Evaluation of Log-Derived Cation Exchange Capacity for Water Saturation Estimation By Hamedelgzali Abdullah Hamed Ahmed I.D.17759 Dissertation submitted in partial fulfilment of requirements for the Bachelor of Engineering (Hons) Petroleum Engineering January 2015 Universiti Teknologi PETRONAS Bander Seri Iskandar 31750, Tronoh Perak Darul Ridzuan Malaysia,

Welcome message from author
This document is posted to help you gain knowledge. Please leave a comment to let me know what you think about it! Share it to your friends and learn new things together.
Transcript

Evaluation of Log-Derived Cation Exchange Capacity for Water Saturation
Estimation
By
Hamedelgzali Abdullah Hamed Ahmed
I.D.17759
Dissertation submitted in partial fulfilment of requirements for the
Bachelor of Engineering (Hons)
Petroleum Engineering
January 2015
Universiti Teknologi PETRONAS
Bander Seri Iskandar
31750, Tronoh
Perak Darul Ridzuan
Malaysia,

ii
CERTIFICATION OF APPROVAL
Evaluation of Log-Derived Cation Exchange Capacity for Water Saturation
Estimation
By
Hamedelgzali Abdullah Hamed Ahmed
I.D.17759
A project dissertation submitted to the
Petroleum Engineering Department
Universiti Teknologi PETRONAS
In partial fulfilment of requirements for the
Bachelor of Engineering (Hons)
(Petroleum)
Approved by,
(Dr. Shiferaw Regassa Jufar)
UNIVERSITI TEKNOLOGI PETRONAS
TRONOH, PERAK
January 2015

iii
CERTIFICATION OF ORIGINALITY
This is to certify that I am responsible for the work submitted in this project, that the
original work is my own except as specified in the references and acknowledgements,
and that the original work contained herein have not been undertaken or done by
unspecified sources of persons.
Hamedelgzali Abdullah Hamed Ahmed

iv
ABSTRACT
A common method to investigate the hydrocarbon content of a reservoir rock is through
the evaluation of wireline logs. Lithology and Porosity logs combined with resistivity
log are used to estimate the water saturation of a reservoir. However, several factors
affect evaluation of wireline logs. One of such factors is presence of clay in the
formation. Since clay mineral introduces additional conductivity, its presence is an
extremely perturbing factor in formation evaluation. Many models are developed to
account for the extra conductivity of clay minerals during log evaluation. Some of these
models attempt to account for the extra conductivity due to clay presence through the
introduction of cation exchange capacity (CEC). Usually, CEC is determined through
a laboratory study and the process is complicated and tedious.
In this study, CEC values are determined from log and the normalized Waxman-Smits
(nWS) shaly sand evaluation model is used to estimate water saturation in clean and
shaly sand zones. The results are compared with the Archie equation. In the clean sand
zone, the average CEC value is 0.018 meq/cm3. The average CEC value in the shaly
sand zone is 0.11 meq/cm3 (0.8 meq/g). This suggests that the major clay composition
in this zone is Montmorillonite.
In the clean sand zone where Vsh is about 10 %, the deviation in water saturation
between the Archie and the nWS models is about 12 %. In the shaly sand zone where
Vsh = 66 %, the deviation in water saturation between the Archie and the nWS models
is about 67 %. Although, the water saturation needs to be compared with the true value,
the results found indicate that with the application of CEC values determined from logs,
the nWS shaly sand model can be used to estimate water saturation with reasonable
accuracy. As such, it can eliminate the challenges in CEC value determination in the
laboratory. The other main advantage of determining the CEC from logs is that it is the
average value from many intervals unlike the laboratory determined CEC. The
laboratory determined CEC value is from a core sample taken from some particular
section and it may not represent the whole formation. As such, the water saturation
estimation may not be correct. However, the value determined from the logs represents
the whole section through the zone of interest. As a result, given the CEC determination
from log is well calibrated using core data, the water saturation estimation should be
better.

v
ACKNOWLEDGMENT
All praise and thanks to Allah, the creator, the maker, the fashioner, for his boundless
blessings and guidance throughout my life and the success, he granted me in completing
this project in easiness and success Alhamdulillah.
The Author would like to express his great thanks to his supervisor Dr. Shiferaw Jufar
for the valuable support, knowledge and the assistance during the development of the
project.
Special thanks also extend to all people who direct or indirectly were involved in
making this project a reality.
Finally, I wish to offer my special heart thanks to my parents for their faith, love,
support and encouragement throughout my life and study.

vi
Contents
CERTIFICATION OF APPROVAL ..................................................................................... ii
CERTIFICATION OF ORIGINALITY ............................................................................... iii
ABSTRACT ............................................................................................................................. iv
ACKNOWLEDGMENT ......................................................................................................... v
ABBREVIATION AND NOMENCLATURES.................................................................. viii
Chapter 1: Intorduction .......................................................................................................... 1
1.1 Introduction and Background .......................................................................................... 1
1.2 Problem Statement ........................................................................................................... 2
1.3 Scope of study .................................................................................................................. 3
1.4 Objectives ........................................................................................................................ 3
Chapter 2: Literature Review ................................................................................................. 4
2.1 Concept of Clean Sand formation Model ........................................................................ 4
2.2 Concept of shaly Sand formation Models ........................................................................ 4
2.3 Vsh Shaly Sand Models .................................................................................................... 5
2.4 Types and Distribution of shale: ...................................................................................... 6
Chapter 3: Methodology .......................................................................................................... 8
3.1 Methodology steps .......................................................................................................... 8
3.2 Software used ................................................................................................................... 9
3.3 Plan and Schematic Flow Process of the Project ........................................................... 12
3.4 Gantt chart ...................................................................................................................... 13
3.5 Project Milestones .......................................................................................................... 14
Chapter 4: Results and Discussion ....................................................................................... 15
4.1 Data Gathering ............................................................................................................... 15
4.2 Log Interpretation .......................................................................................................... 15
4.3 Volume of Shale (Vsh) .................................................................................................... 19
4.4 Normalized Waxman-Smith (W-S) equation ................................................................. 22
4.5 Water Saturation ............................................................................................................ 24
Chapter 5: Conclusion and Recommendation ..................................................................... 30
5.1 Conclusion ..................................................................................................................... 30
5.2 Recommendation ........................................................................................................... 31
References ............................................................................................................................... 32
Appendixes ............................................................................................................................. 34

vii
List of Figures
Figure 1: Types of Shale distribution ......................................................................................... 6
Figure 2: Import the logs to the interactive petro physics software ........................................... 9
Figure 3: full view of logs at interactive petrophysics software .............................................. 10
Figure 4: set up porosity and water saturation calculation ....................................................... 10
Figure 5: creating the crossplot at interactive petrophysics software ...................................... 11
Figure 6: Key milestones ......................................................................................................... 14
Figure 7: logs interpretation ..................................................................................................... 16
Figure 8: Zone A1 (Clean sand) ............................................................................................... 17
Figure 9: Zone B2 (Shaly Sand) .............................................................................................. 17
Figure 10: Neutron Density crossplot for zone A1 .................................................................. 18
Figure 11: Neutron Density crossplot for zone B2 .................................................................. 18
Figure 12: Vshale vs depth in clean sand zone A1 .................................................................. 20
Figure 13: Vshale vs depth in the shaly sand zone B2 ............................................................. 21
Figure 14: CEC vs Vshale vs Depth in Clean sand zone A1 ................................................... 23
Figure 15: CEC vs Vshale vs Depth in shaly sand zone B2 .................................................... 23
Figure 16: Water saturation from Archie and CEC (nWS) Zone A1 (Clean sand) ................. 24
Figure 17: Water saturation from Archie and CEC (nWS) Zone B2 (Shaly sand) .................. 25
Figure 18: water saturation between Archie and nWS deviation in clean sand zone A1 ........ 26
Figure 19: water saturation between Archie and nWS deviation in shaly sand zone B2 ......... 27
Figure 20: water saturation nWS vs Archie in clean sand zone A1 ......................................... 28
Figure 21: water saturation nWS vs Archie in shaly sand zone B2 ......................................... 28
Figure 22: Zone A2 (Clean sand) ............................................................................................. 34
Figure 23: Neutron Density crossplot for Zone A2 (Clean sand) ............................................ 34
Figure 24: Zone B1 (Shaly sand) ............................................................................................. 35
Figure 25: Neutron Density crossplot for Zone B1 (shaly sand) ............................................. 35

viii
ABBREVIATION AND NOMENCLATURES
CEC Cation exchange capacity of a rock sample (meq/g rock)
Vsh Volume of Shale (percentage)
F Formation resistivity factor
Ro resistivity of saturated rock
Rw Resistivity of electrolyte fluid (water)
(a) Cementation coefficient
(m) Cementation exponent
Sw Formation water saturation
Rt True formation resistivity
Co Formation conductivity
Cw Water conductivity
X term of Shale conductivity
N Saturation exponent
Qv Cation exchange capacity per unit total pore volume (meq/cm3)
Qvn normalized Qv.
Qtsh total porosity of shale (percentage)
Qt total porosity (percentage)
Rwe equivalent bulk water resistivity of shaly formation.
Swt total water saturation
1
Chapter 1
Introduction
1.1 Introduction and Background
Well logging plays an important role in identifying and evaluating the zones of
hydrocarbon in the reservoir. The types and quantities of hydrocarbon and fluids present
on the formation reservoir will be expected by estimating its water saturation (Sw) from
well logs. The determination of water saturation (Sw) is one of the important calculation
in the field development.
In the clean zones, which are zones with low volume fraction of shale, water saturation
is regularly estimated through Archie’s equation. However, Archie’s equation is
established on the assumption that the saline is the only conductive element in the
formation. While, in the case of shaly sand formation the clay appears to provide an
additional conductivity to the formation, the structure of clay minerals produce a
negative surface charge that results in decrease of the SP deflection, and rise in the rock
conductivity, Ct. Therefore, Cation Exchange Capacity of the formation is a main factor
for the modification and improvement of resistivity measurements, which is required
to complete the calculation of water and Hydrocarbon saturation. However, the use of
clean sand model (Archie’s Equation) to estimate the water saturation in shaly sand
formation will results in inaccurate estimation; higher level of water saturation than the
actual present in the formation will be predicted. Designing of the field facilities and
development are depend on the estimated amount of hydrocarbon subsequently the
water saturation estimated. There for incorrect estimation of water saturation will lead
to improper designing. Which will appear in increasing the capital development
expenditure by redesigning the facilities after production.
Usually, the ways to determine Cation exchange capacity (CEC) is in the laboratory,
but this method is rather expensive to produce and does not allow the distribution of
the results to different laboratories, as there is commonly a varied effectivity in Cation
replacement and possible environmental interference, thus reducing the effectivity.

2
Calculating Cation exchange capacity from well logs has showed promising results that
agree with continuous Cation exchange capacity log derived values.
The detection and estimation of water saturation in a hydrocarbon zone that has areas
of shale formation can be estimated using CES models and V shale (Vsh) models.
However, Vsh assume that the shale effect is only relative to the shale volume.
The main limitation of Vsh models that they have no universal Vsh indicator and those
models do not reflect to the type of clay in the formation. Subsequently Vsh shale sand
models fail to predict values that represent values of hydrocarbon saturation in the
formation from wire line data. Modern Cation exchange capacity models produce better
results than the Vsh models as Cation exchange capacity reflects and takes into
consideration different clay types.
1.2 Problem Statement
The Estimation of the amount of hydrocarbon present in the reservoir is one of the most
important factors for the investors in the oil and gas industry, as it is relied upon in
making the decision to proceed with projects and to develop facilities toward start
operation. Determining the water saturation is the key to estimate the amount of
hydrocarbon present in the formation. However, in the clean sand formations
determination of water saturation usually uses the Archie’s equation, which in shale
sand formation will result in incorrect estimation. Therefore, evaluation of water
saturation in a shaly sand needs to include the effect of shale. There are a number of
models to estimate water saturation in shaly sand. some of which is based on Cation
Exchange Capacity (CEC) which is excess conductivity associated with the presence
of shale. Although there are models to estimate water saturation of shaly sands using
CEC values, determination of CEC from core sample is a complicated and time-
consuming process. If the CEC values are not accurately determined, it leads to
erroneous water saturation estimation. Apparently, erroneous water saturation
estimation affects reserve estimation, development strategies, and facilities design to
handle the produced hydrocarbon.

3
1.3 Scope of study
The main goal of this study is to predict the water saturation using the log derived cation
exchange capacity (CEC). In addition comparing the results with the water saturation
values from the production data and Archie’s equation. Therefore, the author could
come with evaluation for the CEC models.
1.4 Objectives
The following are the main objectives of the study:
• To review shaly sand evaluation techniques.
• To Calculate CEC or Qv values from logs and estimate, water saturation based
on the log derived CEC.
• To compare the water saturation obtained from the log derived CEC with the
water saturation from Archie’s Equation for validation.

4
Chapter 2
Literature Review
2.1 Concept of Clean Sand formation Model
Ipek and Bassiouni (2002) state and review the different petrophysical models for shaly
sands.
Archie equation is playing the main role in estimating the water saturation from clean
sand
Where F is the formation resistivity factor, Ro is the resistivity of the rock when it fully
saturated with an electrolyte fluid with a resistivity of Rw.
The formation factor is empirically related to the porosity of the rock as:
Where (a) is coefficient and (m) is the cementation exponent
Generally:
Where Sw is the water saturation expressed as a fraction of pore space, n is the exponent
of saturation.
2.2 Concept of shaly Sand formation Models
Regardless the assumption of that the water (brine) is the only conductive element. At
this model even with low concentration of salt in the brine, the conductivity of shale
rapidly increases with greater rate than increase in Cw.
The following equation can describe the general relation between the conductivity of
the formation Co, and the water conductivity Cw, for shale sand formation (Worthington
& Johnson, 1991).
Where:

5
Co = formation conductivity when 100% saturated with water
Cw = water conductivity
Where:
F = Formation Factor
X = term of shale conductivity
2.3 Vsh Shaly Sand Models
Vsh is defined as the volume of the wetted shale per unit volume of reservoir rock.
Hossin (1960) generated the coming equation for the shale conductivity term, X:
This relationship involving Vsh in water bearing formation and in hydrocarbon
formation respectively
Where:
The Figure above shows the typical Co – Cw plot for shaly sands

6
Sw = water saturation above the irreducible water saturation
N = saturation exponent
2.4 Types and Distribution of shale:
Ramirez (1990) has define and classified the types of shale as:
The term clay indicates natural earthy fine-grained materials that create plasticity when
mixed with a small amount of water.
The most common types of clay minerals found in sedimentary rocks are kaolinite,
illite, smectite (montmorillonite) and chlorite.
Kaolinite and Chlorite are considered as ineffective shale’s. Kaolinite is the simplest
clay mineral in structure and the purest in composition has low CEC ranged from (1-10
meq/100gm). While chlorite is a hydrous green silicate consisting of ordered layers of
alumina octahedrons and silica tetrahedrons with basal cleavage between the layers, has
zero cation exchange capacity.
On the other hand, illite and smectite are considered as effective shale’s. Illite crystal
is composed of two unit layers each of which consists of one alumina octahedron
sandwiched between two silica tetrahedrons, has CEC ranged between (10-40
meq/100gm). However, smectite is similar in structure to illite, different is that
Magnesium, Sodium and Calcium ions tend too be substituting cations rather than
potassium, smectite has CEC from (80-100 meq/ 100gm).
Crain (2001) has explain the types of shale distribution in sand as shown below
Figure 1: Types of Shale distribution

7
As seen by the figure, the laminar shale case is special case where petrophysical
analysis done under standard models do not work when using standard porosity and
saturation.
Due to the chemical reactions between the chemicals in the water and the minerals of
the rock, Clay minerals will form in place after deposition. This usually composes what
is called Dispersed Shale.
For the initial phase of deposition, normally the structural shale is set down as particles,
grains, or clasts.

8
Chapter 3
Research Methodology
The objective of this study is to compute CEC values from logs, which are normally
readily available in comparison to CEC values determined from laboratory
measurements. The log derived CEC values will be used to estimate water saturation
using shaly sand evaluation models based on CEC. Once the water saturation is
determined, it will be compared with the water saturation from Archie’s equation for
evaluation.
3.1 Methodology steps
The research Methodology was conduct through the following steps:
1. Gathering of preliminary information and review about types of shale,
structure and distribution of shale in sand. Which are important to
understand the effectiveness of clay on sand.
2. The brainstorming session, the main idea of this session is to take into
consideration all the features, qualities, effectiveness, efficiency and
other constraints, of the shale on Sand.
3. Research is the essential part of the project since it provides general
information for the project and constructs the overall fundament. Hereby,
I can obtain a more detailed understanding and technical explanations for
CEC Models.
4. Convey the well logs data for several wells for the analysis.
5. Data then compiled as a form of ideas and research data thought several
discussions with the supervisor, this involved comparison and analysis of
the well logs data in each well. A conceptual analysis is being
accomplished, so that important and useful ideas are putted on mind.
6. Interpreting and determine CEC values from the logs, then calculate the
water saturation based on the CEC values obtained. All the aspects and

9
effects of clay are put under continuous investigation and observations,
so that the final estimation corresponds to all the desired requirements.
7. Comparing the results of water saturation obtained from CEC logs with
Archie equation and evaluate the difference between them.
8. During the development of this project there might occur some problems.
Any problem that occurs due to the incorrect reading from logs or any
other reasons were put into critical considerations at this stage. All works
had to be reviewed all over again in order to identify possible reasons of
problem extraction in order to overcome the problem pertaining to it.
9. At this stage, all the results and comparison obtained from this analysis
were put into to the final checking and concluding.
3.2 Software used
This project is focus on evaluating the water saturation estimated from the log-derived
cation exchange capacity. To accomplish the project objectives the use of Interactive
Petrophysics Software was very important which facilitate the log interpretation part.
The important of log interpretation is to identifying the interest zones (sand zones and
shaly sand zone).Microsoft office excel has also been used for all the calculation
required for the CEC and water saturation.
Figure 2: Import the logs to the interactive petro physics software

10
Figure 3: full view of logs at interactive Petrophysics software
Figure 4: set up porosity and water saturation calculation

11
Figure 5: creating the crossplot at interactive Petrophysics software

12
3.3 Plan and Schematic Flow Process of the Project
13
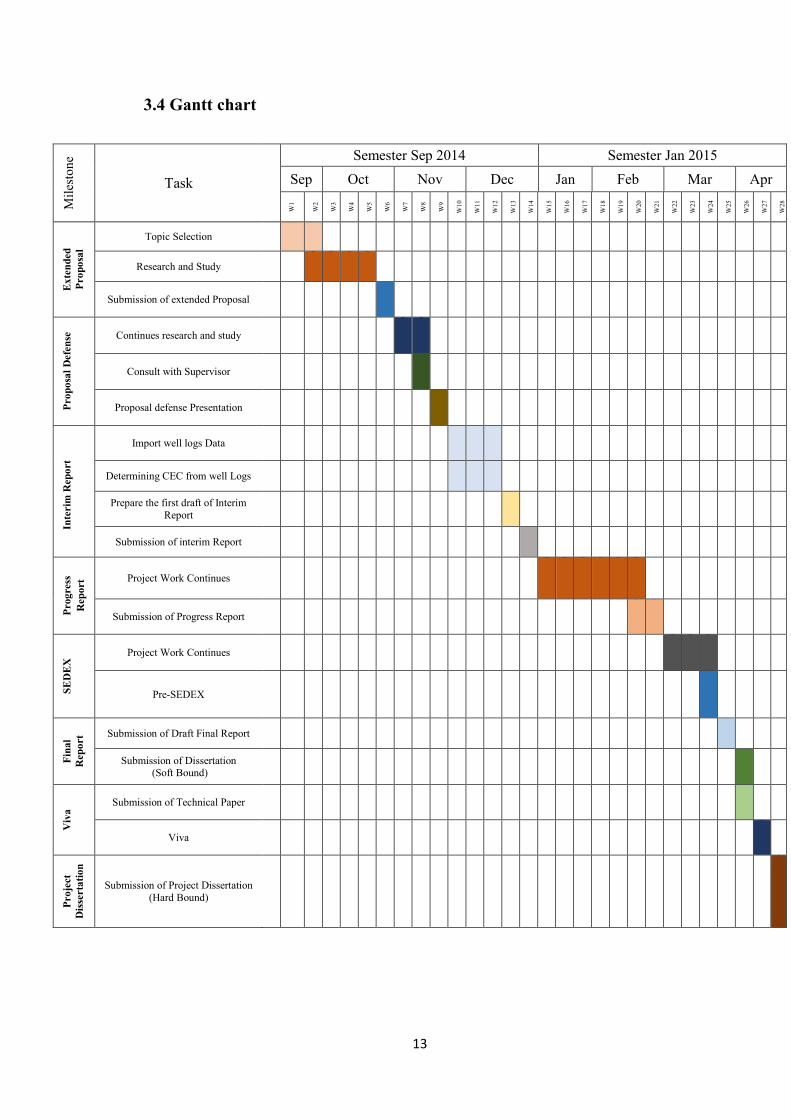
3.4 Gantt chart
Mil
esto
ne
Task
Semester Sep 2014 Semester Jan 2015
Sep Oct Nov Dec Jan Feb Mar Apr
W1
W2
W3
W4
W5
W6
W7
W8
W9
W1
0
W1
1
W1
2
W1
3
W1
4
W1
5
W1
6
W1
7
W1
8
W1
9
W2
0
W2
1
W2
2
W2
3
W2
4
W2
5
W2
6
W2
7
W2
8
Ex
ten
ded
Pro
po
sal
Topic Selection
Research and Study
Submission of extended Proposal
Pro
po
sal
Defe
nse
Continues research and study
Consult with Supervisor
Proposal defense Presentation
Inte
rim
Rep
ort
Import well logs Data
Determining CEC from well Logs
Prepare the first draft of Interim
Report
Submission of interim Report
Prog
ress
Rep
ort Project Work Continues
Submission of Progress Report
SE
DE
X Project Work Continues
Pre-SEDEX
Fin
al
Rep
ort Submission of Draft Final Report
Submission of Dissertation (Soft Bound)
Viv
a Submission of Technical Paper
Viva
Pro
ject
Dis
serta
tio
n
Submission of Project Dissertation
(Hard Bound)

14
3.5 Project Milestones
Import the sets of well logs data for the project (Dec 2014).
Interpret the logs, identifying the zones and compute CEC (Feb 2015).
Calculate water Saturation based on Computed CEC (Mar 2015).
Compare the result obtained (Mar 2015).
Figure 6: Key milestones
Import sets of well logs data
Interpret and Compute CEC from the logs
calculate water saturation Sw based on CEC models
Compare the results obtained

15
Chapter 4
Results and discussion
4.1 Data Gathering
Required data for the project are sets of Well logs data, which have been imported
from the field, X in Malaysia. Author gather well logs data for five wells from the
field (X). The set of well logs consist of the following logs:
Gama Ray log
SP log
Caliper log
Density log
Neutron log
Sonic Log
Resistivity log
The Author has used gamma ray logs and SP logs to identify the lithology. The use of
Resistivity log in order to differentiate between the fluids inside the reservoir.
Neutron and density logs are used to identify the porosity of the rock, Lithology and
the types of shale distribution.
4.2 Log Interpretation
The aim of log interpretation is to locate and identify the zones that possible to contain
hydrocarbon. The first step was scanning the gamma ray and SP logs and determine the
permeable zones base on the shale base line. The permeable zones to the left of the
gamma ray log track. The following step was scanning the resistivity logs and
highlights the zones with high resistivity. High resistivity reflects either hydrocarbon
in the pore space or low porosity. After that was scanning the porosity logs track
(density and neutron logs) and determine which zones, have good porosity against the
high resistivity zones.
The figure (7) shows the identification of the zones A1, B1, A2 & B2. The zones A1
and A2 are clean sand zones, both of them contain hydrocarbon. While the zones B1
and B2 are shaly sand zones. The zone B1 is containing amount of hydrocarbon with
large amount of water. However, zone B1 is containing hydrocarbon.

16
Figure 7: logs interpretation
The figures (8&9) shows the zones of interest that has been evaluated in this project.
Figure (8) shows the zone A1, which is the clean sand zone with less volume of shale
in the zone. The good porosity and high resistivity in the zone indicate hydrocarbon
present in the formation. The figure (9) shows the zone B2 that is shaly sand zone with
high percentage of shale.

17
Figure 8: Zone A1 (Clean sand)
Figure 9: Zone B2 (Shaly Sand)
18
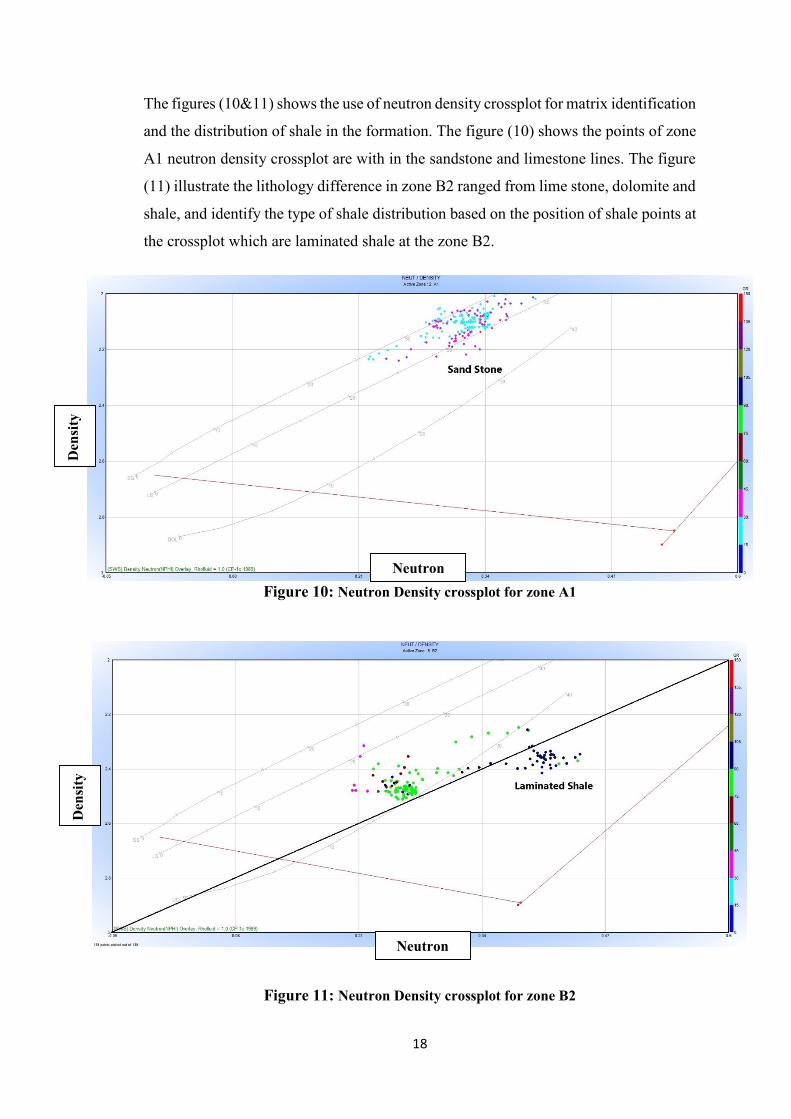
The figures (10&11) shows the use of neutron density crossplot for matrix identification
and the distribution of shale in the formation. The figure (10) shows the points of zone
A1 neutron density crossplot are with in the sandstone and limestone lines. The figure
(11) illustrate the lithology difference in zone B2 ranged from lime stone, dolomite and
shale, and identify the type of shale distribution based on the position of shale points at
the crossplot which are laminated shale at the zone B2.
Figure 10: Neutron Density crossplot for zone A1
Figure 11: Neutron Density crossplot for zone B2
Den
sity
Neutron
Den
sity
Neutron

19
4.3 Volume of Shale (Vsh)
Shale volume is on the method used to correct the porosity and water saturation from
the effects of clay. Generally the geologist describe the clay as any mineral in the rock
with grain size less than 4 microns, however the mineral may not be a clay mineral.
Cation exchange capacity (CEC) is the capacity of a material, such as clay or soil, for
ion exchange of positively charged ions between the clay and the nearby water. A
positively charged ion, which has less electrons than protons, is known as a cation. The
quantity of positively charged ions (cations) that a clay mineral can accommodate on
its negatively charged surface is expressed in milli-equivalent per 100 g.
The equation below shows the use of gamma ray log to estimate the volume of shale:
𝑉𝑠ℎ𝑔 = 𝐺𝑅 − 𝐺𝑅0
𝐺𝑅100 − 𝐺𝑅0
Where:
GR = gamma ray log reading in zone of interest (API unit).
GR0 = gamma ray reading in 100% clean zone (API unit).
GR100 = gamma ray reading in 100% shale zone (API unit).
Vshg = shale volume from gamma ray log (Percentage).
The average gamma ray reading at the clean sand on this study was 18.6 API, while the
reading for the average shale zone was 117 API.
The figure (12) shows the distribution of shale volume against the depth in the clean
sand zone A1 where the average Vshale at that clean zone is 10%. While the figure (13)
shows the distribution of shale volume against the depth in the shaly sand zone B2, the
average Vshale at that zone was determined to be 66%.

20
Figure 12: Vshale vs depth in clean sand zone A1
4660
4680
4700
4720
4740
4760
4780
0 0.2 0.4 0.6 0.8 1
Dep
th (
ft)
Vshale
Vshale Zone A1 (Clean sand)

21
Figure 13: Vshale vs depth in the shaly sand zone B2
4990
5000
5010
5020
5030
5040
5050
5060
5070
0 0.2 0.4 0.6 0.8 1
Dep
th (
ft)
Vshale
Vshale Zone B2 (Shaly sand)

22
4.4 Normalized Waxman-Smits (nWS) equation
The author has used the normalized Waxman-Smits equation which has been proposed
by Juhasz (1981) in order to estimate the cation exchange capacity and calculate the
water saturation, the method depend on the parameter Qv (Cation exchange capacity
per unit total pore volume). Usually Qv will be obtained from the core data. By the use
of normalized Qv concept all, the parameter except the saturation can be obtained from
logs.
The Equations below have used to determined Cation exchange capacity from logs and
determine the water Saturation:
𝑄𝑣𝑛 = 𝑉𝑠ℎ . ∅𝑡𝑠ℎ
∅𝑡 𝑄𝑣 = [
𝐶𝐸𝐶 . (1 − ∅) . 𝜌𝑚𝑎
∅ . 100]
𝑅𝑤𝑒 = 𝑆𝑤𝑡. 𝑅𝑤𝑠ℎ. 𝑅𝑤
𝑄𝑣𝑛. 𝑅𝑤 + (𝑆𝑤𝑡 − 𝑄𝑣𝑛)𝑅𝑤𝑠ℎ 𝑅𝑤𝑠ℎ = ∅𝑇𝑠ℎ
𝑚 . 𝑅𝑠ℎ
𝑆𝑤𝑡 = [∅𝑇
−𝑚.𝑅𝑤𝑒
𝑅𝑡]
Where:
Qv = Cation exchange capacity per unit
total pore volume (meq/cm3)
Qvn = normalized Qv.
Vsh = volume of shale (percentage)
Qtsh = total porosity of shale
(percentage)
Qt = total porosity (percentage)
The figures (14 & 15) show the calculated cation exchange capacity plotted against the
volume of shale. It is very clear to notice that the value of the Vsh and CEC at the shaly
sand zone (figure 15) are much higher than the values at the clean sand zone in (figure
14). As can be seen from the figure (14) which is in the clean sand zone as the volume
of shale increase the CEC values increase by following one trend line. While the figure
(15) represent the shaly sand zone, as can be notice from the figure as the shale volume
increase the CEC increase following two trend line that my represent occurs of two
types of shale or two different shale distribution.

23
Figure 14: CEC vs Vshale vs Depth in Clean sand zone A1
Figure 15: CEC vs Vshale vs Depth in shaly sand zone B2
0
0.05
0.1
0.15
0.2
0.25
0.3
0.35
0 0.01 0.02 0.03 0.04 0.05 0.06
Vsh
ale
Qv (CEC/cm3)
CEC VS Vshale in Clean Zone
0
0.1
0.2
0.3
0.4
0.5
0.6
0.7
0.8
0.9
0 0.02 0.04 0.06 0.08 0.1 0.12 0.14
Vsh
ale
Qv (CEC/cm3)
CEC Vs Vshale in Shaly sand zone

24
4.5 Water Saturation
The water saturation has been calculated the normalized Waxman and Smith equation
and Archie equation for both zones clean sand zone A1 and shaly sand zone B2. The
figure (16) shows the calculated water saturation plotted against depth at zone A1 the
clean sand zone. Using Archie equation and Normalized Waxman and Smith equation,
as it can be seen that the values form the both methods are almost match each other.
The average value of water saturation using Archie equation is 6.5%, while it slightly
do up to 7% when using Normalized Waxman equation.
Figure 16: Water saturation from Archie and CEC (nWS) Zone A1 (Clean sand)
4660
4670
4680
4690
4700
4710
4720
4730
4740
4750
0 0.1 0.2 0.3
Dep
th (
ft)
Sw
Water saturation from Archie and CEC (nWS)Zone A1 (Clean sand)
Archie
CEC (nWS)

25
The figure (17) shows the calculated water saturation plotted against depth at zone B2
the shaly sand zone. Using Archie equation and Normalized Waxman and Smith
equation, I can be noticed that the value of water saturation from Archie equation is
much higher than the Normalized Waxman and smith equation and this is due to the
shale (clay) effect on the formation. The average value of water saturation using Archie
equation is 75%, while it drop to 24% when using Normalized Waxman equation.
Figure 17: Water saturation from Archie and CEC (nWS) Zone B2 (Shaly sand)
4980
4990
5000
5010
5020
5030
5040
5050
5060
5070
0 0.5 1
Dep
th (
ft)
Sw
Water saturation from Archie and CEC (nWS)
Zone B2 (Shaly sand)
Archie
CEC (nWS)

26
Figure 18: water saturation between Archie and nWS deviation in clean sand zone A1
4660
4680
4700
4720
4740
4760
4780
0 20 40 60 80 100
Dep
th (
ft)
Deviation %
Deviation Zone A1 (Clean sand)
Vshale A1 Avg Deviation = 12%

27
Figure 19: water saturation between Archie and nWS deviation in shaly sand zone B2
4980
4990
5000
5010
5020
5030
5040
5050
5060
5070
0 20 40 60 80 100
Dep
th (
ft)
Deviation %
Deviation Zone B2 (Shaly sand)
Vshale A1 Avg Deviation = 67%

28
Figure 20: water saturation nWS vs Archie in clean sand zone A1
Figure 21: water saturation nWS vs Archie in shaly sand zone B2
0
0.1
0.2
0.3
0.4
0.5
0.6
0 0.1 0.2 0.3 0.4 0.5 0.6
Sw (
nW
S)
Sw (Archi)
Zone A1 Clean Sand
0
0.1
0.2
0.3
0.4
0.5
0.6
0.7
0.8
0.9
1
0 0.1 0.2 0.3 0.4 0.5 0.6 0.7 0.8 0.9 1
Sw (
nW
S)
Sw (Archie)
Zone B2

29
The figures (18 & 19) show the deviation between calculated water saturation using
Archie equation and Normalized Waxman and Smith equation. The average deviation
in the sand zone is 12% showed in figure (18). While the deviation is 66% in the shaly
sand zone presented in figure (19).
The figures (20 & 21) presented the water saturation from Archie Equation versus the
water saturation from Normalized Waxman and Smith equation. It can be notice that
the values are almost match between the two methods at the clean sand zone in figure
(20). While there is a huge difference between the two methods at the shaly sand zone;
that is due to the effect clay on the formation and the limitation of Archie equation
shows in figure (21).

30
Chapter 5
Conclusion and Recommendation
5.1 Conclusion
Determination of Cation exchange capacity (CEC) from logs is easy to apply and more
reflect to the real behavior of the formation since the log has been recorded each half
feet. While the cores samples are to be taken from specific points and apply the average
to the whole reservoir. CEC values are determined from logs and the normalized
Waxman-Smits (nWS) shaly sand evaluation model is used to estimate water saturation
in clean and shaly sand zones. The results are compared with the Archie equation. In
the clean sand zone, the average CEC value is 0.018 meq/cm3. The average CEC value
in the shaly sand zone is 0.11 meq/cm3 (0.8 meq/g). This suggests that the major clay
composition in this zone is Montmorillonite.
Cation Exchange Capacity (CEC) values derived from logs are successfully used to
estimate water saturation (Sw). In the clean sand zone where Vsh is about 10 %, the
average water saturation estimated through Archie is about 6.5% and through nWS is
about 7%, The average deviation in water saturation between the Archie and the nWS
models is about 12 %. In the shaly sand zone where Vsh = 66 %, the average water
saturation estimated through Archie is about 75% and through nWS is about 24%, The
average the deviation in water saturation between the Archie and the nWS models is
about 67 %.
In clean sand, Archie’s formula and Normalized Waxman and Smits (nWS) models
estimation agrees with each other, since there is no clay in the formation all the
assumptions of Archie will be valid.
In the shaly sand zones, Archie’s formula will estimate higher values of water saturation
due to the effect of shale (clay) on the formation, where the clay appear to add an extra
conductivity to the formation. Archie equation assume all of the conductivity in the
formation is from the water based on its assumption; therefor it will give us an incorrect
estimation. Normalized Waxman and Smits (nWS) model, which is one of the Cation

31
Exchange Capacity (CEC) models, consider the additional conductivity from the shale
and give us estimation that is more accurate.
The right estimation and determination of water saturation and hydrocarbon is very
important since it will lead to save the expenses of facilities redesigning and related
problems. If the effect of shale was not considered during evaluation of shaly sands, it
may lead to erroneous reserve estimation, which in turn affects development strategies,
and facilities design to handle the produced hydrocarbon.
The water saturation from estimated from Normalized Waxman and Smits (nWS)
model has only been compare with Archie equation due to the lack of the real
production data which it has requested. However, the results obtained matched with the
principals of each model.
5.2 Recommendation
This evaluation and study can be improve by comparing the results with real production
data from the field (X), which will help to estimate the accuracy of the Normalized
Waxman and Smits (nWS) model and Archie equation in each case.
Moreover, better results and accuracy can be achieved by applying more than one
model of CEC models to estimate the water saturation and compare the results between
all the models, which could give a chance to evaluate the difference between the CEC
models, the advantages and limitations of each model.

32
References
Ipek, G., and Bassiouni, Z., (2002). Log-Derived Cation Exchange Capacity of
Shaly Sands: Application to Hydrocarbon Detection and Drilling
Optimization. Ph.D Dissertation, Louisiana State University.
Waxman, M.H., and Smits, L.J. (1968). Electrical Conductivities in Oil
Bearing Shaly Sands. SPE Journal of Petroleum Technology, Trans. AIME
243, pages 107-122.
Juhasz, I.,(1981).Normalized Qv- The key to shaly sand evaluation using the
Waxman Smits Equation in the absence of core data. SPWLA, 22sd, Annual
Logging Symposium.
Bassiouni, Z., Theory.(1994). Measurement and Interpretation of Well Logs.
SPE Textbook Series Volume (4).
Worthington, P. E.(1985).The Evaluation of Shaly Sand Concepts in Reservoir
Evaluation, The Log Analyst.
HOSSIN, A. (1960). Calcul des saturations en eau par la methode du ciment
argileux (formule d’ Archie generalisee). Bull. Assoc. Francaise Tech. Pet.
140, 31 March.
Crain, E.R.(2001). Crain's Petrophysical Handbook. 3rd edition.
Ramirez, M, O.(1990). Cation Exchange Capacity Data Derived from Well
logs.Sociaty of Petroelum Engineers.
Kamel, M, H.& Mabrouk, W, M. (2003).Estimation of shale volume using a
combitation of the three prosity logs.Cairo University.
Kurniawan (2005). Shaly sand interpretation using CEC-dependent
petrophysical parameter. Louisiana state university.
Brock, J. (1951). Applied open hole log analysis. Houston: Gulf Pub. Co.,
Book Division.
Archie, G.E.(1942). The Electrical Resistivity Log as an Aid in Determining
some Reservoir Characteristics. Trans. AIME. V.146.p.54-62.
Simandoux, P. (1963). Dielectric Measurements on Porous Media:
Application to Measurement of Water Saturation: Study of the Behavior of
Argillacious Formation. SPWLA, Houston. p. IV 97-124.
Poupon, A., and Leveaux, J.(1971). Evaluation of Water Saturations in Shaly
Formation. The Log Analyst-July-August, p. 3-8.

33
Silva, P., and Bassiouni, Z. (1985). A Shaly Sand Conductivity Model Based
on Variable Equivalent Counter-ion Conductivity and Dual Water Concepts.
SPWLA Trans. paper RR.
Lau, M. (1989). Development and Field Applications of Shaly Sand
Petrophysical Models. Ph.D Dissertation, Louisiana State University.
Silva, P. (1986). Development of a New Conductivity Model for Shaly Sand
Interpretation. Ph.D Dissertation, Louisiana State University.

34
Appendixes
Figure 22: Zone A2 (Clean sand)
Figure 23: Neutron Density crossplot for Zone A2 (Clean sand)

35
Figure 24: Zone B1 (Shaly sand)
Figure 25: Neutron Density crossplot for Zone B1 (shaly sand)
Related Documents