Evaluation of Limit of Detection (LOD) Capability for the Analysis of Total Phosphorus Bureau of Science Services Wisconsin Department of Natural Resources P.O. Box 7921 Madison, WI 53707-7921 Miscellaneous Publication PUB-SS-1091 2011

Welcome message from author
This document is posted to help you gain knowledge. Please leave a comment to let me know what you think about it! Share it to your friends and learn new things together.
Transcript
Evaluation of Limit of Detection (LOD) Capability for the
Analysis of Total Phosphorus
Bureau of Science Services Wisconsin Department of Natural Resources P.O. Box 7921 Madison, WI 53707-7921 Miscellaneous Publication PUB-SS-1091 2011

Summary: Revisions to Wisconsin’s water quality standards for phosphorus discharges will require laboratories to attain a level of detection (LOD) no more than 0.01 to 0.03 mg/L (as P) for total phosphorus. We surveyed accredited labs to evaluate their potential to meet this new LOD expectation. It was determined that 41% of laboratories were unable to achieve a valid LOD of 0.03 mg/L or less. Labs that use the Hach Company’s Test ‘N Tube procedure had particular difficulty in meeting the new LOD. It was determined that if absorbance measurements were made using a single, high quality cuvette, the LOD of the Test ‘N Tube procedure could be improved (lowered) by as much as 60%. Other procedures which can be used to improve LODs are discussed as well. Acknowledgements We wish to acknowledge and thank the following for their contributions to this study:
Patrick Gorski and Graham Anderson of the Wisconsin State Laboratory of Hygiene for providing analytical and technical support.
Jim Burke of the Hach Company for providing an instrument to assist us with our assessment of the Test ‘N Tube method capability.
All the labs that responded to our survey, providing the data which made this study possible.
Disclaimer Mention of trade names and commercial products does not constitute endorsement of their use by the Wisconsin Department of Natural Resources. Cover Photographs: Phosphorus testing equipment and procedures by Kay Curtin, 2006. Used with permission.
The Wisconsin Department of Natural Resources provides equal opportunity in its employment, programs, services, and functions under an Affirmative Action Plan. If you have any questions regarding this plan, please write to Equal Opportunity Office, Department of Interior, Washington, D.C. 20240.
This publication is available in alternative format (large print, Braille, audio tape, etc.) upon request. Please call (608) 266-0531 for more information.

Evaluation of Limit of Detection (LOD)
Capability for the Analysis of
Total Phosphorus
Rick Mealy
Environmental Science Services Section
Bureau of Science Services Wisconsin Department of Natural Resources
P.O. Box 7921 Madison, WI 53707-7921
December 2011

Evaluation of LOD Capability for Total Phosphorus
1
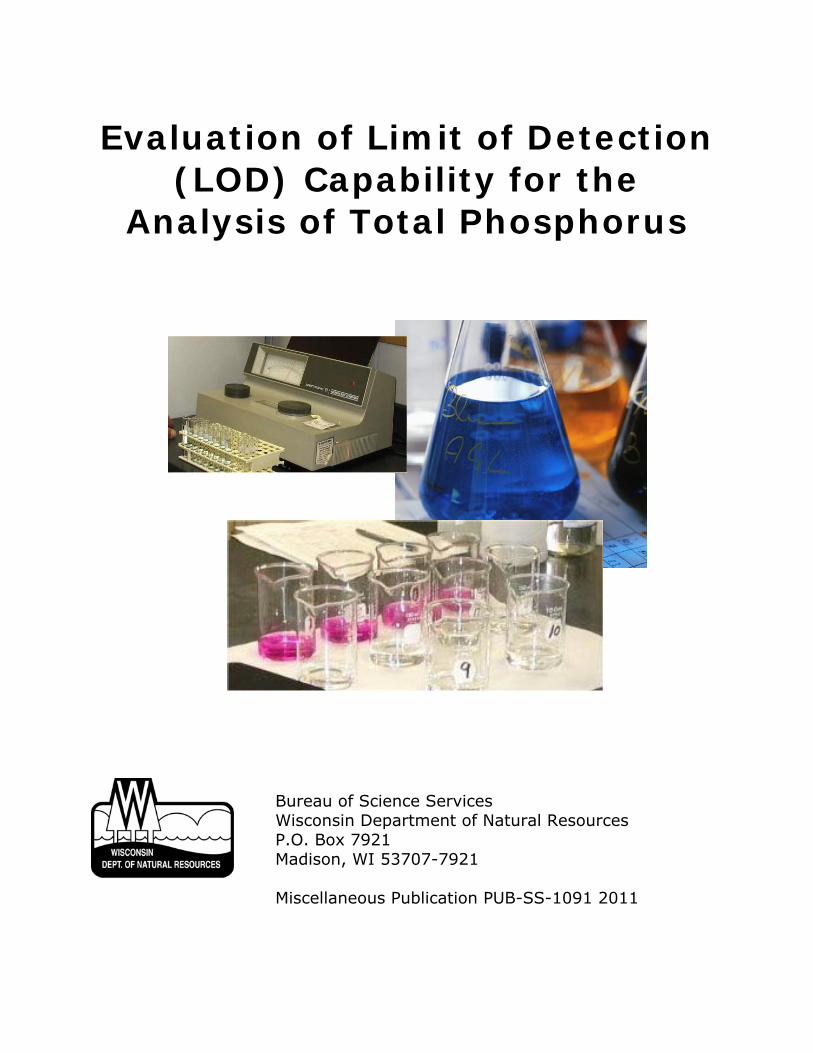
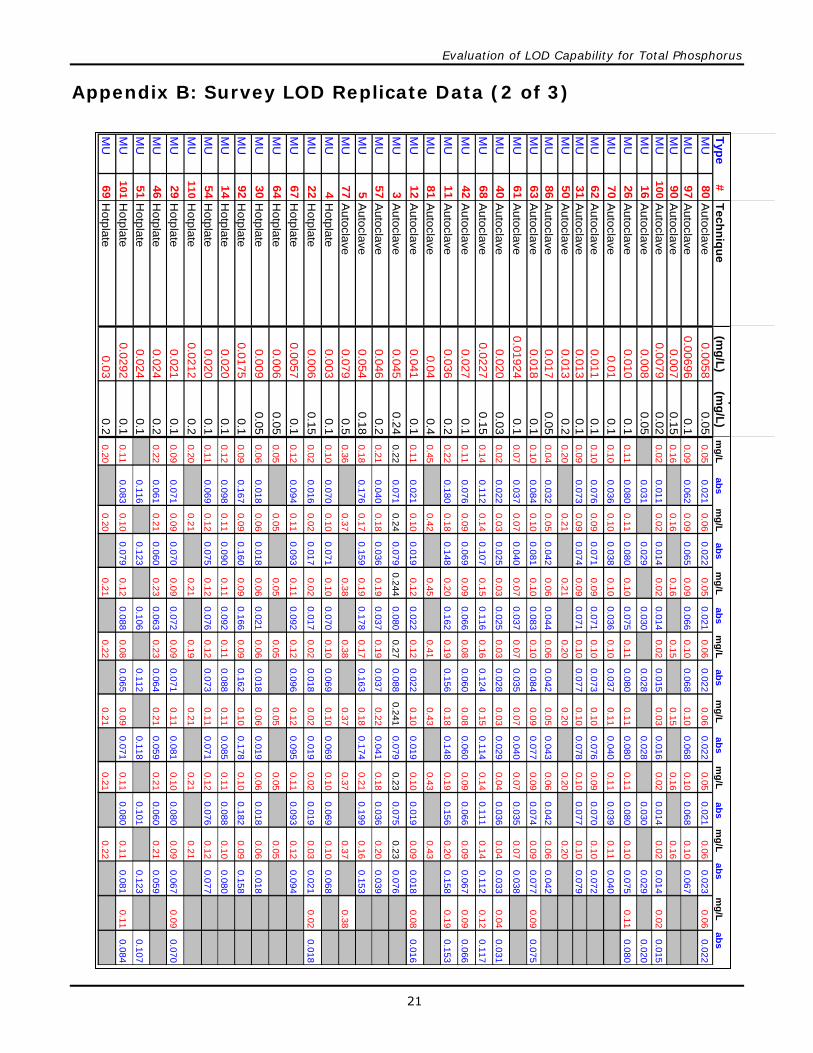
Contents Introduction 3 Methods 4 Survey 4 Survey Data review 4 Statistical Analysis 5 Multiple vs. Single Cuvette Comparison 5 Results 6 Analytical protocols Used by Labs 6 Quality of LOD Data Received 6 Ability to Achieve an LOD of 0.03 mg/L 7 Ability to Achieve a Specific LOD by Lab Type 8 Ability to Achieve a Specific LOD by Analytical Approach 8 Student’s t-Test Analysis 10 Color Measurement in Test ‘N Tube Vial vs. Single Cuvette 11 Discussion 13 Analytical Protocols Used by Surveyed Labs 13 Ability to Achieve an LOD of 0.03 mg/L 13 Ability to Achieve a Specific LOD by Analytical Approach 13 Quality of LOD Data Received 14 Color Measurement in Test ‘N Tube Vial vs. Single Cuvette 15 Other Considerations to Improve LOD 16 Summary / Conclusions 18 Appendix A: Survey Summary Data 19 Appendix B: Survey LOD Replicate Data 20 Appendix C: Survey Lab Recent Blank Data 23 Appendix D: Single Cuvette Study Data 26
2
Figures 1. Survey questions 4 2. Layout for the WSLH study to evaluate whether use of a single cuvette 5 improves the LOD attainable using Test ‘N Tube™ 3. Hach Test’ N Tube™ procedure 5 4. Breakdown of analytical approach employed by labs responding to survey 6 5. Quality of reported LOD data 6 6. Total phosphorus LOD as reported by surveyed labs 7 7. Ability to meet a specific TP LOD, based on data as reported 8 8. Ability to meet a specific TP LOD, based on adjusted, “realistic” LODs 8 9. Ability to meet a specific TP LOD by approach, based on data as reported 8 10. Ability to meet a specific TP LOD y approach, based on adjusted, 9 “realistic” LODs 11. Mean LODS (mg/L) by analytical approach 9 12. t-Values at the 95% confidence levels 10 13. Student’s t-test results by analytical approach 10 14. p-values associated with the Student’s t-test comparison of mean 10 LODs by analytical approach 15. Lower end of calibration performed using Test ‘N Tube™ vials 12 16. Lower end of calibration performed using single 25-mm cuvette 12 17. Classic graphical representation of the LOD from Principles of 14 Environmental Analysis (1983) 18. The response of typical blanks suggests that the validity of the LOD 15 is in question 19. Pictures of new Test ‘N Tube™ vials under a light microscope 17 20. Pictures of cleaned and reused Test ‘N Tube™ vials under a light microscope 17
Evaluation of LOD Capability for Total Phosphorus
3
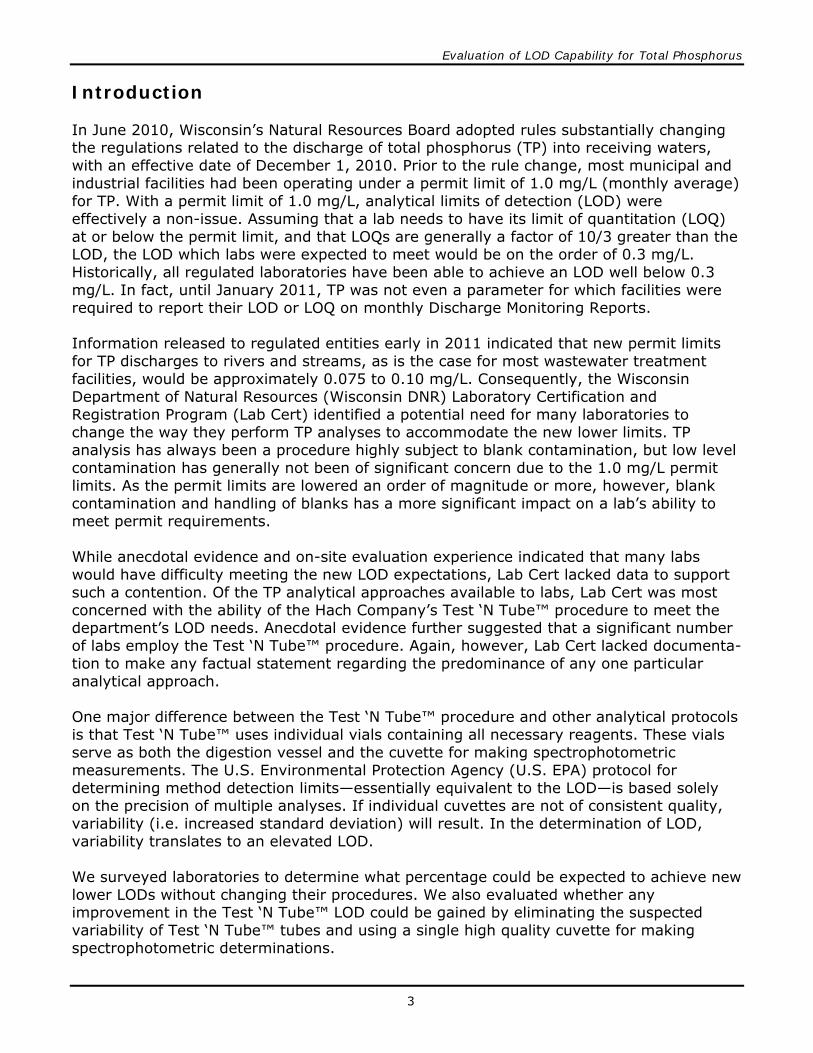
Introduction In June 2010, Wisconsin’s Natural Resources Board adopted rules substantially changing the regulations related to the discharge of total phosphorus (TP) into receiving waters, with an effective date of December 1, 2010. Prior to the rule change, most municipal and industrial facilities had been operating under a permit limit of 1.0 mg/L (monthly average) for TP. With a permit limit of 1.0 mg/L, analytical limits of detection (LOD) were effectively a non-issue. Assuming that a lab needs to have its limit of quantitation (LOQ) at or below the permit limit, and that LOQs are generally a factor of 10/3 greater than the LOD, the LOD which labs were expected to meet would be on the order of 0.3 mg/L. Historically, all regulated laboratories have been able to achieve an LOD well below 0.3 mg/L. In fact, until January 2011, TP was not even a parameter for which facilities were required to report their LOD or LOQ on monthly Discharge Monitoring Reports. Information released to regulated entities early in 2011 indicated that new permit limits for TP discharges to rivers and streams, as is the case for most wastewater treatment facilities, would be approximately 0.075 to 0.10 mg/L. Consequently, the Wisconsin Department of Natural Resources (Wisconsin DNR) Laboratory Certification and Registration Program (Lab Cert) identified a potential need for many laboratories to change the way they perform TP analyses to accommodate the new lower limits. TP analysis has always been a procedure highly subject to blank contamination, but low level contamination has generally not been of significant concern due to the 1.0 mg/L permit limits. As the permit limits are lowered an order of magnitude or more, however, blank contamination and handling of blanks has a more significant impact on a lab’s ability to meet permit requirements. While anecdotal evidence and on-site evaluation experience indicated that many labs would have difficulty meeting the new LOD expectations, Lab Cert lacked data to support such a contention. Of the TP analytical approaches available to labs, Lab Cert was most concerned with the ability of the Hach Company’s Test ‘N Tube™ procedure to meet the department’s LOD needs. Anecdotal evidence further suggested that a significant number of labs employ the Test ‘N Tube™ procedure. Again, however, Lab Cert lacked documenta-tion to make any factual statement regarding the predominance of any one particular analytical approach. One major difference between the Test ‘N Tube™ procedure and other analytical protocols is that Test ‘N Tube™ uses individual vials containing all necessary reagents. These vials serve as both the digestion vessel and the cuvette for making spectrophotometric measurements. The U.S. Environmental Protection Agency (U.S. EPA) protocol for determining method detection limits—essentially equivalent to the LOD—is based solely on the precision of multiple analyses. If individual cuvettes are not of consistent quality, variability (i.e. increased standard deviation) will result. In the determination of LOD, variability translates to an elevated LOD. We surveyed laboratories to determine what percentage could be expected to achieve new lower LODs without changing their procedures. We also evaluated whether any improvement in the Test ‘N Tube™ LOD could be gained by eliminating the suspected variability of Test ‘N Tube™ tubes and using a single high quality cuvette for making spectrophotometric determinations.

4
Methods Survey We e-mailed a simple survey (Figure 1), consisting of five questions to 173 Wisconsin laboratory facilities accredited to analyze aqueous matrix samples for TP. The survey requested the data (observed concentration and absorbance measurements for LOD replicates) associated with each lab’s most recent determination of LOD for TP. In addition, specific information regarding the instruments and analytical process used by the lab, basic calibration information, and results of recent blank determinations was requested. Survey Data Review Once we received all data, we compiled a master spreadsheet. Initially, an analysis was conducted to determine whether the data submitted met the requirements of the U.S. EPA protocol for determining detection limits outlined in 40 CFR Part 136, Appendix B. Using the raw data, all calculations were verified. Corrections to a final version of the resulting spreadsheet were made as necessary. We divided results into three groups:
(1) those with a valid and defensible LOD, (2) those whose LOD did not meet one or more of the U.S. EPA requirements and
were therefore deemed to be invalid, and (3) those labs whose data met U.S. EPA requirements, but the LOD was deemed to
be questionable in light of blank results.
For the purposes of this study, the absolute concentration and response of blanks, compared to the theoretical response which would be predicted for a sample concentration equal to the LOD, were used to determine defensibility of the reported LOD. By conventional definition, the LOD represents the concentration at which the analytical response is significantly different than that of a blank. Consequently, if supporting data suggest this is not the case, then the reported LOD is neither realistic nor defensible.
FIGURE 1: Survey questions. 1. What instrument, method, and digestion technique are
you using? 2. What is your current TP LOD and the spike
concentration used to determine it? 3. What were the concentrations and absorbance
responses for each of your LOD samples from your last LOD determination/study?
4. What is the concentration and corresponding
absorbance response of the lowest standard in a typical TP calibration curve?
5. What is the concentration and corresponding
absorbance response of the last seven (7) method blanks analyzed?

Evaluation of LOD Capability for Total Phosphorus
5
Statistical Analysis We used a Student’s t-test to compare the LODs determined by the three major protocols (Test ‘N Tube, Hotplate Manual Digestion/Spectrophotometry, and Autoclave Digestion/Spectrophotometry) used by laboratories. The null hypothesis for the t-test was that no significant statistical difference existed between the means of LODs generated by the two analytical approaches being compared. LODs generated by conventional hotplate digestion [“Hotplate”] followed by spectrophotometric color measurement were compared to results generated using an autoclave for digestion [“Autoclave”] followed by spectrophotometric color measurement. Both Hotplate and Autoclave results were compared to LODs generated using Test ‘N Tube. A sufficient sample size was available to draw conclusions from the analysis. Multiple vs. Single Cuvette Comparison Lab Cert commissioned the Wisconsin State Laboratory of Hygiene (WSLH) to assess the effects of using a single cuvette to perform colorimetric measurements following analysis using the Test ‘N Tube procedure. The study procedure, outlined in Figure 2, was to use the Hach Test ‘N Tube protocol (Method 8190; Figure 3) to prepare a calibration, and then, on each of four separate days (to induce typical analytical variability), analyze 2-3 LOD spike replicates along with a continuing calibration verification (CCV) standard and a method blank. This same sequence was then repeated with all color measurements made using a single, high-quality 25-mm, round, glass cuvette (Hach catalog #249502) instead of the 13-mm Test ‘N Tube vials. According to the Hach instructions, each individual vial is used to zero the instrument before adding the Phos-Ver 3 color reagent. This practice conflicts with Lab Cert requirements for handling blanks; consequently, in the WSLH study, the spectrophotometer was zeroed at the beginning of each day using a “zero blank”, which contained only the acid, persulfate, and sodium hydroxide reagents; no Phos-Ver 3 color reagent was added. The spectrophotometer used a single wavelength user program at 880 nm. A Vortex mixer was used for mixing samples. The mean and standard deviation for the two LOD data sets were compared using a Student’s t-test.
FIGURE 2: Layout for the WSLH study to evaluate whether use of a single cuvette improves the LOD attainable using Test ‘N Tube.
FIGURE 3: Hach Test ‘N Tube procedure.
6
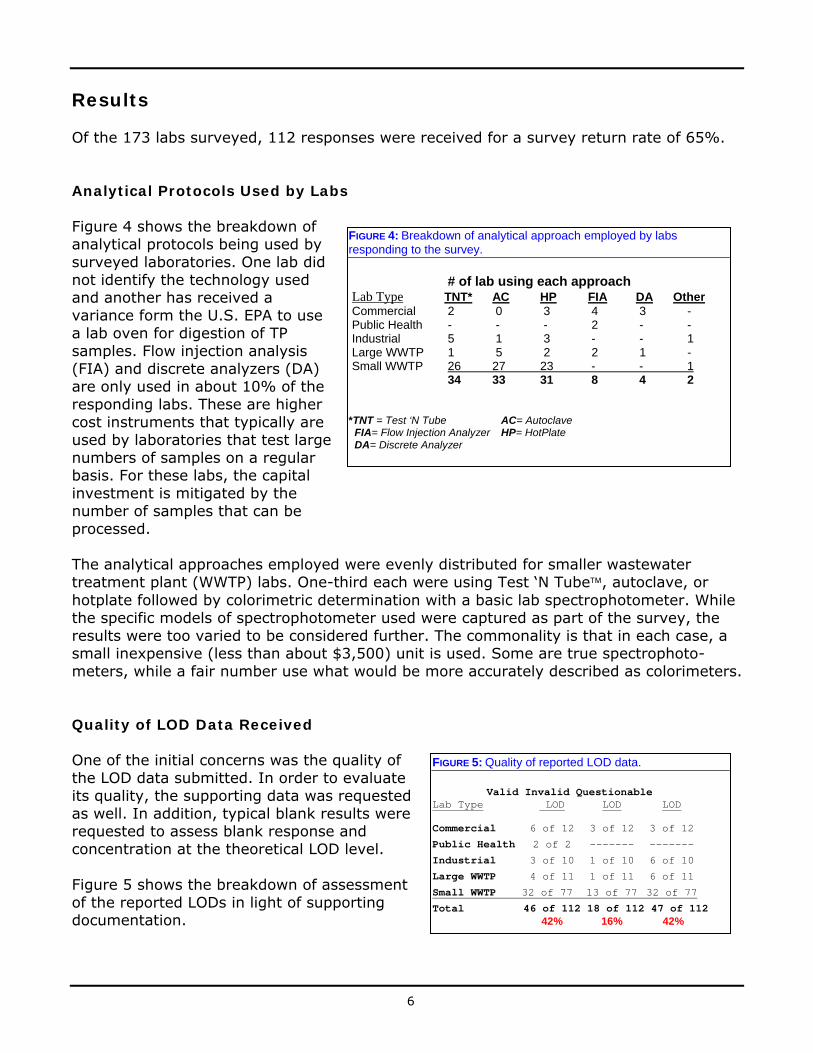
Results Of the 173 labs surveyed, 112 responses were received for a survey return rate of 65%. Analytical Protocols Used by Labs Figure 4 shows the breakdown of analytical protocols being used by surveyed laboratories. One lab did not identify the technology used and another has received a variance form the U.S. EPA to use a lab oven for digestion of TP samples. Flow injection analysis (FIA) and discrete analyzers (DA) are only used in about 10% of the responding labs. These are higher cost instruments that typically are used by laboratories that test large numbers of samples on a regular basis. For these labs, the capital investment is mitigated by the number of samples that can be processed. The analytical approaches employed were evenly distributed for smaller wastewater treatment plant (WWTP) labs. One-third each were using Test ‘N Tube, autoclave, or hotplate followed by colorimetric determination with a basic lab spectrophotometer. While the specific models of spectrophotometer used were captured as part of the survey, the results were too varied to be considered further. The commonality is that in each case, a small inexpensive (less than about $3,500) unit is used. Some are true spectrophoto-meters, while a fair number use what would be more accurately described as colorimeters. Quality of LOD Data Received One of the initial concerns was the quality of the LOD data submitted. In order to evaluate its quality, the supporting data was requested as well. In addition, typical blank results were requested to assess blank response and concentration at the theoretical LOD level. Figure 5 shows the breakdown of assessment of the reported LODs in light of supporting documentation.
FIGURE 4: Breakdown of analytical approach employed by labs responding to the survey. # of lab using each approach Lab Type TNT* AC HP FIA DA Other Commercial 2 0 3 4 3 - Public Health - - - 2 - - Industrial 5 1 3 - - 1 Large WWTP 1 5 2 2 1 - Small WWTP 26 27 23 - - 1
34 33 31 8 4 2 *TNT = Test ‘N Tube AC= Autoclave FIA= Flow Injection Analyzer HP= HotPlate DA= Discrete Analyzer
FIGURE 5: Quality of reported LOD data.
Valid Invalid Questionable Lab Type LOD LOD LOD Commercial 6 of 12 3 of 12 3 of 12
Public Health 2 of 2 ------- -------
Industrial 3 of 10 1 of 10 6 of 10
Large WWTP 4 of 11 1 of 11 6 of 11
Small WWTP 32 of 77 13 of 77 32 of 77
Total 46 of 112 18 of 112 47 of 112 42% 16% 42%
Evaluation of LOD Capability for Total Phosphorus
7
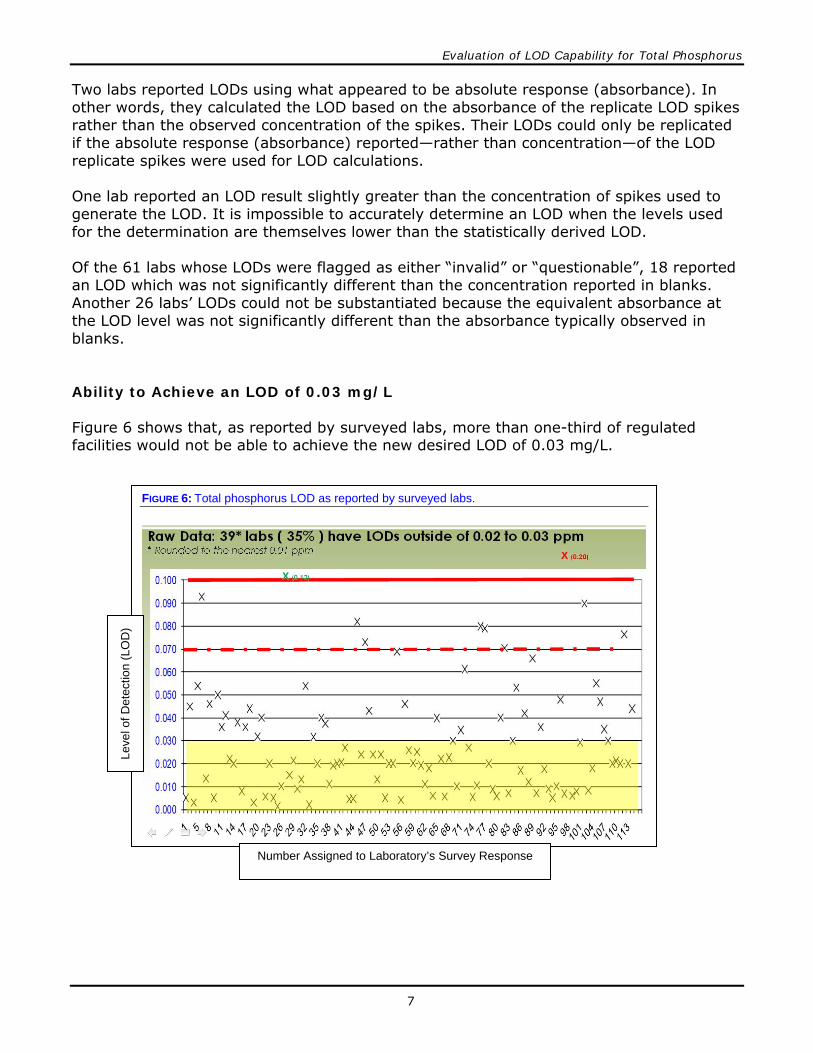
Two labs reported LODs using what appeared to be absolute response (absorbance). In other words, they calculated the LOD based on the absorbance of the replicate LOD spikes rather than the observed concentration of the spikes. Their LODs could only be replicated if the absolute response (absorbance) reported—rather than concentration—of the LOD replicate spikes were used for LOD calculations. One lab reported an LOD result slightly greater than the concentration of spikes used to generate the LOD. It is impossible to accurately determine an LOD when the levels used for the determination are themselves lower than the statistically derived LOD. Of the 61 labs whose LODs were flagged as either “invalid” or “questionable”, 18 reported an LOD which was not significantly different than the concentration reported in blanks. Another 26 labs’ LODs could not be substantiated because the equivalent absorbance at the LOD level was not significantly different than the absorbance typically observed in blanks. Ability to Achieve an LOD of 0.03 mg/L Figure 6 shows that, as reported by surveyed labs, more than one-third of regulated facilities would not be able to achieve the new desired LOD of 0.03 mg/L.
FIGURE 6: Total phosphorus LOD as reported by surveyed labs.
Number Assigned to Laboratory’s Survey Response
Leve
l of D
etec
tion
(LO
D)
8
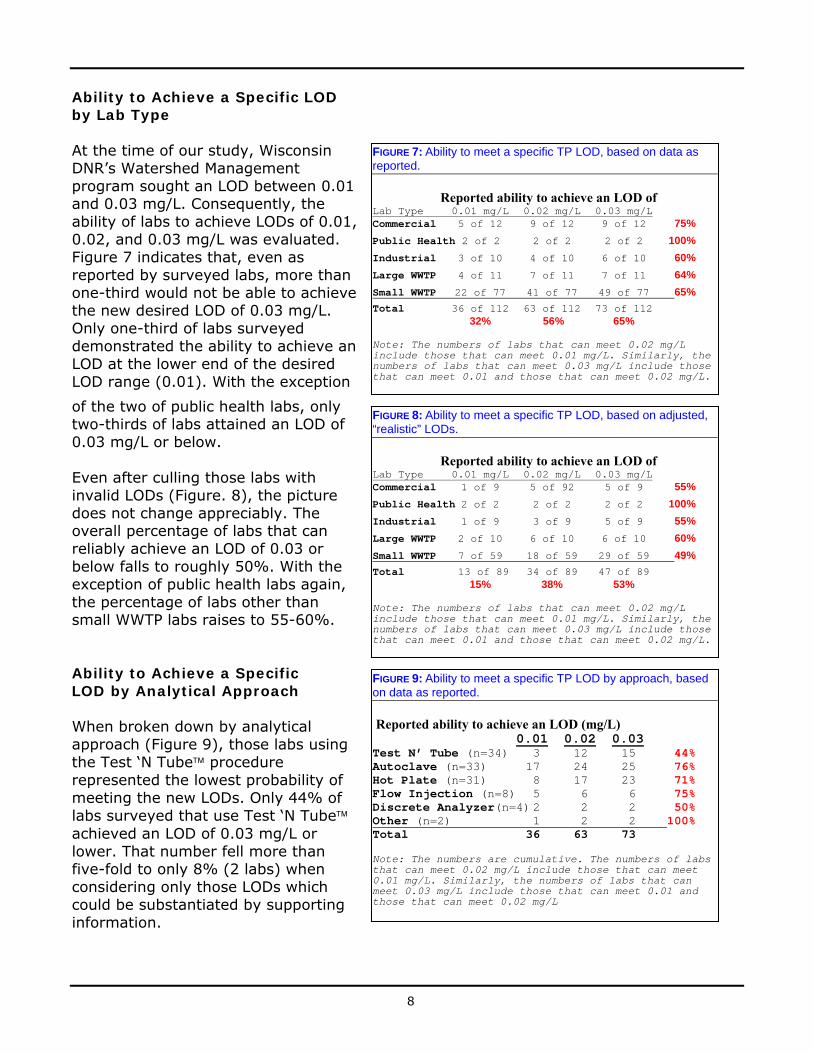
Ability to Achieve a Specific LOD by Lab Type At the time of our study, Wisconsin DNR’s Watershed Management program sought an LOD between 0.01 and 0.03 mg/L. Consequently, the ability of labs to achieve LODs of 0.01, 0.02, and 0.03 mg/L was evaluated. Figure 7 indicates that, even as reported by surveyed labs, more than one-third would not be able to achieve the new desired LOD of 0.03 mg/L. Only one-third of labs surveyed demonstrated the ability to achieve an LOD at the lower end of the desired LOD range (0.01). With the exception
of the two of public health labs, only two-thirds of labs attained an LOD of 0.03 mg/L or below. Even after culling those labs with invalid LODs (Figure. 8), the picture does not change appreciably. The overall percentage of labs that can reliably achieve an LOD of 0.03 or below falls to roughly 50%. With the exception of public health labs again, the percentage of labs other than small WWTP labs raises to 55-60%. Ability to Achieve a Specific LOD by Analytical Approach When broken down by analytical approach (Figure 9), those labs using the Test ‘N Tube procedure represented the lowest probability of meeting the new LODs. Only 44% of labs surveyed that use Test ‘N Tube achieved an LOD of 0.03 mg/L or lower. That number fell more than five-fold to only 8% (2 labs) when considering only those LODs which could be substantiated by supporting information.
FIGURE 7: Ability to meet a specific TP LOD, based on data as reported.
Reported ability to achieve an LOD of Lab Type 0.01 mg/L 0.02 mg/L 0.03 mg/L Commercial 5 of 12 9 of 12 9 of 12 75%
Public Health 2 of 2 2 of 2 2 of 2 100%
Industrial 3 of 10 4 of 10 6 of 10 60%
Large WWTP 4 of 11 7 of 11 7 of 11 64%
Small WWTP 22 of 77 41 of 77 49 of 77 65%
Total 36 of 112 63 of 112 73 of 112 32% 56% 65% Note: The numbers of labs that can meet 0.02 mg/L include those that can meet 0.01 mg/L. Similarly, the numbers of labs that can meet 0.03 mg/L include those that can meet 0.01 and those that can meet 0.02 mg/L.
FIGURE 8: Ability to meet a specific TP LOD, based on adjusted, “realistic” LODs.
Reported ability to achieve an LOD of Lab Type 0.01 mg/L 0.02 mg/L 0.03 mg/L Commercial 1 of 9 5 of 92 5 of 9 55%
Public Health 2 of 2 2 of 2 2 of 2 100%
Industrial 1 of 9 3 of 9 5 of 9 55%
Large WWTP 2 of 10 6 of 10 6 of 10 60%
Small WWTP 7 of 59 18 of 59 29 of 59 49%
Total 13 of 89 34 of 89 47 of 89 15% 38% 53% Note: The numbers of labs that can meet 0.02 mg/L include those that can meet 0.01 mg/L. Similarly, the numbers of labs that can meet 0.03 mg/L include those that can meet 0.01 and those that can meet 0.02 mg/L.
FIGURE 9: Ability to meet a specific TP LOD by approach, based on data as reported.
Reported ability to achieve an LOD (mg/L) 0.01 0.02 0.03 Test N’ Tube (n=34) 3 12 15 44% Autoclave (n=33) 17 24 25 76% Hot Plate (n=31) 8 17 23 71% Flow Injection =8) 5 6 6 75% (nDiscrete Analyzer(n=4) 2 2 2 50% Other (n=2) 1 2 2 100% Total 36 63 73 Note: The numbers are cumulative. The numbers of labs that can meet 0.02 mg/L include those that can meet 0.01 mg/L. Similarly, the numbers of labs that can meet 0.03 mg/L include those that can meet 0.01 and those that can meet 0.02 mg/L

Evaluation of LOD Capability for Total Phosphorus
9
Test ‘N Tube is the most popular method—and the method more and more small labs are adopting—yet, less than 10% of Test ‘N Tube™ labs can meet the desired LODs. Three quarters of labs surveyed could meet the new target LOD range when the autoclave procedure was employed. This percentage did not change significantly when only validated LODs (Figure 10) were considered. Flow injection, as expected, looked to be the most consistent and sensitive of the techniques employed. Whether using LODs as reported or only validated LODs, 6 of 8 labs using FIA technology could meet the lower LOD. When using LODs as reported, 71% of labs using hotplate digestion could achieve an LOD of 0.03 or less; when only validated LODs were considered, that percentage dropped to 61%. When the LOD means for individual analytical techniques are evaluated (Figure 11), Test ‘N Tube not only has the highest LOD (0.038) , but the mean exceeds the new desired maximum LOD of 0.030 mg/L. The conventional hotplate digestion is also of some concern as the mean (0.030) is right at the upper limit of the target LOD range. When looking at raw, uncensored data, only the mean LOD for the autoclave digestion fell within the target LOD range. For each of the three techniques, the sample size was at least 31, a number statistically significant for making assessments using the mean. The mean LOD for the filtered data set, after LODs were excluded or adjusted to a defensible level rose significantly (82%, an increase of 0.031 mg/L) to 0.069 mg/L for Test ‘N Tube. The mean for hotplate rose 37% to 0.041. Although still high in terms of percent increase (19%), the mean for the autoclave data only increased by 0.004 mg/L to 0.025 mg/L. Consequently, even after excluding invalid data and adjusting the remaining data based on blank responses, the autoclave approach was still capable of yielding an LOD that would meet new program expectations.
FIGURE 11: Mean LODs (mg/L) by analytical approach.
Adjusted/ As Reported Realistic LOD LOD Test ‘N Tube 0.038 0.069
Autoclave 0.021 0.025
Hotplate 0.030 0.041
FIGURE 10: Ability to meet a specific TP LOD by approach, based on adjusted, “realistic” LODs.
Reported ability to achieve an LOD (mg/L) 0.01 0.02 0.03 Test N’ Tube (n=25) 0 2 2 8% Autoclave (n=26) 8 16 20 77% Hot Plate (n=28) 1 8 17 61% Flow Injection (n=8) 3 6 6 75% Discrete Analyzer(n=3) 0 2 2 67% Total (n=90) 12 34 47 Note: The numbers are cumulative. The numbers of labs that can meet 0.02 mg/L include those that can meet 0.01 mg/L. Similarly, the numbers of labs that can meet 0.03 mg/L include those that can meet 0.01 and those that can meet 0.02 mg/L

10
Student’s t-Test Analysis
We used a t-test to compare the LODs generated by Test ‘N Tube vs. autoclave, Test ‘N Tube vs. hotplate, and autoclave vs. hotplate to determine whether a statistically significant difference between any of the three techniques’ means could be identified. The t-test was performed both before and after the raw LODs were filtered and adjusted to provide realistic, defensible values. Due to the sample sizes, the degrees of freedom for the determinations ranged from 50 to 65; subsequently (Figure 12) a t-value greater than 2.00 would be significant at the 95% confidence level and a t-value in excess of 2.70 would be significant at the 99% level.
Using the raw data as reported, only the mean LODs determined by Test ’N Tube and autoclave were determined to be significantly different (statistically), with a t-value of 3.57 (Figure 13).
When the means of the adjusted LODs were compared, however, all three techniques had LODs that were statistically different at the 95% confidence level. In addition, the mean Test ‘N Tube LOD was considered to be statistically different from the LODs determined by either autoclave or hotplate at the 99% confidence level. The t-value simply indicates whether or not the null hypothesis can be rejected (i.e. that there is no difference between the LODs obtained by two different analytical approaches). In order to determine how significant the results are, we examined p-values. A p-value for the study represents the probability that one could obtain the same results assuming there is no real difference between the LODs determined by any pair of analytical techniques. Using the original data, Figure 14 indicates that if this study were repeated, the likelihood of obtaining a mean LOD for Test ‘N Tube that is significantly different from that determined by autoclave is 0.08%, or 8 chances in 10,000. On the other end of the spectrum, a p-value of 0.1952 was obtained for the comparison of the
FIGURE 13: Student’s t-test results by analytical approach.
FIGURE 12: t-values at the 95% and 99% confidence levels
(df) α=.05 α=.01 50 2.01 2.68 55 2.00 2.67 60 2.00 2.66 65 2.00 2.66 ∞ 1.96 2.58
FIGURE 14: p-values associated with the Student’s t-test comparison of mean LODs by analytical approach.
Evaluation of LOD Capability for Total Phosphorus
11
mean LOD obtained from the Test ‘N Tube and that obtained by hotplate. Assuming there is no difference between the Test ‘N Tube and hotplate LODs, the p-value indicates that a 1 in 5 chance exists that the difference between the means could be even greater if the study were repeated. Significant changes occur in p-values when the adjusted LOD data are analyzed. Now the null hypothesis that there is no significant difference between the Test ‘N Tube™ and hotplate LODs is easily rejected. Using the adjusted LOD results, there is only a 0.14% chance that a repeated study would yield a wider difference. In reviewing the statistics for the adjusted LOD data, it is now the autoclave and hotplate LODs that are least likely to be different; and even then, the effective probability that the means are the same is less than 2%. Color Measurement in Test ‘N Tube Vial vs. Single Cuvette Noting the significantly higher LODs obtained using Test ‘N Tube as compared to other techniques, one theory that was explored concerned the Test ‘N Tube vials themselves. One of the conveniences offered by the Test ‘N Tube procedure is that the individual vials serve as both the digestion vessel and the cuvette for colorimetric measurements. In all of the other procedures, a single cell, or cuvette, is used to make all spectrophotometric measurements. These cells are typically constructed of high optical quality glass. Our simple test determined whether any difference in LOD is obtained if the Test ‘N Tube vials are used for digestion but all colorimetric measurements are made using a single high quality cell. The chemist made several noteworthy observations during the testing:
The potassium persulfate did not completely dissolve until heated in the block reactor.
The PhosVer 3 color reagent did not completely dissolve (as stated in the method instructions). The chemist did not observe any significant sticking of it on cuvette walls. It seemed to settle to bottom in both the Test ‘N Tube vials and the 25-mm cuvette.
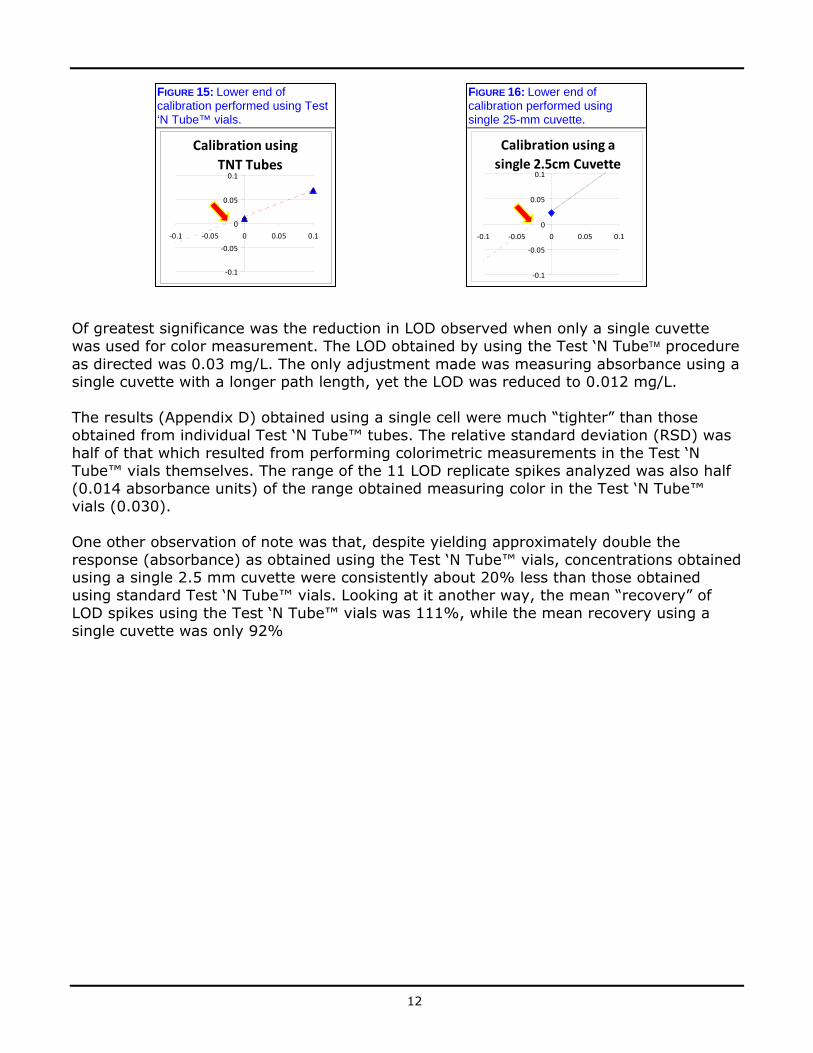
The data generated during this study are provided in Appendix D. One of the initial observations made was that the response (absorbance) nearly doubled when the single 25-mm cell was used. This is what one would expect according to Beer-Lambert’s law, which can be simplified to state that the absorbance of light is directly related to the path length. Therefore if path length is doubled, the absorbance of a known standard is expected to double. Another consequence of the increased path length was that the Y-intercept of the linear regression also doubles. What does not change, however, is what is known as the “X-intercept”, or the concentration where response equals zero. This is the phenomenon which causes “negative” blanks. In our study (Figures 15, 16, next page), we found that while the absorbance (response) and Y-intercept double, there is no significant change to the X-intercept.
12
Of greatest significance was the reduction in LOD observed when only a single cuvette was used for color measurement. The LOD obtained by using the Test ‘N Tube procedure as directed was 0.03 mg/L. The only adjustment made was measuring absorbance using a single cuvette with a longer path length, yet the LOD was reduced to 0.012 mg/L. The results (Appendix D) obtained using a single cell were much “tighter” than those obtained from individual Test ‘N Tube™ tubes. The relative standard deviation (RSD) was half of that which resulted from performing colorimetric measurements in the Test ‘N Tube™ vials themselves. The range of the 11 LOD replicate spikes analyzed was also half (0.014 absorbance units) of the range obtained measuring color in the Test ‘N Tube™ vials (0.030). One other observation of note was that, despite yielding approximately double the response (absorbance) as obtained using the Test ‘N Tube™ vials, concentrations obtained using a single 2.5 mm cuvette were consistently about 20% less than those obtained using standard Test ‘N Tube™ vials. Looking at it another way, the mean “recovery” of LOD spikes using the Test ‘N Tube™ vials was 111%, while the mean recovery using a single cuvette was only 92%
FIGURE 15: Lower end of calibration performed using Test ‘N Tube™ vials.
Calibration using
TNT Tubes
‐0.1
‐0.05
0
0.05
0.1
‐0.1 ‐0.05 0 0.05 0.1
FIGURE 16: Lower end of calibration performed using single 25-mm cuvette.
Calibration using a
single 2.5cm Cuvette
‐0.1
‐0.05
0
0.05
0.1
‐0.1 ‐0.05 0 0.05 0.1

Evaluation of LOD Capability for Total Phosphorus
13
Discussion This survey and associated work should be viewed as neither an indictment nor an endorsement of the Test ‘N Tube method for TP. In reality, many laboratories may find the Test ‘N Tube method to be a convenient and cost effective approach to performing TP testing. Our results show that the Test ‘N Tube approach has some limitations when it comes to achieving LODs that will be necessary in dealing with Wisconsin’s new phosphorus regulations. Hach Method 8190 (the written method associated with the Test ‘N Tube procedure for TP) indicates that the estimated detection limit (LOD) is 0.02 mg/L (as P). While that level of sensitivity is certainly possible in some labs, our study data support the contention that the actual LODs determined in smaller labs, and particularly WWTP labs, are significantly higher. Test ‘N Tube is different because it is the only currently recognized procedure (with U.S. EPA equivalence) for TP that uses individual sample cuvettes. Saying it is different, and that it presents some challenges in light of new LOD expectations, is not to suggest that Test ‘N Tube is no longer acceptable. Rather, by highlighting the differences and focusing on changes which can be easily incorporated, labs should be able to consistently achieve an LOD which meets the needs of the Watershed Management program. Analytical Protocols Used by Survey Labs If survey results are representative of the entire Wisconsin certified/registered lab community, then approximately one-third of smaller labs are actively using the Test ‘N Tube procedure. Consequently, there is a need to educate laboratories regarding the changes which can be made that will allow the Test ‘N Tube method to produce results that meet the needs of the Watershed Management program. Ability to Achieve an LOD of 0.03 mg/L This is not a problem limited to Test ‘N Tube. Only results from labs using flow injection (FIA)—and it was a very limited dataset—could reliably achieve an LOD that meets the new Watershed Management program expectation. Is it possible to achieve an LOD of 0.03 mg/L or less with any of the typical techniques used? Yes, but only if the lab takes steps to control background contamination and other analytical aspects that affect sensitivity. Also coming in a close second in terms of consistently being able to obtain an LOD of 0.03 mg/l or less, was the autoclave method. Ability to Achieve a Specific LOD by Analytical Approach The answer to the question, “Are LODs obtained using Test ‘N Tube really different from other methods?” is clearly, “yes”. Results from Student’s t-test analyses indicate that even before any of the raw data were filtered or adjusted, there was a significant difference in the data generated by Test ‘N Tube and data generated using autoclave digestion followed by colorimetric measurement using a single cuvette.

14
The results of Student’s t-test indicates that the mean LODs for the three most common analytical approaches are all significantly different from one another. Survey results suggest that the lowest, most reliable LODs are obtained using an autoclave digestion, but there is rationale to support that. The pressure and temperature of the autoclave digestion is such that the sample volume is not boiled down, as is done with hotplate digestions. In addition, samples are not exposed to atmospheric contaimination during digestion as occurs when using the hotplate method, and there is less sample handling, which helps reduce background contamination. The hotblock digestion used for Test ‘N Tube results in a similar situation. However, the variability—and thus higher LODs—would appear to result from inconsistencies in the optical quality of individual Test ‘N Tube™ vials, or from scratches and micro-abrasions due to improper handling. Anecdotal reports have been received of several facilities that actually wash and re-use Test ‘N Tube™ vials, re-filling them with their own purchased or prepared reagents. Quality of LOD Data Received Sixteen percent of surveyed labs reported results which do not meet requirements of the U.S. EPA LOD procedure, indicating a need for additional lab training. Another 42% of labs reported an LOD which could not be substantiated due to blank responses or concentrations which approached or even exceeded the LOD or predicted reponse at the LOD. That left only 42% of data deemed to be valid. The U.S. EPA procedure for determining an LOD (40 CFR Part 136, Appendix B Rev. 1.11) is generally recognized to be flawed in that it focuses entirely on analytical precision, without giving any consideration to accuracy. In addition, the U.S. EPA procedure does not consider the basic premise of the original treatise on environmental detection (Keith et al. 1983. Principles of Environmental Analysis. Anal. Chem. 55:2210-2218): “The limit of detection (LOD) is defined as the lowest concentration level that can be determined to be statistically different from a blank.” Figure 17 provides a graphical representation of the LOD and LOQ relationship. A “reality” test should be a requisite part of the LOD process. An LOD should only be considered “realistic” if the LOD can be distinguished statistically from a blank. Until such time as a replacement mechanism for determining LODs is promulgated, labs must use what is available. That determination, however, should be supplemented by reviewing the calculated LOD while taking into consideration the response and concentration of typical method blanks. See Figure 18 for an unrealistic LOD as compared to the blank response.
FIGURE 17: Classic graphical representation of the LOD from Principles of Environmental Analysis (1983).
Evaluation of LOD Capability for Total Phosphorus
15
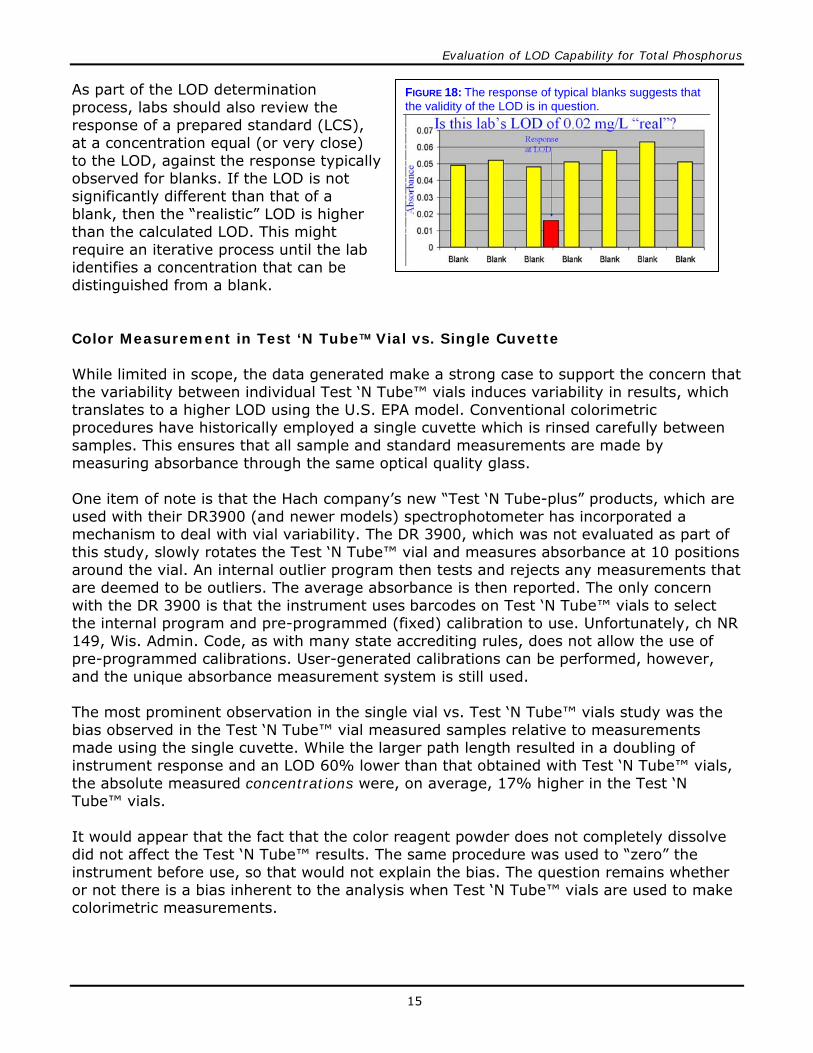
As part of the LOD determination process, labs should also review the response of a prepared standard (LCS), at a concentration equal (or very close) to the LOD, against the response typically observed for blanks. If the LOD is not significantly different than that of a blank, then the “realistic” LOD is higher than the calculated LOD. This might require an iterative process until the lab identifies a concentration that can be distinguished from a blank. Color Measurement in Test ‘N Tube Vial vs. Single Cuvette While limited in scope, the data generated make a strong case to support the concern that the variability between individual Test ‘N Tube™ vials induces variability in results, which translates to a higher LOD using the U.S. EPA model. Conventional colorimetric procedures have historically employed a single cuvette which is rinsed carefully between samples. This ensures that all sample and standard measurements are made by measuring absorbance through the same optical quality glass. One item of note is that the Hach company’s new “Test ‘N Tube-plus” products, which are used with their DR3900 (and newer models) spectrophotometer has incorporated a mechanism to deal with vial variability. The DR 3900, which was not evaluated as part of this study, slowly rotates the Test ‘N Tube™ vial and measures absorbance at 10 positions around the vial. An internal outlier program then tests and rejects any measurements that are deemed to be outliers. The average absorbance is then reported. The only concern with the DR 3900 is that the instrument uses barcodes on Test ‘N Tube™ vials to select the internal program and pre-programmed (fixed) calibration to use. Unfortunately, ch NR 149, Wis. Admin. Code, as with many state accrediting rules, does not allow the use of pre-programmed calibrations. User-generated calibrations can be performed, however, and the unique absorbance measurement system is still used. The most prominent observation in the single vial vs. Test ‘N Tube™ vials study was the bias observed in the Test ‘N Tube™ vial measured samples relative to measurements made using the single cuvette. While the larger path length resulted in a doubling of instrument response and an LOD 60% lower than that obtained with Test ‘N Tube™ vials, the absolute measured concentrations were, on average, 17% higher in the Test ‘N Tube™ vials. It would appear that the fact that the color reagent powder does not completely dissolve did not affect the Test ‘N Tube™ results. The same procedure was used to “zero” the instrument before use, so that would not explain the bias. The question remains whether or not there is a bias inherent to the analysis when Test ‘N Tube™ vials are used to make colorimetric measurements.
FIGURE 18: The response of typical blanks suggests that the validity of the LOD is in question.

16
Other Considerations to Improve LOD
o Purchase a flow-injection analysis (FIA) instrument. FIA systems are generally closed systems which eliminate, to a great extent, background contamination. These systems are also very precise, and the current U.S. EPA procedure for determining LODs is based solely on precision. The downside of this option is cost. Even a used instrument can cost upwards of $15,000, and a brand new instrument equipped to analyze both TP and total Kjeldahl nitrogen (TKN) will cost about $30,000-$35,000. Consequently, investing in such a system is likely cost-prohibitive for most smaller industrial or municipal wastewater treatment plants.
o Closely monitor and evaluate calibration data. Calibration errors will also affect
LOD. At the extreme range of linearity, the net change in slope (change in response per unit concentration) starts to plateau. The linear regression equation will often still result in an acceptable calibration as determined by the correlation coefficient, but the regression line will cease to pass through all calibration points. As the upper end of the calibration “drops” the linear regression line “teeters” at the calibration midpoint and the lower end of the calibration rises. This amounts to an increase in the Y-intercept, which, in turn, results in increasingly “negative” values for blanks.
A drop, or dip, in the points at the upper end of a calibration can be caused by exceeding the linear range, a spectrophotometer bulb (lamp) which is not operating at peak performance (i.e. “going bad”), poorly prepared standards, spectrophoto-meter optics becoming coated with acids (e.g., HCl), or failing detector. To check for this, labs can monitor the response factors (response divided by concentration) for each of the calibration standards. In addition, attention must be paid to blanks that yield negative concentrations. A small degree of negativity can be expected, but when the absolute value of the blank concentration exceeds the LOD, corrective action should be initiated.
o Optimize spectrophotometer performance. Insufficient spectrophotometer
maintenance can significantly degrade measurement accuracy and precision. Incorporating the following into the laboratory maintenance program may help generate consistent results at optimum sensitivity. Clean up spills on or inside the spectrophotometer immediately. Periodically clean cell compartment by wiping it out with soft damp cloth. Avoid exposing spectrophotometers to a corrosive environment. Acid vapors, dust, and moisture can coat optics and degrade performance. Consider changing lamp/bulb annually (and before generating a new calibration
curve). Recalibrate anytime major maintenance is performed. Track absorbance of CCVs to ensure sensitivity does not degrade over time. Consider having wavelength accuracy and performance checked by an outside
vendor every few years.
Evaluation of LOD Capability for Total Phosphorus
17
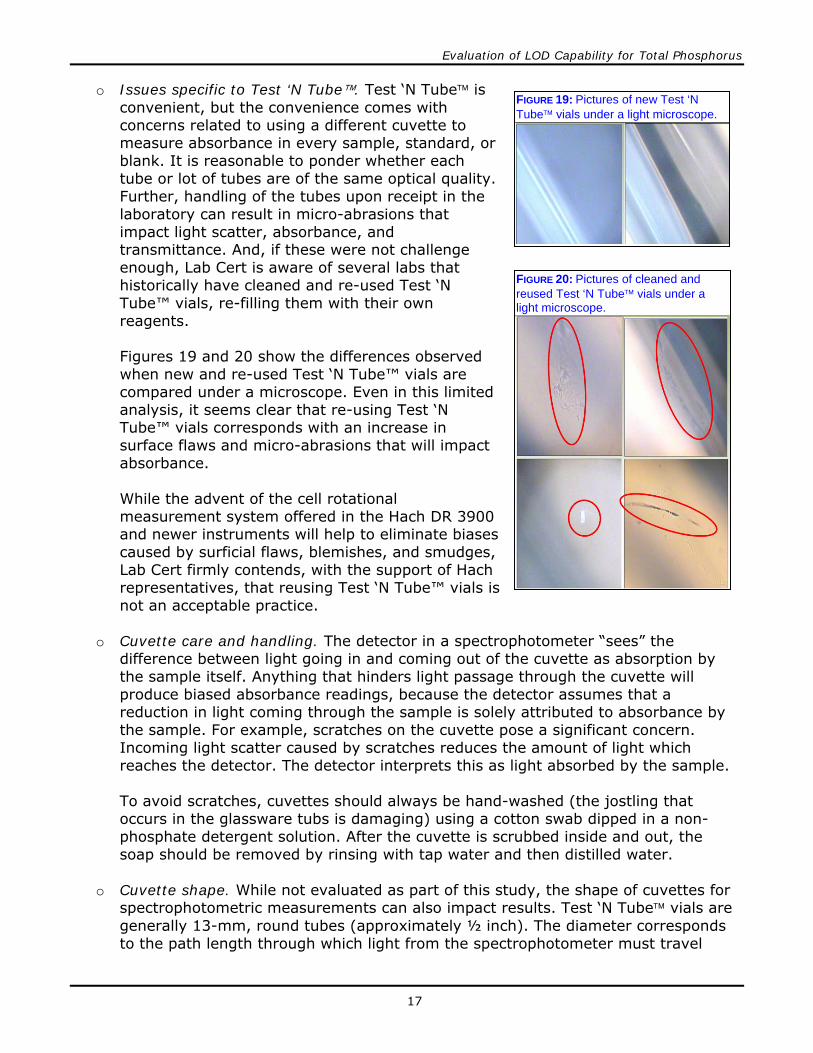
o Issues specific to Test ‘N Tube. Test ‘N Tube is convenient, but the convenience comes with concerns related to using a different cuvette to measure absorbance in every sample, standard, or blank. It is reasonable to ponder whether each tube or lot of tubes are of the same optical quality. Further, handling of the tubes upon receipt in the laboratory can result in micro-abrasions that impact light scatter, absorbance, and transmittance. And, if these were not challenge enough, Lab Cert is aware of several labs that historically have cleaned and re-used Test ‘N Tube™ vials, re-filling them with their own reagents.
Figures 19 and 20 show the differences observed when new and re-used Test ‘N Tube™ vials are compared under a microscope. Even in this limited analysis, it seems clear that re-using Test ‘N Tube™ vials corresponds with an increase in surface flaws and micro-abrasions that will impact absorbance.
While the advent of the cell rotational measurement system offered in the Hach DR 3900 and newer instruments will help to eliminate biases caused by surficial flaws, blemishes, and smudges, Lab Cert firmly contends, with the support of Hach representatives, that reusing Test ‘N Tube™ vials is not an acceptable practice.
o Cuvette care and handling. The detector in a spectrophotometer “sees” the
difference between light going in and coming out of the cuvette as absorption by the sample itself. Anything that hinders light passage through the cuvette will produce biased absorbance readings, because the detector assumes that a reduction in light coming through the sample is solely attributed to absorbance by the sample. For example, scratches on the cuvette pose a significant concern. Incoming light scatter caused by scratches reduces the amount of light which reaches the detector. The detector interprets this as light absorbed by the sample.
To avoid scratches, cuvettes should always be hand-washed (the jostling that occurs in the glassware tubs is damaging) using a cotton swab dipped in a non-phosphate detergent solution. After the cuvette is scrubbed inside and out, the soap should be removed by rinsing with tap water and then distilled water.
o Cuvette shape. While not evaluated as part of this study, the shape of cuvettes for spectrophotometric measurements can also impact results. Test ‘N Tube vials are generally 13-mm, round tubes (approximately ½ inch). The diameter corresponds to the path length through which light from the spectrophotometer must travel
FIGURE 19: Pictures of new Test ‘N Tube vials under a light microscope.
FIGURE 20: Pictures of cleaned and reused Test ‘N Tube vials under a light microscope.
18
through the sample and to the detector. Most other labs use round cuvettes that range from 13 mm to 25 mm. Generally speaking, round cuvettes are used because they are less expensive than square or rectangular cuvettes.
Studies have shown that square (or rectangular) cuvettes are more precise than round ones, and thus yield more accurate results. One reason for this is that as incident light hits the rounded surface, diffraction or scatter eliminates some of the light from ever reaching the detector, which reduces potential absorbance. While there is certainly some degree of diffraction even from a flat surface (square cells), it understandably occurs to a much lesser extent than with round cuvettes. Labs wishing to further improve the quality of their data may wish to consider using square (or rectangular) cuvettes.
Summary/Conclusions • New administrative rules for phosphorus will mean labs need to achieve a valid LOD of
at least 0.03 mg/L. • In general, labs need to review LOD protocols. • The LOD determination process must be focused on obtaining a valid LOD which is both
realistic and defensible, rather than simply meeting the minimum U.S. EPA criteria for LOD.
• It will be very difficult to achieve a realistic, defensible LOD of 0.03 mg/L or less when using Test ‘N Tube procedures without making some adjustments.
• It is strongly recommended that Test ‘N Tube users adopt the single quality cuvette approach.
Evaluation of LOD Capability for Total Phosphorus
Appendix A: Survey Summary Data
19
Question 1Question 1
TypeTechnique
LOD
(mg/L)
Spike (m
g/L)Low
std m
g/LLow
std abs
TypeTechnique
LOD
(mg/L)
Spike (m
g/L)Low
std m
g/LLow
std abs
TypeTechnique
LOD
(mg/L)
Spike (m
g/L)Low
std m
g/LLow
std abs
CODiscrete Analyzer
0.0090.05
0.06250.004
MU
Autoclave0.05
0.040M
UHotplate
0. 10.143
CODiscrete Analyzer
0.0900.4
0.250.006
MU
Autoclave0.1
0.070M
UHotplate
0.10. 123
CODiscrete Analyzer
0.2000.4
0.40.027
MU
Autoclave0.15
0.072M
UHotplate
0.050.077
COFlow Injection (FIA)
0.0250.341
MU
Autoclave0.02
0.031M
UHotplate
0.10.048
COFlow Injection (FIA)
0.10.787
MU
Autoclave0.05
0.072M
UHotplate
0.1
COFlow Injection (FIA)
0.0150.163
MU
Autoclave0.1
0.145M
UHotplate
0.10. 342
COFlow Injection (FIA)
0.10.809
MU
Autoclave0.1
0.036M
UHotplate
0.10.099
COHotplate
0.03750.022
MU
Autoclave0.1
MU
Hotplate0.5
0.025
COHotplate
0.050.022
MU
Autoclave0.1
0.069M
UHotplate
0.10.032
COHotplate
0.1M
UAutoclave
0.20.067
MU
Oven (250C)
0.10.080
COTNT (Test N' Tube)
0.10.074
MU
Autoclave0.05
0.040M
UTNT (Test N' Tube)
0.10.118
COTNT (Test N' Tube)
0.20.119
MU
Autoclave0.1
0.082M
UTNT (Test N' Tube)
0.20. 130
INAutoclave
0.10.078
MU
Autoclave0.1
0.072M
UTNT (Test N' Tube)
0.20. 136
INHotplate
0.050.061
MU
Autoclave0.03
0.172M
UTNT (Test N' Tube)
0.050.281
INHotplate
0.010.032
MU
Autoclave0.15
0.077M
UTNT (Test N' Tube)
0.10.078
INHotplate
0.10.174
MU
Autoclave0.1
0.132M
UTNT (Test N' Tube)
0.20.032
INTNT (Test N' Tube)
0.10.126
MU
Autoclave0.2
0.158M
UTNT (Test N' Tube)
0.70. 077
INTNT (Test N' Tube)
0.10.109
MU
Autoclave0.4
0.229M
UTNT (Test N' Tube)
0.050.043
INTNT (Test N' Tube)
0.30.080
MU
Autoclave0.1
0.041M
UTNT (Test N' Tube)
0.20. 147
INTNT (Test N' Tube)
0.20.075
MU
Autoclave0.24
0.030M
UTNT (Test N' Tube)
0.10.071
INTNT (Test N' Tube)
0.10.105
MU
Autoclave0.2
0.033M
UTNT (Test N' Tube)
0.20.100
IN0.025
0.028M
UAutoclave
0.180.190
MU
TNT (Test N' Tube)0.1
0. 152
lg MU
Autoclave0.015
0.037M
UAutoclave
0.50.079
MU
TNT (Test N' Tube)0.1
0. 122
lg MU
Autoclave0.1
0.059M
UHotplate
0.10.141
MU
TNT (Test N' Tube)0.3
lg MU
Autoclave0.1
MU
Hotplate0.15
0.078M
UTNT (Test N' Tube)
0.20.090
lg MU
Autoclave0.1
0.074M
UHotplate
0.10.165
MU
TNT (Test N' Tube)0.2
0.146lg M
UAutoclave
0.050.035
MU
Hotplate0.05
0.015M
UTNT (Test N' Tube)
0.20. 165
lg MU
Discrete Analyzer0.007
0.010.01
0.009M
UHotplate
0.05M
UTNT (Test N' Tube)
0.10. 139
lg MU
Flow Injection (FIA)0.08
0.030M
UHotplate
0.10.167
MU
TNT (Test N' Tube)0.1
lg MU
Flow Injection (FIA)0.1
2.342M
UHotplate
0.10.150
MU
TNT (Test N' Tube)0.2
0. 069lg M
UHotplate
0.040.023
MU
Hotplate0.1
0.126M
UTNT (Test N' Tube)
0.10.027
lg MU
Hotplate0.2
0.012M
UHotplate
0.20.154
MU
TNT (Test N' Tube)0.1
0.102
lg MU
TNT (Test N' Tube)0.5
0.300M
UHotplate
0.10.076
MU
TNT (Test N' Tube)0.2
0. 056
MU
Autoclave0.05
0.055M
UHotplate
0.20.028
MU
TNT (Test N' Tube)0.2
0. 136
MU
Autoclave0.025
0.072M
UHotplate
0.10.057
MU
TNT (Test N' Tube)0.2
0.090M
UAutoclave
0.0150.068
MU
Hotplate0.1
0.072M
UTNT (Test N' Tube)
0.20. 188
MU
Autoclave0.05
0.080M
UHotplate
0.20.140
PHFlow Injection (FIA)
0.0160.530
PHFlow Injection (FIA)
0. 0250.735
Question 4Question 2
Question 4Question 2
Question 1Question 2
Question 4
##
#
9380
0.0060.05
1080.030
0.2
10297
0.0070.1
340.032
0.1
9890
0.0070.1
710.035
0.125
190.003
0.025100
0.0080.05
1070.035
0.143
0.0050.2
160.008
0.117
0.036
940.005
0.00526
0.0100.2
910.036
0.2
760.080
0.170
0.0100.1
1050.055
0.199
0.0060.015
620.011
1120.076
0.05
390.019
0.0531
0.0130.1
450.082
0.1
1130.020
500.013
0.1104
0.0180.1
230.020
0.186
0.0170.05
950.010
0.2
780.020
0.163
0.0180.1
750.011
0.2
380.011
0.161
0.0190.2
70.014
0.2
880.012
0.140
0.0200.12
280.015
0.15
840.030
0.0568
0.0230.1
350.020
0.1
200.032
0.142
0.0270.2
1090.020
0.141
0.0210.2
110.036
0.2111
0.0200.1
210.040
0.281
0.0400.2
130.022
0.185
0.0530.1
120.041
0.2566
0.0220.484
890.066
0.13
0.0450.12
600.025
0.182
0.0700.3
570.046
0.158
0.0260.1
1030.008
0.55
0.0540.1
730.027
0.2
560.004
0.0577
0.0790.1
150.038
0.1
440.005
0.14
0.0030.2
650.040
590.020
220.006
0.136
0.0400.1
490.024
0.167
0.0060.2
870.042
0.210
0.0500.05
640.006
0.148
0.0430.3
8330
0.00918
0.0440.1
530.020
0.492
0.0180.1
1140.044
370.038
0.114
0.0200.2
80.046
0.19
0.0050.02
540.020
0.2106
0.0470.01
270.130
0.2110
0.0210.2
960.048
0.1
320.054
0.529
0.0210.1
720.061
0.1
330.002
0.246
0.0240.1
550.069
0.2
10.005
0.151
0.0240.1
470.073
0.252
0.0050.1
1010.029
0.16
0.0930.2
740.005
0.169
0.0300.2
240.005
0.01679
0.0090.2
20
Appendix B: Survey LOD Replicate Data (1 of 3)1
23
45
67
8
Typ
e#93
0. 009
0.05
0.05
0.050.05
0.05
0.05
0.05
10
20.09
0.40
0.43
0.380.39
0.45
0.44
0.38
980.2
0.35
0.34
0.350.35
0.34
0.29
0.35
190
.0030.0
20
.020.02
0.030
.030
.020.0
20.0
3
430
. 0050.0
60
.060.06
0.060
.060
.060.0
60.0
5
940
. 0050.0
10
.010.01
0.010
.010
.010.0
20.0
2
760.08
0.13
0.13
0.120.12
0.13
0.13
0.13
0.11
990
. 0060.0
40
.040.04
0.040
.040
.040.0
4
390
.0190.0
50
.030.03
0.040
.040
.040.0
4
11
30.02
1
23
Te ch
niq
ue
LO
D
(mg
/L)
Sp
ike (m
g/L
)m
g/L
abs
mg
/Lab
sm
g/L
abs
mg
/Lab
sm
g/L
abs
mg
/Lab
sm
g/L
abs
mg
/Lab
s
CO
Discre
te A
nalyze
r0.0
50.0
030
.003
0.003
0.002
0.00
30.0
030.00
3
CO
Discre
te A
nalyze
r0.4
0.012
0.01
30.0
110
.0120
.014
0.014
0.011
CO
Discre
te A
nalyze
r0.4
0.025
0.02
50.0
260
.0250
.025
0.022
0.025
CO
FIA
0.025
0.340
0.34
70.3
410
.3550
.370
0.333
0.344
0.359
CO
FIA
0.10.4
340
.432
0.441
0.435
0.42
60.4
320.42
50.41
8
CO
FIA
0.015
0.404
0.39
20.3
960
.3610
.344
0.409
0.463
0.446
CO
FIA
0.11.0
701
.110
1.030
1.030
1.09
01.0
901.12
00.93
5
CO
Hotplate
0.0375
0.061
0.06
20.0
640
.0600
.060
0.062
0.061
CO
Hotplate
0.05
0.019
0.01
40.0
140
.0160
.016
0.015
0.017
CO
Hotplate
0.
CO
TN
T (T
est N' T
ube)0
.0200.1
00
.120.10
0.110
.110
.110.1
0
780.02
0.19
0.18
0.190.20
0.19
0.19
0.19
380
. 0110.1
10
.100.10
0.100
.110
.100.1
0
880
. 0120.0
50
.050.06
0.050
.050
.050.0
4
840.03
0.01
0.01
0.010.01
0.01
0.01
0.01
200
. 0320.0
90
.110.10
0.100
.090
.110.1
2
41
0.10.0
800
.089
0.081
0.088
0.08
30.0
860.07
8
CO
TN
T (T
est N' T
ube)0.2
0.160
0.15
50.1
610
.1640
.160
0.160
0.159
INA
utoclave
0.10.0
780
.075
0.073
0.072
0.07
80.0
740.07
1
INH
otplate0.0
50.0
200
.021
0.022
0.019
0.01
90.0
200.01
7
IN
Hotplate
0.01
0.008
0.00
90.0
080
.0080
.008
0.008
0.008
INH
otplate0.1
IN
TN
T (T
est N' T
ube)0
.0210.1
00
.100.11
0.100
.100
.110.0
90.1
1
210.1
0.073
0.07
60.0
770
.0720
.076
0.078
0.068
0.079
INT
NT
(Test N
' Tube)
0.040
0.12
0.13
0.140.12
0.15
0.11
0.13
850.1
0.069
0.07
60.0
800
.0690
.084
0.066
0.077
INT
NT
(Test N
' Tube)
0.0531
0.32
0.31
0.300.32
0.34
0.29
0.34
0.34
890.3
0.201
0.18
60.1
800
.1900
.200
0.172
0.199
0.198
INT
NT
(Test N
' Tube)
0.066
82
0.20.1
450
.143
0.123
0.161
0.13
90.1
460.14
8
INT
NT
(Test N
' Tube)
0.0704
0.16
0.13
0.110.10
0.09
0.12
0.09
10
30.0
0830.0
20
.020.02
0.020
.020
.020.0
3
560
.0040.0
10
.010.01
0.010
.020
.020.0
20.0
1
440
. 0050.1
10
.110.10
0.100
.100
.100.1
00.1
1
590.0
2020.0
90
.090.10
0.100
.100
.090.0
90.1
0
490
. 0240.0
90
.080.07
0.080
.090
.080.0
7
100
. 0500.0
60
.060.05
0.040
.040
.050.0
80.0
8
83
0.10.0
630
.057
0.051
0.047
0.04
60.0
520.04
4
IN0.02
50.0
160
.016
0.017
0.016
0.01
40.0
140.01
9
lg MU
Au
toclave0.01
50.0
120
.012
0.012
0.012
0.01
30.0
130.01
30.01
1
lg MU
Au
toclave0.1
0.063
0.06
20.0
610
.0610
.061
0.061
0.061
0.062
lg MU
Au
toclave0.1
0.066
0.06
50.0
730
.0740
.073
0.066
0.066
0.073
lg MU
Au
toclave0.1
0.042
0.03
80.0
360
.0390
.042
0.037
0.036
lg MU
Au
toclave0.0
50.0
100
.012
0.009
0.008
0.00
80.0
090.01
50.01
5
lg MU
Discre
te A
nalyzer
0.01
0.010
0.01
00.0
100
.0100
.010
0.009
0.009
lg MU
FIA
0.08
0.007
0.00
70.0
070
.0070
.007
0.008
0.007
lg MU
FIA
0.1
lg MU
Hotplate
0.04
0.041
0.04
20.0
410
.0430
.043
0.041
0.042
lg MU
Hotplate
0.20.0
570
.060
0.063
0.062
0.06
40.0
600.05
8
lg MU
TN
T (T
est N' T
ube)0.5
0.324
0.29
00.2
790
.2960
.299
0.323
0.291
MU
Au
toclave0.0
50.0
300
.030
0.031
0.030
0.03
00.0
310.03
1
MU
Au
toclave0.02
5
MU
Au
t oclave0.01
50.0
060
.006
0.005
0.005
0.00
70.0
060.00
40.00
6
MU
Au
toclave0.0
5
0.041
0
.040
0.0
42
0.039
0
.043
0.0
44
0.042
Question 1
Question 2
Question 3 (LO
D data)
0. 007
0.01
0.01
0.010.01
0.01
0.01
0.01
530
. 0200.0
90
.080.09
0.090
.080
.090.0
9
370
. 0380.0
70
.060.07
0.080
.060
.090.0
9
90
. 0050.0
40
.040.04
0.040
.040
.040.0
4
270
. 1300.1
60
.200.25
0.230
.270
.200.1
7
320
. 0540.5
50
.480.46
0.490
.500
.550.4
8
330
. 0020.0
60
.060.06
0.060
.060
.060.0
6
10
. 0050.0
30
.030.03
0.030
.020
.030.0
3
520
. 0050.0
10
.010.00
0.000
.000
.010.0
10.0
1
740.0
054
Evaluation of LOD Capability for Total Phosphorus
21
Appendix B: Survey LOD Replicate Data (2 of 3)
Typ
e#
Te
ch
niq
ue
(mg
/L)
p(m
g/L
)m
g/L
ab
sm
g/L
ab
sm
g/L
ab
sm
g/L
ab
sm
g/L
ab
sm
g/L
ab
sm
g/L
ab
sm
g/L
ab
s
MU
Auto
clave
0.0
50.0
21
0.0
22
0.0
21
0.0
22
0.0
22
0.0
21
0.0
23
0.0
22
MU
Auto
clave
0.1
0.0
62
0.0
65
0.0
66
0.0
68
0.0
68
0.0
68
0.0
67
MU
Auto
clave
0.1
5M
UA
uto
clave
0.0
20.0
11
0.0
14
0.0
14
0.0
15
0.0
16
0.0
14
0.0
14
0.0
15
MU
Auto
clave
0.0
5
0.0
31
0.0
29
0.0
30
0
.028
0.0
28
0.0
30
0.0
29
0.0
20
MU
Auto
clave
0.1
0.0
80
0.0
80
0.0
75
0.0
80
0.0
80
0.0
80
0.0
75
0.0
80
MU
Auto
clave
0.1
0.0
36
0.0
38
0.0
36
0.0
37
0.0
40
0.0
39
0.0
40
MU
Auto
clave
0.1
0.0
76
0.0
71
0.0
71
0.0
73
0.0
76
0.0
70
0.0
72
MU
Auto
clave
0.1
0.0
73
0.0
74
0.0
71
0.0
77
0.0
78
0.0
77
0.0
79
MU
Auto
clave
0.2
MU
Auto
clave
0.0
50.0
32
0.0
42
0.0
44
0.0
42
0.0
43
0.0
42
0.0
42
MU
Auto
clave
0.1
0.0
84
0.0
81
0.0
83
0.0
84
0.0
77
0.0
74
0.0
77
0.0
75
MU
Auto
clave
0.1
0.0
37
0.0
40
0.0
37
0.0
35
0.0
40
0.0
35
0.0
38
MU
Auto
clave
0.0
30.0
22
0.0
25
0.0
25
0.0
28
0.0
29
0.0
36
0.0
33
0.0
31
MU
Auto
clave
0.1
50.1
12
0.1
07
0.1
16
0.1
24
0.1
14
0.1
11
0.1
12
0.1
17
MU
Auto
clave
0.1
0.0
76
0.0
69
0.0
66
0.0
60
0.0
60
0.0
66
0.0
67
0.0
66
MU
Auto
clave
0.2
0.1
80
0.1
48
0.1
62
0.1
56
0.1
48
0.1
56
0.1
58
0.1
53
MU
Auto
clave
0.4
MU
Auto
clave
0.1
0.0
21
0.0
19
0.0
22
0.0
22
0.0
19
0.0
19
0.0
18
0.0
16
MU
Auto
clave
0.2
40.2
20.0
71
0.2
40
.079
0.2
44
0.0
80
0.2
70
.088
0.2
41
0.0
79
0.2
30.0
75
0.2
30.0
76
MU
Auto
clave
0.2
0.0
40
0.0
36
0.0
37
0.0
37
0.0
41
0.0
36
0.0
39
MU
Auto
clave
0.1
80.1
76
0.1
59
0.1
78
0.1
63
0.1
74
0.1
99
0.1
53
MU
Auto
clave
0.5
MU
Hotp
late
0.1
0.0
70
0.0
71
0.0
70
0.0
69
0.0
69
0.0
69
0.0
68
MU
Hotp
late
0.1
50.0
16
0.0
17
0.0
17
0.0
18
0.0
19
0.0
19
0.0
21
0.0
18
MU
Hotp
late
0.1
0.0
94
0.0
93
0.0
92
0.0
96
0.0
95
0.0
93
0.0
94
MU
Hotp
late
0.0
5
MU
Hotp
late
0.0
50.0
18
0.0
18
0.0
21
0.0
18
0.0
19
0.0
18
0.0
18
MU
Hotp
late
0.1
0.1
67
0.1
60
0.1
66
0.1
62
0.1
78
0.1
82
0.1
58
MU
Hotp
late
0.1
0.0
98
0.0
90
0.0
92
0.0
88
0.0
85
0.0
88
0.0
80
MU
Hotp
late
0.1
0.0
69
0.0
75
0.0
76
0.0
73
0.0
71
0.0
76
0.0
77
MU
Hotp
late
0.2
MU
Hotp
late
0.1
0.0
71
0.0
70
0.0
72
0.0
71
0.0
81
0.0
80
0.0
67
0.0
70
MU
Hotp
late
0.2
0.0
61
0.0
60
0.0
63
0.0
64
0.0
59
0.0
60
0.0
59
MU
Hotp
late
0.1
0.1
16
0
.123
0.1
06
0
.112
0.1
18
0.1
01
0.1
23
0.1
07
MU
Hotp
late
0.1
0.0
83
0.0
79
0.0
88
0.0
65
0.0
71
0.0
80
0.0
81
0.0
84
MU
Hotp
late
0.2
80
0.0
058
0.0
50.0
60
.05
0.0
60.0
60.0
50.0
60.0
6
97
0. 0
069
60.0
90.0
90
.09
0.1
00.1
00.1
00.1
0
90
0.0
07
0.1
60.1
60
.16
0.1
50.1
50.1
60.1
6
10
00.0
079
0.0
20.0
20
.02
0.0
20.0
30.0
20.0
20.0
2
16
0.0
08
26
0.0
10
0.1
10.1
10
.10
0.1
10.1
10.1
10.1
00.1
1
70
0.0
10.1
00.1
00
.10
0.1
00.1
10.1
10.1
1
62
0.0
11
0.1
00.0
90
.09
0.1
00.1
00.0
90.1
0
31
0.0
13
0.0
90.0
90
.09
0.1
00.1
00.1
00.1
0
50
0.0
13
0.2
00.2
10
.21
0.2
00.2
00.2
00.2
0
86
0.0
17
0.0
40.0
50
.06
0.0
60.0
50.0
60.0
6
63
0.0
18
0.1
00.1
00
.10
0.1
00.0
90.0
90.0
90.0
9
61
0. 0
192
40.0
70.0
70
.07
0.0
70.0
70.0
70.0
7
40
0.0
20
0.0
20.0
30
.03
0.0
30.0
30.0
40.0
40.0
4
68
0.0
227
0.1
40.1
40
.15
0.1
60.1
50.1
40.1
40.1
2
42
0.0
27
0.1
10.0
90
.09
0.0
80.0
80.0
90.0
90.0
9
11
0.0
36
0.2
20.1
80
.20
0.1
90.1
80.1
90.2
00.1
9
81
0.0
40.4
50.4
20
.45
0.4
10.4
30.4
30.4
3
12
0.0
41
0.1
10.1
00
.12
0.1
20.1
00.1
00.0
90.0
8
30.0
45
57
0.0
46
0.2
10.1
80
.19
0.1
90.2
20.1
80.2
0
50.0
54
0.1
80.1
70
.19
0.1
70.1
80.2
10.1
6
77
0.0
79
0.3
60.3
70
.38
0.3
80.3
70.3
70.3
70.3
8
40.0
03
0.1
00.1
00
.10
0.1
00.1
00.1
00.1
0
22
0.0
06
0.0
20.0
20
.02
0.0
20.0
20.0
20.0
30.0
2
67
0.0
057
0.1
20.1
10
.11
0.1
20.1
20.1
10.1
2
64
0.0
06
0.0
50.0
50
.05
0.0
50.0
50.0
50.0
5
30
0.0
09
0.0
60.0
60
.06
0.0
60.0
60.0
60.0
6
92
0.0
175
0.0
90.0
90
.09
0.0
90.1
00.1
00.0
9
14
0.0
20
0.1
20.1
10
.11
0.1
10.1
10.1
10.1
0
54
0.0
20
0.1
10.1
20
.12
0.1
20.1
10.1
20.1
2
11
00.0
212
0.2
00.2
10
.21
0.1
90.2
10.2
10.2
1
29
0.0
21
0.0
90.0
90
.09
0.0
90.1
10.1
00.0
90.0
9
46
0.0
24
0.2
20.2
10
.23
0.2
30.2
10.2
10.2
1
51
0.0
24
10
10.0
292
0.1
10.1
00
.12
0.0
80.0
90.1
10.1
10.1
1
69
0.0
30.2
00.2
00
.21
0.2
20.2
10.2
10.2
2

22
Appendix B: Survey LOD Replicate Data (3 of 3)
12
34
56
78
Typ
e#10
80.0
30.1
20.1
30.1
40.1
30.1
30.1
40.1
4
34
0.0
32
0.0
90.0
90.0
90.0
90.1
10.1
10.1
0
71
0.0
346
0.0
50.0
60.0
70.0
70.0
80.0
80.0
6
10
70
.03
50.0
90.0
80.1
00.1
10.1
00.0
90.0
8
17
0.0
36
0.0
60.0
60.0
60.0
50.0
60.0
60.0
6
91
0.0
36
0.1
20.0
90.0
90.1
30.1
10.1
20.1
10.1
0
10
50
.05
50.1
10.1
10.0
70.0
80.0
80.1
20.0
8
11
20.0
763
0.4
50.4
60.4
80.5
30.4
80.4
80.4
7
45
0.0
82
0.1
10.1
10.0
90.1
00.1
00.1
00.1
1
10
40
.01
80.1
00.1
00.1
00.1
00.1
10.1
00.1
0
95
0.0
10.1
10.1
10.1
10.1
20.1
10.1
10.1
1
75
0.0
105
0.2
00.2
00.2
00.2
00.2
00.2
10.2
0
70
.01
40.2
00.2
00.1
90.2
00.2
00.1
90.2
0
28
0.0
15
0.0
50.0
60.0
70.0
50.0
50.0
50.0
50.0
5
35
0.0
20
0.0
90.1
00.1
00.1
00.0
90.1
10.0
9
10
90.0
20.1
70.1
50.1
60.1
60.1
70.1
60.1
70.1
6
11
10.0
20.7
10.7
20.7
10.7
10.7
20.7
10.7
0
13
0.0
22
0.0
40.0
50.0
40.0
40.0
50.0
30.0
4
66
0.0
22
0.2
00.2
00.2
00.2
10.1
90.1
90.2
00.2
0
60
0.0
25
0.0
80.0
80.0
90.0
70.0
90.0
90.0
7
58
0.0
26
0.2
00.2
10.1
90.2
00.2
00.1
90.1
9
73
0.0
27
0.1
10.1
00.1
00.1
10.1
10.1
20.1
2
15
0.0
38
0.1
30.1
30.1
00.1
20.1
30.1
10.1
1
65
Te
ch
niq
ue
LO
D
(mg
/L)
Sp
ike
(mg
/L)
mg
/Lab
sm
g/L
ab
sm
g/L
ab
sm
g/L
ab
sm
g/L
ab
sm
g/L
ab
sm
g/L
ab
sm
g/L
ab
s
MU
Ho
tpla
te0
.10.0
27
0.0
31
0.0
36
0.0
32
0.0
31
0.0
33
0.0
35
MU
Ho
tpla
te0
.1
MU
Hotp
late
0.0
5
MU
Ho
tpla
te0
.10.0
56
0.0
54
0.0
64
0.0
72
0.0
61
0.0
60
0.0
51
MU
Ho
tpla
te0
.10.0
49
0.0
49
0.0
45
0.0
37
0.0
45
0.0
43
0.0
46
MU
Ho
tpla
te0
.10.2
02
0.1
42
0.1
64
0.2
18
0.1
95
0.2
07
0.1
66
0.1
48
MU
Ho
tpla
te0
.10.0
22
0.0
22
0.0
19
0.0
20
0.0
20
0.0
23
0.0
20
MU
Ho
tpla
te0
.50.1
86
0.1
90
0.1
98
0.2
17
0.1
99
0.1
97
0.1
96
MU
Ho
tpla
te0
.10.0
36
0.0
36
0.0
28
0.0
31
0.0
32
0.0
32
0.0
34
MU
Ove
n (2
50C
)0
.1
MU
TN
T ( T
est N
' Tu
be
)0
.10.0
68
0.0
66
0.0
66
0.0
70
0.0
67
0.0
64
0.0
65
MU
TN
T (T
est N
' Tu
be
)0
.20.1
24
0.1
25
0.1
25
0.1
28
0.1
27
0.1
32
0.1
27
MU
TN
T (T
est N
' Tu
be
)0
.20.1
22
0.1
25
0.1
19
0.1
22
0.1
25
0.1
20
0.1
24
MU
TN
T (T
est N
' Tu
be
)0.0
50.0
95
0.1
02
0.1
19
0.0
93
0.0
94
0.0
91
0.0
92
0.0
90
MU
TN
T (T
est N
' Tu
be
)0
.10.0
72
0.0
75
0.0
79
0.0
74
0.0
73
0.0
80
MU
TN
T (T
est N
' Tu
be
)0
.20.0
52
0.0
48
0.0
51
0.0
50
0.0
53
0.0
50
0.0
52
0.0
49
MU
TN
T (T
est N
' Tu
be
)0
.70.4
03
0.4
07
0.4
04
0.4
02
0.4
09
0.4
02
0.3
97
MU
TN
T (T
est N
' Tu
be
)0.0
50.0
19
0.0
24
0.0
18
0.0
16
0.0
20
0.0
07
0.0
16
MU
TN
T (T
est N
' Tu
be
)0
.20.0
58
0.0
60
0.0
58
0.0
62
0.0
56
0.0
56
0.0
58
0.0
60
MU
TN
T (T
est N
' Tu
be
)0
.10.0
78
0.0
77
0.0
82
0.0
72
0.0
79
0.0
82
0.0
72
MU
TN
T (T
est N
' Tu
be
)0
.20.1
53
0.1
57
0.1
46
0.1
52
0.1
49
0.1
46
0.1
47
MU
TN
T (T
est N
' Tu
be
)0
.10.1
12
0.1
07
0.1
08
0.1
12
0.1
16
0.1
20
0.1
21
MU
TN
T (T
est N
' Tu
be
)0
.10.1
34
0.1
33
0.1
18
0.1
29
0.1
34
0.1
23
0.1
21
MU
TN
T (T
est N
' Tu
be
)0.0
399
0.3
10.2
90.2
80.2
90.2
70.2
80.2
8
36
0.0
40
0.2
00.1
80.2
00.2
10.2
00.1
90.1
80.1
7
87
0.0
42
0.1
90.1
90.2
20.2
20.1
90.2
00.2
0
48
0.0
43
0.2
20.2
30.2
20.2
40.2
30.2
10.2
1
18
0.0
44
0.1
00.0
90.0
90.1
00.0
90.0
80.0
60.0
6
11
40
.04
40.0
90.0
80.0
60.0
60.0
60.0
50.0
6
80
.04
60.2
30.2
00.2
20.1
90.2
20.2
00.2
2
10
60
.04
70.0
90.1
10.1
30.0
90.1
20.1
20.1
2
96
0.0
48
0.1
30.1
20.1
10.1
30.1
00.1
40.1
1
72
0.0
612
0.2
00.1
70.1
80.2
20.2
10.1
80.1
8
55
0.0
69
0.2
20.1
70.2
20.2
10.2
40.2
20.2
3
47
0.0
73
0.2
00.2
30.2
00.2
60.2
30.2
50.2
1
60
.09
30.2
10.2
50.1
84
0.2
10.1
92
0.2
34
0.1
59
25
0.0
01
0.0
10.0
10.0
10.0
10.0
10.0
10.0
1
79
0.0
088
0.0
30.0
30.0
30.0
30.0
30.0
30.0
30.0
2
0.3
0.3
55
0.3
48
0.3
41
0.3
45
0.3
36
0.3
42
0.3
40
MU
TN
T (T
est N
' Tu
be
)0
.2
MU
TN
T (T
est N
' Tu
be
)0
.20.1
49
0.1
50
0.1
67
0.1
64
0.1
47
0.1
57
0.1
56
MU
TN
T (T
est N
' Tu
be
)0
.20.1
36
0.1
44
0.1
34
0.1
49
0.1
41
0.1
32
0.1
28
MU
TN
T (T
est N
' Tu
be
)0
.10.0
87
0.0
81
0.0
83
0.0
88
0.0
82
0.0
79
0.0
69
0.0
67
MU
TN
T (T
est N
' Tu
be
)0
.10.0
57
0.0
50
0.0
39
0.0
39
0.0
42
0.0
37
0.0
42
MU
TN
T (T
est N
' Tu
be
)0
.20.1
31
0.1
19
0.1
27
0.1
10
0.1
28
0.1
17
0.1
26
MU
TN
T (T
est N
' Tu
be
)0
.10.0
29
0.0
37
0.0
41
0.0
30
0.0
37
0.0
38
0.0
37
MU
TN
T (T
est N
' Tu
be
)0
.10.1
05
0.1
03
0.0
95
0.1
08
0.0
89
0.1
10
0.0
93
MU
TN
T (T
est N
' Tu
be
)0
.20.1
06
0.0
90
0.0
97
0.1
16
0.1
14
0.0
95
0.0
99
MU
TN
T (T
est N
' Tu
be
)0
.20.1
58
0.1
31
0.1
57
0.1
47
0.1
67
0.1
53
0.1
59
MU
TN
T (T
est N
' Tu
be
)0
.2
MU
TN
T ( T
est N
' Tu
be
)0
.2
PH
FIA
0.0
05
0.5
01
0.4
57
0.4
65
0.4
81
0.4
76
0.4
95
0.4
94
PH
FIA
0.0
25
0.0
96
0.0
79
0.1
06
0.0
97
0.1
02
0.0
85
0.0
87
0.0
77
Question 1
Question 2
Questio
n 3 (LOD
data)
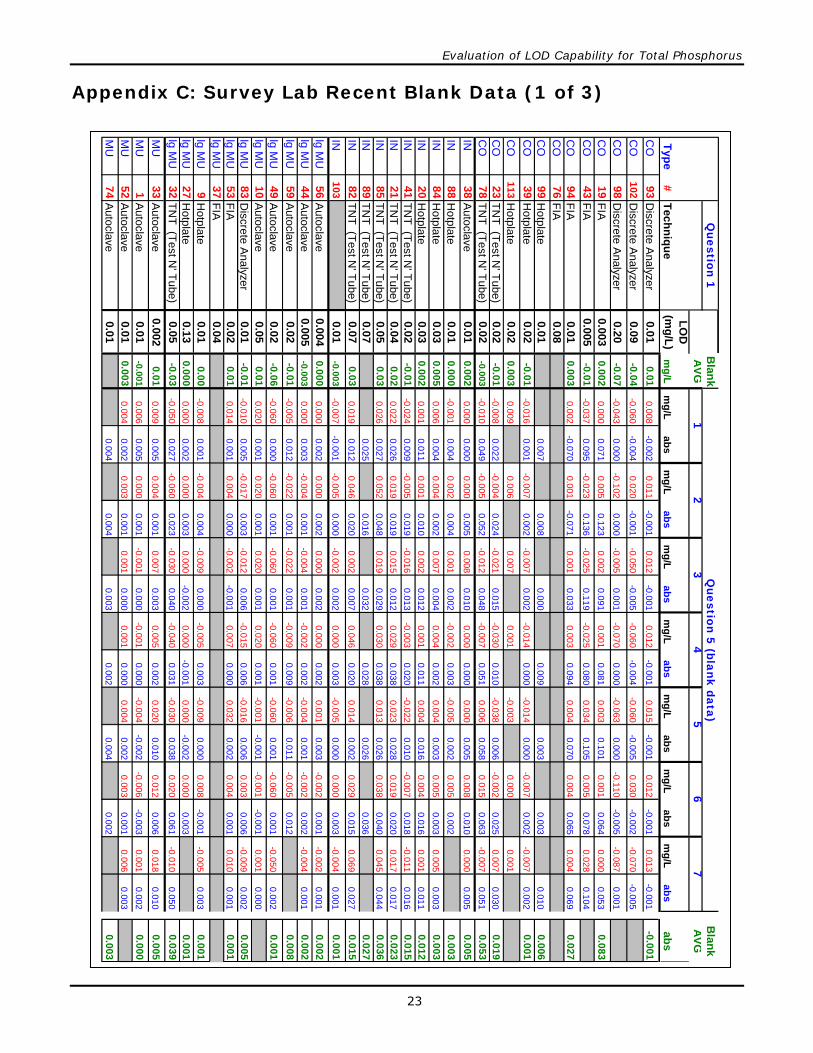
Evaluation of LOD Capability for Total Phosphorus
23
Appendix C: Survey Lab Recent Blank Data (1 of 3)
Blan
kB
lank
HP
/AC
/BD
/TN
TLO
DA
VG
AV
G
Typ
e#93
0.0080.011
0.0120.012
0.0150.012
0.013
10
2-0.060
0.020-0.050
-0.060-0.060
0.030-0.070
98-0.043
-0.102-0.005
-0.070-0.063
-0.110-0.087
190.000
0.0050.002
0.0010.003
0.0010.000
43-0.037
-0.023-0.025
-0.0250.034
0.0050.028
940.002
0.0010.001
0.0030.004
0.0040.004
769939-0.016
-0.007-0.007
-0.014-0.014
-0.007-0.007
11
30.009
0.0060.007
0.001-0.003
0.0000.001
23
Tec
hn
iqu
eL
OD
(m
g/L
)m
g/L
mg
/La
bs
mg
/La
bs
mg
/La
bs
mg
/La
bs
mg
/La
bs
mg
/La
bs
mg
/La
bs
abs
CO
Discrete A
nalyzer0
.010
.01
-0.002-0.001
-0.001-0.001
-0.001-0.001
-0.001-0
.00
1
CO
Discrete A
nalyzer0
.09-0
.04
-0.004-0.001
-0.005-0.004
-0.005-0.002
-0.005
CO
Discrete A
nalyzer0
.20-0
.07
0.0000.000
0.0010.000
0.000-0.005
0.001
CO
FIA
0.003
0.0
02
0.0710.123
0.0910.081
0.1010.064
0.0530
.08
3
CO
FIA
0.005
-0.0
10.095
0.1360.119
0.0800.105
0.0780.104
CO
FIA
0.01
0.0
03
-0.070-0.071
0.0330.094
0.0700.065
0.0690
.02
7
CO
FIA
0.08
CO
Hotplate
0.01
0.0070.008
0.0000.009
0.0030.003
0.0100
.00
6
CO
Hotplate
0.02
-0.0
10.001
0.0020.002
0.0000.000
0.0020.002
0.0
01
CO
Hotplate
0.02
0.0
03
CO
TN
T (T
est N' T
ube)0
.02-0
.01
0.0220.024
0.0150.010
0.0060.025
0.0300
.01
9C
OT
NT
(Test N
' Tube)
0.02
-0.0030.049
0.0520.048
0.0510.058
0.0630.051
0.0
53
INA
utoclave0
.010
.00
20.000
0.0050.010
0.0000.005
0.0100.005
0.0
05
INH
otplate0
.010
.00
00.004
0.0040.002
0.0030.002
0.0020
.00
3
INH
otplate0
.030
.00
50.004
0.0020.004
0.0020.003
0.0030.003
0.0
03
INH
otplate0
.030
.00
20.011
0.0100.012
0.0110.016
0.0160.011
0.0
12
INT
NT
-0.008-0.004
-0.021-0.030
-0.038-0.002
0.007
78-0.010
- 0.005-0.012
-0.0070.006
0.015-0.007
380.000
0.0000.008
0.0000.000
0.0080.000
88-0.001
0.0020.001
-0.002-0.005
0.005
840.006
0.0040.007
0.0040.004
0.0050.005
200.001
0.0010.002
0.0010.004
0.0040.001
41(T
est N' T
ube)0
.02-0
.01
0.0090.019
0.0130.020
0.0100.018
0.0160
.01
5
INT
NT
-0.024
-0.005-0.016
-0.003-0.022
-0.007-0.011
21(T
est N' T
ube)0
.040
.02
0.0260.019
0.0120.038
0.0280.020
0.0170
.02
3
INT
NT
0.022
0.0190.015
0.0290.023
0.0190.017
85(T
est N' T
ube)0
.050
.03
0.0270.048
0.0290.038
0.0260.040
0.0440
.03
6
INT
NT
0.026
0.0520.019
0.0300.013
0.0380.045
89(T
est N' T
ube)0
.070.025
0.0160.032
0.0280.026
0.0360
.02
7
INT
NT
82
(Test N
' Tube)
0.07
0.0
30.012
0.0200.007
0.0200.002
0.0150.027
0.0
15
IN0
.01-0.003
-0.0010.000
0.0020.003
0.0000.003
0.0010
.00
1
lg MU
Autoclave
0.004
0.0
00
0.0020.002
0.0020.002
0.0030.001
0.0010
.00
2
lg MU
Autoclave
0.005
-0.0030.003
0.0010.001
0.0020.001
0.0020.001
0.0
02
lg MU
Autoclave
0.02
-0.0
10.012
0.0010.001
0.0090.011
0.0120
.00
8
lg MU
Autoclave
0.02
-0.0
60.000
0.0010.001
0.0010.001
0.0010.002
0.0
01
lg MU
Autoclave
0.05
0.0
10.001
0.0010.001
0.001-0.001
-0.0010.000
lg MU
Discrete A
nal
0.0190.046
0.0020.046
0.0140.029
0.069
10
3-0.00 7
-0.005-0.002
0.000-0.005
0.000-0.004
560.000
0.0000.000
0.0000.001
-0.002-0.002
440.00 0
-0.004-0.004
-0.002-0.004
-0.002-0.004
59-0.005
-0.022-0.022
-0.009-0.006
-0.005
49-0.060
-0.060-0.060
-0.060-0.060
-0.060-0.050
100.020
0.0200.020
0.020-0.001
-0.0010.001
83yzer
0.01
-0.0
10.005
0.0030.006
0.0060.006
0.0060.002
0.0
05
lg MU
FIA
0.02
0.0
10.001
0.000-0.001
0.0000.002
0.0010.001
0.0
01
lg MU
FIA
0.04
lg MU
Hotplate
0.01
0.0
00.001
0.0040.000
0.0030.000
-0.0010.003
0.0
01
lg MU
Hotplate
0.13
0.0
00
0.0020.003
-0.002-0.001
-0.0020.003
0.0
01
lg MU
TN
T (T
est N' T
ube)0
.05-0
.03
0.0270.023
0.0400.031
0.0380.061
0.0500
.03
9
MU
Autoclave
0.002
0.0
10.005
0.0010.003
0.0020.010
0.0060.010
0.0
05
MU
Autoclave
0.01
-0.0010.005
0.0010.000
0.000-0.002
-0.0030.002
0.0
00
MU
Autoclave
0.01
0.0
03
0.0020.001
0.0000.000
0.0020.001
0.003
MU
Autoclave
0.01
0.0040.004
0.0030.002
0.0040.002
0.0
03
56
71
23
4Q
uestion 5 (blank data)Q
uestion 1
-0.010-0.017
-0.012-0.015
-0.0160.003
-0.009
530.014
0.004-0.002
0.0070.032
0.0040.010
379-0.008
-0.004-0.009
-0.005-0.009
0.008-0.005
270.000
0.0000.000
0.0000.000
0.000
32-0.050
-0.060-0.030
-0.040-0.030
0.020-0.010
330.009
0.0040.007
0.0050.020
0.0120.018
10.006
0.000-0 .001
-0.001-0.004
-0.0060.001
520.004
0.0030.001
0.0010.004
0.0030.006
74
uestion

24
Appendix C: Survey Lab Recent Blank Data (2 of 3)
Blan
kB
lan
kH
P/A
C/B
D/T
NT
LOD
AV
GA
VG
Typ
e#80
0.003-0. 009
0.0000.001
0.001-0.001
-0.011
97900.010
0.0060.009
0.004-0.003
-0.0010.002
100
0.0000.000
0.0000.000
0.000
160.000
0.0000.000
0.0000.000
0.0000.000
260.000
0.0000.000
0.0000.000
0.0000.000
700.000
0.0000.000
0.0000.000
0.0000.000
620.005
0.0050.005
0.0080.008
0.0080.010
310.008
0.0030.003
0.0040.004
0.0020.006
500.003
0.0040.003
0.0020.004
0.0020.002
8663-0.014
-0.012-0.012
-0.014-0.011
-0.010-0.017
610.012
0.0070.007
0.0070.004
0.0150.009
400.000
0.0030.004
0.0020.000
0.0020.001
6842-0.023
-0.018-0.021
-0.021-0.019
-0.019-0.014
11-0. 003
0.003-0.001
-0.001-0.007
-0.005-0.008
810.006
120.00 0
-0.0100.000
-0.010-0.010
-0.0100.010
30.011
0.0110.008
0.0080.011
0.0050.011
57-0. 083
-0.083-0.083
-0.083-0.083
-0.083-0.083
50.001
0.0090.002
0.0170.004
0.0080.005
774220.003
0.0030.004
0.0030.004
0.0030.003
670.000
0.0000.000
0.0000.000
0.0000.000
64-0.002
-0.0020.003
0.0050.004
0.0130.003
30920.000
0.0100.030
0.0100.000
0.0000.010
140.030
0.050-0.040
-0.0400.030
0.0000.003
54-0. 005
-0.003-0.003
-0.011-0.005
-0.001-0.001
110
0.00 6-0.009
-0.0050.000
-0.002-0.006
-0.006
29-0.016
-0.019-0.018
-0.019-0.016
-0.006-0.006
460.001
0.0020.001
0.0030.017
0.0170.017
51-0.012
-0.008-0.003
-0.004-0.005
-0.004-0.001
101
0.0030.003
0.0030.000
0.003-0.001
-0.007
690.012
0.0150.008
0.0040.008
0.0080.019
Te
chn
iqu
e
LO
D
(mg
/L)
mg
/Lm
g/L
ab
sm
g/L
abs
mg
/La
bs
mg
/La
bs
mg
/Lab
sm
g/L
ab
sm
g/L
ab
sa
bs
MU
Au
toclave
0.01-0.002
0.005-0.004
0.0030.002
0.0040.002
0.0110
.00
3
MU
Au
toclave
0.01M
UA
uto
clave0.01
0.0
04
0.0030.000
0.0020.004
0.0010.002
0.0040
.00
2
MU
Au
toclave
0.010
.00
0-0.002
0.0010.005
0.0000.000
0.0
01
MU
Au
toclave
0.010
.00
00.002
0.0020.001
0.0020.000
0.0010.002
0.0
01
MU
Au
toclave
0.010
.00
00.000
0.0000.000
0.0000.000
0.0000.000
0.0
00
MU
Au
toclave
0.010
.00
00.001
0.0030.001
0.0010.000
0.0000.002
0.0
01
MU
Au
toclave
0.010
.01
0.0010.001
0.0010.002
0.0020.002
0.0030
.00
2
MU
Au
toclave
0.010
.00
40.005
0.0010.001
0.0020.002
0.0000.003
MU
Au
toclave
0.010
.00
3
MU
Au
toclave
0.020.486
0.4930.490
0.4870.484
0.4790.518
0.4
91
MU
Au
toclave
0.02-0
.01
0.0050.006
0.0060.005
0.0070.008
0.003
MU
Au
toclave
0.020
.00
80.004
0.0020.002
0.0020.001
0.0050.003
0.0
03
MU
Au
toclave
0.020
.00
20.003
0.0070.009
0.0060.003
0.0060.004
0.0
05
MU
Au
toclave
0.02
MU
Au
toclave
0.03-0
.02
0.0010.004
0.0020.002
0.0030.003
0.0050
.00
3
MU
Au
toclave
0.04-0.003
0.0050.009
0.0060.006
0.0020.003
0.0010
.00
5
MU
Au
toclave
0.040
.00
6
MU
Au
toclave
0.04-0.004
0.0040.003
0.0030.002
0.0030.002
0.0050
.00
3
MU
Au
toclave
0.050
.00
9
MU
Au
toclave
0.05-0.083
0.0000.000
0.0000.000
0.0000.000
0.0000
.00
0
MU
Au
toclave
0.050
.00
70.012
0.0280.014
0.0420.018
0.0290.021
0.0
23
MU
Au
toclave
0.08
MU
Hotpla
te0.0
03
MU
Hotpla
te0.01
0.0
03
0.0030.003
0.0040.003
0.0040.003
0.0030
.00
3
MU
Hotpla
te0.01
0.0
00
0.0070.003
0.0040.003
0.0030.005
0.0030
.00
4
MU
Hotpla
te0.01
0.0
03
0.0000.000
0.0010.003
0.0020.009
0.001
MU
Hotpla
te0.01
0.0030.003
0.0040.001
0.0050.007
0.0030
.00
4
MU
Hotpla
te0.02
0.0
10.007
0.0150.054
0.0180.004
0.0000.010
0.0
15
MU
Hotpla
te0.02
0.0
00.024
0.0390.001
0.0010.024
0.0090.004
MU
Hotpla
te0.02
-0.0040.003
0.0040.004
0.0050.003
0.0020.002
0.0
03
MU
Hotpla
te0.02
-0.0030.010
-0.0010.002
0.0050.004
0.0010.001
0.0
03
MU
Hotpla
te0.02
-0.0
10.002
0.0000.001
0.0000.002
0.0020.002
0.0
01
MU
Hotpla
te0.02
0.0
10.002
0.0010.002
0.0010.001
0.0010.001
0.0
01
MU
Hotpla
te0.02
-0.0
1-0.011
-0.0040.004
0.0020.001
0.0020.007
0.0
00
MU
Hotpla
te0.03
0.0
01
0.0060.008
0.0060.004
0.0060.003
-0.0010
.00
5
MU
Hotpla
te0.03
0.0
10.008
0.0100.005
0.0030.005
0.0050.013
0.0
07
56
71
23
4Q
uestion 5 (blank data)Q
uestion 1uestion
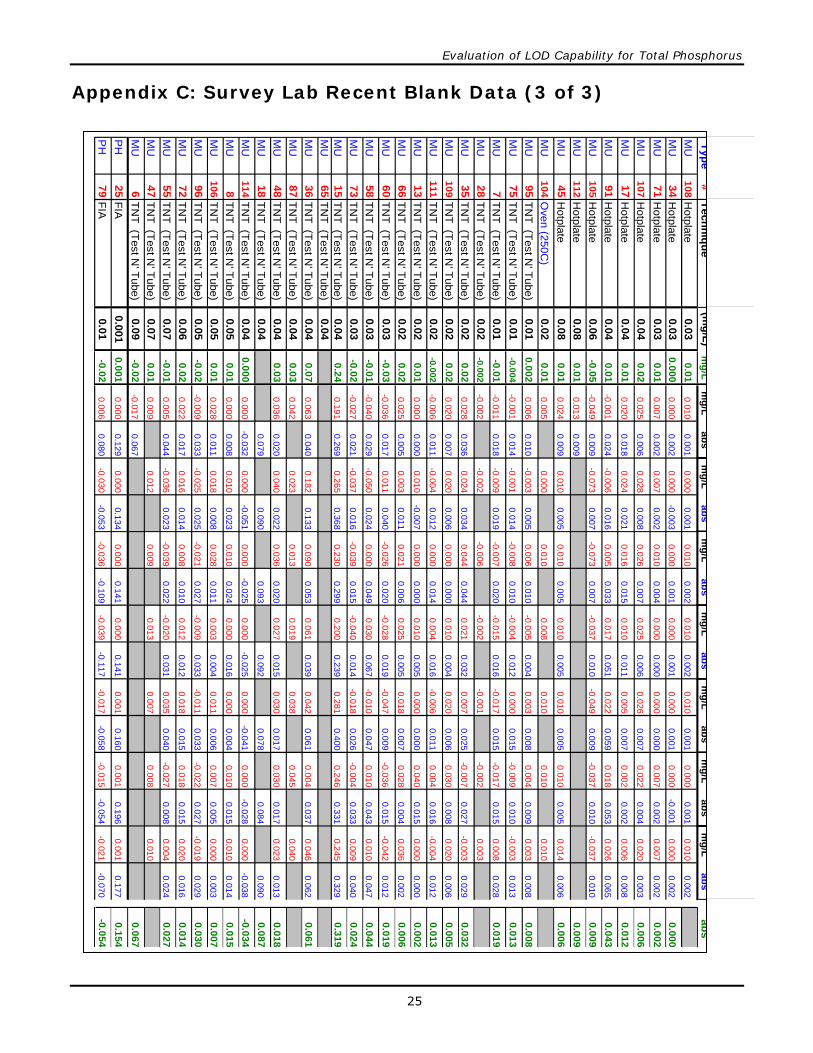
Evaluation of LOD Capability for Total Phosphorus
25
Appendix C: Survey Lab Recent Blank Data (3 of 3)
Typ
e#
Te
ch
niq
ue
(mg
/L)
mg
/Lm
g/L
ab
sm
g/L
ab
sm
g/L
ab
sm
g/L
ab
sm
g/L
ab
sm
g/L
ab
sm
g/L
ab
sa
bs
MU
Ho
tpla
te0.0
30
.01
0.00
10.0
01
0.002
0.00
20.0
01
0.001
0.00
2
MU
Ho
tpla
te0.0
30
.00
00.00
2-0
.003
0.001
0.00
10.0
01
-0.001
0.00
20
.00
0
MU
Ho
tpla
te0.0
30
.01
0.00
20.0
02
0.004
0.00
00.0
00
0.002
0.00
20
.00
2
MU
Ho
tpla
te0.0
40
.02
0.00
60.0
08
0.007
0.00
60.0
07
0.004
0.00
30
.00
6
MU
Ho
tpla
te0.0
40
.01
0.01
80.0
21
0.015
0.01
10.0
07
0.002
0.00
80
.01
2
MU
Ho
tpla
te0.0
40
.01
0.02
40.0
16
0.033
0.05
10.0
59
0.053
0.06
50
.04
3
MU
Ho
tpla
te0.0
6-0
.05
0.00
90.0
07
0.007
0.01
00.0
09
0.010
0.01
00
.00
9
MU
Ho
tpla
te0.0
80
.01
0.00
90
.00
9
MU
Ho
tpla
te0.0
80
.01
0.00
90.0
05
0.005
0.00
50.0
05
0.005
0.00
60
.00
6
MU
Ove
n (2
50
C)
0.0
20
.01
MU
TN
T (T
est N
' Tube)
0.0
10
.00
20.01
00.0
05
0.010
0.00
40.0
08
0.009
0.00
80
.00
8
MU
TN
T (T
est N
' Tube)
0.0
1-0.0
04
0.01
40.0
14
0.010
0.01
20.0
15
0.010
0.01
30
.01
3
MU
TN
T (T
est N
' Tube)
0.0
1-0
.01
0.01
80.0
19
0.020
0.01
60.0
15
0.015
0.02
80
.01
9
MU
TN
T (T
est N
' Tube)
0.0
2-0.0
02
MU
TN
T (T
est N
' Tube)
0.0
20
.02
0.03
60.0
34
0.044
0.03
20.0
25
0.027
0.02
90
.03
2
MU
TN
T (T
est N
' Tube)
0.0
20
.02
0.00
70.0
06
0.000
0.00
40.0
06
0.008
0.00
60
.00
5
MU
TN
T (T
est N
' Tube)
0.0
2-0.0
02
0.01
10.0
12
0.014
0.01
60.0
11
0.016
0.01
20
.01
3
MU
TN
T (T
est N
' Tube)
0.0
20
.01
0.00
0-0
.007
0.000
0.00
50.0
00
0.015
0.00
00
.00
2
MU
TN
T (T
est N
' Tube)
0.0
20
.02
0.00
50.0
11
0.006
0.00
50.0
07
0.004
0.00
20
.00
6
MU
TN
T (T
est N
' Tube)
0.0
3-0
.03
0.01
70.0
40
0.020
0.01
90.0
09
0.015
0.01
20
.01
9
MU
TN
T (T
est N
' Tube)
0.0
3-0
.01
0.02
90.0
24
0.049
0.06
70.0
47
0.043
0.04
70
.04
10
80.0
10
0.0
000.0
10
0.0
10
0.0
100.0
00
0.0
10
34
0.0
00
0.0
000.0
00
0.0
00
0.0
000.0
00
0.0
00
71
0.0
07
0.0
070.0
10
0.0
00
0.0
000.0
07
0.0
07
10
70.0
25
0.0
280.0
26
0.0
25
0.0
260.0
22
0.0
20
17
0.0
20
0.0
240.0
16
0.0
10
0.0
050.0
02
0.0
06
91
-0.0
01
-0.0
060.0
05
0.0
17
0.0
220.0
18
0.0
26
10
5-0
.049
-0.0
73-0
.073
-0.0
37
-0.0
49-0
.037
-0.0
37
11
20.0
13
45
0.0
24
0.0
100.0
10
0.0
10
0.0
100.0
10
0.0
14
10
40.0
05
0.0
000.0
10
0.0
08
0.0
100.0
10
0.0
10
95
0.0
06
-0.0
030.0
06
-0.0
05
0.0
030.0
04
0.0
03
75
-0.0
01
-0.0
0 1-0
.008
-0.0
04
0.0
00-0
.009
-0.0
03
7-0
.011
-0.0
09-0
.007
-0.0
15
-0.0
17-0
.017
0.0
08
28
-0.0
02
-0. 0
02-0
.006
-0.0
02
-0.0
01-0
.002
0.0
03
35
0.0
28
0.0
240.0
44
0.0
21
0.0
07-0
.007
-0.0
03
10
90.0
20
0.0
200.0
00
0.0
10
0.0
200.0
30
0.0
20
11
1-0
.006
-0.0
0 40.0
00
0.0
04
-0.0
060.0
04
-0.0
04
13
0.0
00
0.0
100.0
00
0.0
10
0.0
000.0
40
0.0
00
66
0.0
25
0.0
030.0
21
0.0
25
0.0
180.0
28
0.0
36
60
-0.0
36
0.0
11-0
.026
-0.0
28
-0.0
47-0
.036
-0.0
42
58
-0.0
40
-0.0
500.0
00
0.0
30
-0.0
100.0
10
0.0
10
4
MU
TN
T (T
est N
' Tube)
0.0
3-0
.02
0.02
10.0
16
0.015
0.01
40.0
26
0.033
0.04
00
.02
73
-0.0
27
-0.0
37-0
.039
-0.0
40
-0.0
18-0
.004
0.0
09
4
MU
TN
T (T
est N
' Tube)
0.0
40
.24
0.26
90.3
68
0.299
0.23
90.4
00
0.331
0.32
90
.31
9
MU
TN
T
15
0.1
91
0.2
650.2
30
0.2
00
0.2
810.2
46
0.2
45
65
(Test N
' Tu
be
)0.0
4
MU
TN
T (T
est N
' Tube)
0.0
40
.07
0.04
00.1
33
0.053
0.03
90.0
61
0.037
0.06
20
.06
1
MU
TN
T (T
est N
' Tube)
0.0
40
.03
MU
TN
T (T
est N
' Tube)
0.0
40
.03
0.02
00.0
22
0.020
0.01
50.0
17
0.017
0.01
30
.01
8
MU
TN
T (T
est N
' Tube)
0.0
40.07
90.0
90
0.093
0.09
20.0
78
0.084
0.09
00
.08
7
MU
TN
T (T
est N
' Tube)
0.0
40
.00
0-0
.032
-0.0
51
-0.025
-0.02
5-0
.041
-0.028
-0.03
8-0
.03
36
0.0
63
0.1
820.0
90
0.0
61
0.0
420.0
04
0.0
46
87
0.0
42
0.0
230.0
13
0.0
19
0.0
380.0
45
0.0
40
48
0.0
36
0.0
400.0
36
0.0
27
0.0
300.0
30
0.0
23
18
11
40.0
00
0.0
000.0
00
0.0
00
0.0
000.0
00
0.0
00
4
MU
TN
T (T
est N
' Tube)
0.0
50
.01
0.00
80.0
23
0.024
0.01
60.0
04
0.015
0.01
40
.01
5
MU
TN
T (T
est N
' Tube)
0.0
50
.01
0.01
10.0
08
0.011
0.00
40.0
06
0.005
0.00
30
.00
7
MU
TN
T (T
est N
' Tube)
0.0
5-0
.02
0.03
30.0
25
0.027
0.03
30.0
33
0.027
0.02
90
.03
0
MU
TN
T (T
est N
' Tube)
0.0
60
.02
0.01
70.0
14
0.010
0.01
20.0
15
0.015
0.01
60
.01
80.0
00
0.0
100.0
10
0.0
00
0.0
000.0
10
0.0
10
10
60.0
28
0.0
180.0
28
0.0
03
0.0
110.0
07
0.0
00
96
-0.0
09
-0.0
25-0
.021
-0.0
09
-0.0
11-0
.022
-0.0
19
72
0.0
22
0.0
160.0
08
0.0
12
0.0
180.0
18
0.0
20
4
MU
TN
T (T
est N
' Tube)
0.0
7-0
.01
0.04
40.0
23
0.022
0.03
10.0
40
0.008
0.02
40
.02
7
MU
TN
T (T
est N
' Tube)
0.0
70
.01
MU
TN
T (T
est N
' Tube)
0.0
9-0
.02
0.06
70
.06
7
PH
FIA
0.0
01
0.0
01
0.12
90.1
34
0.141
0.14
10.1
60
0.196
0.17
70
.15
55
0.0
05
-0.0
36-0
.039
-0.0
20
0.0
35-0
.027
0.0
04
47
0.0
09
0.0
120.0
09
0.0
13
0.0
070.0
08
0.0
10
6-0
.017
25
0.0
00
0.0
000.0
00
0.0
00
0.0
010.0
01
0.0
01
4
PH
FIA
0.0
1-0
.02
0.08
0-0
.053
-0.109
-0.11
7-0
.058
-0.054
-0.07
0-0
.05
79
0.0
06
-0.0
30-0
.036
-0.0
39
-0.0
17-0
.015
-0.0
21
4
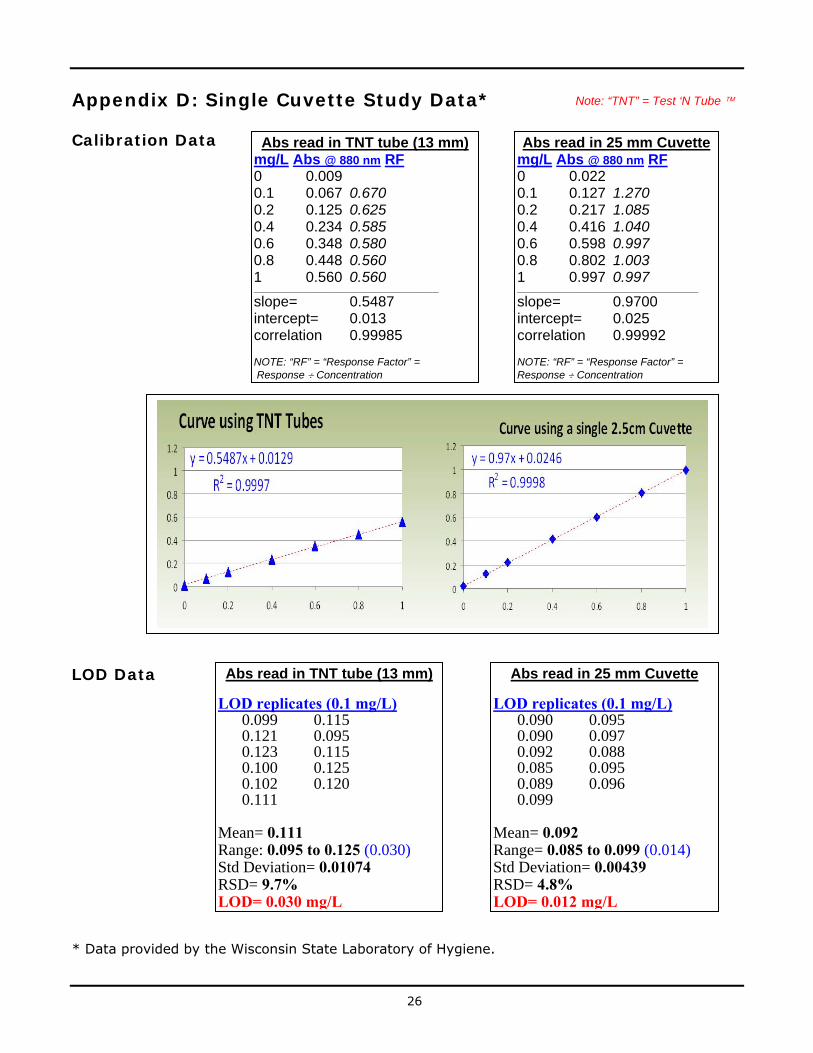
Appendix D: Single Cuvette Study Data* Note: “TNT” = Test ‘N Tube
Calibration Data
26
LOD Data
Abs read in TNT tube (13 mm) mg/L Abs @ 880 nm RF 0 0.009 0.1 0.067 0.670 0.2 0.125 0.625 0.4 0.234 0.585 0.6 0.348 0.580 0.8 0.448 0.560 1 0.560 0.560 __________________________________________________
slope= 0.5487 intercept= 0.013 correlation 0.99985 NOTE: “RF” = “Response Factor” = Response Concentration
Abs read in 25 mm Cuvettemg/L Abs @ 880 nm RF 0 0.022 0.1 0.127 1.270 0.2 0.217 1.085 0.4 0.416 1.040 0.6 0.598 0.997 0.8 0.802 1.003 1 0.997 0.997 _________________________________________________
slope= 0.9700 intercept= 0.025 correlation 0.99992 NOTE: “RF” = “Response Factor” = Response Concentration
Abs read in TNT tube (13 mm)
LOD replicates (0.1 mg/L) 0.099 0.115 0.121 0.095 0.123 0.115 0.100 0.125 0.102 0.120 0.111
Mean= 0.111 Range: 0.095 to 0.125 (0.030) Std Deviation= 0.01074 RSD= 9.7% LOD= 0.030 mg/L
Abs read in 25 mm Cuvette
LOD replicates (0.1 mg/L) 0.090 0.095 0.090 0.097 0.092 0.088 0.085 0.095 0.089 0.096 0.099
Mean= 0.092 Range= 0.085 to 0.099 (0.014) Std Deviation= 0.00439 RSD= 4.8% LOD= 0.012 mg/L
* Data provided by the Wisconsin State Laboratory of Hygiene.


Science Services Center for Excellence – providing expertise for science-based decision-making
We develop and deliver science-based information, technologies, and applications to help people make well-informed decisions about natural resource management, conservation, and environmental protection. Our Mission: The Bureau of Science Services works across agency divisions to support all Wisconsin Department of Natural Resources programs and their partners by: • conducting applied research and acquiring original knowledge. • analyzing new information and emerging technologies. • synthesizing information for policy and management decisions. • applying the scientific method to the solution of environmental and natural resources problems. • providing science-based support services for management programs department-wide. • collaborating with local, state, regional, and federal agencies and academic institutions in Wisconsin and around the world.
Related Documents