Evaluation of LiDAR data processing at the mobile network edge for connected vehicles Tiia Ojanperä 1* , Jukka Mäkelä 1 , Mikko Majanen 1 , Olli Mämmelä 1 , Ossi Martikainen 1 and Jani Väisänen 2 1 Introduction e current technological transformation, taking place in the automotive industry, in terms of vehicles getting more and more connected to each other and to the cloud, is foreseen to improve the safety and efficiency of roads. Digital services, offered to vehicle drivers in real time, with the purpose of preventing traffic accidents and avoiding casual- ties, are essential in realizing the benefits envisioned. Especially, accurate and focused road weather and road condition information plays a key role here, together with direct incident and control information. Furthermore, similar services will pave the way for full automation of vehicles in the future as they can help extending the electronic horizon of the vehicles beyond their own sensors. In advanced road weather and safety services, data from fixed roadside sen- sors combined with extensive observation data from vehicles are used to increase Abstract 5G mobile network technology together with edge computing will create new oppor- tunities for developing novel road safety services in order to better support connected and automated driving in challenging situations. This paper studies the feasibility and benefits of localized mobile network edge applications for supporting vehicles in diverse conditions. We study a particular scenario, where vehicle sensor data process- ing, required by road safety services, is installed into the mobile network edge in order to extend the electronic horizon of the sensors carried by other vehicles. Specifically, we focus on a LiDAR data-based obstacle warning case where vehicles receive obstacle warnings from the mobile network edge. The proposed solution is based on a generic system architecture. In this paper, we first evaluate different connectivity and comput- ing options associated with such a system using ns-3 simulations. Then, we introduce a proof-of-concept implementation of the LiDAR-based obstacle warning scenario together with first results from an experimental evaluation, conducted both in a real vehicle testbed environment and in a laboratory setting. As a result, we obtain first insights on the feasibility of the overall solution and further enhancements needed. Keywords: 5G, Automotive vertical, MEC, LiDAR, Experimental evaluation, Testbed, Simulations Open Access © The Author(s), 2021. Open Access This article is licensed under a Creative Commons Attribution 4.0 International License, which permits use, sharing, adaptation, distribution and reproduction in any medium or format, as long as you give appropriate credit to the original author(s) and the source, provide a link to the Creative Commons licence, and indicate if changes were made. The images or other third party material in this article are included in the article’s Creative Commons licence, unless indicated otherwise in a credit line to the mate- rial. If material is not included in the article’s Creative Commons licence and your intended use is not permitted by statutory regulation or exceeds the permitted use, you will need to obtain permission directly from the copyright holder. To view a copy of this licence, visit http:// creativecommons.org/licenses/by/4.0/. RESEARCH Ojanperä et al. J Wireless Com Network (2021) 2021:96 https://doi.org/10.1186/s13638-021-01975-7 *Correspondence: tiia.ojanpera@vtt.fi 1 VTT Technical Research Centre of Finland Ltd., Kaitoväylä 1, 90571 Oulu, Finland Full list of author information is available at the end of the article

Welcome message from author
This document is posted to help you gain knowledge. Please leave a comment to let me know what you think about it! Share it to your friends and learn new things together.
Transcript

Evaluation of LiDAR data processing at the mobile network edge for connected vehiclesTiia Ojanperä1*, Jukka Mäkelä1, Mikko Majanen1, Olli Mämmelä1, Ossi Martikainen1 and Jani Väisänen2
1 IntroductionThe current technological transformation, taking place in the automotive industry, in terms of vehicles getting more and more connected to each other and to the cloud, is foreseen to improve the safety and efficiency of roads. Digital services, offered to vehicle drivers in real time, with the purpose of preventing traffic accidents and avoiding casual-ties, are essential in realizing the benefits envisioned. Especially, accurate and focused road weather and road condition information plays a key role here, together with direct incident and control information. Furthermore, similar services will pave the way for full automation of vehicles in the future as they can help extending the electronic horizon of the vehicles beyond their own sensors.
In advanced road weather and safety services, data from fixed roadside sen-sors combined with extensive observation data from vehicles are used to increase
Abstract
5G mobile network technology together with edge computing will create new oppor-tunities for developing novel road safety services in order to better support connected and automated driving in challenging situations. This paper studies the feasibility and benefits of localized mobile network edge applications for supporting vehicles in diverse conditions. We study a particular scenario, where vehicle sensor data process-ing, required by road safety services, is installed into the mobile network edge in order to extend the electronic horizon of the sensors carried by other vehicles. Specifically, we focus on a LiDAR data-based obstacle warning case where vehicles receive obstacle warnings from the mobile network edge. The proposed solution is based on a generic system architecture. In this paper, we first evaluate different connectivity and comput-ing options associated with such a system using ns-3 simulations. Then, we introduce a proof-of-concept implementation of the LiDAR-based obstacle warning scenario together with first results from an experimental evaluation, conducted both in a real vehicle testbed environment and in a laboratory setting. As a result, we obtain first insights on the feasibility of the overall solution and further enhancements needed.
Keywords: 5G, Automotive vertical, MEC, LiDAR, Experimental evaluation, Testbed, Simulations
Open Access
© The Author(s), 2021. Open Access This article is licensed under a Creative Commons Attribution 4.0 International License, which permits use, sharing, adaptation, distribution and reproduction in any medium or format, as long as you give appropriate credit to the original author(s) and the source, provide a link to the Creative Commons licence, and indicate if changes were made. The images or other third party material in this article are included in the article’s Creative Commons licence, unless indicated otherwise in a credit line to the mate-rial. If material is not included in the article’s Creative Commons licence and your intended use is not permitted by statutory regulation or exceeds the permitted use, you will need to obtain permission directly from the copyright holder. To view a copy of this licence, visit http:// creat iveco mmons. org/ licen ses/ by/4. 0/.
RESEARCH
Ojanperä et al. J Wireless Com Network (2021) 2021:96 https://doi.org/10.1186/s13638-021-01975-7
*Correspondence: [email protected] 1 VTT Technical Research Centre of Finland Ltd., Kaitoväylä 1, 90571 Oulu, FinlandFull list of author information is available at the end of the article

Page 2 of 23Ojanperä et al. J Wireless Com Network (2021) 2021:96
the accuracy and coverage of the information and alerts produced [1]. So far, the lack of sufficient communication media has hindered the wide-scale adoption of such services, however. 5G together with edge computing (e.g., ETSI multi-access edge computing (MEC)) [2, 3] is expected to create new possibilities, particularly for the vehicular sensor and video data communication and processing, required by the advanced road weather and safety services. The increased transmission capac-ity, especially in the uplink direction, and lower latency of 5G will enable vehicular services to utilize and build intelligence upon data collected from vehicles traveling on the roads, in real time. The data in question can be produced by a variety of sen-sors and systems installed on the vehicles, including LiDARs, radars, cameras, and friction sensors [4]. In addition, MEC will enable bringing the data processing and cloud-based services physically closer to the vehicles, thus allowing offloading the burden of data processing from vehicles to the edge cloud, if needed, as well as col-laborative sensing using data from multiple vehicles.
In the future, cars will be close to the level of small-scale supercomputers when it comes to their data processing capabilities. Yet, having additional data processing capacity and algorithms running in the network entities, such as MEC servers, has its own incentives. Firstly, computing in vehicles always comes with a cost. Thus, we cannot assume that all vehicles (cf. non-premium models) will have limitless computing capacity to serve all applications even in the future. Secondly, a network-centered approach may be lucrative in some cases in the business perspective as well, thanks to easier software updates and better security and integrity. In such an approach, no other access to the vehicles themselves is needed besides the sensor data collection and feeding back the processed information and warnings. Finally, the approach allows collecting and fusing data from multiple vehicles and using the same data for the purposes of different applications running in the edge.
This paper presents an initial study on the practical feasibility of a 5G-inspired MEC application in providing real-time warnings based on vehicle observations. We focus on the case of LiDAR-based obstacle detection and describe the overall sce-nario, architecture and proof-of-concept implementation of the solution. The pro-totype is evaluated both in a real vehicular environment and in a laboratory setting. This paper is partly based on the results presented in the paper [5], yet extended with additional details and findings from a simulation study. As a result, we obtain both simulated and practical experiences from using a MEC application to generate road condition warnings based on vehicle observations. We also identify places for future enhancements in order to make the overall concept a reality.
The rest of the paper is organized as follows: Section 2 summarizes the research methods used in the paper. Section 3 gives an overview of the related work. Sec-tion 4 introduces our proposed system architecture and scenario. Section 5 presents the simulation study and analysis of the results. Sections 6 and 7 describe the proof-of-concept implementation of the LiDAR-based obstacle warning scenario and the experimental results obtained using the prototype, respectively. Finally, Sects. 8 and 9 provide the discussion and conclusions of the paper as well as an outlook for future work.

Page 3 of 23Ojanperä et al. J Wireless Com Network (2021) 2021:96
2 MethodsThis paper presents both simulated and experimental results obtained in the context of the 5G-inspired road safety use cases and the corresponding system architecture, con-sidered in the paper. The simulation study is conducted using ns-3—the discrete-event network simulator for Internet systems. The experimental results are produced in a real field testing environment, including vehicles, vehicular sensors and a 5G test network, and using a proof-of-concept implementation of a 5G-assisted automated driving sce-nario. The experimental results are also reproduced in a more controlled laboratory setting for comparison. Due to the differences in the communication technologies and capabilities supported by the simulator and testbed environments, the results are pre-sented separately for each in their corresponding sections.
3 Related workIntelligent transport systems (ITSs) and underlying vehicle-to-vehicle (V2V) and vehi-cle-to-infrastructure (V2I) communication have traditionally been implemented using wireless local area network connectivity, based on the IEEE 802.11p standard [6]. IEEE 802.11p WAVE/DSRC is the standard used in US for V2V communication, and ITS-G5 is the European version. They are both based on the 802.11p, but they have differences on the upper MAC layer and above. A major drawback of 802.11p-based systems is the cost of the roadside infrastructure, required by the V2I services, which has severely lim-ited the adoption of the technology. Recently, the adoption of DSCR has faced further challenges in the US due to FCC’s decision to reallocate the spectrum reserved for DSRC to other uses in November 2020. Nevertheless, Europe continues to promote a hybrid approach supporting ITS-G5.
For vehicle-to-network (V2N) communication, 3GPP-standardized 5G technology [2] offers a complementary solution to 802.11p without the need for a dedicated network infrastructure for automotive vertical services. Instead, it is envisioned that even critical services can be delivered through a public or shared 5G network infrastructure, thanks to emerging capabilities such as network slicing. Furthermore, 5G will enable novel ITS services requiring a higher bandwidth for data transmission and more flexibility in the delivered content than what is offered by 802.11p and the associated US and European ITS standards.
For V2V and V2I, 3GPP’s cellular V2X (C-V2X) communication facilitates direct com-munication between vehicles and roadside infrastructure, thus offering an alternative solution to 802.11p. LTE device-to-device (D2D), also referred to as sidelink (SL), was introduced in the LTE Release 12. It has two modes: in Mode 1 the eNB manages the direct communication scheduling between UEs, while in Mode 2 the UEs manage the scheduling independently from the eNB. Thus, in Mode 2 the UEs do not need to be in the coverage area of any eNB, which makes this mode more suitable for vehicular safety applications. In LTE Release 14, additional modes for D2D communication were speci-fied, especially for vehicular scenarios. Like Mode 1, also Mode 3 is based on eNB for managing the V2V communication, while Mode 4 is similar to Mode 2 and does not depend on the eNB. Thus, the Mode 4 should be the best solution for vehicular scenarios requiring direct V2V communication. The difference between Modes 1 & 2 and Modes

Page 4 of 23Ojanperä et al. J Wireless Com Network (2021) 2021:96
3 & 4 is that Modes 1 & 2 were designed with battery consumption as a priority, while Modes 3 & 4 were designed especially for V2V communication with latency, reliability and scalability in mind. Release 16 specifies the 5G NR-based sidelink communication for V2X. The upcoming Release 17 in 2022 will include enhancements to the 5G NR-V2X communication, e.g., sidelink relay and discontinuous reception mode.
The emergence of 5G and Internet of Things (IoT) type of communications has risen the interest towards edge computing and solutions such as MEC [3, 7]. In the MEC paradigm, mobile computing, network control and storage are pushed to the edge of networks, that is, close to the access points. By doing so, MEC can enable compu-tation-intensive and latency-critical applications at mobile devices, which are typically resource-limited. In many scenarios, MEC is seen as a point for hosting applications, but it may provide also computing resources for AI-guided network and radio resource management, for example for radio access technology (RAT) selection for vehicular communication [8]. For 5G automotive vertical services, MEC is also a key enabler for low-latency communications and distributed sensor data collection and processing.
Regarding MEC and automated driving, a few research papers are available in the lit-erature [9–12]. Ogawa et al. reported field experiments with sensor data transmission over the 5G network [13]. Industry trials have also taken place to evaluate the capabili-ties of cellular technology to enable low-latency car connectivity [14]. To the best of our knowledge, this paper is the one of the first works detailing the feasibility and benefits of localized MEC applications both in a real vehicle testbed environment and in a labora-tory setting.
For sensor and IoT data communication, a number of different protocols and solu-tions exist. In this work, we consider Apache Kafka [15] and Message Queuing Teleme-try Transport (MQTT) [16] protocols. Both are lightweight publish-subscribe messaging transport protocols that function on top of TCP/IP. By using TCP/IP-based protocols, we are able to avoid any problems related to the network firewalls and Network Address Translation (NAT) in the used test networks. Performance-wise, a UDP-based solution, such as Constrained Application Protocol (CoAP) [17], may be better as indicated by our earlier study [1], but adding support for it in the test networks is left for future work.
4 Scenario for 5G‑assisted automated drivingIn our prior work, we have proposed a generic system architecture for 5G-enabled road safety services [1]. The architecture is based on three use cases, namely Use Case 1: “Local focused road weather and safety services”, Use Case 2: “Road safety improvement through real-time vehicular video and LiDAR data”, and Use Case 3: “Ultra-low delay services for autonomous driving”. The use cases were chosen so that they encompass a variety of road safety services that utilize real-time sensor and video data transmitted from a vehicle to another or from a vehicle to MEC/cloud. For the road weather ser-vices, a roadside infrastructure of weather stations is considered as a additional source of information to the vehicle observations. In this paper, we focus on Use Case 3 and the 5G-assisted automated driving scenario outlined in this section. For a detailed design of the services associated with the other use cases as well as experimental results, an inter-ested reader is referred to [18].

Page 5 of 23Ojanperä et al. J Wireless Com Network (2021) 2021:96
The ultimate purpose of Use Case 3 is to study and demonstrate how low latency or safety-critical control information can be used for improving the safety of automated driving. The information may include various alerts, such as emergency breaking, chal-lenging weather or obstacles, and other information for vehicle control and route plan-ning, such as dynamic maps with road and traffic status data, for example. In the scope of this paper, we focus on a scenario, aiming to demonstrate the feasibility and benefits of 5G and localized MEC applications in supporting automated driving in diverse condi-tions. We consider a MEC application that uses real-time sensor data from vehicles, pro-cesses it with intelligent algorithms, and generates warnings about the road or weather conditions. That is, the vehicle sensor data processing is installed into the network edge in our approach.
In specific, we use vehicle-generated LiDAR data for detecting obstacles on the road. The detailed scenario considered in this paper includes the following steps:
1. Two vehicles are traveling on a road and they are connected to a MEC server over wireless connection. The leading vehicle, referred to as a LiDAR publisher vehicle in this paper, is equipped with a LiDAR sensor, and it is sending a stream of LiDAR data to a MEC server.
2. The MEC server hosts an obstacle detection algorithm that generates warnings based on the LiDAR data collected from vehicles traveling in the area.
3. When an obstacle is detected, the algorithm issues a warning message about the obstacle on the road. The warning is sent to vehicles traveling in the area.
4. An automated vehicle, traveling behind the LiDAR publisher vehicle, receives the warning and acts accordingly (e.g., goes around the obstacle or brakes).
Figure 1 illustrates a sequence diagram of the communications between the two vehicles and MEC server in the scenario. The LiDAR publisher vehicle sends LiDAR data to the MEC server. These data are processed in the MEC server, and if an obstacle is found, a warning message is sent to the automated vehicle.
In this paper, we focus on two types of obstacles that can be detected with LiDAR, namely (1) a physical obstacle on the road (e.g., a human, animal or large debris) that may cause a collision or (2) a hard ridge of snow formed on the road’s surface, hindering
Fig. 1 Data flow between the communicating entities in the scenario

Page 6 of 23Ojanperä et al. J Wireless Com Network (2021) 2021:96
driving and safety, but not blocking the road. Other types of sensor data (e.g., vehicle camera, friction sensors, CAN bus data), sensor fusion and algorithms can be incorpo-rated as well in order to detect more diverse conditions such as potholes or road weather. However, such extensions are left for future work.
5 Simulation study and resultsBefore going into the details of the practical proof-of-concept implementation of our 5G-assisted automated driving scenario, this section first presents more generic find-ings related to V2X communication. The results were obtained using ns-3 simulations, and the aim of the simulation study was to gain insights on the impact of the placement of the services and used communication medium to advanced road weather and safety services in the system architecture. The main motivation for the approach is that simu-lations allow us to test the feasibility of technologies that are not yet available in test-beds. For example, this was the case for LTE V2V at the time of building the prototypes and conducting experiments for this paper. In addition, simulations offer possibilities for testing vehicular communication technologies and solutions in a larger scale than what is possible with test networks and vehicles.
In the remainder of this section, we briefly summarize the simulation scenarios and results obtained. For the purposes of this paper, we selected three key emerging net-working topics to be studied in V2X communication scenarios, namely
1. Multi-Access Edge Computing (MEC) server versus Cloud Computing server2. 5G mmWave spectrum versus 4G LTE radio3. LTE V2V versus IEEE 802.11p communication.
In the first case, the end-to-end delay from an UE to the application server was studied. The application server was located either on the remote server in the cloud, connected with a 100-Gbps point-to-point link with 10-ms delay to the packet gateway (PGW) node, or on a MEC server co-located with the eNB. The traffic generated on the UE was constant bit rate UDP traffic, with 10-ms packet interval and 1054 bytes packet size. UE used 4G LTE for the communication. With MEC, the end-to-end delay was 12 ms. With remote server in the cloud, the delay was 22 ms. Since the delay between the eNB and PGW was modeled as 0 ms, the result matches to the point-to-point link delay from PGW to the cloud. We made the same test with using 5G mmWave instead of 4G LTE. With 5G mmWave, the delay from UE to the MEC decreased to less than 0.5 ms. So, with MEC, the delay caused by the links from the PGW to the destination node can be cut off. Furthermore, 5G mmWave communication technology reduces the delay between UE and eNB. Using both MEC and 5G mmWave instead of remote server in the cloud and 4G LTE, the end-to-end delay can be reduced even 97.5%. The developed ns-3 MEC model was released for the public, and it is available in [19].
5G mmWave decreases the delay, but it can also provide much more bandwidth, which is essential for transmitting, for example, LiDAR or video data. As an example, we sim-ulated a scenario with many types of vehicular data: LiDAR, video, CAM and DENM messages. The LiDAR data simulated Velodyne HDL-64 LiDAR with packet size of 1206 bytes with 5200 packets/s. The video data packet size was 1400 bytes with 714 packets/s.

Page 7 of 23Ojanperä et al. J Wireless Com Network (2021) 2021:96
CAM message size was 250 bytes with 10 packets/s. All these data were sent by each UE to the MEC server. DENM message size was 800 bytes, and it was sent by the MEC server to the every UE once per second. Figure 2 represents the average delay for the above-mentioned data packets as a function of number of UEs. The UEs were station-ary in a row formation with 10 m distance from each other. All the UEs were also close enough to the eNB so that there were no packet loss due to the too weak signal strength. (Friis free space propagation model was used.) As can be seen from the figure, the delay remains well below 1 ms (roughly between 0.3 and 0.6 ms) with less than 40 UEs. With more than 40 UEs, the delay increases more rapidly, being over 514 ms with 45 UEs, for example. Figure 3 shows the packet loss as a function of number of UEs. With 40 UEs or less, the packet loss was constant 0.07% because of some packets lost in the buffer over-flow in the very beginning of the simulation when the communication links were set up. With more than 40 UEs, the packet loss increases. For 4G LTE, the amount of data was way too much even with a single UE. The packet loss even with only one UE was 69%.
We also simulated the same scenario with other propagation and channel mod-els. With 3GPP propagation loss and channel models (provided by the ns-3 mmWave model), the delay and packet loss started to increase already with more than 20 UEs, as depicted in Figs. 4 and 5, respectively. In the 3GPP propagation loss model, some UEs
Fig. 2 Average delay from UE to MEC as a function of number of UEs
Fig. 3 Packet loss in 5G mmWave with Friis propagation model

Page 8 of 23Ojanperä et al. J Wireless Com Network (2021) 2021:96
had line of sight (LOS) to the eNB, while others did not, which had effects on the recep-tion of the packets.
We also added some buildings on both sides of the UE queue, that is, to model a street with buildings on both side of the street. In this case, the propagation loss model was set to 3GPP buildings propagation loss model, also provided by the ns-3 mmWave model. The same 3GPP channel model was used as in the previous simulation. If the eNB was set inside a building, the signal strength was very weak and only the closest UEs were able to communicate. With 1 UE, the delay was 1.34 ms and packet loss 0.07%. With 5 UEs, the delay was already 585 ms and packet loss 9.29%. However, if the eNB was located on top of the building, the performance was pretty much the same as with the Friis free space propagation model, as depicted in Figs. 6 and 7. The delay increases rap-idly with more than 40 UEs, so the real-time communication delay limits of 50 ms or 100 ms are exceeded soon after 40 UEs.
In case 3, we studied the delay and packet delivery rate in IEEE 802.11p WAVE/DSRC and LTE D2D mode 2 networks. The ns-3 simulator supports only WAVE/DSRC ver-sion and LTE D2D Modes 1 and 2 [20]. Recently, support for Modes 3 and 4 was imple-mented [21], but unfortunately the model is not publicly available. An analytical model for performance evaluation of Mode 4 has also been developed in [22].
Fig. 4 Delay when 3GPP propagation loss and channel models were used
Fig. 5 Packet loss with 3GPP propagation loss and channel models

Page 9 of 23Ojanperä et al. J Wireless Com Network (2021) 2021:96
Figures 8, 9, 10, 11, 12 and 13 represent the delay and packet delivery ratio (PDR) with different sizes of CAM messages that are sent by each node every 100 ms. The nodes were aligned in the queue formation 10 m apart from each other, just like in the previous simulation cases. As can be seen, the average delay is much smaller with 802.11p WAVE/DSRC than with LTE D2D. WAVE/DSRC delay is mainly between 0.5 and 3.5 ms depending on the CAM message size and number of nodes. Also, PDR is nearly 100%. The small drop with 15 nodes and greater drop with 20 nodes are due to the communication range. The coverage radius with the used simulation settings was about 150 m, i.e., the th node was on the edge of the coverage area of the first node, and 20th node was already out of coverage of the first 1 to 5 nodes in the queue. The physical mode used in 802.11p was OFDM with 6 Mbps data rate and 10 MHz bandwidth. LTE D2D Mode 2 did not suffer from the signal strength-related issues. However, it performed worse than WAVE/DRSC due to the smaller bandwidth. (Only two resource blocks were used.) LTE D2D reached the most stringent delay limit of 50 ms for real-time communication only with the smallest CAM message size of 100 bytes and with less than 10 UEs. With CAM message size of 800 bytes, it did not even reach the 100-ms delay limit (without optimizing some parameters). Also, with 10 UEs or more, it did not reach the most stringent PDR limit of 95% with any size of
Fig. 6 Delay with 3GPP buildings propagation and channel models, eNB on top of a building
Fig. 7 Packet loss with 3GPP buildings propagation and channel models, eNB on top of a building
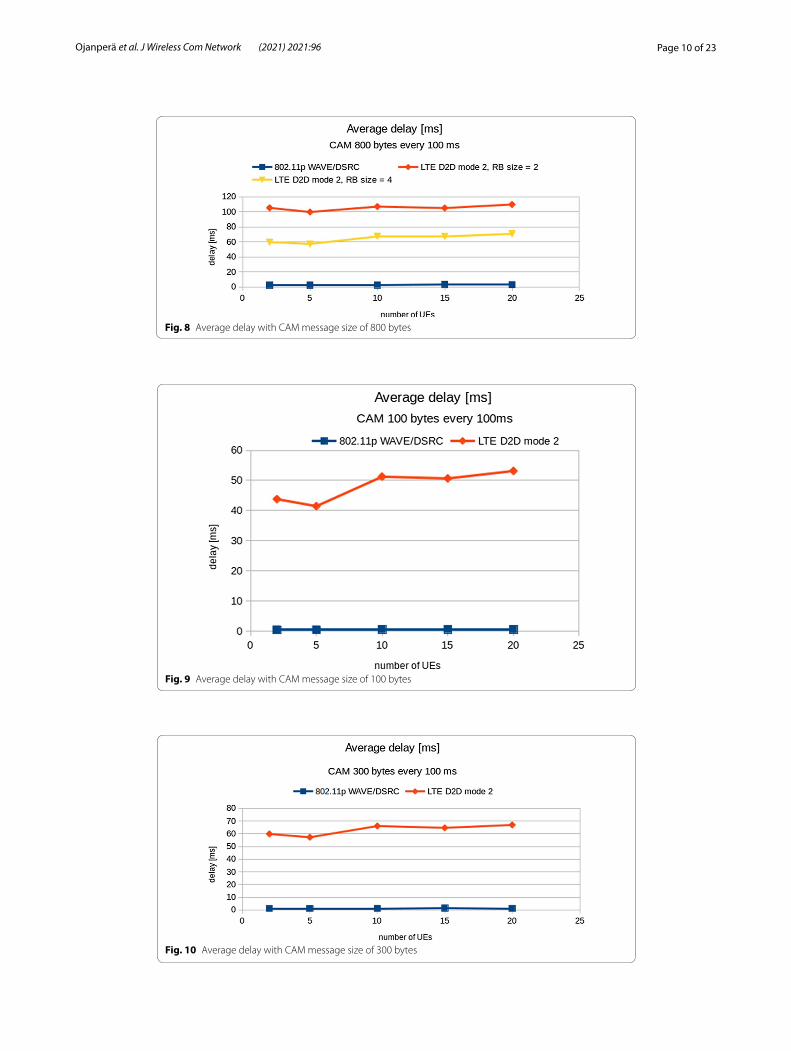
Page 10 of 23Ojanperä et al. J Wireless Com Network (2021) 2021:96
Fig. 8 Average delay with CAM message size of 800 bytes
Fig. 9 Average delay with CAM message size of 100 bytes
Fig. 10 Average delay with CAM message size of 300 bytes

Page 11 of 23Ojanperä et al. J Wireless Com Network (2021) 2021:96
CAM messages. The reasons for poor performance are the smaller amount of band-width and the way the sidelink resources are scheduled. There are also several con-figurable parameters that affect on the performance, and they form over 150 possible
Fig. 11 PDR with CAM message size of 100 bytes
Fig. 12 PDR with CAM message size of 300 bytes
Fig. 13 PDR with CAM message size of 800 bytes

Page 12 of 23Ojanperä et al. J Wireless Com Network (2021) 2021:96
combinations [23]. It is hard to find the optimal configuration to the current situation. Furthermore, none of the combinations achieves a global optimum [23]. An example is seen in Figs. 8 and 13, when the delay for the increased CAM packet size exceeded 100 ms and PDR was below 40% with 20 UEs, but with a small change in resource block (RB) size parameter decreased the delay to 60–70 ms and kept the PDR in over 80% even with 20 UEs.
The LTE D2D communication is based on two physical channels: physical sidelink shared channel (PSSCH) and physical sidelink control channel (PSCCH). PSSCH car-ries the user plane data, while the PSCCH carries sidelink information (SCI) messages that are used to detect and decode the PSSCH at the receiving device. Each channel uses a combination of resource blocks (RB) in the frequency domain and a set of sub-frames in the time domain. The PSCCH periods in the time domain are repeated peri-odically. The device selects the PSCCH/PSSCH resources by itself in Mode 2 from the subframe pool containing all available subframes. The PSCCH channel is defined by a PSCCH subframe bitmap. The PSSCH subframes are defined in time repetition pat-tern (TRP) bitmap that is included in the SCI message. Each PSCCH transmission is sent twice in different RBs within the same period. If both of these transmissions over-lap with another device’s PSCCH transmission, neither of them can be received by any devices, which causes delay in the communication since the corresponding PSSCH data transmission cannot be received then either. Colliding or interfering PSSCH transmis-sions may also reduce the system performance, but they can possibly be solved by hybrid automatic repeat request (HARQ) process, i.e., each message transmission is repeated n times. Thus, the dimensioning of the resource pools has a significant impact on the performance. NIST has developed an analytical model to determine the best configura-tion to obtain a target performance level while minimizing the resource pool size [24]. However, it only optimizes the PSCCH. PSSCH optimization is still needed to maximize the sidelink throughput. Since the 802.11p WAVE/DSRC performance was limited only by the coverage area, we ran another test with nodes closer to each other to see how many nodes can be supported within the coverage area so that the delay stays less than 50 ms and PDR greater than or equal to 95%. We used a CAM message size of 100 bytes. As shown in Figs. 14 and 15, the PDR drops below 95% with more than 130 nodes, while the delay keeps well below 50 ms with even 250 nodes (PDR has dropped to 60% then, however).
Fig. 14 Average delay in 802.11p WAVE/DSRC when all nodes in the coverage area

Page 13 of 23Ojanperä et al. J Wireless Com Network (2021) 2021:96
6 Proof‑of‑concept implementationIn addition to simulations, it is important to obtain practical experiences of implement-ing advanced road safety service concepts using actual test networks and vehicles. For this, we implemented a proof of concept of the 5G-assisted automated driving scenario that is introduced in Sect. 4. This section describes the proof-of-concept implementa-tion, which was used in an experimental evaluation for achieving first results and more realistic view of the defined system.
6.1 Overall system design
Our proof-of-concept implementation follows the architectural design and publish/subscribe type of a communication framework originally defined in the paper [1]. The architecture and modular design of the communication framework offer a flexible way of adding and removing software modules depending on the service and test case require-ments without a need for redesign or major re-implementation. Consequently, we were able to integrate an existing algorithm implementation into the communication frame-work for an initial prototype experimentation.
The main design of the prototype is shown in Fig. 16. The obstacle detection algo-rithm is an application running in the MEC server that can, in general, send warnings to nearby vehicles about obstacles on the road. The algorithm is running in the MEC server as a Docker container. A vehicle equipped with LiDAR measurement tool is sending LiDAR data via TCP to an Apache Kafka information broker located in the MEC server. The algorithm serves as an Apache Kafka subscriber for the LiDAR data, which is sent in point cloud data (PCD) format. Once the algorithm detects an obstacle, it sends a warn-ing message via the MQTT interface to an MQTT broker located in the MEC server. The automated vehicle subscribes to the topic related to the warning and receives the mes-sage. The warning message generated by the algorithm gives information on the current time, GPS longitude, GPS latitude, type of warning, and level of warning. The warning message has the following format as string type:
• Epoch time;GPS latitude;GPS longitude;type;level
Fig. 15 PDR in 802.11p WAVE/DSRC when all nodes in the coverage area

Page 14 of 23Ojanperä et al. J Wireless Com Network (2021) 2021:96
where type is the type of obstacle: either a hard ridge of snow on the road or a physical obstacle. Level is a float value from 0 to 3, and it informs how large the obstacle is. The higher the value, the larger the obstacle. For implementing the information brokers, we chose Mosquitto [25] as the MQTT broker, while for Apache Kafka, the Confluent soft-ware [15] was used.
6.2 LiDAR data generation and processing components
In this work, we used a Velodyne VLP-16 sensor. One of its important features is a 360◦ - horizontal field of view, which provides a full view of the surrounding scene. However, its vertical resolution is notably coarser. The Velodyne VLP-16 can only obtain readings from 16 lines, vertically distributed within range from − 15
◦ to 15◦.
6.2.1 Algorithms
Main processing flow of the software should detect, count and classify vehicles observed by the LiDAR sensor. We developed a multilayered processing pipeline, where input comes from the raw sensor readings and in the output vehicle crossing events are recorded and reported. This pipeline can be roughly divided into the following stages: pre-filtering (outlier removal), clusterization (object detection), cluster tracking and cluster classification.
6.2.2 Pre‑filtering
As the raw point cloud from the LiDAR sensor usually contains only a small fraction of useful points, some filtering technique should be applied to remove unwanted and irrel-evant data points. In this work, we removed points from the back of the LiDAR sensor and ground points.
Fig. 16 The communication framework and components of the prototype
Page 15 of 23Ojanperä et al. J Wireless Com Network (2021) 2021:96
6.2.3 Clusterization
For the clusterization step, we have implemented hierarchical clustering algorithm, cal-culated on top of the Minimum Spanning Tree (MST) [26, 27], which is constructed from the filtered point cloud. One of the main algorithmic parameters for MST structure is the maximum length of the edge between two points. Based on that parameter, all pos-sible edges between all points in the remaining point cloud are created. Edges are then sorted in ascending order and added to the tree structure with the greedy algorithm, which starts from the smallest edge and adds next smallest one after another avoiding those edges. This causes loops in the generated structure.
6.2.4 Static background removal
Another important aspect is the presence of multiple static elements in the real-time scene. These could be traffic signs and traffic lights, pavements, and the road itself. Each such element can reflect some of the LiDAR points, which are meaningless for obstacle detection.
6.2.5 Cluster tracking
As each LiDAR scan represents real-time situation at one moment in time, their auto-matic clusterization will usually end up into variable number of clusters, returned with completely irrelevant order each time. Robust tracking of corresponding clusters within the recording timeline is necessary to obtain correctly detected object.
6.2.6 Cluster dissimilarity measurement
Each cluster can be, for example, described with its centroid point. Dissimilarity between clusters of different scans can be simply taken as Euclidean distance between consecutive centroids.
6.3 Automated vehicle components and controls
In the field test experiments, we used VTT’s automated vehicle “Martti” [4] as the test vehicle. For testing, “Martti” is set to drive autonomously using a combination of its own sensors and the warning data it receives from the MEC server. In addition, “Mar-tti” is programmed with a local map of the test site. The local map is used in the route planning of the vehicle.
The vehicle control system consists of three components. A vehicle controller com-ponent handles the actuators based on instructions it is given. The instructions come from a route planner component that calculates the fastest route to the destination given by the user. The route planner also receives warning data from the third compo-nent, a MQTT obstacle data subscriber. This information is used to either slow down the speed of the vehicle or to calculate a completely new route to the destination.
The vehicle’s internal communication is handled by an OpenDDS messaging plat-form. It provides a flexible way of adding software components to the vehicle with-out affecting former software. We added a new wrapper to the system that converts the warning data from the MEC server to OpenDDS form that the vehicle’s other software components know how to utilize it. The route planner software was also

Page 16 of 23Ojanperä et al. J Wireless Com Network (2021) 2021:96
redesigned so that it can do recalculations based on the restrictions given by the MEC server. The complete internal data stream from the MEC server to the vehicle actua-tors is depicted in Fig. 17.
Although the obstacle data can be evaluated in the vehicle, the main driving deci-sions must be made by the vehicle’s internal processing system, e.g., the route planner. This is because all measurements, whether they come from the vehicle itself or from the MEC server can contain errors. If for some reason the vehicle interprets its posi-tion incorrectly, all data received from the MEC server are positioned incorrectly in the vehicle’s internal map. If driving decisions are based on the incorrect local map, the warning system could increase risks instead of reducing them. In this case, the warnings received from the MEC server are used to increase caution in the warn-ing area or to choose an alternative route. In the future, the vehicles exchanging data could position each other in their own local maps. This would increase the accuracy of warning positions and make the warnings valid for more rapid driving decisions. GPS precision is very important regarding our proposed concept. If GPS precision is deteriorated, the accuracy of the obstacle data coming from the MEC server also declines. It would be beneficial to offer more precise location data for occasions where very high location data precision is required.
7 Experimental evaluation and resultsThe 5G-assisted automated driving prototype was tested in two different environments, namely in a real LTE-A network with outdoor coverage and in an indoor laboratory environment. This section summarizes the test setups and results obtained.
Fig. 17 Communication of the obstacle detection data inside the automated vehicle

Page 17 of 23Ojanperä et al. J Wireless Com Network (2021) 2021:96
7.1 Field test
We conducted an experimental evaluation in a winter vehicle test track located in Sodankylä, Finland. More information, including a map of the test track, can be found from [28]. We used two vehicles in the field test, one equipped with LiDAR sensor capa-bility and acting as the LiDAR publisher vehicle, and the second one a real automated car “Martti” [4]. Both vehicles were connected to the 5G test network (5GTN) [29] via a LTE-A connection. The MEC server was hosted by the 5GTN service core where MEC is realized by following the ETSI distributed EPC approach where MEC is located in the same network as the LTE EPC entities. The MEC server specifications can be found in Table 1.
With the help of the 5GTN operator, we were able to reserve all LTE radio resources and dedicated network resources. This ensured that there were no other users interfer-ing in the network during the tests. In the field test, we executed network delay measure-ments by the use of tcpdump, and for analyzing the results, we used the simple tcptrace application.
The main metrics considered in the tests were the round-trip time (RTT) between the LiDAR publisher vehicle and MEC server and RTT between the MEC server and auto-mated vehicle. Figure 18 depicts the measurement scenario for the first test case. The tcptrace application provides RTT values for route A1→A2→A3. This route includes sending packets from the MEC server to the LiDAR publisher vehicle (A1), packet
Table 1 MEC server and client laptop specifications
MEC server Client laptop
Model Dell PowerEdge R510 HP ZBook
Processor 2 * Intel Xeon E5606 1 * Intel i7-4700MQ
Cores (threads) 4(4) @ 2.13 GHz 4(8) @ 2.4 GHz
Memory 16 GB 8 GB
Operating system Ubuntu 16.04 Ubuntu 16.04
Fig. 18 RTT measurement scenario 1 between the LiDAR publisher vehicle and MEC server
Table 2 RTT measurement results between LiDAR publisher vehicle and MEC server
Parameter A1→A2→A3
RTT samples 32 098
RTT min 19.3 ms
RTT max 487.8 ms
RTT avg 60.0 ms
RTT stdev 16.9 ms

Page 18 of 23Ojanperä et al. J Wireless Com Network (2021) 2021:96
processing at the LiDAR publisher vehicle (A2), and sending packets from the LiDAR publisher vehicle to the MEC server (A3).
In Table 2, we can see the results from the experiments. A1→A2→ A3 is the RTT from the MEC server to the LiDAR publisher vehicle. The minimum RTT is 19.3 ms, maxi-mum 487.8 ms and the average value is 60.0 ms. To estimate the network delay between the LiDAR publisher vehicle and the MEC server, the RTT values for A1→A2→ A3 can be divided by two. However, we do not know the processing time A2, but it is assumed to negligible, since the MEC server is only sending ACK messages that have a very low processing time. A reasonable assumption is that the network delay is between 9.65 and 243.9 ms.
Figure 19 depicts the measurement scenario between the MEC server and the auto-mated vehicle. Similar to the previous scenario, A1→A2→ A3 is the RTT from the MEC server to the automated vehicle. The results for the aforementioned scenario are shown in Table 3. RTT between the MEC server and the automated vehicle is at minimum 21.0 ms, maximum 83.0 ms and on average 50.7 ms. As in the first scenario, the packet processing delay at the automated vehicle (A2) is not known. We can, however, reason-ably assume that the network delay between the MEC server and the automated vehicle is between 10.5 and 41.5 ms.
7.2 Laboratory test
We also conducted test setup in a laboratory environment, as illustrated in Fig. 20. Test setup was realized with the same 5GTN operator, and it used the same MEC resources as in outdoor field tests. In the laboratory test, we got similar dedicated resources for LTE radio connectivity as in the outdoor test to ensure a stable test environment. The test consisted of a MEC server and two client laptops. One client served as a LiDAR publisher and the other as a warning message subscriber that mod-els an automated vehicle. The specifications of the laptops and the MEC server can
Fig. 19 RTT measurement scenario 2 between MEC server and automated vehicle
Table 3 RTT measurement results between MEC server and automated vehicle
Parameter A1→ A2→ A3
RTT samples 1754
RTT min 21.0 ms
RTT max 83.0 ms
RTT avg 50.7 ms
RTT stdev 12.4 ms

Page 19 of 23Ojanperä et al. J Wireless Com Network (2021) 2021:96
be found in Table 1. The clients were connected to the 5GTN [29] via LTE-A using a broadband USB stick. The MEC server was located in the same network as the LTE evolved packet and service core (EPC). In the laboratory tests, we considered the same metrics as in the pilot scenario, the RTT between the LiDAR publisher and the MEC server and the RTT between the MEC server and the warning message sub-scriber. We also took into account the delay for sending the LiDAR data as an PCD file and the obstacle detection algorithm processing time. We executed twenty runs with each run lasting approximately one minute.
Fig. 20 The testbed used for the laboratory measurements
Table 4 Summary of the RTT measurement results between LiDAR publisher and MEC server
Parameter Value
RTT samples 705 939
RTT minimum 14 ms
RTT maximum 241 ms
RTT average 45.6 ms
RTT standard deviation 20.1 ms
Table 5 Summary of the RTT measurement results between MEC server and warning message subscriber
Parameter Value
RTT samples 3130
RTT minimum 12 ms
RTT maximum 111 ms
RTT average 47.5 ms
RTT standard deviation 20.5 ms

Page 20 of 23Ojanperä et al. J Wireless Com Network (2021) 2021:96
Table 4 shows the summary of the RTT measurement results between the LiDAR publisher and the MEC server. The results are similar to the ones obtained from the pilot scenario. The RTT is on average 45.6 ms, and the maximum and minimum val-ues are 241 ms and 14 ms, respectively. There is a lot of variation on the results as the minimum and maximum values are far away from each other.
A summary of the RTT results between MEC server and warning message sub-scriber is presented in Table 5. The minimum value is 12 ms, the maximum value is 111 ms and the RTT is on average 47.5 ms. The PCD file delay measurement results between LiDAR publisher and MEC server are summarized in Table 6. The results show that there is a very large variation with the PCD file delay. The delay is at mini-mum 78.3 ms, at maximum 2.98 s and on average 245.9 ms.
The obstacle detection algorithm processing delay measurements are summarized in Table 7. The processing delay was on average 544.6 ms, at maximum 913.6 ms and at minimum 80.6 ms. Table 8 presents the throughput by the LiDAR publisher to the MEC server. The table shows that when the data processing is done at the MEC, there needs to be a lot of data for the application to generate warnings or actions.
The approximate delay when an obstacle is detected and when the warning message subscriber receives the warning is generally a sum of the PCD file delay, the algorithm
Table 6 Summary of the PCD file delay measurement results between LiDAR publisher and MEC server
Parameter Value
Samples 4871
Minimum 78.3 ms
Maximum 2.98 s
Average 245.9 ms
Standard deviation 264.6 ms
Table 7 Summary of the obstacle detection algorithm processing delay measurements
Parameter Value
Samples 38
Minimum 80.6 ms
Maximum 913.6 ms
Average 544.6 ms
Standard deviation 219.5 ms
Table 8 Throughput by the LiDAR publisher per experiment
Parameter Value
Samples 20
Minimum 8 869 624 bps
Maximum 19 179 912 bps
Average 16 428 317.2 bps
Standard deviation 2 507 078.506 bps

Page 21 of 23Ojanperä et al. J Wireless Com Network (2021) 2021:96
processing delay and the network delay between the MEC server and the warning mes-sage subscriber. Taking into account the average values in each measurement, the total delay is approximately 245.9 ms + 544.6 ms + 23.75 ms = 814.25 ms on average, which is close to 1 second. However, as the maximum values for all metrics indicate, the total delay can reach several seconds. The most significant metrics for the total delay are the PCD file delay and the algorithm processing delay. Regarding the radio link, the targeted latency of 5G is approximately 1 ms, indicating a roughly 30–50 ms reduction compared to LTE [30]. We could reduce the amount of data transmitted to the network by process-ing the data at the connected vehicle and sending warning messages to the MEC that could distribute them to nearby vehicles. Consequently, real-time MEC applications for connected vehicles require the use of 5G networks and efficient hardware in the MEC server as the applications require very low latency, such as 10 ms [30].
8 DiscussionThe simulation studies showed the possibility to decrease the end-to-end delay from UE to remote server in the cloud by using MEC. Also, 5G mmWave decreases the delay significantly compared to 4G LTE. In addition, 5G provides larger bandwidth than LTE and enables transmission of, for example, LiDAR data over a 5G radio. Finally, we studied the delay and packet loss in D2D communication, that is, without any MEC or cloud servers, by using 802.11p and LTE D2D Mode 2-based commu-nication technologies. 802.11p performed better due to the much larger bandwidth compared to what we used for LTE D2D. However, a comparison to LTE D2D Mode 4 was left as a future work item due to the lack of a publicly available simulation model for that at the time of doing the work.
For the proof of concept, the first major milestone was achieved when the field trial was realized and all implemented functionalities worked together in a real operator grade LTE-A test network and with real cars. The implementation and experiments con-ducted in the winter vehicle test track were also verified by additional tests in a labora-tory environment. The test cases and results presented in this paper are very initial ones, and the development and testing will be continued in future work. During the tests, described in this paper, all the available network resources were allocated for the devices used in the test case. The first results proved that it is possible to realize the scenario in real cellular networks. Anyhow, when scaling the scenario for supporting hundreds of connected cars, it is obvious that data filtering and processing may be needed also at the source for avoiding unnecessary flooding of the networks. Edge computing provides a way to minimize the delays and offers extra resources for data processing when needed.
Our future work includes a comparison of different scenarios, such as data processing at the vehicle, data processing at the MEC, and data processing in the cloud in order to find an optimal combination for different services and scenarios. We are also planning to use more computing power with GPU computing capable hardware in the MEC to minimize the processing times and to continue the tests with an actual 5G New Radio connectivity once it is supported by our testbed.

Page 22 of 23Ojanperä et al. J Wireless Com Network (2021) 2021:96
9 ConclusionThis paper presented a feasibility study of a 5G-inspired road condition warning applica-tion running at the mobile network edge. We described the detailed scenario associated with the proposed application as well as its relation to a more generic system architec-ture specified our in prior work. In terms of practical experimentation, we first evalu-ated different connectivity and computing options associated with the proposed V2X communication system using ns-3 simulations. Then, we introduced a proof-of-concept implementation of the LiDAR-based obstacle warning scenario together with first results from an experimental evaluation, conducted both in a real vehicle testbed environment and in a laboratory setting. As a result, we obtained the first insights on the feasibility of the overall solution and further enhancements needed. The work will be continued in terms or evaluating the services and solutions with 5G New Radio connectivity as well as analyzing the distribution of the vehicular data processing in more complex scenarios encompassing the vehicle, edge and cloud.
Abbreviations5GTN: 5G test network; C-V2X: Cellular vehicle-to-everything communication; CAM: Cooperative Awareness Message; D2D: Device-to-device communication; DENM: Decentralized Environmental Notification Message; DSRC: Dedicated short-range communications; EPC: Evolved packet core; IoT: Internet of Things; ITS: Intelligent transport system; LiDAR: Light detection and ranging; LTE: Long-term evolution; LTE-A: LTE advanced; MEC: Multi-access edge computing; MQTT: Message queuing telemetry transport; NAT: Network address translation; PCD: Point cloud data; PDR: Packet delivery ratio; PGW: Packet gateway; PSSCH: Physical sidelink shared channel; PSCCH: Physical sidelink control channel; RAT : Radio access technology; RTT : Round-trip time; V2I: Vehicle-to-infrastructure communication; V2N: Vehicle-to-network com-munication; V2V: Vehicle-to-vehicle communication; V2X: Vehicle-to-everything communication.
AcknowledgementsThe work was conducted in the Challenge Finland 5G-SAFE and Celtic-Next 5G-SAFE-Plus projects, partially funded by Business Finland. The authors would like to thank for the support and for the collaboration with the partners in the project.
Authors’ contributionsTO contributed to the overall storyline and especially to the introduction and motivation of the paper, related work, and the scenario and system design for 5G-assisted automated driving. JM, OM and OM were the main contributors of the proof-of-concept implementation and the corresponding experimental evaluation based on the work published in the EuCNC 2019 paper [5]. MM was the main contributor of the simulation study and findings. JV was the main contribu-tor focused on the LiDAR data generation and processing in the context of the proof-of-concept implementation. All authors read and approved the final manuscript.
Availability of data and materialsData are shared only according to the agreements associated with the projects providing funding to the described work. Some of the ns-3 models developed for the simulations have been made public by the authors.
Declarations
Competing interestsThe authors declare that they have no competing interests.
Author details1 VTT Technical Research Centre of Finland Ltd., Kaitoväylä 1, 90571 Oulu, Finland. 2 Unikie Ltd., Elektroniikkatie 3, 90590 Oulu, Finland.
Received: 30 December 2019 Accepted: 30 March 2021
References 1. T. Ojanperä, J. Mäkelä, O. Mämmelä, M. Majanen, O. Martikainen, Use cases and communications architecture for
5G-enabled road safety services, in 2018 European Conference on Networks and Communications (EuCNC) (2018) 2. 5G PPP Architecture WG: 5G Architecture White Paper Revision 2.0 (online). https:// 5g- ppp. eu/ white- papers/ (2017) 3. ETSI: Mobile Edge Computing (MEC): Framework and Reference Architecture. ETSI GS MEC 003 V1.1.1 (2016-03)
(2016)

Page 23 of 23Ojanperä et al. J Wireless Com Network (2021) 2021:96
4. J. Scholliers, M. Kutila, A. Virtanen, P. Pyykönen, Development of an automated vehicle as an innovation platform, in 25th ITS World Congress (2018)
5. O. Mämmelä, T. Ojanperä, J. Mäkelä, O. Martikainen, J. Väisänen, Evaluation of LiDAR data processing at the mobile network edge for connected vehicles, in 2019 European Conference on Networks and Communications (EuCNC) (2019)
6. IEEE: IEEE Standard for Information Technology—Local and metropolitan area networks—Part 11, Amendment 6: Wireless Access in Vehicular Environments (2010). IEEE Std. 802.11p-2010 (2010)
7. T. Taleb, K. Samdanis, B. Mada, H. Flinck, S. Dutta, D. Sabella, On multi-access edge computing: a survey of the emerging 5G network edge cloud architecture and orchestration. IEEE Commun. Surv. Tutor. 19(3), 1657–1681 (2017)
8. ETSI Whitepaper No.23: Cloud RAN and MEC: A Perfect Pairing (2018) 9. M. Emara, M.C. Filippou, D. Sabella, MEC-assisted end-to-end latency evaluations for C-V2X communications, in 2018
European Conference on Networks and Communications (EuCNC), pp. 1–9 (2018) 10. K. Sasaki, N. Suzuki, S. Makido, A. Nakao, Vehicle control system coordinated between cloud and mobile edge
computing, in 2016 55th Annual Conference of the Society of Instrument and Control Engineers of Japan (SICE), pp. 1122–1127 (2016)
11. A. Aissioui, A. Ksentini, A.M. Gueroui, T. Taleb, On enabling 5G automotive systems using follow me edge-cloud concept. IEEE Trans. Veh. Technol. 67(6), 5302–5316 (2018)
12. L. Gillam, K. Katsaros, M. Dianati, A. Mouzakitis, Exploring edges for connected and autonomous driving, in IEEE INFO-COM 2018—IEEE Conference on Computer Communications Workshops (INFOCOM WKSHPS), pp. 148–153 (2018)
13. A. Ogawa, S. Kuroda, H.Y. Katsunori Ushida, T. Kantou, R. Kudo, K. Tateishi, Field experiments on sensor data transmis-sion for 5g-based vehicle-infrastructure cooperation, in VTC2018-Fall (2018)
14. Nokia: Nokia and KDDI successfully trial 4G LTE connected vehicle applications in Japan (online).https:// www. nokia. com/ en_ int/ news/ relea ses/ 2018/ 04/ 16/ nokia- and- kddi- succe ssful ly- trial- 4g- lte- conne cted- vehic le- appli catio ns- in- japan/
15. Confluent: Confluent Open Source: A developer-optimized distribution of Apache Kafka (online). https:// www. confl uent. io/ produ ct/ confl uent- open- source/
16. International Organization for Standardization (ISO): Information technology—Message Queuing Telemetry Trans-port (MQTT) v3.1.1 (online). https:// www. iso. org/ stand ard/ 69466. html
17. Z. Shelby, K. Hartke, C. Bormann, The Constrained Application Protocol (CoAP). RFC 7252 (2014) 18. T. Ojanperä, T. Sukuvaara, M. Kutila, O. Huuskonen, K. Mäenpää, J. Scholliers, P. Pyykönen, Development and piloting
of novel 5g enabledroad safety services, in IEEE WCNC 2019 Workshop: Advanced 5G Radio Access Network Features and Performance (2019)
19. M. Majanen: MEC model for ns-3 (ns3-MEC) (online). https:// github. com/ mmaja nen/ ns3- MEC (2018) 20. R. Rouil, A.B.M. F. Cintron, Gamboa, S.: Implementation and validation of an lte d2d model for ns-3, in Workshop on
Ns-3 (WNS3 2017) (2017) 21. A. Nabil, K.K.C.D. V. Marojevic: Performance analysis of sensing-based semi-persistent scheduling in c-v2x networks,
in CoRR, Abs/1804.10788 (2018) 22. M. Gonzalez-Martin, R.M.-M.J.G. M. Sepulcre: System level evaluation of lte-v2v mode 4 communications and its
distributed scheduling, in IEEE 85th Vehicular Technology Conference (VTC Spring) (2017) 23. F. Eckermann, C.W. J. Freudenthal: Performance analysis of unsupervised lte device-to-device (d2d) communication,
in IEEE Vehicular Technology Conference (VTC-Fall) (2018) 24. D.W. Griffith, R.A.R. F.J. Cintron: Physical sidelink control channel (pscch) in mode 2: performance analysis, in IEEE
International Conference on Communications (ICC) (2017) 25. R.A. Light, Mosquitto: server and client implementation of the MQTT protocol. J. Open Sour. Softw. 2(13), 265 (2017) 26. O. Grygorash, Y. Zhou, Z. Jorgensen, Minimum spanning tree based clustering algorithms, in 18th IEEE International
Conference on Tools with Artificial Intelligence (ICTAI), pp. 73–81 (2006) 27. C. Zhong, D. Miao, P. Fränti, Minimum spanning tree based split-and-merge: a hierarchical clustering method. Inf. Sci.
181(16), 3397–3410 (2011) 28. Sod5G: Project website (online). http:// sod5g. fmi. fi/ (2018) 29. M. Latva-aho, A. Pouttu, A. Hekkala, I. Harjula, J. Mäkelä, Small cell based 5G test network (5GTN), in 2015 International
Symposium on Wireless Communication Systems (ISWCS), pp. 231–235 (2015) 30. NGMN Alliance, NGMN 5G White Paper (Technical report, NGMN Alliance, 2015)
Related Documents


