EVALUATION OF LEVELS OF REGULATED TRIHALOMETHANES (THMs) IN A COMMUNITY DRINKING WATER SUPPLY IN NIGERIA 1 E. M. Shaibu-Imodagbe, 2 C. A. Okuofu, 3 J. P. Unyimadu, 4 A. B. Williams, and 1 H. Omenesa 1 Samaru College of Agriculture, Ahmadu Bello University, Zaria [email protected] 2 Department of Water Resources and Environmental Engineering, Ahmadu Bello University, Zaria [email protected] 3 Department of Physical Chemistry, Institute of Oceanography and Marine Research, Victoria Island, Lagos [email protected] 4 Department of Chemistry, Covenant University, Canaanland, Ota Ogun State [email protected] ABSTRACT The study assessed the levels of trihalomethanes in drinking water from Ahmadu Bello University treatment plant between 2008 and 2010. Two hundred and fifty-two (252) samples of processed drinking water at various stages of treatment and distribution were taken in duplicates. In accordance with the United States Environmental Protection Agency (USEPA) Method 551.1, samples were taken using ammonium chloride as de- chlorinating agent and methyl tert-butyl ether (MTBE) as solvent extractant during samples’ analyses. Concentrations of the four regulated trihalomethanes (trichloromethane – CHCl 3 -, tribromomethane – CHBr 3 -, dibromochloromethane and bromodichloromethane) were analysed using Agilent gas chromatograph (GC) model 19091-413 with Chemstation software. From the study only tribromomethane was detected immediately after chlorination while trichloromethane and bromodichloromethane were detected at storage in the booster station. Peak values of these analytes were also obtained at the booster station. Maximum permissible levels of the analytes are set only as total mean trihalomethanes. In the study, total mean trihalomethane (TTHMs) values ranged from 1

Welcome message from author
This document is posted to help you gain knowledge. Please leave a comment to let me know what you think about it! Share it to your friends and learn new things together.
Transcript
EVALUATION OF LEVELS OF REGULATED TRIHALOMETHANES(THMs) IN A COMMUNITY DRINKING WATER SUPPLY IN
NIGERIA
1E. M. Shaibu-Imodagbe, 2C. A. Okuofu, 3J. P. Unyimadu, 4A. B.Williams, and 1H. Omenesa
1Samaru College of Agriculture, Ahmadu Bello University, [email protected]
2Department of Water Resources and Environmental Engineering, AhmaduBello University, Zaria [email protected]
3Department of Physical Chemistry, Institute of Oceanography andMarine Research, Victoria Island, Lagos [email protected]
4Department of Chemistry, Covenant University, Canaanland, Ota OgunState
ABSTRACT
The study assessed the levels of trihalomethanes in drinkingwater from Ahmadu Bello University treatment plant between2008 and 2010. Two hundred and fifty-two (252) samples ofprocessed drinking water at various stages of treatment anddistribution were taken in duplicates. In accordance with theUnited States Environmental Protection Agency (USEPA) Method551.1, samples were taken using ammonium chloride as de-chlorinating agent and methyl tert-butyl ether (MTBE) assolvent extractant during samples’ analyses. Concentrationsof the four regulated trihalomethanes (trichloromethane –CHCl3-, tribromomethane – CHBr3 -, dibromochloromethane andbromodichloromethane) were analysed using Agilent gaschromatograph (GC) model 19091-413 with Chemstation software.From the study only tribromomethane was detected immediatelyafter chlorination while trichloromethane andbromodichloromethane were detected at storage in the boosterstation. Peak values of these analytes were also obtained atthe booster station. Maximum permissible levels of theanalytes are set only as total mean trihalomethanes. In thestudy, total mean trihalomethane (TTHMs) values ranged from
1
zero in the raw water and water after sedimentation to1.3140E-02±1.4614E-05 mg/L in the booster station watersamples but decreased to 1.0601E-02±1.6625 mg/L at householdlevel. These values exceeded the national limit of 0.001 mg/Lbut fall within acceptable limits under the United StatesEnvironmental Protection Agency (USEPA), European Union (EU),Canadian and World Health Organization (WHO) standards.Statistically, the observed mean values showed somesignificant differences and also had significant relationshipswith some of the sampled waters’ physical parameters such aspH, residual chlorine, total organic carbon and temperature.Furthermore, the study highlights total dissolved solids andnitrates as additional contributors to total meantrihalomethanes in drinking water sampled but found seasonalinfluence to be insignificant despite significant temperatureinfluence. As these trihalomethanes (THMs) are implicated incarcinogenicity and mutagenicity their presence inconventionally treated drinking water creates serious healthchallenges.
Key words: Trihalomethanes, gas chromatograph, MTBE, Ahmadu BelloUniversity, drinking water
INTRODUCTION
Water is very vital to all living resources plants and animals
alike. It is a pre-condition for human, animal and plant life
as well as an indispensable economic resource. Water also
plays a fundamental role in climate regulation (WISE, 2011).
Drinking water is a fundamental requirement of the human body
that cannot be replaced. Potable drinking water is primarily
sourced from rainfall or from surface water sources like
streams, rivers, lakes and springs. Where these surface
waters do not exist or where they occur in quantities that
2
cannot adequately support the dependent populations, ground
water resources are exploited in the form of wells and
boreholes to provide this vital resource for the sustenance of
the dependent populations. Furthermore, potable water becomes
still more limited because surface water bodies are over
tapped sometimes requiring inter-basin transfer to augment and
ground water sources are over abstracted leading to landslides
and faults. There is also rapid eco-forest destruction and
aggravated pollution of water resources in many world regions
by microbial pathogens, nutrients and various categories of
wastes especially from anthropogenic activities. This is also
compounded by global climate change and incompatible human
activities on the world’s hydrosphere (UNU, 2001; Shaibu-
Imodagbe, 2011). As a result, a range of water crisis in
water quality and quantity has since been triggered (Postel,
2000). It is against this background that Chapter 18 of
Agenda 21 of the Rio De Janeiro Conference on climate change
of 1992 set a high priority on the protection of water
resources from depletion, pollution and degradation through
climate change and the sophisticated practices of man that
3
produce complex wastes that end up in water supplies (Porter,
2002).
With the discovery of chlorine in 1774 and its disinfecting
properties and subsequent use in treating drinking water
supply to New Jersey in 1904, a new phase in water treatment
was opened (Wigle, 1998). Disinfection has continued to play
a major role in the wholesomeness of treated drinking water,
because it serves as the major barrier against the
transmission of water borne diseases, the occurrence of which
have been linked to many deaths in developing countries. In
1993 alone cholera outbreak in developing countries was of the
magnitude of 950,000 reported cases with more than 9,000
deaths (Reiff, 1995). As a result, disinfection is considered
the most important process in drinking water treatment and one
of the public health triumphs of the 20th century. Because of
this, microbial safety has taken precedence over associated
health risks in developing countries even when disinfection
by-products were discovered (Reiff, 1995; Schoeny, 2010).
This is consistent with many international regulators of
drinking water quality directives that adequate disinfection
4
should never be compromised in attempting to meet guidelines
for THMs (WHO, 2005) and any contamination from disinfection
by-products is kept as low as possible without compromising
disinfection (WHO, 2008, Irish EPA, 2011).
In the disinfection process in water treatment, chlorine and
other disinfectants react with organic matter or its
intermediates such as humus, fulvic acids and amides that are
dissolved in water. Subsequently, potentially harmful
disinfection by-products (DBPs) are produced. Among these,
are trihalomethanes that were the first group of DBPs to be
recognized. This group of compounds have been implicated in
liver and kidney defects, central nervous system problems and
increased risk of carcinogenicity and mutagenicity as Class B
carcinogens (USEPA, 1990). Among these regulated four THMs,
bromodichloromethane is known to be most toxic followed by
dibromochloromethane and tribromomethane while
trichloromethane, is least toxic among the four (WHO, 2005).
To date many trihalomethanes have been discovered in water but
only four of them are regulated. These are trichloromethane –
CHCl3, dibromochloromethane – CHClBr2, Bromodichloromethane –
5
CHCl2Br and tribromomethane – CHBr3. Trichloromethane – CHCl3
is the most common and dominant compound of these regulated
THMs in drinking water. Like other THMs, it is susceptible to
pH changes, levels of total dissolved organic carbon, and
sulphates content of the drinking water medium through a
direct relationship (WHO, 2008). These show that there is a
need to document concentrations of these trihalomethane DBPs
in drinking water. This study is aimed at assessing the levels
of regulated trihalomethanes in drinking water with particular
reference to an institutional (Ahmadu Bello University)
community drinking water supply.
MATERIALS AND METHODS
Materials
Sixty millilitres (60-mL) screw cap glass vials equipped with
cap fitted with PTFE septa were washed thoroughly and dried
ready for sampling.
Micro syringes of the capacities – 10 µL, 50 µL, 100 µL and
1000 µL
Glass Pipettes of 10 mL size
6
Pasteur pipette – about 23cm to extract solvent
Top loading balance
ACS Grade ammonium chloride de-chlorinating agent
ACS Grade sodium sulphate muffle furnaced at 4000C for a
minimum of 30 minutes
Phosphate buffer prepared by mixing 1% ACS Grade sodium
phosphate dibasic and 99% ACS Grade potassium phosphate
monobasic salts
High purity grade MTBE and
Agilent Gas Chromatograph (GC) Model 19091 – 413 calibrated
with commercial standards for disinfection by-products
supplied by Ultra Scientific Analytical Solutions, North
Kingston, RI 02852-7723, USA with a Certificate of Quality
Assurance.
All the reagents used were of analar grade.
Sampling
7
Two hundred and fifty two (252) samples were collected in
duplicates longitudinally along the treatment and distribution
system of the Ahmadu Bello University Water Treatment Plant.
These samples were taken from the source (raw) water (Kubanni
reservoir), after the sedimentation tanks, after chlorination,
at the booster station and at household level (Area E
Quarters). Samples for trihalomethanes (THMs) analyses were
taken in 60mL glass vials with weighed samples of ammonium
chloride used as de-chlorinating agent. Care was taken to
avoid overtopping or spilling of sampled water from the vials.
The samples were subsequently stored at temperature of about 4
0C or less in ice filled jugs in accordance with USEPA method
551.1 (USEPA, 1995).
Methodology
Analyses of the water samples for the THMs were in accordance
with standard methods outlined in USEPA method 551.1 using
Agilent Gas Chromatograph. The results were statistically
analysed and compared with National and International
standards.
8
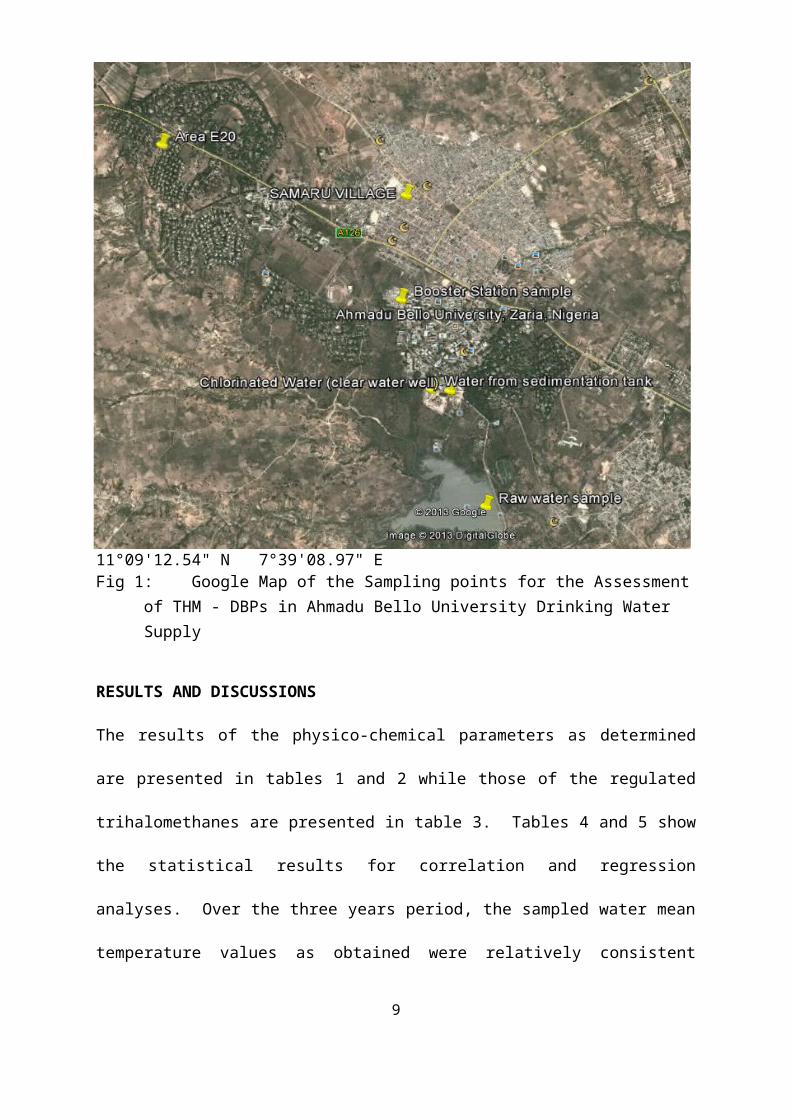
11°09'12.54" N 7°39'08.97" EFig 1: Google Map of the Sampling points for the Assessment
of THM - DBPs in Ahmadu Bello University Drinking Water Supply
RESULTS AND DISCUSSIONS
The results of the physico-chemical parameters as determined
are presented in tables 1 and 2 while those of the regulated
trihalomethanes are presented in table 3. Tables 4 and 5 show
the statistical results for correlation and regression
analyses. Over the three years period, the sampled water mean
temperature values as obtained were relatively consistent
9
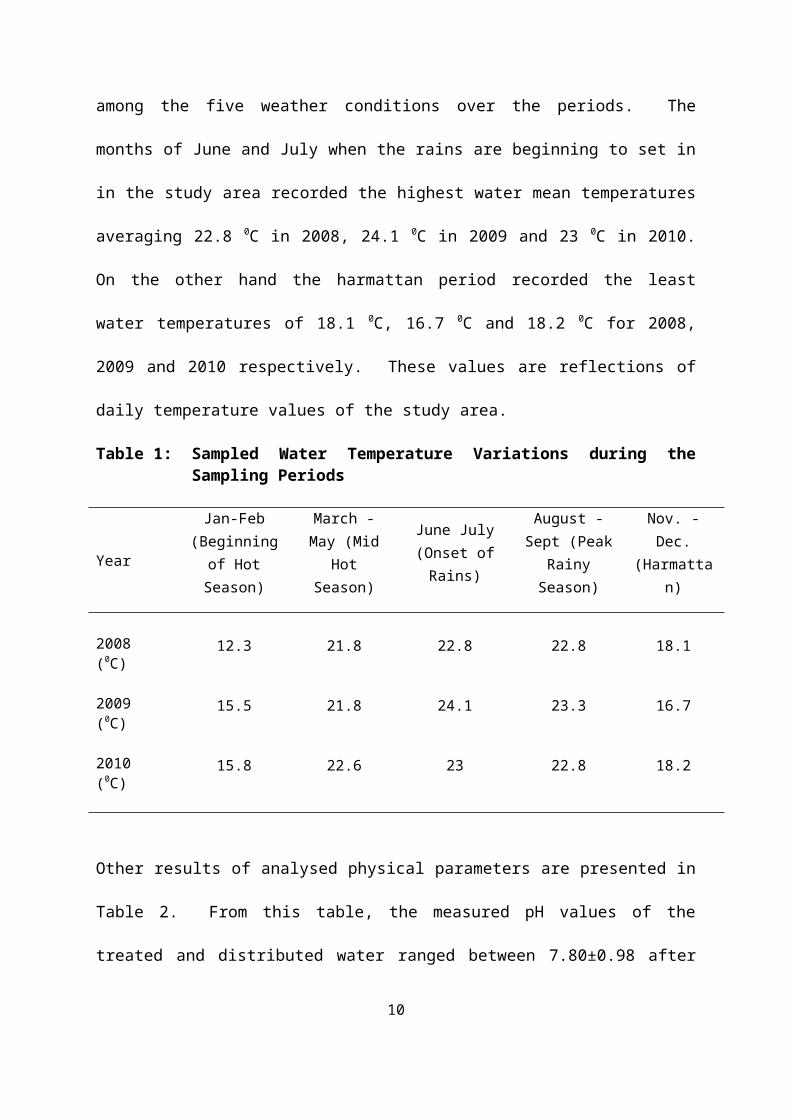
among the five weather conditions over the periods. The
months of June and July when the rains are beginning to set in
in the study area recorded the highest water mean temperatures
averaging 22.8 0C in 2008, 24.1 0C in 2009 and 23 0C in 2010.
On the other hand the harmattan period recorded the least
water temperatures of 18.1 0C, 16.7 0C and 18.2 0C for 2008,
2009 and 2010 respectively. These values are reflections of
daily temperature values of the study area.
Table 1: Sampled Water Temperature Variations during theSampling Periods
Year
Jan-Feb(Beginningof HotSeason)
March -May (Mid
HotSeason)
June July(Onset ofRains)
August -Sept (Peak
RainySeason)
Nov. -Dec.
(Harmattan)
2008(0C)
12.3 21.8 22.8 22.8 18.1
2009(0C)
15.5 21.8 24.1 23.3 16.7
2010(0C)
15.8 22.6 23 22.8 18.2
Other results of analysed physical parameters are presented in
Table 2. From this table, the measured pH values of the
treated and distributed water ranged between 7.80±0.98 after
10
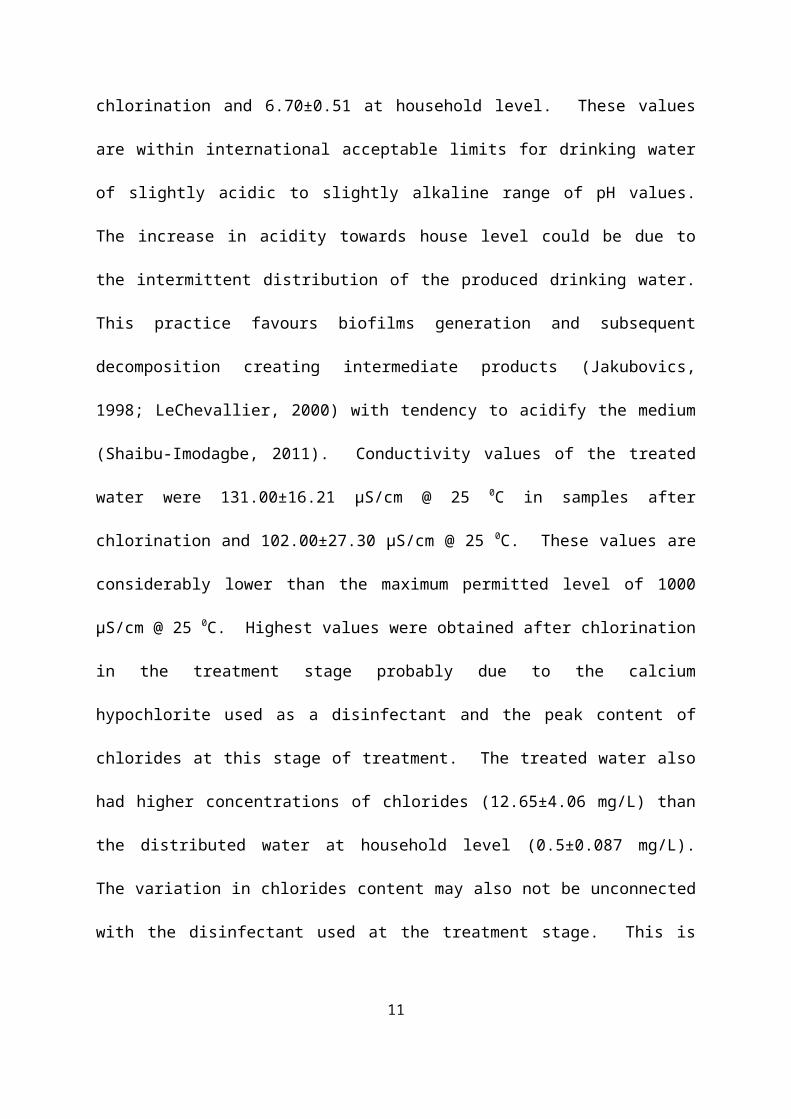
chlorination and 6.70±0.51 at household level. These values
are within international acceptable limits for drinking water
of slightly acidic to slightly alkaline range of pH values.
The increase in acidity towards house level could be due to
the intermittent distribution of the produced drinking water.
This practice favours biofilms generation and subsequent
decomposition creating intermediate products (Jakubovics,
1998; LeChevallier, 2000) with tendency to acidify the medium
(Shaibu-Imodagbe, 2011). Conductivity values of the treated
water were 131.00±16.21 µS/cm @ 25 0C in samples after
chlorination and 102.00±27.30 µS/cm @ 25 0C. These values are
considerably lower than the maximum permitted level of 1000
µS/cm @ 25 0C. Highest values were obtained after chlorination
in the treatment stage probably due to the calcium
hypochlorite used as a disinfectant and the peak content of
chlorides at this stage of treatment. The treated water also
had higher concentrations of chlorides (12.65±4.06 mg/L) than
the distributed water at household level (0.5±0.087 mg/L).
The variation in chlorides content may also not be unconnected
with the disinfectant used at the treatment stage. This is
11
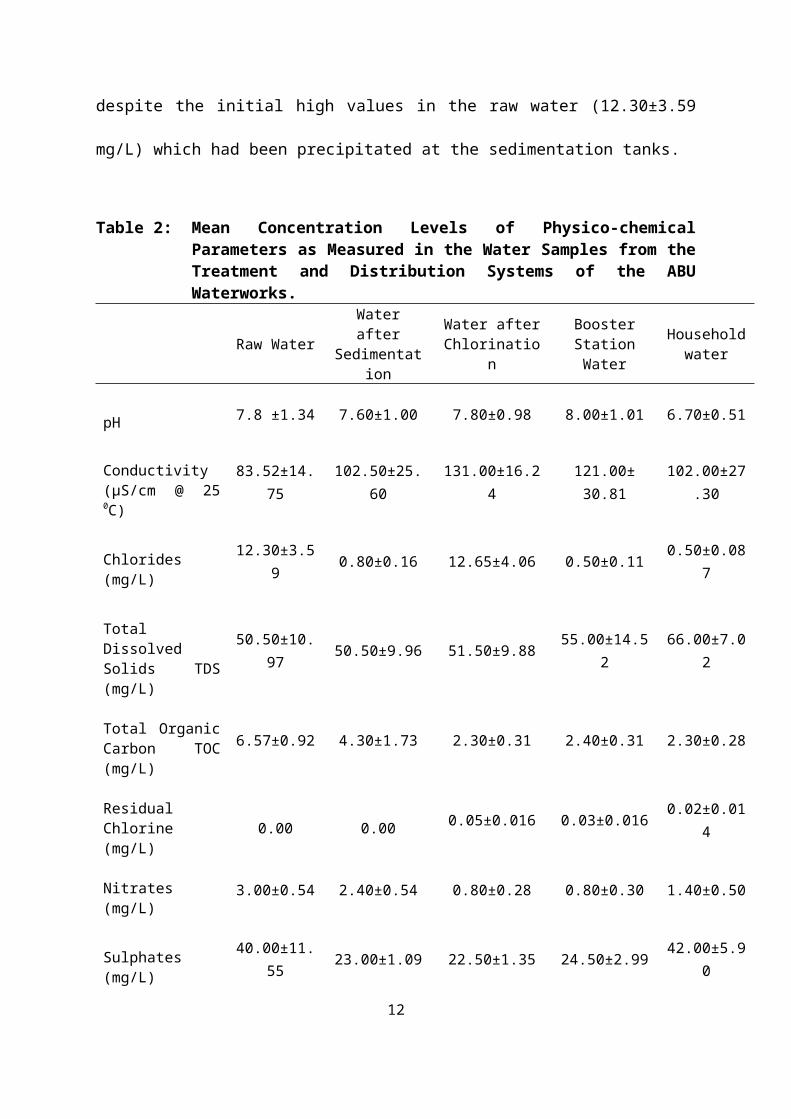
despite the initial high values in the raw water (12.30±3.59
mg/L) which had been precipitated at the sedimentation tanks.
Table 2: Mean Concentration Levels of Physico-chemicalParameters as Measured in the Water Samples from theTreatment and Distribution Systems of the ABUWaterworks.
Raw Water
Waterafter
Sedimentation
Water afterChlorinatio
n
BoosterStationWater
Householdwater
pH 7.8 ±1.34 7.60±1.00 7.80±0.98 8.00±1.01 6.70±0.51
Conductivity(µS/cm @ 250C)
83.52±14.75
102.50±25.60
131.00±16.24
121.00±30.81
102.00±27.30
Chlorides(mg/L)
12.30±3.59 0.80±0.16 12.65±4.06 0.50±0.11 0.50±0.08
7
TotalDissolvedSolids TDS(mg/L)
50.50±10.97 50.50±9.96 51.50±9.88 55.00±14.5
266.00±7.0
2
Total OrganicCarbon TOC(mg/L)
6.57±0.92 4.30±1.73 2.30±0.31 2.40±0.31 2.30±0.28
ResidualChlorine(mg/L)
0.00 0.00 0.05±0.016 0.03±0.016 0.02±0.014
Nitrates(mg/L)
3.00±0.54 2.40±0.54 0.80±0.28 0.80±0.30 1.40±0.50
Sulphates(mg/L)
40.00±11.55 23.00±1.09 22.50±1.35 24.50±2.99 42.00±5.9
0
12
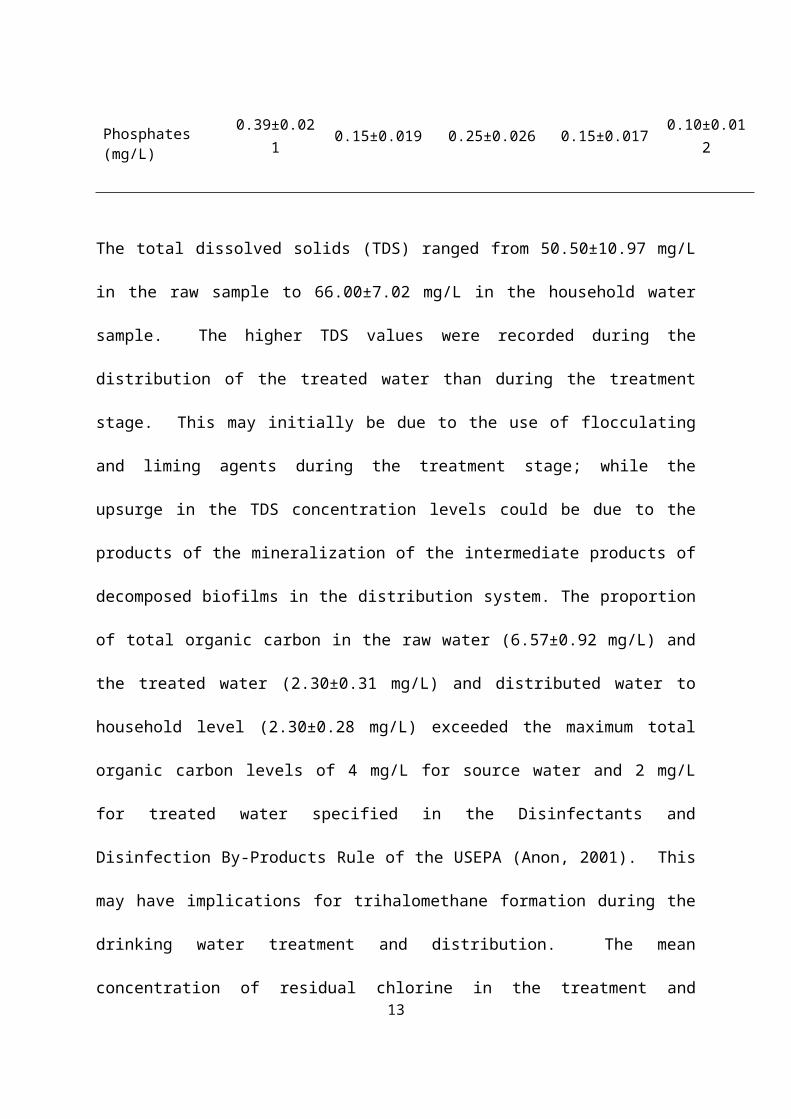
Phosphates(mg/L)
0.39±0.021 0.15±0.019 0.25±0.026 0.15±0.017 0.10±0.01
2
The total dissolved solids (TDS) ranged from 50.50±10.97 mg/L
in the raw sample to 66.00±7.02 mg/L in the household water
sample. The higher TDS values were recorded during the
distribution of the treated water than during the treatment
stage. This may initially be due to the use of flocculating
and liming agents during the treatment stage; while the
upsurge in the TDS concentration levels could be due to the
products of the mineralization of the intermediate products of
decomposed biofilms in the distribution system. The proportion
of total organic carbon in the raw water (6.57±0.92 mg/L) and
the treated water (2.30±0.31 mg/L) and distributed water to
household level (2.30±0.28 mg/L) exceeded the maximum total
organic carbon levels of 4 mg/L for source water and 2 mg/L
for treated water specified in the Disinfectants and
Disinfection By-Products Rule of the USEPA (Anon, 2001). This
may have implications for trihalomethane formation during the
drinking water treatment and distribution. The mean
concentration of residual chlorine in the treatment and13
distribution system were found to vary from 0.05±0.016 mg/L in
the samples after chlorination to 0.02±0.014 mg/L at household
level. These low mean concentrations have implications for
the safe delivery of wholesome and potable drinking water to
the consuming community as these indicate low capacity to
maintain secondary disinfection in the distribution system.
The mean nitrate concentrations decreased longitudinally along
the treatment process from 3.00±0.54 mg/L in the raw water to
0.80±0.28 mg/L in the sample after chlorination but increased
slightly to 1.40±0.5 mg/L at house level probably due to the
biofilm growth, decomposition and mineralization as a result
of intermittent water distribution. These values are
considerably lower than the maximum contaminant limit of 50
mg/L allowed in national and international standards because
of the risk of methaemoglobinanaemia. The concentrations of
sulphates were found to decrease during the treatment process
from 40.00±11.55 mg/L to 22.50±1.35 mg/L after chlorination
but gradually increased to 42.00±5.90 mg/L at household level.
This situation is most probably accounted for by the growth,
decomposition and mineralization of biofilms generated in the
distribution system due to intermittent water distribution.
14
Despite this, these values are still within acceptable
permissible limits under the national and international
standards which range from 100 mg/L to 500 mg/L. The mean
phosphate concentrations in the treatment and distribution
stages progressively decreased from the raw water with
0.39±0.021 mg/L to house level water with 0.10±0.012 mg/L.
This trend may be connected to the use of phosphates as
essential nutrients for the growth and development of biofilms
along the distribution system.
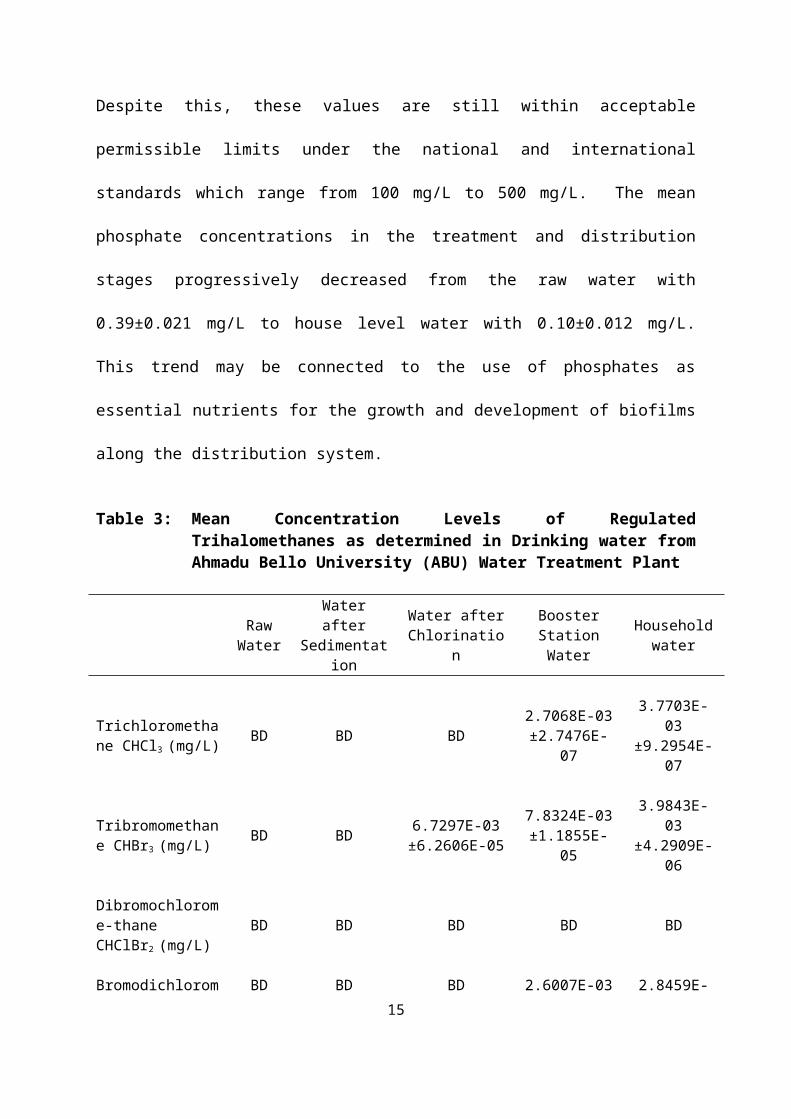
Table 3: Mean Concentration Levels of RegulatedTrihalomethanes as determined in Drinking water fromAhmadu Bello University (ABU) Water Treatment Plant
RawWater
Waterafter
Sedimentation
Water afterChlorinatio
n
BoosterStationWater
Householdwater
Trichloromethane CHCl3 (mg/L) BD BD BD
2.7068E-03±2.7476E-
07
3.7703E-03
±9.2954E-07
Tribromomethane CHBr3 (mg/L) BD BD 6.7297E-03
±6.2606E-05
7.8324E-03±1.1855E-
05
3.9843E-03
±4.2909E-06
Dibromochlorome-thaneCHClBr2 (mg/L)
BD BD BD BD BD
Bromodichlorom BD BD BD 2.6007E-03 2.8459E-15
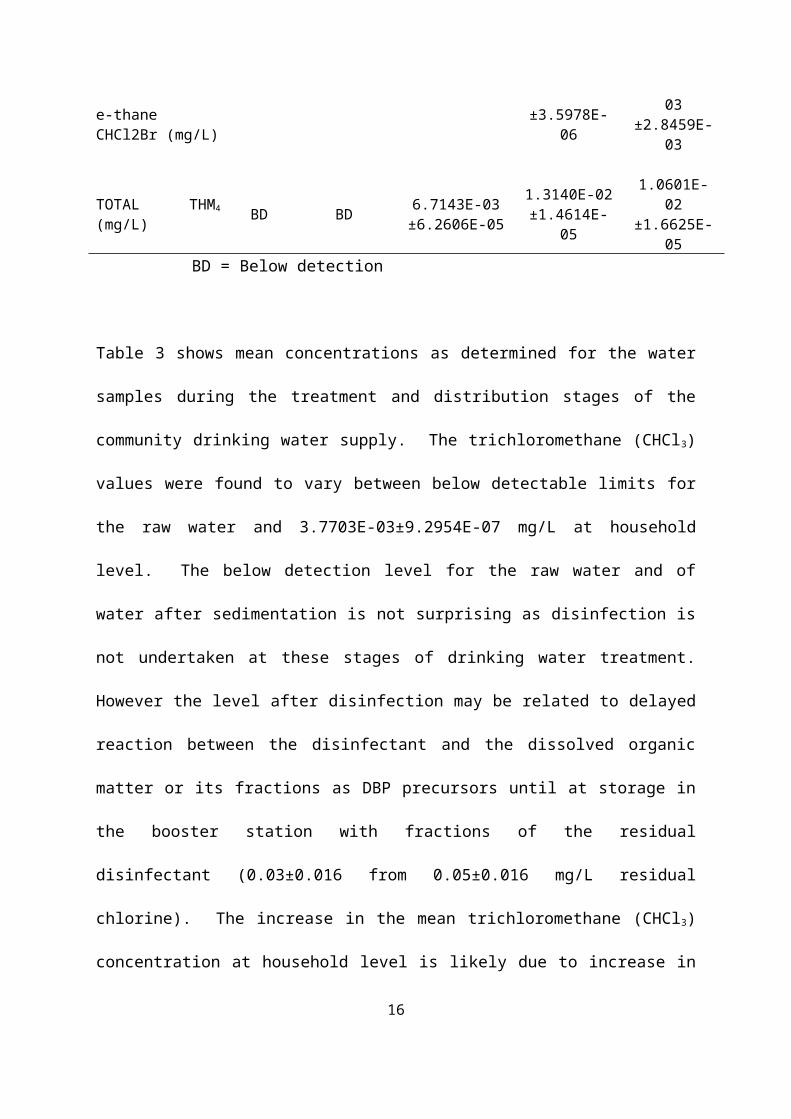
e-thaneCHCl2Br (mg/L)
±3.5978E-06
03±2.8459E-
03
TOTAL THM4
(mg/L) BD BD 6.7143E-03±6.2606E-05
1.3140E-02±1.4614E-
05
1.0601E-02
±1.6625E-05
BD = Below detection
Table 3 shows mean concentrations as determined for the water
samples during the treatment and distribution stages of the
community drinking water supply. The trichloromethane (CHCl3)
values were found to vary between below detectable limits for
the raw water and 3.7703E-03±9.2954E-07 mg/L at household
level. The below detection level for the raw water and of
water after sedimentation is not surprising as disinfection is
not undertaken at these stages of drinking water treatment.
However the level after disinfection may be related to delayed
reaction between the disinfectant and the dissolved organic
matter or its fractions as DBP precursors until at storage in
the booster station with fractions of the residual
disinfectant (0.03±0.016 from 0.05±0.016 mg/L residual
chlorine). The increase in the mean trichloromethane (CHCl3)
concentration at household level is likely due to increase in
16
the sulphate (24.50±2.99 to 42.0 mg/L) and total dissolved
solids (55.00±14.52 to 66.00±7.02 mg/L) content from the
booster station to household level. This is in agreement with
earlier reports in literature (WHO, 2008). The maximum
contaminant level prescribed by the WHO, (2008) for this
compound is 0.3 mg/L as against the maximum contaminant level
goal of 0.07 mg/L under the USEPA standards. The mean values
of the compound in the treated and distributed water to
household level as determined are correspondingly lower than
the prescribed limits in these standards and as such the
treated drinking water could be assumed to be safe
Like the trichloromethane, mean levels of tribromomethane were
below detectable levels in the raw water and water after
sedimentation due to the absence of a disinfectant in these
stages of water treatment. But after chlorination, mean
concentration of 6.7297E-03±6.2606E-05 mg/L of tribromomethane
was observed. This mean level increased to 7.8324E-03
±1.1855E-05 mg/L in the booster station, where it decreased to
3.9843E-03±4.2909E-06 mg/L in the household water. The
increase in the tribromomethane concentration in the booster
17
station may be due to the increased levels of total organic
carbon (TOC) from 2.30±0.31 mg/L in the chlorinated water to
2.40±0.31 mg/L), which would have provided more dissolved
organic matter to react with the little quantity of residual
chlorine (0.03 mg/L) to form more of the tribromomethane
during storage in the booster station tanks. Like the
trichloromethane, this observed mean level of tribromomethane
is lower than the maximum contaminant level (0.1 mg/L)
permitted by the WHO drinking water guidelines (2008). It is
likely therefore that the Ahmadu Bello University treated
drinking water does not pose any risk to human health due to
its content of tribromomethane.
Dibromochloromethane was neither detected in the source water
nor in the Ahmadu Bello University treated drinking water and
during this study. However, bromodichloromethane was detected
in the water treated and stored in the booster station with a
mean concentration of 2.6007E-03±3.5978E-06 mg/L. This mean
concentration increased at household level to 2.8459E-
03±2.8459E-03 mg/L. Like trichloromethane (CHCl3), mean
concentration levels of dibromochloromethane increased at
18
house level water samples from the booster station samples due
to increase in the sulphate (24.50±2.99 to 42.00±5.90 mg/L)
and total dissolved solids (55.00±14.52 to 66.00±7.02 mg/L)
content from the booster station to household level. This is
consistent with other findings in literature (WHO, 2008). The
obtained mean concentration value for this regulated
trihalomethane in the treated household drinking water
(2.8459E-03±2.8459E-03 mg/L) is considerably lower than the
maximum permissible limit of the compound in the WHO standards
for drinking water (0.06 mg/L) (WHO, 2008).
From this study, total trihalomethanes (TTHMs) in the various
treatment and distribution stages of ABU drinking water supply
had the highest concentration of 1.3140E-02±1.4614E-05 mg/L
during storage in the booster station tanks. This is likely
connected to the development of biofilms due to fluctuations
in the water levels in these tanks which caused increase in
the total organic carbon content (from 2.30±0.31 mg/L in water
after chlorination to 2.40±0.31 mg/L in the booster station
water). This observation is similar to earlier reports by
Jakubovicks, (1998) and LeChevallier, (2000). Such increased
19
total organic carbon provides more dissolved organic matter as
DBP precursor to generate more of the THMs during storage in
the booster station tanks than after chlorination (1.3140E-
02±1.4614E-05 mg/L as against 6.7143E-03±6.2606E-05 mg/L in
the water after chlorination). From the booster station, the
mean concentration level decreased to 1.0601E-02±1.6625E-05
mg/L. This lower household concentration level may be due to
losses in the distribution system arising from frictional
losses and flow characteristics as had been noted earlier
(Stevens et al, 1989; USEPA, 1997). In relation to standards,
these concentration levels of the finished drinking water
(household and booster station) are well within permissible
limits of the USEPA (0.080mg/L), WHO and EU (0.1 mg/L) but
exceeded the maximum limit of 0.001 mg/L of the Nigerian
Drinking Water Quality standard (SON. 2007).
Relationship Assessment
The Pearson correlation technic was used to assess the
possibility and the degree to which pairs of analysed
parameters are related. The results were further subjected to
regression analyses to determine any significant linear
20
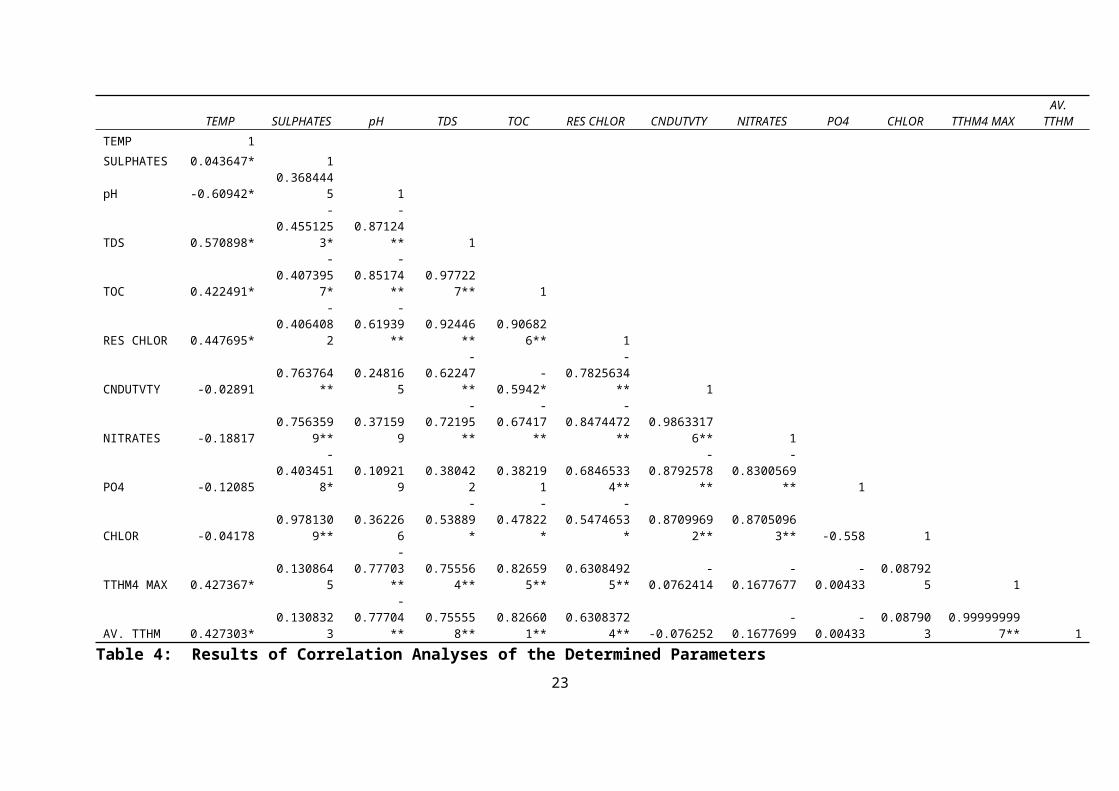
relationship among pairs of analysed parameters. Results of
the correlation analysis are shown in Table 4. These results
show negative and positive significant relationship among
pairs of parameters determined in addition to some with
insignificant relationship. Positive correlation arise when
large values of one parameter in a pair are associated with
large values of the other, while negative correlation occur
when large values of one parameter are associated with small
values of another. Some pairs of the physico-chemical
parameters correlated significantly, either positively or
negatively in each pair like pH with TDS, TOC and residual
chlorine among others.
Statistical correlation of pairs with the total mean
trihalomethanes, show that total mean trihalomethanes (TTHM4)
values significantly correlated positively with temperature,
total dissolved solids (TDS), total organic matter (TOC) and
residual chlorine values, while significantly correlating
negatively with pH. These signify that large values of the
total mean trihalomethanes-DBPs are associated in this study
with large values of temperature, TDS, TOC and residual
21
chlorine while large values of the total mean trihalomethanes
(TTHMs) are associated with low values of pH (high acidic
condition) as had been documented in literature, (WHO, 2008).
22
TEMP SULPHATES pH TDS TOC RES CHLOR CNDUTVTY NITRATES PO4 CHLOR TTHM4 MAXAV.
TTHMTEMP 1SULPHATES 0.043647* 1
pH -0.60942*0.368444
5 1
TDS 0.570898*
-0.455125
3*
-0.87124
** 1
TOC 0.422491*
-0.407395
7*
-0.85174
**0.97722
7** 1
RES CHLOR 0.447695*
-0.406408
2
-0.61939
**0.92446
**0.90682
6** 1
CNDUTVTY -0.028910.763764
**0.24816
5
-0.62247
**-
0.5942*
-0.7825634
** 1
NITRATES -0.188170.756359
9**0.37159
9
-0.72195
**
-0.67417
**
-0.8474472
**0.9863317
6** 1
PO4 -0.12085
-0.403451
8*0.10921
90.38042
20.38219
10.6846533
4**
-0.8792578
**
-0.8300569
** 1
CHLOR -0.041780.978130
9**0.36226
6
-0.53889
*
-0.47822
*
-0.5474653
*0.8709969
2**0.8705096
3** -0.558 1
TTHM4 MAX 0.427367*0.130864
5
-0.77703
**0.75556
4**0.82659
5**0.6308492
5**-
0.0762414-
0.1677677-
0.004330.08792
5 1
AV. TTHM 0.427303*0.130832
3
-0.77704
**0.75555
8**0.82660
1**0.6308372
4** -0.076252-
0.1677699-
0.004330.08790
30.99999999
7** 1Table 4: Results of Correlation Analyses of the Determined Parameters
23

24
Further relationship assessment was undertaken using
regression analysis to determine the rate of change of the
determined concentration levels of the regulated
trihalomethanes as a function of the concentration levels of
assessed physico-chemical parameters. Among these paired
assessments, the rate of change of the mean regulated total
trihalomethanes were found to vary significantly with changes
in temperature, pH, total dissolved solids, total organic
carbon, residual chlorine and nitrates. These generated
respective models by which the level of trihalomethanes can be
predicted with some degree of certainty based on fixed or
predetermined level of these physico-chemical parameters.
These characteristics are presented in table 5
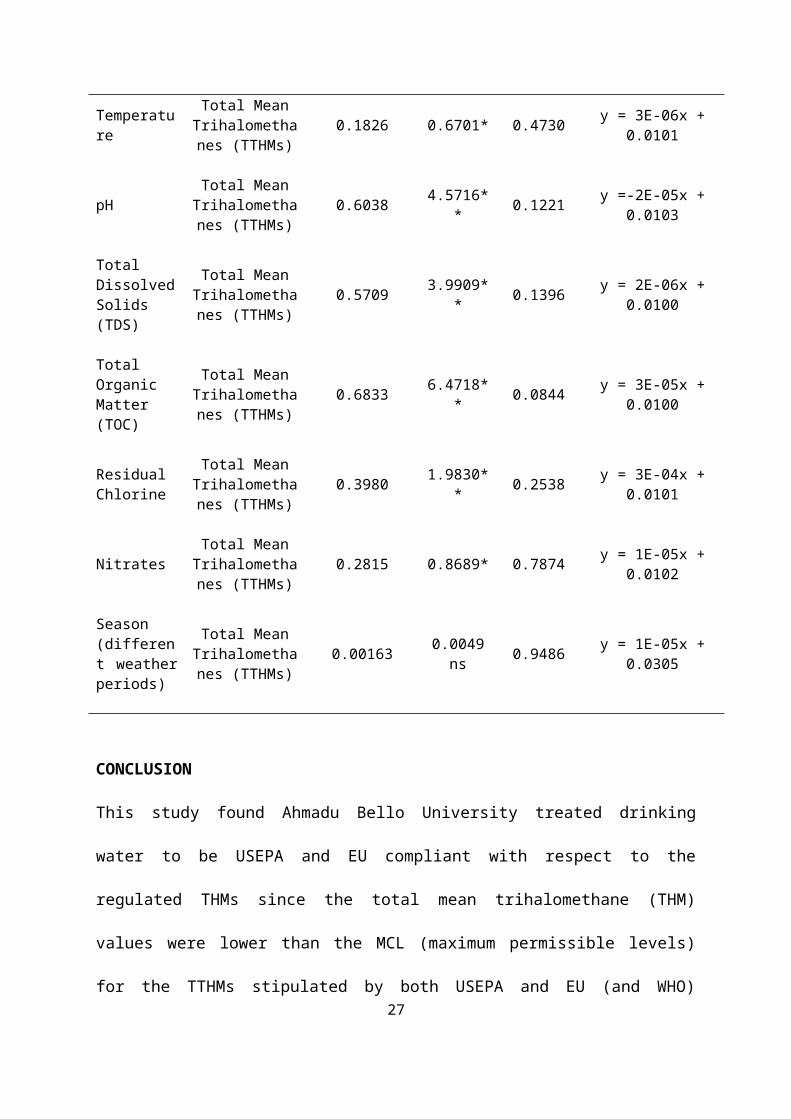
Table 5 shows that average values of six of the determined
physico-chemical parameters create statistically significant
conditional expectation in the average values of total mean
trihalomethanes for any fixed value of these physico-chemical
parameters. Among these parameters are temperature, pH, total
organic carbon, and residual chlorine already identified in
literature as factors affecting concentration levels of
25
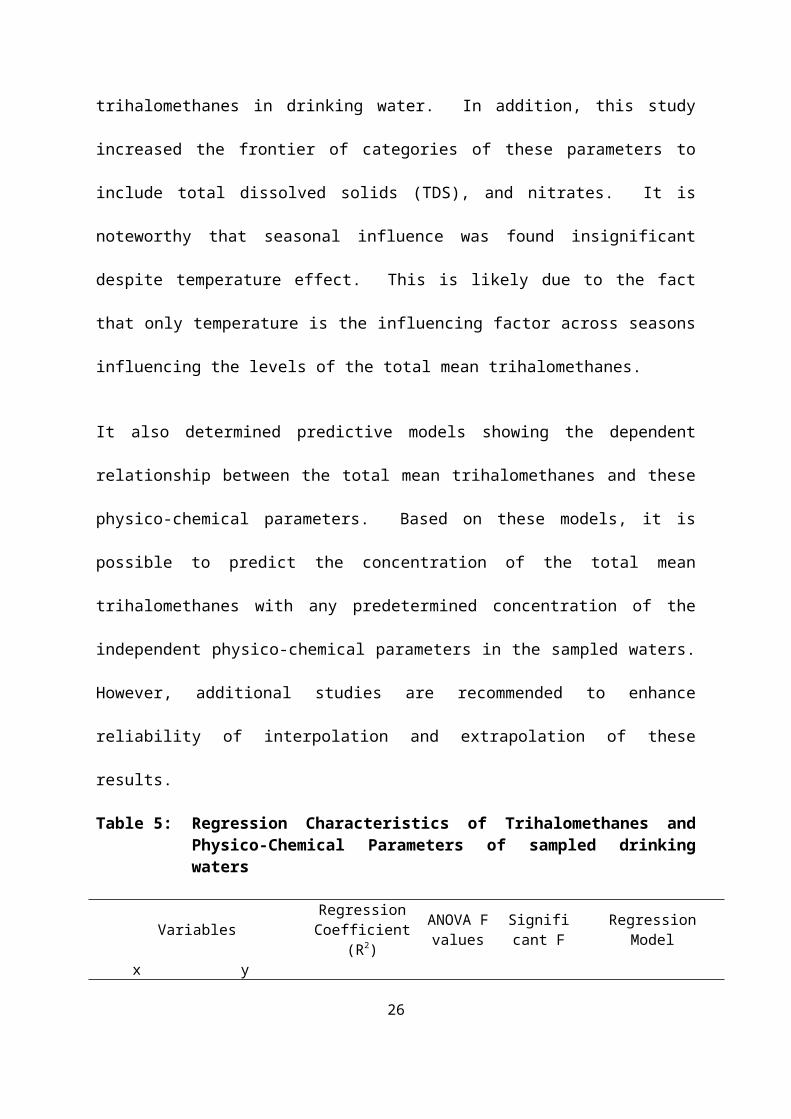
trihalomethanes in drinking water. In addition, this study
increased the frontier of categories of these parameters to
include total dissolved solids (TDS), and nitrates. It is
noteworthy that seasonal influence was found insignificant
despite temperature effect. This is likely due to the fact
that only temperature is the influencing factor across seasons
influencing the levels of the total mean trihalomethanes.
It also determined predictive models showing the dependent
relationship between the total mean trihalomethanes and these
physico-chemical parameters. Based on these models, it is
possible to predict the concentration of the total mean
trihalomethanes with any predetermined concentration of the
independent physico-chemical parameters in the sampled waters.
However, additional studies are recommended to enhance
reliability of interpolation and extrapolation of these
results.
Table 5: Regression Characteristics of Trihalomethanes andPhysico-Chemical Parameters of sampled drinkingwaters
VariablesRegressionCoefficient
(R2)
ANOVA Fvalues
Significant F
RegressionModel
x y
26
Temperature
Total MeanTrihalomethanes (TTHMs)
0.1826 0.6701* 0.4730 y = 3E-06x +0.0101
pHTotal MeanTrihalomethanes (TTHMs)
0.6038 4.5716** 0.1221 y =-2E-05x +
0.0103
TotalDissolvedSolids(TDS)
Total MeanTrihalomethanes (TTHMs)
0.5709 3.9909** 0.1396 y = 2E-06x +
0.0100
TotalOrganicMatter(TOC)
Total MeanTrihalomethanes (TTHMs)
0.6833 6.4718** 0.0844 y = 3E-05x +
0.0100
ResidualChlorine
Total MeanTrihalomethanes (TTHMs)
0.3980 1.9830** 0.2538 y = 3E-04x +
0.0101
NitratesTotal MeanTrihalomethanes (TTHMs)
0.2815 0.8689* 0.7874 y = 1E-05x +0.0102
Season(different weatherperiods)
Total MeanTrihalomethanes (TTHMs)
0.00163 0.0049ns 0.9486 y = 1E-05x +
0.0305
CONCLUSION
This study found Ahmadu Bello University treated drinking
water to be USEPA and EU compliant with respect to the
regulated THMs since the total mean trihalomethane (THM)
values were lower than the MCL (maximum permissible levels)
for the TTHMs stipulated by both USEPA and EU (and WHO)27
standards of 0.08mg/L and 0.1 mg/L respectively. However, the
mean of the total THM values were higher in all the treatment
segments and finished water (in the Booster station and
Household) than the Nigerian standard maximum permissible
limit of the compounds (0.001 mg/L). This requires a constant
effort to minimise the concentration of these DBPs in the
treated water by reducing the DBP precursors, through source
water protection from wastewater discharges from Samaru
village and effluent from waste dump behind Ramat/ICSA
hostels. Also, an uninterrupted flow of treated water in the
booster station and distribution mains will control the growth
of biofilms which add to the total organic carbon (TOC) when
these decompose into the system. Statistically, the range of
measured total mean trihalomethanes measured as TTHM4 showed
significant linear regression with temperature, pH, total
dissolved solids, total organic carbon, nitrates and the
residual chlorine of the sampled waters. These generated
predictive models which could be safely interpolated to
predict the levels of these regulated trihalomethanes at any
pre-determined conditions of these independent variables of
temperature, pH, total dissolved solids, total organic carbon,
28
nitrates and residual chlorine of the Ahmadu Bello University
treated drinking water during the sampling period. However,
care must be taken in extrapolating the results of these
models to the treated drinking water outside the sampling
period and indeed to other drinking water supplies unless
backed with additional sampling and assessment.
REFERENCES
Anon, (2001): Water Quality: Ambient Water QualityGuidelines for Organic Carbon; Prepared for theEnvironmental Protection Division Ministry ofEnvironment, Government of British Columbia, Canada,Updated August 7, 2001;http://www.env.gov.bc.ca/wat/wq/BCguidelines/orgcarbon/ocarbon_over.html Accessed on 5/10/2013.
Irish Environmental Protection Agency (IEPA) and HealthServices Executive (2011) Joint Position Statement:Trihalomethanes in Drinking Water, Nov. 2011http://www.hse.ie/eng/services/publications/services/Environmentalhealth/Joint%20Position%20Statement/%20Trihalomethanes%20in%20Drinking%20Water.pdf
Accessed on 19/6/2012
Jakubovics, N. S. (1998) Biofilms in Potable WaterDistribution Network. Ph.D Thesis, University ofWarwick, University of Warwick Publications,http://webcast.warwick.ac.uk/36980 Accessed on 13/10/2011
LeChevallier, M. W. (2000): Biofilms in Drinking WaterDistribution Systems: Significance and Control inIdentifying Future Drinking Water Contaminants. TheNational Academy Press.
29
Porter, H. (2002): Acid Rain Environment Pollution – SMILEProgramme Chemistry Index.http://mypages.iit.edu/~smile/cheminde.html
Accessed on 2/6/2002
Postel, S. L. (2000): Water and World Population Growth:Journal of American Water Works Association, April, 2000;Vol. 92:4, 131-138
Reiff, F. M. (1995): Balancing the Chemical and MicrobialRisks in the Disinfection of Drinking Water Supplies inDeveloping Countries. Proceedings of the Rome Symposium(September 1994) on Assessing and Managing Health Risksfrom Drinking Water Contamination; Approaches andApplications pp 23 – 30
Schoeny, R. (2010): Disinfection by-Products; A Question ofbalance. Environ. Health Perspect 118:a466-a467.Doi:10.1289/ehp.1003053 Nov 2010.
Shaibu-Imodagbe, E. M. (2011): Studies of Disinfection by-Products and Heavy Metals in Ahmadu Bello UniversityDrinking Water Supplies and Operations of Some TreatmentPlants; Unpublished Ph.D. Thesis submitted to theDepartment of Water resources and EnvironmentalEngineering and the School of Postgraduate Studies,Ahmadu Bello University, Zaria 153pp.
Standards Organization of Nigeria – SON (2007): NigerianStandard for Drinking Water Quality. Nigerian IndustrialStandard NIS 554: 2007. ICS 13.060.20
Stevens, A. A., Moore, L. A and Miltner, R. J. (1989):Formation and Control of Non-Trihalomethane
Disinfection By-Products. Journal of American WaterWorks Association, 81(8), 54-60.
United Nations University (UNU) International Network onWater, Environment and Health, (2001): Global WaterCrisis in UNU/INWEH Mc Master University, 1280 MainStreet, West Hamilton, Ontario L8S 4L8 Canada.
30
United States Environmental Protection Agency - USEPA, (1990).Risk Assessment, Management and Communication of DrinkingWater Contaminants, Seminar Publication EPA/625/4-89/024of June 1990 from the office of Research and Development,Washington, D.C. US EPA
USEPA (1997): Research Plan for Microbial Pathogens andDisinfection By-Products in Drinking Water. EPA 600-R-97-122. Office of research and Development, WashingtonDC, December.
USEPA, (1995): Methods for the Determination of OrganicCompounds in Drinking Water. Supplement III. EPA/600/R-95/131, Office of research and development, Washington DC20460, August.
Water Information and Security for Europe – WISE (2011):Drinking Water Directive: The Drinking Water
Directive (DWD), Council Directive 98/83/EC. The European13/02/Commission.http://ec.europa.eu/environment/water/water-drink/index_en.html Accessed on 13/02/2011
Wigle, D. T. (1998): Safe Drinking Water: A Public HealthChallenge. Chronic Dis Can 19:103-107
World Health Organization - WHO, (2005): Trihalomethanesin Drinking Water. Background document for developmentof WHO Guidelines for Drinking-water Quality; WHO/SDE/WSH/05.08/64 –English only, August 2005;http://www.who.int/water_sanitaion_health/dwq/chemicals/THM200605.pdf Accessed on 19/6/2012
World Health Organization - WHO (2008): Guidelines forDrinking Water Quality, 3rd Edition, incorporating thefirst and second Addenda, Vol. 1 – Recommendations. WHOGeneva, 2008http://www.who.int/water_sanitation_health/dwq/fulltext.pdf Accessed on 18/6/2012
31
Related Documents


