EVALUATION OF IRISH POTATO PRODUCTION AND MARKETING PERFORMANCE: A CASE STUDY OF MBEYA RURAL DISTRICT, MBEYA REGION, TANZANIA BY CATHERINE V. D. KABUNGO A DISSERTATION SUBMITTED IN PARTIAL FULFILMENT OF THE REQUIREMENTS FOR THE DEGREE OF MASTER OF SCIENCE IN AGRICULTURAL ECONOMICS OF SOKOINE UNIVERSITY OF AGRICULTURE. MOROGORO, TANZANIA. 2008

Welcome message from author
This document is posted to help you gain knowledge. Please leave a comment to let me know what you think about it! Share it to your friends and learn new things together.
Transcript
EVALUATION OF IRISH POTATO PRODUCTION AND MARKETING
PERFORMANCE: A CASE STUDY OF MBEYA RURAL DISTRICT,
MBEYA REGION, TANZANIA
BY
CATHERINE V. D. KABUNGO
A DISSERTATION SUBMITTED IN PARTIAL FULFILMENT OF THE
REQUIREMENTS FOR THE DEGREE OF MASTER OF SCIENCE IN
AGRICULTURAL ECONOMICS OF SOKOINE UNIVERSITY OF
AGRICULTURE. MOROGORO, TANZANIA.
2008
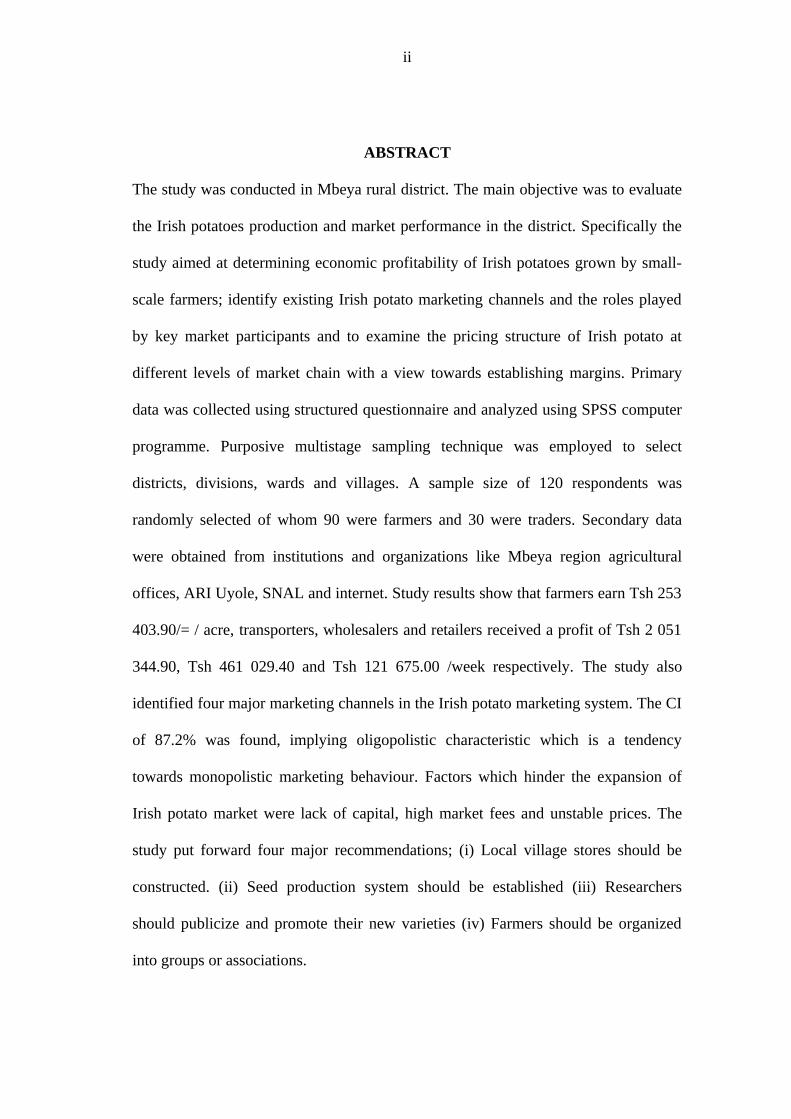
ABSTRACT
The study was conducted in Mbeya rural district. The main objective was to evaluate
the Irish potatoes production and market performance in the district. Specifically the
study aimed at determining economic profitability of Irish potatoes grown by small-
scale farmers; identify existing Irish potato marketing channels and the roles played
by key market participants and to examine the pricing structure of Irish potato at
different levels of market chain with a view towards establishing margins. Primary
data was collected using structured questionnaire and analyzed using SPSS computer
programme. Purposive multistage sampling technique was employed to select
districts, divisions, wards and villages. A sample size of 120 respondents was
randomly selected of whom 90 were farmers and 30 were traders. Secondary data
were obtained from institutions and organizations like Mbeya region agricultural
offices, ARI Uyole, SNAL and internet. Study results show that farmers earn Tsh 253
403.90/= / acre, transporters, wholesalers and retailers received a profit of Tsh 2 051
344.90, Tsh 461 029.40 and Tsh 121 675.00 /week respectively. The study also
identified four major marketing channels in the Irish potato marketing system. The CI
of 87.2% was found, implying oligopolistic characteristic which is a tendency
towards monopolistic marketing behaviour. Factors which hinder the expansion of
Irish potato market were lack of capital, high market fees and unstable prices. The
study put forward four major recommendations; (i) Local village stores should be
constructed. (ii) Seed production system should be established (iii) Researchers
should publicize and promote their new varieties (iv) Farmers should be organized
into groups or associations.
ii
DECLARATION
I, Catherine D. Kabungo, do hereby declare to the Senate of Sokoine University of
Agriculture that the work presented here is my own original work and has not been
submitted for a higher degree award in any other University.
_____________________ ____________________
Catherine V. D. Kabungo Date
(MSc candidate)
The above declaration is confirmed
_____________________ ____________________
M. E. Mlambiti (Prof) Date
_____________________ ____________________
A. A. A. Manyama Date
iii

COPYRIGHT
No part of this dissertation may be produced, stored in any retrieval system, or
transmitted in any form or by any other means without prior written permission of the
author or Sokoine University of Agriculture in that behalf.
iv
ACKNOWLEDGEMENT
I would like to express my sincere appreciation to all those who supported me
morally and materially during my study period. Special thanks go to; Presidents
Office, Public Service Management (POPSM) for sponsoring the whole of my MSc
(Agricultural Economics) course. I also gratefully acknowledge my supervisors
Professor M. E. Mlambiti and A. A. A. Manyama for their guidance, constructive
advice, valuable criticisms, insight and experience that contributed immensely to the
completion of this work and to the staff of the Department of Agricultural Economics
and Agribusiness who provided me with the necessary theoretical and analytical tools
that enabled me to accomplish this demanding task.
Thanks are also extended to my family particularly my husband David Kabungo for
his tireless support during the whole period of my studies. Thanks to my children
Ipyana, Victor and Kisa for being patient when I left them alone, also my sister and
her family for taking care of my daughter during my absence. Various relatives and
friends (Aaron, Sophia, Mwakasendo, Kimbi, Auguster, Agnes, Natalia, Mary and
Adela) to mention a few, who extended their best wishes, are also thanked. I also
thank my MSc colleagues, especially my classmates; it was wonderful to have you all
around.
Last but not least to the whole team of enumerators who assisted me in data collection
and to all respondents of this study, despite all the difficulties their co-operation was
so crucial in the accomplishment of this task.
v

DEDICATION
To my beloved Mum Rosalia Massawe and my daddy, the late Victor Massawe, I
pray that the Almightily God to rest his soul in peace. AMEN.
vi
TABLE OF CONTENTS
ABSTRACT........................................................................................................................... ii
DECLARATION.................................................................................................................iii
COPYRIGHT.......................................................................................................................iv
ACKNOWLEDGEMENT....................................................................................................v
DEDICATION......................................................................................................................vi
TABLE OF CONTENTS....................................................................................................vii
LIST OF TABLES...............................................................................................................xi
LIST OF FIGURES...........................................................................................................xiii
LIST OF APPENDICES....................................................................................................xiv
LIST OF ABBREVIATIONS.............................................................................................xv
CHAPTER ONE...................................................................................................................1
1.0 INTRODUCTION...........................................................................................................1
1.1 Background information.........................................................................................1
1.2 Problem statement and justification........................................................................4
1.3 Objectives ..............................................................................................................5
1.3.1 Main objective......................................................................................................................5
1.3.2 Specific objectives................................................................................................................5
1.3.3 Research questions...............................................................................................................5
CHAPTER TWO..................................................................................................................6
2.0 LITERATURE REVIEW...............................................................................................6
2.1 Definitions and marketing concepts.......................................................................6
2.2 Schools of marketing efficiency ............................................................................6
vii
2.2.1 The internal productive efficiency of marketing enterprises...............................................6
2.2.2 Market structure...................................................................................................................7
2.2.3 Market conduct....................................................................................................................8
2.2.4 Market performance.............................................................................................................8
2.2.5 Relationship between structure-conduct-performance models............................................9
2.3 Marketing channel theory.......................................................................................9
2.4 Market margins, price spread and share of consumers’ shillings.........................10
2.5 Irish potato production in Tanzania......................................................................11
2.6 Irish potato marketing in Tanzania ......................................................................13
2.7 Impact of infrastructure on market access............................................................14
CHAPTER THREE............................................................................................................15
3.0 METHODOLOGY OF THE STUDY..........................................................................15
3.1 Overview...............................................................................................................15
3.2 Conceptual framework..........................................................................................15
3.3 Description of the study area................................................................................18
3.4 Research design....................................................................................................18
3.5 Data collection and sources..................................................................................19
3.5.1 Primary data......................................................................................................................19
3.5.2 Secondary data ..................................................................................................................19
3.6 Study population and sampling procedure ..........................................................19
3.7 Sample size...........................................................................................................20
3.8 Tools for data analysis..........................................................................................20
3.8.1 Descriptive statistics..........................................................................................................20
3.8.2 Quantitative analysis.........................................................................................................21
3.8.2.1 Gross margin analysis ...................................................................................................21
3.8.2.2 Market concentration.....................................................................................................22
3.8.2.3 Market margin................................................................................................................23
3.8.2.4 Degree of interface pricing.............................................................................................24
viii
3.8.3 Limitations to the study methodology................................................................................25
CHAPTER FOUR...............................................................................................................26
4.0 RESULT AND DISCUSSIONS....................................................................................26
4.1 Overview...............................................................................................................26
4.2 Social economic characteristics of farmers..........................................................26
4.2.1 Respondents general characteristics.................................................................................26
4.2.1.1 Age................................................................................................................................26
4.2.1.2 Marital status..................................................................................................................27
4.2.1.3 Education.......................................................................................................................27
4.2.2 Land ownership..................................................................................................................28
4.2.3 Major sources of income....................................................................................................29
4.2.4 Source of labour ................................................................................................................29
4.3 Production aspects................................................................................................30
4.3.1 Fertilizer use .....................................................................................................................30
4.3.2 Use of fungicides................................................................................................................31
4.3.3 Type of seed used ..............................................................................................................32
4.3.4 Irish potato production and income statistics....................................................................32
4.2.5 Price setting in Irish potato market...................................................................................33
4.4 Agricultural support services................................................................................33
4.4.1 Credit facilities...................................................................................................................34
4.4.2 Access to extension services...............................................................................................34
4.4.3 Irish potato growers association.......................................................................................35
4.5 Constraints faced by Irish potato farmers.............................................................36
4.6 Marketing of Irish potato......................................................................................37
4.6.1 Characteristics of sample traders .....................................................................................37
4.6.2 Business activities done by Irish potato traders................................................................38
4.6.3 Source of capital for Irish potato trading..........................................................................39
4.6.4 Market information............................................................................................................39
4.6.5 Marketing channels for Irish potatoes...............................................................................40
ix
4.6.5.1 Farmers..........................................................................................................................42
4.6.5.2 Village traders/assemblers..............................................................................................43
4.6.5.3 Brokers...........................................................................................................................43
4.6.5.4 Wholesalers....................................................................................................................44
4.6.5.5 Travelling traders...........................................................................................................45
4.6.5.6 Retailers.........................................................................................................................45
4.6.5.7 Consumers /processors...................................................................................................45
4.7.1 Market structure and prices...............................................................................................46
4.7.2 Market transparency..........................................................................................................46
4.7.3 Barriers to market entry.....................................................................................................47
4.7.4 Market concentration index ..............................................................................................48
4.7.5 Market conduct .................................................................................................................49
4.8 Marketing margin analysis along Irish potato channel.........................................50
4.8.1 At farm level.......................................................................................................................50
4.8.2 At transporters’ level.........................................................................................................52
4.8.3 At wholesalers’ level..........................................................................................................52
4.8.4 At retailing level.................................................................................................................52
4.8.5 Market power distribution along Irish potato marketing channel.....................................53
4.9 Degree of interface pricing efficiency in Irish potato marketing.........................54
4.10 Problems faced by Irish potato traders and their possible solutions...................55
CHAPTER FIVE.................................................................................................................57
5.0 CONCLUSION AND RECOMMENDATION...........................................................57
5.1 Overview...............................................................................................................57
5.2 Conclusion............................................................................................................57
5. 3 Recommendations ...............................................................................................58
APPENDICES.....................................................................................................................70
x
LIST OF TABLES
Table 1: Mbeya Rural District: Summary of sampled household socio-economic
characteristics......................................................................................................................28
Table 2: Mbeya Rural District: Land ownership and uses..............................................29
Table 3: Mbeya Rural District: Income earning activities ..............................................29
Table 4: Mbeya Rural District: Source of labour for Irish potato production...............30
Table 5: Mbeya Rural District: Use of inputs in Irish potato production.......................31
Table 6: Mbeya Rural District: Irish potato production and income statistics..............33
Table 7: Mbeya Rural District: Who sets price?..............................................................33
Table 8 : Mbeya Rural District: Access to credit..............................................................34
Table 9: Mbeya Rural District: Access to extension services...........................................35
Table 10: Mbeya Rural District: Irish potato growers association.................................36
Table 11: Mbeya Rural District: Problems encountered by farmers in Irish potato
marketing.............................................................................................................................37
Table 12: Mbeya Rural District: Traders’ household characteristics ............................38
Table 13: Mbeya Rural District: Business activities.........................................................39
Table 14: Mbeya Rural District: Source of capital for Irish potato trading...................39
Table 15: Mbeya Rural District: Source of market information.....................................40
Table 16: Mbeya Rural District: Available marketing channels (N=88)........................41
Table 17: Mbeya Rural District: Market concentration index........................................49
Table 18: Mbeya Rural District: Irish potato returns at different market levels...........51
Table 19: Mbeya Rural District: Efficiency measures among marketing agents...........54
Table 20: Mbeya Rural district: Correlations analysis....................................................55
xi

Table 21: Mbeya Rural District: Problems facing Irish potato traders and their
possible solutions.................................................................................................................56
xii
LIST OF FIGURES
Figure 1: Irish potato production trend in Tanzania 1990 -2005....................................12
Figure 2: Irish potato yield trend in Tanzania 1990-2005................................................12
Figure 3: Area (1000 ha) under Irish potato cultivation in Tanzania, 1990 -2005.........13
Figure 4: Conceptual framework.......................................................................................17
Figure 5: Mbeya Rural District: Irish potato marketing channel...................................42
xiii
LIST OF APPENDICES
Appendix 1: Farmers’ questionnaire for the study; evaluation of Irish potato
production and marketing performance. A case of Mbeya rural district.....................70
Appendix 2: Traders’ questionnaire for evaluation of Irish potato production and
marketing performance. A case of Mbeya Rural District................................................75
Appendix 3: Mbeya Rural District: Irish potato returns at farm level...........................80
Appendix 4: Mbeya Rural District:Profit margin analysis for Irish potato transporters
..............................................................................................................................................80
Appendix 5: Mbeya Rural District: Profit margin at wholesalers’ level.........................81
Appendix 6: Mbeya Rural District: Profit margin analysis at retailers level.................81
xiv
LIST OF ABBREVIATIONS
ASARECA Association for Strengthening Agricultural Research in East and
Central Africa
ARI Agricultural Research Institute
CAN Calcium Ammonium Nitrate
CI Concentration Index
CIP International Potato Centre
DAP Diammonium Phosphate
GMA Gross Margin Analysis
Masl Meters Above Sea Level
MoAC Ministry of Agriculture and Cooperatives
MSc. Masters of Science
NGO Non Governmental Organization
NPK Nitrogen Phosphorus Potassium
POPSM Presidents Office Public Services Management
SACCOS Savings and Credit Cooperative Society
SH Southern Highland
SHZ Southern Highlands Zone
SNAL Sokoine National Agricultural Library
Tsh Tanzanian Shilling
TSP Triple Super Phosphate
URT United Republic of Tanzania
WPC Western Potato Council
xv
CHAPTER ONE
1.0 INTRODUCTION
1.1 Background information
Irish potato is one of mankind’s most valuable food crops in the world with
annual production volume of 347 metric million tones, produced in an estimated
area of 18.9 million hectares (FAOSTAT, 2004). It ranks fourth in the world as
food crop after maize, rice, and wheat (FAOSTAT, 2004). Among root crops Irish
potato ranks first in terms of volume produced and consumed followed by
cassava, sweet potato and yams, and provides roughly half of the world’s annual
output of all roots and tubers, making it the largest non cereal food and cash crop
world wide (FAOSTAT, 2004). It contributes energy and substantial amounts of
high quality protein and essential vitamins, minerals and trace elements to the diet
(Horton, 1987). A single medium-sized Irish potato contains about half the daily
adult requirement of vitamin C, very low in fat (about 5 percent of the fat content
of wheat), more protein, and twice calcium than maize (Horton, 1987; Dean,
1994; McGlynn, 2007).
Moreover Irish potato crop provides more nutritious food per unit land in less time and
often under more adverse condition than other food crops (FAO, 2006). It is one of the
most efficient crops in converting natural resources, labour and capital into a high quality
food with wide consumer acceptance (Horton, 1980; FAO, 2006). For low-income people
in both urban and rural areas, “Irish potato is a buried treasure” It grows fast, it's
adaptable, high yielding and responsive to low inputs (FAO, 2006).
Irish potato is important crop in developing countries (FAO, 2006). More than one-third
of the global Irish potato output comes from developing countries including Asia (China,
1
India, Indonesia, Nepal, Pakistan countries) and Africa (Cameroon, South Africa, Kenya,
Uganda, Egypt, Algeria, Morocco, and Tanzania) (CIP, 1983 ; Okoboi and Ferris, 2002).
According to FAOSTAT (2007) consumption in developing countries increased from 9
kg per capita in 1961-63 to 14 kg per capita in 1995-97. Major producing countries in
Africa are Egypt, Algeria, South Africa and Morocco, which produces 65% of the total
world production (Okoboi, 2001).
In Tanzania, Irish potato is becoming an important cash and food crop (Kelly, 2006).
Since its introduction, production trends have been increasing positively (FAOSTAT,
2007). Irish potato was introduced in Tanzania during 1920s by German mission in the
Southern Highlands (SH) of Tanzania where local farmers began its cultivation in small
scale gardens (Jakobsen and Mallya, 1976; Macha et al., 1982). Irish potatoes are
generally grown in areas between 1 800 and 2 700 meters above sea level (masl), the
highest producers in Tanzania being the Southern Highland Zone (SHZ), particularly
Iringa and Mbeya regions (Macha et al ., 1982).
According to Mayona (1991) 90% of Irish potato is produced by smallholder farmers in
the SHZ where it is used as food and source of income and considered as potential as
maize, rice and wheat in the region. Other areas which grow Irish potato in Tanzania are
West Kilimanjaro, Arusha, Mara and Kagera regions, and west of Lake Nyanza near the
Ugandan border (Macha et al., 1982). About 116 277 metric tones (equivalent to 58 % of
total country production) of Irish potato is produced in SH regions, which cover about 16
609 hectares, while about 70 413 metric tones (equivalent to 35% of total country
production) is produced in the Northern highland regions (Kilimanjaro and Arusha)
covering an area of about 10 058 hectares (MoAC, 2001; URT, 2003). Minor production
occurs in Mara, Tanga, Kigoma, Rukwa, and Ruvuma Regions (Macha et al., 1982).
2
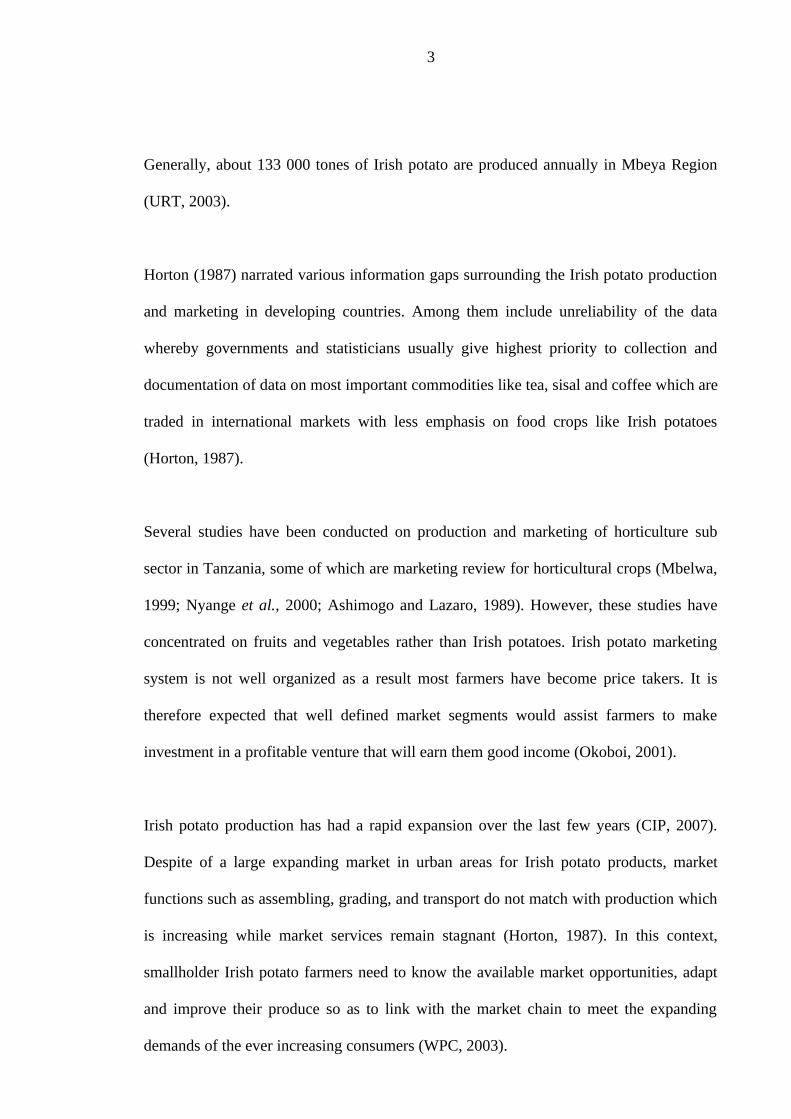
Generally, about 133 000 tones of Irish potato are produced annually in Mbeya Region
(URT, 2003).
Horton (1987) narrated various information gaps surrounding the Irish potato production
and marketing in developing countries. Among them include unreliability of the data
whereby governments and statisticians usually give highest priority to collection and
documentation of data on most important commodities like tea, sisal and coffee which are
traded in international markets with less emphasis on food crops like Irish potatoes
(Horton, 1987).
Several studies have been conducted on production and marketing of horticulture sub
sector in Tanzania, some of which are marketing review for horticultural crops (Mbelwa,
1999; Nyange et al., 2000; Ashimogo and Lazaro, 1989). However, these studies have
concentrated on fruits and vegetables rather than Irish potatoes. Irish potato marketing
system is not well organized as a result most farmers have become price takers. It is
therefore expected that well defined market segments would assist farmers to make
investment in a profitable venture that will earn them good income (Okoboi, 2001).
Irish potato production has had a rapid expansion over the last few years (CIP, 2007).
Despite of a large expanding market in urban areas for Irish potato products, market
functions such as assembling, grading, and transport do not match with production which
is increasing while market services remain stagnant (Horton, 1987). In this context,
smallholder Irish potato farmers need to know the available market opportunities, adapt
and improve their produce so as to link with the market chain to meet the expanding
demands of the ever increasing consumers (WPC, 2003).
3
1.2 Problem statement and justification
Agricultural marketing plays fundamental role in the development process. Marketing
process integrates the farming community into the national economy through
communication and exchange. Agricultural marketing has a great potential in creating
employment opportunities, increasing production and distribution of income by involving
majority of people, reducing unemployment and fostering national security (Matola,
2005).
Several studies have been conducted on the Irish potato production and marketing in
Tanzania. Some of which are Mussei et al. (2000) who studied the adoption of improved
potato production technologies in Njombe district, Mwakasendo, et al. (2007) who
assessed market for fresh and frozen potato chips in the ASARECA region and potential
for regional trade the case of in Tanzania, Mayona (1991) who assessed potato
production potentials and constraints in the SHZ and Okoboi, (2001) who studied potato
production and marketing in Tanzania and the market opportunities for Rwanda.
However, these studies had scanty information on the production and marketing
performance. Therefore little is known about the general performance of the Irish potato
marketing chain in Tanzania and its contribution to total household income, leave alone
the specific problems that face the industry. This study was therefore an attempt to fill
that gap. Inadequate market information, especially on prices is a major obstacle to the
performance of marketing and production system (Mlambiti, 1999). The level of state
intervention in other food markets such as fruits, vegetables, roots and tuber was less
wide spread (Ponte, 2002).
This study aimed at determining an economic profitability of Irish potato grown by
small-scale farmers, identified existing Irish potato marketing channels and the roles
4
played by various market participants and determined the pricing structure at different
levels of Irish potato market chain with the purpose of establishing marketing margins
and producers share of a consumer shilling. Results of this study will help to provide
market information to various stakeholders in Irish potato sub sector and possibly help to
improve income and enhance poverty reduction of farmers’ households.
1.3 Objectives
1.3.1 Main objective
The main objective of the study was to evaluate the Irish potatoes production and
marketing performance in Mbeya rural district
1.3.2 Specific objectives
The specific objectives include:
1. To determine economic profitability of Irish potato grown by small-scale farmers.
2. To identify existing Irish potato marketing channels and the roles played by key
market participants.
3. To examine the pricing structure of Irish potato at different levels of market chain
4. To establish margins at different levels of Irish potato marketing chain
1.3.3 Research questions
1. How profitable is Irish potato production enterprise to small scale producers?
2. What are the existing Irish potato marketing channels and the roles played by
market participants over different market chain?
3. What is the existing pricing structure of Irish potato at different levels of market
chain?
4. What are the marketing margins at different levels of Irish potato marketing
chain?
5
CHAPTER TWO
2.0 LITERATURE REVIEW
2.1 Definitions and marketing concepts
Marketing is defined as the process of planning and executing the conception, pricing,
promotion and distribution of ideas, goods, services, organizations and events to create
exchange that will satisfy individual and organizational objectives (Mlambiti, 1999).
Marketing may also be defined as the process of creating form, time and space utility
(Kohls and Uhls, 1990). Agricultural marketing refers to the performance of all business
activities involved in the flow of goods and services from the point of initial agricultural
production to the ultimate consumer (Kohls and Uhls, 1990). Dixie (1989) defines
agricultural marketing as series of services involved in moving a product from the point
of production to the point of consumption.
Marketing concepts and techniques apply not only for profit organization but also non
profit oriented businesses (Kohl and Uhls, 1990). However, marketing of agricultural
products is a major problem for smallholder farmers in most of sub-Saharan Africa
(Kusina N. T. and Kusina, J. 2001). Inadequate marketing information, especially on
prices is a major obstacle to the performance of any market system and to the production
system of the sector (Mlambiti, 1999).
2.2 Schools of marketing efficiency
2.2.1 The internal productive efficiency of marketing enterprises
This is the measure of economic efficiency at firm level and is a combination of technical
and operational efficiency (Scarborough and Kydd, 1992). It is a good theoretical
framework for measuring costs and analyzing the efficiency of individual firms. Under
this school, the method of descriptive analysis of accounting data is commonly used
6
because data for that purpose are relatively more available. In this study, the structure-
conduct- performance model is used to assess the marketing efficiency because it
provides well developed framework for examining behavior of imperfectly competitive
markets (Scarborough and Kydd, 1992). The model emphasizes the relationship between
functionary similar firms and their market behaviour as a group.
2.2.2 Market structure
Market structure refers to the organizational characteristics of a market that influences the
nature of competition and pricing mechanisms within the market (Scarborough and
Kydd, 1992). Structural characteristics may be used as a basis to classify markets.
Markets may be competitive (presence of a large enough number of firms that none can
individually influence the price they receive by changing the volume of goods or
services), monopolistic (in which there are many firms each producing slightly
differentiated products) or oligopolistic (in which there are only a few firms each of
which controls a large share of the market) (Pomeroy and Trinidad, 1995).
The common measures of efficiency of the component are the degree of concentration,
market transparency, information barrier to market entry and product differentiation
(Schmidt, 1999). Performance is expected to be satisfactory under the following
conditions: If sufficient number of buyers and sellers exist to provide alternative outlet
without one of them having the market power to dominate others. If market transparency
with regard to product quality, variety, grades and prices is given and no serious barriers
to market entry and exit (Scarborough and Kydd, 1992).
7
2.2.3 Market conduct
This is one of the determinants of performance of the marketing system. Market conduct
refers to the pattern of behaviour that firms follow in adopting or adjusting to the markets
in which they sell or buy (Pomeroy and Trinidad, 1995). There are two closely
interrelated aspects of market conduct; one is the manner in which devices and
mechanisms by which different sellers coordinate their intrinsically rivals decisions and
actions. The second aspect concerns the characteristics of pricing policy that sellers in the
industry adopt (Pomeroy and Trinidad, 1995). Market conduct can be assessed in terms
of individual or collective aims or goals that different sellers pursue as they determine
selling prices, their sales promotion outlays and the design and qualities of their products
(Scott, 1995). Analysis of market conduct entails an examination of i) buying and selling
behavour of various markets participants ii) forms which completion amongst them takes
(pricing terms of payment and credit) iii) level of activity and iv) actions to avoid
collusion (Scarborough and Kydd, 1992).
2.2.4 Market performance
This refers to the impact of the structure and conduct as measured in terms of variables
such as prices, costs and volumes of outputs (Pomeroy and Trinidad, 1995). By analyzing
level of marketing margins and their cost components, it is possible to evaluate the
impact of the structure and conduct characteristics on market performance (Anderson et
al., 2004). It is generally knowledgeable that a distribution system displaying acceptable
performance is the one that allows technological progress, has the ability to adopt,
innovate and utilize resources efficiently and to transmit prices that reflect costs (OECD,
1982). Common indicators of performance are trends in retail price level of stability of
farm prices and income spread of marketing margins, marginal propensity to consumer
and farmers’ share of the customers’ shillings spent on agricultural product, middlemen
8
profit, party farm prices (Kohls and Uhl, 1990). Analysis under this concept normally
includes evaluation of operational technical and pricing efficiency (Ellis, 1992).
2.2.5 Relationship between structure-conduct-performance models
According to Schmidt (1999) the market structure determines market conduct, the
behaviour of economic agents within the environment and thereby sets the level of
market performance. The structure conduct performance framework suggests that
relationships exist between structural characteristics of a market and the behavior of
market participants and that their behavior in turn influences the performance of the
market (Scarborough and Kydd 1992; Scott 1995).
2.3 Marketing channel theory
The marketing channel is the trade or distribution channel and is defined as a set of
interdependent organizations involved in the process of making a product or service
available for consumption or user (Stern et al., 1996). The channel follows a vertical
structure where products flow from producer to the ultimate consumer and in which
actors meet each other at markets. Producers, wholesalers and retailers as well as other
channel actors exist in channel arrangements to perform marketing functions (business
activities) that contribute to the product flow. Actors that stand between producers and
final users are known as intermediaries (Eskola, 2005).
The analysis of marketing channels is intended to provide a systematic knowledge of the
flow of goods and services from their original producer to their final destination
(consumers) (Mendoza, 1995). This knowledge is acquired by studying the participants in
the process i.e. those who perform physical marketing functions in order to obtain
economic benefits (Mendoza, 1995). In carrying out these functions, marketing agents
achieve both personal and social goals. They earn a personal financial reward by
9
performing an activity desired by the society. Also they add value to production and in so
doing they satisfy consumers needs (Kotler, 1997).
Nyange (1993) identified Irish potato marketing channel to consist of producers, truckers,
wholesalers, retailer hawkers and consumers. On the other hand, Ferris et al. (2002)
reported marketing channel of Irish potato in Uganda to consist of farmers (producers),
village traders, urban brokers, wholesalers, urban retailers and consumers and processors.
2.4 Market margins, price spread and share of consumers’ shillings
Investigating marketing margins is of great importance because of the impact of
intermediary market participants upon the prices paid by consumers and that received by
the producers (Smith, 1992; Wohlgenant, 2001). Research studies on margins and price
spreads in Tanzania are lacking especially as far as the Irish potato production sector is
concerned. This section reviews findings of such studies. Nyange (1993) revealed that
largest margins were found among hawkers and the smallest margins were observed at
retail and wholesale Irish potato market levels, but no reasons were given. The author
found that producer’s share of consumer’s shilling ranged from 36 to 42 cents but he
didn’t focus on monitoring costs of a few selected market participants over a period of
time.
Ferris et al. (2002) found that transporters (truckers) get more than 35% net margin,
wholesalers earn a net margin of 9.5% and retailers get an average net margin of 12.3%
per 100 kg bag of Irish potatoes. However, Tomek and Robinson (1991) cautions that
increase in the share of consumer shilling is not an indicator that farmers are better off,
nor is a decline in the share of consumer shillings is an indicator that farmers are worse
off and marketing firms are performing poorly. Prices spread provide only a starting
10
point in an attempt to evaluate the performance of the food industry. Therefore Tomek
and Robinson (1991) argue that the measure of efficiency and profit earned must be
examined to determine whether or not margins are excessive. In this study, the market
margin analysis will be employed to make comparison of prices at different levels of
market chain.
2.5 Irish potato production in Tanzania
Tanzania enjoys a wide diversity of agro - climatic conditions suitable for a wide range of
both tropical and subtropical horticultural product (Nyange et al., 1997). Production of
Irish potato in Tanzania is fairly well distributed in areas with tropical and sub tropical
climatic conditions (Nyange, 1993). The crop is socio economically important to both
travelers and traders. Resource poor farmers prefer growing Irish potato because of its
short maturity period and can be grown throughout the year. Maize crop in high altitudes
take about ten to twelve months to reach maturity, the period which might have been
used by two cycles for Irish potato production (Haugwitz and Thowart, 1972).
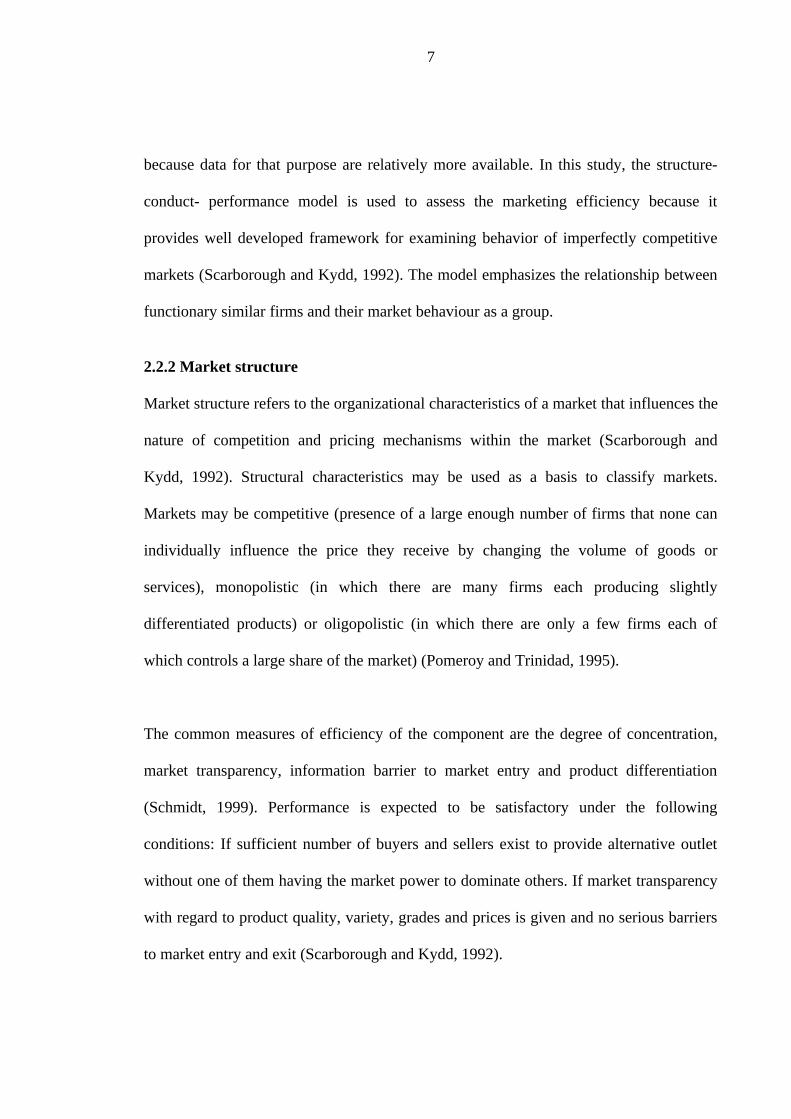
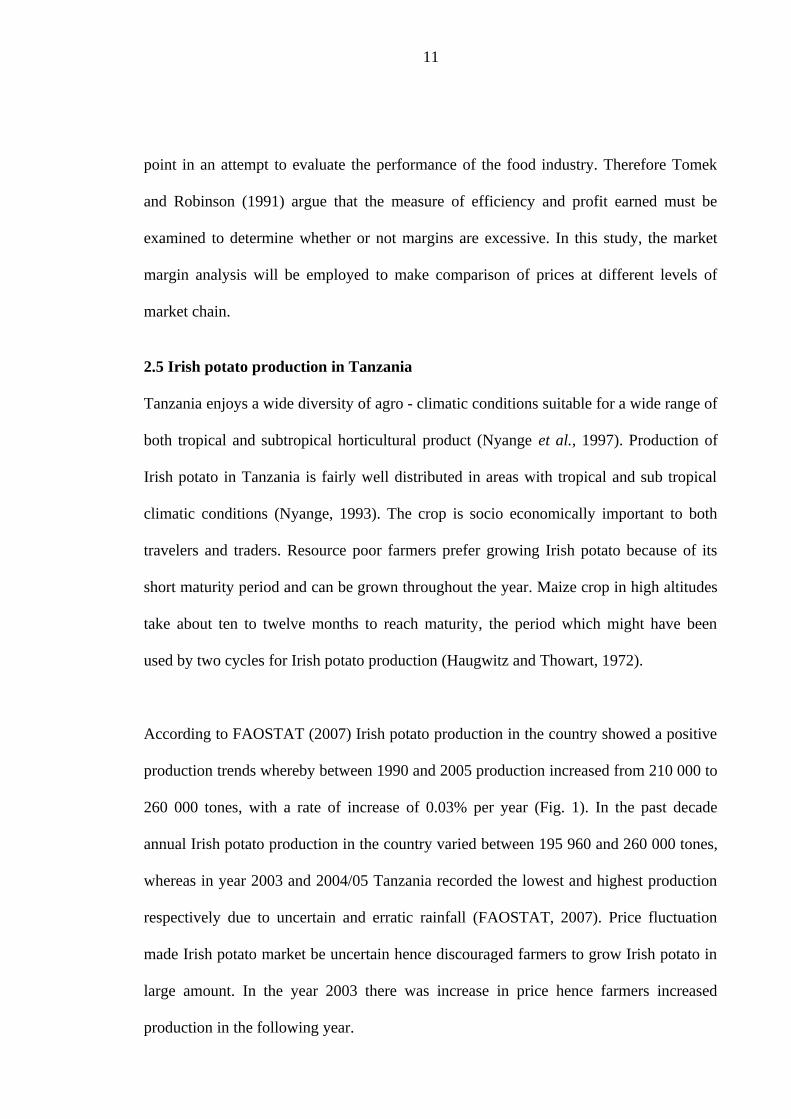
According to FAOSTAT (2007) Irish potato production in the country showed a positive
production trends whereby between 1990 and 2005 production increased from 210 000 to
260 000 tones, with a rate of increase of 0.03% per year (Fig. 1). In the past decade
annual Irish potato production in the country varied between 195 960 and 260 000 tones,
whereas in year 2003 and 2004/05 Tanzania recorded the lowest and highest production
respectively due to uncertain and erratic rainfall (FAOSTAT, 2007). Price fluctuation
made Irish potato market be uncertain hence discouraged farmers to grow Irish potato in
large amount. In the year 2003 there was increase in price hence farmers increased
production in the following year.
11
0
50
100
150
200
250
300
1990 1991 1992 1993 1994 1995 1996 1997 1998 1999 2000 2001 2002 2003 2004 2005
Years
To
nn
es
Production quantity(1000tonnes) |Potatoes
Figure 1: Irish potato production trend in Tanzania 1990 -2005
Source: FAOSTAT, 2007
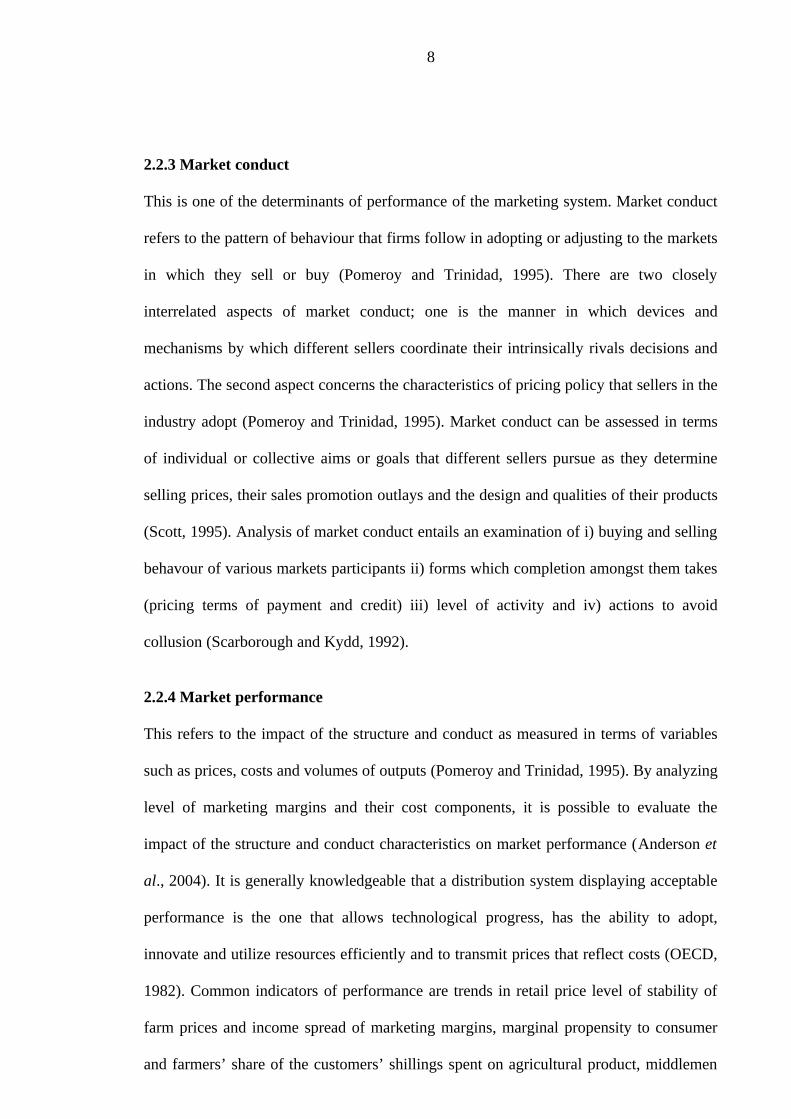
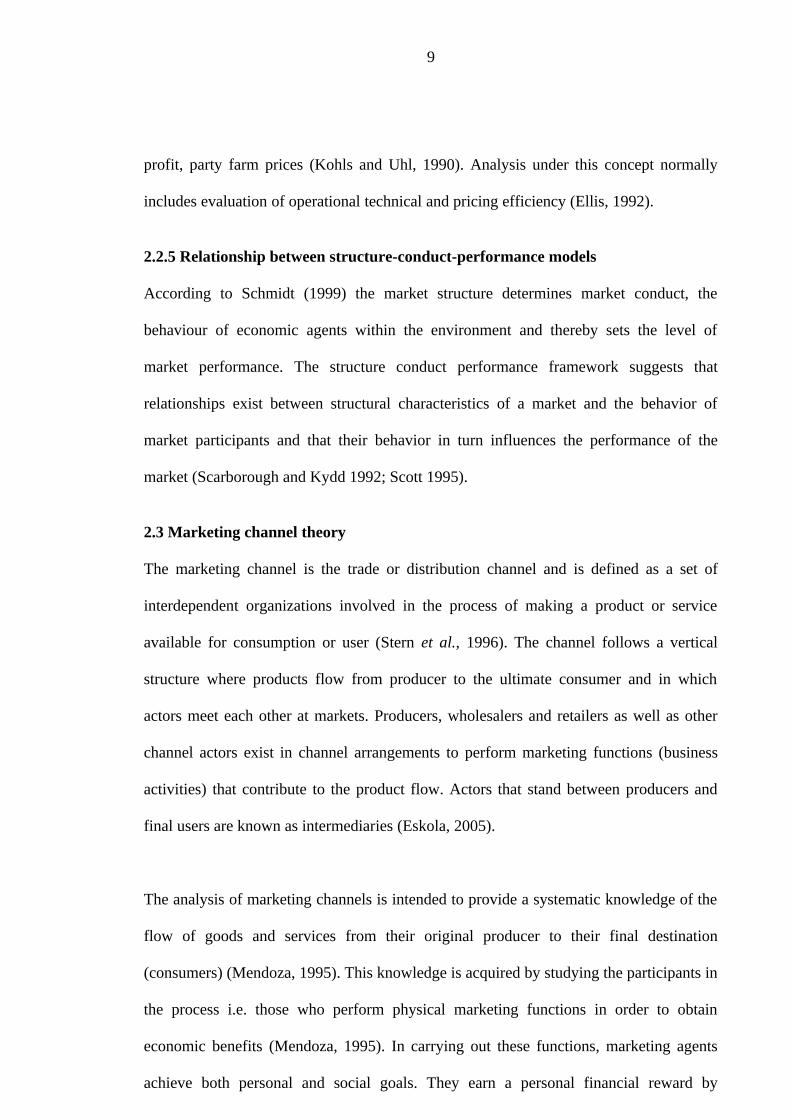
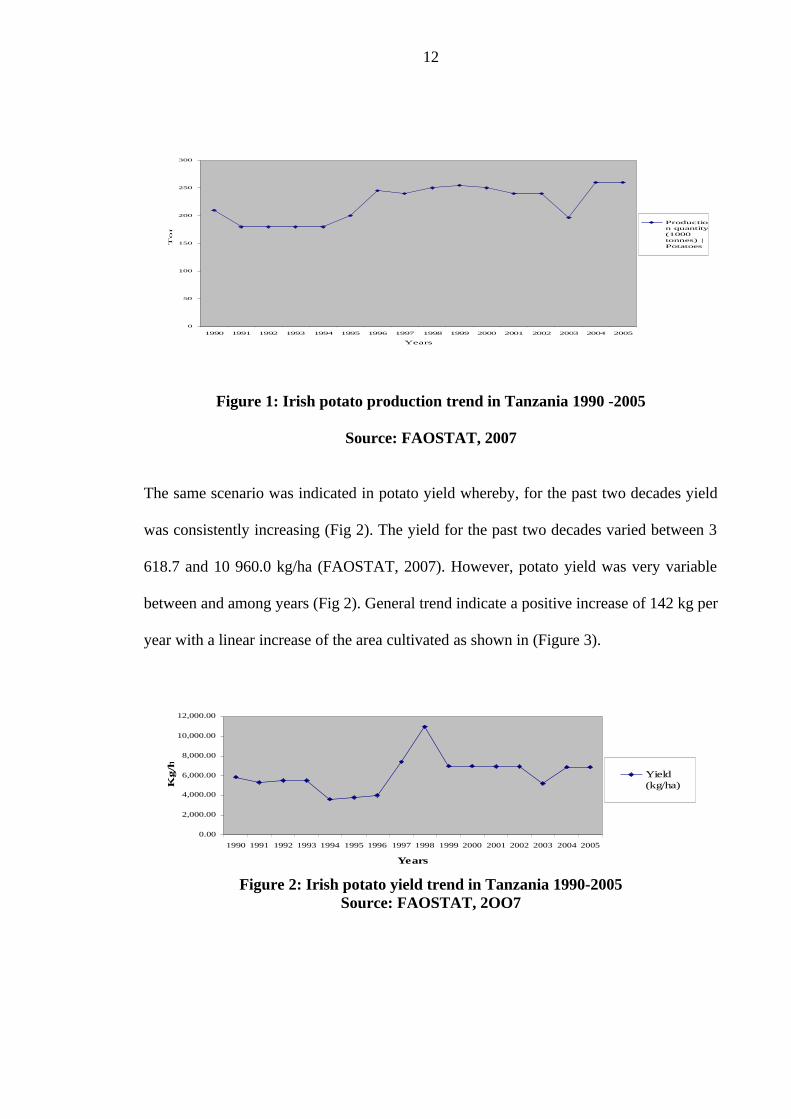
The same scenario was indicated in potato yield whereby, for the past two decades yield
was consistently increasing (Fig 2). The yield for the past two decades varied between 3
618.7 and 10 960.0 kg/ha (FAOSTAT, 2007). However, potato yield was very variable
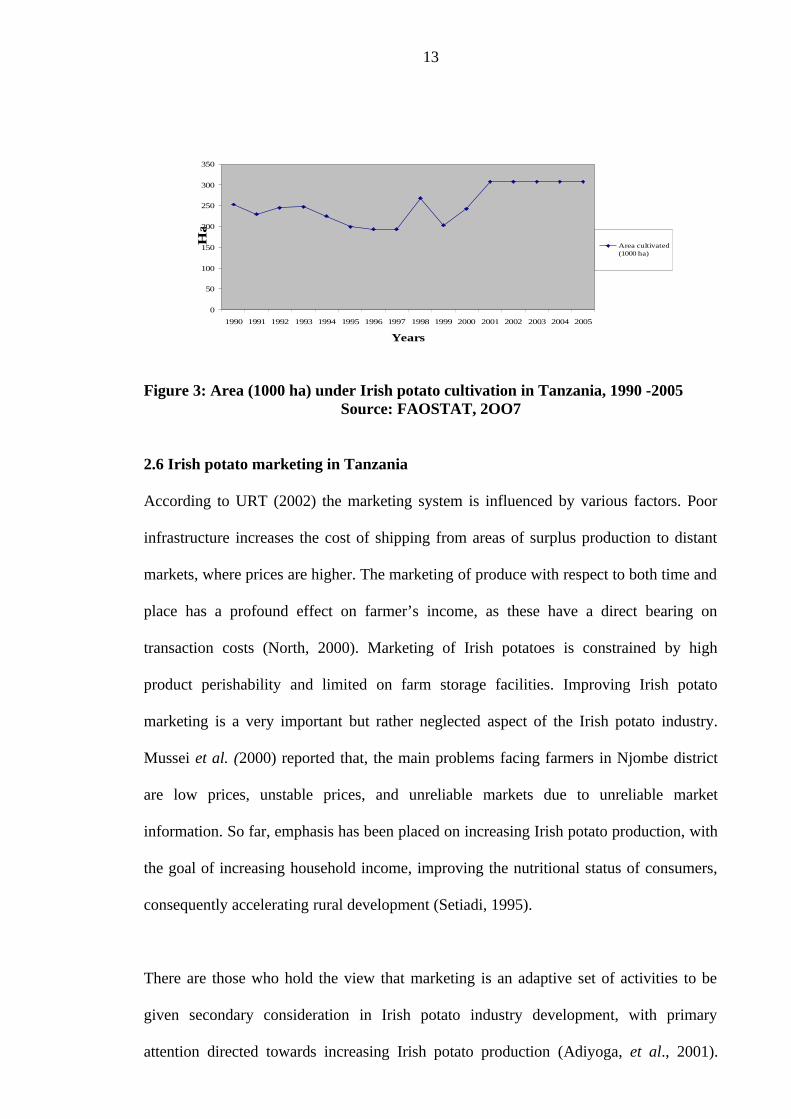
between and among years (Fig 2). General trend indicate a positive increase of 142 kg per
year with a linear increase of the area cultivated as shown in (Figure 3).
Figure 2: Irish potato yield trend in Tanzania 1990-2005Source: FAOSTAT, 2OO7
0.00
2,000.00
4,000.00
6,000.00
8,000.00
10,000.00
12,000.00
1990 1991 1992 1993 1994 1995 1996 1997 1998 1999 2000 2001 2002 2003 2004 2005
Years
Kg/h
a
Yield(kg/ha)
12
0
50
100
150
200
250
300
350
1990 1991 1992 1993 1994 1995 1996 1997 1998 1999 2000 2001 2002 2003 2004 2005
Years
Ha
Area cultivated(1000 ha)
Figure 3: Area (1000 ha) under Irish potato cultivation in Tanzania, 1990 -2005Source: FAOSTAT, 2OO7
2.6 Irish potato marketing in Tanzania
According to URT (2002) the marketing system is influenced by various factors. Poor
infrastructure increases the cost of shipping from areas of surplus production to distant
markets, where prices are higher. The marketing of produce with respect to both time and
place has a profound effect on farmer’s income, as these have a direct bearing on
transaction costs (North, 2000). Marketing of Irish potatoes is constrained by high
product perishability and limited on farm storage facilities. Improving Irish potato
marketing is a very important but rather neglected aspect of the Irish potato industry.
Mussei et al. (2000) reported that, the main problems facing farmers in Njombe district
are low prices, unstable prices, and unreliable markets due to unreliable market
information. So far, emphasis has been placed on increasing Irish potato production, with
the goal of increasing household income, improving the nutritional status of consumers,
consequently accelerating rural development (Setiadi, 1995).
There are those who hold the view that marketing is an adaptive set of activities to be
given secondary consideration in Irish potato industry development, with primary
attention directed towards increasing Irish potato production (Adiyoga, et al., 2001).
13
However, markets do not develop automatically, and the lack of a well-functioning
market can increase risks and costs for farmers and other market participants (Adiyoga,
et al., 2001). There may be a need for positive action by public agencies to provide some
of the basic services and create an environment conducive to efficient marketing of Irish
potato. There is also a question of whether spontaneous development of marketing firms,
in the absence of facilitating policies and programs, will provide efficient and equitable
linkages between producers and consumers (Hayami and Kawagoe, 1993).
2.7 Impact of infrastructure on market access
Market infrastructures can be classified as hard (such as roads) and soft (such as access
to credit, extension services, marketing information, security, risk bearing and
agricultural inputs (IFAD, 2001). A well functioning infrastructure is critically important
to efficient agricultural marketing (IFAD, 2001; Escola, 2005).The presence of good
infrastructure is expected to increase the efficiency of both marketing and production as
they reduce transaction costs and ensure more competitive pricing conditions in
marketing than would occur in their absence (Minten and Kyle, 1995). Thus, regardless
of their nature both types, hard and soft, have a significant impact on market access by
farmers.
14
CHAPTER THREE
3.0 METHODOLOGY OF THE STUDY
3.1 Overview
This chapter presents the methodology used in this study. It covers the conceptual
framework governing the study, description of the study area, study design, data
collection and sources, study population and sampling procedure, sample size, tools of
data analysis and study limitations.
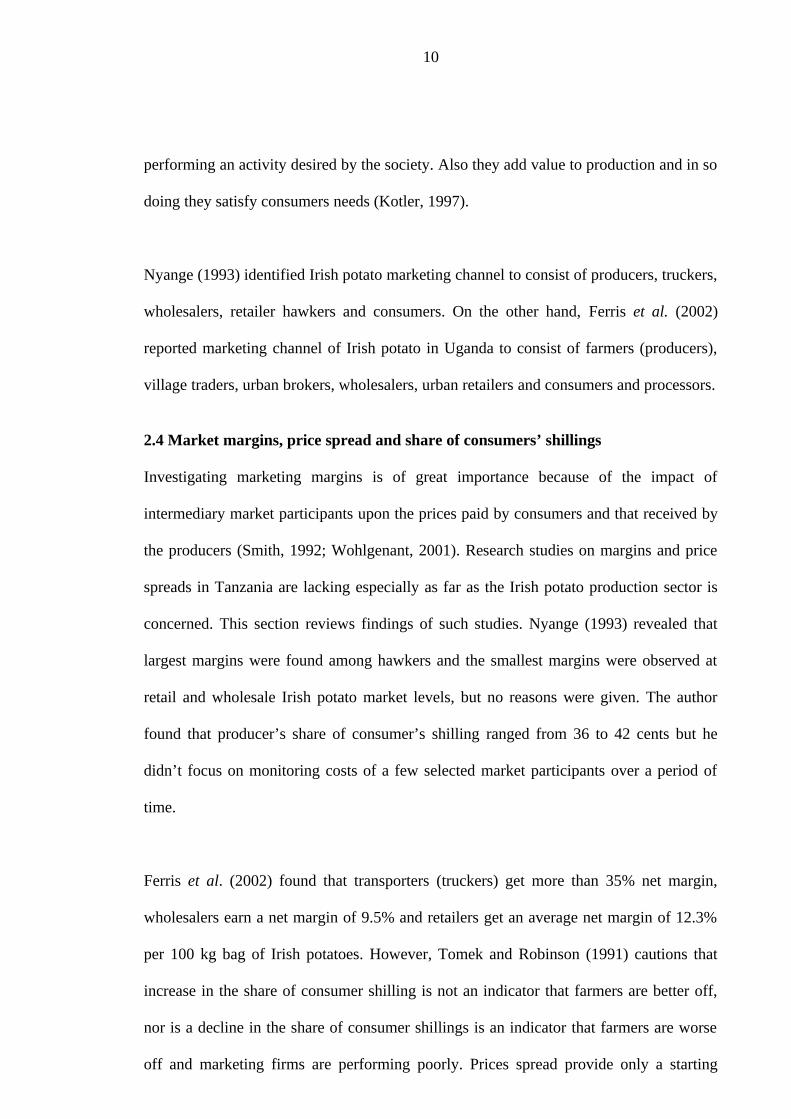
3.2 Conceptual framework
Conceptual or analytical frameworks of market performance and the way in which the
markets are structured are essential guidelines in identifying important variables for
effective and efficient data collection. Scarborough and Kydd (1992) stress that such
framework should help to indicate the most useful area(s) in which to focus, limited
research resources and ensure that data collected is relevant to the objective of research.
There are three factors that are important in determining the production and market
channels of Irish potato (Fig.4).
The first factor is the ability of supplier to offer produce that will meet the demand of
different end users. This in turn to a great extent is influenced by household endowment
of factors of production mainly labour, land, and capital which jointly play a central role
in agriculture production in Tanzania. Access to production technologies in terms of
fertilizers, improved seeds and pesticides will also determine the level of production of
various factors of production. Access to credit facility may also ease off rural households
capital constraints. These factors all together affect the amount and rate of produce to be
supplied which in turn affect the market efficiency.
15
The second factor is analysis of market efficiency by using market structure conduct and
performance. Under market structure the organization of market was studied by
identifying Irish potato market functionaries and their roles in providing product with
place, form and time utility. The market channel and information transparency was
examined to trace the movement of Irish potato from point of production to consumption.
Concentration index and market barrier was also determined. Market conduct was
studied by looking at the behavioural characteristics of market participants by examining
Irish potato production pricing aspects as well as existence of organization among Irish
potato market participants. Market performance which is the impact of structure and
conduct was measured in terms of prices, cost and volume of outputs. This was measured
by analyzing the level of margins and their cost components.
The third part is the consumer who buys the product in form that satisfies his/her
demand. Prices set by market agents influences consumers demand. High demand of
consumer results into higher prices of the product and therefore better margins of traders
and producer.
16
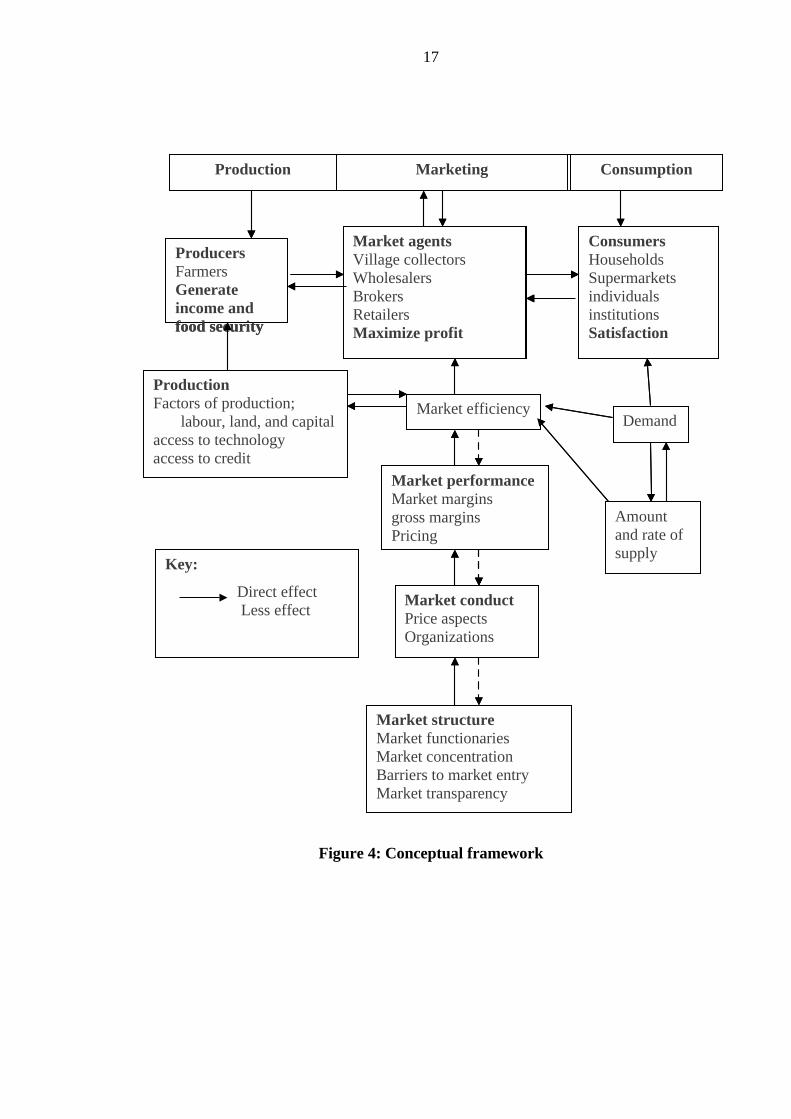
Figure 4: Conceptual framework
Production ConsumptionMarketing
ProducersFarmersGenerate income and food security
Market agentsVillage collectorsWholesalersBrokersRetailersMaximize profit
ConsumersHouseholdsSupermarketsindividualsinstitutionsSatisfaction
ProductionFactors of production; labour, land, and capital
access to technologyaccess to credit
Market efficiencyDemand
Market structureMarket functionariesMarket concentrationBarriers to market entryMarket transparency
Amount and rate of supply
Market conductPrice aspectsOrganizations
Market performanceMarket marginsgross marginsPricing
Key:
Direct effect Less effect
17
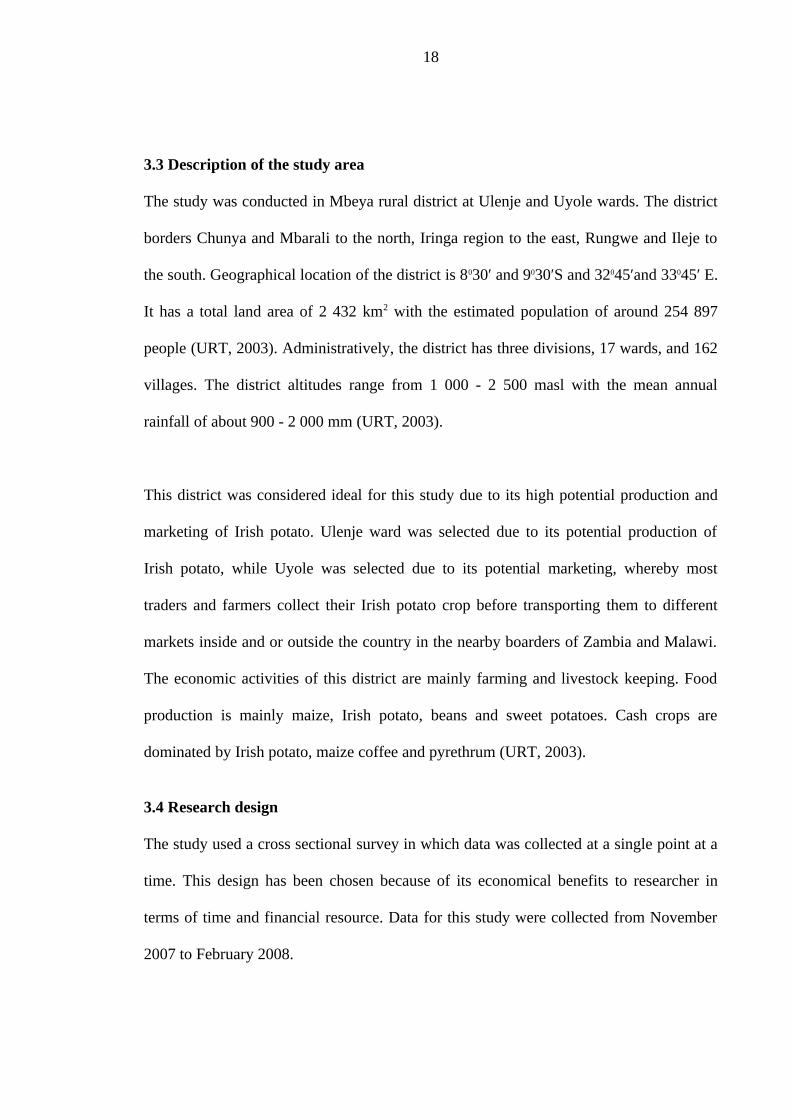
3.3 Description of the study area
The study was conducted in Mbeya rural district at Ulenje and Uyole wards. The district
borders Chunya and Mbarali to the north, Iringa region to the east, Rungwe and Ileje to
the south. Geographical location of the district is 8030′ and 9030′S and 32045′and 33045′ E.
It has a total land area of 2 432 km2 with the estimated population of around 254 897
people (URT, 2003). Administratively, the district has three divisions, 17 wards, and 162
villages. The district altitudes range from 1 000 - 2 500 masl with the mean annual
rainfall of about 900 - 2 000 mm (URT, 2003).
This district was considered ideal for this study due to its high potential production and
marketing of Irish potato. Ulenje ward was selected due to its potential production of
Irish potato, while Uyole was selected due to its potential marketing, whereby most
traders and farmers collect their Irish potato crop before transporting them to different
markets inside and or outside the country in the nearby boarders of Zambia and Malawi.
The economic activities of this district are mainly farming and livestock keeping. Food
production is mainly maize, Irish potato, beans and sweet potatoes. Cash crops are
dominated by Irish potato, maize coffee and pyrethrum (URT, 2003).
3.4 Research design
The study used a cross sectional survey in which data was collected at a single point at a
time. This design has been chosen because of its economical benefits to researcher in
terms of time and financial resource. Data for this study were collected from November
2007 to February 2008.
18
3.5 Data collection and sources
3.5.1 Primary data
The primary data from the sampled farmers and traders were collected through formal
survey by using a structured questionnaire. The questionnaire was pre-tested before the
main survey to check the relevance of questions and to determine whether it was
comprehensive enough to collect the required information. The information collected
included household general characteristics, household source of income, and crop
production including quantity produced, costs of production, labour and use of farm
inputs. Other information was quantity of produce handled in various markets, buying
and selling prices, marketing costs.
3.5.2 Secondary data
Secondary data were collected from Mbeya rural district council offices and wards. Data
from Mbeya rural district council were mainly on the social economic profile for the
district and the Mbeya region at large. Information from the wards was on the number of
the Irish potato farmers and traders their performance and the mode of the contract in the
study area. More secondary data were obtained from relevant institutions and
organizations like Mbeya region agricultural offices, Sokoine National Agriculture
Library (SNAL) and internet.
3.6 Study population and sampling procedure
The target population of the study was Irish potato producers and traders. Purposive
multistage sampling technique was employed to select districts, divisions, wards and
villages. Respondents were randomly selected from three villages. Random sampling
procedure was used to reduce biasness due large number of farmers available in study
area.
19
3.7 Sample size
A total of 120 respondents were obtained and interviewed for this study being 90 farmers
and 30 traders. Although sample size was limited to 120 it was sufficient enough to allow
for statistical analysis. Usually the sample size depends on the size of the population to be
sampled although general rule were hard to make without knowledge of specific
population. Thirty cases seem to be minimal for studies in which statistical data analysis
is to be done (Bailey, 1998. In this regard 30 farmers were selected from each village to
make 90 farmers. At traders’ level a total of 30 respondents were interviewed, among
them being 8 wholesalers, 11 retailers and 11 transporters. The number was selected
based on total number on traders available in the respective groups.
3.8 Tools for data analysis
The data obtained was summarized, coded, and analyzed by using Statistical Package for
Social Sciences (SPSS) computer program version 12.0 Both descriptive and quantitative
analysis were carried out.
3.8.1 Descriptive statistics
Statistics such as means, frequency distribution, percentage, average, and cross tabulation
were used. Cross tabulation analysis was used to segregate respondents characteristics
based on certain criteria such as price paid to each group and buying price along the
market participants in order to determine whether or not the variable were statistically
independent.
20
3.8.2 Quantitative analysis
3.8.2.1 Gross margin analysis
Gross margin (GMA) refers to the difference between total revenue and total variable
costs (Msangi, 2000; Mlulla, 2003). Gross margin analysis (GMA) is one of the widely
used analytical techniques for planning and analysis of projects by advisors, consultants,
researchers and producers (Rogan, 2004). It is used as a measure of enterprise
profitability and means of selecting farm plans. The size of gross margin depends on the
services provided, market structure, perishability of the product as well as the distance
between producers and consumers and may be influenced by market information
especially for short-run margins.
The fundamental advantages of the GMA analysis as an economic tool include its
easiness to understand and utilize the logical interrelations of economic and technological
parameters and its ability to forecast rational variants for the operational structure of an
enterprise or individual farmer (Selejio, 2002). In addition GMA is an easy way to
understand profitability of an enterprise as it shows how effectively management can
bring profits from sales and how an enterprise has to withstand downturn and fend off
competition (McClure, 2004). The GMA models are very useful in cases where some
data, for example profits of firms, are hard to collect. Just as important, calculations of
depreciation have often been difficult to undertake due to the ambiguity nature of
estimating the lifespan of fixed assets, appreciation and salvage values in many firms,
thus necessitating the use of GMA models rather than the normal profit margin models.
Johnsen (2003) defined GM as the difference between value of an enterprises gross
output and variable cost of that production; AVCTRGM −=
Where: GM = Gross margin (Tshs/kg),
21
TR = Total revenue (Tshs/kg)
AVC = Average variable cost (Tshs/kg)
However, gross margin analyses do not include fixed or overhead costs such as
depreciation, machinery purchases, or permanent labour costs and comparison can be
misleading (Hassall, 2003). Gross margin analysis is not an exact estimate and reliable
point of reference of an enterprises pricing strategy and pricing profit but it does give a
good indication of financial direction (Hassall, 2003). The GM analysis requires proper
records such as input costs, quantities sold and prices received (Msangi, 2000).
In Tanzania, a number of studies have employed the GM model. For instance the study
by Mlulla (2003) who assessed the operation of border trade in northern Tanzania and
Philip (2001) who studied the economics of medium scale sugarcane producers in
Morogoro. The model was also employed by Silomba (2000) who evaluated the
performance of beans marketing in Kigoma region.
3.8.2.2 Market concentration
Market concentration is defined as the number, size and distribution of sellers and buyers
in the market (Pomeroy and Trinidad, 1995). Market concentration is the measure of
market power. It plays an important role in determination of market behaviour within an
industry because it affects the interdependence action of firms. According to Kohls and
Uhls (1990) the concentration ratio of over 50% is an indication of a strong concentrated
(oligopolystic industry), 33%-50% a weak concentration and less than that,
unconcentrated industry. In this study Irish potato market concentration was determined
by looking at the proportion of total purchase accounted by few largest buyer to the total
volume handled. Concentration ratio is given by the following formula:-
22
100xIP
XPC =
Where;
C = Concentration ratio index
XP = Volume of potato purchased by big buyers in the reference areas (Kg)
IP = Total volume of potato handled in the market (kg)
3.8.2.3 Market margin
Market margins are differences between prices at different market levels. The term
market margin is commonly used to refer the difference between producer and consumer
price of an equivalent quantity and quality of a commodity (Pomeroy and Trinidad, 1995;
Smith 1992). However it may also be used to describe price differences between other
points in the marketing chain, for example between producer and wholesale or wholesale
and retail prices like the case of this study (Pomeroy and Trinidad, 1995). Market
performance was assessed by computing market margin, gross margin and determining
the interface price efficiency.
The importance of estimating market margins springs from the fact that, intermediary
market participants are very often reported to receive low shares of the total market
values. Ashimogo and Lazaro (1989) in their study of the marketing channels for
horticultural products in Morogoro district and Dar es Salaam city showed that marketing
margins were the highest for truckers who delivered the product to the city for wholesale.
Transport costs contributed about 37% to 40% of the total costs along this channel. The
profit margin ranged between 25% and 27% of the producer prices.
Similarly, Nyange (1993) in his study of the economics of vegetables in Arumeru district
(Arusha region) showed that the highest margins were accrued by retailers – with
23
hawkers receiving higher margins than other retailers. To a large extent this was expected
since hawkers provide more services for delivering products closer to consumers. Nyange
(1993) reported further that the truckers’ margins were larger than margins at wholesale
level with transport costs constituting about 30% to 35% of the total costs from producer
to wholesale markets. In this study market margin was calculated by comparing
difference between Irish potato selling and buying prices at different market level (farm
gate, wholesale, transporter and retailers);
1−−= ii PPMM
Where; MM = Market margin between market level 1and market level i-1 in
Tshs/kg
Pi = Price at market level i in Tsh/kg,
Pi – 1 = Price at market level i-1 in Tshs/kg
3.8.2.4 Degree of interface pricing
The degree of interface pricing efficiency was analyzed by using correlation analysis to
test to what extent markets were statistically associated with buying and selling prices.
The employed model was; ( )µ−= iPfMM
Where; MM = Market margin,
Pi = Buying price at specified market and
µ = Error term.
24
3.8.3 Limitations to the study methodology
The majority of respondents in the study area do not keep records a fact that posed a big
problem during data collection. Therefore, collection of the required information
depended mainly on memory recall. On the other hand, some respondents particularly
traders were reluctant to give data on income generated from their trading activities.
However most of them were convinced to cooperate after being persuaded by market
authority that the information so given was meant for research purpose and that their
privacy would be respected.
Inescapability, to capture respondents at their place of work made it difficult to get their
full attention/ cooperation especially traders due to their habit of moving here and there to
find transport goods. However, this was taken as a challenge by researcher to familiarize
with such research works. Convention of units was also a problem since some traders
used local units like bags filled extra ordinarily called “lumbesa,” debes and or heaps
which are not standardized. Estimations had therefore been made to convert local units to
conventional ones such as kilograms.
25
CHAPTER FOUR
4.0 RESULT AND DISCUSSIONS
4.1 Overview
This chapter presents the results and discussion of the findings. The chapter is divided
into two sections; section one presents Irish potato production aspects, household
characteristic, use of inputs in Irish potato production, land ownership, sources of
income, credit facilities and technical assistance in farming. The second section discusses
the trading aspects including traders’ characteristics, empirical results from gross margin
analysis; market margin, producer’s share and degree of interface pricing analysis with
the aim of answering the stipulated research questions.
4.2 Social economic characteristics of farmers
4.2.1 Respondents general characteristics
Table 1 presents socio economic characteristics of respondents. Social economic
characteristics have effects on the farmers’ production decisions and resource allocation.
They determine human potential to produce and capacity to change production practices
and technology in this ever-changing social and economic environment (Ngailo, 1993).
4.2.1.1 Age
Survey results in Table1 indicated that 86.7% of the family members were aged between
1-18 years while 91.1% were 19-35 years old, 53.3% were 36-60 years and 4.4% were
above 60 years old. The age of household head ranged from 19 years to a maximum of 80
years with the mean age of 39.8 years old. These findings imply that majority of farmers
fall between the age group of 19-35 years who are energetic enough, capable to undertake
Irish potato production activities. Age influences Irish potato production very much since
activities associated with Irish potato production are very tough hence requires young and
26
energetic people. Regnard (2006) urges that in total the accumulation of wealthy is
highly dependent on age of an individual, whereby a direct relationship is experienced.
The interviewed Irish potato farmers in the study areas fall in economically productive
class, below and above which are dependants.
4.2.1.2 Marital status
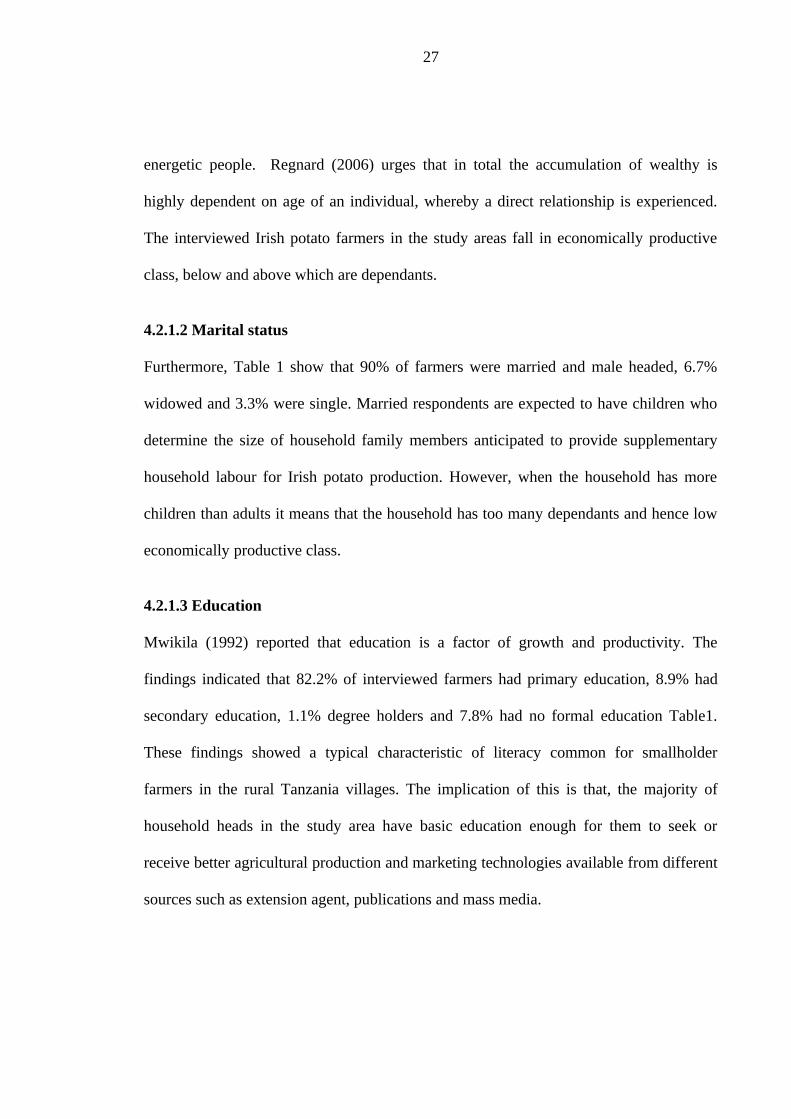
Furthermore, Table 1 show that 90% of farmers were married and male headed, 6.7%
widowed and 3.3% were single. Married respondents are expected to have children who
determine the size of household family members anticipated to provide supplementary
household labour for Irish potato production. However, when the household has more
children than adults it means that the household has too many dependants and hence low
economically productive class.
4.2.1.3 Education
Mwikila (1992) reported that education is a factor of growth and productivity. The
findings indicated that 82.2% of interviewed farmers had primary education, 8.9% had
secondary education, 1.1% degree holders and 7.8% had no formal education Table1.
These findings showed a typical characteristic of literacy common for smallholder
farmers in the rural Tanzania villages. The implication of this is that, the majority of
household heads in the study area have basic education enough for them to seek or
receive better agricultural production and marketing technologies available from different
sources such as extension agent, publications and mass media.
27
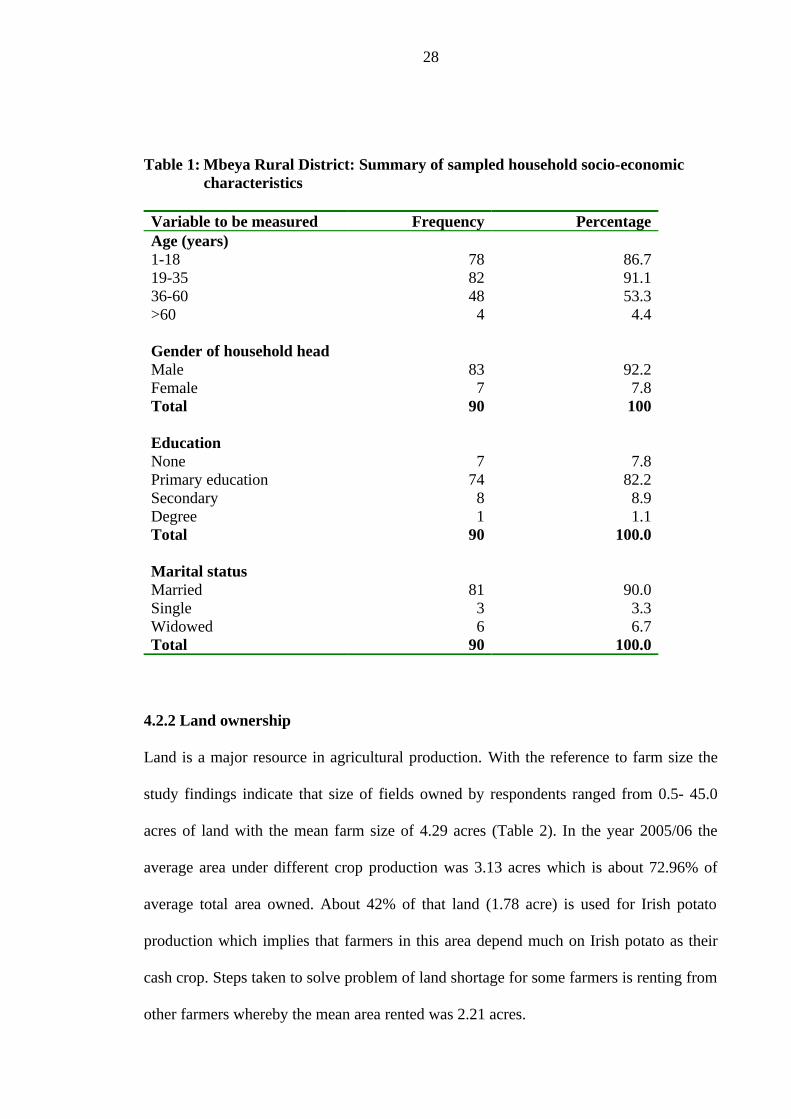
Table 1: Mbeya Rural District: Summary of sampled household socio-economic characteristics
Variable to be measured Frequency PercentageAge (years)1-18 78 86.719-35 82 91.136-60 48 53.3>60 4 4.4
Gender of household headMale 83 92.2Female 7 7.8Total 90 100
EducationNonePrimary education
774
7.882.2
Secondary 8 8.9DegreeTotal
190
1.1100.0
Marital statusMarried 81 90.0Single 3 3.3Widowed 6 6.7Total 90 100.0
4.2.2 Land ownership
Land is a major resource in agricultural production. With the reference to farm size the
study findings indicate that size of fields owned by respondents ranged from 0.5- 45.0
acres of land with the mean farm size of 4.29 acres (Table 2). In the year 2005/06 the
average area under different crop production was 3.13 acres which is about 72.96% of
average total area owned. About 42% of that land (1.78 acre) is used for Irish potato
production which implies that farmers in this area depend much on Irish potato as their
cash crop. Steps taken to solve problem of land shortage for some farmers is renting from
other farmers whereby the mean area rented was 2.21 acres.
28
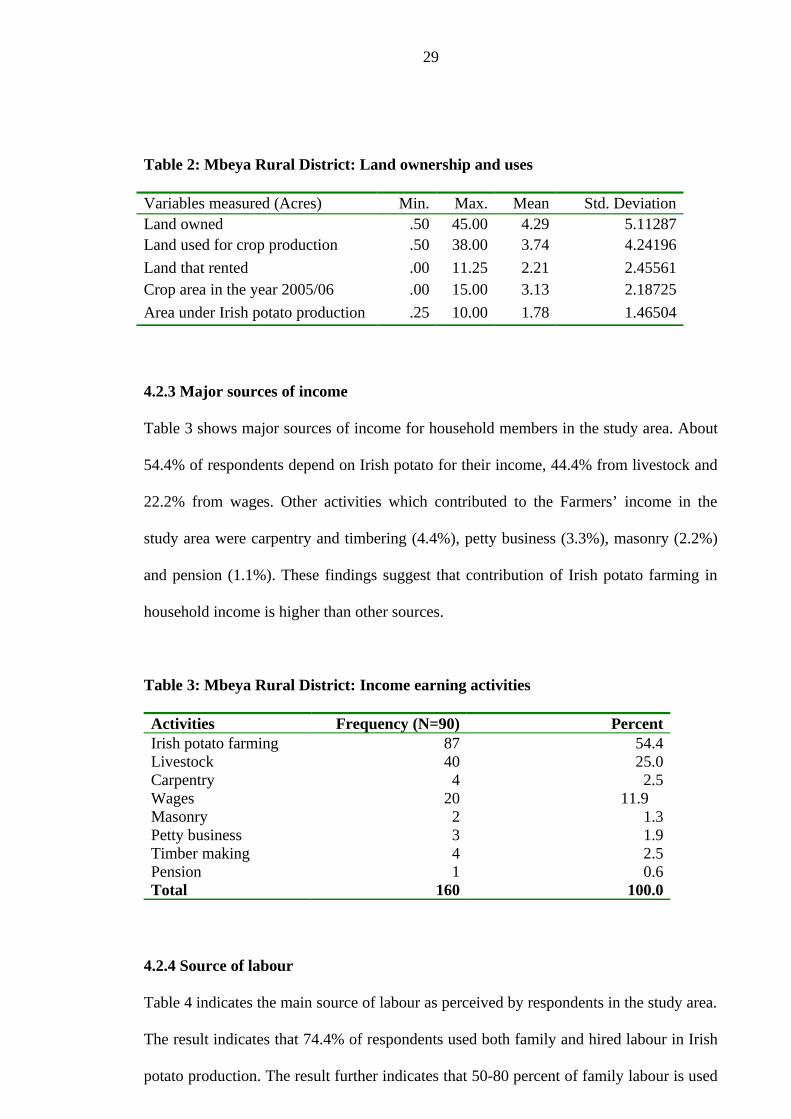
Table 2: Mbeya Rural District: Land ownership and uses
Variables measured (Acres) Min. Max. Mean Std. DeviationLand owned .50 45.00 4.29 5.11287Land used for crop production .50 38.00 3.74 4.24196
Land that rented .00 11.25 2.21 2.45561Crop area in the year 2005/06 .00 15.00 3.13 2.18725
Area under Irish potato production .25 10.00 1.78 1.46504
4.2.3 Major sources of income
Table 3 shows major sources of income for household members in the study area. About
54.4% of respondents depend on Irish potato for their income, 44.4% from livestock and
22.2% from wages. Other activities which contributed to the Farmers’ income in the
study area were carpentry and timbering (4.4%), petty business (3.3%), masonry (2.2%)
and pension (1.1%). These findings suggest that contribution of Irish potato farming in
household income is higher than other sources.
Table 3: Mbeya Rural District: Income earning activities
Activities Frequency (N=90) PercentIrish potato farming 87 54.4Livestock 40 25.0Carpentry 4 2.5Wages 20 11.9 Masonry 2 1.3Petty business 3 1.9Timber making 4 2.5Pension 1 0.6Total 160 100.0
4.2.4 Source of labour
Table 4 indicates the main source of labour as perceived by respondents in the study area.
The result indicates that 74.4% of respondents used both family and hired labour in Irish
potato production. The result further indicates that 50-80 percent of family labour is used
29
for Irish potato production which implies that Irish potato is potential crop hence given
much attention by family members in the study area. The mean daily wage for farm
labour was Tshs 1,782.54 with minimum of Tshs 800 and maximum of Tshs 3 000 as
perceived by (70%) of the respondents.
Table 4: Mbeya Rural District: Source of labour for Irish potato production
Source Frequency PercentFamily (alone) 15 16.7Hired 8 8.9Family and hired 67 74.4Total 90 100.0
4.3 Production aspects
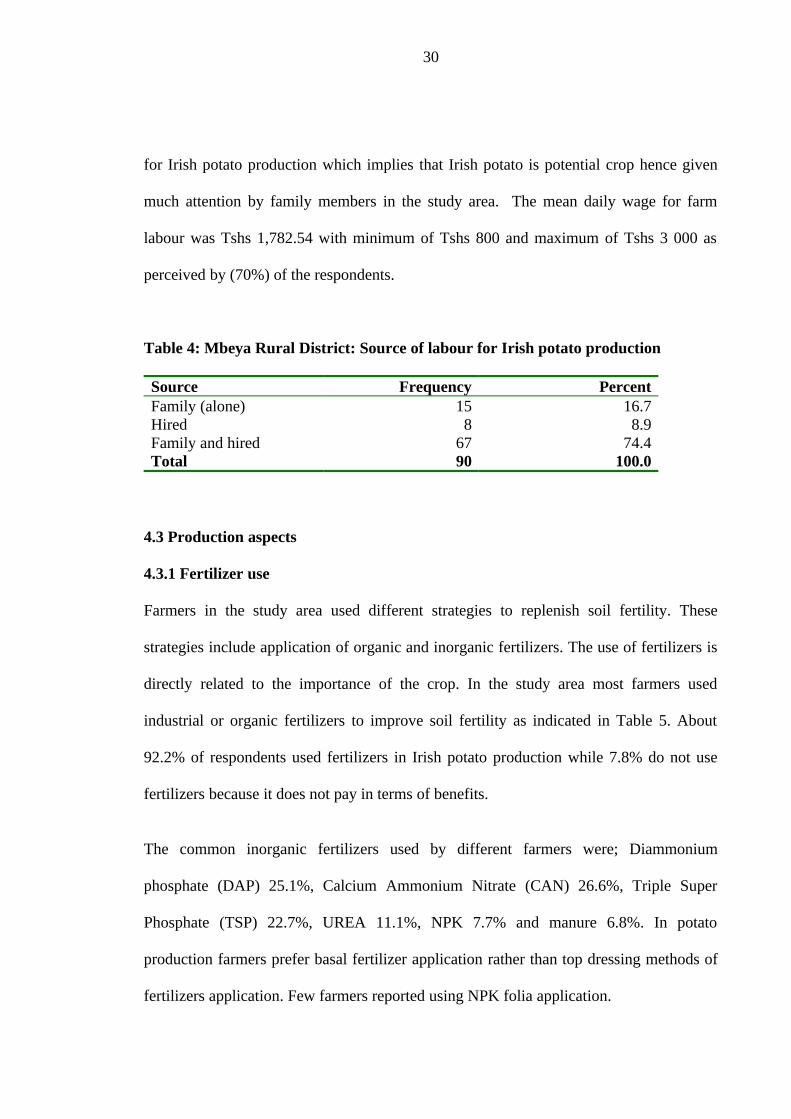
4.3.1 Fertilizer use
Farmers in the study area used different strategies to replenish soil fertility. These
strategies include application of organic and inorganic fertilizers. The use of fertilizers is
directly related to the importance of the crop. In the study area most farmers used
industrial or organic fertilizers to improve soil fertility as indicated in Table 5. About
92.2% of respondents used fertilizers in Irish potato production while 7.8% do not use
fertilizers because it does not pay in terms of benefits.
The common inorganic fertilizers used by different farmers were; Diammonium
phosphate (DAP) 25.1%, Calcium Ammonium Nitrate (CAN) 26.6%, Triple Super
Phosphate (TSP) 22.7%, UREA 11.1%, NPK 7.7% and manure 6.8%. In potato
production farmers prefer basal fertilizer application rather than top dressing methods of
fertilizers application. Few farmers reported using NPK folia application.
30
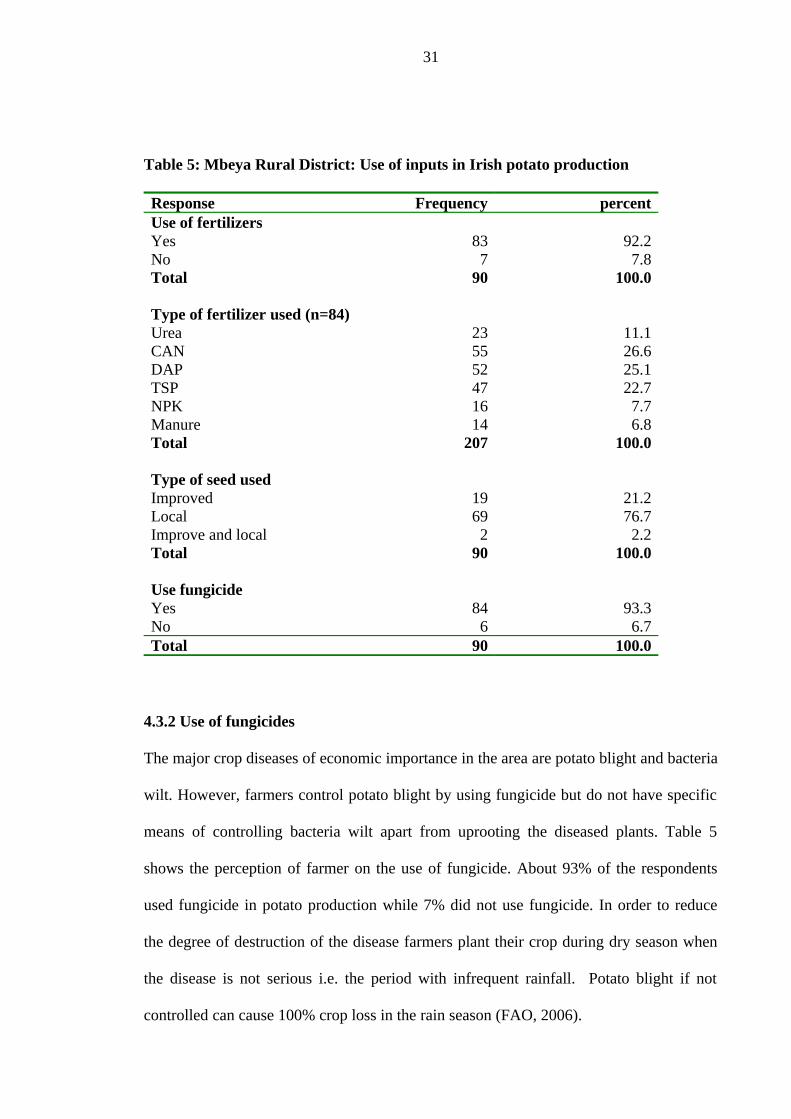
Table 5: Mbeya Rural District: Use of inputs in Irish potato production
Response Frequency percentUse of fertilizersYes 83 92.2No 7 7.8Total 90 100.0
Type of fertilizer used (n=84)Urea 23 11.1CAN 55 26.6DAP 52 25.1TSPNPK
4716
22.77.7
ManureTotal
14207
6.8100.0
Type of seed usedImproved 19 21.2Local 69 76.7Improve and local 2 2.2Total 90 100.0
Use fungicideYes 84 93.3No 6 6.7Total 90 100.0
4.3.2 Use of fungicides
The major crop diseases of economic importance in the area are potato blight and bacteria
wilt. However, farmers control potato blight by using fungicide but do not have specific
means of controlling bacteria wilt apart from uprooting the diseased plants. Table 5
shows the perception of farmer on the use of fungicide. About 93% of the respondents
used fungicide in potato production while 7% did not use fungicide. In order to reduce
the degree of destruction of the disease farmers plant their crop during dry season when
the disease is not serious i.e. the period with infrequent rainfall. Potato blight if not
controlled can cause 100% crop loss in the rain season (FAO, 2006).
31
4.3.3 Type of seed used
The choice of variety of seed to grow is determined by its availability, farmer’s
knowledge about the source and preference in terms of production goal. Results on type
of seeds farmers plant are presented in Table 5. About 76.7% of respondents reported to
grow local variety known as arka, 21.2% used improved Irish potato varieties, whereas
2.2% used both improved and local varieties. The reasons mentioned were unavailability
and lack of knowledge about the source of improved seeds.
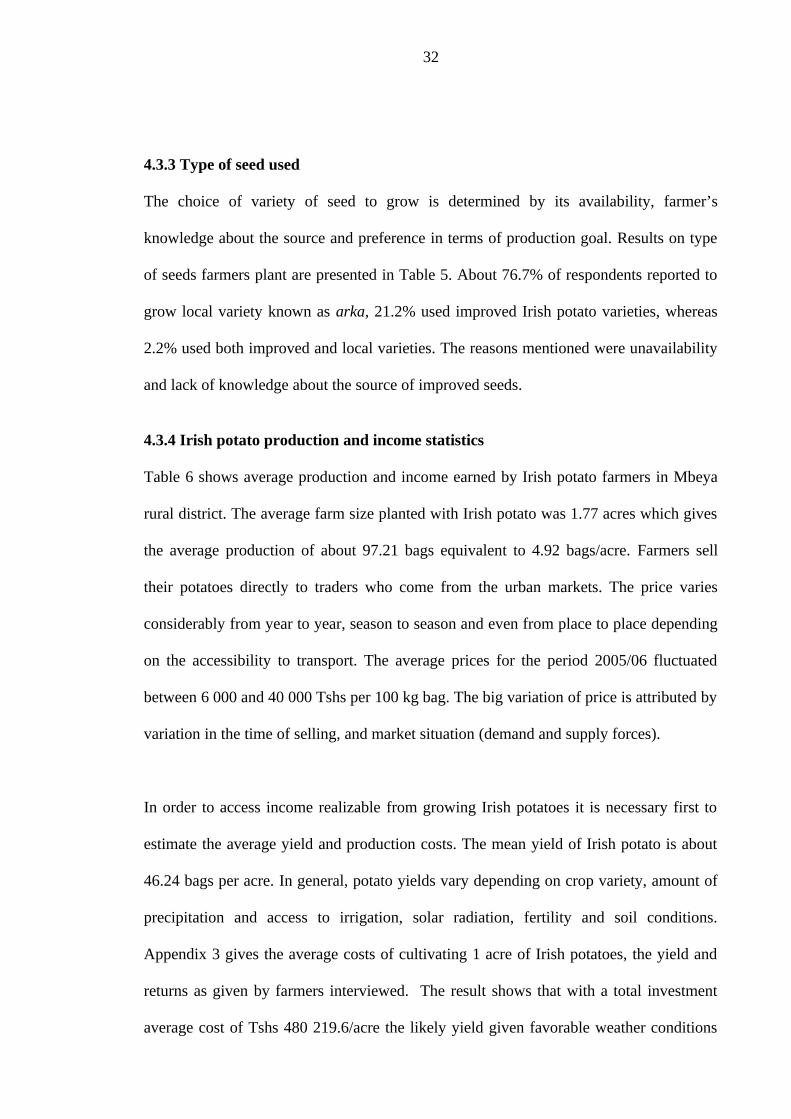
4.3.4 Irish potato production and income statistics
Table 6 shows average production and income earned by Irish potato farmers in Mbeya
rural district. The average farm size planted with Irish potato was 1.77 acres which gives
the average production of about 97.21 bags equivalent to 4.92 bags/acre. Farmers sell
their potatoes directly to traders who come from the urban markets. The price varies
considerably from year to year, season to season and even from place to place depending
on the accessibility to transport. The average prices for the period 2005/06 fluctuated
between 6 000 and 40 000 Tshs per 100 kg bag. The big variation of price is attributed by
variation in the time of selling, and market situation (demand and supply forces).
In order to access income realizable from growing Irish potatoes it is necessary first to
estimate the average yield and production costs. The mean yield of Irish potato is about
46.24 bags per acre. In general, potato yields vary depending on crop variety, amount of
precipitation and access to irrigation, solar radiation, fertility and soil conditions.
Appendix 3 gives the average costs of cultivating 1 acre of Irish potatoes, the yield and
returns as given by farmers interviewed. The result shows that with a total investment
average cost of Tshs 480 219.6/acre the likely yield given favorable weather conditions
32
ranges from 12-120 bags with the mean of 46.24 bags per acre. Results further show that
the farmer earns Tshs 253 403.90/= per acre.
Table 6: Mbeya Rural District: Irish potato production and income statistics
Variable measured Min Max MeanArea planted with Irish potato (acres) .25 10.00 1.77Production per acre (Bags) 12.00 120.00 46.24Total production (Bags) 5.00 600.00 97.21Quantity sold (bags) 4.00 600.00 90.92Price per bag (Tsh) 6 000.00 40 000.00 15 865.56Total earnings (Tsh) 18 000.00 15 750 000.00 1 581 071.11Total earning per acre (Tsh) 253 403.90
4.2.5 Price setting in Irish potato market
Results in Table 7 show that about 60% of the respondents said that price was determined
by market forces mainly through negotiation between farmers and traders, 36% said that
farmers set the price and 4% said it is the wholesalers. The real situation is that, traders
offer prices according to the market situation, and mostly depending on the prevailing
prices in urban centers especially at Dar es Salaam markets.
Table 7: Mbeya Rural District: Who sets price?
Responses Frequency PercentNegotiate and agree with each other 15 60.0Farmers 9 36.0Wholesalers 1 4.0Total 25 100
4.4 Agricultural support services
Agricultural support services discussed here include: credit, extension and association
facilities
33
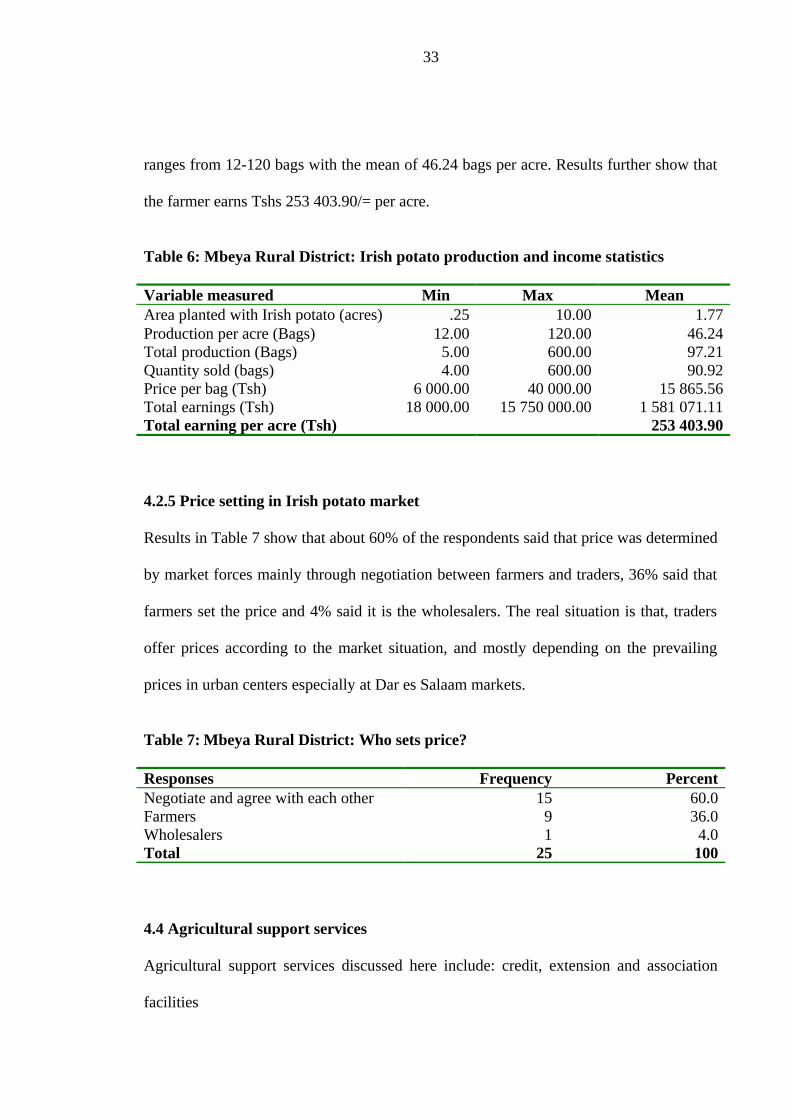
4.4.1 Credit facilities
Table 8 shows that 13.3% of respondents have access to credit facilities, leaving behind a
substantial proportion of farmers without credit facilities. SACCOS, NGO, bank and
informal groups are the most important financial sources mentioned by farmers whereby,
58.3% of respondents got credit from SACCOS, 25.1% from bank, and 8.3% from
informal groups and NGOs respectively. Findings also revealed that, despite the obvious
need of financial services by agricultural producers, credit facilities to farmers are very
poor. These results conform to that of Goodland et al. (1999) who said that, access to
financial services and in particular to funds for crop production is a limiting factor that
slows down input use and output marketing. Furthermore, study results show that, 100%
of those who accessed credit were paid cash of whom 83.33% used the money to finance
Irish potato production activities while 16.67% used the money for diversion problems.
Table 8 : Mbeya Rural District: Access to credit
Response Frequency %Access to creditAccess 12 13.3No access 78 86.7Total 90 100.0
Source of credit (N=12)Informal group 1 8.3Bank 3 25.1SACCOS 7 58.3NGO 1 8.3Total 12 100.00
4.4.2 Access to extension services
Farmers’ access to extension services is presented in Table 9. Results indicate that 51.1%
of the respondents had access to extension services while 48.9% had no access. About
93.3% of respondents reported that they got the extension services from village extension
34
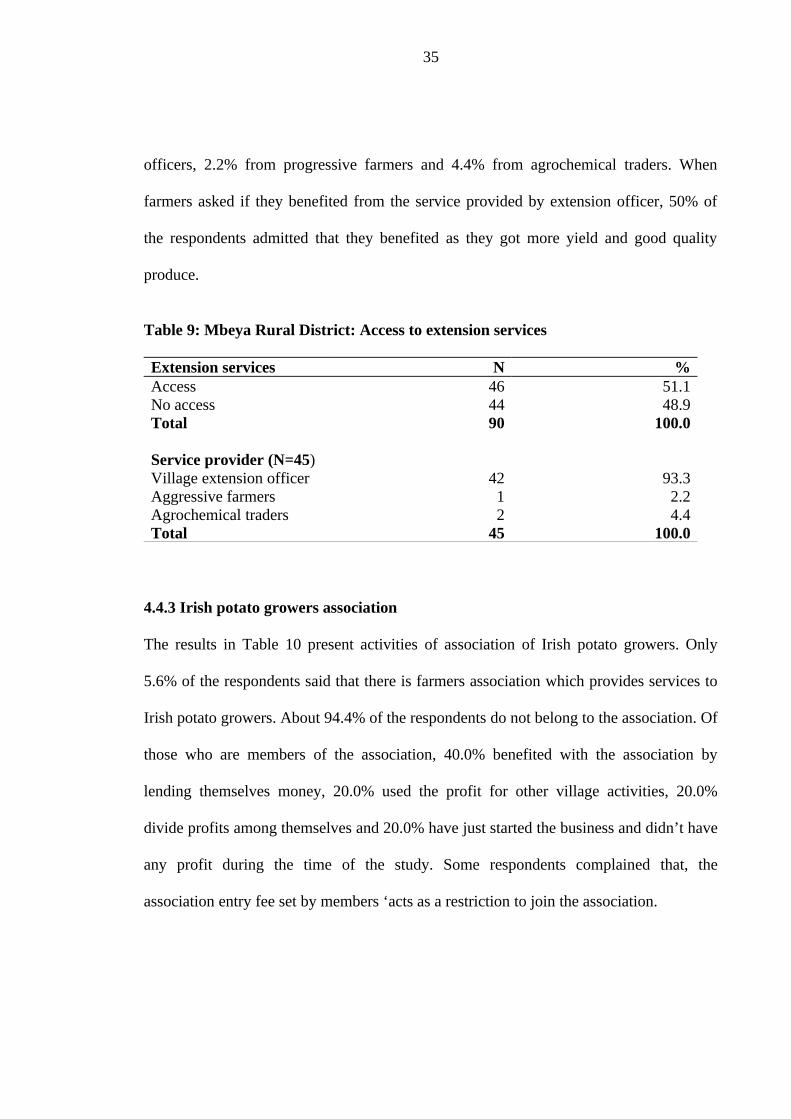
officers, 2.2% from progressive farmers and 4.4% from agrochemical traders. When
farmers asked if they benefited from the service provided by extension officer, 50% of
the respondents admitted that they benefited as they got more yield and good quality
produce.
Table 9: Mbeya Rural District: Access to extension services
Extension services N %Access 46 51.1No access 44 48.9Total 90 100.0
Service provider (N=45)Village extension officer 42 93.3Aggressive farmers 1 2.2Agrochemical traders 2 4.4Total 45 100.0
4.4.3 Irish potato growers association
The results in Table 10 present activities of association of Irish potato growers. Only
5.6% of the respondents said that there is farmers association which provides services to
Irish potato growers. About 94.4% of the respondents do not belong to the association. Of
those who are members of the association, 40.0% benefited with the association by
lending themselves money, 20.0% used the profit for other village activities, 20.0%
divide profits among themselves and 20.0% have just started the business and didn’t have
any profit during the time of the study. Some respondents complained that, the
association entry fee set by members ‘acts as a restriction to join the association.
35
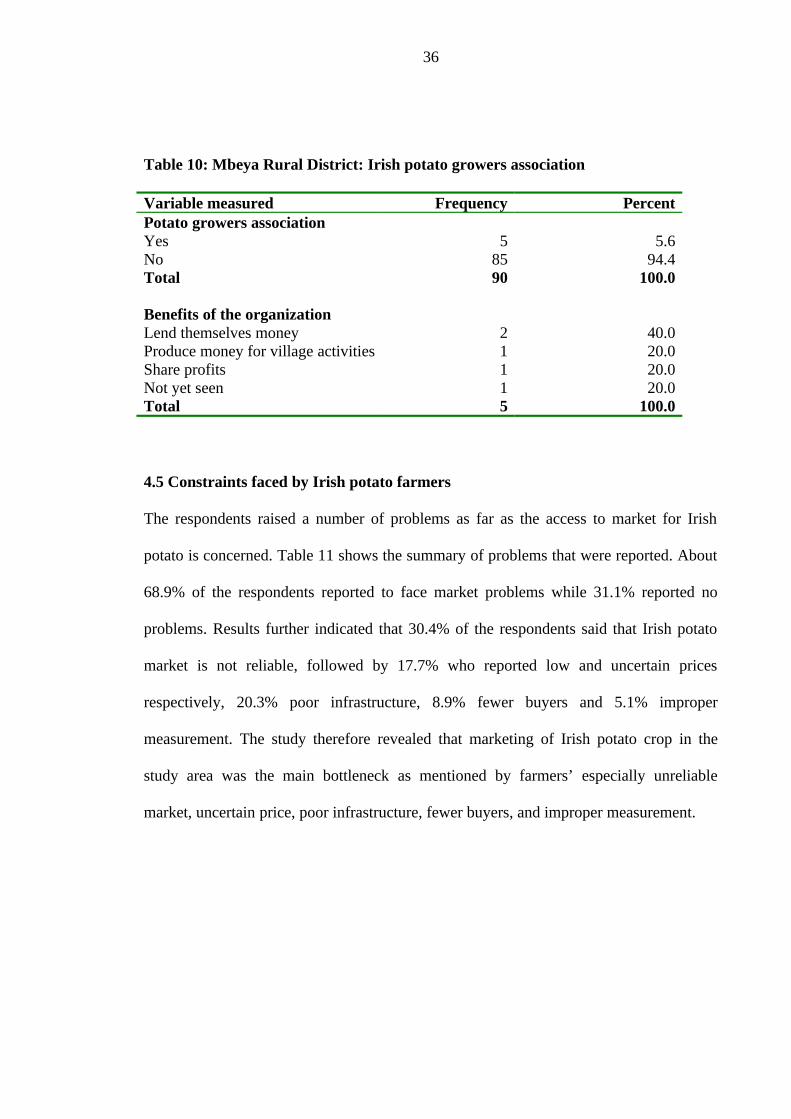
Table 10: Mbeya Rural District: Irish potato growers association
Variable measured Frequency PercentPotato growers associationYes 5 5.6No 85 94.4Total 90 100.0
Benefits of the organizationLend themselves money 2 40.0Produce money for village activities 1 20.0Share profits 1 20.0Not yet seen 1 20.0Total 5 100.0
4.5 Constraints faced by Irish potato farmers
The respondents raised a number of problems as far as the access to market for Irish
potato is concerned. Table 11 shows the summary of problems that were reported. About
68.9% of the respondents reported to face market problems while 31.1% reported no
problems. Results further indicated that 30.4% of the respondents said that Irish potato
market is not reliable, followed by 17.7% who reported low and uncertain prices
respectively, 20.3% poor infrastructure, 8.9% fewer buyers and 5.1% improper
measurement. The study therefore revealed that marketing of Irish potato crop in the
study area was the main bottleneck as mentioned by farmers’ especially unreliable
market, uncertain price, poor infrastructure, fewer buyers, and improper measurement.
36
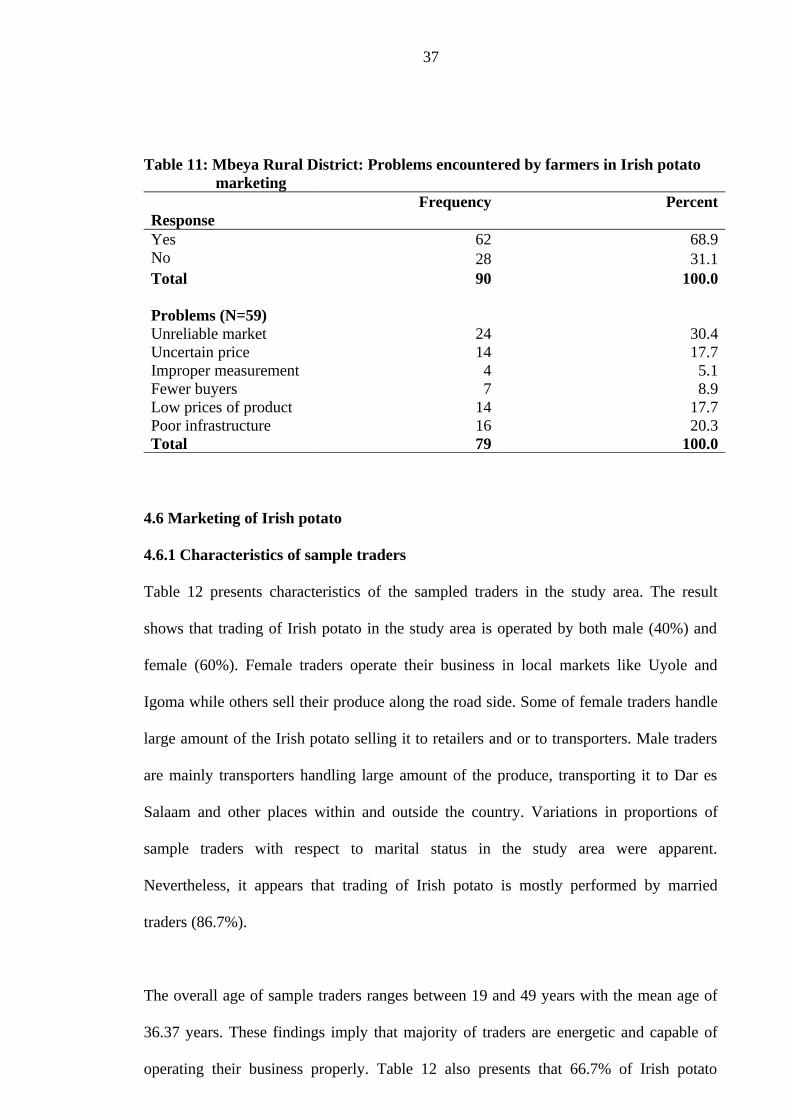
Table 11: Mbeya Rural District: Problems encountered by farmers in Irish potato marketing
ResponseFrequency Percent
Yes 62 68.9No 28 31.1Total 90 100.0
Problems (N=59)Unreliable market 24 30.4Uncertain price 14 17.7Improper measurement 4 5.1Fewer buyers 7 8.9Low prices of productPoor infrastructureTotal
141679
17.720.3
100.0
4.6 Marketing of Irish potato
4.6.1 Characteristics of sample traders
Table 12 presents characteristics of the sampled traders in the study area. The result
shows that trading of Irish potato in the study area is operated by both male (40%) and
female (60%). Female traders operate their business in local markets like Uyole and
Igoma while others sell their produce along the road side. Some of female traders handle
large amount of the Irish potato selling it to retailers and or to transporters. Male traders
are mainly transporters handling large amount of the produce, transporting it to Dar es
Salaam and other places within and outside the country. Variations in proportions of
sample traders with respect to marital status in the study area were apparent.
Nevertheless, it appears that trading of Irish potato is mostly performed by married
traders (86.7%).
The overall age of sample traders ranges between 19 and 49 years with the mean age of
36.37 years. These findings imply that majority of traders are energetic and capable of
operating their business properly. Table 12 also presents that 66.7% of Irish potato
37
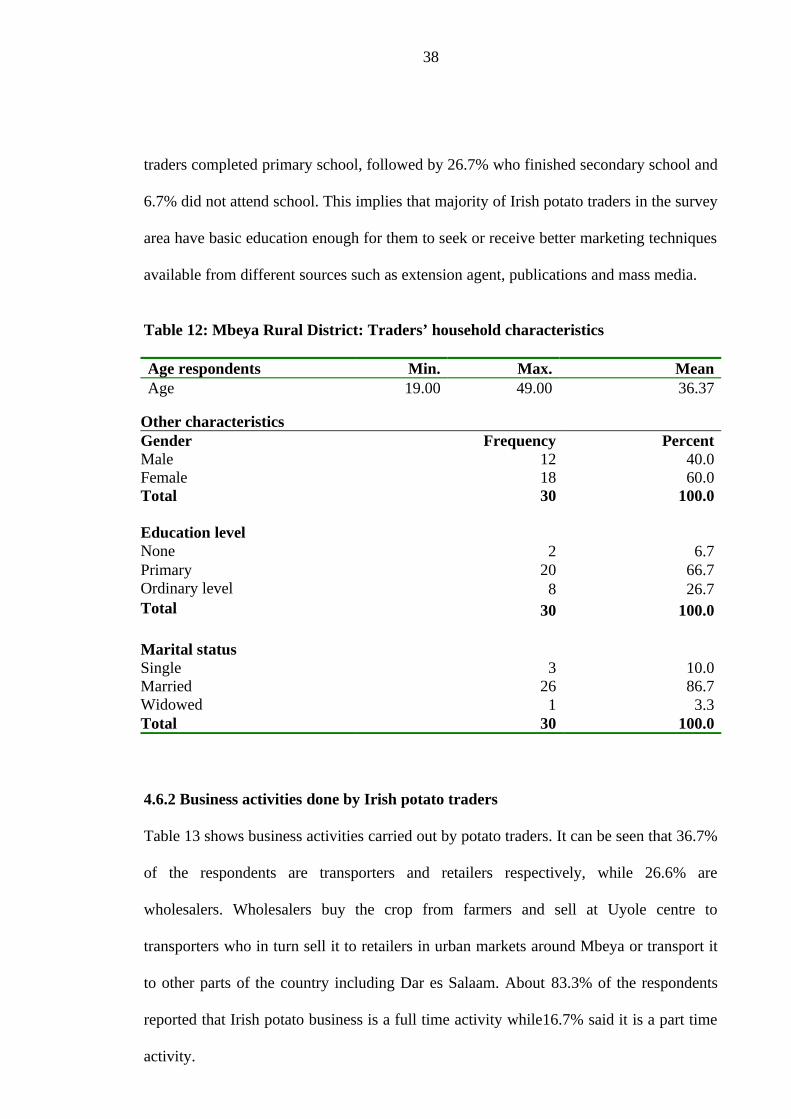
traders completed primary school, followed by 26.7% who finished secondary school and
6.7% did not attend school. This implies that majority of Irish potato traders in the survey
area have basic education enough for them to seek or receive better marketing techniques
available from different sources such as extension agent, publications and mass media.
Table 12: Mbeya Rural District: Traders’ household characteristics
Age respondents Min. Max. MeanAge 19.00 49.00 36.37
Other characteristics Gender Frequency PercentMale 12 40.0Female 18 60.0Total 30 100.0
Education levelNone 2 6.7Primary 20 66.7Ordinary level 8 26.7Total 30 100.0
Marital statusSingle 3 10.0Married 26 86.7Widowed 1 3.3Total 30 100.0
4.6.2 Business activities done by Irish potato traders
Table 13 shows business activities carried out by potato traders. It can be seen that 36.7%
of the respondents are transporters and retailers respectively, while 26.6% are
wholesalers. Wholesalers buy the crop from farmers and sell at Uyole centre to
transporters who in turn sell it to retailers in urban markets around Mbeya or transport it
to other parts of the country including Dar es Salaam. About 83.3% of the respondents
reported that Irish potato business is a full time activity while16.7% said it is a part time
activity.
38
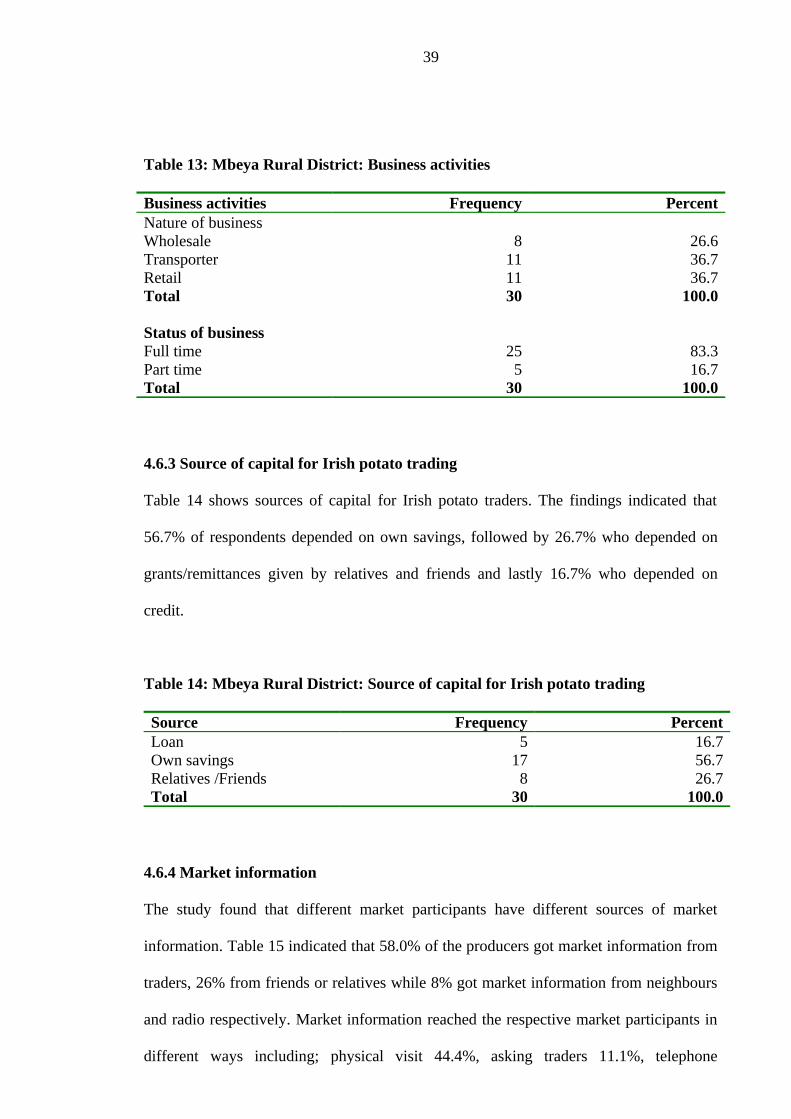
Table 13: Mbeya Rural District: Business activities
Business activities Frequency PercentNature of businessWholesale 8 26.6Transporter 11 36.7Retail 11 36.7Total 30 100.0
Status of businessFull time 25 83.3Part time 5 16.7Total 30 100.0
4.6.3 Source of capital for Irish potato trading
Table 14 shows sources of capital for Irish potato traders. The findings indicated that
56.7% of respondents depended on own savings, followed by 26.7% who depended on
grants/remittances given by relatives and friends and lastly 16.7% who depended on
credit.
Table 14: Mbeya Rural District: Source of capital for Irish potato trading
Source Frequency PercentLoan 5 16.7Own savings 17 56.7Relatives /Friends 8 26.7Total 30 100.0
4.6.4 Market information
The study found that different market participants have different sources of market
information. Table 15 indicated that 58.0% of the producers got market information from
traders, 26% from friends or relatives while 8% got market information from neighbours
and radio respectively. Market information reached the respective market participants in
different ways including; physical visit 44.4%, asking traders 11.1%, telephone
39
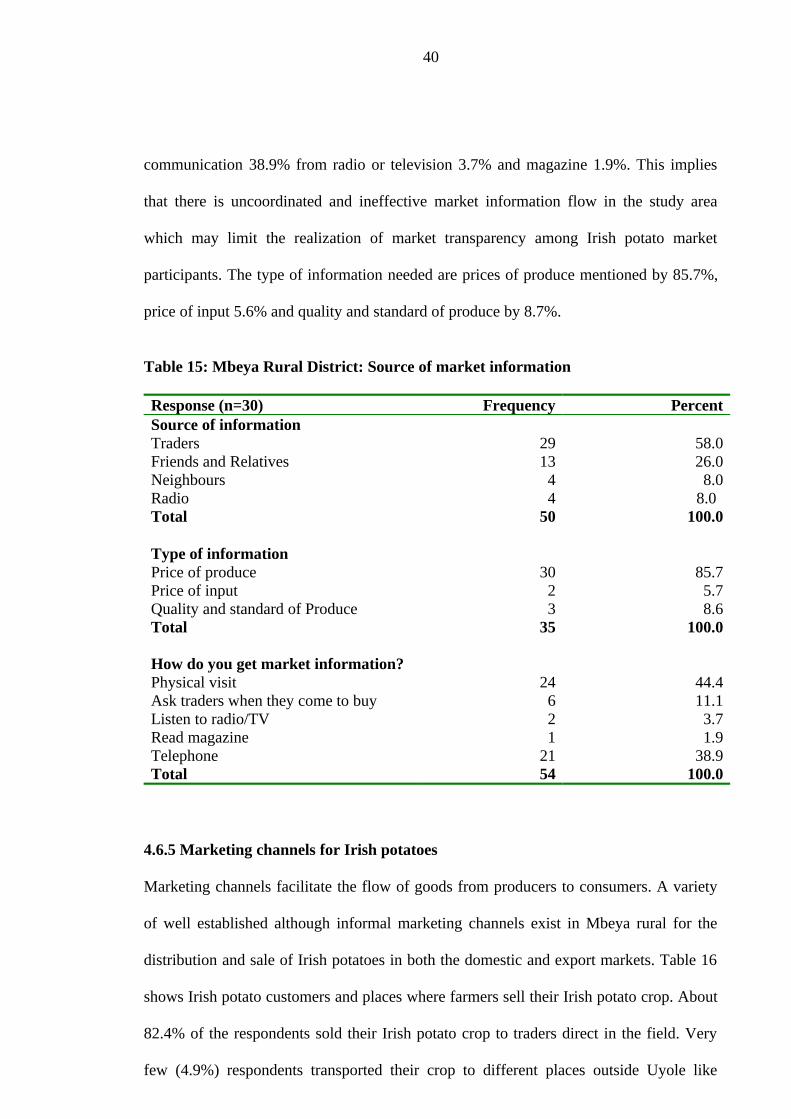
communication 38.9% from radio or television 3.7% and magazine 1.9%. This implies
that there is uncoordinated and ineffective market information flow in the study area
which may limit the realization of market transparency among Irish potato market
participants. The type of information needed are prices of produce mentioned by 85.7%,
price of input 5.6% and quality and standard of produce by 8.7%.
Table 15: Mbeya Rural District: Source of market information
Response (n=30) Frequency PercentSource of informationTraders 29 58.0Friends and Relatives 13 26.0Neighbours 4 8.0Radio 4 8.0Total 50 100.0
Type of informationPrice of produce 30 85.7Price of input 2 5.7Quality and standard of Produce Total
335
8.6100.0
How do you get market information?Physical visit 24 44.4Ask traders when they come to buy 6 11.1Listen to radio/TV 2 3.7Read magazine 1 1.9Telephone Total
2154
38.9100.0
4.6.5 Marketing channels for Irish potatoes
Marketing channels facilitate the flow of goods from producers to consumers. A variety
of well established although informal marketing channels exist in Mbeya rural for the
distribution and sale of Irish potatoes in both the domestic and export markets. Table 16
shows Irish potato customers and places where farmers sell their Irish potato crop. About
82.4% of the respondents sold their Irish potato crop to traders direct in the field. Very
few (4.9%) respondents transported their crop to different places outside Uyole like
40
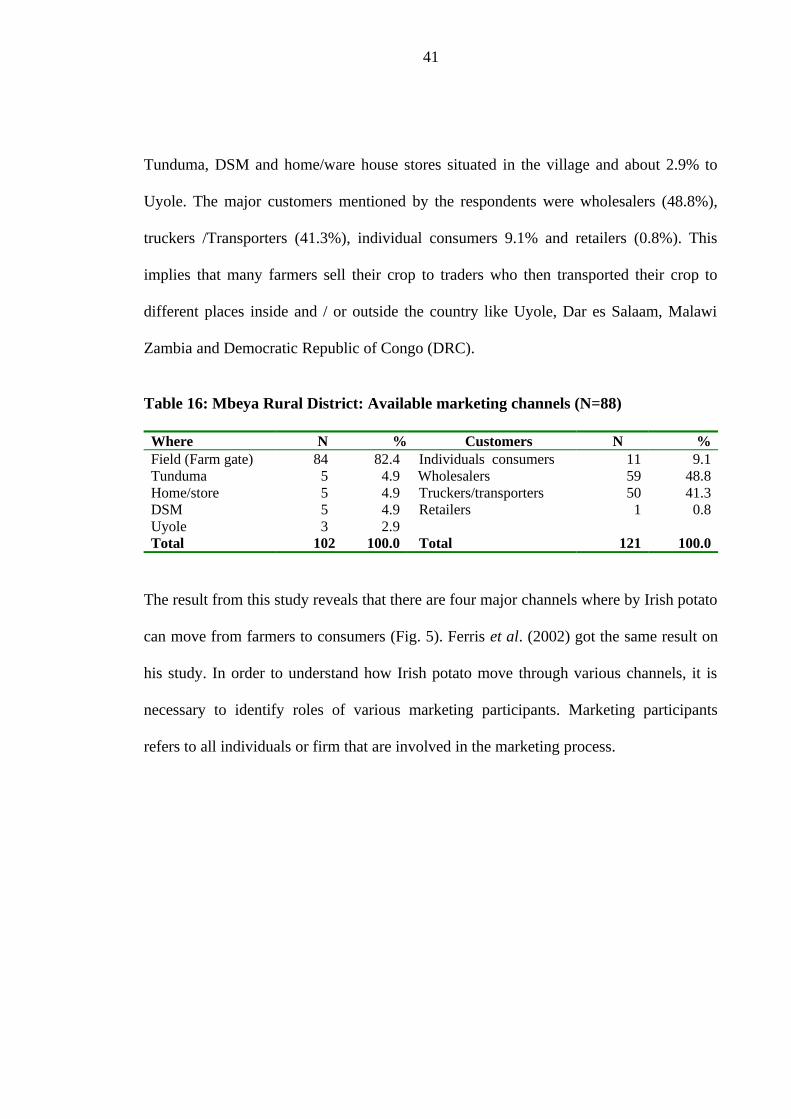
Tunduma, DSM and home/ware house stores situated in the village and about 2.9% to
Uyole. The major customers mentioned by the respondents were wholesalers (48.8%),
truckers /Transporters (41.3%), individual consumers 9.1% and retailers (0.8%). This
implies that many farmers sell their crop to traders who then transported their crop to
different places inside and / or outside the country like Uyole, Dar es Salaam, Malawi
Zambia and Democratic Republic of Congo (DRC).
Table 16: Mbeya Rural District: Available marketing channels (N=88)
Where N % Customers N %Field (Farm gate) 84 82.4 Individuals consumers 11 9.1Tunduma 5 4.9 Wholesalers 59 48.8Home/store 5 4.9 Truckers/transporters 50 41.3DSM 5 4.9 Retailers 1 0.8UyoleTotal
3102
2.9100.0 Total 121 100.0
The result from this study reveals that there are four major channels where by Irish potato
can move from farmers to consumers (Fig. 5). Ferris et al. (2002) got the same result on
his study. In order to understand how Irish potato move through various channels, it is
necessary to identify roles of various marketing participants. Marketing participants
refers to all individuals or firm that are involved in the marketing process.
41
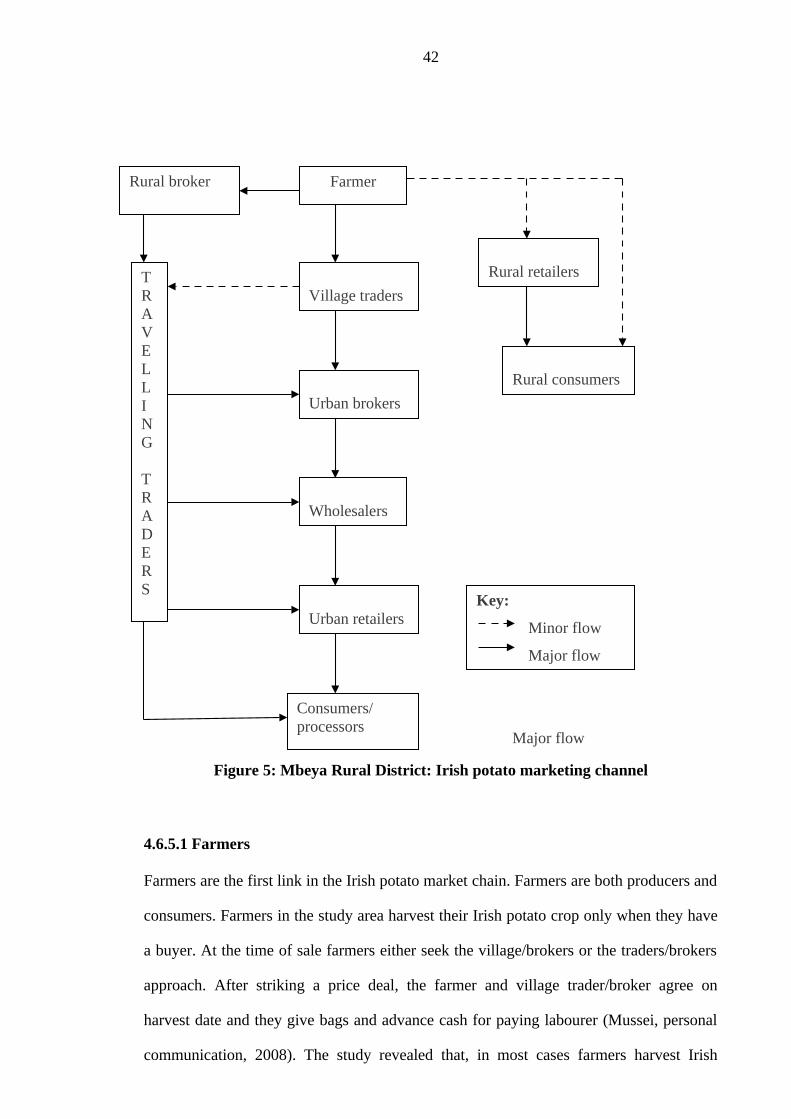
Figure 5: Mbeya Rural District: Irish potato marketing channel
4.6.5.1 Farmers
Farmers are the first link in the Irish potato market chain. Farmers are both producers and
consumers. Farmers in the study area harvest their Irish potato crop only when they have
a buyer. At the time of sale farmers either seek the village/brokers or the traders/brokers
approach. After striking a price deal, the farmer and village trader/broker agree on
harvest date and they give bags and advance cash for paying labourer (Mussei, personal
communication, 2008). The study revealed that, in most cases farmers harvest Irish
Village traders
Farmer
Urban brokers
Wholesalers
Urban retailers
Rural broker
TRAVELLING
TRADERS
Rural retailers
Rural consumers
Consumers/ processors
Key:
Minor flow
Major flow
Major flow
42
potatoes while traders provide bags and do the packing. Very few individuals harvest
their Irish potatoes, transport and wholesale them at urban markets. Most often, produce
is sold at farm-gate and on a cash basis. The study revealed that, farmers also sell their
Irish potatoes by the roadside or take them to the weekly village markets or sell them to
the village retailer.
4.6.5.2 Village traders/assemblers
Village traders come from the production areas and know the farmers in their village and
surrounding areas. They know what farmers have planted and when it is likely to be
harvested. The observations made during study time revealed that village traders are in
contact with transporters, wholesalers and retailers who they contact using mobile
telephones after identifying farmers willing to sell and a price is agreed. Once an
agreement is struck, the deal is concluded on a trust basis. Trade can also be initiated by
the wholesaler who requires urgent supplies. When wholesaler requires Irish potatoes, he
will call his contact (village trader) agree on a price and other marketing arrangements
and in turn the village trader assembles the crop to as per amount required.
4.6.5.3 Brokers
Brokers are one of the prominent market participants in Irish potato trading. In the study
area, brokers are the contact point for travelling traders and wholesale buyers and the key
link of farmers to traders. Brokers get instant pay (commission) per Irish potato bag
collected for their services. The amount of the commission ranges from 500-1 000/= per
bag depending on the quantity required and the urgency with which the consignment is
required (Khalifa, personal communication, 2008). Apart from rural brokers there are
also brokers in most urban centers who link travelling traders to wholesalers and urban
retailers. For example, in Dar es Salaam travelling traders or village traders, who have
brought a lorry load of Irish potatoes, surrender it to the broker to handle the product on
behalf.
43
Brokers are an organized and influential group in the market especially at Dar es Salaam
markets. The study revealed that urban brokers negotiate a fixed price with the travelling
traders and sell at a higher price to the wholesalers while the rural brokers may negotiate
a different price (higher price) with the buyers and pay a different price (lower price) to
the farmers. At worst, they sell at the travelling traders’ reserve price otherwise a price
above the reserve price guarantees them of a minimum commission. On the whole, the
market has now accepted brokers (urban and rural) as a necessary iniquity. They are a
key link in the marketing chain. They are the most informed about the market (demand
and supply) conditions.
4.6.5.4 Wholesalers
Wholesalers are divided into two groups; collectors and distributors. The former collects
produce from farmers in the region. They travel long distances to purchase commodities
in spot markets from the producing areas in the village. To facilitate operation, collectors
frequently employ purchasing agents who work in the production areas on their behalf.
Purchasing agents reduce costs by identifying produce for sale, carrying out the
negotiations, accumulating, assembling and carrying the produce to a nearby earth road
for ease of collection. Major Irish potato wholesalers in the study area come from Uyole
and Dar es Salaam markets.
More often, wholesalers in Dar es Salaam buy from traders. Rarely wholesalers venture
out to buy directly from the farmers. Some wholesalers in the study area sale their
product at Uyole market to transporters and sometimes to retailers who sell at Uyole and
other urban markets around Mbeya. Once there is enough load to carry, collectors
transport the crop to the main cities/towns generally using seven tons lorries. Collecting
wholesalers operate in such a way that allows distributing wholesalers to focus entirely
44
on their urban customers and it is important in large urban centers such as Dar es Salaam
where wholesale and retail markets operate.
4.6.5.5 Travelling traders
These are traders who either own trucks or hire them for buying Irish potatoes from
farmers or village traders and then transport and sell to wholesalers and urban retailers in
other district markets. In Dar es Salaam, travelling traders can sell their truckload of Irish
potato at one market agent where they have a contact.
4.6.5.6 Retailers
Irish potato retailers are many and range from village to small towns roadside sellers. In
the study area, retailers in markets buy 5-15 bags from the farmers and then sell it in
various heap sizes or tins for amounts ranging from 100-500/=. A heap sells at 500/=
and weighs an average of 3 Kg. Retailers sort and grade potatoes according to variety and
size. A tin (debe) which has an average weight of 20 kgs, sells for approximately 2500/=
at the time when the study was conducted.
4.6.5.7 Consumers /processors
In Irish potato farming communities and rural dwellers, potatoes are eaten as a major
staple food, mainly in boiled or mashed forms by all age groups. At times they eat Irish
potatoes mixed with beans, beef, or other vegetable stew. In the urban areas where most
of Irish potato is sold, Irish potatoes are mainly consumed as chips, snacks (crisps) and
occasionally in a boiled or mashed form. The major consumers of Irish potatoes in towns
are young people of working class and students of higher institutions of learning. Many
customers in hotels, bars and restaurants preferred chips compared to boiled, mashed or
grilled potato (Mwakasendo et al., 2007).
45
4.7 Efficiency analysis for Irish potato marketing system
4.7.1 Market structure and prices
Marketing outlets for potatoes basically include local, regional and export markets. Data
from traders through questionnaire showed that the number of traders who are doing Irish
potato business range from 25-100 with the mean of 51 traders. These traders are
responsible for bringing products to local consumers in potato-deficit districts and cities
in Tanzania. Based on the existing number of potato traders and exporters in Mbeya
rural, low barriers to entry, and the homogeneous nature of the locally grown potatoes;
the market structure for potatoes in Mbeya rural district can be categorized as
competitive. Marketing costs and profits do not appear to be excessive, and product
losses during marketing appear to be low. Price fluctuation is a source of uncertainty that
confronts Irish potato growers in the study area. As negotiations and trade take place
between buyers and sellers, potato prices may change from week to week, from day to
day, and even within the trading day. Prices in the field are also influenced by prices at
Dar es Salaam markets. Prices are somewhat below the annual average during the main
harvest season i.e. between January and April.
4.7.2 Market transparency
Market transparency affects the intensity of competition. If buyers or sellers do not have
proper knowledge about market conditions, the intensity of competition is low despite the
sufficient number of market participation to ensure competition. The most important
aspect of market transparency is information transmission process in marketing system
which implies information about prices, grades and standard weights of the product in
question. In the study area the conditions for a high degree of market transparency are
poor. There are no uniform measurements, weights or standard grades. Market traders use
many and different measuring devices such as bags, tins and heaps such that direct price
46
comparisons are very difficult. For instance, some traders used bags which are over filled
with a big heap at the top (lumbesa) which may go up to 150 kg per bag instead of
normal weight of a bag which is 100 kg. Market retailers sell Irish potato in heap which
you can not know what the exact weight is. Therefore, although the price within the
market tends to be uniform, the amount sold for a given price differs greatly i.e. price
variations are replaced by quantity variations.
4.7.3 Barriers to market entry
Barriers to market entry reduce the threat of potential competition and therefore impede
marketing efficiency (Eskola, 2005). Barrier can result from know-how, capital
requirements, and institutional restrictions and non- competitive reaction of established
traders (Eskola, 2005). The major entry barrier include shortage of capital and or credit
facilities, the licensing fees which are still exorbitant for many traders and lack of market
information associated with poor infrastructure and transport facilities. All traders
admitted that Irish potato business was open to any body provided that he/she has enough
capital. Some traders said they are constrained by capital where by 72% said did not have
access to credit. It was observed that the majority of traders do not have enough collateral
to meet requirement imposed by credit lending institutions and the acquisition of credit
from formal institution such as bank follows very long bureaucratic procedures. All these
factors act as disincentives to traders for making any effort to seek credit from formal
financial institutions.
Accordingly traders market fee (produce levy) of (300- 800)/= is charged per bag of Irish
potato sold. Traders who procure Irish potato from rural areas pay a district council levy
(ushuru wa mazao) of 15 000-20 000 Tsh per trip. Sometimes these fees are paid more
than once before reaching its final destination. Moreover some traders who transported
47
Irish potato to Dar es Salaam complained about road blocks which require them to pay
some extra money in case their bags seemed to be overfilled. These results show that,
lack of enough capital, high market fees and unstable prices are the major barrier to
market entry. It can be concluded that market entry is not a serious problem but rather a
major barrier to business expansion.
4.7.4 Market concentration index
The concentration indices (CI) were obtained by dividing the volume traded by few
largest traders by total volume traded by sample traders in 2005/06. In order to obtain the
volume for the largest few Irish potato traders the respondents were divided into two
groups. The first group comprised of respondents who handle volumes below the sample
mean and the second group comprised of respondents who handle volumes above the
sample mean. The volume for the first group was calculated and those above the mean
were taken as a few largest traders in marketing system. Survey results in Table 17 show
that concentration indices for Irish potato traders were; retailers 34.1%, wholesale 83.5%,
transporter 42.9% and overall traders 87.2%. The index of 87.2% for Irish potato traders,
suggests that Irish potato market was highly concentrated.
According to Kohls and Uhls (1990) the concentration index of over 50% is an indication
of a strong concentrated (oligopolystic industry), 33%-50% a weak concentration and
less than that, unconcentrated industry. In the study area, the concentration ratio of 34.1%
and 42.9% for retailers and transporters respectively implies that Irish potato market is
weakly concentrated. The CI of 83.5% for wholesalers indicates that the market is highly
concentrated implying oligopolistic market behaviour a tendency towards monopolistic
marketing behaviour. The higher concentration ratio of the traders which reflect barriers
to entry manifests its effect on the conduct of price formation.
48
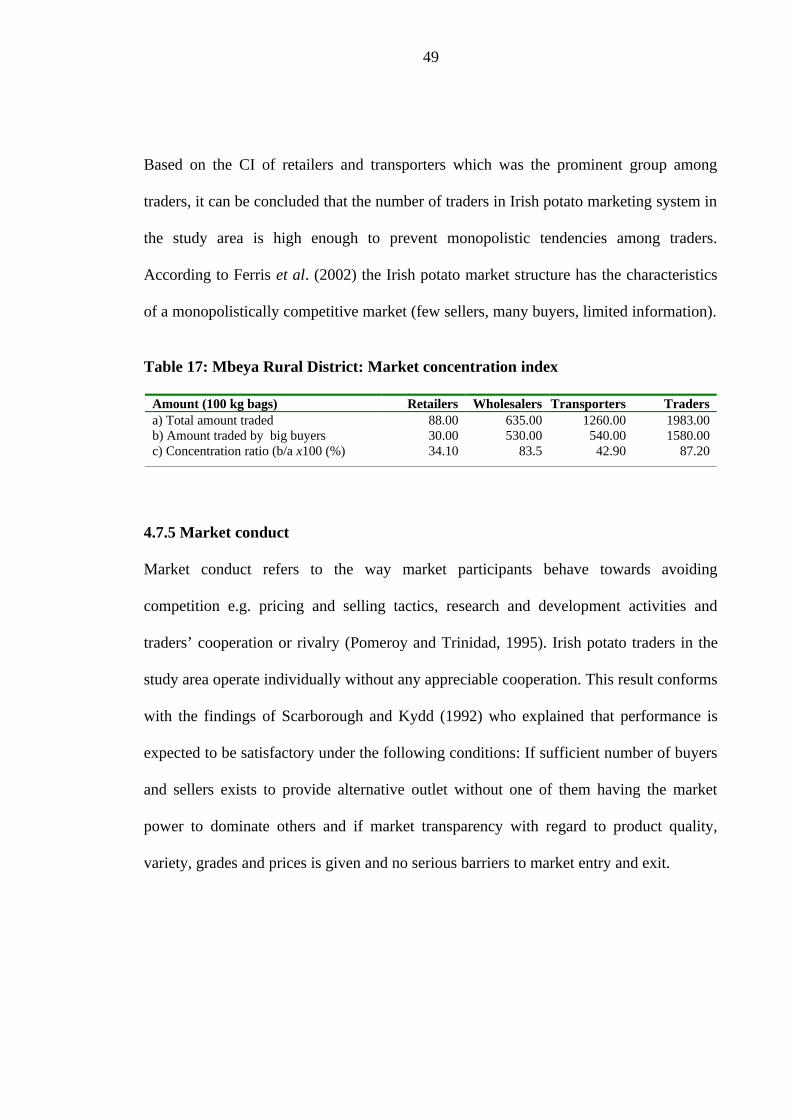
Based on the CI of retailers and transporters which was the prominent group among
traders, it can be concluded that the number of traders in Irish potato marketing system in
the study area is high enough to prevent monopolistic tendencies among traders.
According to Ferris et al. (2002) the Irish potato market structure has the characteristics
of a monopolistically competitive market (few sellers, many buyers, limited information).
Table 17: Mbeya Rural District: Market concentration index
Amount (100 kg bags) Retailers Wholesalers Transporters Tradersa) Total amount traded 88.00 635.00 1260.00 1983.00b) Amount traded by big buyers 30.00 530.00 540.00 1580.00c) Concentration ratio (b/a x100 (%) 34.10 83.5 42.90 87.20
4.7.5 Market conduct
Market conduct refers to the way market participants behave towards avoiding
competition e.g. pricing and selling tactics, research and development activities and
traders’ cooperation or rivalry (Pomeroy and Trinidad, 1995). Irish potato traders in the
study area operate individually without any appreciable cooperation. This result conforms
with the findings of Scarborough and Kydd (1992) who explained that performance is
expected to be satisfactory under the following conditions: If sufficient number of buyers
and sellers exists to provide alternative outlet without one of them having the market
power to dominate others and if market transparency with regard to product quality,
variety, grades and prices is given and no serious barriers to market entry and exit.
49
4.8 Marketing margin analysis along Irish potato channel
4.8.1 At farm level
Table 18 presents marketing margin analysis at different levels along the Irish potato
channel. The average profit margin per acre was estimated to be Tsh. 253 403.90. Returns
per shilling invested are Tsh 0.53 while return per bag harvested is Tsh 5 480.20 and
return per acre rented is Tsh 8.51. Market margin at farm level seems to be small
compared to other market levels due to the nature of the enterprise. Irish potato is labour
intensive crop which requires effective supervision at every stage of production. Any
small mistake in the production may lead to total loss. This is evidenced by a large range
of yield per acre of 12-120 bags obtained by farmers as shown in Table 6. The survey
reveals that having a relatively high farmers’ share of the marketing margin may not
guarantee that potato growers will earn profits as it depends in the market price received.
This implies that when the price is low, the risk of loss due to deterioration is higher for
potato growers than for potato traders.
50
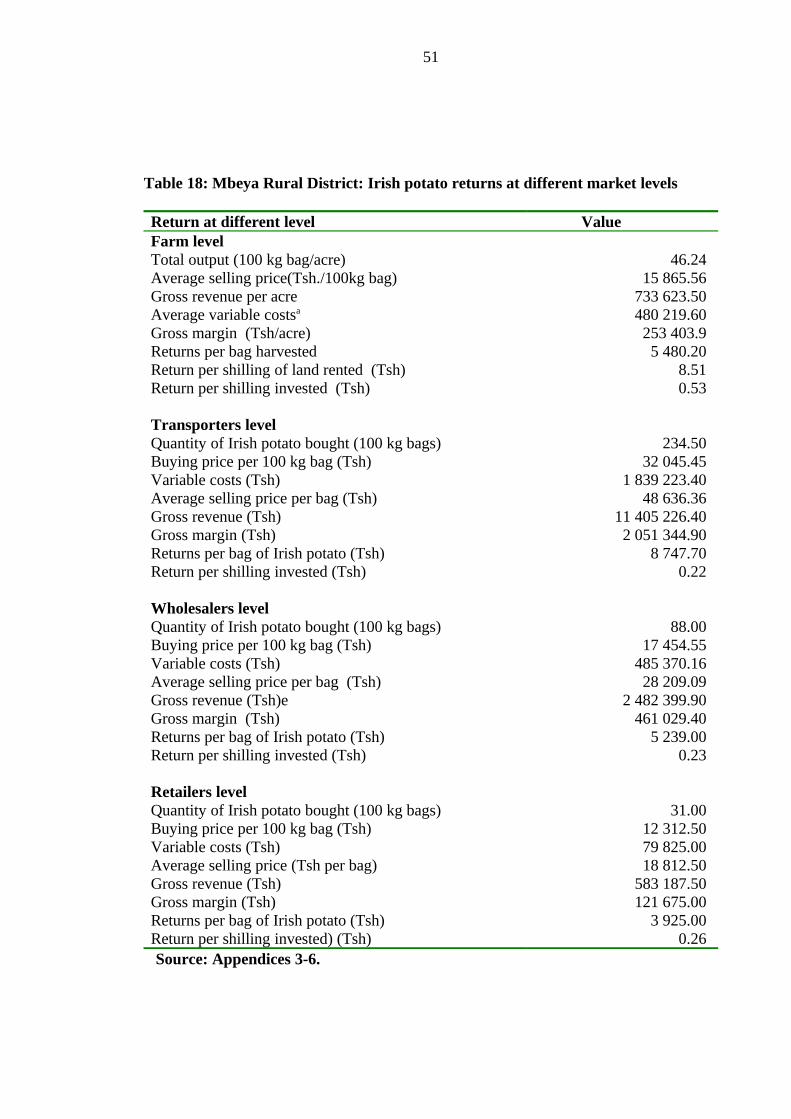
Table 18: Mbeya Rural District: Irish potato returns at different market levels
Return at different level ValueFarm levelTotal output (100 kg bag/acre) 46.24Average selling price(Tsh./100kg bag) 15 865.56Gross revenue per acre 733 623.50Average variable costsa 480 219.60Gross margin (Tsh/acre) 253 403.9Returns per bag harvestedReturn per shilling of land rented (Tsh)
5 480.208.51
Return per shilling invested (Tsh) 0.53
Transporters levelQuantity of Irish potato bought (100 kg bags)Buying price per 100 kg bag (Tsh)
234.5032 045.45
Variable costs (Tsh) 1 839 223.40Average selling price per bag (Tsh) 48 636.36Gross revenue (Tsh) 11 405 226.40Gross margin (Tsh) 2 051 344.90Returns per bag of Irish potato (Tsh) 8 747.70Return per shilling invested (Tsh) 0.22
Wholesalers levelQuantity of Irish potato bought (100 kg bags) 88.00Buying price per 100 kg bag (Tsh) 17 454.55Variable costs (Tsh) 485 370.16Average selling price per bag (Tsh) 28 209.09Gross revenue (Tsh)e 2 482 399.90Gross margin (Tsh) 461 029.40Returns per bag of Irish potato (Tsh) 5 239.00Return per shilling invested (Tsh) 0.23
Retailers levelQuantity of Irish potato bought (100 kg bags) 31.00Buying price per 100 kg bag (Tsh) 12 312.50Variable costs (Tsh) 79 825.00Average selling price (Tsh per bag) 18 812.50Gross revenue (Tsh) 583 187.50Gross margin (Tsh) 121 675.00Returns per bag of Irish potato (Tsh) 3 925.00Return per shilling invested) (Tsh) 0.26Source: Appendices 3-6.
51
4.8.2 At transporters’ level
The survey results show that on average transporters receive a total profit of Tsh 2 051
344.90 per week per person giving an average return per bag of Tsh 8747.70 if
transported and sold in Dar es salaam. The return per shilling invested is found to be low
(0.22 Tsh.) compared to the return per shilling acquired at farm level (0.53). Although the
return per shilling of transporter seems to be lower than that of the farmers, it is important
to note that transporters usually have higher turnover than farmer. For example a
transporter may sell the average of 938 bags of Irish potato per month giving him a net
income 8 205 342.6 Tsh per month while a farmer can get only 253 404.45 for three
months.
4.8.3 At wholesalers’ level
The results also show that on average wholesalers receive a total profit of Tsh 461 029.40
per person per week lower than that of transporters, giving an average return per bag of
Tsh 5 239.00. A return per shilling invested is found to be Tsh 0.23 which is higher than
that of transporters. This implies that the cost incurred at transportation stage is higher
than that at wholesale stage. Efficiency at wholesalers’ stage is lower than that of
transporters because of relatively small amount handled. Return per shilling at farm level
seems to be higher than that at wholesalers’ level. This could be the reason why farmers
keep on producing Irish potatoes.
4.8.4 At retailing level
At retailer’s level, profit is found to be Tsh 121 675.00 per week giving Tsh 0.26 returns
per shilling invested which is higher than that of wholesalers and Tsh 3 925.00 returns
per bag of Irish potato sold. Although the return per shilling invested seem to be higher,
turn over is very small because retailer sell the average of 124 bags giving a monthly net
income of Tsh 486 700.00 while a wholesaler may earn the average of Tsh 1 844 128.00
52
per month. The efficiency of marketing at this point seemed to be very small compared
to other levels of Irish potato market. This obeys the rule of economies and diseconomies
of scale since at retail level amount handled is small compared to other levels and high
rate of deterioration since the produce take long time before finished.
4.8.5 Market power distribution along Irish potato marketing channel
Transporters seem to have relatively more market power than other participants in Irish
potato market channel. This is revealed by the efficiency measures of return per bag and
return per shilling invested (Table 19). Returns per bag were highest at transporter (8
747.70 Tsh) compared to other actors. However return per shilling invested single out
retailers to be more efficient than other chain actors. The reason for large return per bag
at transporters level with relatively small return per shilling is accounted by the time at
which they handle Irish potato.
It was found that, transporters may take 3-5 days to collect and transport potatoes to Dar
es Salaam while wholesalers who sell potatoes at Uyole may hardly take one day to
collect and sale their product. Another reason for transporters efficiency is large volume
of Irish potato handled compare to other actors hence economy and diseconomies of
scale. Transporters handle an average of 234.5 bags of Irish potato while wholesalers
handle 88 and retailers handle 31 bags per week. Morever marketing costs are highest at
transporters than other marketing levels hence more profit margin. Marketing costs are
highest at the transporters level, but transporters also earn the highest profit margin
(Adiyago, et al., 2001).
53
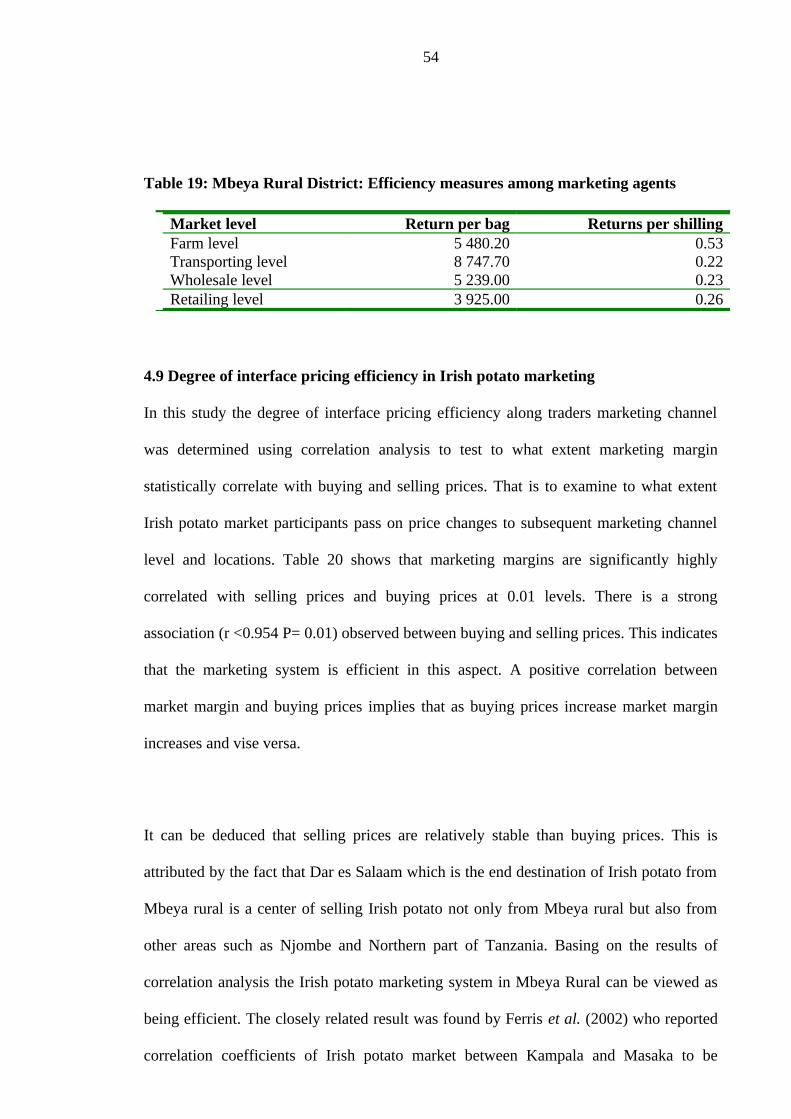
Table 19: Mbeya Rural District: Efficiency measures among marketing agents
Market level Return per bag Returns per shillingFarm level 5 480.20 0.53Transporting level 8 747.70 0.22Wholesale level 5 239.00 0.23Retailing level 3 925.00 0.26
4.9 Degree of interface pricing efficiency in Irish potato marketing
In this study the degree of interface pricing efficiency along traders marketing channel
was determined using correlation analysis to test to what extent marketing margin
statistically correlate with buying and selling prices. That is to examine to what extent
Irish potato market participants pass on price changes to subsequent marketing channel
level and locations. Table 20 shows that marketing margins are significantly highly
correlated with selling prices and buying prices at 0.01 levels. There is a strong
association (r <0.954 P= 0.01) observed between buying and selling prices. This indicates
that the marketing system is efficient in this aspect. A positive correlation between
market margin and buying prices implies that as buying prices increase market margin
increases and vise versa.
It can be deduced that selling prices are relatively stable than buying prices. This is
attributed by the fact that Dar es Salaam which is the end destination of Irish potato from
Mbeya rural is a center of selling Irish potato not only from Mbeya rural but also from
other areas such as Njombe and Northern part of Tanzania. Basing on the results of
correlation analysis the Irish potato marketing system in Mbeya Rural can be viewed as
being efficient. The closely related result was found by Ferris et al. (2002) who reported
correlation coefficients of Irish potato market between Kampala and Masaka to be
54
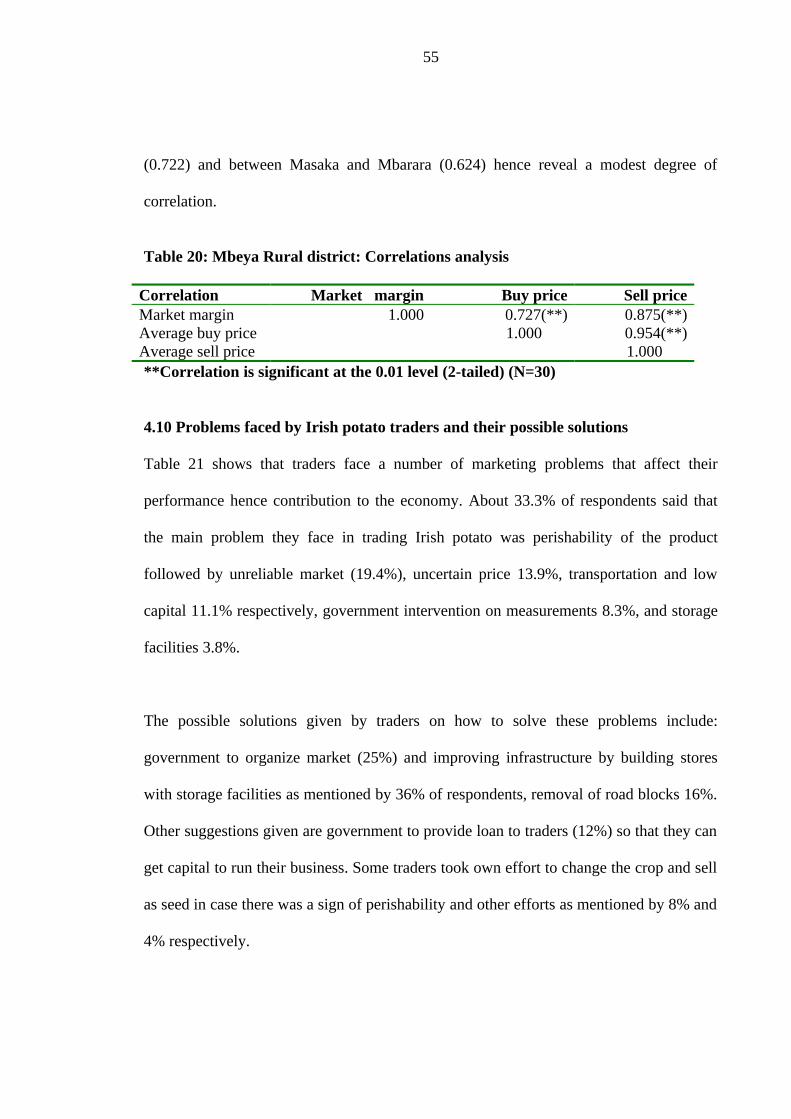
(0.722) and between Masaka and Mbarara (0.624) hence reveal a modest degree of
correlation.
Table 20: Mbeya Rural district: Correlations analysis
Correlation Market margin Buy price Sell priceMarket margin 1.000 0.727(**) 0.875(**)Average buy price 1.000 0.954(**)Average sell price 1.000**Correlation is significant at the 0.01 level (2-tailed) (N=30)
4.10 Problems faced by Irish potato traders and their possible solutions
Table 21 shows that traders face a number of marketing problems that affect their
performance hence contribution to the economy. About 33.3% of respondents said that
the main problem they face in trading Irish potato was perishability of the product
followed by unreliable market (19.4%), uncertain price 13.9%, transportation and low
capital 11.1% respectively, government intervention on measurements 8.3%, and storage
facilities 3.8%.
The possible solutions given by traders on how to solve these problems include:
government to organize market (25%) and improving infrastructure by building stores
with storage facilities as mentioned by 36% of respondents, removal of road blocks 16%.
Other suggestions given are government to provide loan to traders (12%) so that they can
get capital to run their business. Some traders took own effort to change the crop and sell
as seed in case there was a sign of perishability and other efforts as mentioned by 8% and
4% respectively.
55
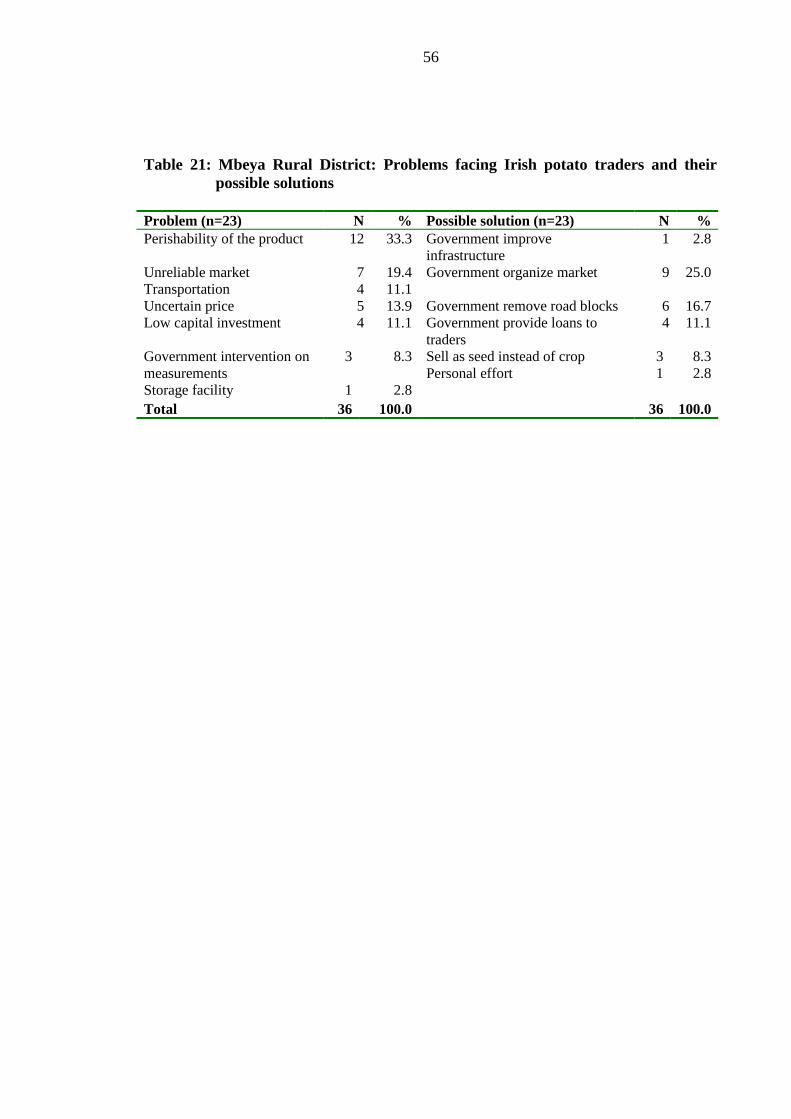
Table 21: Mbeya Rural District: Problems facing Irish potato traders and their possible solutions
Problem (n=23) N % Possible solution (n=23) N %Perishability of the product 12 33.3 Government improve
infrastructure 1 2.8
Unreliable market Transportation
74
19.411.1
Government organize market 9 25.0
Uncertain price 5 13.9 Government remove road blocks 6 16.7Low capital investment 4 11.1 Government provide loans to
traders 4 11.1
Government intervention on measurementsStorage facility
3
1
8.3
2.8
Sell as seed instead of crop Personal effort
31
8.32.8
Total 36 100.0 36 100.0
56
CHAPTER FIVE
5.0 CONCLUSION AND RECOMMENDATION
5.1 Overview
The main objective of this study was to evaluate the Irish potatoes production and
marketing performance in Mbeya rural district. Specifically the study aimed at
determining economic profitability of Irish potato grown by small-scale farmers; identify
existing Irish potato marketing channels and the role played by key market participants
and to examine the pricing structure of Irish potato at different levels of market chain
with a view towards establishing margins at different levels of market channels.
5.2 Conclusion
Based on CI of retailers and transporters it can be concluded that the number of traders in
Irish potato marketing system in the study area is high enough to prevent any
monopolistic tendencies among traders.
It is evident that Irish potato growers in Mbeya rural district have not captured the full
potential benefits of production. Some problems have been noted from the study which
indicated some inefficiency in the entire production – marketing system. These problems
are perishability of the crop, unreliable markets, uncertain prices, transportation, road
blocks, low capital investment and government intervention on measurements.
Despite the far ranging effects of certain natural factors on crop yield, the potato grower
himself is responsible to a large extent for the final success or failure of his crop. The
survey data show a wide range in final profit margins suggesting that many producers
could achieve better financial results if they paid greater attention to the factors
influencing Irish potato production that are within their control.
57
5. 3 Recommendations
Marketing of Irish potato crop in the study area was the main bottleneck as mentioned by
farmers’ especially unreliable market, uncertain price, poor infrastructure, fewer buyers,
and improper measurement. This study therefore recommends that these problems
should be addressed in order to improve performance of Irish potato market.
The profitability of Irish potato production depends largely on yield and product price.
Results show a wide range of yield from 12-120 bags/acre, which suggests that many
producers could achieve better financial results if they pay greater attention to the factors
influencing Irish potato production that are within their control. One of these factors is
the use of improved seed variety. This seems to be a problem since it was mentioned by
76.7% respondents that they use local variety. They do not grow improved varieties due
to its unavailability and farmers’ knowledge about the source. It is recommended that
research should consider wide publicity of new varieties and promote them through
participatory on farm research trials and demonstrations.
In potato enterprise, price fluctuates considerably depending on season. This is
demonstrated by a wide range of profit margin. One way of reducing price fluctuations
would be increased use of storage facilities. A local village stores could be constructed
for storing potatoes for later sale.
In order for farmers to fully enjoy the benefits of a free market environment they must
understand the market mechanism at play. This is only possible if farmers are organized
into groups or association which will increase bargaining power. Through associations
farmers can be able to mobilize saving and credit facilities which can provide funds for
urgent need while speculating for higher prices when there is low supply of potatoes in
the market.
58
The bulk of potatoes in the study area and Tanzania at a large are transported in trucks
and stored in warehouse that are not refrigerated. Often times great losses are experienced
especially when breakdowns occur or when the trucks get stuck in the muddy roads
during the rain season. There is a need to conduct another study to analyze technical
efficiency of potato transportation system in order to come up with the recommendation
regarding Technology and infrastructures aimed at extending and improving the storage
period of potato.
59
REFERENCE
Adiyoga, Witono, Keith O. F. and Rachman S. (2001). Potato Marketing in North
Sumatra and an Assessment of Indonesian Potato Trade. UPWARD Working
Paper Series No.7. CIP -UPWARD, Los Baños, Laguna, Philippines, 31pp.
Anderson, E. W., Fornell, C. and Mazvancheryl, S.K. (2004). Customer Satisfaction and
Shareholder Value. Journal of Marketing 68: 172 - 185.
Ashimogo, G. C. and Lazaro, E. A. (1989). Vegetable Marketing in Mgeta, Morogoro
District. Franco – Tanzania Horticulture Development Project, Sokoine
University of Agriculture, Morogoro, Tanzania. 34pp.
Bailey, D.K. (1998). Method of Social Research. Free Press. Collier Macmillan
Publisher, New York. 589pp.
CIP (1983). Potato for Developing World. Lima Peru. [http://www.cipotato.org.] site
visited on 20/5/ 2007.
CIP (2007). Growth in Production Accelerates. [http://www.cipotato.org.] site visited on
13/ 5/ 2007.
Dean, B.B. (1994). Managing the potato production system. Food products press, USA.
61pp.
Dixie, G. (1989). Horticultural marketing In: A resource and training manual for
extension officers: FAO Agriculture service bulletin Rome. pp. 1-5
60
Ellis, F. (1992). Agricultural Policies in Developing Countries. Cambridge University
Press. London. 56pp.
Eskola E. (2005). Agricultural Marketing and Supply Chain Management in Tanzania: A
Case Study. 46pp.
FAO (2006). Agriculture, Biosecurity, Nutrition and Consumer Protection.
[http://www.fao.org.telefood] site visited on 4/7/2008.
FAOSTAT (2004). Agricultural Data. Provisional 2003 Production and indices data Crop
primary [http://apps.fao./default.jsp] site visited on 10/6/2007.
FAOSTAT (2007). Food and Agriculture Organization of the United Nations statistical
database [http://www.fao.org/site html] site visited on 10/6/2007.
Ferris R. S. B., Okoboi G., Crissman C., Ewell P. and Lemaga B. (2002).Uganda Irish
potato sector. In: The Government of Uganda’s conference on competitiveness of
selected strategic exports. IITA-FOODNET, CIP, PRAPACE CGIAR and
ASARECA. Uganda. 31pp.
Goodland, A., Coulter, J., Stringfellow, R. and Tallontire, A. (1999). Contract farming
and cooperatives in the provision of agricultural services in liberalizing
economies in Sub-Saharan Africa. Journal of marketing 7: 275 – 291.
Hassall, I. (2003). Review of gross margin analysis and modeling tools for sheep
enterprises. [http://www.sheepre.org.au/images/pdfs] site visited on 10/02/2008.
61
Hayami, Y. and Kawagoe, T. (1993). The Agrarian Origins of Commerce and Industry:
A study of Peasant Marketing in Indonesia. London: Macmillan. 58pp.
Horton, D. (1980). The potato as a food crop in developing countries. A bulletin of
international Potato center 17: 30 – 42.
Horton, D. (1987). Potatoes production, marketing and programs for developing
countries. [http://www.cipotato.org] site visited on 13/5/2007.
IFAD (2001). Rural Poverty Report 2000/01: Markets for poor.
[http:/www.ifad/media/pack/rpr/5.html] site visited on 17/07/2008.
Jakobsen, H. (1976). Potato Production in Tanzania. In: Regional Workshop on Potato
Seed Production and Marketing, Nairobi, October, 1976. 4pp.
Johnsen, F. H. (2003). Using Gross Margin Analysis in the TRP II SUA Projects. In
Impact: Lessons leant From Farmers- Oriented Research News Letter. Sokoine
University of Agriculture. Morogoro, Tanzania. 4 (1): pp. 19-21.
Kelly T. (2006). Tanzania potato production. [http://research.cip.cgiar.org] site visited on
5/8/2007.
Kohls, R. L. and Uhls, J. N. (1990). Marketing of agricultural products. Macmillan
Publishing Company, New York. 173pp.
62
Kotler, P.H. (1997). Marketing Management Analysis, Planning, Implementation and
Control. 9th ed. Prentice Hall International Editions, New Jersey. 129pp.
Kusina, N. T. and Kusina J. (2001). Goat marketing model for enhanced revenue
generation by smallholder farmers in Zimbabwe. In. proceedings of the 28th
Scientific Conference of the Tanzania Society of Animal Production.Arusha,
Tanzania. pp. 210-220.
Macha, C.A. (1976). Report of participants on Potato Production in Tanzania. In:
International Potato Course on Production, Storage, and Seed Technology.
International Agricultural Center, Wageningen, the Netherlands. 340pp.
Matola, F. B. (2005). Towards entrepreneurial economy of Tanzania. Journal of
Tanzania Association of Accountancy 17 (1): 17 – 20.
Mayona C. M. (1991). Potato production in the Southern Highlands of Tanzania –
Potentials and constraints. A case study of Mbeya District. Mbeya, Tanzania.
42pp.
Mbelwa R. J. (1999). Marketing review of horticultural policy and planning Department
of Agricultural information service, Dar es Salaam. 48pp.
McClure, B. (2004). Fundamentals of gross profit margin
[http//www.investopedia.co/articles/fundamental/asp] site visited on 16/10/2007.
63
McGlynn, A. (2007). Re- Inventing the potato. A marketing approach for 21st century In:
National potato conference and Trade show. Glen Royal Hotel. 14TH Feb. 2007;
May Rooth, Co. Kildare. 44 pp.
Mendoza, (1995). A primer on marketing channels and margins. In: Prices product and
people analyzing agricultural marketing in developing countries. (Edited by
Scott, G.J.) Publisher International potato centre. pp. 257-275.
MoAC (2001). Basic data annual report Agriculture and livestock Cooperatives, Dar es
Salaam, Tanzania. 83pp.
Minten, B. and Kyle, S. (1995). The impact of distance and road quality on food
collection, market margins and traders’ wages. Evidence from the Zaire. Ithaca,
New York. 145pp.
Mlambiti, M. E. (1999). Optimization of inputs and outputs market in Tanzania and its
effect on improvement of rural livelihoods. Agricultural research challenges for
the 21st century: In proceeding of the fourth annual research conference of the
faculty of Agriculture Sokoine University of Agriculture. 17th-19th November
1999, Morogoro, Tanzania. pp. 11-23.
Mlulla, S. A. (2003). Cross-border Trade in Northern Tanzania: The Effect of Market
Exchange Arrangement and Institution on Values of Non-Traditional Export
Crops. Dissertation for Award of MSc Degree at Sokoine University of
Agriculture, Morogoro, Tanzania. 159pp.
64
Msangi, A. A. (2000). Comparative Analysis of Resource use Efficiency between
SURUDE project and Non- Project Supported Smallholder Dairy Farmers in
Turiani Division. Dissertation for Award of MSc Degree at Sokoine University of
Agriculture, Morogoro, Tanzania. 127pp.
Mussei, A. N., Mbogollo, M. J. and Mayona, C. M. (2000). Adoption of improved potato
production technologies and the contribution to the farmers’ income, Njombe
district, Uyole, Mbeya. 38pp.
Mwakasendo, J.A., Mussei A. N., Kabungo C.D., Mende D. H. and Gondwe B. J. (2007).
Market for Fresh and Frozen Potato Chips in the ASARECA Region and the
potential for Regional Trade: The Case of Tanzania Mbeya, Tanzania. 46pp.
Mwikila, T. R. (1992). Economic analysis of factor influencing flue cured tobacco
production in Tanzania: A case study of Iringa district. Dissertation for Award of
MSc Degree at Sokoine University of Agriculture, Morogoro, Tanzania. 104pp.
Ngailo, L. N. (1993). Economic analysis of pyrethrum industry in Tanzania.Acase study
of Njombe District. Dissertation for award of MSc Degree at Sokoine University
of Agriculture, Morogoro, Tanzania. 177pp.
North, D.C. (2000). A. Revolution in Economics. In Institution, Contract and
Organization: Perspective from New Institutional Economics. (Edited by C.
Mernad), Edward Helga, Cheltenham, UK. pp. 19-21.
65
Nyange, D., Duma, T. and Temu A. E. (2000). Fresh Fruit Marketing in Tanzania:
Prospectus for International Marketing. In: Food and Agriculture Organization of
the United Nations. Journal of Research in Agribusiness 2: 201 – 235.
Nyange, D., Duma, T. and Temu, A. E. (1997). Fresh fruits marketing in Tanzania.
Prospectus for International Marketing. In food and agriculture Organization of
the United Nations. Journal of Research in Agribusiness 2: 201- 235.
Nyange, D.A. (1993). Economics of vegetable marketing in Tanzania. A case study of
Arumeru district. Dissertation for Award of MSc degree at Cornell University,
135pp.
OECD (1982). Price Formation and Performance of Agro Food System, Paris, France.
79pp.
Okoboi G. (2001). The marketing potential of Potatoes in Uganda and market
opportunities for Rwanda [http://www.cipotato.org.] site visited on 10/04/2008.
Okoboi, G and Ferris, R.S.B. (2002). The export marketing potential of seed and ware
Potatoes in Uganda, Tanzania and Kenya with respect to the Rwandan market.
IITAFOODNET. 57 pp.
Philip, (2001). Economic analysis of medium scale agricultural enterprises in
predominantly smallholder agriculture sector. Dissertation for Award of MSc
Degree at Sokoine University of Agriculture, Morogoro, Tanzania. 139pp.
66
Pomeroy, R. S. and Trimidad A. C. (1995). Industrial organization and market analysis.
Fish marketing In: Prices Product and People; Analyzing agricultural marketing
in developing countries; (Edited by Scott, G. J.) James Curry Ltd., Oxford. 289pp.
Ponte, S. (2002). Farmers and Markets in Tanzania. Oxford, United Kingdom. 204pp.
Regnard, I. (2006). Contribution of out growers’ scheme in household poverty reduction:
A case study of Mtibwa Sugar Estate in Tanzania. Dissertation for award of MSc
degree at Sokoine University of Agriculture, Tanzania. 77pp.
Scaborough, V. and Kydd, J. (1992). Economic analysis of Agricultural markets. A
manual of Natural Resource Institute (NRI) 5:166.
Schmidt, G. (1999). “Maize and beans marketing in Kenya”. In: The interaction and
effectiveness of informal and formal marketing systems. IDS –Occasional paper
no. 31. University of Nairobi. 140pp.
` `
Scott, G. (1995). "Agricultural Transformation in Zambia: Past Experience and Future
Prospects," In: Agricultural Transformation Workshop, Abidjan (East Lansing:
Michigan State University. 17pp.
Selejio, O. (2002). Economic analysis of micro enterprises and the role of micro
enterprise financing in Tanzania. A case study of Morogoro region. Dissertation
for award of Msc Degree at Sokoine University of Agriculture, Morogoro,
Tanzania. 133pp.
67
Setiadi, T. (1995). Peluang pasar kentang di Indonesia. Makalah disampaikan pada
Seminar Agribisnis Kentang. Agribusiness Club, Jakarta. pp. 18-19.
Silomba, L. B. (2000). Structure and performance of bean marketing in Tanzania. A case
study of Kigoma region. Dissertation for Award of Msc Degree at Sokoine
University of Agriculture, Morogoro, Tanzania. 112pp.
Smith, L. D. (1992). Costs, margins and returns in Agricultural marketing. In: Marketing
and Agribusiness Development. 1:3-4
Stern, L.W., El-Ansary A. I. and Coughlan, A.T. (1996). Marketing Channels, New
Jersey, Prentice Hall. 179pp.
Tomek, W. G. and Robinson K. L. (1991). Agricultural Product Prices: Third Edition.
Ithaca NY: Cornell University Press. 39pp.
URT (2002). Agricultural Marketing Systems Development Programme. Agriculture &
Rural Development Department – Onar North, East & South Regions. 38pp.
URT (2003). 2002 Population and Housing Census. General Report. Government
Printers, Dar es Salaam, Tanzania. 13pp.
URT (2003). Mbeya region Socio-economic profile. National Bureau of Statistics (NBS)
and Mbeya regional Commissioner’s office. 2nd edition 1: 156pp.
68
WPC (2003). Guide to Commercial Potato Production - Potato Marketing and Cost of
Productions on the Canadian Prairies.
[http://www.gov.mb.ca/agriculture/crops/potatoes/bda04s03.html] Site visited on
7/5/2007.
Wohlgenant, M. K. (2001). "Marketing margins: Empirical analysis. In: Handbook of
Agricultural Economics. (Edited by Elsevier. B. L. Gardner & G. C. Rausser) 1
(1): pp. 933-970.
69
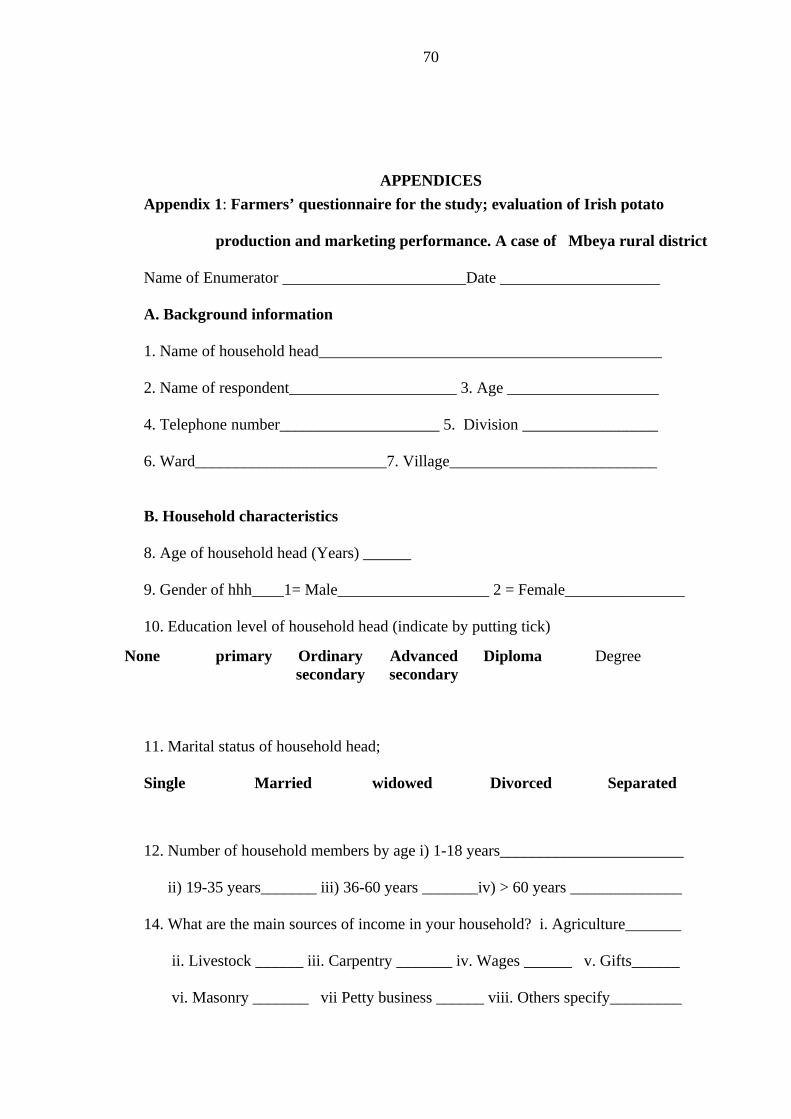
APPENDICES
Appendix 1: Farmers’ questionnaire for the study; evaluation of Irish potato
production and marketing performance. A case of Mbeya rural district
Name of Enumerator _______________________Date ____________________
A. Background information
1. Name of household head___________________________________________
2. Name of respondent_____________________ 3. Age ___________________
4. Telephone number____________________ 5. Division _________________
6. Ward________________________7. Village__________________________
B. Household characteristics
8. Age of household head (Years) ______
9. Gender of hhh____1= Male___________________ 2 = Female_______________
10. Education level of household head (indicate by putting tick)
11. Marital status of household head; Single Married widowed Divorced Separated
12. Number of household members by age i) 1-18 years_______________________
ii) 19-35 years_______ iii) 36-60 years _______iv) > 60 years ______________
14. What are the main sources of income in your household? i. Agriculture_______
ii. Livestock ______ iii. Carpentry _______ iv. Wages ______ v. Gifts______
vi. Masonry _______ vii Petty business ______ viii. Others specify_________
None primary Ordinary secondary
Advanced secondary
Diploma Degree
70
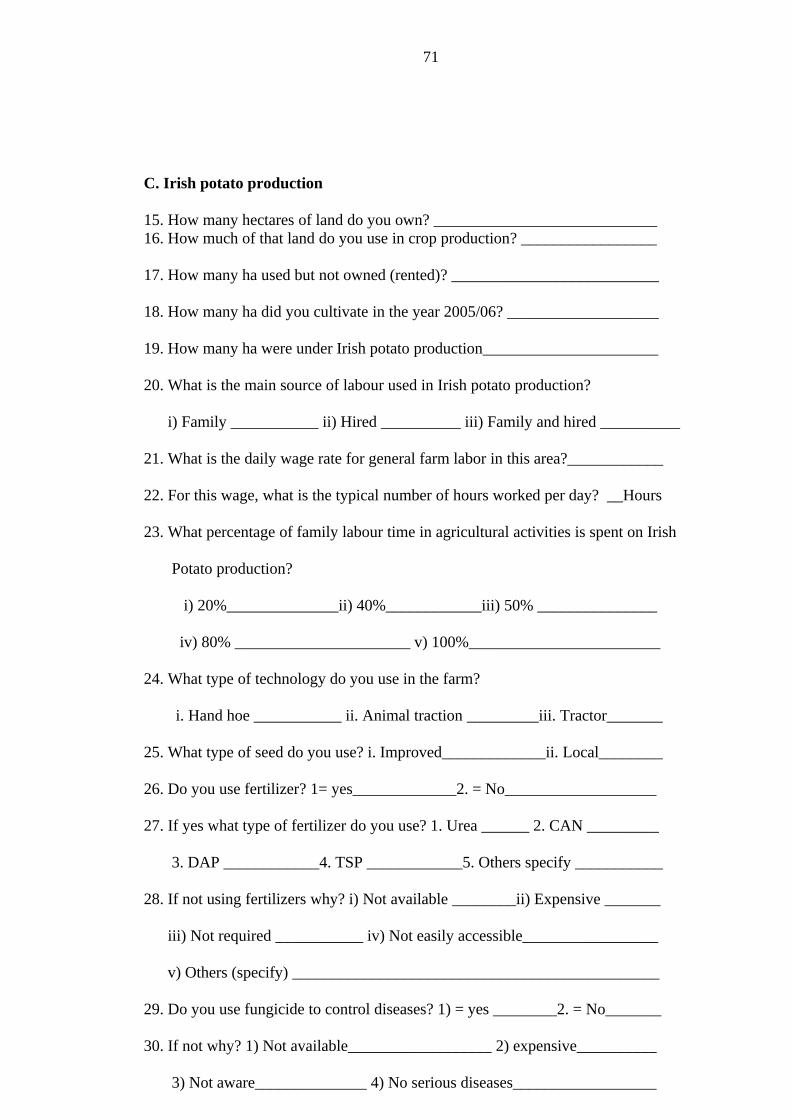
C. Irish potato production
15. How many hectares of land do you own? ____________________________16. How much of that land do you use in crop production? _________________
17. How many ha used but not owned (rented)? __________________________
18. How many ha did you cultivate in the year 2005/06? ___________________
19. How many ha were under Irish potato production______________________
20. What is the main source of labour used in Irish potato production?
i) Family ___________ ii) Hired __________ iii) Family and hired __________
21. What is the daily wage rate for general farm labor in this area?____________
22. For this wage, what is the typical number of hours worked per day? __Hours
23. What percentage of family labour time in agricultural activities is spent on Irish
Potato production?
i) 20%______________ii) 40%____________iii) 50% _______________
iv) 80% ______________________ v) 100%________________________
24. What type of technology do you use in the farm?
i. Hand hoe ___________ ii. Animal traction _________iii. Tractor_______
25. What type of seed do you use? i. Improved_____________ii. Local________
26. Do you use fertilizer? 1= yes_____________2. = No___________________
27. If yes what type of fertilizer do you use? 1. Urea ______ 2. CAN _________ 3. DAP ____________4. TSP ____________5. Others specify ___________
28. If not using fertilizers why? i) Not available ________ii) Expensive _______
iii) Not required ___________ iv) Not easily accessible_________________
v) Others (specify) ______________________________________________
29. Do you use fungicide to control diseases? 1) = yes ________2. = No_______
30. If not why? 1) Not available__________________ 2) expensive__________
3) Not aware______________ 4) No serious diseases__________________
71
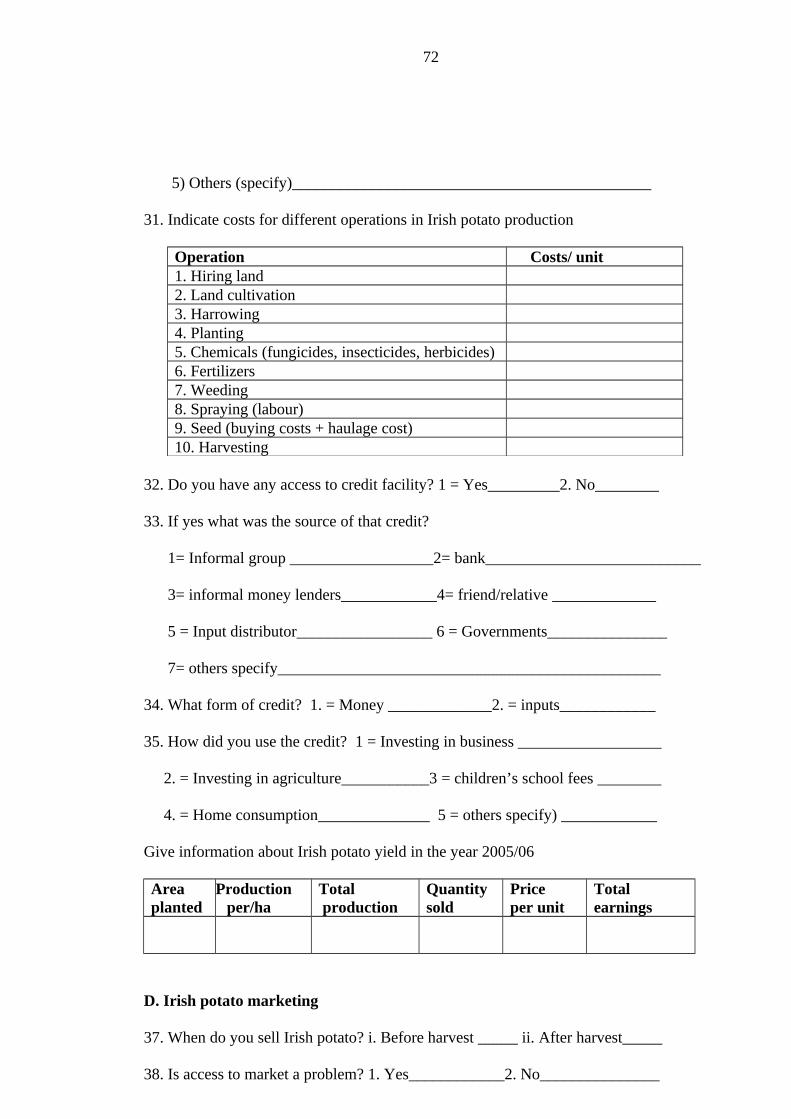
5) Others (specify)_____________________________________________
31. Indicate costs for different operations in Irish potato production
Operation Costs/ unit1. Hiring land2. Land cultivation3. Harrowing4. Planting5. Chemicals (fungicides, insecticides, herbicides)6. Fertilizers7. Weeding8. Spraying (labour)9. Seed (buying costs + haulage cost)10. Harvesting
32. Do you have any access to credit facility? 1 = Yes_________2. No________
33. If yes what was the source of that credit?
1= Informal group __________________2= bank___________________________
3= informal money lenders____________4= friend/relative _____________
5 = Input distributor_________________ 6 = Governments_______________ 7= others specify________________________________________________
34. What form of credit? 1. = Money _____________2. = inputs____________
35. How did you use the credit? 1 = Investing in business __________________ 2. = Investing in agriculture___________3 = children’s school fees ________ 4. = Home consumption______________ 5 = others specify) ____________
Give information about Irish potato yield in the year 2005/06
Areaplanted
Production per/ha
Total production
Quantitysold
Price per unit
Total earnings
D. Irish potato marketing
37. When do you sell Irish potato? i. Before harvest _____ ii. After harvest_____
38. Is access to market a problem? 1. Yes____________2. No_______________
72
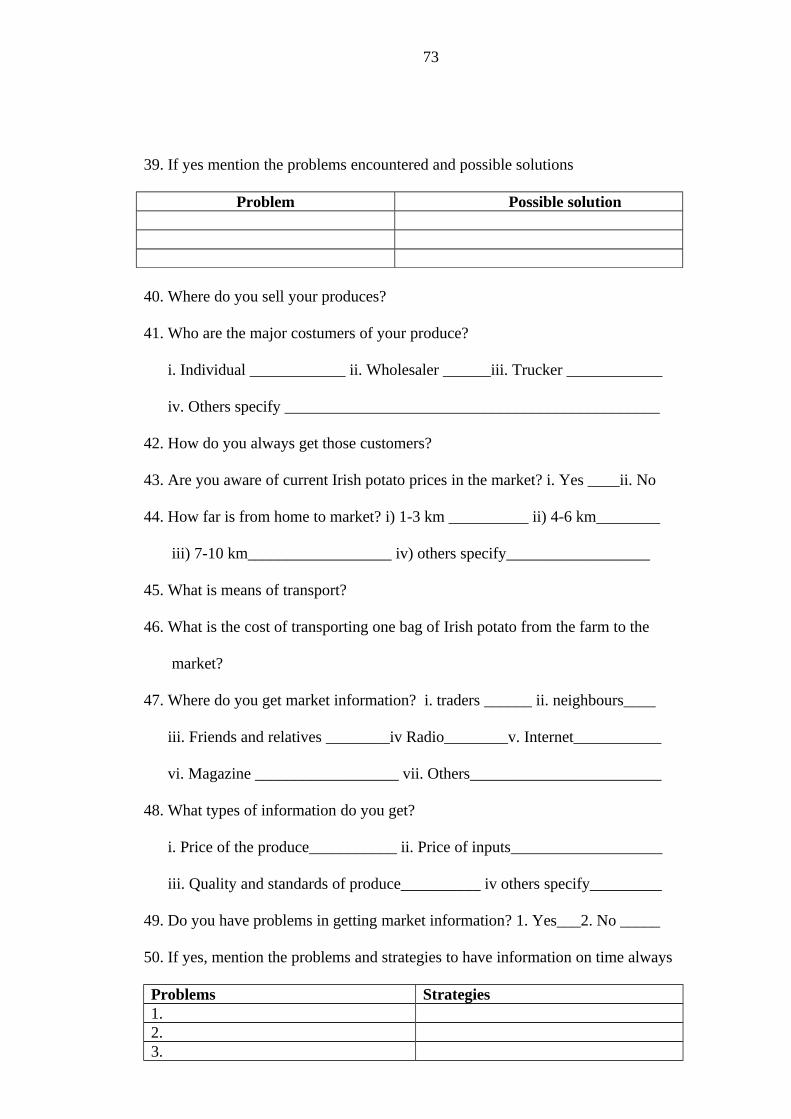
39. If yes mention the problems encountered and possible solutions
Problem Possible solution
40. Where do you sell your produces?
41. Who are the major costumers of your produce?
i. Individual ____________ ii. Wholesaler ______iii. Trucker ____________
iv. Others specify _______________________________________________
42. How do you always get those customers?
43. Are you aware of current Irish potato prices in the market? i. Yes ____ii. No
44. How far is from home to market? i) 1-3 km __________ ii) 4-6 km________
iii) 7-10 km__________________ iv) others specify__________________
45. What is means of transport?
46. What is the cost of transporting one bag of Irish potato from the farm to the
market?
47. Where do you get market information? i. traders ______ ii. neighbours____
iii. Friends and relatives ________iv Radio________v. Internet___________
vi. Magazine __________________ vii. Others________________________
48. What types of information do you get?
i. Price of the produce___________ ii. Price of inputs___________________
iii. Quality and standards of produce__________ iv others specify_________
49. Do you have problems in getting market information? 1. Yes___2. No _____
50. If yes, mention the problems and strategies to have information on time always
Problems Strategies1.2.3.
73
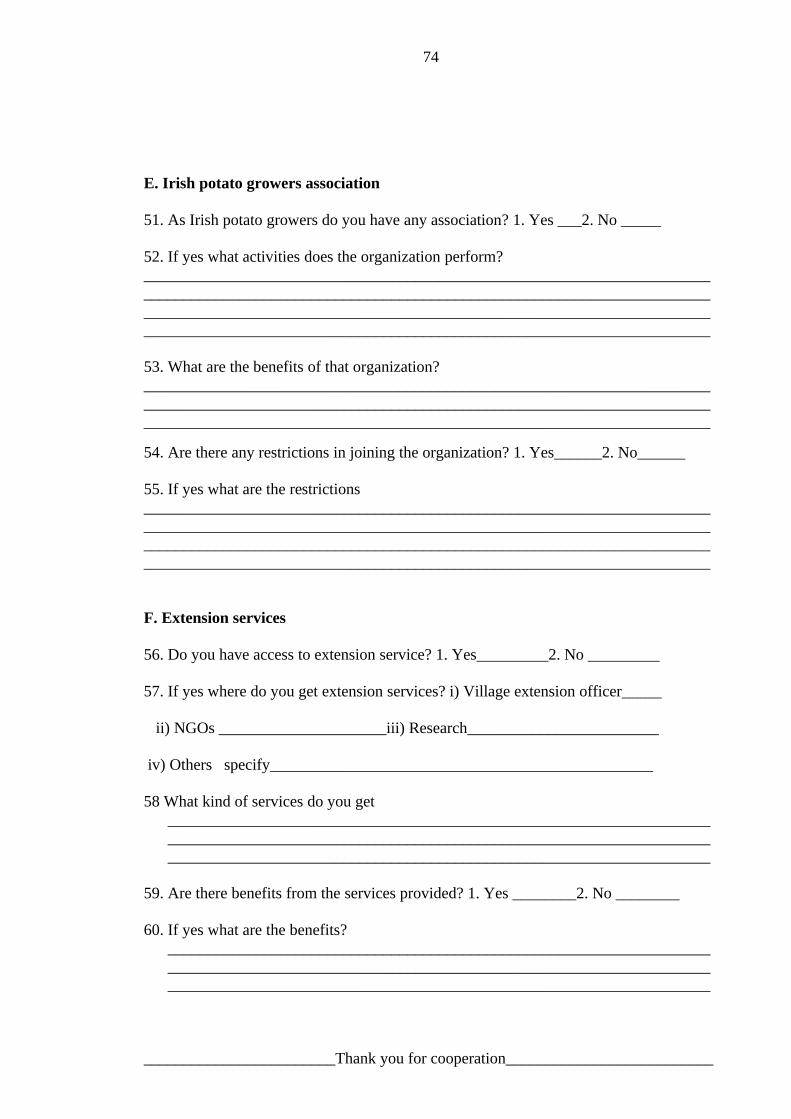
E. Irish potato growers association
51. As Irish potato growers do you have any association? 1. Yes ___2. No _____
52. If yes what activities does the organization perform? ____________________________________________________________________________________________________________________________________________________________________________________________________________________________________________________________________________________________
53. What are the benefits of that organization?_____________________________________________________________________________________________________________________________________________________________________________________________________________________
54. Are there any restrictions in joining the organization? 1. Yes______2. No______
55. If yes what are the restrictions____________________________________________________________________________________________________________________________________________________________________________________________________________________________________________________________________________________________
F. Extension services
56. Do you have access to extension service? 1. Yes_________2. No _________
57. If yes where do you get extension services? i) Village extension officer_____ ii) NGOs _____________________iii) Research________________________
iv) Others specify________________________________________________
58 What kind of services do you get ____________________________________________________________________________________________________________________________________________________________________________________________________________
59. Are there benefits from the services provided? 1. Yes ________2. No ________
60. If yes what are the benefits? ____________________________________________________________________________________________________________________________________________________________________________________________________________
________________________Thank you for cooperation__________________________
74
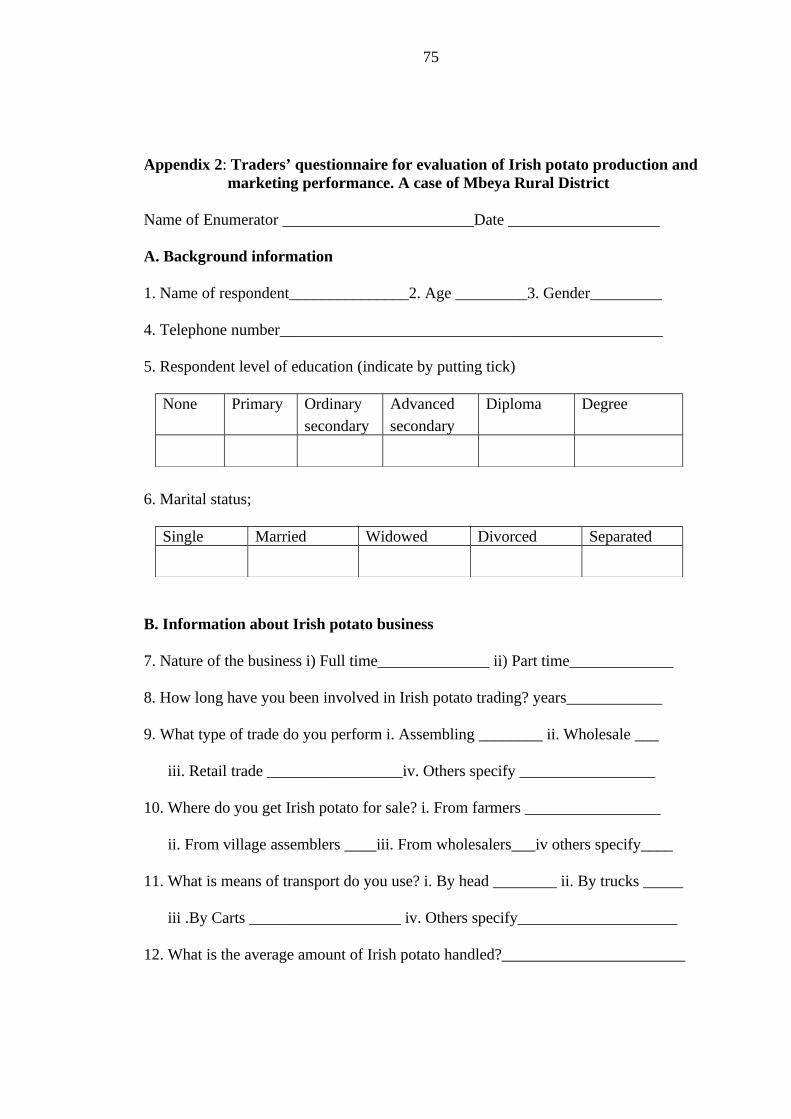
Appendix 2: Traders’ questionnaire for evaluation of Irish potato production and marketing performance. A case of Mbeya Rural District
Name of Enumerator ________________________Date ___________________
A. Background information
1. Name of respondent_______________2. Age _________3. Gender_________
4. Telephone number________________________________________________
5. Respondent level of education (indicate by putting tick)
None Primary Ordinary secondary
Advanced secondary
Diploma Degree
6. Marital status;
Single Married Widowed Divorced Separated
B. Information about Irish potato business
7. Nature of the business i) Full time______________ ii) Part time_____________
8. How long have you been involved in Irish potato trading? years____________
9. What type of trade do you perform i. Assembling ________ ii. Wholesale ___
iii. Retail trade _________________iv. Others specify _________________
10. Where do you get Irish potato for sale? i. From farmers _________________
ii. From village assemblers ____iii. From wholesalers___iv others specify____
11. What is means of transport do you use? i. By head ________ ii. By trucks _____
iii .By Carts ___________________ iv. Others specify____________________
12. What is the average amount of Irish potato handled?_______________________
75
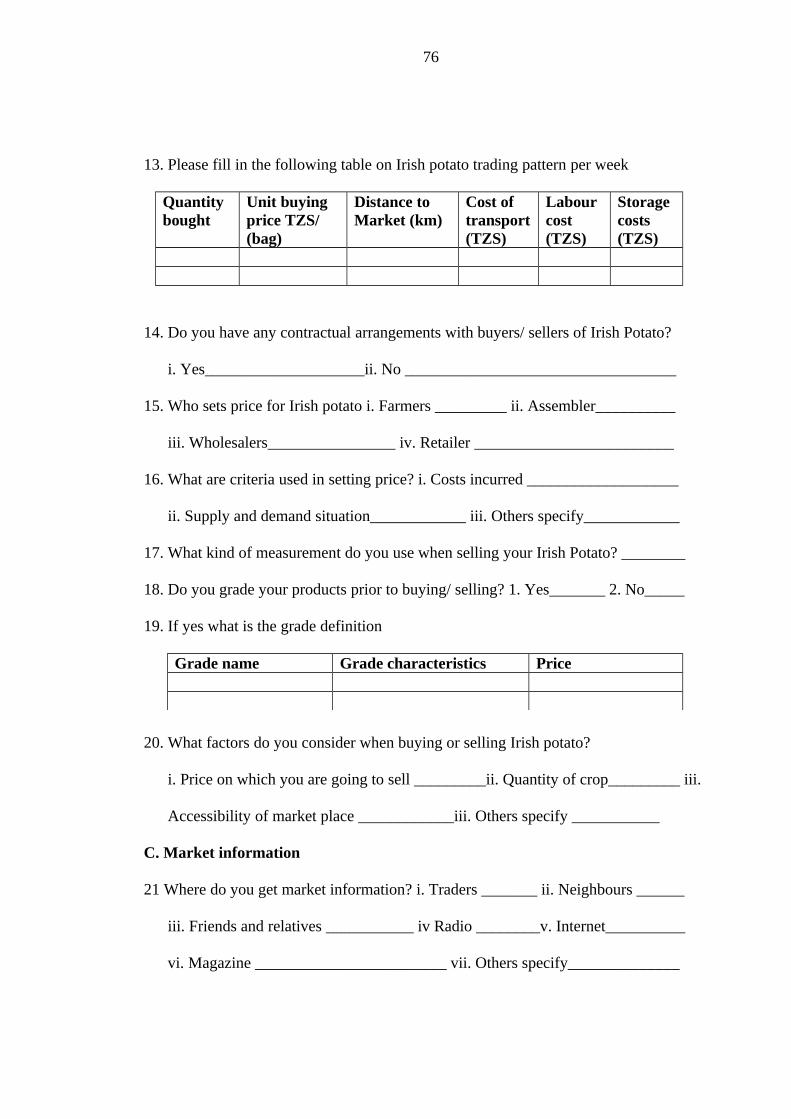
13. Please fill in the following table on Irish potato trading pattern per week
Quantity bought
Unit buying price TZS/(bag)
Distance to Market (km)
Cost of transport (TZS)
Labour cost (TZS)
Storage costs (TZS)
14. Do you have any contractual arrangements with buyers/ sellers of Irish Potato?
i. Yes____________________ii. No __________________________________
15. Who sets price for Irish potato i. Farmers _________ ii. Assembler__________
iii. Wholesalers________________ iv. Retailer _________________________
16. What are criteria used in setting price? i. Costs incurred ___________________
ii. Supply and demand situation____________ iii. Others specify____________
17. What kind of measurement do you use when selling your Irish Potato? ________
18. Do you grade your products prior to buying/ selling? 1. Yes_______ 2. No_____
19. If yes what is the grade definition
Grade name Grade characteristics Price
20. What factors do you consider when buying or selling Irish potato?
i. Price on which you are going to sell _________ii. Quantity of crop_________ iii.
Accessibility of market place ____________iii. Others specify ___________
C. Market information
21 Where do you get market information? i. Traders _______ ii. Neighbours ______
iii. Friends and relatives ___________ iv Radio ________v. Internet__________
vi. Magazine ________________________ vii. Others specify______________
76
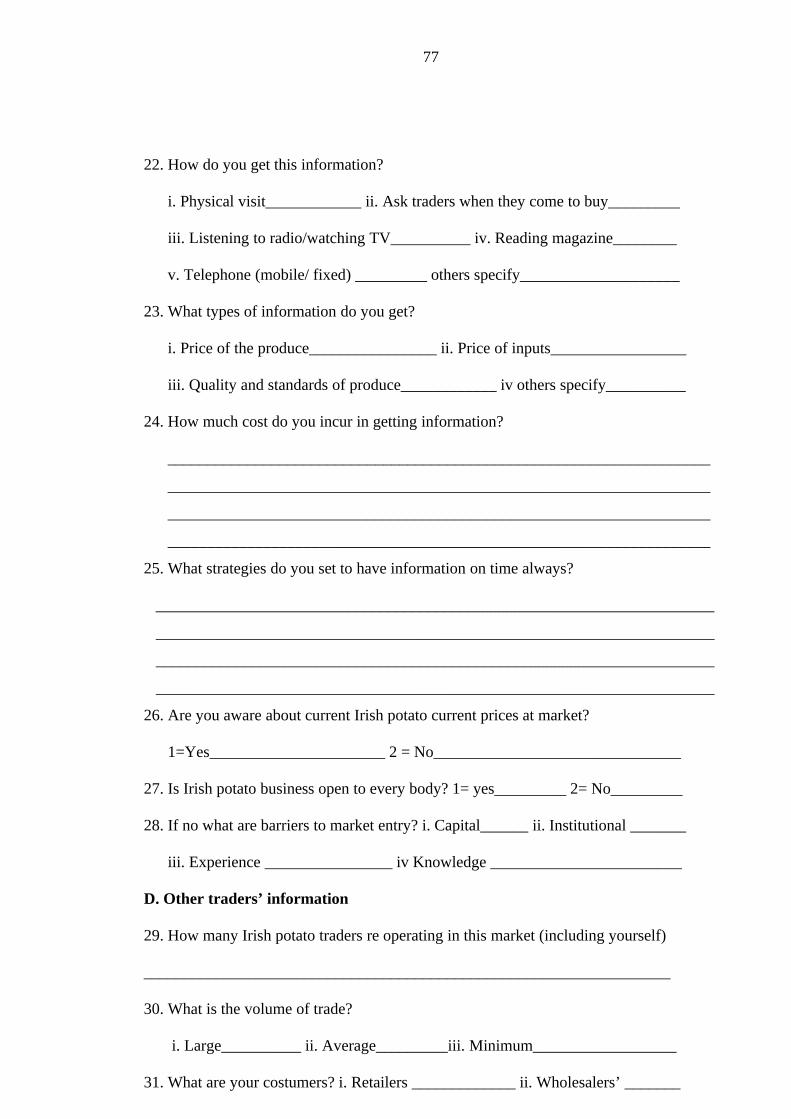
22. How do you get this information?
i. Physical visit____________ ii. Ask traders when they come to buy_________
iii. Listening to radio/watching TV__________ iv. Reading magazine________
v. Telephone (mobile/ fixed) _________ others specify____________________
23. What types of information do you get?
i. Price of the produce________________ ii. Price of inputs_________________
iii. Quality and standards of produce____________ iv others specify__________
24. How much cost do you incur in getting information?
____________________________________________________________________
____________________________________________________________________
____________________________________________________________________
____________________________________________________________________
25. What strategies do you set to have information on time always?
______________________________________________________________________
______________________________________________________________________
______________________________________________________________________
______________________________________________________________________
26. Are you aware about current Irish potato current prices at market?
1=Yes______________________ 2 = No_______________________________
27. Is Irish potato business open to every body? 1= yes_________ 2= No_________
28. If no what are barriers to market entry? i. Capital______ ii. Institutional _______
iii. Experience ________________ iv Knowledge ________________________
D. Other traders’ information
29. How many Irish potato traders re operating in this market (including yourself)
__________________________________________________________________
30. What is the volume of trade?
i. Large__________ ii. Average_________iii. Minimum__________________
31. What are your costumers? i. Retailers _____________ ii. Wholesalers’ _______
77
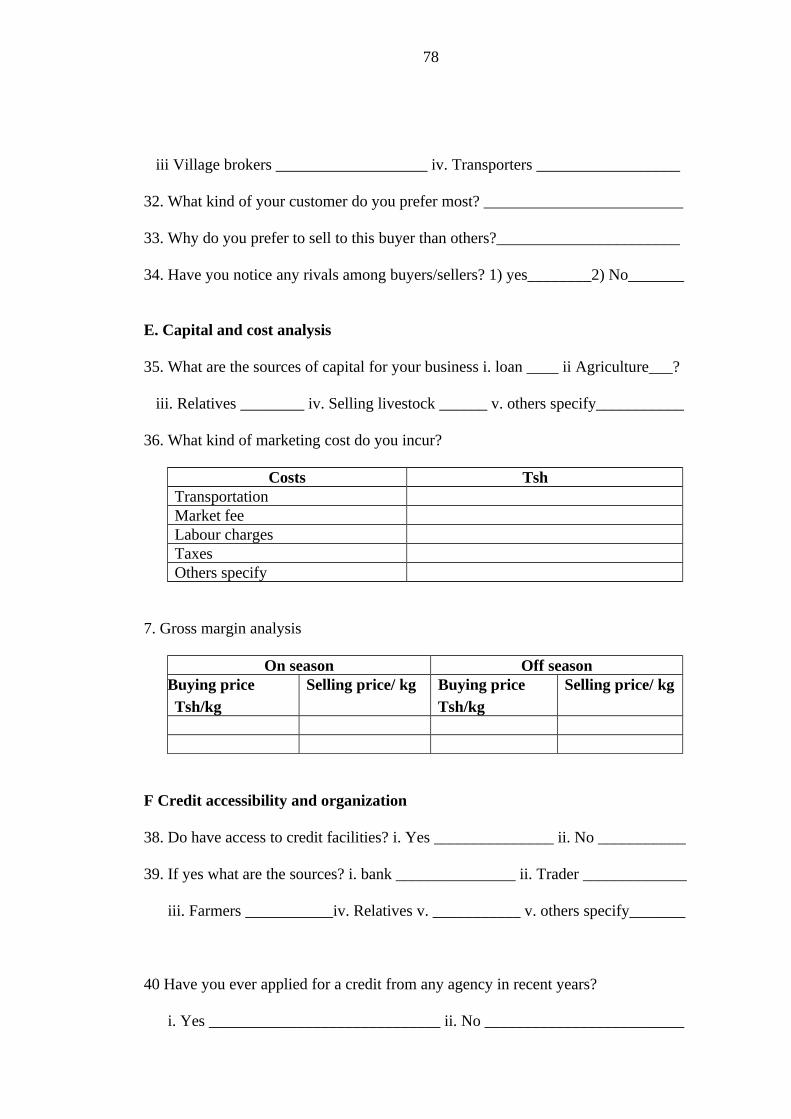
iii Village brokers ___________________ iv. Transporters __________________
32. What kind of your customer do you prefer most? _________________________
33. Why do you prefer to sell to this buyer than others?_______________________
34. Have you notice any rivals among buyers/sellers? 1) yes________2) No_______
E. Capital and cost analysis
35. What are the sources of capital for your business i. loan ____ ii Agriculture___?
iii. Relatives ________ iv. Selling livestock ______ v. others specify___________
36. What kind of marketing cost do you incur?
Costs TshTransportationMarket feeLabour chargesTaxesOthers specify
7. Gross margin analysis
On season Off seasonBuying price Tsh/kg
Selling price/ kg Buying price Tsh/kg
Selling price/ kg
F Credit accessibility and organization
38. Do have access to credit facilities? i. Yes _______________ ii. No ___________
39. If yes what are the sources? i. bank _______________ ii. Trader _____________
iii. Farmers ___________iv. Relatives v. ___________ v. others specify_______
40 Have you ever applied for a credit from any agency in recent years?
i. Yes _____________________________ ii. No _________________________
78
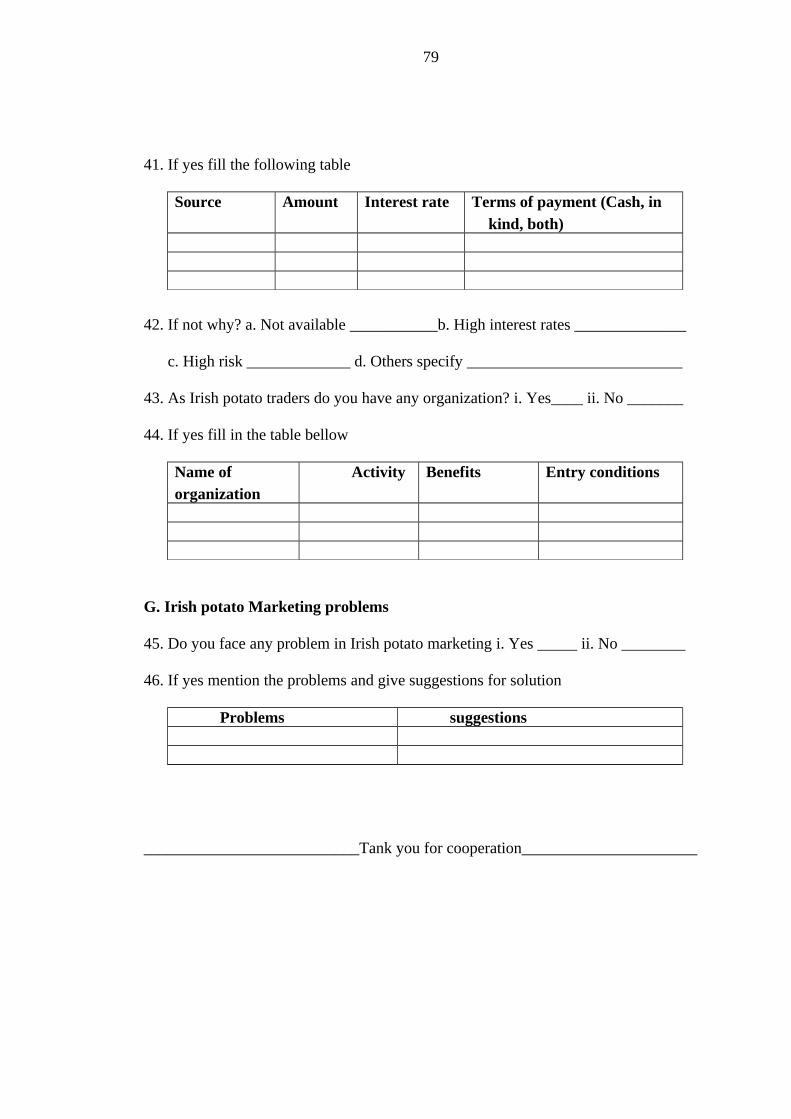
41. If yes fill the following table
Source Amount Interest rate Terms of payment (Cash, in kind, both)
42. If not why? a. Not available ___________b. High interest rates ______________
c. High risk _____________ d. Others specify ___________________________
43. As Irish potato traders do you have any organization? i. Yes____ ii. No _______
44. If yes fill in the table bellow
Name of organization
Activity Benefits Entry conditions
G. Irish potato Marketing problems
45. Do you face any problem in Irish potato marketing i. Yes _____ ii. No ________
46. If yes mention the problems and give suggestions for solution
Problems suggestions
___________________________Tank you for cooperation______________________
79
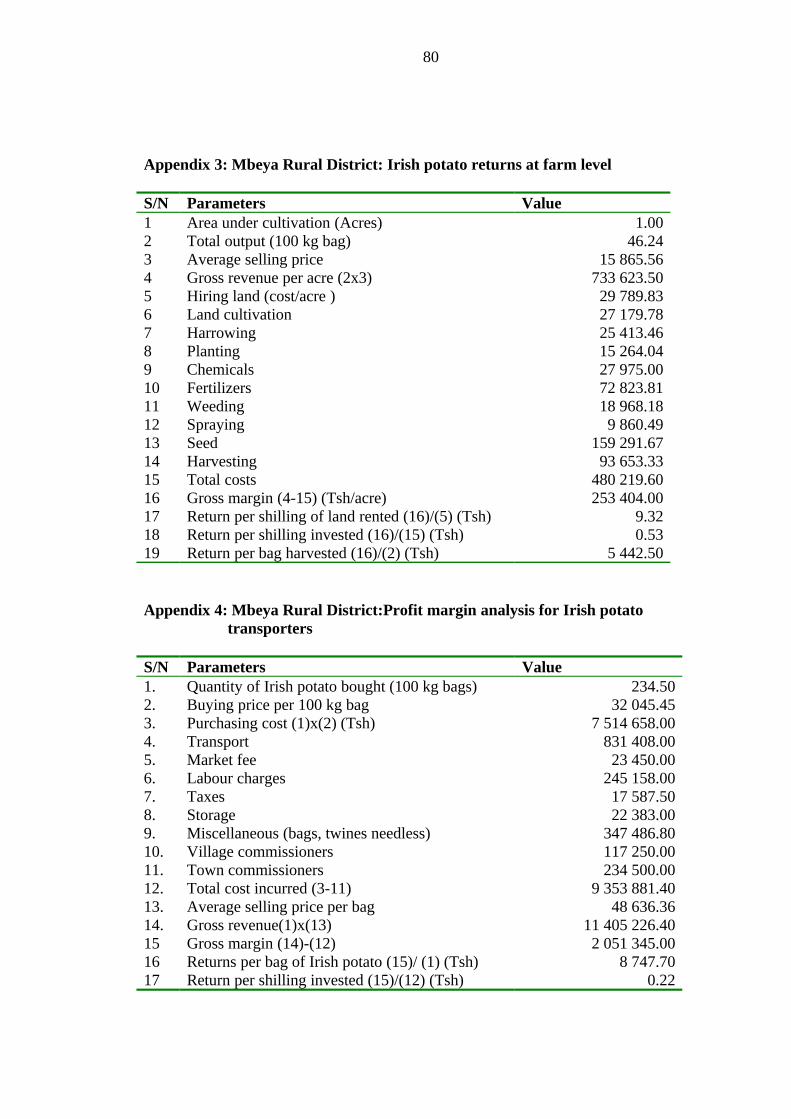
Appendix 3: Mbeya Rural District: Irish potato returns at farm level
S/N Parameters Value1 Area under cultivation (Acres) 1.002 Total output (100 kg bag) 46.243 Average selling price 15 865.564 Gross revenue per acre (2x3) 733 623.505 Hiring land (cost/acre ) 29 789.836 Land cultivation 27 179.787 Harrowing 25 413.468 Planting 15 264.049 Chemicals 27 975.0010 Fertilizers 72 823.8111 Weeding 18 968.1812 Spraying 9 860.4913 Seed 159 291.6714 Harvesting 93 653.3315 Total costs 480 219.6016 Gross margin (4-15) (Tsh/acre) 253 404.0017 Return per shilling of land rented (16)/(5) (Tsh) 9.3218 Return per shilling invested (16)/(15) (Tsh) 0.5319 Return per bag harvested (16)/(2) (Tsh) 5 442.50
Appendix 4: Mbeya Rural District:Profit margin analysis for Irish potato transporters
S/N Parameters Value1. Quantity of Irish potato bought (100 kg bags) 234.502. Buying price per 100 kg bag 32 045.453. Purchasing cost (1)x(2) (Tsh) 7 514 658.004. Transport 831 408.005. Market fee 23 450.006. Labour charges 245 158.007. Taxes 17 587.508. Storage 22 383.009. Miscellaneous (bags, twines needless) 347 486.8010. Village commissioners 117 250.0011. Town commissioners 234 500.0012. Total cost incurred (3-11) 9 353 881.4013. Average selling price per bag 48 636.3614. Gross revenue(1)x(13) 11 405 226.4015 Gross margin (14)-(12) 2 051 345.0016 Returns per bag of Irish potato (15)/ (1) (Tsh) 8 747.7017 Return per shilling invested (15)/(12) (Tsh) 0.22
80
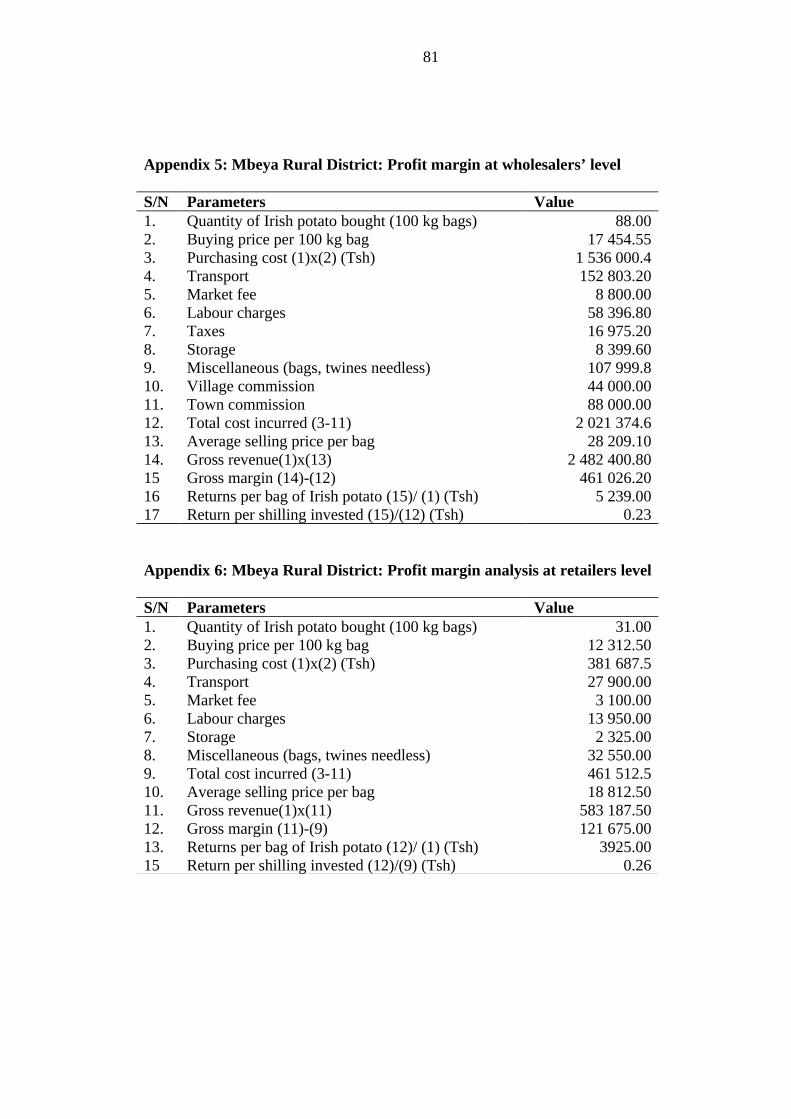
Appendix 5: Mbeya Rural District: Profit margin at wholesalers’ level
S/N Parameters Value1. Quantity of Irish potato bought (100 kg bags) 88.002. Buying price per 100 kg bag 17 454.553. Purchasing cost (1)x(2) (Tsh) 1 536 000.44. Transport 152 803.205. Market fee 8 800.006. Labour charges 58 396.807. Taxes 16 975.208. Storage 8 399.609. Miscellaneous (bags, twines needless) 107 999.810. Village commission 44 000.0011. Town commission 88 000.0012. Total cost incurred (3-11) 2 021 374.613. Average selling price per bag 28 209.1014. Gross revenue(1)x(13) 2 482 400.8015 Gross margin (14)-(12) 461 026.2016 Returns per bag of Irish potato (15)/ (1) (Tsh) 5 239.0017 Return per shilling invested (15)/(12) (Tsh) 0.23
Appendix 6: Mbeya Rural District: Profit margin analysis at retailers level
S/N Parameters Value1. Quantity of Irish potato bought (100 kg bags) 31.002. Buying price per 100 kg bag 12 312.503. Purchasing cost (1)x(2) (Tsh) 381 687.54. Transport 27 900.005. Market fee 3 100.006. Labour charges 13 950.007. Storage 2 325.008. Miscellaneous (bags, twines needless) 32 550.009. Total cost incurred (3-11) 461 512.510. Average selling price per bag 18 812.5011. Gross revenue(1)x(11) 583 187.5012. Gross margin (11)-(9) 121 675.0013. Returns per bag of Irish potato (12)/ (1) (Tsh) 3925.0015 Return per shilling invested (12)/(9) (Tsh) 0.26
81
Related Documents