© 2018 IJRAR November 2018, Volume 5, Issue 4 www.ijrar.org (E-ISSN 2348-1269, P- ISSN 2349-5138) IJRAR1904875 International Journal of Research and Analytical Reviews (IJRAR) www.ijrar.org 545 EVALUATION OF GROUNDWATER QUALITY OF VAIPPAR BASIN, TAMIL NADU, INDIA: A GEOINFORMATICS APPROACH 1** M.Venkatesan, 1* Sagar Chougule, 2 K. Kumaraswamy, 3 Suresh Lamani 1** UGC-BSR Research Scholar Department of Geography Bharathidasan University, Tiruchirappalli – 620 024 1* Department of Geography Bharathidasan University, Tiruchirappalli – 620 024 3 Faculty Department of Geoinformatics Karnataka State Rural Development and Panchyat Raj University, Gadag 2 UGC BSR Faculty Fellow, Department of Geography Bharathidasan University, Tiruchirappalli – 620 024 ABSTRACT The Vaippar Basin, one of the important basins of Tamil Nadu is located between 9° 0' 05" & 9° 44' 56" N latitudes and 77° 23' 25" & 78° 17' 02" E longitudes with an area of 5339 sq.km. Groundwater samples were collected from 91 different locations in Vaippar basin, Tamil Nadu, India. Groundwater quality data for the period of 30 years (1983 to 2013) of both pre-monsoon and post-monsoon periods were used to analyze the groundwater quality aspects of the Vaippar basin. The physico-chemical parameters such as HCO3-, Ca2+, Mg2+, Na+, K+, SO4-, NO3- and Cl have been analyzed to determine geological and non-geological source of contamination. Overall hydro geochemical analytical study using Electrical Conductivity, Sodium Adsorption Ratio (SAR) and Sodium percentage (Na%) values reveals that most of the groundwater samples collected from the study area are evaluation of water quality purpose. The results were evaluated in detail and compared with water quality standards of World Health Organization (WHO, 2011). In the USSL method, in the study area C2S1, C3S1, C3S2, C4S2, C4S3 and C4S1 type of groundwater quality categories observed. The Piper diagram illustrates that most of the water samples are mixed Ca+Mg+Cl and Na+Cl types and variation of cation and anions. These values were taken into GIS (Geographical Information System) platform for further processing to understand the spatial variation. Keywords: Evaluation of water quality, Geoinformatics, Vaippar basin. -------------------------------------------------------------------------------------------------------------- Introduction Water is the most essential element of life on the earth compared to all other natural resources. Simply we can say it as the “Elixir of Life”. India is an agrarian economy and water is inevitable for agricultural purposes and all other activities. Water and land are the most important resources in our country. Prosperity of the country depends on how carefully these resources are utilized. It has been established that the total quantity of water in the order of ready availability viz. a) open water bodies b) ground water c) Ocean and d) atmospheric moisture.

Welcome message from author
This document is posted to help you gain knowledge. Please leave a comment to let me know what you think about it! Share it to your friends and learn new things together.
Transcript
© 2018 IJRAR November 2018, Volume 5, Issue 4 www.ijrar.org (E-ISSN 2348-1269, P- ISSN 2349-5138)
IJRAR1904875 International Journal of Research and Analytical Reviews (IJRAR) www.ijrar.org 545
EVALUATION OF GROUNDWATER QUALITY OF VAIPPAR BASIN, TAMIL
NADU, INDIA: A GEOINFORMATICS APPROACH
1**M.Venkatesan, 1*Sagar Chougule, 2K. Kumaraswamy, 3Suresh Lamani
1**UGC-BSR Research Scholar Department of Geography Bharathidasan University, Tiruchirappalli – 620 024
1*Department of Geography Bharathidasan University, Tiruchirappalli – 620 024 3 Faculty Department of Geoinformatics Karnataka State Rural Development and Panchyat Raj University, Gadag 2 UGC BSR Faculty Fellow, Department of Geography Bharathidasan University, Tiruchirappalli – 620 024
ABSTRACT
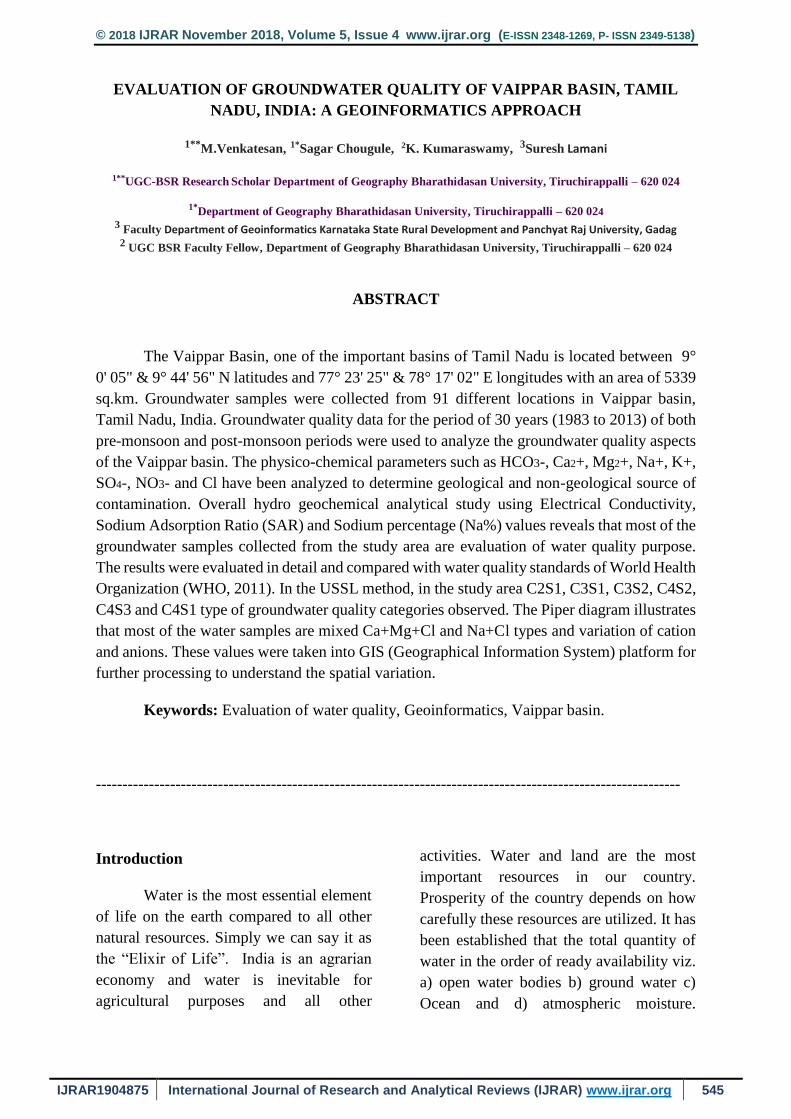
The Vaippar Basin, one of the important basins of Tamil Nadu is located between 9°
0' 05" & 9° 44' 56" N latitudes and 77° 23' 25" & 78° 17' 02" E longitudes with an area of 5339
sq.km. Groundwater samples were collected from 91 different locations in Vaippar basin,
Tamil Nadu, India. Groundwater quality data for the period of 30 years (1983 to 2013) of both
pre-monsoon and post-monsoon periods were used to analyze the groundwater quality aspects
of the Vaippar basin. The physico-chemical parameters such as HCO3-, Ca2+, Mg2+, Na+, K+,
SO4-, NO3- and Cl have been analyzed to determine geological and non-geological source of
contamination. Overall hydro geochemical analytical study using Electrical Conductivity,
Sodium Adsorption Ratio (SAR) and Sodium percentage (Na%) values reveals that most of the
groundwater samples collected from the study area are evaluation of water quality purpose.
The results were evaluated in detail and compared with water quality standards of World Health
Organization (WHO, 2011). In the USSL method, in the study area C2S1, C3S1, C3S2, C4S2,
C4S3 and C4S1 type of groundwater quality categories observed. The Piper diagram illustrates
that most of the water samples are mixed Ca+Mg+Cl and Na+Cl types and variation of cation
and anions. These values were taken into GIS (Geographical Information System) platform for
further processing to understand the spatial variation.
Keywords: Evaluation of water quality, Geoinformatics, Vaippar basin.
--------------------------------------------------------------------------------------------------------------
Introduction
Water is the most essential element
of life on the earth compared to all other
natural resources. Simply we can say it as
the “Elixir of Life”. India is an agrarian
economy and water is inevitable for
agricultural purposes and all other
activities. Water and land are the most
important resources in our country.
Prosperity of the country depends on how
carefully these resources are utilized. It has
been established that the total quantity of
water in the order of ready availability viz.
a) open water bodies b) ground water c)
Ocean and d) atmospheric moisture.
© 2018 IJRAR November 2018, Volume 5, Issue 4 www.ijrar.org (E-ISSN 2348-1269, P- ISSN 2349-5138)
IJRAR1904875 International Journal of Research and Analytical Reviews (IJRAR) www.ijrar.org 546
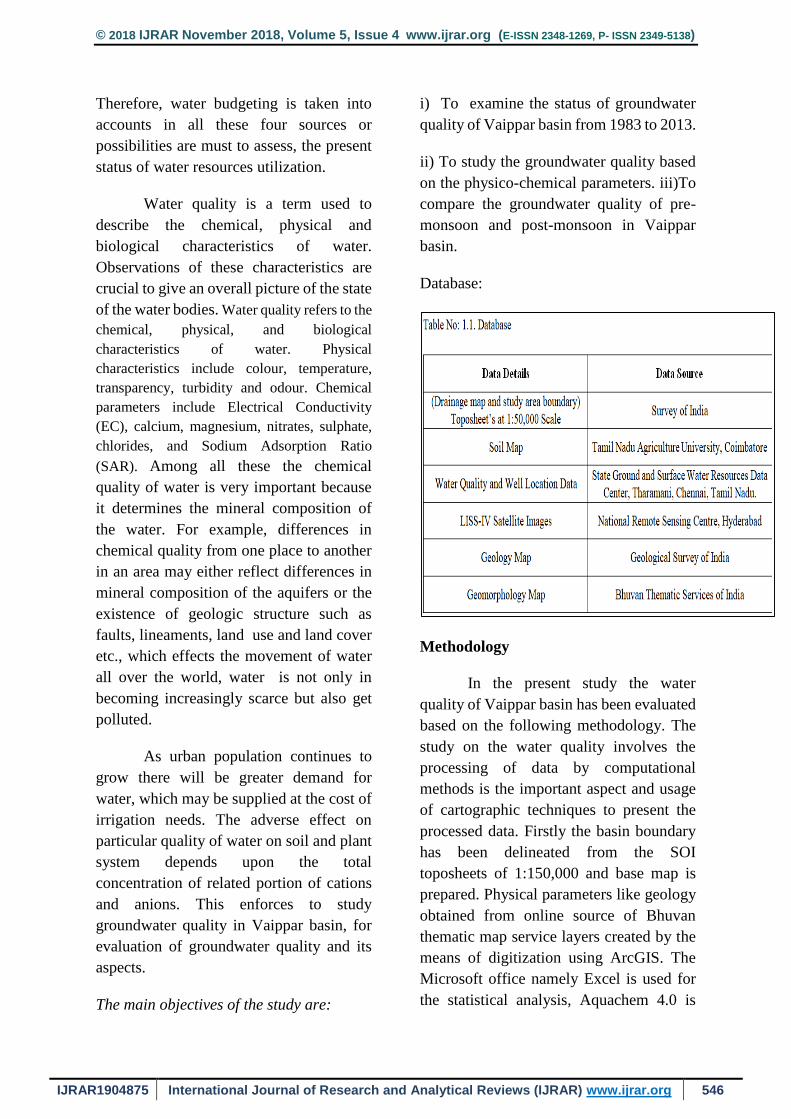
Therefore, water budgeting is taken into
accounts in all these four sources or
possibilities are must to assess, the present
status of water resources utilization.
Water quality is a term used to
describe the chemical, physical and
biological characteristics of water.
Observations of these characteristics are
crucial to give an overall picture of the state
of the water bodies. Water quality refers to the
chemical, physical, and biological
characteristics of water. Physical
characteristics include colour, temperature,
transparency, turbidity and odour. Chemical
parameters include Electrical Conductivity
(EC), calcium, magnesium, nitrates, sulphate,
chlorides, and Sodium Adsorption Ratio
(SAR). Among all these the chemical
quality of water is very important because
it determines the mineral composition of
the water. For example, differences in
chemical quality from one place to another
in an area may either reflect differences in
mineral composition of the aquifers or the
existence of geologic structure such as
faults, lineaments, land use and land cover
etc., which effects the movement of water
all over the world, water is not only in
becoming increasingly scarce but also get
polluted.
As urban population continues to
grow there will be greater demand for
water, which may be supplied at the cost of
irrigation needs. The adverse effect on
particular quality of water on soil and plant
system depends upon the total
concentration of related portion of cations
and anions. This enforces to study
groundwater quality in Vaippar basin, for
evaluation of groundwater quality and its
aspects.
The main objectives of the study are:
i) To examine the status of groundwater
quality of Vaippar basin from 1983 to 2013.
ii) To study the groundwater quality based
on the physico-chemical parameters. iii)To
compare the groundwater quality of pre-
monsoon and post-monsoon in Vaippar
basin.
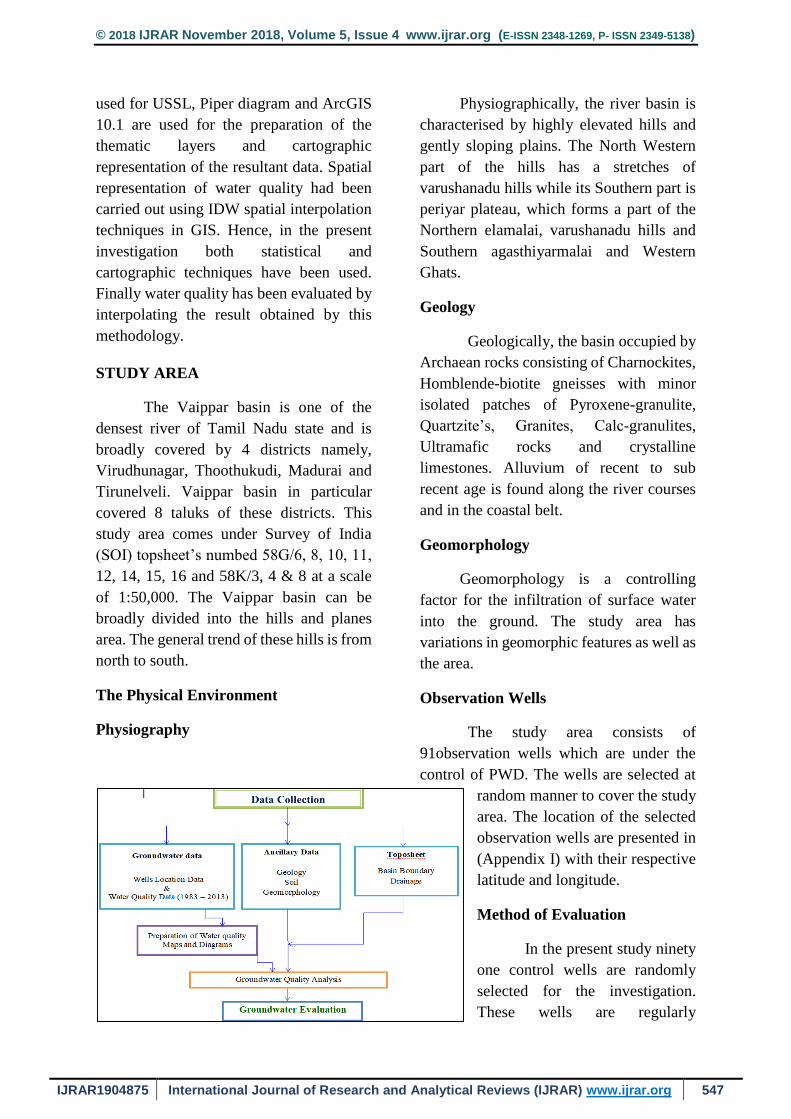
Database:
Methodology
In the present study the water
quality of Vaippar basin has been evaluated
based on the following methodology. The
study on the water quality involves the
processing of data by computational
methods is the important aspect and usage
of cartographic techniques to present the
processed data. Firstly the basin boundary
has been delineated from the SOI
toposheets of 1:150,000 and base map is
prepared. Physical parameters like geology
obtained from online source of Bhuvan
thematic map service layers created by the
means of digitization using ArcGIS. The
Microsoft office namely Excel is used for
the statistical analysis, Aquachem 4.0 is
© 2018 IJRAR November 2018, Volume 5, Issue 4 www.ijrar.org (E-ISSN 2348-1269, P- ISSN 2349-5138)
IJRAR1904875 International Journal of Research and Analytical Reviews (IJRAR) www.ijrar.org 547
used for USSL, Piper diagram and ArcGIS
10.1 are used for the preparation of the
thematic layers and cartographic
representation of the resultant data. Spatial
representation of water quality had been
carried out using IDW spatial interpolation
techniques in GIS. Hence, in the present
investigation both statistical and
cartographic techniques have been used.
Finally water quality has been evaluated by
interpolating the result obtained by this
methodology.
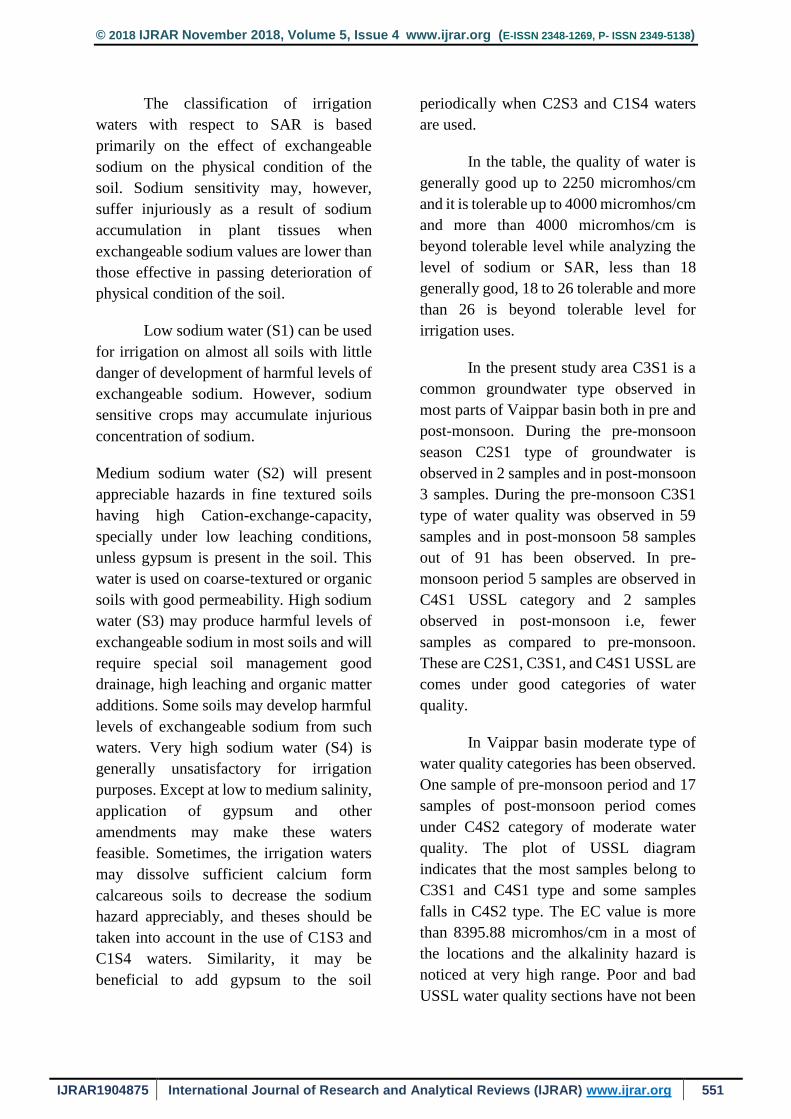
STUDY AREA
The Vaippar basin is one of the
densest river of Tamil Nadu state and is
broadly covered by 4 districts namely,
Virudhunagar, Thoothukudi, Madurai and
Tirunelveli. Vaippar basin in particular
covered 8 taluks of these districts. This
study area comes under Survey of India
(SOI) topsheet’s numbed 58G/6, 8, 10, 11,
12, 14, 15, 16 and 58K/3, 4 & 8 at a scale
of 1:50,000. The Vaippar basin can be
broadly divided into the hills and planes
area. The general trend of these hills is from
north to south.
The Physical Environment
Physiography
Physiographically, the river basin is
characterised by highly elevated hills and
gently sloping plains. The North Western
part of the hills has a stretches of
varushanadu hills while its Southern part is
periyar plateau, which forms a part of the
Northern elamalai, varushanadu hills and
Southern agasthiyarmalai and Western
Ghats.
Geology
Geologically, the basin occupied by
Archaean rocks consisting of Charnockites,
Homblende-biotite gneisses with minor
isolated patches of Pyroxene-granulite,
Quartzite’s, Granites, Calc-granulites,
Ultramafic rocks and crystalline
limestones. Alluvium of recent to sub
recent age is found along the river courses
and in the coastal belt.
Geomorphology
Geomorphology is a controlling
factor for the infiltration of surface water
into the ground. The study area has
variations in geomorphic features as well as
the area.
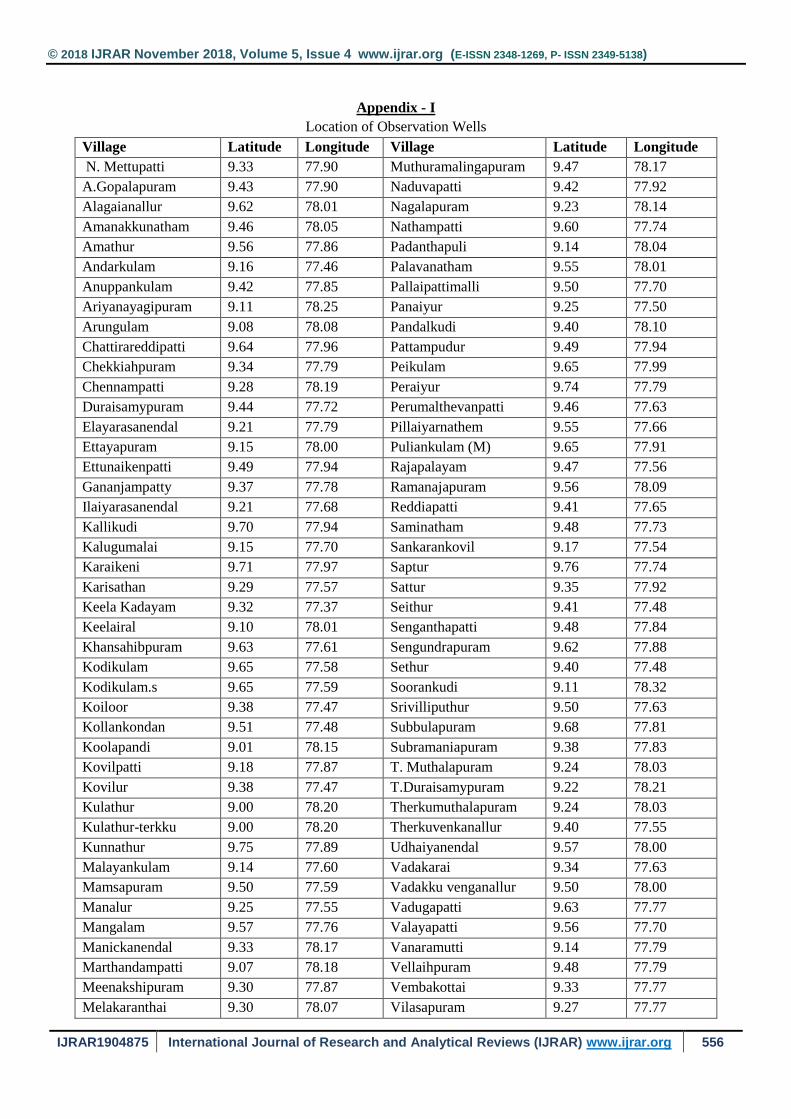
Observation Wells
The study area consists of
91observation wells which are under the
control of PWD. The wells are selected at
random manner to cover the study
area. The location of the selected
observation wells are presented in
(Appendix I) with their respective
latitude and longitude.
Method of Evaluation
In the present study ninety
one control wells are randomly
selected for the investigation.
These wells are regularly
© 2018 IJRAR November 2018, Volume 5, Issue 4 www.ijrar.org (E-ISSN 2348-1269, P- ISSN 2349-5138)
IJRAR1904875 International Journal of Research and Analytical Reviews (IJRAR) www.ijrar.org 548
monitored and maintain by Public Work
Department (PWD) of government of
Tamil Nadu.
The piper diagram methods have
been adopted to classify the groundwater
into cation and anion groups. The chemical
content of which does not exceed 50
percent in any of the types is considered as
intermediate mixed waters. The anion and
the cations variations have been graphically
represented for two periods and
interpolated maps have been drawn to show
the spatial distribution of considered
parameters.
Hydrogeochemical Variations
The hydro geochemical status of the
groundwater is cumulative function of its
reaction with soil, lithology of water
bearing formations, the residence time in
the formation along the direction of its
movement from the place of reaction
(recharge to discharge) (Sastri 1994).
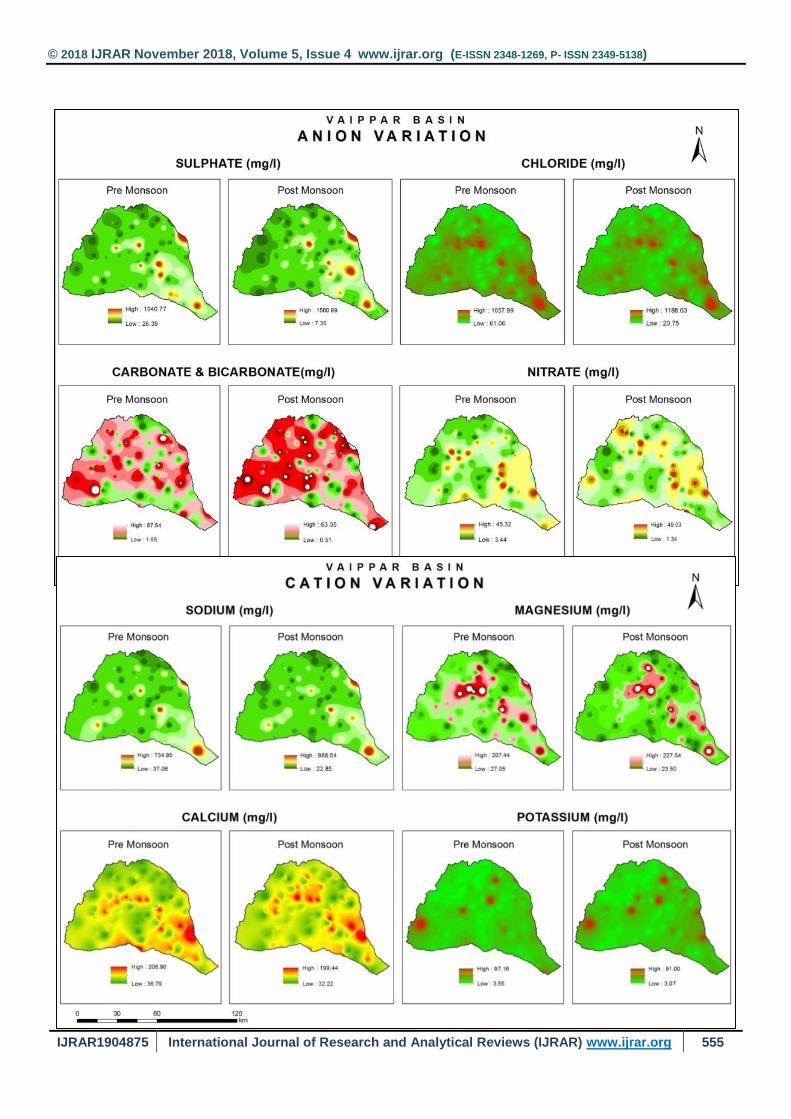
Cation Variation
Major cations such as calcium,
magnesium, sodium and potassium have
been taken into consideration as far as
cation variation is concerned cation
concentration is worked out for two seasons
namely pre-monsoon and post-monsoon.
Sodium
The highest concentration of Sodium
within the entire basin is in between 22.85
mg/l to 988.54 mg/l. The concentration is
same as that of post-monsoon period. In
post-monsoon the lowest concentration of
sodium observed in Ramanajapuram
village and the highest sodium
concentration falls in Watrap village. The
concentration of sodium is less in pre-
monsoon period than the post-monsoon
season.
Magnesium
Most of the groundwater contains
relatively small amount of magnesium,
except where they have been in contact
with dolomite. The concentration of
Magnesium range from 27.05 mg/l to
207.44 mg/l in pre-monsoon season. In
post-monsoon seasons, these values
changes between 23.50 mg/l and 227.54
mg/l. In both seasons the highest values
marked in central, north east and lower
portions of the basin and highest values
present in the east of the basin.
Calcium
The concentration of Calcium varies
from 36.79 mg/l to 206.90 mg/l in pre-
monsoon season and 32.22 mg/l to 199.44
mg/l during the post-monsoon season. In
both seasons the highest values are
concentrated in central, south and lower
portion of the basin. The post-monsoon
period indicates relatively less
concentration when compared to pre-
monsoon. The minimum calcium
concentration observed in Nagalapuram
village and maximum concentration
observed in Kovilankulam village.
Potassium
The values of Potassium change from 3.
55 mg/l to 97.16 mg/l and 3.07 mg/l to
91.00 mg/l. In both seasons the highest
values are identified south west, central,
north and lower portions of the basin.
During post-monsoon period potassium is
slightly low when compared to pre-
monsoon. Lower concentration of
potassium observed in Kollankondan
© 2018 IJRAR November 2018, Volume 5, Issue 4 www.ijrar.org (E-ISSN 2348-1269, P- ISSN 2349-5138)
IJRAR1904875 International Journal of Research and Analytical Reviews (IJRAR) www.ijrar.org 549
village and the higher concentration
observed in Sengundrapuram village.
Anion Variation
According to Herman Bower (1978)
the sources for carbonate and bicarbonate
includes carbon-di-oxide from the
atmosphere produced by the biota of the
soil or the activity of sulphate and bacteria
in deeper formations and various carbonate
rocks and minerals.
Sulphate
Sulphate occurs naturally in water
as a result of leaching from gypsum and
other common minerals. The pre-monsoon
period marked by high concentration of
Sulphate in the portions of West, North
West and South West. Moderate
concentration of Sulphate recorded at
central and South Eastern parts of the basin.
Chloride
Chloride is one of best indicators of
pollution (Rai 1975) and it is the most
troublesome anion for irrigation in the
sense that is more toxic than sulphate to
plants. Lochart (1995) have reported that
the taste thresholds for chloride ion in water
varied between 210 mg/l to 300 mg/l and
also the high chloride content of water
would cause unpleased for drinking.
The Chloride concentration ranges
from 61.06 mg/l to 1057.99 mg/l in pre-
monsoon and in post-monsoon 20.75 mg/l
to 1188.63 mg/l.The lowest concentration
of chloride during the monsoon period is
recorded in Pattampudur village and the
highest concentration of chloride
concentration falls in Kovilankulam
village. The lowest concentration of
chloride recorded in Kollankondan village
and the highest value of chloride
concentration falls in Kovilankulam
village.
Carbonate and Bicarbonate
The primary source of bicarbonate ions
in groundwater is dissolved carbon-di-
oxide. In Vaippar basin high level of
carbonate concentration in pre-monsoon is
found in small areas of West, Central,
North and North East. In post-monsoon the
trend of concentration of carbonate moved
to Western parts as compared to pre-
monsoon. Concentrations are noticed in the
lower portion of the basin. The
concentration in pre-monsoon period
ranges between less than 1.65 mg/l to 87.84
mg/l.
Nitrate
In Vaippar basin Nitrate values varies
between 3.44 mg/l to 45.32 mg/l (pre-
monsoon) and 1.34 mg/l to 49.03 mg/l
(post-monsoon). A moderate to low Nitrate
values is found in upper, South West, South
East and South central portions.
It is observed that during the pre-
monsoon season the highest concentration
of nitrate in falls Muthuramalingapuram
village and the lowest concentration
observed in Nathampatti village. The
lowest nitrate concentration is observed in
Kollankondan village and the highest
nitrate concentration observed in
Muthuramalingapuram village.
Introduction of Evaluation of water
quality.
Water resource evaluation has
expanded its scope in newer areas of
investigation. In recent years it has been
increasingly recognized that the quality of
© 2018 IJRAR November 2018, Volume 5, Issue 4 www.ijrar.org (E-ISSN 2348-1269, P- ISSN 2349-5138)
IJRAR1904875 International Journal of Research and Analytical Reviews (IJRAR) www.ijrar.org 550
water has greater importance than the
quantity. The physical and bacteriological
aspects of water resources are normally
applied to a few wells, which are locally
concerned with water supply (Baweja,
1980) Based on the WHO standards, a
number of studies on groundwater quality
have been attempted throughout the world.
The quality of water is a set of chemical,
physical and biological properties that
affect the use of water (Ragunath 1987)
stated that geochemical studies provide a
complete knowledge of the water resources
of a hydrological regime and they are of
value with respect to water use.
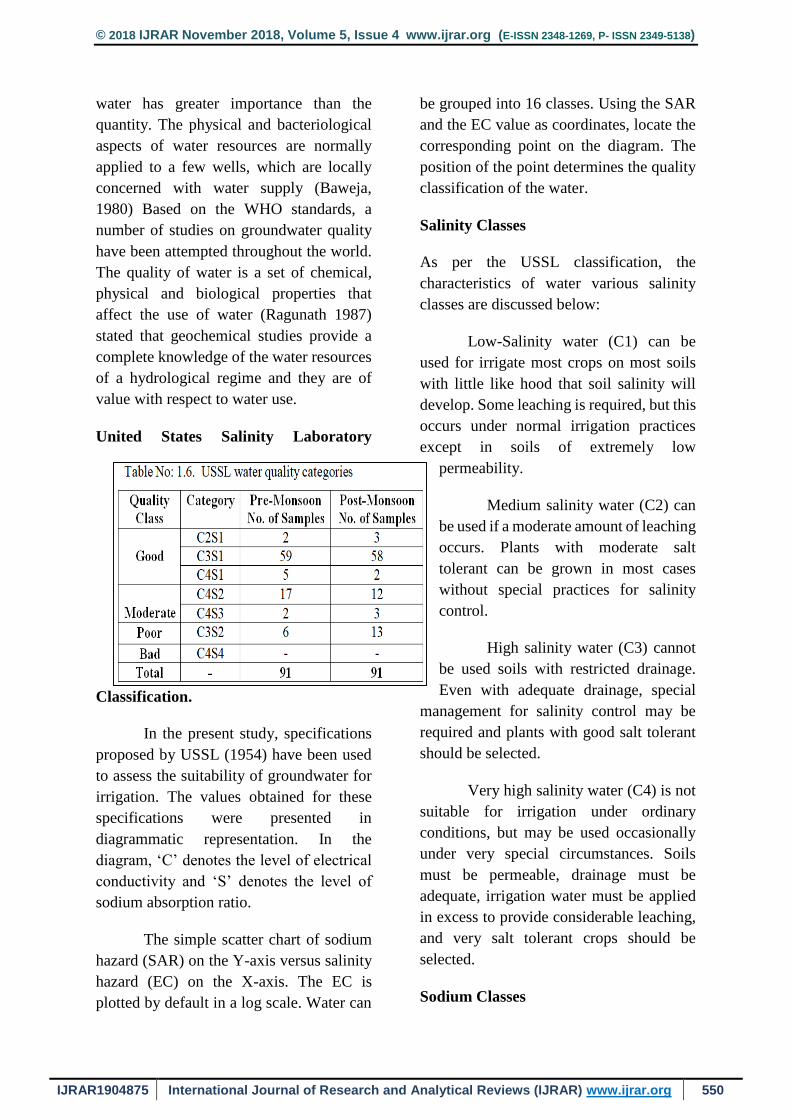
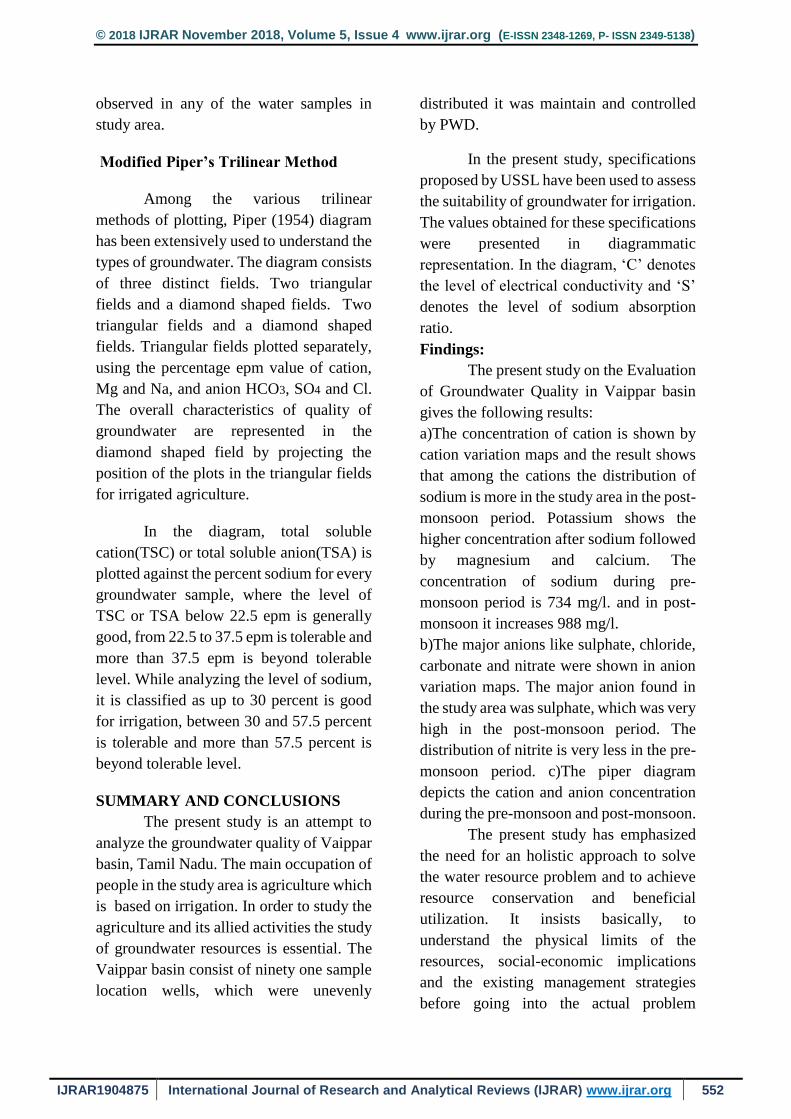
United States Salinity Laboratory
Classification.
In the present study, specifications
proposed by USSL (1954) have been used
to assess the suitability of groundwater for
irrigation. The values obtained for these
specifications were presented in
diagrammatic representation. In the
diagram, ‘C’ denotes the level of electrical
conductivity and ‘S’ denotes the level of
sodium absorption ratio.
The simple scatter chart of sodium
hazard (SAR) on the Y-axis versus salinity
hazard (EC) on the X-axis. The EC is
plotted by default in a log scale. Water can
be grouped into 16 classes. Using the SAR
and the EC value as coordinates, locate the
corresponding point on the diagram. The
position of the point determines the quality
classification of the water.
Salinity Classes
As per the USSL classification, the
characteristics of water various salinity
classes are discussed below:
Low-Salinity water (C1) can be
used for irrigate most crops on most soils
with little like hood that soil salinity will
develop. Some leaching is required, but this
occurs under normal irrigation practices
except in soils of extremely low
permeability.
Medium salinity water (C2) can
be used if a moderate amount of leaching
occurs. Plants with moderate salt
tolerant can be grown in most cases
without special practices for salinity
control.
High salinity water (C3) cannot
be used soils with restricted drainage.
Even with adequate drainage, special
management for salinity control may be
required and plants with good salt tolerant
should be selected.
Very high salinity water (C4) is not
suitable for irrigation under ordinary
conditions, but may be used occasionally
under very special circumstances. Soils
must be permeable, drainage must be
adequate, irrigation water must be applied
in excess to provide considerable leaching,
and very salt tolerant crops should be
selected.
Sodium Classes
© 2018 IJRAR November 2018, Volume 5, Issue 4 www.ijrar.org (E-ISSN 2348-1269, P- ISSN 2349-5138)
IJRAR1904875 International Journal of Research and Analytical Reviews (IJRAR) www.ijrar.org 551
The classification of irrigation
waters with respect to SAR is based
primarily on the effect of exchangeable
sodium on the physical condition of the
soil. Sodium sensitivity may, however,
suffer injuriously as a result of sodium
accumulation in plant tissues when
exchangeable sodium values are lower than
those effective in passing deterioration of
physical condition of the soil.
Low sodium water (S1) can be used
for irrigation on almost all soils with little
danger of development of harmful levels of
exchangeable sodium. However, sodium
sensitive crops may accumulate injurious
concentration of sodium.
Medium sodium water (S2) will present
appreciable hazards in fine textured soils
having high Cation-exchange-capacity,
specially under low leaching conditions,
unless gypsum is present in the soil. This
water is used on coarse-textured or organic
soils with good permeability. High sodium
water (S3) may produce harmful levels of
exchangeable sodium in most soils and will
require special soil management good
drainage, high leaching and organic matter
additions. Some soils may develop harmful
levels of exchangeable sodium from such
waters. Very high sodium water (S4) is
generally unsatisfactory for irrigation
purposes. Except at low to medium salinity,
application of gypsum and other
amendments may make these waters
feasible. Sometimes, the irrigation waters
may dissolve sufficient calcium form
calcareous soils to decrease the sodium
hazard appreciably, and theses should be
taken into account in the use of C1S3 and
C1S4 waters. Similarity, it may be
beneficial to add gypsum to the soil
periodically when C2S3 and C1S4 waters
are used.
In the table, the quality of water is
generally good up to 2250 micromhos/cm
and it is tolerable up to 4000 micromhos/cm
and more than 4000 micromhos/cm is
beyond tolerable level while analyzing the
level of sodium or SAR, less than 18
generally good, 18 to 26 tolerable and more
than 26 is beyond tolerable level for
irrigation uses.
In the present study area C3S1 is a
common groundwater type observed in
most parts of Vaippar basin both in pre and
post-monsoon. During the pre-monsoon
season C2S1 type of groundwater is
observed in 2 samples and in post-monsoon
3 samples. During the pre-monsoon C3S1
type of water quality was observed in 59
samples and in post-monsoon 58 samples
out of 91 has been observed. In pre-
monsoon period 5 samples are observed in
C4S1 USSL category and 2 samples
observed in post-monsoon i.e, fewer
samples as compared to pre-monsoon.
These are C2S1, C3S1, and C4S1 USSL are
comes under good categories of water
quality.
In Vaippar basin moderate type of
water quality categories has been observed.
One sample of pre-monsoon period and 17
samples of post-monsoon period comes
under C4S2 category of moderate water
quality. The plot of USSL diagram
indicates that the most samples belong to
C3S1 and C4S1 type and some samples
falls in C4S2 type. The EC value is more
than 8395.88 micromhos/cm in a most of
the locations and the alkalinity hazard is
noticed at very high range. Poor and bad
USSL water quality sections have not been
© 2018 IJRAR November 2018, Volume 5, Issue 4 www.ijrar.org (E-ISSN 2348-1269, P- ISSN 2349-5138)
IJRAR1904875 International Journal of Research and Analytical Reviews (IJRAR) www.ijrar.org 552
observed in any of the water samples in
study area.
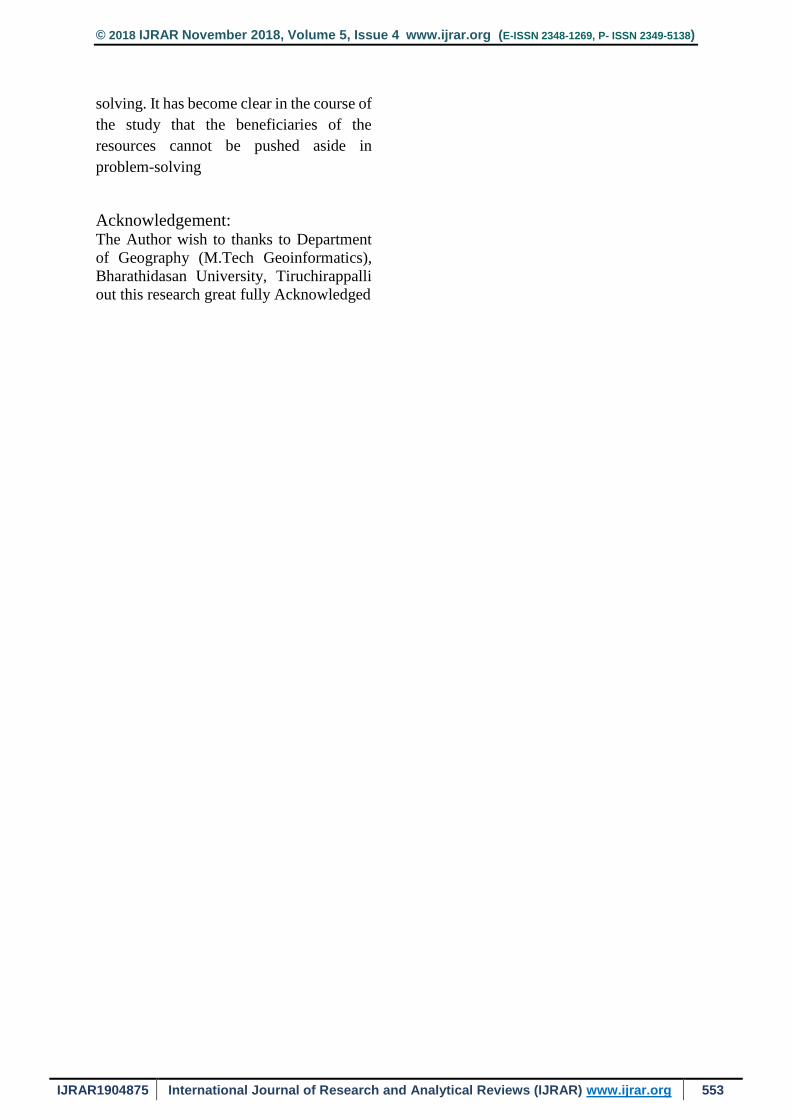
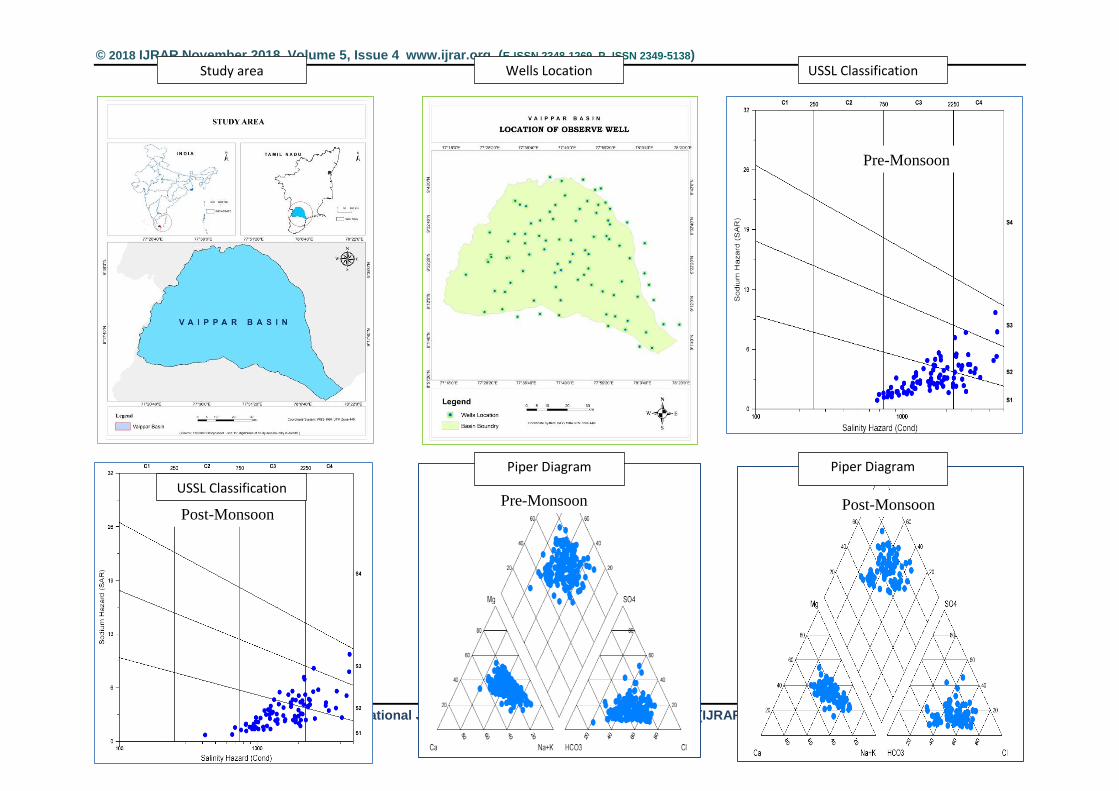
Modified Piper’s Trilinear Method
Among the various trilinear
methods of plotting, Piper (1954) diagram
has been extensively used to understand the
types of groundwater. The diagram consists
of three distinct fields. Two triangular
fields and a diamond shaped fields. Two
triangular fields and a diamond shaped
fields. Triangular fields plotted separately,
using the percentage epm value of cation,
Mg and Na, and anion HCO3, SO4 and Cl.
The overall characteristics of quality of
groundwater are represented in the
diamond shaped field by projecting the
position of the plots in the triangular fields
for irrigated agriculture.
In the diagram, total soluble
cation(TSC) or total soluble anion(TSA) is
plotted against the percent sodium for every
groundwater sample, where the level of
TSC or TSA below 22.5 epm is generally
good, from 22.5 to 37.5 epm is tolerable and
more than 37.5 epm is beyond tolerable
level. While analyzing the level of sodium,
it is classified as up to 30 percent is good
for irrigation, between 30 and 57.5 percent
is tolerable and more than 57.5 percent is
beyond tolerable level.
SUMMARY AND CONCLUSIONS
The present study is an attempt to
analyze the groundwater quality of Vaippar
basin, Tamil Nadu. The main occupation of
people in the study area is agriculture which
is based on irrigation. In order to study the
agriculture and its allied activities the study
of groundwater resources is essential. The
Vaippar basin consist of ninety one sample
location wells, which were unevenly
distributed it was maintain and controlled
by PWD.
In the present study, specifications
proposed by USSL have been used to assess
the suitability of groundwater for irrigation.
The values obtained for these specifications
were presented in diagrammatic
representation. In the diagram, ‘C’ denotes
the level of electrical conductivity and ‘S’
denotes the level of sodium absorption
ratio.
Findings:
The present study on the Evaluation
of Groundwater Quality in Vaippar basin
gives the following results:
a)The concentration of cation is shown by
cation variation maps and the result shows
that among the cations the distribution of
sodium is more in the study area in the post-
monsoon period. Potassium shows the
higher concentration after sodium followed
by magnesium and calcium. The
concentration of sodium during pre-
monsoon period is 734 mg/l. and in post-
monsoon it increases 988 mg/l.
b)The major anions like sulphate, chloride,
carbonate and nitrate were shown in anion
variation maps. The major anion found in
the study area was sulphate, which was very
high in the post-monsoon period. The
distribution of nitrite is very less in the pre-
monsoon period. c)The piper diagram
depicts the cation and anion concentration
during the pre-monsoon and post-monsoon.
The present study has emphasized
the need for an holistic approach to solve
the water resource problem and to achieve
resource conservation and beneficial
utilization. It insists basically, to
understand the physical limits of the
resources, social-economic implications
and the existing management strategies
before going into the actual problem
© 2018 IJRAR November 2018, Volume 5, Issue 4 www.ijrar.org (E-ISSN 2348-1269, P- ISSN 2349-5138)
IJRAR1904875 International Journal of Research and Analytical Reviews (IJRAR) www.ijrar.org 553
solving. It has become clear in the course of
the study that the beneficiaries of the
resources cannot be pushed aside in
problem-solving
Acknowledgement: The Author wish to thanks to Department
of Geography (M.Tech Geoinformatics),
Bharathidasan University, Tiruchirappalli
out this research great fully Acknowledged
© 2018 IJRAR November 2018, Volume 5, Issue 4 www.ijrar.org (E-ISSN 2348-1269, P- ISSN 2349-5138)
IJRAR1904875 International Journal of Research and Analytical Reviews (IJRAR) www.ijrar.org 554
Pre-Monsoon Post-Monsoon Post-Monsoon
Pre-Monsoon
Study area Wells Location USSL Classification
USSL Classification
Piper Diagram Piper Diagram
© 2018 IJRAR November 2018, Volume 5, Issue 4 www.ijrar.org (E-ISSN 2348-1269, P- ISSN 2349-5138)
IJRAR1904875 International Journal of Research and Analytical Reviews (IJRAR) www.ijrar.org 555
© 2018 IJRAR November 2018, Volume 5, Issue 4 www.ijrar.org (E-ISSN 2348-1269, P- ISSN 2349-5138)
IJRAR1904875 International Journal of Research and Analytical Reviews (IJRAR) www.ijrar.org 556
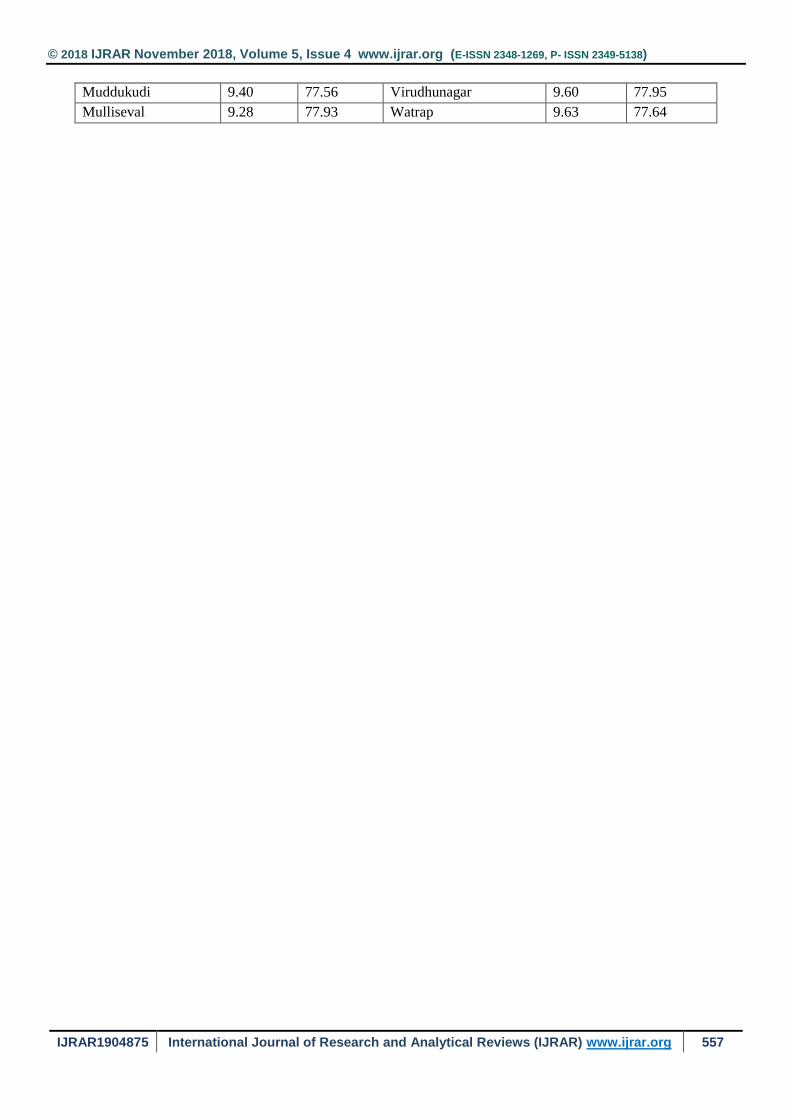
Appendix - I
Location of Observation Wells
Village Latitude Longitude Village Latitude Longitude
N. Mettupatti 9.33 77.90 Muthuramalingapuram 9.47 78.17
A.Gopalapuram 9.43 77.90 Naduvapatti 9.42 77.92
Alagaianallur 9.62 78.01 Nagalapuram 9.23 78.14
Amanakkunatham 9.46 78.05 Nathampatti 9.60 77.74
Amathur 9.56 77.86 Padanthapuli 9.14 78.04
Andarkulam 9.16 77.46 Palavanatham 9.55 78.01
Anuppankulam 9.42 77.85 Pallaipattimalli 9.50 77.70
Ariyanayagipuram 9.11 78.25 Panaiyur 9.25 77.50
Arungulam 9.08 78.08 Pandalkudi 9.40 78.10
Chattirareddipatti 9.64 77.96 Pattampudur 9.49 77.94
Chekkiahpuram 9.34 77.79 Peikulam 9.65 77.99
Chennampatti 9.28 78.19 Peraiyur 9.74 77.79
Duraisamypuram 9.44 77.72 Perumalthevanpatti 9.46 77.63
Elayarasanendal 9.21 77.79 Pillaiyarnathem 9.55 77.66
Ettayapuram 9.15 78.00 Puliankulam (M) 9.65 77.91
Ettunaikenpatti 9.49 77.94 Rajapalayam 9.47 77.56
Gananjampatty 9.37 77.78 Ramanajapuram 9.56 78.09
Ilaiyarasanendal 9.21 77.68 Reddiapatti 9.41 77.65
Kallikudi 9.70 77.94 Saminatham 9.48 77.73
Kalugumalai 9.15 77.70 Sankarankovil 9.17 77.54
Karaikeni 9.71 77.97 Saptur 9.76 77.74
Karisathan 9.29 77.57 Sattur 9.35 77.92
Keela Kadayam 9.32 77.37 Seithur 9.41 77.48
Keelairal 9.10 78.01 Senganthapatti 9.48 77.84
Khansahibpuram 9.63 77.61 Sengundrapuram 9.62 77.88
Kodikulam 9.65 77.58 Sethur 9.40 77.48
Kodikulam.s 9.65 77.59 Soorankudi 9.11 78.32
Koiloor 9.38 77.47 Srivilliputhur 9.50 77.63
Kollankondan 9.51 77.48 Subbulapuram 9.68 77.81
Koolapandi 9.01 78.15 Subramaniapuram 9.38 77.83
Kovilpatti 9.18 77.87 T. Muthalapuram 9.24 78.03
Kovilur 9.38 77.47 T.Duraisamypuram 9.22 78.21
Kulathur 9.00 78.20 Therkumuthalapuram 9.24 78.03
Kulathur-terkku 9.00 78.20 Therkuvenkanallur 9.40 77.55
Kunnathur 9.75 77.89 Udhaiyanendal 9.57 78.00
Malayankulam 9.14 77.60 Vadakarai 9.34 77.63
Mamsapuram 9.50 77.59 Vadakku venganallur 9.50 78.00
Manalur 9.25 77.55 Vadugapatti 9.63 77.77
Mangalam 9.57 77.76 Valayapatti 9.56 77.70
Manickanendal 9.33 78.17 Vanaramutti 9.14 77.79
Marthandampatti 9.07 78.18 Vellaihpuram 9.48 77.79
Meenakshipuram 9.30 77.87 Vembakottai 9.33 77.77
Melakaranthai 9.30 78.07 Vilasapuram 9.27 77.77
© 2018 IJRAR November 2018, Volume 5, Issue 4 www.ijrar.org (E-ISSN 2348-1269, P- ISSN 2349-5138)
IJRAR1904875 International Journal of Research and Analytical Reviews (IJRAR) www.ijrar.org 557
Muddukudi 9.40 77.56 Virudhunagar 9.60 77.95
Mulliseval 9.28 77.93 Watrap 9.63 77.64
© 2018 IJRAR November 2018, Volume 5, Issue 4 www.ijrar.org (E-ISSN 2348-1269, P- ISSN 2349-5138)
IJRAR1904875 International Journal of Research and Analytical Reviews (IJRAR) www.ijrar.org 558
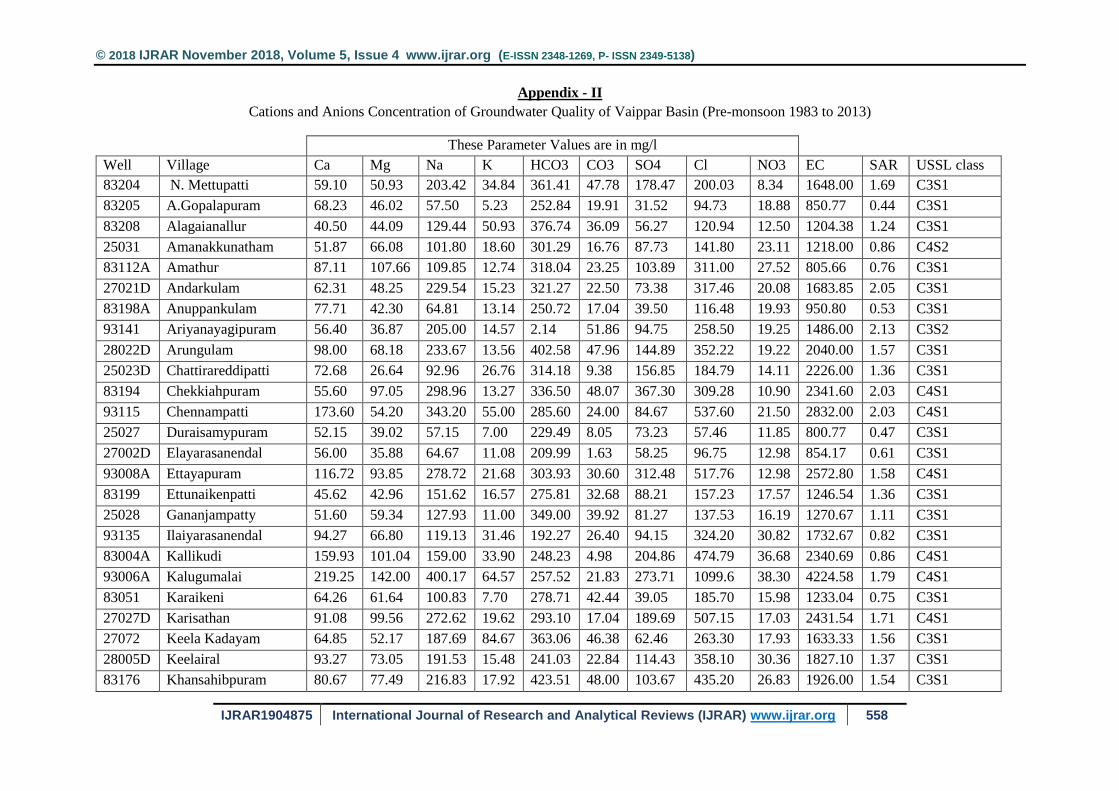
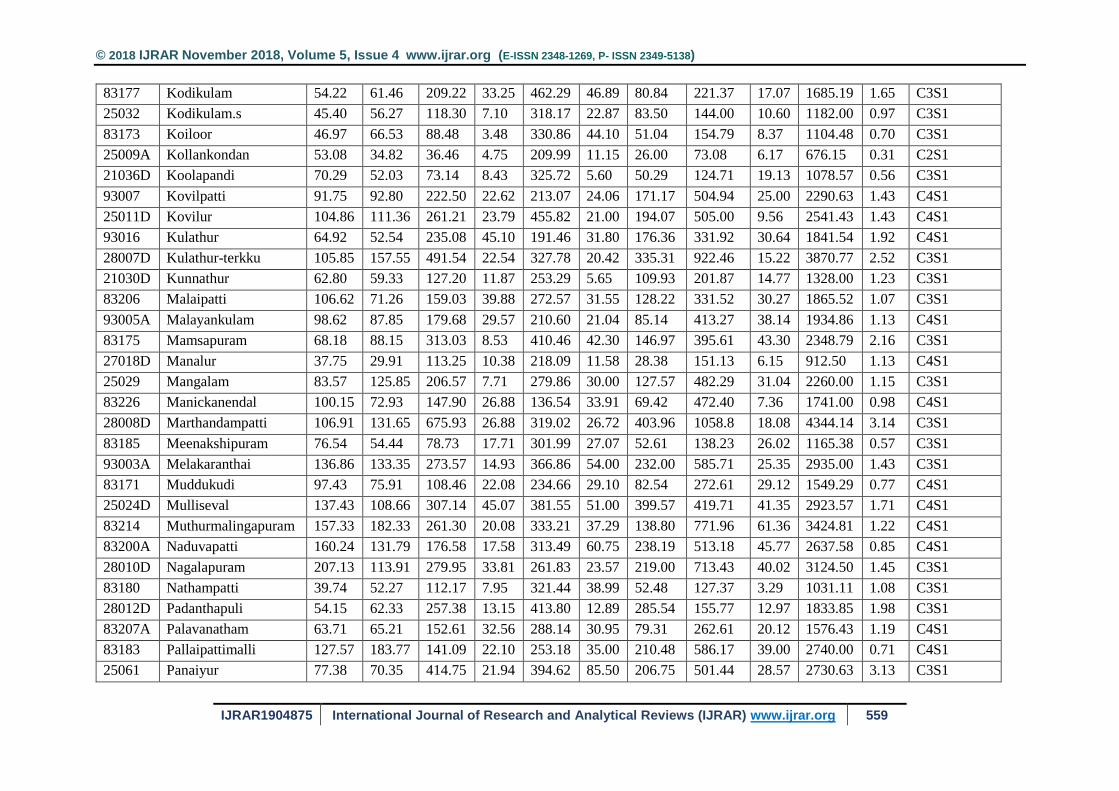
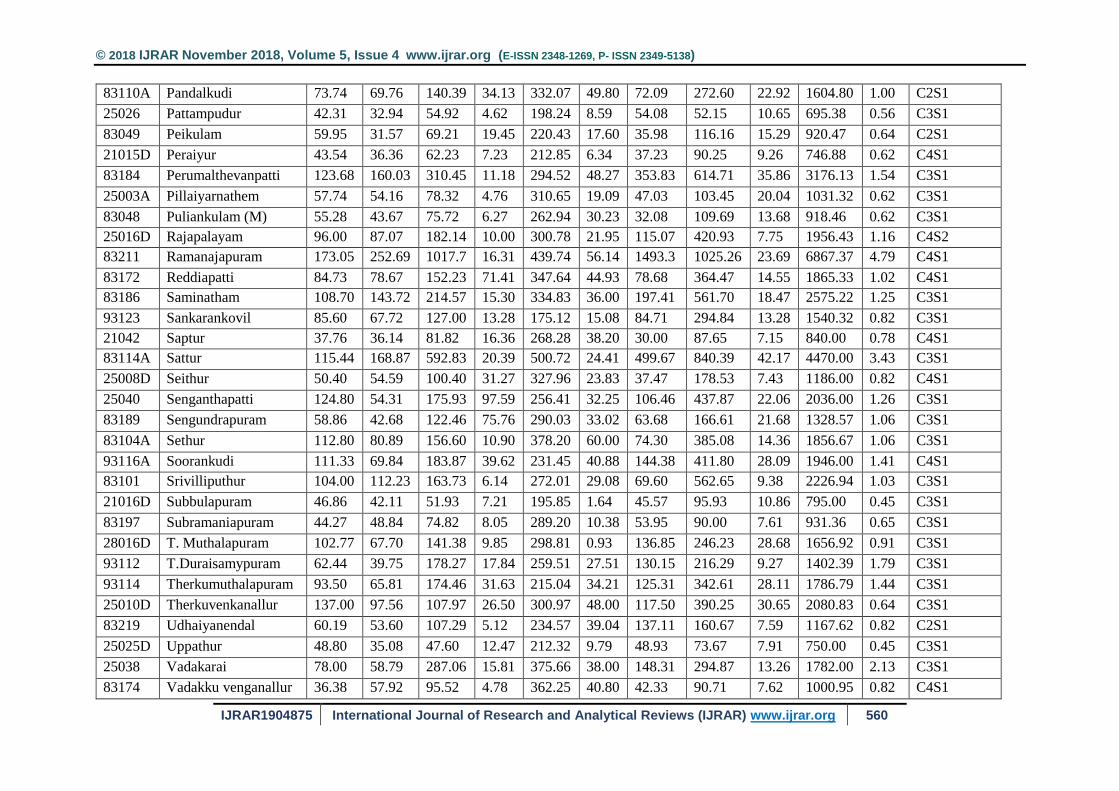
Appendix - II
Cations and Anions Concentration of Groundwater Quality of Vaippar Basin (Pre-monsoon 1983 to 2013)
These Parameter Values are in mg/l
Well Village Ca Mg Na K HCO3 CO3 SO4 Cl NO3 EC SAR USSL class
83204 N. Mettupatti 59.10 50.93 203.42 34.84 361.41 47.78 178.47 200.03 8.34 1648.00 1.69 C3S1
83205 A.Gopalapuram 68.23 46.02 57.50 5.23 252.84 19.91 31.52 94.73 18.88 850.77 0.44 C3S1
83208 Alagaianallur 40.50 44.09 129.44 50.93 376.74 36.09 56.27 120.94 12.50 1204.38 1.24 C3S1
25031 Amanakkunatham 51.87 66.08 101.80 18.60 301.29 16.76 87.73 141.80 23.11 1218.00 0.86 C4S2
83112A Amathur 87.11 107.66 109.85 12.74 318.04 23.25 103.89 311.00 27.52 805.66 0.76 C3S1
27021D Andarkulam 62.31 48.25 229.54 15.23 321.27 22.50 73.38 317.46 20.08 1683.85 2.05 C3S1
83198A Anuppankulam 77.71 42.30 64.81 13.14 250.72 17.04 39.50 116.48 19.93 950.80 0.53 C3S1
93141 Ariyanayagipuram 56.40 36.87 205.00 14.57 2.14 51.86 94.75 258.50 19.25 1486.00 2.13 C3S2
28022D Arungulam 98.00 68.18 233.67 13.56 402.58 47.96 144.89 352.22 19.22 2040.00 1.57 C3S1
25023D Chattirareddipatti 72.68 26.64 92.96 26.76 314.18 9.38 156.85 184.79 14.11 2226.00 1.36 C3S1
83194 Chekkiahpuram 55.60 97.05 298.96 13.27 336.50 48.07 367.30 309.28 10.90 2341.60 2.03 C4S1
93115 Chennampatti 173.60 54.20 343.20 55.00 285.60 24.00 84.67 537.60 21.50 2832.00 2.03 C4S1
25027 Duraisamypuram 52.15 39.02 57.15 7.00 229.49 8.05 73.23 57.46 11.85 800.77 0.47 C3S1
27002D Elayarasanendal 56.00 35.88 64.67 11.08 209.99 1.63 58.25 96.75 12.98 854.17 0.61 C3S1
93008A Ettayapuram 116.72 93.85 278.72 21.68 303.93 30.60 312.48 517.76 12.98 2572.80 1.58 C4S1
83199 Ettunaikenpatti 45.62 42.96 151.62 16.57 275.81 32.68 88.21 157.23 17.57 1246.54 1.36 C3S1
25028 Gananjampatty 51.60 59.34 127.93 11.00 349.00 39.92 81.27 137.53 16.19 1270.67 1.11 C3S1
93135 Ilaiyarasanendal 94.27 66.80 119.13 31.46 192.27 26.40 94.15 324.20 30.82 1732.67 0.82 C3S1
83004A Kallikudi 159.93 101.04 159.00 33.90 248.23 4.98 204.86 474.79 36.68 2340.69 0.86 C4S1
93006A Kalugumalai 219.25 142.00 400.17 64.57 257.52 21.83 273.71 1099.6 38.30 4224.58 1.79 C4S1
83051 Karaikeni 64.26 61.64 100.83 7.70 278.71 42.44 39.05 185.70 15.98 1233.04 0.75 C3S1
27027D Karisathan 91.08 99.56 272.62 19.62 293.10 17.04 189.69 507.15 17.03 2431.54 1.71 C4S1
27072 Keela Kadayam 64.85 52.17 187.69 84.67 363.06 46.38 62.46 263.30 17.93 1633.33 1.56 C3S1
28005D Keelairal 93.27 73.05 191.53 15.48 241.03 22.84 114.43 358.10 30.36 1827.10 1.37 C3S1
83176 Khansahibpuram 80.67 77.49 216.83 17.92 423.51 48.00 103.67 435.20 26.83 1926.00 1.54 C3S1
© 2018 IJRAR November 2018, Volume 5, Issue 4 www.ijrar.org (E-ISSN 2348-1269, P- ISSN 2349-5138)
IJRAR1904875 International Journal of Research and Analytical Reviews (IJRAR) www.ijrar.org 559
83177 Kodikulam 54.22 61.46 209.22 33.25 462.29 46.89 80.84 221.37 17.07 1685.19 1.65 C3S1
25032 Kodikulam.s 45.40 56.27 118.30 7.10 318.17 22.87 83.50 144.00 10.60 1182.00 0.97 C3S1
83173 Koiloor 46.97 66.53 88.48 3.48 330.86 44.10 51.04 154.79 8.37 1104.48 0.70 C3S1
25009A Kollankondan 53.08 34.82 36.46 4.75 209.99 11.15 26.00 73.08 6.17 676.15 0.31 C2S1
21036D Koolapandi 70.29 52.03 73.14 8.43 325.72 5.60 50.29 124.71 19.13 1078.57 0.56 C3S1
93007 Kovilpatti 91.75 92.80 222.50 22.62 213.07 24.06 171.17 504.94 25.00 2290.63 1.43 C4S1
25011D Kovilur 104.86 111.36 261.21 23.79 455.82 21.00 194.07 505.00 9.56 2541.43 1.43 C4S1
93016 Kulathur 64.92 52.54 235.08 45.10 191.46 31.80 176.36 331.92 30.64 1841.54 1.92 C4S1
28007D Kulathur-terkku 105.85 157.55 491.54 22.54 327.78 20.42 335.31 922.46 15.22 3870.77 2.52 C3S1
21030D Kunnathur 62.80 59.33 127.20 11.87 253.29 5.65 109.93 201.87 14.77 1328.00 1.23 C3S1
83206 Malaipatti 106.62 71.26 159.03 39.88 272.57 31.55 128.22 331.52 30.27 1865.52 1.07 C3S1
93005A Malayankulam 98.62 87.85 179.68 29.57 210.60 21.04 85.14 413.27 38.14 1934.86 1.13 C4S1
83175 Mamsapuram 68.18 88.15 313.03 8.53 410.46 42.30 146.97 395.61 43.30 2348.79 2.16 C3S1
27018D Manalur 37.75 29.91 113.25 10.38 218.09 11.58 28.38 151.13 6.15 912.50 1.13 C4S1
25029 Mangalam 83.57 125.85 206.57 7.71 279.86 30.00 127.57 482.29 31.04 2260.00 1.15 C3S1
83226 Manickanendal 100.15 72.93 147.90 26.88 136.54 33.91 69.42 472.40 7.36 1741.00 0.98 C4S1
28008D Marthandampatti 106.91 131.65 675.93 26.88 319.02 26.72 403.96 1058.8 18.08 4344.14 3.14 C3S1
83185 Meenakshipuram 76.54 54.44 78.73 17.71 301.99 27.07 52.61 138.23 26.02 1165.38 0.57 C3S1
93003A Melakaranthai 136.86 133.35 273.57 14.93 366.86 54.00 232.00 585.71 25.35 2935.00 1.43 C3S1
83171 Muddukudi 97.43 75.91 108.46 22.08 234.66 29.10 82.54 272.61 29.12 1549.29 0.77 C4S1
25024D Mulliseval 137.43 108.66 307.14 45.07 381.55 51.00 399.57 419.71 41.35 2923.57 1.71 C4S1
83214 Muthurmalingapuram 157.33 182.33 261.30 20.08 333.21 37.29 138.80 771.96 61.36 3424.81 1.22 C4S1
83200A Naduvapatti 160.24 131.79 176.58 17.58 313.49 60.75 238.19 513.18 45.77 2637.58 0.85 C4S1
28010D Nagalapuram 207.13 113.91 279.95 33.81 261.83 23.57 219.00 713.43 40.02 3124.50 1.45 C3S1
83180 Nathampatti 39.74 52.27 112.17 7.95 321.44 38.99 52.48 127.37 3.29 1031.11 1.08 C3S1
28012D Padanthapuli 54.15 62.33 257.38 13.15 413.80 12.89 285.54 155.77 12.97 1833.85 1.98 C3S1
83207A Palavanatham 63.71 65.21 152.61 32.56 288.14 30.95 79.31 262.61 20.12 1576.43 1.19 C4S1
83183 Pallaipattimalli 127.57 183.77 141.09 22.10 253.18 35.00 210.48 586.17 39.00 2740.00 0.71 C4S1
25061 Panaiyur 77.38 70.35 414.75 21.94 394.62 85.50 206.75 501.44 28.57 2730.63 3.13 C3S1
© 2018 IJRAR November 2018, Volume 5, Issue 4 www.ijrar.org (E-ISSN 2348-1269, P- ISSN 2349-5138)
IJRAR1904875 International Journal of Research and Analytical Reviews (IJRAR) www.ijrar.org 560
83110A Pandalkudi 73.74 69.76 140.39 34.13 332.07 49.80 72.09 272.60 22.92 1604.80 1.00 C2S1
25026 Pattampudur 42.31 32.94 54.92 4.62 198.24 8.59 54.08 52.15 10.65 695.38 0.56 C3S1
83049 Peikulam 59.95 31.57 69.21 19.45 220.43 17.60 35.98 116.16 15.29 920.47 0.64 C2S1
21015D Peraiyur 43.54 36.36 62.23 7.23 212.85 6.34 37.23 90.25 9.26 746.88 0.62 C4S1
83184 Perumalthevanpatti 123.68 160.03 310.45 11.18 294.52 48.27 353.83 614.71 35.86 3176.13 1.54 C3S1
25003A Pillaiyarnathem 57.74 54.16 78.32 4.76 310.65 19.09 47.03 103.45 20.04 1031.32 0.62 C3S1
83048 Puliankulam (M) 55.28 43.67 75.72 6.27 262.94 30.23 32.08 109.69 13.68 918.46 0.62 C3S1
25016D Rajapalayam 96.00 87.07 182.14 10.00 300.78 21.95 115.07 420.93 7.75 1956.43 1.16 C4S2
83211 Ramanajapuram 173.05 252.69 1017.7 16.31 439.74 56.14 1493.3 1025.26 23.69 6867.37 4.79 C4S1
83172 Reddiapatti 84.73 78.67 152.23 71.41 347.64 44.93 78.68 364.47 14.55 1865.33 1.02 C4S1
83186 Saminatham 108.70 143.72 214.57 15.30 334.83 36.00 197.41 561.70 18.47 2575.22 1.25 C3S1
93123 Sankarankovil 85.60 67.72 127.00 13.28 175.12 15.08 84.71 294.84 13.28 1540.32 0.82 C3S1
21042 Saptur 37.76 36.14 81.82 16.36 268.28 38.20 30.00 87.65 7.15 840.00 0.78 C4S1
83114A Sattur 115.44 168.87 592.83 20.39 500.72 24.41 499.67 840.39 42.17 4470.00 3.43 C3S1
25008D Seithur 50.40 54.59 100.40 31.27 327.96 23.83 37.47 178.53 7.43 1186.00 0.82 C4S1
25040 Senganthapatti 124.80 54.31 175.93 97.59 256.41 32.25 106.46 437.87 22.06 2036.00 1.26 C3S1
83189 Sengundrapuram 58.86 42.68 122.46 75.76 290.03 33.02 63.68 166.61 21.68 1328.57 1.06 C3S1
83104A Sethur 112.80 80.89 156.60 10.90 378.20 60.00 74.30 385.08 14.36 1856.67 1.06 C3S1
93116A Soorankudi 111.33 69.84 183.87 39.62 231.45 40.88 144.38 411.80 28.09 1946.00 1.41 C4S1
83101 Srivilliputhur 104.00 112.23 163.73 6.14 272.01 29.08 69.60 562.65 9.38 2226.94 1.03 C3S1
21016D Subbulapuram 46.86 42.11 51.93 7.21 195.85 1.64 45.57 95.93 10.86 795.00 0.45 C3S1
83197 Subramaniapuram 44.27 48.84 74.82 8.05 289.20 10.38 53.95 90.00 7.61 931.36 0.65 C3S1
28016D T. Muthalapuram 102.77 67.70 141.38 9.85 298.81 0.93 136.85 246.23 28.68 1656.92 0.91 C3S1
93112 T.Duraisamypuram 62.44 39.75 178.27 17.84 259.51 27.51 130.15 216.29 9.27 1402.39 1.79 C3S1
93114 Therkumuthalapuram 93.50 65.81 174.46 31.63 215.04 34.21 125.31 342.61 28.11 1786.79 1.44 C3S1
25010D Therkuvenkanallur 137.00 97.56 107.97 26.50 300.97 48.00 117.50 390.25 30.65 2080.83 0.64 C3S1
83219 Udhaiyanendal 60.19 53.60 107.29 5.12 234.57 39.04 137.11 160.67 7.59 1167.62 0.82 C2S1
25025D Uppathur 48.80 35.08 47.60 12.47 212.32 9.79 48.93 73.67 7.91 750.00 0.45 C3S1
25038 Vadakarai 78.00 58.79 287.06 15.81 375.66 38.00 148.31 294.87 13.26 1782.00 2.13 C3S1
83174 Vadakku venganallur 36.38 57.92 95.52 4.78 362.25 40.80 42.33 90.71 7.62 1000.95 0.82 C4S1
© 2018 IJRAR November 2018, Volume 5, Issue 4 www.ijrar.org (E-ISSN 2348-1269, P- ISSN 2349-5138)
IJRAR1904875 International Journal of Research and Analytical Reviews (IJRAR) www.ijrar.org 561
2504M Vadugapatti 94.46 133.04 304.46 4.85 382.69 44.00 217.54 567.46 21.37 2832.31 1.58 C3S1
25005A Valayapatti 76.67 56.92 139.22 27.56 331.98 54.00 99.33 224.22 14.35 1511.11 1.01 C3S1
28027D Vanaramutti 146.00 81.57 146.38 13.46 300.56 37.62 237.38 302.31 27.18 1910.00 0.93 C4S1
83187B Vellaihpuram 139.20 208.50 447.90 9.20 473.38 49.80 403.70 988.00 18.81 4435.00 2.11 C3S1
83115 Vembakottai 54.06 81.07 190.66 9.45 436.36 46.37 159.97 168.72 8.34 1574.17 1.45 C3S1
83196 Vilasapuram 43.48 47.57 141.85 10.60 333.02 34.70 102.76 132.85 9.84 1243.33 1.32 C4S1
83113A Virudhunagar 56.80 61.87 348.70 15.65 544.14 88.00 187.80 274.70 29.96 2296.50 2.83 C3S1
25015D Watrap 58.50 54.51 77.58 3.42 310.59 23.09 63.67 106.33 7.16 1029.17 0.65 C3S1
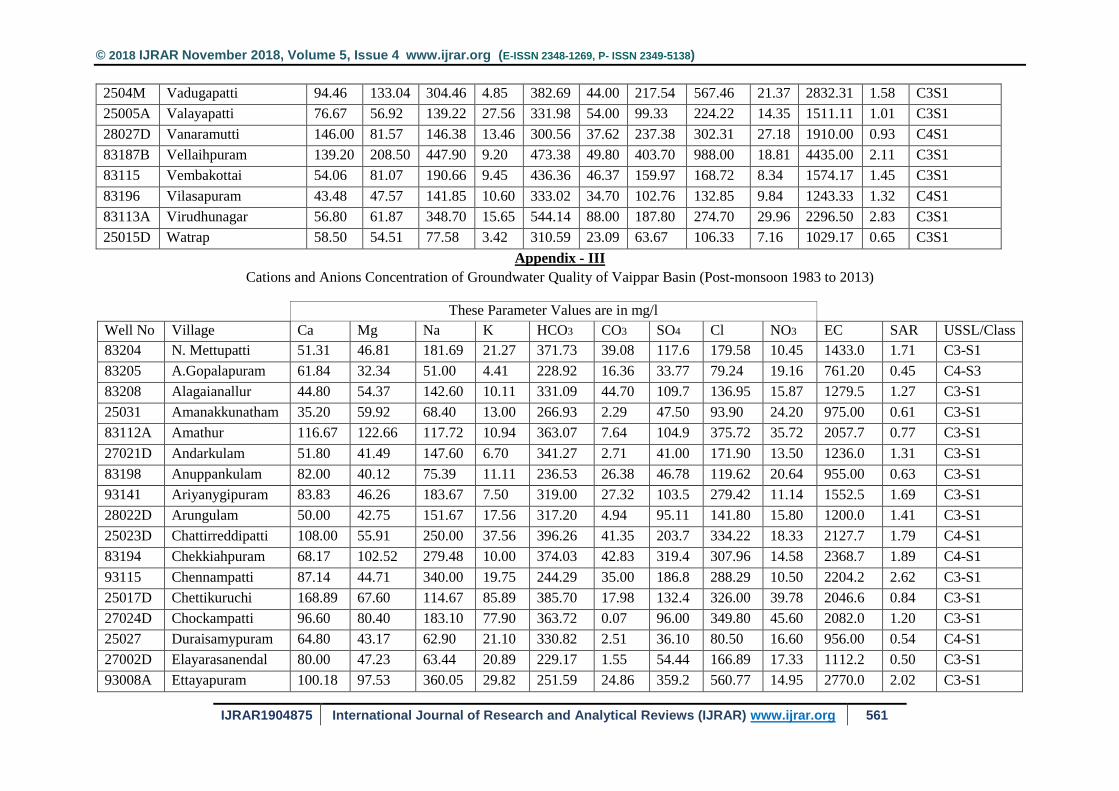
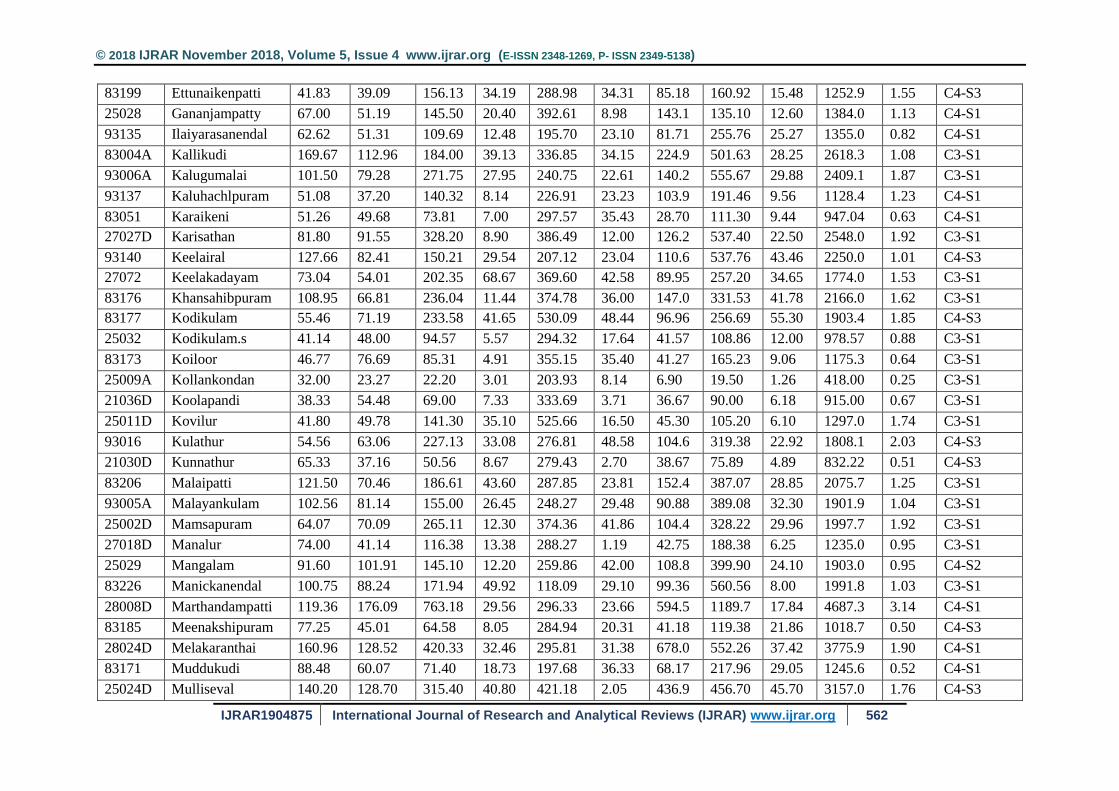
Appendix - III
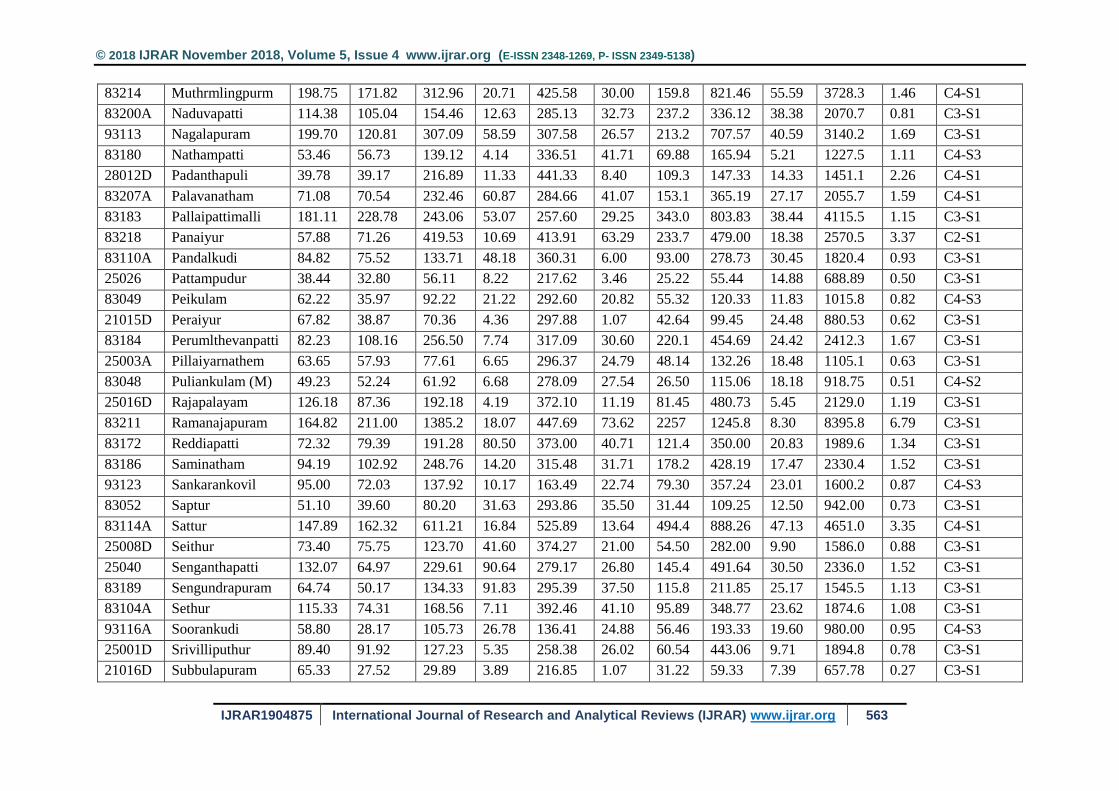
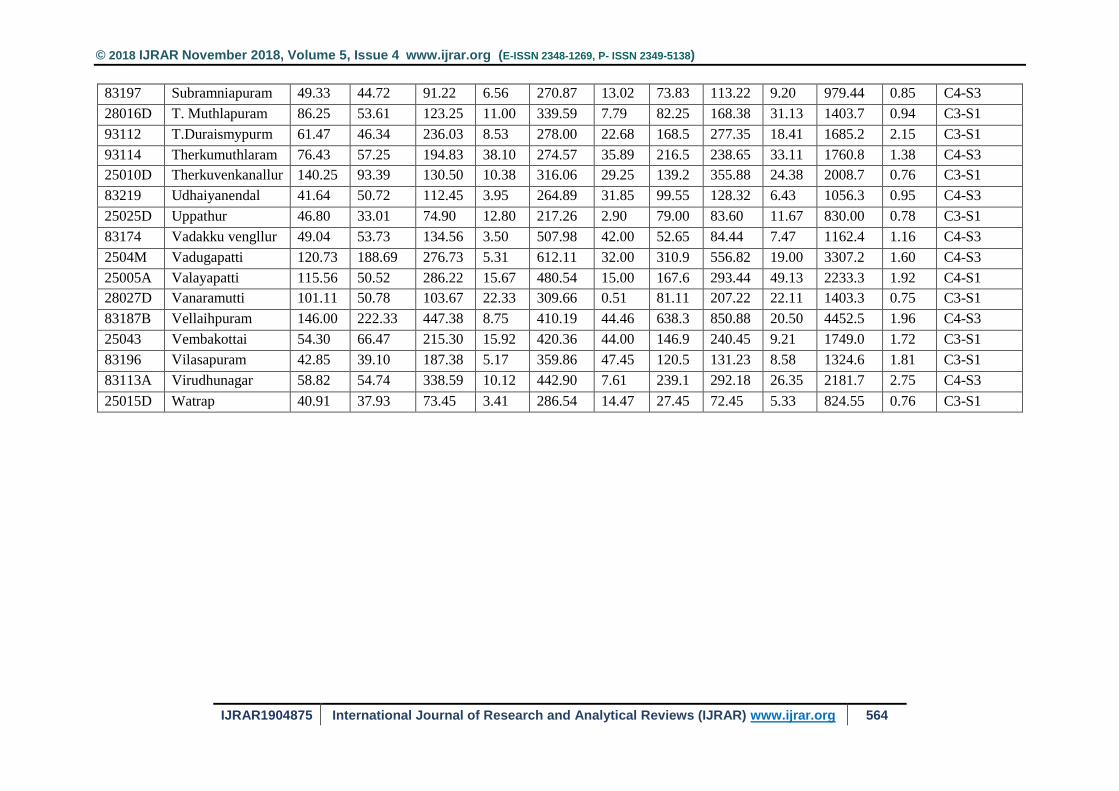
Cations and Anions Concentration of Groundwater Quality of Vaippar Basin (Post-monsoon 1983 to 2013)
These Parameter Values are in mg/l
Well No Village Ca Mg Na K HCO3 CO3 SO4 Cl NO3 EC SAR USSL/Class
83204 N. Mettupatti 51.31 46.81 181.69 21.27 371.73 39.08 117.6 179.58 10.45 1433.0 1.71 C3-S1
83205 A.Gopalapuram 61.84 32.34 51.00 4.41 228.92 16.36 33.77 79.24 19.16 761.20 0.45 C4-S3
83208 Alagaianallur 44.80 54.37 142.60 10.11 331.09 44.70 109.7 136.95 15.87 1279.5 1.27 C3-S1
25031 Amanakkunatham 35.20 59.92 68.40 13.00 266.93 2.29 47.50 93.90 24.20 975.00 0.61 C3-S1
83112A Amathur 116.67 122.66 117.72 10.94 363.07 7.64 104.9 375.72 35.72 2057.7 0.77 C3-S1
27021D Andarkulam 51.80 41.49 147.60 6.70 341.27 2.71 41.00 171.90 13.50 1236.0 1.31 C3-S1
83198 Anuppankulam 82.00 40.12 75.39 11.11 236.53 26.38 46.78 119.62 20.64 955.00 0.63 C3-S1
93141 Ariyanygipuram 83.83 46.26 183.67 7.50 319.00 27.32 103.5 279.42 11.14 1552.5 1.69 C3-S1
28022D Arungulam 50.00 42.75 151.67 17.56 317.20 4.94 95.11 141.80 15.80 1200.0 1.41 C3-S1
25023D Chattirreddipatti 108.00 55.91 250.00 37.56 396.26 41.35 203.7 334.22 18.33 2127.7 1.79 C4-S1
83194 Chekkiahpuram 68.17 102.52 279.48 10.00 374.03 42.83 319.4 307.96 14.58 2368.7 1.89 C4-S1
93115 Chennampatti 87.14 44.71 340.00 19.75 244.29 35.00 186.8 288.29 10.50 2204.2 2.62 C3-S1
25017D Chettikuruchi 168.89 67.60 114.67 85.89 385.70 17.98 132.4 326.00 39.78 2046.6 0.84 C3-S1
27024D Chockampatti 96.60 80.40 183.10 77.90 363.72 0.07 96.00 349.80 45.60 2082.0 1.20 C3-S1
25027 Duraisamypuram 64.80 43.17 62.90 21.10 330.82 2.51 36.10 80.50 16.60 956.00 0.54 C4-S1
27002D Elayarasanendal 80.00 47.23 63.44 20.89 229.17 1.55 54.44 166.89 17.33 1112.2 0.50 C3-S1
93008A Ettayapuram 100.18 97.53 360.05 29.82 251.59 24.86 359.2 560.77 14.95 2770.0 2.02 C3-S1
© 2018 IJRAR November 2018, Volume 5, Issue 4 www.ijrar.org (E-ISSN 2348-1269, P- ISSN 2349-5138)
IJRAR1904875 International Journal of Research and Analytical Reviews (IJRAR) www.ijrar.org 562
83199 Ettunaikenpatti 41.83 39.09 156.13 34.19 288.98 34.31 85.18 160.92 15.48 1252.9 1.55 C4-S3
25028 Gananjampatty 67.00 51.19 145.50 20.40 392.61 8.98 143.1 135.10 12.60 1384.0 1.13 C4-S1
93135 Ilaiyarasanendal 62.62 51.31 109.69 12.48 195.70 23.10 81.71 255.76 25.27 1355.0 0.82 C4-S1
83004A Kallikudi 169.67 112.96 184.00 39.13 336.85 34.15 224.9 501.63 28.25 2618.3 1.08 C3-S1
93006A Kalugumalai 101.50 79.28 271.75 27.95 240.75 22.61 140.2 555.67 29.88 2409.1 1.87 C3-S1
93137 Kaluhachlpuram 51.08 37.20 140.32 8.14 226.91 23.23 103.9 191.46 9.56 1128.4 1.23 C4-S1
83051 Karaikeni 51.26 49.68 73.81 7.00 297.57 35.43 28.70 111.30 9.44 947.04 0.63 C4-S1
27027D Karisathan 81.80 91.55 328.20 8.90 386.49 12.00 126.2 537.40 22.50 2548.0 1.92 C3-S1
93140 Keelairal 127.66 82.41 150.21 29.54 207.12 23.04 110.6 537.76 43.46 2250.0 1.01 C4-S3
27072 Keelakadayam 73.04 54.01 202.35 68.67 369.60 42.58 89.95 257.20 34.65 1774.0 1.53 C3-S1
83176 Khansahibpuram 108.95 66.81 236.04 11.44 374.78 36.00 147.0 331.53 41.78 2166.0 1.62 C3-S1
83177 Kodikulam 55.46 71.19 233.58 41.65 530.09 48.44 96.96 256.69 55.30 1903.4 1.85 C4-S3
25032 Kodikulam.s 41.14 48.00 94.57 5.57 294.32 17.64 41.57 108.86 12.00 978.57 0.88 C3-S1
83173 Koiloor 46.77 76.69 85.31 4.91 355.15 35.40 41.27 165.23 9.06 1175.3 0.64 C3-S1
25009A Kollankondan 32.00 23.27 22.20 3.01 203.93 8.14 6.90 19.50 1.26 418.00 0.25 C3-S1
21036D Koolapandi 38.33 54.48 69.00 7.33 333.69 3.71 36.67 90.00 6.18 915.00 0.67 C3-S1
25011D Kovilur 41.80 49.78 141.30 35.10 525.66 16.50 45.30 105.20 6.10 1297.0 1.74 C3-S1
93016 Kulathur 54.56 63.06 227.13 33.08 276.81 48.58 104.6 319.38 22.92 1808.1 2.03 C4-S3
21030D Kunnathur 65.33 37.16 50.56 8.67 279.43 2.70 38.67 75.89 4.89 832.22 0.51 C4-S3
83206 Malaipatti 121.50 70.46 186.61 43.60 287.85 23.81 152.4 387.07 28.85 2075.7 1.25 C3-S1
93005A Malayankulam 102.56 81.14 155.00 26.45 248.27 29.48 90.88 389.08 32.30 1901.9 1.04 C3-S1
25002D Mamsapuram 64.07 70.09 265.11 12.30 374.36 41.86 104.4 328.22 29.96 1997.7 1.92 C3-S1
27018D Manalur 74.00 41.14 116.38 13.38 288.27 1.19 42.75 188.38 6.25 1235.0 0.95 C3-S1
25029 Mangalam 91.60 101.91 145.10 12.20 259.86 42.00 108.8 399.90 24.10 1903.0 0.95 C4-S2
83226 Manickanendal 100.75 88.24 171.94 49.92 118.09 29.10 99.36 560.56 8.00 1991.8 1.03 C3-S1
28008D Marthandampatti 119.36 176.09 763.18 29.56 296.33 23.66 594.5 1189.7 17.84 4687.3 3.14 C4-S1
83185 Meenakshipuram 77.25 45.01 64.58 8.05 284.94 20.31 41.18 119.38 21.86 1018.7 0.50 C4-S3
28024D Melakaranthai 160.96 128.52 420.33 32.46 295.81 31.38 678.0 552.26 37.42 3775.9 1.90 C4-S1
83171 Muddukudi 88.48 60.07 71.40 18.73 197.68 36.33 68.17 217.96 29.05 1245.6 0.52 C4-S1
25024D Mulliseval 140.20 128.70 315.40 40.80 421.18 2.05 436.9 456.70 45.70 3157.0 1.76 C4-S3
© 2018 IJRAR November 2018, Volume 5, Issue 4 www.ijrar.org (E-ISSN 2348-1269, P- ISSN 2349-5138)
IJRAR1904875 International Journal of Research and Analytical Reviews (IJRAR) www.ijrar.org 563
83214 Muthrmlingpurm 198.75 171.82 312.96 20.71 425.58 30.00 159.8 821.46 55.59 3728.3 1.46 C4-S1
83200A Naduvapatti 114.38 105.04 154.46 12.63 285.13 32.73 237.2 336.12 38.38 2070.7 0.81 C3-S1
93113 Nagalapuram 199.70 120.81 307.09 58.59 307.58 26.57 213.2 707.57 40.59 3140.2 1.69 C3-S1
83180 Nathampatti 53.46 56.73 139.12 4.14 336.51 41.71 69.88 165.94 5.21 1227.5 1.11 C4-S3
28012D Padanthapuli 39.78 39.17 216.89 11.33 441.33 8.40 109.3 147.33 14.33 1451.1 2.26 C4-S1
83207A Palavanatham 71.08 70.54 232.46 60.87 284.66 41.07 153.1 365.19 27.17 2055.7 1.59 C4-S1
83183 Pallaipattimalli 181.11 228.78 243.06 53.07 257.60 29.25 343.0 803.83 38.44 4115.5 1.15 C3-S1
83218 Panaiyur 57.88 71.26 419.53 10.69 413.91 63.29 233.7 479.00 18.38 2570.5 3.37 C2-S1
83110A Pandalkudi 84.82 75.52 133.71 48.18 360.31 6.00 93.00 278.73 30.45 1820.4 0.93 C3-S1
25026 Pattampudur 38.44 32.80 56.11 8.22 217.62 3.46 25.22 55.44 14.88 688.89 0.50 C3-S1
83049 Peikulam 62.22 35.97 92.22 21.22 292.60 20.82 55.32 120.33 11.83 1015.8 0.82 C4-S3
21015D Peraiyur 67.82 38.87 70.36 4.36 297.88 1.07 42.64 99.45 24.48 880.53 0.62 C3-S1
83184 Perumlthevanpatti 82.23 108.16 256.50 7.74 317.09 30.60 220.1 454.69 24.42 2412.3 1.67 C3-S1
25003A Pillaiyarnathem 63.65 57.93 77.61 6.65 296.37 24.79 48.14 132.26 18.48 1105.1 0.63 C3-S1
83048 Puliankulam (M) 49.23 52.24 61.92 6.68 278.09 27.54 26.50 115.06 18.18 918.75 0.51 C4-S2
25016D Rajapalayam 126.18 87.36 192.18 4.19 372.10 11.19 81.45 480.73 5.45 2129.0 1.19 C3-S1
83211 Ramanajapuram 164.82 211.00 1385.2 18.07 447.69 73.62 2257 1245.8 8.30 8395.8 6.79 C3-S1
83172 Reddiapatti 72.32 79.39 191.28 80.50 373.00 40.71 121.4 350.00 20.83 1989.6 1.34 C3-S1
83186 Saminatham 94.19 102.92 248.76 14.20 315.48 31.71 178.2 428.19 17.47 2330.4 1.52 C3-S1
93123 Sankarankovil 95.00 72.03 137.92 10.17 163.49 22.74 79.30 357.24 23.01 1600.2 0.87 C4-S3
83052 Saptur 51.10 39.60 80.20 31.63 293.86 35.50 31.44 109.25 12.50 942.00 0.73 C3-S1
83114A Sattur 147.89 162.32 611.21 16.84 525.89 13.64 494.4 888.26 47.13 4651.0 3.35 C4-S1
25008D Seithur 73.40 75.75 123.70 41.60 374.27 21.00 54.50 282.00 9.90 1586.0 0.88 C3-S1
25040 Senganthapatti 132.07 64.97 229.61 90.64 279.17 26.80 145.4 491.64 30.50 2336.0 1.52 C3-S1
83189 Sengundrapuram 64.74 50.17 134.33 91.83 295.39 37.50 115.8 211.85 25.17 1545.5 1.13 C3-S1
83104A Sethur 115.33 74.31 168.56 7.11 392.46 41.10 95.89 348.77 23.62 1874.6 1.08 C3-S1
93116A Soorankudi 58.80 28.17 105.73 26.78 136.41 24.88 56.46 193.33 19.60 980.00 0.95 C4-S3
25001D Srivilliputhur 89.40 91.92 127.23 5.35 258.38 26.02 60.54 443.06 9.71 1894.8 0.78 C3-S1
21016D Subbulapuram 65.33 27.52 29.89 3.89 216.85 1.07 31.22 59.33 7.39 657.78 0.27 C3-S1
© 2018 IJRAR November 2018, Volume 5, Issue 4 www.ijrar.org (E-ISSN 2348-1269, P- ISSN 2349-5138)
IJRAR1904875 International Journal of Research and Analytical Reviews (IJRAR) www.ijrar.org 564
83197 Subramniapuram 49.33 44.72 91.22 6.56 270.87 13.02 73.83 113.22 9.20 979.44 0.85 C4-S3
28016D T. Muthlapuram 86.25 53.61 123.25 11.00 339.59 7.79 82.25 168.38 31.13 1403.7 0.94 C3-S1
93112 T.Duraismypurm 61.47 46.34 236.03 8.53 278.00 22.68 168.5 277.35 18.41 1685.2 2.15 C3-S1
93114 Therkumuthlaram 76.43 57.25 194.83 38.10 274.57 35.89 216.5 238.65 33.11 1760.8 1.38 C4-S3
25010D Therkuvenkanallur 140.25 93.39 130.50 10.38 316.06 29.25 139.2 355.88 24.38 2008.7 0.76 C3-S1
83219 Udhaiyanendal 41.64 50.72 112.45 3.95 264.89 31.85 99.55 128.32 6.43 1056.3 0.95 C4-S3
25025D Uppathur 46.80 33.01 74.90 12.80 217.26 2.90 79.00 83.60 11.67 830.00 0.78 C3-S1
83174 Vadakku vengllur 49.04 53.73 134.56 3.50 507.98 42.00 52.65 84.44 7.47 1162.4 1.16 C4-S3
2504M Vadugapatti 120.73 188.69 276.73 5.31 612.11 32.00 310.9 556.82 19.00 3307.2 1.60 C4-S3
25005A Valayapatti 115.56 50.52 286.22 15.67 480.54 15.00 167.6 293.44 49.13 2233.3 1.92 C4-S1
28027D Vanaramutti 101.11 50.78 103.67 22.33 309.66 0.51 81.11 207.22 22.11 1403.3 0.75 C3-S1
83187B Vellaihpuram 146.00 222.33 447.38 8.75 410.19 44.46 638.3 850.88 20.50 4452.5 1.96 C4-S3
25043 Vembakottai 54.30 66.47 215.30 15.92 420.36 44.00 146.9 240.45 9.21 1749.0 1.72 C3-S1
83196 Vilasapuram 42.85 39.10 187.38 5.17 359.86 47.45 120.5 131.23 8.58 1324.6 1.81 C3-S1
83113A Virudhunagar 58.82 54.74 338.59 10.12 442.90 7.61 239.1 292.18 26.35 2181.7 2.75 C4-S3
25015D Watrap 40.91 37.93 73.45 3.41 286.54 14.47 27.45 72.45 5.33 824.55 0.76 C3-S1
© 2018 IJRAR November 2018, Volume 5, Issue 4 www.ijrar.org (E-ISSN 2348-1269, P- ISSN 2349-5138)
IJRAR1904875 International Journal of Research and Analytical Reviews (IJRAR) www.ijrar.org 565
REFERENCES
1. Adamat. N., Foster. L and Baban. M.,
(2003), “Groundwater Vulnerablity and
Risk Mapping for the Basaltic Aquifer of
the Azraq Basin Jardan Using GIS,
Remote Sensing and DRASTIC”.
Applied Geography. Vol.23, No.4,
pp.303-324.
2. Arvindan. S., Manivel. M and
Chandraseker. S., (2004),
“Groundwater Quality in Hard
Rock Area of the Gadilam River Basin
Tamil Nadu”. Journal Geological
Society of India. Vol. 63, pp. 625-635.
3. Biswas. A. K., (1991), “Water for
Sustainable Development in the 21st
Century”. A Global Perspective, Water
International. Vol.16, No.4, pp.219-224.
4. Handa. K., (1964), “Modified
Classification Procedure for Rating
Irrigation Water”. Soil Science. Vol.98,
No.2, pp.264-269.
5. Handa. K., (1979), “Quality Criteria for
Groundwater”. In Proceedings of the
International Seminar on Development
& Management of Groundwater
Resources, University of Roorkee.pp.1-7.
6. Karunakaran. K., Thamilarasu. P and
Sharmila. R., (2009), “Statistical study
on physicochemical characteristics of
Groundwater in and around Namakkal,
Tamilnadu, India”. E-Journal of
Chemistry. Vol.6, No.3, pp. 909-914.
7. Kelly. W.P., (1940), “Permissible
Composition and Concentration of
Irrigation Water”, In Proceedings of
American Society Report for Civil
Engineering, pp 607-609.
8. Kumaraswamy. K., (1984),
“Evaluation of Groundwater Quality and
Use in Vaippar Basin, Tamil Nadu,
India”. Vol.19, No.4, pp. 63-72.
9. Kumarswamy. K., Kamaraj. M and
Unnikrishnan. K., (1995), “
Hydrogeochemical Evaluation of Sea
Water Intrusion in The Vaippar Estuary,
Tamil Nadu”. Journal of Applied
Hydrology. Vol.8, No.1 to 4, pp.93-97.
10. Kumaraswamy. K and Sivagnanam.
N., (1988), “Surface Water Aspects of
Vaippar Basin, South India”. Indian
Geographical Journal. Vol.63, No.1, pp.
1-56.
11. Kumaraswamy. K and Sivagnanam.
N., (1988), “Morphometric
Characteristics of Vaippar Basin, Tamil
Nadu - A Quantitative Approach”. Indian
Journal of Landscape Systems and
Ecological Studies. Vol.1, No.1, pp.94-
101.
12. Kumaraswamy. K., (1992), "Coastal
Geomorphology and Salt Water Intrusion
in the Vaippar Estuary". Tamil Nadu
Science Congress Volume, Earth and
Atmospheric Sciences, pp.100-103.
13. Kumaraswamy. K., (1995), "Fluvio-
Marine Sediment Deposit Patterns and
Hydro - geomorphology of Tamil Nadu
Coast, India". pp.116 - 122
14. Kumarswamy. K., Jayakumar. R.,
Kamaraj. M and Unnikrishnan. K.,
(1996), “Multivariate Hydrogeochemical
Investigation in Vaippar Basin, South
India”. Transactions of the Institute of
Indian Geographers. Vol. 18, No.2,
pp.70-85.
15. Karanth. R.L., (1987), “Groundwater
Assessment, Development and
Management”. Tata McGraw-Hill
Publishing Company Limited, New
Delhi.pp.720.
16. Lloyd. J.W., (1976), “Hydrochemistry
and Groundwater Flow Patterns in the
Vicinity of Stanford-Upon-Avon”.
Quarterly Journal of Engineering
Geology. Vol.9, pp.315-325.
Related Documents