Evaluation of genetic and physiological parameters associated with meat tenderness in South African feedlot cattle By GERTRUIDA LOUISA MARAIS B.Sc. (Agric) Animal Science, University of Pretoria Submitted in partial fulfilment of the requirements for the degree M.Sc. (Agric) Production Physiology In the Department of Animal and Wildlife Sciences University of Pretoria Pretoria 2007 Supervisor: Prof. E.C. Webb. Co-supervisors: Dr. L. Frylinck & Dr. E. van Marle – Köster

Welcome message from author
This document is posted to help you gain knowledge. Please leave a comment to let me know what you think about it! Share it to your friends and learn new things together.
Transcript
Evaluation of genetic and physiological parameters associated with
meat tenderness in South African feedlot cattle
By
GERTRUIDA LOUISA MARAIS B.Sc. (Agric) Animal Science, University of Pretoria
Submitted in partial fulfilment of the requirements for the degree
M.Sc. (Agric) Production Physiology
In the Department of Animal and Wildlife Sciences
University of Pretoria
Pretoria 2007
Supervisor: Prof. E.C. Webb.
Co-supervisors: Dr. L. Frylinck & Dr. E. van Marle – Köster

I declare that this thesis for the degree M.Sc. (Agric) Production Physiology at the University of Pretoria has not been submitted by me for a degree at any other
University.

The beginning of wisdom is found in doubting, by doubting we come to the question, and by
seeking we may come upon the truth.
Pierre Abelard (1079-1142)

INDEX
Acknowledgements i List of abbreviations ii
List of figures v List of tables vii Abstract ix
Chapter 1: Introduction 1
Chapter 2: Literature overview 3 2.1 Role of physical factors on meat tenderness 4 2.2 The genetic basis of meat tenderness 15 2.3 Measurement of meat tenderness 22 2.4 Future developments 24
Chapter 3: Materials and methods 26 3.1 Animal management and harvest 26
3.2 The slaughtering process, post mortem sampling and storage 27 3.3 Warner-Bratzler shear force measurement 27 3.4 Myofibrillar fragment length determination 29 3.5 Sarcomere length determination 29
3.6 Calpain and calpastatin analysis 30 3.7 SDS-PAGE and Western-blotting analysis 30 3.8 Total collagen and percentage collagen solubility 33 3.9 DNA extraction and marker analyses 33 3.10 Statistical analyses 35
Chapter 4: Results 36 4.1 Animal characteristics 36
4.2 Tenderness of loin samples 38 4.3 Genetic considerations and the expression of the calpain system 39 4.4 Association of SNP markers with shear force values 45 4.5 The expressed calpain system 51
4.6 Proteolytic degradation 53 4.7 Extend of muscle contraction 57 4.8 Connective tissue 58 4.9 Correlation between muscle characteristics 58
Chapter 5: Discussion 60 5.1 Animal characteristics 60
5.2 Tenderness of loin samples 61 5.3 Genetic considerations and the expression of the calpain system 62 5.4 Association of SNP markers with shear force values 63 5.5 The expressed calpain system 64
5.6 Proteolytic degradation 66 5.7 Extend of muscle contraction 67 5.8 Connective tissue 67 5.9 Correlation between muscle characteristics 67
Chapter 6: Conclusions and recommendations 69 Addendum A 73 Addendum B 75 Addendum C 77
References 79
ACKNOWLEDGEMENTS
I wish to express my sincere gratitude to the following people without whom this study would not have
been possible:
Prof. E.C Webb from the Department of Animal and Wildlife Sciences at the University of Pretoria, who
acted as supervisor, for his leadership and support throughout the course of the study.
Dr. E. van Marle – Köster from the Department of Animal and Wildlife Sciences at the University of
Pretoria, Dr. L. Frylinck at the Meat Industry Centre of the Agricultural Research Council, who acted as co –
supervisors, for their enthusiastic guidance, support and valuable advice throughout the course of the study.
H. Snyman, J. Anderson, Dr. P.E. Strydom and M.F. Smith from the Agricultural Research Council-Animal
Production Institute (ARC-API), Irene and the research team at the U.S. Meat Animal Research Centre
(MARC), in particular Dr. T.P.L. Smith for his assistance with various laboratory procedures, support and
guidance.
A word of thanks to my husband, Marius for his love, continues encouragement, enthusiasm and support.
A special word of thanks to my parents (Izak and Gerda), my brother (Piet), for their love, encouragement
and moral support during all my years of study.
A word of appreciation to the National Research Foundation (NRF) and the University of Pretoria for
postgraduate bursaries, which enabled me to undertake this study.
The Red Meat Research and Development Trust Project Committee for financial support.
Technology and Human Resources for Industry Programme for financial support.
The Agricultural Research Council for facilities and financial support.
Above all I thank God, who gave me the ability and opportunity to complete this study.
1 Corinthians 10:31
i

LIST OF ABBREVIATIONS
A - Adenine AA - Amino acid A260 - Absorption at 260 nm A280 - Absorption at 280 nm ANOVA - Analysis of variance ATP - Adenosine triphosphate ARC - Agricultural Research Council ARC-API - Agricultural Research Council - Animal Production Institute Bh - Brahman-crosses Brahman-X - Brahman-crosses BTA - Bovine autosomes C - Cytosine ˚C - Celsius degrees CA - Calpstatin activity CAPN1 - Micro molar calcium-activated neutral protease CAST - Calpastatin gene CSIRO - Commonwealth Scientific and Research Organization CUT - Estimated cutability CWT - Carcass weight 1D - One-dimensional DAG - Dystrophin associated glycans DAP - Dystrophin associated protein dH2O - Distilled water DM - Dry matter DMW - Dry matter weight DNA - Deoxyribo nucleic acid DFD - Dark, firm and dry d.p.m. - Days post mortem
EBV - Estimated breeding values EDTA - Ethylenediaminetetra-acetic acid e.g. - For example EPD - Expected progeny difference ES - Electrical stimulation FAT - Fat depth G - Guanine g - Gram g/kg - Gram per kilogram h - Hour HCl - Hydrochloric acid H2O2 - Hydrogen peroxide HRP - Horseradish peroxidase i.e. - For example IgG - Immunoglobulin G IMT - Intra-muscular fat
ii

IUB - International Union of Biochemistry kb - Kilo base kg - Kilogram kDa - Kilo Dalton KOH - Potassium hydroxide L - Leader LL - M. longissimus dorsi (L1-L6) LSD - Least significant difference LT - M. longissimus thoracis
M - Molar MARB - Marbling score or percentage of intra muscular fat MARC - Meat Animal Research Centre MAS - Marker-assisted selection MgCl2 - Magnesium chloride MFI - Myofibrillar fragmentation index MFL - Myofibrillar fragment length MJ/kg - Mega joules per kilogram ml - Millilitre mm - Millimetre mM - Milli molar MM - Molecular mass Mr - Molecular weight
MW - Molecular weight n - Number N - Avogadro’s number NaCl - Sodium chloride Na2HPO4 - Disodium hydrogen orthophosphate NaH2PO4 - Sodium dihydrogen orthophosphate NaN3 - Sodium azide Ng - Nguni-crosses Nguni-X - Nguni-crosses ng/µl - Nanogram per micro litre nm - Nanometer No - Number NRF - National Research Foundation NS - Not electrical stimulated PAGE - Polyacrylamide gel electrophoresis PBS - Phosphate buffer saline PCR - Polymerase chain reaction PSE - Pale, soft and exudative Pr - Pre-Rigor QTL - Quantitative trait loci r - Correlation REA - Longissimus muscle area Rm - Rigor mortis RMRDT - Red Meat Research and Development Trust rpm - Resolution per minute S - Skelemins
iii

SA - South Africa SACCS - South African Carcass Classification System SAFA - South African Feedlot Association SDS - Sodium dodecyl sulphate SDS-PAGE - Sodium dodecyl sulphate polyacrylamide gel electrophoresis SEM - Standard errors of means SL - Sarcomere length Sm - Simmentaler-crosses Simmentaler-X - Simmentaler-X SNP - Single nucleotide polymorphism T - Thiamine TEND - Taste panel tenderness score TRIS - Tris(hydroxymethyl)amino methane UP - University of Pretoria USA - United States of America UTR - Untranslated region UV - Ultraviolet vol/vol - Volume per volume WBC - Water binding capacity WBSF - Warner-Bratzler shear force wt/vol - Weight per volume α - Alfa β - Beta γ - Gama θ - Cross sectional µ - Micro µl - Micro litre µm - Micrometer µM - Micro molar % - Percentage > - Higher than < - Lower than ~ - Approximately 3' - Three prime 5' - Five prime
iv

LIST OF FIGURES
CHAPTER 2 Page Figure 2.1: Factors determining meat tenderness (adapted from Scheepers, 1999). 3
Figure 2.2: Schematic overview of the muscle structure (Geesink, 1993). 4 Figure 2.3: Schematic diagram showing the structure and protein composition of costameres in
striated muscle relative to Z-disks and the myofibrillar lattice (Taylor et al., 1995). 5 Figure 2.4: Changes in Warner-Bratzler shear force of lamb M. longissimus thoracic et lumborum
muscle during post mortem storage (Wheeler and Koohmaraie, 1994). 6 Figure 2.5: Tenderisation of bovine longissimus dorsi muscle by calpains – relationship between
the activities of µ-calpain, m-calpain and post mortem tenderisation (Dransfield, 1994). 8
Figure 2.6: The five domain inhibitory protein, calpastatin (Odeh, 2003). 9 Figure 2.7: Model of activation of calpains and muscle tenderisation (Dransfield, 1993). 9 Figure 2.8: Electro-micrographs of sections of bovine biceps femoris muscle samples after
different times of post mortem storage at 4 °C (Taylor et al., 1995). 12 Figure 2.9: Examples of changes observed in meat samples at the microscopic level
(Taylor and Frylinck, 2003). 13 Figure 2.10: Effect of Bos indicus blood on muscle tenderness (De Bruyn, 1991). 15 Figure 2.11: An integrated cytogenetic and meiotic map of the bovine genome, adapted from
(Eggen and Fries, 1994). 19 Figure 2.12: Genomic locations of SNP markers in CAPN1 gene (White et al., 2005). 20 Figure 2.13: Sodium dodecyl sulphate polyacrylamide gel electrophoresis indicating protein
separation base on molecular weight (Adapted from Geesink, 1993). 24
CHAPTER 3
Figure 3.1: The cuts of a beef carcass (Hofmeyer, 1981) and a schematic representation of where
the various samples were taken for the various analyses. 28 Figure 3.2: Illustration of the set up of a PAGE apparatus and concept of using electric charge to
drive protein separation (Campbell, 1995). 30 Figure 3.3: Principles of protein detection procedures (AEC-Amersham, 2002). 32
CHAPTER 4 Figure 4.1: Temperature (°C) decline of the M. longissimus dorsi (L1-L6) (non-electrically
stimulated carcasses) in the three crossbreds evaluated. 38
v

Figure 4.2: Calpastain / µ-calpain ratio of the M. longissimus dorsi (L1-L6) in the three crossbreds evaluated (means with different superscripts differ significantly,
(p < 0.001). 54
vi

LIST OF TABLES
CHAPTER 2 Page Table 2.1: Heritability estimates for selected carcass traits (As cited in Bertrand et al., 2001). 17
CHAPTER 3 Table 3.1: Molecular weight distributions for proteins in the wide molecular weight range
(SigmaMarkerTM). 31 Table 3.2: Genotyping primers for CAPN1 markers (White et al., 2005). 34
CHAPTER 4 Table 4.1: Least square means and standard errors of means (SEM) describing the carcass
mass and percentage carcass weight loss characteristics, water binding capacity (WBC), the effect of genotype and post mortem metabolism on the temperature and pH decline of the M. longissimus dorsi (L1-L6) (non-electrically stimulated carcasses) in three crossbreds evaluated. 37
Table 4.2: Least square means and standard errors of means (SEM) for shear force measurements
and the effect of ageing in the M. longissimus dorsi (L1-L6) (non-electrically stimulated carcasses) in the three crossbreds evaluated. 39
Table 4.3: Allele and haplotype frequencies of the three crossbreds evaluated at the CAPN1 gene. 40 Table 4.4: Number of individuals inheriting the CC, CG and GG genotypes at position 316
(CAPN1-316) and CC, CT and TT genotypes at position 4751 (CAPN1-4751). 41 Table 4.5: The average indexes for the markers (316 and 4751) at the CAPN1 gene for the three
crossbreds evaluated. 41 Table 4.6: Allele and haplotype frequencies of the three crossbreds evaluated at the CAST gene. 42 Table 4.7: The average indexes for the markers (CAST and CAST-Brahman) at the CAST gene in
the three crossbreds evaluated. 43
Table 4.8: Shows the number of animals with genotypes for the SNP used in the CAST and CAPN1 markers. 43
Table 4.9: The average indexes for the CAST (CAST + CAST-Brahman) and CAPN1 (316 and 4751) gene in the three crossbreds evaluated. 44
Table 4.10: Minor allele frequency within the three different crossbreds and the total number of animals with calls. 44
Table 4.11: Genotype contrast for shear force at 1 day, 7 and 14 days post mortem with CAPN1-316 marker in the animals evaluated. 45
Table 4.12: Genotype contrast for shear force at 1 day, 7 and 14 days post mortem with CAPN1-316 marker in the three crossbreds evaluated. 46
vii

Table 4.13: Genotype contrast for shear force at 1 day, 7 and 14 days post mortem with CAPN1-4751 marker in the animals evaluated. 47
Table 4.14: Genotype contrast for shear force at 1 day, 7 and 14 days post mortem with
CAPN1-4751 marker in the three crossbreds evaluated. 48
Table 4.15: Haplotype contrast of CAPN1 marker (316 and 4751) for shear force at 1 day, 7 and 14 days post mortem. 48
Table 4.16: Genotype contrast for shear force at 1 day, 7 and 14 days post mortem with CAST marker in the animals evaluated. 49
Table 4.17: Genotype contrast for shear force at 1 day, 7 and 14 days post mortem with CAST marker in the crossbreds evaluated. 50
Table 4.18: Genotype contrast for shear force at 1 day, 7 and 14 days post mortem with
CAST-Brahman marker in the three crossbreds. 50
Table 4.19: Haplotype contrast of CAST marker and CAST-Brahman marker for shear force at 1 day, 7 and 14 days post mortem. 51
Table 4.20: Least square means and standard errors for µ-calpain, m-calpain and calpastatin activity levels measured in the M. longissimus dorsi (L1-L6) (non-electrically stimulated carcasses) in the three crossbreds evaluated at 1 hour and 24 hours post mortem. 52
Table 4.21: Least square means and standard errors describing myofibrillar fragmentation lengths (MFL), proteolytic degradation profiles and an ageing effect in the M. longissimus
dorsi (L1-L6) (non-electrically stimulated carcasses) post mortem of the three crossbreds. 54
Table 4.22: Least square means and standard errors of desmin degradation evaluated with Western-blotting and an ageing effect in the M. longissimus dorsi (L1-L6) (non-electrically stimulated carcasses) post mortem of the three crossbreds evaluated. 55
Table 4.23: Correlation-matrix showing how proteolytic degradation correlates with the calpain system 24 hours post mortem of the M. longissimus dorsi (L1-L6) in the three crossbreds. 56
Table 4.24: Least square means and standard errors of means and ageing effect describing the histological characteristics of the M. longissimus dorsi (L1-L6) (non-electrically stimulated carcasses) in the three crossbreds evaluated. 57
Table 4.25: Least square means and standard errors for connective tissue characteristics of the M. longissimus dorsi (L1-L6) (non-electrically stimulated carcasses) in the three crossbreds evaluated. 58
Table 4.26: Correlation-matrix showing simple correlation coefficients between tenderness (WBSF) and various muscle characteristics in the three crossbreds evaluated. 59
viii

ABSTRACT
The objective of this study was to compare prediction of meat tenderness by means of gene technologies
(markers) with established physical estimates of meat tenderness. Weaned, young bulls (n = 60) were
selected on phenotype from various commercial producers to represent a Brahman (Bos indicus; n = 20),
Simmental (continental Bos Taurus; n = 20) and Nguni (Sanga; n = 20) crossbred group. After being raised
under intensive feedlot conditions the animals were slaughtered according to normal South African slaughter
procedures at an A-age (10 - 12 months) with a fatness class of two or three (lean-medium fatness). At
slaughter the carcasses were not electrical stimulated because electrical stimulation influences the processes
of meat tenderness, and the emphasis was on the expression of the inherent tenderness characteristics without
external post mortem influences. Carcasses were halved, chilled at 4 ˚C within 2 hours post mortem. The M.
longissimus thoracis et lumboram (LT and LL) of the right and left sides were removed from the third last
rib to the last lumbar vertebra and sub sampled for shear force evaluations, SDS-PAGE, Western-blotting,
myofibril fragmentation (MFL), sarcomere length (SL), calpain, calpastatin, total collagen, % collagen
solubility and marker analysis. The position of sampling for each test was consistent and the different
samples were either frozen immediately at -20 ˚C or -80 ˚C or vacuum packed and aged (2 ± 2 ˚C) for 7 or
14 days post mortem.
Two single nucleotide polymorphism (SNP) markers were employed in this study for the bovine
CAPN1 gene, which is found or situated on bovine chromosome 29, namely a SNP marker which is situated
on exon nine (CAPN1-316) and the other on intron 17 (CAPN1-4751). The inhibitor, calpastatin (CAST)
found on chromosome seven was also analysed in this study. Both the CAST markers (CAST and CAST-
Brahman) lie in the three prime untranslated regions (3' UTR) of the CAST gene. Genotype data of two-
markers were used to determine the two-marker haplotypes.
The results of the study showed that differences exist in meat quality of the different crossbreds.
Brahman- and Nguni-crosses had lower shear force values (more tender) than that of the Simmentaler-
crosses under these specific experimental conditions. The pH decline did not differ significantly (p > 0.001)
between the crossbreds. The carcass temperature and temperature decline rate although similar between the
Brahman- and the Simmentaler-crosses for three hours and up to eight hours post mortem differed
significantly from that of the Nguni-crosses (p < 0.006). The sarcomere lengths were mostly under 1.7 µm,
which indicate that shortening (caused by rapid chilling) can not be eliminated. No significant differences
were found between the different crossbreds for the calpastatin levels but significant differences were found
for the µ-calpain activity and µ-calpain / calpastatin activity ratios. The Brahman-crosses had longer
myofibril fragment lengths on average, indicating lower proteolysis / myofibrillar fragmentation compared to
the other crossbreds. Myofibrillar protein degradation (titin, nebulin, desmin) and myofibrillar protein
formation (30 kDa) during post mortem ageing was examined as a confirmation for the myofibril fragment
length results. Significant differences between the crossbreds were found for titin degradation. Nguni-cross
ix

animals had significantly (p < 0.033) more titin present than the other crossbreds. Nebulin degradation
showed a significant (p < 0.038) breed effect at 7 days post mortem and a significant degradation rate
difference for breed types between 1 day and 7 days post mortem (p < 0.03) and 1 day and 14 days post
mortem (p < 0.034). Desmin degradation evaluated with SDS-PAGE and Western-blotting indicated that the
Simmentaler-cross animals had significantly (p < 0.018; p < 0.024, respectively) lower desmin levels
compared to the other crossbreds. For the 30 kDa proteins there were no significant (p > 0.001) differences
in data evaluated at 1 day, 7 and 14 days post mortem as well as for the formation rate.
The results indicates that Brahman-crosses had the highest frequency for haplotypes that are
associated with increased shear force, and thus tougher meat compared to the Simmentaler-crosses that had
the highest frequency for haplotyes that are associated with lower shear force, and thus more tender meat,
while Nguni-crosses were intermediate. A multiplex marker system incorporating both markers (316 and
4751) and indexes for the markers at CAST and CAPN1 genes were evaluated in this study. Considering the
average index for the interactions between the CAST and CAPN1 genes, it can be concluded that the Nguni-
cross was overall the breed with the highest potential for inherently tender meat. In general, the animals in
this study had the tendency for tougher meat. The genetic markers (CAST and CAPN1) showed no
association with Warner-Bratzler shear force (WBSF) (p > 0.05), which suggest that various mechanisms
and environmental factors may be involved and give another outcome compared to the genetic make up.
Simple correlation coefficients were generated between the different characteristics measured.
If the group of animals in this study is indeed a typical representation of South African feedlot
finished crossbred animals, the relatively high WBSF values emphasise the challenge to manipulate their
intrinsic tenderness potential by making use of various pre- and post-slaughter techniques and procedures.
.
x

CHAPTER 1
INTRODUCTION
The beef industry at present is faced with a major problem, which has been indicated in numerous
international consumer surveys namely the inconsistency in meat tenderness (Koohmaraie, 1992a; Morgan et
al., 1991; Ouali, 1991; Warkup et al., 1995). A significant portion of commercially available beef is
regarded as unacceptable, due to toughness (Jeremiah, 1996). Meat tenderness is therefore considered as one
of the most important meat qualities attributes (Lawrie, 1985; Jiang, 1998). Despite many changes in
consumer attitude towards red meat consumption, one expectation has remained constant namely that meat
should be consistently tender. Tenderness can be defined as: 1) Ease of penetration by teeth, 2) Ease with
which meat breaks into fragments, and 3) The amount of residue remaining after chewing (Jeremiah and
Phillips, 2000). The concept of meat tenderness is regarded as a multi-factorial process as it is biologically
dependant on a combination of many genetic and physiological factors. To understand the complex
processes involved with meat tenderness, it is important to know what tenderness is and to identify and study
the mechanisms involved with meat tenderness and tenderisation.
The quality of meat with specific reference to meat tenderness has received much attention in South
Africa (SA) over the past decade. From the producers’ point of view, much money is at stake in supplying
consistent meat products to the market, because consumers influence the market through the purchase and
repurchase of products. The South African meat consumer in general, fined red meat or beef acceptable and
popular. Red meat is rather a luxury product in SA, as most meat-eating consumers fall into the low-income
group rather than in the high-income group. These consumers are also more concerned whether they will
have food to eat, rather than whether food is safe or of high quality. A survey done by the South African
Feedlot Association (SAFA) during 2003 indicated that consumers that fall in the high-income group are
concerned about health. As a matter of fact beef produced in SA and internationally is regarded as a lean end
product. Lean beef also receives the best prices according to the South African Carcass Classification
System (SACCS), thus the South African beef industry attempts to ensure the production of consistent
quality lean meat. The SACCS and the Namibian Carcass Classification systems are basically the same,
except that the SACCS categorises the carcass of 2-tooth animals in a separate age-class (AB), than the 3- to
6-tooth animals (B) and 0-tooth (A). Both systems classify carcasses from 7- to 8-tooth animals in an age-
class (C). The United States meat industry grades beef according to Prime, Choice and Select. The quality
grade factors that are considered include marbling and maturity, while inconsistent meat tenderness is
considered as a top priority. Since the 1990’s, the United States of America (USA) beef industry has
adopted new technologies based on a genotypic approach to meet consumer expectations (Koohmaraie et al.,
2003). A segment of consumers worldwide are always willing to pay some level of premium for guaranteed
tenderness (Boleman et al., 1997; Wheeler et al., 2002; Rhee et al., 2004). With this in mind, the beef
1
industry had changed from being production driven to being more concerned with the demands of the
consumer (Harrington, 1994; Dransfield, 2003).
In SA the beef industry is currently moving towards the selection of economically relevant beef
carcass traits (i.e. tenderness). For many years beef breeders in SA have focussed primarily on production
traits in their selection programmes. Traits associated with reproduction (i.e. calving ease) and growth (i.e.
weaning weight) received by far the most attention compared to selection for carcass characteristics
(Gertenbach and Kars, 1999). In the past decade various factors contributed to highlighting quality traits,
with specific interest in tenderness and marbling. The development of molecular theory provides new
strategies for improvement of meat tenderness through a genetic approach (Koohmaraie et al., 2003) that is a
non-invasive method and can be applied while the animal is still alive. GeneStar® technology is a
commercial deoxyribo nucleic acid (DNA) based test that was developed from gene research in Australia and
now available to producers worldwide (Australia, New Zealand, North America, Europe, Asia and SA) to
test for tenderness and marbling (Alison, 2006; Gao et al., 2007). GeneStar®-tenderness test for variants of
the bovine calpastatin gene located on chromosome seven and the estimated contribution of this gene on
meat tenderness is 10 - 12% (www.agribsa.co.za, 21 January 2006). The gene for marbling is less important
in SA since it is not regarded in the classification system. However, marbling is positively associated with
juiciness of meat (www.agribsa.co.za, 21 January 2006). The use of gene technology from a quantitative and
molecular point of view to predict meat tenderness provides a useful aid to beef producers. It can give an
indication of which animal has the potential to produce more tender meat.
Certain breeds are genetically dispositional to produce meat that is tougher. Many researchers have
focused their studies on the difference in tenderness between Bos indicus and Bos taurus breeds (Gregory et
al., 1994; O’Connor et al., 1997; Sherbeck et al., 1995; Campo et al., 1999). It is well documented that
tenderness decreases as the percentage Bos indicus increases in a crossbred animal (Crouse et al., 1989; De
Bruyn, 1991; Shackelford et al., 1991; Shackelford et al., 1994; Whipple et al., 1990a; Koohmaraie, 1996).
It has been shown that differences occur between Bos indicus and Bos taurus due to variation in the
properties of the muscle proteolytic calpain enzyme system, (Whipple et al., 1990a; Shackelford et al., 1991;
Koohmaraie, 1996) and the related effects on the myofibrillar properties of the muscle.
This study is based on two important factors namely the importance of the red meat industry in SA
with specific emphasis on the increasing awareness of meat tenderness. The second factor is the availability
of new molecular technologies for the assessment of meat tenderness. According to SAFA, a large
proportion of weaners finished in South African feedlots for beef production include Brahman- and
Simmentaler-crosses. Therefore these types were included as experimental groups in this study representing
medium and large frame breeds. Nguni-crosses were also included to represent a small frame breed. The
Nguni that is an indigenous (Sanga) breed-type is also a popular breed in SA (See Addendum A for the
migration of the breed-types to SA). The objective of this study was therefore to compare prediction of meat
tenderness by means of gene technologies (markers) with established physical estimates of meat tenderness.
2

CHAPTER 2
LITERATURE OVERVIEW
The exact mechanisms involved in the post mortem meat tenderisation process and the nature of changes
associated with improvement of meat tenderness is complex and not fully understood (Ouali, 1991, Fritz and
Greaser, 1991; Koohmaraie, 1994; Odeh, 2003). Meat quality is becoming increasingly important to meat
processors and consumers (Beattie et al., 1999). Solving the problem of inconsistent meat tenderness has
become a top priority of the beef industry due to consumer demands and preferences. Consumers have
widely diverging expectations of the specific product of which, their own conception of “value” and
“quality” is the most important parameter (Breidenstein et al., 1983; Naudé, 1985; Huffman et al., 1996;
Miller et al., 2001). Production, processing, value adding and the cooking method to prepare the meat for
consumption are important factors determining the end result of meat tenderness (Lee, 1986; Thompson,
2002).
Tenderness has been defined as “the composite of those properties which arise from structural
elements, and the manner in which it registers with the physiological senses”. This definition recognises
three essential elements: tenderness is the result of the structure; it is a composite of several properties and a
sensory quality (Lawrie, 1985; Scheepers, 1999). Since tenderness is a major palatability trait that
determines consumer acceptability, it is important to understand what causes meat to be tender or less tender
(tough). Factors affecting muscle and meat tenderness have been extensively research over the past decade
as illustrated in Figure 2.1.
ANIMAL MUSCLE Species, breed, age, gender, anatomical location
Muscle fibre (myofibrillar proteins), connective tissue and
collagen, adipose tissue, water holding capacity, proteolytic
enzymes
RIGOR MORTIS
Electrical stimulation, temperature (chilling), pH
MUSCLE / MEAT
AGEING Sarcomere length, myofibrillar fragmentation (length and index),
proteolytic enzymes
PREPARATION Cooking method, internal end point temperature
Meat tenderness and residue Sensory analysis, physiological
EATING QUALITY analysis, histological analysis, genetic analysis
Aroma, flavour, juiciness Sensory analysis
Figure 2.1: Factors determining meat tenderness (adapted from Scheepers, 1999).
3

Although meat tenderness is highly dependent on pre- and post-slaughter factors, physiological factors and
measurable genotype differences (genetic factors) make a contribution to the total variation in tenderness. It
is essential to gain an understanding of the contribution made by these factors (genetic and physiological), in
order to develop parameters for them to aid in the assessment of meat tenderness.
2.1 Role of physiological factors on meat tenderness
The concept of meat tenderness is dependant on various physiological factors namely muscle structure and
connective tissue characteristics; meat ageing and tenderisation by means of proteolytic degradation of cyto-
skeletal proteins (proteolytic calpain system and myofibrillar fragmentation); the energy status of the muscle
(muscle glycolysis, sarcomere length and change in muscle pH:temperature ratio decline), which influence
the extent of muscle contraction (Morton et al., 1999; Monin, 1998; Webb et al., 1964). All of these
physiological factors contribute to the degree of meat tenderness of the final product.
2.1.1 Muscle structure
Muscle tissue is composed of long cylindrical cells termed myofibres that are surrounded by collagen fibres
in the extra cellular space (Figure 2.2).
Figure 2.2: Schematic overview of the muscle structure (Geesink, 1993).
4

Muscle cells are packed with smaller cylindrical organelles called myofibrils that occupy over 80% of the
cell volume. There may be as many as 1000 of these 1-2 µm diameter myofibrils in a cross section of a
muscle fibre. Observation of these organelles in a phase contrast microscope reveals alternating light and
dark bands. Electron microscopy shows that the bands arise because of the presence of two major filaments:
thick filaments in the A-band and thin filaments in the I-band. A dense line bisects the I-band perpendicular
to the myofibril’s long axis and is termed the Z-line. An M-line is located in the middle of the A-band. The
filaments are composed of proteins, with myosin being the major constituent of the thick filaments while
actin, tropomyosin and troponin make up most of the thin filaments. Costameres (Figure 2.3) link myofibrils
to the sarcolemma, and N2-lines have been reported to be areas where titin and nebulin filaments, form a
cytoskeletal network linking thick and thin filaments, respectively, to the Z-disk (Craig and Pardo, 1983;
Geesink, 1993).
Figure 2.3: Schematic diagram showing the structure and protein composition of costameres in
striated muscle relative to Z-disks and the myofibrillar lattice (Adopted from Taylor et al., 1995).
The probable position of titin filaments is shown in this diagram, but nebulin filaments have been omitted to simplify
the diagram. The N-terminal end of the large titin molecule is anchored in the Z-disk. Desmin, vinculin, and ankyrin,
three of the protein constituents of costameres, extend into the muscle cell where they encircle myofibrils at the Z-disk
and run from myofibril to myofibril to link adjacent Z-disks laterally. DAPs = dystrophin associated proteins; DAG =
dystrophin associated glycans; S = skelemins.
Two phases can be distinguished in the conversion of muscle to meat (Figure 2.4). During the first phase,
pre-rigor (Pr), energy-rich compounds, including adenosine triphosphate (ATP), creatine phosphate and
glycogen, are almost completely depleted (Greaser, 1986). Due to the anaerobic conversion of glycogen to
lactate the muscle pH decreases from 7.2 to about 5.5. At extremely low concentrations of ATP, myosin
5

filaments in the myofibril form bonds with the overlapping actin filaments and, as a consequence, the muscle
becomes inextensible and rigid: rigor mortis (Rm) sets in. At this point post mortem muscle reaches
maximum toughness. Goll et al. (1995a) postulated that the increase in toughness observed during the first
24 - 36 hours post mortem is caused by a change in the actin / myosin interaction from a weak-binding state
to a strong-binding state. The decrease in toughness that occurs after 24 - 36 hours post mortem is caused by
two factors: a) a weakening of actin / myosin interaction; and b) calpain-induced proteolytic degradation of
costameres, of intermediate filaments that constitute the inter-myofibrillar linkages in muscle fibres, and of
the attachments of titin and nebulin to the Z-disk (Figure 2.3). Thus, meat tenderness has been generally
resolved into at least two different components referred to as “background toughness” and “myofibrillar
toughness” (Marsh and Leet, 1966; Ouali, 1991, Valin, 1995) (Figure 2.4).
Figure 2.4: Changes in Warner-Bratzler shear force of lamb M. longissimus thoracic et lumborum
muscle during post mortem storage (Wheeler and Koohmaraie, 1994) (Pr = Pre-rigor; Rm = Rigor mortis).
The toughening phase (background toughness and myofibrillar toughness) is similar in all carcasses under
similar processing conditions. The tenderising period is highly variable. There is a large variation in both
the rate and extent of post mortem tenderisation of meat, and this result in the inconsistency of meat
tenderness found at the consumer level (Koohmaraie and Geesink, 2006).
2.1.2 Meat tenderisation
The physiological and biochemical mechanisms of meat tenderness and the meat tenderisation process are
based on theory (Jiang, 1998). Tenderisation is a variable process determined by / or depending on a number
of biological factors i.e. age, sex-type, muscle type and species. This is further affected by the rate of
glycolysis, rate of pH decline, osmolarity of muscle cells, temperature, and genetic factors inherent to the
6

animal, amongst others (Geesink, 1993). Tenderness of meat originates in the biochemical and structural
properties of skeletal muscle fibres (myofibrils, intermediate filaments, intramuscular connective tissue, the
endomysium and the perimysium, which are composed of collagen fibrils and fibres) (Strandine et al., 1949;
Bailey, 1972; Takahashi, 1996). The connective tissue content and its properties are responsible for
approximately 20% of variation in meat tenderness (Dransfield, 1995). Greaser and Fritz (1995) concluded
that the weakening myofibril structure primarily control meat texture. The mechanisms underlying
myofibrillar fragmentation or disintegration of the myofibril structure are, the result of proteolytic action of
various enzyme systems (Ouali, 1990; Roncales et al., 1995) from which the calpain proteolytic system
seems to play a major role.
The calpain proteolytic system has been identified as being most important in the tenderness of meat
(Koohmaraie et al., 1995; Koohmaraie, 1996; Boehm et al., 1998; Koohmaraie and Geesink, 2006).
According to Goll (1991) 90% or more of the tenderisation that occurs during post mortem storage (2 - 4 °C)
can be contributed to the action of calpains. Calpains are calcium-activated proteases with an optimum
activity at a neutral pH (Koohmaraie and Geesink, 2006). The calpain system contains four known proteins
(For review see Koohmaraie and Geesink, 2006):
1) µ-calpain (mu-calpain) (calpain I), a proteinase that requires 5 to 50 µM Ca2+ for half
maximal activity;
2) m-calpain (calpain II), a proteinase that requires 300 to 1000 µM Ca2+ for half maximal
activity (Dayton, 1982; Nagainis et al, 1983; Suzuki et al, 1981);
3) a third proteinase (p94 or calpain-3) identified in 1989 and still poorly characterised; it
evidently requires 3000 to 4000 µM Ca2+ for half maximal activity (Wolfe et al., 1989); and
4) calpastatin a polypeptide that is specific for inhibiting the proteolytic activity of µ-calpain
and m-calpain (Maki et al, 1988; Goll, 1991; Goll et al., 1995b)
Theoretically the calpain system contains at least one more protein; an “activator” that is able in response to
physiological demand to alter Ca2+ concentration required for activity of µ-calpain or m-calpain. The nature
of this “activator” is unknown; it probably responds to Ca2+ fluxes in the nanomolar concentration range and
may be a kinase, a phosphatase or a calmodulin-like molecule (Goll, 1991). µ-Calpain and m-calpain consist
of a large 80 kDa subunit and a small 30 kDa subunit (Dayton et al., 1976a; Dayton et al., 1976b; Dayton et
al., 1981; Emori et al., 1986), both of which can be readily truncated at their N-termini, thereby modifying
their membrane binding properties and calcium requirement (Suzuki et al., 1995). The 80 kDa catalytic
subunits of µ-calpain and m-calpain are different polypeptides but share 50% to 60% amino acid sequence
homology; the 30 kDa regulatory subunits are identical.
Experimental evidence so far points to µ-calpain as the primary enzyme of post mortem proteolysis.
The enzyme is thought to be the first to be activated post mortem as the pH declines to 6.02 and below, and
intracellular calcium concentration rises from 0.1 - 0.2 µM to over 100 µM (Vidalence et al., 1983; Jeacocke,
1993; Dransfield, 1993). Dransfield (1994) suggested that the most tenderisation is caused by µ-calpain
(Figure 2.5) and that about 50% of the tenderisation occurs before 24 hours, after which tenderisation
7

continues approximately exponentially with time. Under normal muscle post mortem conditions (pHu 5.5 to
5.8 and 5 °C) the enzyme retains 20% to 38% of at-death activity by 24 hours post mortem (Koohmaraie et
al., 1986; Boehm et al., 1998).
Figure 2.5: Tenderisation of bovine longissimus dorsi muscle by calpains - relationship between the
activities of µ-calpain, m-calpain and post mortem tenderisation (Dransfield, 1994). Curves were
calculated using a calpain – activity model from measured levels of calpains, rigor development, temperature and shear
force determined experimentally and show the sharp rise in activity of µ-calpain and the much smaller contribution of
m-calpain to tenderisation and ageing of beef longissimus dorsi.
In general there is a suggestion that m-calpain is responsible for tenderisation that occurs beyond 24 hours
post mortem (Dransfield, 1994) but other scientists doubt its contribution because its concentration remains
largely unchanged during post mortem ageing (Vidalence et al., 1983; Geesink and Koohmaraie, 1999;
Koohmaraie and Geesink, 2006).
Calpain 3 is a single polypeptide of 94 kDa with sequence homology to the large subunits of µ-
calpain and m-calpain (Sorimachi et al., 1989). Purification and characterisation of calpain 3 has been
extremely difficult for several reasons. Unlike µ-calpain and m-calpain, calpain 3 cannot be easily extracted
from skeletal muscle due to its association with the myofibrillar protein, titin (Sorimachi et al., 1995;
Koohmaraie and Geesink, 2006).
Calpastain is the endogenous specific inhibitor of µ-calpain and m-calpain (Maki et al., 1988;
Koohmaraie and Geesink, 2006) with a predicted molecular weight of 77 kDa. Several isoforms of this
protein exist (Lee et al., 1992), but the predominant form contains five-domains (Figure 2.6). Of the five
domains, the N-terminal leader (L) domain does not appear to have any inhibitory activity, but may be
8

involved in targeting or intracellular localisation. The other domains (I – IV) are highly homologous and are
each capable of inhibiting calpain.
Figure 2.6: The five domain inhibitory protein, calpastatin (Odeh, 2003). It includes an N-termini leader
(XL and L) domain and four inhibitory domains (I-IV). The inhibitory domains of calpastatin contain three conserved
regions, A, B, and C.
Figure 2.7: Model of activation of calpains and muscle tenderisation (Dransfield, 1993). (a) Initiation.
The inert calpains are activated by the rise in calcium ion concentration and enter into the tenderisation system. (b)
Binding. The equilibrium of the binding of calpains to calpastatin determines the level of free activated-calpains, which
increase as the pH declines. (c) Inactivation of free activated-calpains. Decay of free activated-calpains by autolysis.
(d) Inactivation of calpastatin (it should be noted that the model makes no distinction between proteolysis by calpains of
the complexed and free calpastatin, but, for clarity, inactivation is shown only to free calpastatin). (e) Tenderisation.
Proteolysis of structural components by calpains causes tenderisation.
Calpastatin in combination with Ca2+ is a major regulator of the calpain system in post mortem muscle
(Figure 2.7) (Dransfield, 1993). There is a strong negative correlation between calpastatin and the rate of
tenderisation (Doumit and Koohmaraie, 1999; Morgan et al., 1993). A high calpastatin activity results in
decreased calpain activity and thus, decreased tenderness (Boehm et al., 1998; Sazili et al., 2003).
9

The calpain system is closely linked to the proteolytic breakdown of myofibrillar proteins (Goll et al., 1991;
Koohmaraie, 1994; Huff-Lonergan et al., 1996a). Myofibrillar proteins can be subdivided into contractile,
regulatory and cytoskeletal proteins. Myosin and actin are the main contractile proteins and are directly
involved in muscle contraction and relaxation; these proteins account for 43% and 22% of total myofibrillar
protein, respectively. Regulatory proteins are associated with the actin and myosin filaments and play an
indirect role in the contraction-relaxation cycle of muscles by controlling the interaction between actin and
myosin.
The main determinant of ultimate tenderness appears to be the extent of proteolysis of key proteins
within muscle fibres (Taylor et al., 1995). These proteins are involved in both inter- (e.g. desmin) and intra-
myofibrils (e.g. titin, nebulin and possibly, troponin-T) linkages and the function of these proteins are to
maintain the structural integrity of myofibrils (Price, 1991; Robson et al., 1991; Jiang, 1998), (See
Addendum B, Table 1 for the major characteristics, potential roles and importance of desmin, titin and
nebulin in muscle).
Desmin (55 kDa) is a member of the type III group of intermediate filament proteins and is localized
at the periphery of the myofibrillar Z-disk in skeletal muscle. Desmin filaments probably play an important
role in connecting adjacent myofibrils and in linking myofibrils to sub cellular organelles and the
sarcolemma in the costamere region. Desmin is a rather insoluble protein although it is not as insoluble as
intact titin, or nebulin (Robson et al., 1991).
Titin is a large structural protein that span the distance from the Z-line to nearly the M-line (half of
the skeletal sarcomere muscle), thus titin may serve to aid in maintaining the overall structural integrity of
the myofibril. It comprises approximately 8% to 10% of total myofibrillar protein in skeletal muscle. It is
the third most abundant myofibrillar / cytoskeletal protein in these cells (Furst et al., 1988; Robson et al.,
1991).
Nebulin is large structural cytoskeletal protein that comprises 5% of the total myofibrillar proteins.
It spans the distance from the Z-line to near the free end of the thin filament. It is highly insoluble, and has a
very high molecular weight (MW) (Mr = 6 x 10⁵ to 9 x 10⁵). Nebulin has also recently been shown to be
capable of linking actin and myosin, thus nebulin may also have a regulatory function in skeletal muscle
contraction. The post mortem degradation of nebulin may alter actin-myosin interactions (Wang and Wright,
1988; Robson et al., 1991).
The degradation of structural elements that connect the major components (i.e. the myofibrils) of a
muscle cell together (resulting in gaps between myofibrils in post mortem muscle), as well as the peripheral
layer of myofibrils to the cell membrane, could affect the development of tenderness (Taylor et al., 1995;
Koohmaraie, 1996) (Figure 2.8). A number of studies have suggested that Z-disk degradation is a major
factor contributing to post mortem tenderisation (Davey and Gilbert, 1969). These conclusions seem to have
been based largely on experimental findings showing that the calpain system has a major role in post mortem
tenderisation. It has been shown that when incubated with myofibrils or muscle strips, purified calpain tend
to removes Z-disks.
10

Approximately 65 - 80% of all post mortem tenderisation occurs during the first 3 to 4 days post mortem, and
there is little or no ultra structurally detectable Z-disk degradation during this period (Figure 2.8 B-E; Taylor
et al., 1995). Electron microscope studies showed that, during the first 3 to 4 days of post mortem storage at
4 °C, both costameres and N2-lines are degraded. Costameres link myofibrils to the sarcolemma, and N2-
lines have been reported to be areas where titin and nebulin filaments, which form a cytoskeletal network
linking thick and thin filaments, respectively, to the Z-disk. Filamentous structures linking adjacent
myofibrils laterally at the level of each Z-disk are also degraded during the first 3 or 4 days of post mortem
storage at 4 °C, resulting in gaps between myofibrils in post mortem muscle. Degradation of these structures
would have important effects on tenderness. The proteins constituting these structures, nebulin and titin (N2-
lines); vinculin, desmin, and dystrophin (three of the six to eight proteins constituting costameres); and
desmin (filaments linking adjacent myofibrils) are all excellent substrates for the calpains, and nebulin, titin,
vinculin, and desmin are largely degraded within 3 days post mortem in the M. semimembranosus muscle.
Electron micrographs of myofibrils used in the myofibril fragmentation index (MFI) (i.e. the turbidity of a
myofibrillar suspension, with a fixed protein concentration, at 540 nm) assay show that these myofibrils,
which have been assumed to be broken at their Z-disks, in fact have intact Z-disk and are broken in their I-
bands as shown by Taylor et al. (1995) in Figure 2.8 F. Other structural changes, which have been reported,
include loss of transversal alignment of the sarcomeres (Rowe, 1977; Ouali, 1990) and longitudinal splitting
of the myofibres (Gann and Merkel, 1978).
11

Figure 2.8: Electro-micrographs of sections of bovine biceps femoris muscle samples after different
times of post mortem storage at 4 °C (Taylor et al., 1995). (A) Electro micrograph of bovine skeletal muscle
sampled within 45 minutes after exsanguinations. Arrow and arrowhead indicate areas of density (costameres) where
the sarcolemma is attached to the Z-disk and M-line, respectively. (B and C) Bovine biceps femoris muscle sampled
24 hours after death. Both these micrographs show structural disintegration and broadening of the sarcolemma
compared with the structure of at-death sarcolemma. The sarcolemma is clearly detached and has been displaced from
the myofibril in C. This detachment is representative of approximately 50% of the structures observed after 24 hours
post mortem. (D and E) Bovine biceps femoris muscle after 3 days of post mortem storage. Arrowheads (D) point to
patches of densely staining material at the level of the Z-disk. These densely staining areas may be remnants of the
transmembrane patches containing integrins, DAGs, and DAPs. The arrow in D shows the detached membrane that has
now been pulled away a considerable distance from the myofibril. E shows examples of widening of the distance
between adjacent myofibrils in post mortem muscle and loss of material that seems to connect Z-disks from adjacent
myofibrils (arrow). This material probably contains desmin and filamin. (F) Bovine biceps femoris muscle after
16 days post mortem. The Z-disk structure is well preserved even after 16 days post mortem. Arrowheads point to gaps
in the I-band adjacent to the intact Z-disk. These gaps were observed in muscle that has been stored for 4 days or
longer at 4 °C.
A
C
E
B
D
F
12
2.1.3 Effects of the calpain system mechanism on the macro level
Most of the quantitative changes described above have been at the ultra structural level - structures that are
too small to relate to the sensorial perception of tough and tender meat. These structural changes have been
related to tenderness by temporal correlation, association with specific degradation of proteins and
relationships to shear force measures (Ho et al., 1997; Taylor et al., 1995). Taylor and Frylinck (2003)
demonstrated that at the light microscopic level the evident changes included fibre contraction, fibre
attachment, and partial and full breaks in fibres. Therefore, structures that relate to tenderness perception are
approximately the size of two fibres. Brady (1937) and Ramsbottom et al. (1945) published erudite
manuscripts, which described the relationship of muscle fibres and connective tissue to sensory quality and
mechanical shear force measures. Both concluded that the amount of connective tissue and its organisation
are important parameters, which contribute to meat quality in different muscle types. Studies of tenderness
variation within a muscle type were advanced significantly when Locker and Hagyard (1963) demonstrated
that fibre contraction is one of the major factors causing tough meat, and Herring et al. (1965) showed that
fibre diameter is highly correlated with shear force. Taylor and Frylinck (2003) examined changes in whole
myofibre using optical microscopy, especially fibre breaks and fibre-to-fibre attachment. Figure 2.9 shows
examples of the changes observed and quantified.
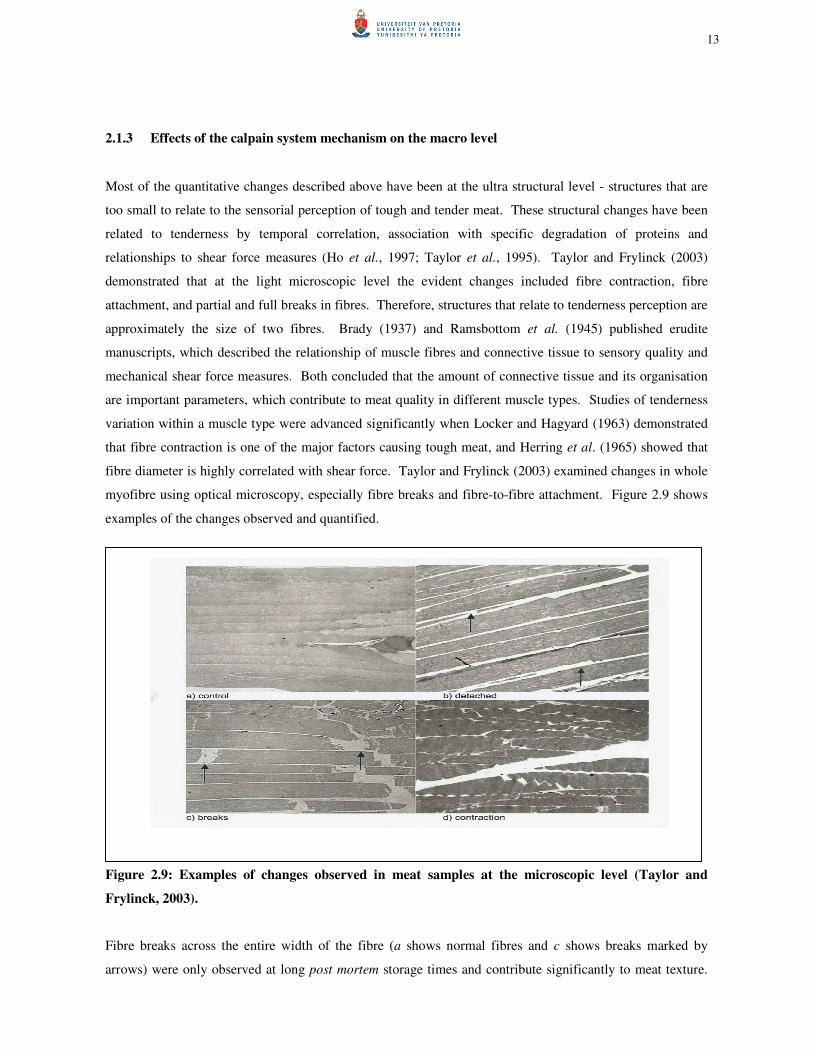
Figure 2.9: Examples of changes observed in meat samples at the microscopic level (Taylor and
Frylinck, 2003).
Fibre breaks across the entire width of the fibre (a shows normal fibres and c shows breaks marked by
arrows) were only observed at long post mortem storage times and contribute significantly to meat texture.
13

Fibre contraction is evident as waves and contraction bands as shown in d. Detachment of fibres from the
endomysium is shown in b (arrows indicate detachment).
It was concluded that fibre detachment might be a factor, which contributes primarily to early
tenderness of meat. Fibre detachment also occurs at time of slaughter and is maximal after 1 day of storage.
In fact some reports indicate that as much as 50% of tenderness can occur within 24 hours of storage
(Koohmaraie et al., 1988). Since fibre-to-fibre adhesion changes at this time, but not fibre breaks. Thus the
ultimate sensory perception of tenderness of meat is due to fibre detachment in the first 24 hours, with fibre
contraction as a second factor associated with changes in tenderness.
2.1.4 Extent of muscle contraction
Myofibrillar contribution to meat tenderness depends on the extent of shortening during rigor development
and proteolysis during conditioning (Warriss, 2000). Thus it is determined by the conditions during rigor
development and post mortem tenderisation. As muscle ATP concentration decreases during post mortem
storage, myofibrils attempt to contract, initiating the transition from weak to a strong actin / myosin cross
bridge stage. The weakening of the actin / myosin interaction is directly responsible for most of the decrease
in toughness between 24 hours and 72 hours post mortem and pH-related differences in sarcomere length can
be associated with the toughness of meat (Watanabe and Devine, 1996). Hwang et al. (2004) suggest that
sarcomere shortening may have an impact on the toughness of meat via various mechanisms. Sarcomere
length is related to tenderness, especially in cases of severe shortening (Whipple et al., 1990b). The apparent
increase in sarcomere length with ageing, such as the increase from 1.76 µm at 24 hours to 1.90 µm at 336
hours post mortem that was reported by Wheeler and Koohmaraie (1994) suggests that these interactions are
slackened during conditioning. The rate of post mortem glycolysis is a significant factor affecting the
relationship between sarcomere length and muscle toughness - increased toughness is associated with
shortened sarcomeres (shortening) (Smulders et al., 1990; Goll et al., 1995a). As the degree of overlap
between the thick and thin filaments increase during sarcomere shortening, the “denser” myofilament lattice
resulting from this shortening increase muscle toughness.
2.1.5 Other factors influencing meat tenderness
Muscle is a composite structure of contractile fibres, which are attached to each other and organized by
connective tissue. The connective tissue role in meat quality is both quantity and organisation. The amount,
spatial distribution and composition of the connective tissue within muscle vary with muscle positions in the
carcass and with animal age (Purslow, 2005). Connective tissue toughness is often referred to as background
toughness because the tissue hardly changes during the standard lengths of meat storage post mortem
(McCormick, 1994). This has long been recognised to influence the tenderness of cooked meat.
14

The connective tissue content is responsible for some of this variation (~20%), but the virtual lack of change
in this component during post mortem storage while considerable tenderisation occurs, has led to the
conclusion that the proteins in the muscle myofibril primarily control meat texture (Greaser and Fritz, 1995).
Collagen is the predominant protein of perimysial and endomysial connective tissues, constituting some 1.6
to 14.1% of the dry matter weight (DMW) of muscle (Purslow, 1999). Collagen characteristics, mainly the
content and solubility, are thus the basis for the determination of connective tissue contribution to meat
toughness.
2.2 The genetic basis of meat tenderness
Meat tenderness is dominated by both physiological and environmental influences. More recent research
indicates that genetics of the animal play a significant role (Sellier, 1994; Smith et al., 2000). Various
researchers suggested that the tenderisation process and the extent of muscle contraction occur unequally in
different breeds (Whipple et al., 1990b; Shackelford et al., 1991; Shackelford et al., 1994; Frylinck and
Heinze, 2003; Koohmaraie et al., 2003; Riley et al., 2003). It has been shown that differences occur between
Bos indicus and Bos taurus due to differences in the properties of the proteolytic enzyme systems (calpain
system) and their effects on the myofibrillar properties of the muscle. It is well documented that tenderness
decreases as the percentage Bos indicus increases (Crouse et al., 1989; De Bruyn, 1991; O’Connor et al.,
1997) (Figure 2.10), thus meat from Bos indicus tend to age slower (O’Connor et al., 1997) than meat from
Bos taurus due to the inhibiting effect of calpastatin on the ageing process (Shackelford et al., 1991; De
Bruyn, 1991; Frylinck and Heinze, 2003).
Figure 2.10: Effect of Bos indicus blood on muscle tenderness (De Bruyn, 1991).
De Bruyn (1991) found that the Brahman produced significant tougher meat compared to the Bos taurus
genotypes for example the Hereford and Charolais. The indigenous Afrikaner and the Bonsmara also
compared favourable with the tenderness of the Bos taurus genotypes. Lombard (1960) and Naudé and
15

Boccard (1973) also observed favourable meat tenderising characteristics in the Afrikaner as compared to the
Hereford. Swanepoel (1988) showed that this positive observation in the Afrikaner is a general characteristic
of the Sanga genotypes. The tenderness in the Afrikaner corresponds with that in the Pedi and Nguni. In SA
the indigenous breeds (Sanga types) are also well adapted to a sub-tropical climate and applied in the same
farm systems as Bos indicus breeds. Although it is assumed that they share similar characteristics, the
indigenous South African breeds produce more tender meat compared to the Bos indicus breed types (De
Bruyn, 1991). More information is still required to explain these differences. Once it is known how the
calpain system functions within the indigenous South African breeds, probes could be developed to facilitate
the identification of animals or breeds with the superior trait.
2.2.1 Quantitative approach
It has been suggested that genetics can solve the beef industry’s problem with tenderness (Sellier, 1994;
Eggen and Hocquette, 2003). It is clear that genetic composition makes a significant contribution to the total
variation in tenderness as tenderness varies among and within breeds (Shackelford et al., 1995). It is well
documented that tenderness decreases as the percentage Bos indicus inheritance increase (Crouse et al.,
1989; Shackelford et al., 1991, De Bruyn, 1991; O’Connor et al.,1997) it is therefore found that Bos taurus
genotypes produce more tender meat. These differences occur due to differences in the properties of the
muscle enzyme system (calpastatin activity) and their effects on the myofibrillar properties of the muscle.
To make progress within a breed requires identifying superior sires and dams producing progeny with an
improvement in meat tenderness, either through progeny testing or some direct measurement on the sire and
dam to predict the tenderness of their progeny.
Animal breeders use selection to increase the frequency of desirable alleles for a desirable trait
within a population. Selection response is very high for qualitative traits because the phenotypic variation
associated with the trait can be completely explained by a few genes or loci. Selection for complex or
quantitative traits is more difficult because the genetic component is controlled by many loci, which may
only explain a small portion of the phenotypic variation (Sellier, 1994). Improvements in quantitative trait
selection for traits of economic importance have been realised with use of performance records (animal
recording) for estimating the genetic value of each animal. Estimated breeding values (EBV) are based on
phenotypic information of the individual and / or relatives and their pedigrees (Kappes, 1996). In SA various
breed associations make use of EBV’s to select their animals for the desired traits. In the USA the industry
make use of expected progeny difference (EPD). The procedure also eliminates the effects of the
environment, which allows comparison of animals born in different years and under entirely different
conditions. Bertrand et al. (2001) suggest that the industry movement toward alliances and grid pricing has
led to increased interest in EPD for carcass traits in the USA. Carcass EPD’s are becoming common in this
era and added to the economically important traits in national cattle evaluation programs. In general, the rate
16

of genetic improvement in a given trait is a function of the heritability of the trait, the generation interval,
and the selection differential. Most estimates indicate that, within a breed, additive gene effects control 30%
of the variation in beef tenderness (Wheeler et al., 1995). This 30% represents the heritability of tenderness
within a breed (Koch et al., 1982). This implies that within a breed, 70% of the variation is explained by,
environmental and non-additive gene effects (dominance and epistasis) (Odeh, 2003). Thus, high heritability
estimate would decrease the time required to make an improvement in tenderness through quantitative
selection. Heritability estimates as discussed by Bertrand et al. (2001) indicates that carcass traits will
respond well to selection (Table 2.1).
Table 2.1: Heritability estimates for selected carcass traits (As cited in Bertrand et al., 2001).
CWTa REA FAT MARB % CUT WBSF TEND CA
0.48 0.40 0.52 0.47 0.49
0.43 0.56 0.41 0.40 0.63 0.31
0.60 0.45 0.09 0.10
0.23 0.18
0.38 0.51 0.31
0.31 0.32 0.26 0.26
0.93 0.45 0.53 0.65
0.23 0.22 0.25 0.48 0.47 0.12 0.22
0.40 0.04 0.10
0.37 0.38 0.35 0.40
0.15 0.65 0.56 0.73 0.37 0.50
0.34 0.35 0.26
0.51 0.34 0.79 0.18 0.47 0.42
0.59 0.39 0.27
0.60 0.97 0.46 0.88
0.29 0.15 0.49 0.04
0.30 0.27 0.23 0.36 0.23
0.39c
0.47c
0.34c
0.46c
0.41c
0.22c
0.28c
0.54c
CWTa = carcass weight, REA = longissimus muscle area, FAT = fat depth, MARB = marbling score or percentage of
intramuscular fat, % CUT = estimated cutability or percentage of retail cuts, WBSF = Warner-Bratzler shear force,
TEND = taste panel tenderness score, and CA = calpastatin activity. bFirst row of estimates for Robinson et al., (1998)
is for tropical breeds; second row is for temperate breeds. cAverage.
In SA the Angus breed association makes use of EBV’s for carcass traits that is calculated by the
Agricultural Research Council - Animal Production Institute (ARC-API). The main reason for limited
17
application of EBV’s on carcass traits in SA is the difficulty in measuring the different carcass traits during
production.
2.2.2 Molecular approach
Traditionally, the genetic improvement of beef cattle (meat tenderness included) has been based on
phenotypic selection alone. For many years beef breeders in SA focused primarily on production traits in
their selection programmes, associated with reproduction (i.e. calving ease) and growth (i.e. weaning
weight). These traits received by far the most attention compared to selection for carcass characteristics
(Gertenbach and Kars, 1999). Now, like in the rest of the world, they developed a growing concern towards
the selection of economically relevant beef carcass quality traits such as tenderness.
Advanced bio-technologies including the use of marker-assisted selection, artificial insemination,
cloning, transcriptional and translation assays, and gene transfer are becoming more available and may lead
to commercial applications with the potential to change the way we identify superior animals and the
dissemination of favourable genes to the beef production. In farm animals, molecular markers have several
important applications including the use of polymerase chain reaction (PCR) based techniques for studying
the genome, comparative genome mapping, identification of a candidate gene(s) for particular quantitative
trait loci (QTL’s), and for the investigation of animal biodiversity (Gustavo and Gresshoff, 1997; Odeh,
2003).
The use of DNA-markers to define the genotype and predict the performance of an animal is a
powerful aid to animal breeding (Cockett et al., 1995; Palmer et al., 1999; Beuzen et al., 2000). It enables
scientists to study the genetic composition of the bovine at the molecular level, identify the regions of the
genome that cause genetic variation and suggests strategies for improvement of meat tenderness through a
molecular approach (Kappes, 1996; Koohmaraie et al., 2003).
The bovine genome consists of 30 chromosomes (Figure 2.11), 1558 genes, 4357 loci, 4764 PCR
(polymerase chain reaction) markers and 2402 micro satellite markers (INRA bovmap database,
http://locus.jouy.inra.fr, 12 December 2006). These markers also find application in QTL studies. A study
by Casas et al. (2003), reported two QTL’s for meat tenderness. One of these is on chromosome 20;
affecting Warner-Bratzler shear force (WBSF) at 3 and 14 days post mortem and the second QTL are on
chromosome 29 for WBSF at 14 days post mortem. Casas et al. (2003) suggested that carcass composition
and meat quality traits are among those that would benefit most from the use of genetic marker information.
The identification and confirmation of QTL is complex, time-consuming and costly process, but promises
profitable commercial returns (Van Marle-Köster and Nel, 2003). QTL can lead to the potential use of
marker-assisted selection (MAS). MAS can increase genetic response because it is a more accurate selection
procedure and selection can be practiced at an earlier age (Kappes, 1996). MAS has potential to generate
change in carcass traits such as meat quality (tenderness), for which selection has been historically difficult,
18

due to the fact that tenderness (genetically) is a multi-factorial trait (more than one factor involved in
tenderness) (Frylinck, 2001; Gao et al., 2007).
Figure 2.11: An integrated cytogenetic and meiotic map of the bovine genome, adapted from (Eggen
and Fries, 1994).
Two main research groups in the world, namely USDA Meat Animal Research Centre in collaboration with
the Texas A&M University and AgResearch, New Zealand and CSIRO Livestock Industries and Meat and
Livestock, Australia made the greatest advances on the identification of genetic markers for factors that
influence beef quality, including tenderness. The Australian consortium patented their developed gene
marker tests, and not much is published in peer-reviewed articles. Information on the content of the tests is
only available in the technical notes published on the web site: www.geneticsolutions.com.au. Information
is available on the MARC gene markers, as it is not their policy to patent research, but rather publishes their
research in pear-reviewed articles and shares their work with the scientific community.
Therefore, research on markers indicating a muscle’s inherent ability to become tender has become
of major importance. One such marker is the activity of calpastatin (CAST) (Casas et al., 2006; Schenkel et
al., 2006), the specific inhibitor of calpain (Shackelford et al., 1994). Estimates of the relationship between
calpastatin activity and meat tenderness vary, but up to 40% of the variation in beef tenderness is explained
by calpastatin activity at 24 hours post mortem (Koohmaraie, 1994). A high genetic relationship exists
between calpastatin activity and beef tenderness with a genetic correlation reported in the literature between
calpastatin activity and taste panel tenderness of -0.95 (Bertrand et al., 2001). Such a high degree of
19

association justifies using calpastatin as a candidate gene for predicting meat tenderness, but the candidate
gene approach only allows for examination of one gene at a time.
The drawback of this analysis is that the factors affecting the expression of the gene of interest (e.g.
calpastatin) could be separated by large non-coding sequences (e.g. located on a different chromosome)
(Koohmaraie et al., 2003).
Several markers have been developed at the CAST gene and three SNP-markers (marker 316, marker
530 and marker 4751) have been developed at the CAPN1 gene (Figure 2.12) (Casas et al., 2006). The micro
molar calcium-activated neutral protease gene, CAPN1 (White et al., 2005) on BTA29 (Smith et al., 2000)
encodes a cysteine protease, µ-calpain, which is thought to be one of the most important enzymes involved in
beef tenderness (Page et al., 2002).
Figure 2.12: Genomic locations of SNP markers in CAPN1 gene (White et al., 2005).
Single nucleotide polymorphism (SNP) is found where different nucleotides occur at the same position in the
DNA sequence (i.e. the substitution of one nucleotide for another or the addition or deletion of one or a few
nucleotides). There is an increasing interest in the use of SNP’s as markers for genetic analysis because
these markers are found in coding and non-coding regions of the genome. In the coding regions SNP can be
directly associated with the protein function and as the inheritance pattern is more stable, and they are more
suitable markers for selection over time (Beuzen et al., 2000; Van Marle-Köster and Nel, 2003).
The SNP developed at the CAST gene is a transition from a guanine to an adenine at the 3'
untranslated region of the gene (Casas et al., 2006). The SNP’s in the CAPN1 gene lies on exon 9 (marker-
316) and exon 14 (marker-530) (Figure 2.12), both predict amino acid (AA) sequence changes. At AA
number 316 (marker-316), a guanine (G-allele) to cytosine (C-allele) transverse predicts either glycine or
alanine, and at number 530 (marker-530), an adenine (A-allele) to guanine (G-allele) transition predict either
isoleucine or valine (Page et al., 2004).
These markers (markers 316 and 530) can be used to guide selection in Bos taurus cattle, but do not
segregate at high frequencies in Brahman cattle (Bos indicus). Beef cattle of Bos indicus descent are widely
20

used for their heat tolerance and disease resistance, but tenderness has been problematic in many of these
breeds. The reputation for less tender meat in these cattle presents an opportunity for improvement by use of
genetic markers. White et al. (2005) extended the tenderness maker test to include cattle of Bos indicus, Bos
taurus and crossbred descent. Marker 4751, which is equivalent to position 6545 (C/T) of GenBank
accession number, AF248054 fulfilled this role. It was concluded that maker 316 may continue to be useful
in a variety of populations with a high percentage Bos taurus background, and that a multi marker system
(incorporating both markers 316 and 4751 for CAPN1) provides an optimal solution in cattle of all
subspecies backgrounds.
A commercial test that was developed from gene marker research in Australia is based on DNA-
testing namely: GeneStar® (Alison, 2006; Gao et al., 2007). Producers worldwide (Australia and America)
and in South Africa make use of this commercial test. GeneStar®-tenderness is a DNA based test for the
variants of the bovine calpastatin gene located on chromosome seven. The test detects two different forms of
the gene. The first form is associated with tenderness and the other with toughness. The concept of how
favourable and unfavourable form of the markers work together to predict a certain favourable or
unfavourable outcome of meat tenderness can be intricate for the layman. For simplicity, GeneStar® reports
the result for each marker as being either 0, 1 or 2 stars. Stars represent the favourable form of the markers
associated with the trait (tenderness). The more stars, the better. For a single DNA marker:
1. A zero star result means the animal carries neither of the favourable alleles for that marker.
This animal did not inherit a favourable allele from either parent.
2. A one star result means the animal carries one favourable allele for that marker. This animal
inherited a star from one parent and an unfavourable allele from the other parent.
3. A two star result means the animal carries both favourable alleles for that marker. This
animal inherited one star allele from each parent for this marker.
At the moment GeneStar® tests for four tenderness DNA markers that are identified as T1, T2, T3 and T4
(Alison, 2006; Gao et al., 2007). Not much is known about them except that results for each trait are
claimed to be additive (Technical update October 2006, www.geneticsolutions.com.au, 7 May 2007). Thus
an animal can score from 0 up to 8 stars for tenderness. According to their technical note (Technical update
October 2006, www.geneticsolutions.com.au, 7 May 2007), they DNA tested and analysed large sets of
carcass results with measurements of meat tenderness (i.e. mechanical shear force) as the objective measure,
where lower shear force is more desirable. Their results showed that the four markers are independent and
that the effects on tenderness are additive. The implication is that individual results for each marker can be
added together to assess the potential impact 0 - 8 star results. Their results show that the toughness decrease
as the number of stars increases in the total data set over 3000 carcasses from seven breeds.
A diagnostic test for a major gene for marbling in beef cattle, GeneStar®-marbling is also
commercially available (Gao et al., 2007). Marbling is the fine evenly distributed flecks of fat found through
21

the muscle and is often referred to as intra-muscular fat (IMT). GeneStar®-marbling indicates if the animal
has the favourable genotype with either one desirable allele (1-STAR) or two desirable alleles (2-STAR)
(www.agribsa.co.za, 21 January 2006). Consequently, marbling accounts for less than 10% of the variation
in meat tenderness according to Dransfield (1994).
Gene marker tests have application in the seed stock and commercial level by selecting for a higher
frequency of genes influencing meat tenderness. Under Australian conditions the estimated contribution of
this gene on meat tenderness was found to vary between 10 - 12%. Taking into account the many other
environmental and non-environmental conditions, that plays a role in meat tenderness and the elimination of
this variable could have a significant effect on the consistency of meat tenderness.
2.3 Measurement of meat tenderness
Numerous methods have been developed to measure the tenderness of meat, but the oldest method is the
consumption of meat samples (i.e. sensory analysis) (Boccard, 1973). An important part of sensory analysis
is to show not only the attributes that consumers like or dislike but also the most important characteristics
determining the overall acceptability. Therefore, sensory analysis enjoys recognition for its importance in
new product development, basic research, ingredient and process modification, cost reduction, quality
maintenance, and product optimisation (Lawless and Heymann, 1998; Scheepers, 1999).
Assessment of using instrumentation (shear force resistance measurement using Warner-Bratzler
shear force attachment) has remained the most popular and accurate instrumental measure of meat tenderness
(Culioli, 1995). WBSF based on the force needed to shear muscles fibres measures the tenderness of meat.
Thus, the more force needed, the tougher the meat is and the units of measurements are kilograms of force
needed to shear a one cubic centimetre muscle sample (Honikel, 1998). Factors that may affect the accuracy
of these measurements include the doneness of the cooked meat, uniformity of cylindrical sample size,
direction of the muscle fibre, amount of connective tissue and fat deposits present, temperature of the sample
and the speed at which the sample is sheared. According to Cross et al. (1986) the results usually correlate
well with the scores obtained from the sensory evaluation.
Sarcomere length (SL), myofibril fragmentation index (MFI) and myofibrillar fragment length
measurements (MFL), as part of histological traits has been used by many researchers to predict the
tenderness of meat (Thornberg, 1996). Sarcomere length is related to tenderness, especially in cases of
severe shortening (Whipple et al., 1990b). Frylinck and Heinze (2003) concluded that myofibril fragment
length correlates with sensory tenderness and WBSF, which support the statement that proteolysis of
myofibrillar proteins leads to increased fragmentation of myofibrils and decreased shear force during post
mortem storage (i.e. higher tenderness scores for shorter myofibril fragments). Thus, the MFI and changes in
myofibril fragmentation during post mortem storage is related to tenderness and can be used widely as a
method of estimating meat tenderness (Taylor et al., 1995).
22
It is well established that calpain-mediated degradation of myofibrillar proteins is responsible for post
mortem tenderisation of meat (Frylinck and Heinze, 2003). Apart from regular tests used to measure the
amount of protein in meat, an evaluation of their solubility is performed using electrophoresis, SDS-PAGE
(i.e. sodium dodecyl sulphate polyacrylamide gel electrophoresis) (Pospiech et al., 2003). With this
technique, proteins are separated on the basis of their molecular weight (Figure 2.13), thus evaluating the
proteolysis process. After staining of the gels with protein-binding dye, several bands can be observed
corresponding to proteins with a specific molecular weight. Degradation of a protein during meat ageing,
results in a decrease in the intensity of the band corresponding to this protein. Simultaneously, new bands
appear which correspond to protein fragments of the native protein.
The major contractile proteins, myosin and actin, are hardly or not at all degraded during meat
ageing at refrigeration temperatures (Penny, 1980; Goll et al., 1983; Koohmaraie et al., 1988). However,
during ageing of bovine muscles at high temperatures (23 - 37°C), substantial degradation of myosin heavy
chains takes place (Geesink, 1993). The most reported change in the myofibrillar proteins during ageing is
the gradual disappearance of troponin-T, with simultaneous appearance of protein fragments with a
molecular weight of 27 - 30 kDa (Figure 2.13). The breakdown of troponin-T and the appearance of a
30 kDa peptide have been proposed as a measure of post mortem proteolysis and meat tenderness (Geesink,
1993). Although the degradation of troponin-T parallels meat tenderisation, it is unlikely that this
degradation is directly responsible for post mortem tenderisation; troponin-T is located on the actin filaments
and not at or near the Z-line, where myofibrillar fragmentation takes place. Degradation of titin, during
ageing of meat at various temperatures (2 - 37 °C), has been reported for various muscles (Geesink, 1993).
Although a great deal of experimentation is yet needed to demonstrate the role of titin in meat quality, the
degree of titin degradation seems to parallel measures of fresh meat quality, such as tenderness (Huff et al.,
1991). Nebulin is rapidly degraded in post mortem muscle, even faster than in titin (Penny et al., 1984).
This degradation may trigger subsequent post mortem alterations in the myofibril. Due to nebulin that is a
long, fibrous, structural protein of the sarcomere, and may anchor thin filaments to Z-lines, nebulin’s demise
post mortem may decrease overall cytoskeletal integrity of the myofibrils, muscle cells and muscle tissue
(Robson et al., 1991). The desmin intermediate filaments are the only cytoskeletal elements discovered that
link myofibrils together and the myofibrils to other structural entities in the muscle cell. It was also
demonstrated that purified desmin is an excellent substrate for calpain. Desmin associated with isolated
myofibrils or muscle preparations in situ is also quickly degraded by the calpains. Desmin is degraded
during post mortem storage of muscle at about the same rate as troponin-T, which is degraded as one of the
better substrates of calpain. It is well known that there are distinct alterations and weakening of the inter-
myofibrillar links at the Z-line levels in post mortem muscle. Regarding the location of desmin at the
periphery of the Z-lines, degradation of this protein is probably responsible for loss of transversal alignment
of sarcomeres during ageing (Robson et al., 1991).
23

Figure 2.13: Sodium dodecyl sulphate polyacrylamide gel electrophoresis indicating protein separation
base on molecular weight (Adapted from Geesink, 1993).
The technique, Western-blotting could be used to determine whether these proteins are degraded during post
mortem storage and whether this degradation correlates to the loss of muscle structures (i.e. costameres)
(Taylor et al., 1995). Thus, protein evaluation is often performed simultaneously with an estimation of
proteolytic enzyme activity, changes of other compounds in muscles, especially those associated with
glycolysis.
Assessing tenderness is even further extended to a molecular level, where advances (i.e. genetic
markers) provide a potential for renewed methods in the beef industry. The extend to which meat tenderness
can or will be controlled or measured from this level, the future only will show (Pospiech et al., 2003).
2.4 Future developments
The beef industry is constantly undergoing changes and these changes are forced by the increasing concern
from the consumers for quality, safety, and trace ability. One of the main challenges in the future will be to
solve the problems posed by the analysis, interpretation and the access to large amount of data that will
become available from structural (QTL, SNP) and functional (protein levels) genomics. Beuzen et al. (2000)
Titin Nebulin
Myosin heavy chains
α-Actinin Desmin
Actin Troponin-T
β-Tropomyosin
α-Tropomysin 30 kDa Peptide Myosin light chain 1 Troponin-I Troponin-C
Myosin light chain 2 Myosin light chain 3
24

predicted that the next century would likely see the combination of both quantitative and molecular genetics
dominating the theory and practice in animal breeding. Thus, the challenges for the future can be overcome
by meat research but it appears that it is necessary, to focus on basic research more than ever, using
integrated multidisciplinary approaches.
25

CHAPTER 3
MATERIALS AND METHODS
MATERIALS
3.1 Animal management and harvest
The beef cattle used in this study were representatives of the crossbreds mostly responsible for meat
production in South Africa (according to Dave Ford of the Feedlot Association of South Africa and
committee member of the Red Meat Research and Development Trust) (RMRDT). The sixty beef animals
were classified according to the three breed types (Bos indicus and Sanga, Bos taurus) namely:
• Brahman-crosses (Bh) (n = 20) (Bos indicus)
• Nguni-crosses (Ng) (n = 20) (Sanga)
• Simmentaler-crosses (Sm) (n = 20) (Bos taurus)
Weaned, young bulls (7 - 8 months, and average weight of 158 kg) were transported to the Agricultural
Research Council - Animal Production Institute (ARC-API: Irene), where they were placed under feedlot
conditions for a period of about 100 to 120 days until slaughter. The animals were housed in small pens
holding ten animals each, with each animal having 10 cm2 and 50 cm of feed-bunk space. Clean, fresh water
was available at all times. A standard type of high concentrate diet was supplied to the animals (12 MJ/kg
DM, 13,5% protein) to which they were allowed to adapt during a three-week period, from high levels of hay
(15%) to low levels of hay (6%). The animals within the breed groups were blocked by weight and allocated
to their respective pens. The animals were weighed at two weekly intervals and daily health observations
(animal morbidity, consistent breathing and manure consistency) were made. All these actions were
necessary to comply with the rules of the Ethics Committee of the ARC. The animals were slaughtered
when at an A age (10 - 12 months) with a fatness class of two or three (lean-medium fatness) according to
the current South African Beef Classification System (Government Gazette No. 5092, 1993). The average
final pre-slaughter weight of the crossbreds in the feedlot was:
• Brahman-crosses (Bh) (final pre-slaughter weight in feedlot: +/- 430 kg)
• Nguni-crosses (Ng) (final pre-slaughter weight in feedlot: +/- 400 kg)
• Simmentaler-crosses (Sm) (final pre-slaughter weight in feedlot: +/- 370 kg)
26

3.2 The slaughtering process, post mortem sampling and storage
At slaughter the carcasses were not electrical stimulated (NS) because electrical stimulation (ES) influences
the processes of meat tenderness, and we were interested in the expression of the inherent tenderness
characteristics without external post mortem influences. After exsanguination the carcasses were dressed,
halved and chilled at 4 °C within 2 hours of slaughter. The M. longissimus thoracis et lumboram (LT and
LL) of the right and left sides were removed from the third last rib to the last lumbar vertebra and sub
sampled for shear force evaluations, SDS-PAGE, Western-blotting, myofibril fragmentation (MFL),
sarcomere length (SL), calpain, calpastatin, total collagen, % collagen solubility and marker analysis (Figure
3.1). The position of sampling for each test was consistent and the different samples were either frozen
immediately at -20 ˚C or -80 ˚C or vacuum packed and aged (2 ± 2 ˚C) for 7 or 14 days post mortem.
The muscle pH and temperature decline were measured at the second last lumbar vertebrae (Figure
3.1) at 1 hour, 2, 3, 6, 8 and 20 hours, after slaughter to diagnose pale, soft and exudative (PSE) type (PSE is
only found in pork, but a similar phenomenon exist in beef where a high drip loss takes place after a quick
pH decline and a slow temperature decline) or dark, firm and dry (DFD) phenomena at slaughter. This
phenomenon can influence the ageing process of the meat. The pH and temperature were determined with a
digital handheld meat pH meter (Unitemp) fitted with a polypropylene spear type gel electrode. Muscle
samples for other procedures were removed from M. longissimus dorsi (L1-L6) (LL) at specified positions
and preserved at either -25 °C or -80 °C after ageing at 1 day, 7 and 14 days post mortem (Addendum C,
Figure 1) (samples were aged in vacuum packaging at ± 2 °C) depending on method specification.
METHODS
3.3 Warner-Bratzler shear force measurements (WBSF)
Frozen M. longissimus dorsi (L1-L6) cuts aged for 1 day, 7 and 14 days were processed into 30 mm steaks
by means of a band saw before being thawed at 4 °C for 24 hours, and prepared according to an oven-
broiling method using direct radiant heat (AMSA, 1978). The steaks were broiled at 260 °C (pre-set) to
70 °C internal temperature. Each cooked steak was allowed to cool for 10 minutes and then wrapped in tin
foil and stored overnight at 4 °C for WBSF resistance measurements. WBSF was measured after the meat
had been removed from the chillers, and left to room temperature (± 22 °C) before being cored. Eight
cylindrical samples with a core diameter of 12.5 mm were removed parallel to the grain of the meat and
sheared perpendicular to the fibre direction using Warner-Bratzler shear device mounted on an Instron
Universal Testing Machine, Model 4301, Series IX Automated Materials Testing System Version 5 (Instron,
1990). Shear force was measured as the peak force (kg) average for eight cores per sample. The shear force
27

Left side of the carcass Right side of the carcass
Back
Front
Figure 3.1: The cuts of a beef carcass (Hofmeyer, 1981) and a schematic representation of where the
various samples were taken for the various analyses. MFL = Myofibril fragment lengths, WBC = Water
binding capacity.
of each steak (1 day, 7 and 14 days) was measured as the maximum force (kg, kilograms) required to shear a
cylindrical core cooked steak perpendicular to the grain, at a cross head speed of 400 mm per second.
Fore shin Neck Bolo Chuck Brisket Prime rib Wing rib Sirloin Thin flank Rump Thick flank Topside Silverside
Hind shin
pH measurement
Sample area
WBSF
WBSF WBSF
7 Days post mortem
14 Days post mortem 1 Day post mortem
Sarcomere length, Drip loss percentage,
WBC
Calpain system, MFL, SDS-PAGE, Western-blotting, Muscle Areas,
28

3.4 Myofibrillar fragmentation length (MFL) determination
Myofibril fragment length (MFL) is a useful indicator of the extent of myofibrillar protein degradation and
was used in the place of MFI determinations eliminating the drawbacks of background noise inevitable in the
MFI measuring technique. The MFL changes as a result of ageing, which is used as an indicator of the
weakening of the myofibrillar structure as a result of post mortem proteolysis. The extraction procedure was
conducted as described by Culler et al. (1978) and adapted by Heinze & Bruggemann (1994). From a frozen
M. longissimus dorsi (L1-L6) sample slices were cut with a knife for the MFL determination. Days 1, 7 and
14 samples were used for MFL determination. Any visible fat and connective tissue were removed. The
sample was then finely minced by means of scissors. About 3 grams (g) of the minced sample was weighed
into 50 ml Bőhler glass, and 30 ml of the MFL extraction buffer (0,02 M potassium phosphate buffer
containing: 100 mM KCL, 1 mM MgCl2, 1 mM EDTA, 1 mM NaN3, pH 7) (4 °C) was added. After
allowing the sample to thaw for 60 seconds, the sample was homogenised for exactly 30 seconds in a Bőhler
HO4 homogeniser while the sample was chilled with ice water, at 20,000 rpm with the blade turned around in
order to fragment the myofibrils with the blunt side of the blade rather than to cut them. The samples were
subsequently transferred into centrifuged tubes and centrifuge at 4 °C, 3000 rpm for 15 minutes. The
supernatant was discarded, and the pellet was suspended in 30 ml MFL extraction buffer. The sample was
again centrifuge at 3000 rpm for 15 minutes, at 4 °C. The supernatant was discarded, and the pellet was
again suspended in 10 ml MFL extraction buffer. The suspension was then filtered under vacuum through a
1000 µm polyethylene strainer. An additional 5 ml MFL extraction buffer was used to facilitate the passage
of the myofibrils through the strainer. The filtrate was subsequently filtered under vacuum, through a
250 µm polyethylene strainer. The samples were transferred on to a slide and covered with a slip. The
excess water is dried and the slide was cleaned. 100 Single myofibril fragments were measured by means of
a Video Image Analyser (Kontron, Germany).
3.5 Sarcomere length (SL) determination
The sarcomere lengths (the length of the contractile unit of a muscle) were measured by using a Video Image
Analyser (Kontron, Germany) after preparation of a fresh sample, according to the method of Hegarty and
Naudé (1970) by using distilled water (dH20) instead of Ringer Locke solution (Dreyer et al., 1979).
Sarcomere lengths were determined on the M. longissimus muscle at 1 day, 7 and 14 days post mortem
where a meat sample is scratched along the grain of the fibres. The sample is homogenised with an Ultra
Turrax. After homogenising the sample is transferred on to a slide and covered with a cover slip. The
excess water is dried off and slide is cleaned. Five sarcomere lengths are measure at a time, from the bottom
of the first sarcomere to the top of the fifth sarcomere. The averages of 100 SL readings were calculated.
29

3.6 Calpain and calpastatin analysis
Calpastatin in combination with µ-calpain and m-calpain were extracted from 5 g of the M. longissimus
frozen samples as described by (Dransfield, 1996) and separated by means of the two-step gradient ion-
exchange chromatography-method according to Geesink and Koohmaraie (1999b). µ-Calpain activity in
eluates containing both µ-calpain and calpastatin is estimated from calpastatin measurements before and after
heating the eluates. Calpain assays were done using azo-casein as substrate according to Dransfield (1996).
The use of azo-casein eliminates the problem of background absorbance of non-specific proteins in the
extracts. One unit of calpain activity was defined as an increase in absorbance at 366 nm of 1.0 per hour, at
25 °C. One unit of calpastatin activity was defined as the amount that inhibited one unit of m-calpain
activity. Data were expressed as units per gram of muscle or units per milligram of extractable protein
(specific activity). Protein concentration of the M. longissimus frozen samples was determined by the buiret
method of Cornall et al. (1949) as sited by Bailey (1967).
3.7 Sodium dodecyl sulphate polyacrylamide gel electrophoresis (SDS-PAGE) and
Western-blotting analysis
The separation of macromolecules in an electric field is called electrophoresis. A very common method for
separating proteins by electrophoresis uses a discontinuous polyacrylamide gel as a support medium, and
sodium dodecyl sulphate (SDS) to denature the proteins. The method is called sodium dodecyl sulphate
polyacrylamide gel electrophoresis (SDS-PAGE) (Figure 3.2).
Figure 3.2: Illustration of the set up of a PAGE apparatus and concept of using electric charge to drive
protein separation (Campbell, 1995).
30

To study the degradation of titin, nebulin, desmin and the appearance of the 30 kDa degradation products as
a result of tenderisation. 0.25 g of 1day, 7 and 14 days post mortem M. longissimus samples were extracted
according to the methods of Laemmli (1970). The protein concentration of the samples was determined by
means of the biuret method as sited by Bailey (1967). A standard curve was prepared from which the protein
concentration of the samples was calculated with the spectrophotometer (Beckman Spectrophotometer DU-
7500). For the SDS-PAGE and Western-blotting (specialised technique to detect gene products and to find
similarities) analysis the M. longissimus proteins were separated by means of 30% T, 0.5% C separation gels
with 12% T, 12,5% C stacking gels (Fritz et al., 1989). A wide molecular weight range SigmaMarkerTM (M
4038) containing thirteen proteins from 6 - 205 kDa were used as the standard (Table 3.1).
Table 3.1: Molecular weight distributions for proteins in the wide molecular weight range
(SigmaMarkerTM
).
Proteins Molecular Weight (MW)
Myosin, rabbit muscle 205,000
Β-Galactosidase, E.Coli 116,000
Phosphorylase b, rabbit muscle 97,000
Fructose-6-phosphate kinase, rabbit muscle 84,000
Albumin, bovine serum 66,000
Glutamic Dehydrogenase, bovine liver 55,000
Ovalbumin, chicken egg 45,000
Glyceraldehyde-3-phosphate Dehydrogenase, rabbit muscle 36,000
Carbonic Anhydrase, bovine erythrocytes 29,000
Trypsinogen, bovine pancreas 24,000
Trypsin Inhibitor, soybean 20,000
Lactalbumin, bovine milk 14,200
Aprotinin, bovine lung 6,500
After the gels were stained (Coomassie Blue staining solution) and destained, it was vacuum packed and
stored at 4 °C until all SDS-PAGE analysis were completed. To further study the degradation of the protein
desmin that is regarded as a key structural protein (Huff-Lonergan et al., 1996a; Ho et al., 1996) and is
related to tenderisation, Western-blotting analysis was applied after the SDS-PAGE procedure. The gels
used for Western-blotting was not stained and destained after electrophoresis but were equilibrated for
15 minutes at 4 °C in a transfer buffer containing 25 mM Tris, 192 mM glycine, 2 mM EDTA, 15% (vol/vol)
methanol, and 0.1% (wt/vol) SDS. The transfer conditions were as described by Huff-Lonergan et al.,
(1996b) and a Mighty Small Transphor Tank Transfer Unit (TE 22, Amersham Pharmacia Biotech)
(Addendum C, Figure 2) was used to transfer the proteins from the gels on to a nitrocellulose membrane
(RPN 303D, Hybond ECL, AEC-Amersham). After transferring, the membranes were incubated in a
31
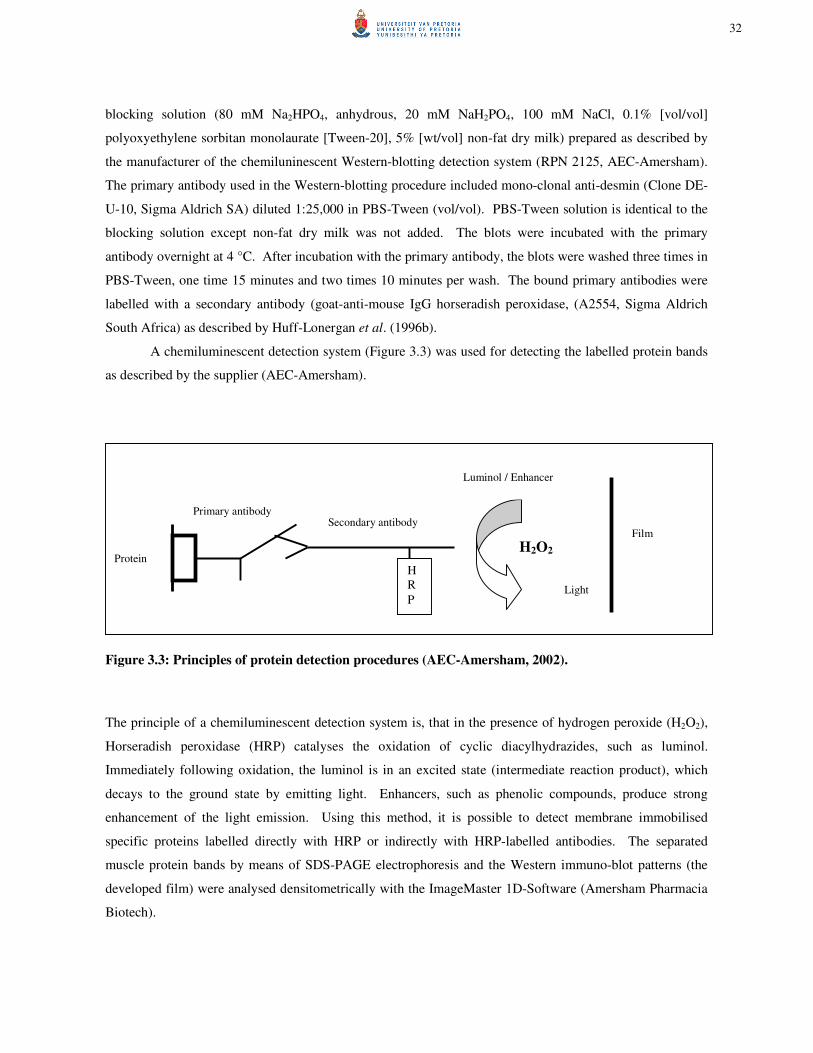
blocking solution (80 mM Na2HPO4, anhydrous, 20 mM NaH2PO4, 100 mM NaCl, 0.1% [vol/vol]
polyoxyethylene sorbitan monolaurate [Tween-20], 5% [wt/vol] non-fat dry milk) prepared as described by
the manufacturer of the chemiluninescent Western-blotting detection system (RPN 2125, AEC-Amersham).
The primary antibody used in the Western-blotting procedure included mono-clonal anti-desmin (Clone DE-
U-10, Sigma Aldrich SA) diluted 1:25,000 in PBS-Tween (vol/vol). PBS-Tween solution is identical to the
blocking solution except non-fat dry milk was not added. The blots were incubated with the primary
antibody overnight at 4 °C. After incubation with the primary antibody, the blots were washed three times in
PBS-Tween, one time 15 minutes and two times 10 minutes per wash. The bound primary antibodies were
labelled with a secondary antibody (goat-anti-mouse IgG horseradish peroxidase, (A2554, Sigma Aldrich
South Africa) as described by Huff-Lonergan et al. (1996b).
A chemiluminescent detection system (Figure 3.3) was used for detecting the labelled protein bands
as described by the supplier (AEC-Amersham).
Figure 3.3: Principles of protein detection procedures (AEC-Amersham, 2002).
The principle of a chemiluminescent detection system is, that in the presence of hydrogen peroxide (H2O2),
Horseradish peroxidase (HRP) catalyses the oxidation of cyclic diacylhydrazides, such as luminol.
Immediately following oxidation, the luminol is in an excited state (intermediate reaction product), which
decays to the ground state by emitting light. Enhancers, such as phenolic compounds, produce strong
enhancement of the light emission. Using this method, it is possible to detect membrane immobilised
specific proteins labelled directly with HRP or indirectly with HRP-labelled antibodies. The separated
muscle protein bands by means of SDS-PAGE electrophoresis and the Western immuno-blot patterns (the
developed film) were analysed densitometrically with the ImageMaster 1D-Software (Amersham Pharmacia
Biotech).
H R
P
Protein
Primary antibody Secondary antibody
Luminol / Enhancer
H2O2
Light
Film
32

3.8 Total collagen and percentage collagen solubility
The total collagen content of the M. longissimus muscle (total hydroxy-proline nitrogen content) was
estimated by determining the hydroxy-proline content in hydrolysed samples. 30 ml 6N HCl was added to
0.5 g pulverized freeze dried sample and hydrolysed at 110 °C for 16 hours, followed by the addition of
active carbon, filtered and diluted with distilled water to 100 ml. The total nitrogen content in muscle was
determined after the samples had been digested in a micro Kjeldahl system.
The solubility of the intramuscular collagen (hydroxy-proline nitrogen content of soluble collagen)
was determined according to the method of Hill (1966) with some modifications. Freeze dried meat samples
(1 g) were pulverized and added to 12 ml of a 1% NaCl solution and heated in a water bath for 60 minutes at
78 °C. After centrifugation at 1,000 rpm for 30 minutes, 30 ml 6 N HCl was added to the supernatants and
then hydrolysed for 16 hours at 110°C. Active carbon was added to the hydrolysed samples, then filtered
and diluted with distilled water to 100 ml.
Hydroxy-proline were calorimetrically determined by neutralising the acid in the samples with 10%
KOH, and then oxidized with Chloramine-T for 20 minutes. Ehrlich’s reagent was then added and the
samples were placed in a water bath for 15 minutes at 60 °C. The absorbance of the pink colour was
measured at 558 nm in a 1-cm3 cuvette, as described by Bergman and Loxley (1963). All determinations
were performed in triplicate. Collagen solubility was calculated by expressing hydroxy-proline in the filtrate
as a percentage of the total hydroxy-proline in the filtrate plus residue.
Collagen content was expressed as hydroxy-proline nitrogen per total protein nitrogen (Hypro N x
103 / total protein N) by calculating hydroxy-proline nitrogen from hydroxy-proline MM 131.13 and nitrogen
atom number 14.0067.
3.9 DNA extraction and marker analyses
DNA extractions were performed at the Department of Animal and Wildlife Science, University of Pretoria
(UP), South Africa, with a commercial kit, DNeasy Tissue (QIAGEN). Samples (Addendum C, Figure 1)
from the M. longissimus that were stored at -20 °C were used for the DNA extraction as described in the
protocol: “Purification of total DNA from total animal tissues”.
The standard protocol of the DNeasy Tissue kit was used with the following adaptations: 150-170 g
tissues was cut up in to small pieces, and placed in a 2 ml micro centrifuge tube. 600 µl ATL buffer and
60 µl Proteinase K was added and incubated at 55 °C until the tissue was completely lysed. After incubation,
620 µl AL buffer was added to the sample and incubated at 70 °C for 10 minutes. After the second
incubation, 620 µl ethanol (96 - 100%) was added to the sample and was centrifuge at ≥ 8000 rpm for four
minutes. The washing steps with buffers AW1 and AW2 were repeated twice.
33

After incubation and elution the DNA yield and purity were determined with a nanodrop (ND-1000)
spectrophotometer, (Addendum C, Figure 3). DNA yield was determined by measuring the concentration of
DNA in the eluant by means of its absorbance at 260 nm. The ratio of the readings at 260 nm and 280 nm
(A260/A280) provides an estimate of the purity of DNA with respect to contaminants that absorb UV, such as
protein. The following estimates were set as a standard:
• Estimate of DNA yield, Absorbance (A260): 0.1 - 1.0 ng/µl
• Purity of the DNA, Ratio (A260/A230): 0.8 - 1.8 ng/µl
• Estimate of the purity of DNA with respect to contaminants that absorb ultra violet (UV), such as
protein, Ratio (A260/A280): 1.8 - 2.0 ng/µl
After determining the purity and yield of the DNA, 40 µl of the DNA was stored at -40 °C at the Department
of Animal and Wildlife Science, University of Pretoria (UP), South Africa. 60 µl DNA was allocated into
tubes with screw tops and labelled clearly. Samples were kept at -4 °C and were transported on ice with a
courier services to the U.S. Meat Animal Research Centre (MARC) for further analyses.
At MARC, animal sequencing and single nucleotide polymorphism (SNP) identification were used
to determine the following markers: the micro molar activated neutral protease (CAPN1) and its inhibitor
calpastatin (CAST). Sequencing was performed with BigDye Terminator as recommended by the
manufacturer (Applied Biosystems, Inc.) and was analysed on an ABI 3700 sequencer. Sequence data was
entered into the database, base calls were made using Phrep, and the sequences were aligned using Phrap
(Ewing and Green, 1998). A viewer (Consed) was used to identify and tag single nucleotide polymorphisms,
according to the method proposed by Gordon et al. (1998) as described by Heaton et al. (2001).
Genotyping was performed using a primer extension method (Table 3.2) with mass spectrometry-
based analysis of the extension products on a Mass Array system as suggested by the manufacturer
(Sequenom, Inc., San Diego, CA) and described by Stone et al. (2002). A universal mass tag sequence was
added to the 5' end of each gene-specific amplification primer sequence as recommended by the
manufacturer.
Table 3.2: Genotyping primers for CAPN1 markers (White et al., 2005)
Marker Forward primer a
Reverse primer a
Probe
316 GAGCTGGCCCTCATAAGATAA CCCATCCTCCATCTTGACC CCTCGGAGTGGAACG
4751 AAGGGACAGATGTGGACAGG GAGGGGTGTTCTCTGAGTGC ACACAGCCCTGCGCCTC
a Amplification primers are shown minus standard mass tag
34

Genotypes for each animal were analysed, and the automated calls were checked by manual visualisation of
the spectrographs to minimize errors. Thus, the methods for determining the CAPN1-316 and CAPN1-4751
were based on the methods described by Page et al. (2002) and White et al. (2005), where the determination
of CAST was based on the method of Casas et al. (2006).
These genetic markers can be associated with meat tenderness and they expand the possibilities to
improve meat tenderness in many commercial herds, especially those including cattle of Brahman and / or
crossbred descent.
3.10 Statistical analysis
The data of WBSF, MFL, SL, calpains- and calpastatin levels, SDS-PAGE, Western-blotting, total
collagen, collagen solubility and genetic markers were subjected to analysis of variance for a split-plot
design (GenStat® 7, 2003) with the three crossbreds (Brahman, Nguni and Simmentaler) as whole plots and
the three ageing periods (1 day, 7 and 14 days post mortem) as sub-plots. Means for the interactions between
the sub-plot and whole plot were separated using Fisher’s protected t-test least significant difference (LSD)
at the 1% and 5% level of probability (Snedecor and Cochran, 1980). ANOVA was used to analyse the
variation caused by breed effect for all other data collected. Allele frequencies were estimated by direct
count. Simple correlation coefficients were generated between the different characteristics measured.
35

CHAPTER 4
RESULTS
4.1 Animal characteristics
The sixty beef carcasses studied were representative of three cattle genotypes and were phenotypically
classified according to the three breed groups (Bos indicus, Sanga and Bos taurus) namely:
• Brahman-crosses (Bos indicus) (n = 20; Bh)
• Nguni-crosses (Sanga) (n = 20; Ng)
• Simmentaler-crosses (Bos taurus) (n = 20; Sm)
The characteristics of the experimental animals are summarised in Table 4.1. The small-framed Nguni-
crosses had a significantly (p < 0.001) lower live weight than the Brahman-crosses and Simmentaler-crosses.
The Simmentaler-crosses and the Brahman-crosses had similar average carcass weight (hot and cold) that
was significantly (p < 0.001) higher than the average carcass weight of the Nguni-crosses. The average
percentage carcass weight loss from warm to cold differed significantly (p < 0.002) between the Nguni-
crosses and the Brahman-crosses, with the Brahman-crosses being significantly lower than the Nguni-crosses
(Table 4.1). Drip loss percentage differed significantly (p < 0.003) between the three genotypes. The
Brahman-crosses had a significantly (p < 0.003) higher drip loss of 1.725%, followed by the Simmentaler-
crosses (1.465%) and the Nguni-crosses with a drip loss percentage of 1.178. The Brahman-crosses differed
significantly from the Nguni-crosses in terms of drip loss percentage. Water binding capacity (WBC) did not
differ significantly (p > 0.05) between the crossbreds (Table 4.1).
The pH and temperature measurements at 1 hour, 3, 6, 8 and 24 hours post slaughter are reported in
Table 4.1. The pH changed over time showed a normal profile to non-electrically stimulated carcasses and
did not differ significantly (p > 0.05) between the crossbreds. Carcass temperature and rate of temperature
decline rate were significantly similar between the Brahman-crosses and the Simmentaler-crosses for 3 hours
and up to 8 hours post mortem (Table 4.1). Carcasses from Nguni-crosses cooled down quicker (smaller
than the Brahman- and Simmentaler-crosses) (Figure 4.1), thus the lower carcass temperatures at 24 hours
post mortem (Table 4.1).
36

Table 4.1: Least square means and standard errors of means (SEM) describing the carcass mass and
percentage carcass weight loss characteristics, water binding capacity (WBC), the effect of genotype
and post mortem metabolism on the temperature and pH decline of the M. longissimus dorsi (L1-L6)
(non-electrically stimulated carcasses) in three crossbreds evaluated.
Genotype
Characteristic SEM Brahman-X Simmentaler-X Nguni-X p-Value
Live animal weight at
slaughter (kg)
5.10
485.2b
483.8b
366.2a
< 0.001
Hot carcass weight (kg) 3.20 282.4b 275.4b 206.9a < 0.001
Cold carcass weight (kg)
24 hours post mortem
3.13
277.3b
270.0b
202.6a
< 0.001
% Carcass loss 0.05 1.796a 1.935ab 2.067b < 0.002
% Drip loss 0.11 1.725b 1.465ab 1.178a < 0.003
WBC 0.01 0.448 0.448 0.463 0.329
Muscle pH
1 hour post mortem 0.04 6.565 6.635 6.606 0.530
3 hours post mortem 0.05 6.209 6.317 6.288 0.283
6 hours post mortem 0.04 5.957 6.043 6.040 0.225
8 hours post mortem 0.04 5.780 5.879 5.897 0.106
24 hours post mortem 0.04 5.704 5.721 5.812 0.071
Muscle temperature (°C)
1 hour post mortem 0.25 38.30 38.70 38.63 0.491
3 hours post mortem 0.50 28.32b 28.84b 25.88a < 0.001
6 hours post mortem 0.49 18.34b 18.30b 15.93a < 0.001
8 hours post mortem 0.53 15.27b 14.84b 12.92a < 0.006
24 hours post mortem 0.40 4.04 3.90 3.73 0.858
abc – Means in row with different superscripts differ significantly based on the Fishers’ means separation test;
Brahman-X: Brahman-crosses; Simmentaler-X: Simmentaler-crosses; Nguni-X: Nguni-crosses.
37

0
5
10
15
20
25
30
35
40
45
Tem
pera
ture
Bh
Ng
Sm
Figure 4.1: Temperature (°C) decline of the M. longissimus dorsi (L1-L6) (non-electrically stimulated
carcasses) in the three crossbreds evaluated.
4.2 Tenderness of the loin samples
Accurate assessment of beef tenderness necessitates careful consideration of the methodologies employed
(Davis et al., 1980). Least square means and standard errors for shear force measurements are presented in
Table 4.2.
Significant differences were found (p < 0.003) in the overall Warner-Bratzler shear force (WBSF)
values of the three different crossbreds for an ageing effect. From the results presented, the Brahman-crosses
(Bos indicus) were found to have overall significant lower shear force values (more tender) and the
Simmentaler-crosses (European Bos taurus) with the highest shear force values (less tender) with the Nguni-
crosses (Sanga) in an intermediate position under these specific experimental conditions. The shear force
measurements for 1 day, 7 and 14 days post mortem did not differ significantly (p > 0.05) between the
crossbreds (Table 4.2).
1 3 6 8 24
Hours post mortem
38
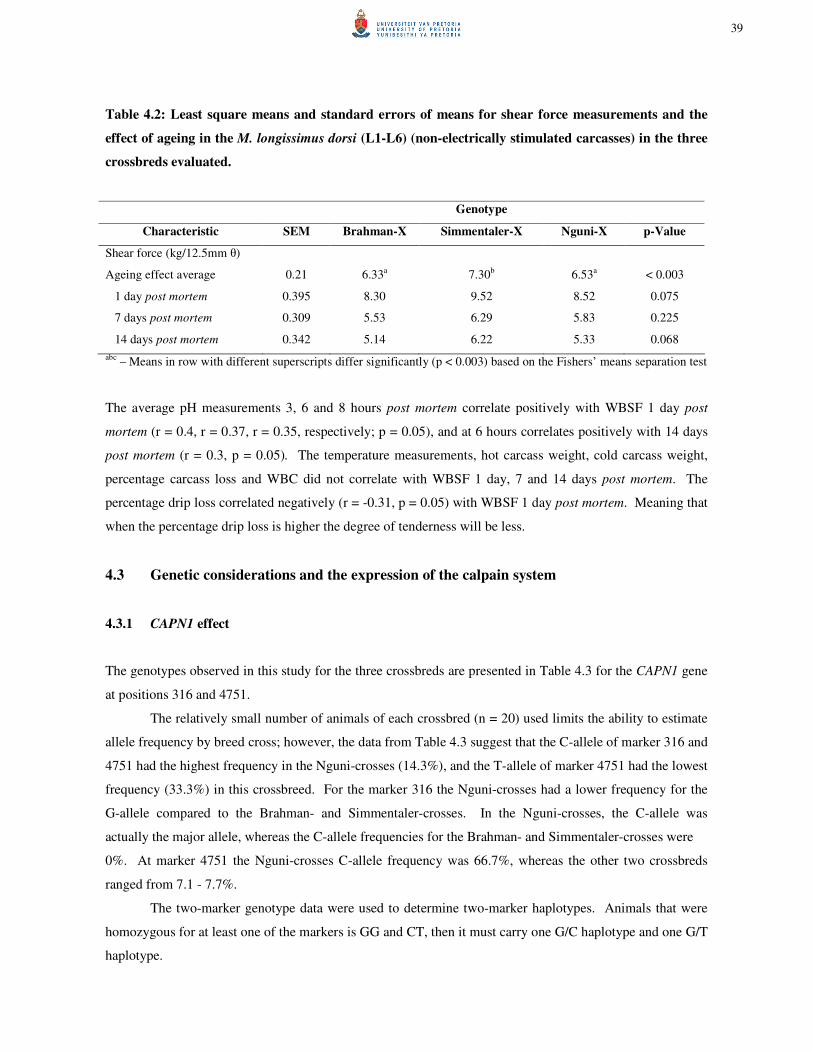
Table 4.2: Least square means and standard errors of means for shear force measurements and the
effect of ageing in the M. longissimus dorsi (L1-L6) (non-electrically stimulated carcasses) in the three
crossbreds evaluated.
Genotype
Characteristic SEM Brahman-X Simmentaler-X Nguni-X p-Value
Shear force (kg/12.5mm θ)
Ageing effect average 0.21 6.33a 7.30b 6.53a < 0.003
1 day post mortem 0.395 8.30 9.52 8.52 0.075
7 days post mortem 0.309 5.53 6.29 5.83 0.225
14 days post mortem 0.342 5.14 6.22 5.33 0.068
abc – Means in row with different superscripts differ significantly (p < 0.003) based on the Fishers’ means separation test
The average pH measurements 3, 6 and 8 hours post mortem correlate positively with WBSF 1 day post
mortem (r = 0.4, r = 0.37, r = 0.35, respectively; p = 0.05), and at 6 hours correlates positively with 14 days
post mortem (r = 0.3, p = 0.05). The temperature measurements, hot carcass weight, cold carcass weight,
percentage carcass loss and WBC did not correlate with WBSF 1 day, 7 and 14 days post mortem. The
percentage drip loss correlated negatively (r = -0.31, p = 0.05) with WBSF 1 day post mortem. Meaning that
when the percentage drip loss is higher the degree of tenderness will be less.
4.3 Genetic considerations and the expression of the calpain system
4.3.1 CAPN1 effect
The genotypes observed in this study for the three crossbreds are presented in Table 4.3 for the CAPN1 gene
at positions 316 and 4751.
The relatively small number of animals of each crossbred (n = 20) used limits the ability to estimate
allele frequency by breed cross; however, the data from Table 4.3 suggest that the C-allele of marker 316 and
4751 had the highest frequency in the Nguni-crosses (14.3%), and the T-allele of marker 4751 had the lowest
frequency (33.3%) in this crossbreed. For the marker 316 the Nguni-crosses had a lower frequency for the
G-allele compared to the Brahman- and Simmentaler-crosses. In the Nguni-crosses, the C-allele was
actually the major allele, whereas the C-allele frequencies for the Brahman- and Simmentaler-crosses were
0%. At marker 4751 the Nguni-crosses C-allele frequency was 66.7%, whereas the other two crossbreds
ranged from 7.1 - 7.7%.
The two-marker genotype data were used to determine two-marker haplotypes. Animals that were
homozygous for at least one of the markers is GG and CT, then it must carry one G/C haplotype and one G/T
haplotype.
39
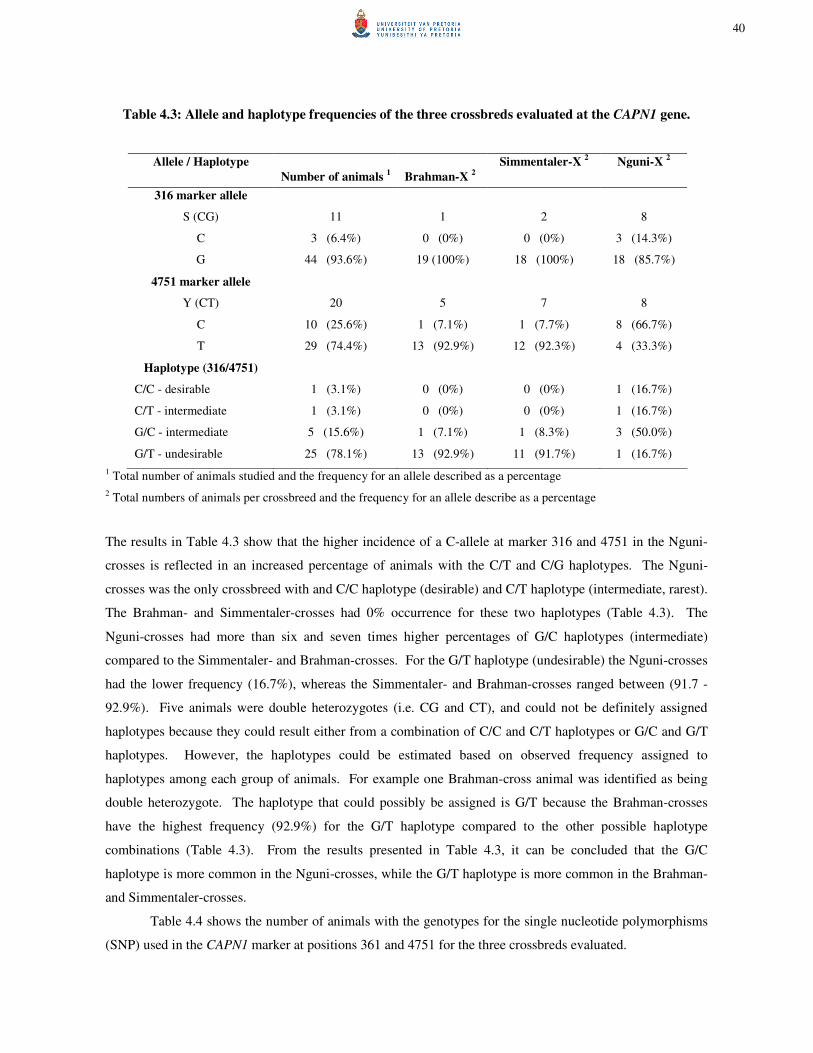
Table 4.3: Allele and haplotype frequencies of the three crossbreds evaluated at the CAPN1 gene.
Allele / Haplotype
Number of animals 1
Brahman-X 2
Simmentaler-X 2
Nguni-X 2
316 marker allele
S (CG) 11 1 2 8
C
G
3 (6.4%)
44 (93.6%)
0 (0%)
19 (100%)
0 (0%)
18 (100%)
3 (14.3%)
18 (85.7%)
4751 marker allele
Y (CT) 20 5 7 8
C
T
10 (25.6%)
29 (74.4%)
1 (7.1%)
13 (92.9%)
1 (7.7%)
12 (92.3%)
8 (66.7%)
4 (33.3%)
Haplotype (316/4751)
C/C - desirable
C/T - intermediate
G/C - intermediate
G/T - undesirable
1 (3.1%)
1 (3.1%)
5 (15.6%)
25 (78.1%)
0 (0%)
0 (0%)
1 (7.1%)
13 (92.9%)
0 (0%)
0 (0%)
1 (8.3%)
11 (91.7%)
1 (16.7%)
1 (16.7%)
3 (50.0%)
1 (16.7%)
1 Total number of animals studied and the frequency for an allele described as a percentage
2 Total numbers of animals per crossbreed and the frequency for an allele describe as a percentage
The results in Table 4.3 show that the higher incidence of a C-allele at marker 316 and 4751 in the Nguni-
crosses is reflected in an increased percentage of animals with the C/T and C/G haplotypes. The Nguni-
crosses was the only crossbreed with and C/C haplotype (desirable) and C/T haplotype (intermediate, rarest).
The Brahman- and Simmentaler-crosses had 0% occurrence for these two haplotypes (Table 4.3). The
Nguni-crosses had more than six and seven times higher percentages of G/C haplotypes (intermediate)
compared to the Simmentaler- and Brahman-crosses. For the G/T haplotype (undesirable) the Nguni-crosses
had the lower frequency (16.7%), whereas the Simmentaler- and Brahman-crosses ranged between (91.7 -
92.9%). Five animals were double heterozygotes (i.e. CG and CT), and could not be definitely assigned
haplotypes because they could result either from a combination of C/C and C/T haplotypes or G/C and G/T
haplotypes. However, the haplotypes could be estimated based on observed frequency assigned to
haplotypes among each group of animals. For example one Brahman-cross animal was identified as being
double heterozygote. The haplotype that could possibly be assigned is G/T because the Brahman-crosses
have the highest frequency (92.9%) for the G/T haplotype compared to the other possible haplotype
combinations (Table 4.3). From the results presented in Table 4.3, it can be concluded that the G/C
haplotype is more common in the Nguni-crosses, while the G/T haplotype is more common in the Brahman-
and Simmentaler-crosses.
Table 4.4 shows the number of animals with the genotypes for the single nucleotide polymorphisms
(SNP) used in the CAPN1 marker at positions 361 and 4751 for the three crossbreds evaluated.
40

Table 4.4: Number of individuals inheriting the CC, CG and GG genotypes at position 316
(CAPN1316) and CC, CT and TT genotypes at position 4751 (CAPN1-4751).
CAPN1-4751
Brahman-X Simmentaler-X Nguni-X
CAPN1-316
CC CT TT Total CC CT TT Total CC CT TT Total
CC 0 0 0 0 0 0 0 0 1 1 1 3
CG 0 1 0 1 0 1 1 2 3 3 2 8
GG 1 4 14 19 1 6 11 18 3 4 1 8
Total 1 5 14 20 1 7 12 20 7 8 4 19
The results from Table 4.4 indicate that for CAPN1 there were 59 animals with both 316 and 4751 markers
called. Table 4.4 indicates that the Nguni-crosses had one “no call” for the markers. A “no call” indicates
that the assay did not produce a reliable genotype. Genotypes for the CC class at CAPN1 were 0% for the
Brahman- and Simmentaler-crosses. The CC genotypes at both markers (316 and 4751) represent animals
that are more tender than any other animal or group compared to inheriting the GG and TT genotype
(undesirable or tough) at both markers. When considering all the results presented (Table 4.3 and Table 4.4),
it can be concluded that the Nguni-crosses have the higher frequency of more preferred alleles for tender
meat compared to the other breeds. The Brahman-crosses had the most undesirable alleles followed by the
Simmentaler-crosses.
The results from Table 4.3 and Table 4.4 can also be explained via indexes. Indexes for both
markers were calculated with a total value of three for each marker, meaning that the higher the index value
the tougher the meat compared to a lower value indicating tenderness. For both markers (316 and 4751) at
the CAPN1 gene the total value of the index adds up to six. Table 4.5 represents the average indexes for the
three crossbreds evaluated in this study.
Table 4.5: The average indexes for the markers (316 and 4751) at the CAPN1 gene for the three
crossbreds evaluated.
Marker Brahman-X Simmentaler-X Nguni-X
CAPN1-316 2.95 2.90 2.26
CAPN1-4751 2.63 2.55 1.80
CAPN1 (316 + 4751) 5.58 5.45 4.11
The results from Table 4.5 confirm that the Nguni-crosses had the higher frequency of more preferred alleles
for tender meat compared to the other crossbreds. The Brahman- and Simmentaler-crosses have the
tendency for tougher meat and differ with a range of 0.05 - 0.13.
41
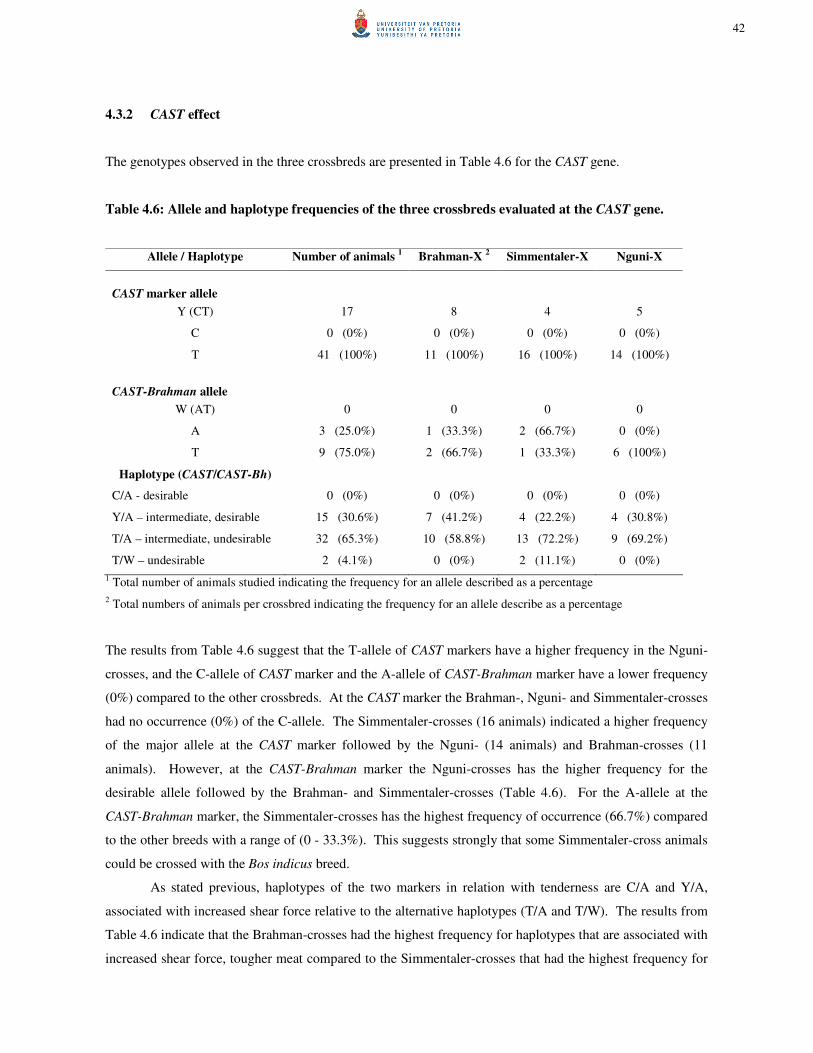
4.3.2 CAST effect
The genotypes observed in the three crossbreds are presented in Table 4.6 for the CAST gene.
Table 4.6: Allele and haplotype frequencies of the three crossbreds evaluated at the CAST gene.
Allele / Haplotype Number of animals 1
Brahman-X 2
Simmentaler-X Nguni-X
CAST marker allele
Y (CT) 17 8 4 5
C
T
0 (0%)
41 (100%)
0 (0%)
11 (100%)
0 (0%)
16 (100%)
0 (0%)
14 (100%)
CAST-Brahman allele
W (AT) 0 0 0 0
A
T
3 (25.0%)
9 (75.0%)
1 (33.3%)
2 (66.7%)
2 (66.7%)
1 (33.3%)
0 (0%)
6 (100%)
Haplotype (CAST/CAST-Bh)
C/A - desirable
Y/A – intermediate, desirable
T/A – intermediate, undesirable
T/W – undesirable
0 (0%)
15 (30.6%)
32 (65.3%)
2 (4.1%)
0 (0%)
7 (41.2%)
10 (58.8%)
0 (0%)
0 (0%)
4 (22.2%)
13 (72.2%)
2 (11.1%)
0 (0%)
4 (30.8%)
9 (69.2%)
0 (0%)
1 Total number of animals studied indicating the frequency for an allele described as a percentage
2 Total numbers of animals per crossbred indicating the frequency for an allele describe as a percentage
The results from Table 4.6 suggest that the T-allele of CAST markers have a higher frequency in the Nguni-
crosses, and the C-allele of CAST marker and the A-allele of CAST-Brahman marker have a lower frequency
(0%) compared to the other crossbreds. At the CAST marker the Brahman-, Nguni- and Simmentaler-crosses
had no occurrence (0%) of the C-allele. The Simmentaler-crosses (16 animals) indicated a higher frequency
of the major allele at the CAST marker followed by the Nguni- (14 animals) and Brahman-crosses (11
animals). However, at the CAST-Brahman marker the Nguni-crosses has the higher frequency for the
desirable allele followed by the Brahman- and Simmentaler-crosses (Table 4.6). For the A-allele at the
CAST-Brahman marker, the Simmentaler-crosses has the highest frequency of occurrence (66.7%) compared
to the other breeds with a range of (0 - 33.3%). This suggests strongly that some Simmentaler-cross animals
could be crossed with the Bos indicus breed.
As stated previous, haplotypes of the two markers in relation with tenderness are C/A and Y/A,
associated with increased shear force relative to the alternative haplotypes (T/A and T/W). The results from
Table 4.6 indicate that the Brahman-crosses had the highest frequency for haplotypes that are associated with
increased shear force, tougher meat compared to the Simmentaler-crosses that had the highest frequency for
42

haplotypes that are associated with lower shear force, tender meat. The Nguni-crosses were intermediate; the
reason for this could be due to the fact that the CAST markers are more prominent in Bos indicus, than in Bos
taurus or animals from a crossbred (Bos Taurus / Bos indicus) descent. Table 4.7 represents the average
indexes for the three crossbreds evaluated in this study for the CAST gene.
Table 4.7: The average indexes for the markers (CAST and CAST-Brahman) at the CAST gene in the
three crossbreds evaluated.
Marker Brahman-X Simmentaler-X Nguni-X
CAST 1.42 1.20 1.26
CAST-Brahman 1.06 1.00 1.11
CAST+CAST-Brahman 2.50 2.32 2.31
According the indexes for the CAST marker, the Simmentaler-crosses should have more tender meat
compared to the Nguni- and Brahman-crosses. The CAST-Brahman marker on the other hand indicated that
the Nguni-crosses should have the toughest meat (Table 4.7). However, according to the total index for the
CAST gene, the Nguni-crosses had more favourable genotypes compared to the Simmentaler- and Brahman-
crosses, and this corresponds with the data for the CAPN1 gene.
4.3.3 Interactions (CAPN1 and CAST)
Table 4.8 shows the number of animals with genotypes for the SNP used in the CAST and CAPN1 markers.
Table 4.8: Shows the number of animals with genotypes for the SNP used in the CAST and CAPN1
markers.
CAPN1
Brahman-X Simmentaler-X Nguni-X
CAST CC CT TT Total CC CT TT Total CC CT TT Total
CC 0 0 1 1 0 0 1 1 0 1 6 7
CT 0 1 4 5 0 3 4 7 0 2 6 8
TT 0 6 6 12 0 1 11 12 0 1 3 4
Total 0 7 11 18 0 4 16 20 0 4 15 19
Genotypes for the CC class at the CAPN1 marker had no frequency across the crossbreds. Thus,
comparisons are only made between CT and TT genotypes. The low frequency of animals inheriting the CC
genotype at the CAST marker generated a low frequency of allelic combinations with CAPN1. For example,
43
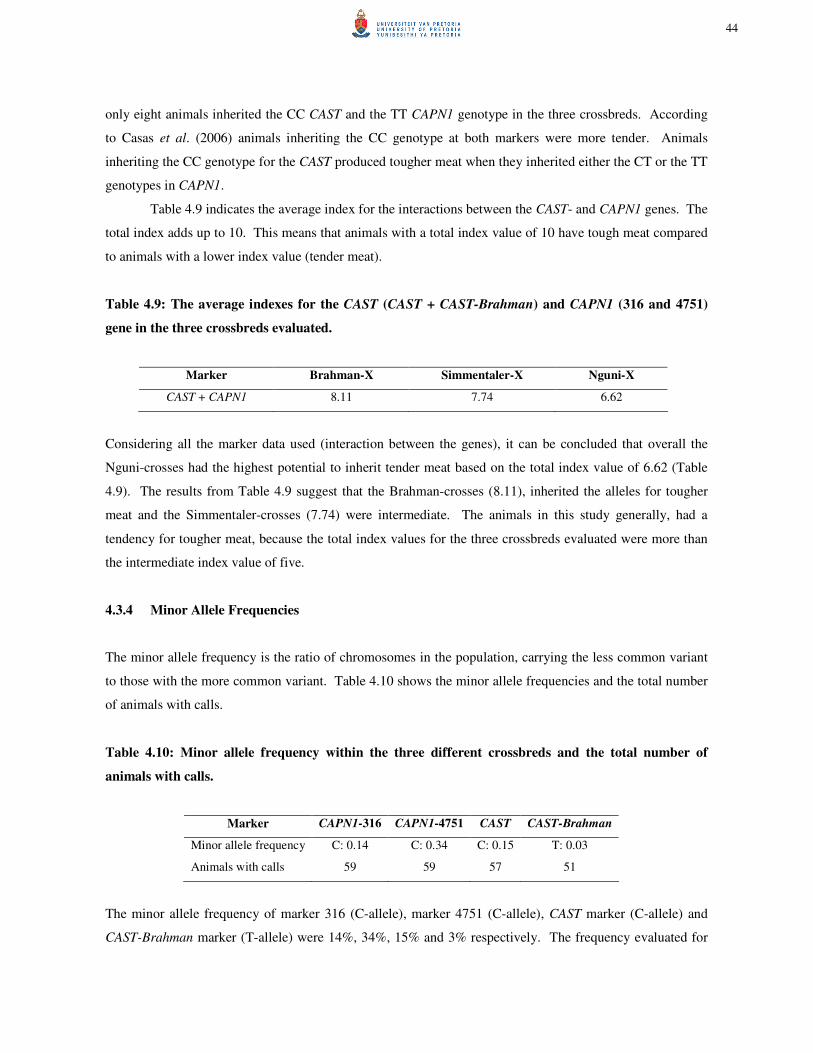
only eight animals inherited the CC CAST and the TT CAPN1 genotype in the three crossbreds. According
to Casas et al. (2006) animals inheriting the CC genotype at both markers were more tender. Animals
inheriting the CC genotype for the CAST produced tougher meat when they inherited either the CT or the TT
genotypes in CAPN1.
Table 4.9 indicates the average index for the interactions between the CAST- and CAPN1 genes. The
total index adds up to 10. This means that animals with a total index value of 10 have tough meat compared
to animals with a lower index value (tender meat).
Table 4.9: The average indexes for the CAST (CAST + CAST-Brahman) and CAPN1 (316 and 4751)
gene in the three crossbreds evaluated.
Marker Brahman-X Simmentaler-X Nguni-X
CAST + CAPN1 8.11 7.74 6.62
Considering all the marker data used (interaction between the genes), it can be concluded that overall the
Nguni-crosses had the highest potential to inherit tender meat based on the total index value of 6.62 (Table
4.9). The results from Table 4.9 suggest that the Brahman-crosses (8.11), inherited the alleles for tougher
meat and the Simmentaler-crosses (7.74) were intermediate. The animals in this study generally, had a
tendency for tougher meat, because the total index values for the three crossbreds evaluated were more than
the intermediate index value of five.
4.3.4 Minor Allele Frequencies
The minor allele frequency is the ratio of chromosomes in the population, carrying the less common variant
to those with the more common variant. Table 4.10 shows the minor allele frequencies and the total number
of animals with calls.
Table 4.10: Minor allele frequency within the three different crossbreds and the total number of
animals with calls.
Marker CAPN1-316 CAPN1-4751 CAST CAST-Brahman
Minor allele frequency C: 0.14 C: 0.34 C: 0.15 T: 0.03
Animals with calls 59 59 57 51
The minor allele frequency of marker 316 (C-allele), marker 4751 (C-allele), CAST marker (C-allele) and
CAST-Brahman marker (T-allele) were 14%, 34%, 15% and 3% respectively. The frequency evaluated for
44

CAPN1-316 was in the same range as that found in the study of Page et al. (2004), which reported a minor
allele frequency of 17% and 20% for two different populations.
4.4 Association of SNP markers with shear force values
4.4.1 CAPN1 association with shear force
Table 4.11 shows the genotype contrast for WBSF values with the CAPN1-316 marker. The values overall
are not significant (p > 0.05).
Table 4.11: Genotype contrast for shear force at 1 day, 7 and 14 days post mortem with CAPN1-316
marker in the animals evaluated.
Genotype WBSF, Kga No. p-Value
1 day post mortem p = 0.368
CC 8.55 ± 7.40 3
CG 8.13 ± 3.91 11
GG 9.00 ± 3.14 45
7 days post mortem p = 0.505
CC 5.80 ± 0.72 3
CG 5.35 ± 4.15 11
GG 5.91 ± 1.60 45
14 days post mortem p = 0.197
CC 6.03 ± 1.82 3
CG 4.79 ± 0.83 11
GG 5.76 ± 3.10 45
a Mean and variation in Warner-Bratzler shear force (WBSF)
At 1 day, 7 and 14 days post mortem the CC genotype was associated with higher shear force values than the
CG genotypes and at 14 days post mortem it was also associated with higher shear force values than the GG
genotypes that were unexpected. Previous results demonstrate that the C allele is associated with lower shear
force values (increased tenderness) (Page et al., 2004). Thus, animals inheriting the CC and CG genotypes
produce more tender meat when compared to animals inheriting the GG genotype (Casas et al., 2006).
Analysis of the CAPN1-316 marker with WBSF values in the crossbreds is presented in Table 4.12.
The values in Table 4.12 are not significantly (p > 0.05) associated with WBSF. The animals homozygous
for the C-allele at marker 316 at 1 day, 7 and 14 days post mortem for the Brahman- and Simmentaler-
crosses were absent. However, the Nguni-crosses indicated that the CC genotype was present and that three
animals had the combination for tender meat. The WBSF values for the CC genotype were still tougher than
45

expected, because the values were above 5 kg. From Table 4.11 it can be concluded that after ageing the
WBSF values were less, meaning more tender meat with days post mortem. The reason for this is that at
1 day post mortem all the processes for tenderisation still need to be put into motion. The CG genotype
unexpectedly had lower WBSF values than the CC genotype despite the fact that White et al. (2005)
indicated that “C” is the more favourable allele.
Table 4.12: Genotype contrast for shear force at 1 day, 7 and 14 days post mortem with CAPN1-316
marker in the three crossbreds evaluated.
Genotype
Brahman-X Simmentaler-X Nguni-X
WBSF, Kg a
No. WBSF, Kg a
No. WBSF, Kg a
No.
1 day post mortem
CC - - - - 9.01 ± 3.77 3
CG 6.88 1 6.85 ± 0.02 2 8.58 ± 5.40 7
GG 8.37 ± 2.02 19 9.82 ± 2.45 18 8.77 ± 4.06 9
7 days post mortem
CC - - - - 5.75 ± 0.45 3
CG 4.08 1 6.02 ± 1.97 2 5.85 ± 5.77 7
GG 6.00 ± 3.23 19 6.55 ± 1.60 18 5.86 ± 1.89 9
14 days post mortem
CC - - - - 5.63 ± 1.71 3
CG 4.18 1 5.16 ± 1.19 2 4.54 ± 0.78 7
GG 4.80 ± 1.68 19 6.10 ± 1.90 18 5.67 ± 1.59 9
a Mean and variation in Warner-Bratzler shear force (WBSF)
Only one Brahman-cross had the CG genotype. Table 4.12 indicates that the Brahman-crosses were tougher
for this genotype compared to the Simmentaler-crosses and the Nguni-crosses with the lowest WBSF values
for the CG genotype.
In Table 4.13 the genotype contrast for WBSF values with the CAPN1-4751 marker are presented.
Overall, the differences in WBSF were not significant (p > 0.05). It is reported that the C-allele is associated
with lower shear force (increase tenderness). Thus, animals inheriting the CC and CT genotypes produce
more tender meat when compared to animals inheriting the TT genotype (Casas et al., 2006). The results of
Table 4.13 correspond with the report of Casas et al. (2006), that the CC and CT genotypes are associated
with lower WBSF values thus increase tenderness. In this study it is indicated that the CC genotype is
associated with the tenderest meat (lowest shear force values), where the TT genotype is associated with high
shear force values (tougher meat).
46

Table 4.13: Genotype contrast for shear force at 1 day, 7 and 14 days post mortem with CAPN1-4751
marker in the animals evaluated.
Genotype WBSF, Kga
No. p-Value
1 day post mortem p = 0.539
CC 8.35 ± 6.24 10
CT 8.68 ± 4.12 20
TT 9.07 ± 2.17 29
7 days post mortem p = 0.986
CC 5.75 ± 4.76 10
CT 5.81 ± 2.01 20
TT 5.84 ± 1.24 29
14 days post mortem p = 0.391
CC 5.01 ± 1.58 10
CT 5.56 ± 1.49 20
TT 5.84 ± 3.83 29
a Mean and variation in Warner-Bratzler shear force (WBSF)
Table 4.14 indicates the association of the CAPN1-4751 marker with WBSF. The values in Table 4.14 were
not significantly (p > 0.05) associated with the WBSF values. As with marker CAPN1-316 the Brahman-
crosses again had the lower WBSF values associated with the CAPN1-4751 marker, indicating the tendency
for more tender meat compared to the Simmentaler- and Nguni-crosses at 1 day post mortem. At 1 day and
14 days post mortem the CC genotype was associated with less tender meat (higher WBSF values) which
was unexpected. However, at 7 days post mortem the CC genotype presented more favourable WBSF values
as expected with the CT genotype in an intermediate position with the TT genotype presenting higher WBSF
values thus less tender meat.
The haplotype contrast of CAPN1-316 and CAPN1-4751 are presented in Table 4.15. According to
Table 4.15 the Brahman-crosses for the GG-CT haplotype was associated with lower shear force values at
1 day, 7 and 14 days post mortem compared to the Nguni- and Simmentaler-crosses.
47
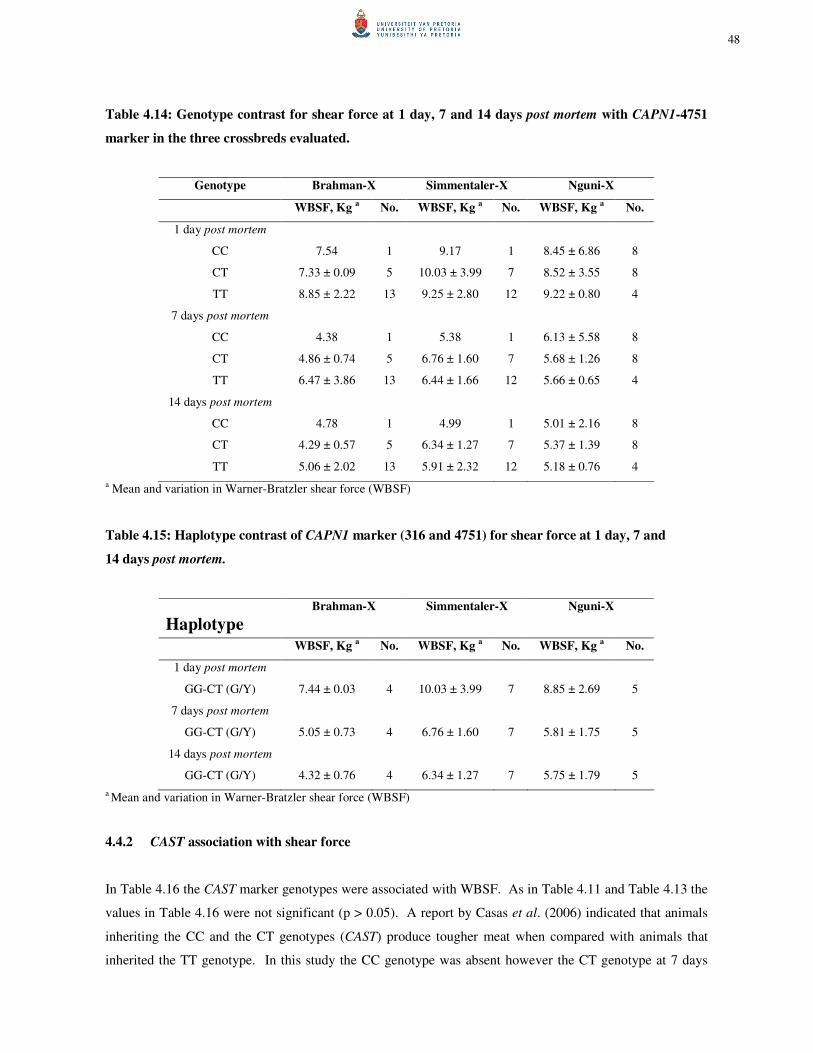
Table 4.14: Genotype contrast for shear force at 1 day, 7 and 14 days post mortem with CAPN1-4751
marker in the three crossbreds evaluated.
Genotype Brahman-X Simmentaler-X Nguni-X
WBSF, Kg a No. WBSF, Kg a No. WBSF, Kg a No.
1 day post mortem
CC 7.54 1 9.17 1 8.45 ± 6.86 8
CT 7.33 ± 0.09 5 10.03 ± 3.99 7 8.52 ± 3.55 8
TT 8.85 ± 2.22 13 9.25 ± 2.80 12 9.22 ± 0.80 4
7 days post mortem
CC 4.38 1 5.38 1 6.13 ± 5.58 8
CT 4.86 ± 0.74 5 6.76 ± 1.60 7 5.68 ± 1.26 8
TT 6.47 ± 3.86 13 6.44 ± 1.66 12 5.66 ± 0.65 4
14 days post mortem
CC 4.78 1 4.99 1 5.01 ± 2.16 8
CT 4.29 ± 0.57 5 6.34 ± 1.27 7 5.37 ± 1.39 8
TT 5.06 ± 2.02 13 5.91 ± 2.32 12 5.18 ± 0.76 4
a Mean and variation in Warner-Bratzler shear force (WBSF)
Table 4.15: Haplotype contrast of CAPN1 marker (316 and 4751) for shear force at 1 day, 7 and
14 days post mortem.
Haplotype Brahman-X Simmentaler-X Nguni-X
WBSF, Kg a
No. WBSF, Kg a
No. WBSF, Kg a
No.
1 day post mortem
GG-CT (G/Y) 7.44 ± 0.03 4 10.03 ± 3.99 7 8.85 ± 2.69 5
7 days post mortem
GG-CT (G/Y) 5.05 ± 0.73 4 6.76 ± 1.60 7 5.81 ± 1.75 5
14 days post mortem
GG-CT (G/Y) 4.32 ± 0.76 4 6.34 ± 1.27 7 5.75 ± 1.79 5
a Mean and variation in Warner-Bratzler shear force (WBSF)
4.4.2 CAST association with shear force
In Table 4.16 the CAST marker genotypes were associated with WBSF. As in Table 4.11 and Table 4.13 the
values in Table 4.16 were not significant (p > 0.05). A report by Casas et al. (2006) indicated that animals
inheriting the CC and the CT genotypes (CAST) produce tougher meat when compared with animals that
inherited the TT genotype. In this study the CC genotype was absent however the CT genotype at 7 days
48

post mortem corresponds with the results of Casas et al. (2006). At 1 day and 14 days post mortem the CT
genotype were associated with lower shear force values (increased tenderness) compared to the TT genotype
with higher shear force values (decreased tenderness) which was unexpected.
Table 4.16: Genotype contrast for shear force at 1 day, 7 and 14 days post mortem with CAST marker
in the animals evaluated.
Genotype WBSF, Kga
No. p-Value
1 day post mortem p = 0.963
CC - 0
CT 8.83 ± 4.09 17
TT 8.86 ± 3.23 41
7 days post mortem p = 0.598
CC - 0
CT 5.96 ± 2.53 17
TT 5.75 ± 1.87 41
14 days post mortem p = 0.919
CC - 0
CT 5.59 ± 2.63 20
TT 5.64 ± 2.76 29
a Mean and variation in Warner-Bratzler shear force (WBSF)
The values in Table 4.17 were not significantly (p > 0.05) associated with the WBSF values. Table 4.17
indicated that no CC genotypes were present for the CAST marker. For the CT genotype at 1 day and 7 days
post mortem the Nguni-crosses had the lowest WBSF value associated with the genotype combination
compared to the Brahman- and Simmentaler-crosses. However, at 14 days post mortem the Brahman-crosses
had the lowest WBSF association while the Simmentaler-crosses had the highest WBSF association. For the
TT genotype the Brahman-crosses overall had the lowest WBSF values associated with the genotype for the
CAST marker.
49

Table 4.17: Genotype contrast for shear force at 1 day, 7 and 14 days post mortem with CAST marker
in the crossbreds evaluated.
Genotype Brahman-X Simmentaler-X Nguni-X
WBSF, Kg a No. WBSF, Kg a No. WBSF, Kg a No.
1 day post mortem
CT 8.42 ± 1.55 8 10.63 ± 6.32 4 8.05 ± 4.59 5
TT 8.35 ± 2.52 11 9.24 ± 2.16 16 9.00 ± 4.27 13
7 days post mortem
CT 6.38 ± 2.35 8 6.56 ± 2.67 4 5.31 ± 3.28 5
TT 5.62 ± 4.23 11 6.48 ± 1.44 16 6.09 ± 2.92 13
14 days post mortem
CT 5.16 ± 1.74 8 6.26 ± 3.14 4 5.27 ± 3.24 5
TT 4.62 ± 1.51 11 5.95 ± 1.69 16 5.28 ± 1.10 13
a Mean and variation in Warner-Bratzler shear force (WBSF)
Table 4.18: Genotype contrast for shear force at 1 day, 7 and 14 days post mortem with CAST-
Brahman marker in the three crossbreds.
Genotype Brahman-X Simmentaler-X Nguni-X
WBSF, Kg a
No. WBSF, Kg a
No. WBSF, Kg a
No.
1 day post mortem
AA 8.21 ± 1.90 18 9.46 ± 3.43 17 8.91 ± 3.96 13
AT 10.65 1 9.44 ± 1.23 2 - -
7 days post mortem
AA 5.73 ± 3.04 18 6.48 ± 1.81 17 6.10 ± 3.63 13
AT 8.97 1 6.70 ± 0.61 2 - -
14 days post mortem
AA 4.58 ± 1.20 18 6.07 ± 1.97 17 5.25 ± 1.50 13
AT 7.81 1 5.37 ± 2.48 2 - -
a Mean and variation in Warner Bratzler shear force (WBSF)
The association between the CAST-Brahman marker and WBSF are presented in Table 4.18. The results in
Table 4.18 did not exhibit significant (p > 0.05) values. Only the AA genotype at the CAST-Brahman
marker can be used for discussion since the other two genotypes (AT and TT) are too few or absent for
comparison between the crossbreds. In this study the AA genotype was associated with lower WBSF values
at 14 days post mortem. At 7 and 14 days post mortem the Brahman-crosses had the lowest WBSF values
thus more tender meat compared to the Nguni- and Simmentaler-crosses.
50
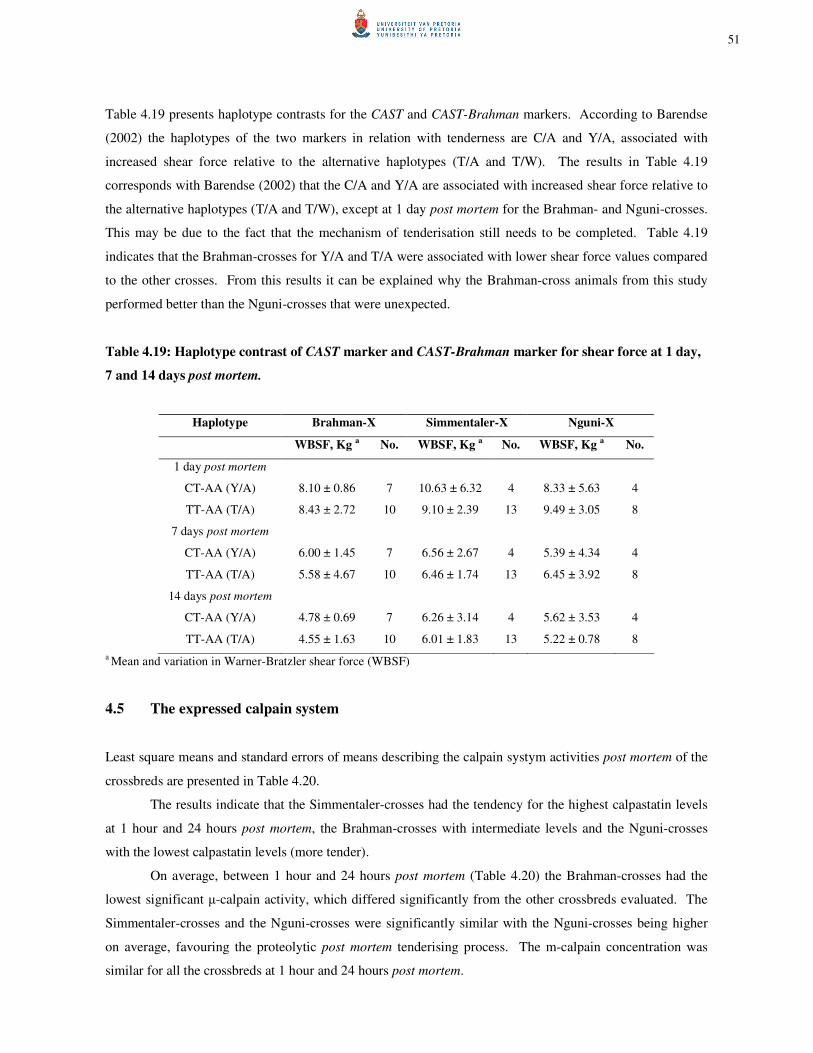
Table 4.19 presents haplotype contrasts for the CAST and CAST-Brahman markers. According to Barendse
(2002) the haplotypes of the two markers in relation with tenderness are C/A and Y/A, associated with
increased shear force relative to the alternative haplotypes (T/A and T/W). The results in Table 4.19
corresponds with Barendse (2002) that the C/A and Y/A are associated with increased shear force relative to
the alternative haplotypes (T/A and T/W), except at 1 day post mortem for the Brahman- and Nguni-crosses.
This may be due to the fact that the mechanism of tenderisation still needs to be completed. Table 4.19
indicates that the Brahman-crosses for Y/A and T/A were associated with lower shear force values compared
to the other crosses. From this results it can be explained why the Brahman-cross animals from this study
performed better than the Nguni-crosses that were unexpected.
Table 4.19: Haplotype contrast of CAST marker and CAST-Brahman marker for shear force at 1 day,
7 and 14 days post mortem.
Haplotype Brahman-X Simmentaler-X Nguni-X
WBSF, Kg a No. WBSF, Kg a No. WBSF, Kg a No.
1 day post mortem
CT-AA (Y/A) 8.10 ± 0.86 7 10.63 ± 6.32 4 8.33 ± 5.63 4
TT-AA (T/A) 8.43 ± 2.72 10 9.10 ± 2.39 13 9.49 ± 3.05 8
7 days post mortem
CT-AA (Y/A) 6.00 ± 1.45 7 6.56 ± 2.67 4 5.39 ± 4.34 4
TT-AA (T/A) 5.58 ± 4.67 10 6.46 ± 1.74 13 6.45 ± 3.92 8
14 days post mortem
CT-AA (Y/A) 4.78 ± 0.69 7 6.26 ± 3.14 4 5.62 ± 3.53 4
TT-AA (T/A) 4.55 ± 1.63 10 6.01 ± 1.83 13 5.22 ± 0.78 8
a Mean and variation in Warner-Bratzler shear force (WBSF)
4.5 The expressed calpain system
Least square means and standard errors of means describing the calpain systym activities post mortem of the
crossbreds are presented in Table 4.20.
The results indicate that the Simmentaler-crosses had the tendency for the highest calpastatin levels
at 1 hour and 24 hours post mortem, the Brahman-crosses with intermediate levels and the Nguni-crosses
with the lowest calpastatin levels (more tender).
On average, between 1 hour and 24 hours post mortem (Table 4.20) the Brahman-crosses had the
lowest significant µ-calpain activity, which differed significantly from the other crossbreds evaluated. The
Simmentaler-crosses and the Nguni-crosses were significantly similar with the Nguni-crosses being higher
on average, favouring the proteolytic post mortem tenderising process. The m-calpain concentration was
similar for all the crossbreds at 1 hour and 24 hours post mortem.
51

The calpastatin / µ-calpain ratio for the Brahman was significantly higher (p < 0.001) (Figure 4.2) than that
for the other crossbreds. The Simmentaler- and Nguni-crosses were significantly similar (1 hour and 24
hours post mortem).
No significant (p > 0.05) correlations between the calpain system and sarcomere lengths (1 day and 3
days post mortem) were found in this study. The calpastatin activity (1 hour and 24 hours post mortem),
calpastatin / µ-calpain ratio (24 hours post mortem) and calpastatin / µ+m-calpain ratio (1 hour and 24 hours
post mortem) correlated with myofibrillar fragment lengths 7 days post mortem, r = 0.38, 0.42, 0.37, 0.38 and
0.44 respectively.
Table 4.20: Least square means and standard errors for µ-calpain, m-calpain and calpastatin activity
levels measured in the M. longissimus dorsi (L1-L6) (non-electrically stimulated carcasses) in the three
crossbreds evaluated at 1 hour and 24 hours post mortem.
Genotype
Characteristic SEM Brahman-X Simmentaler-X Nguni-X p-Value
Calpastatin activity (U/g)
1 hour post mortem 0.106 2.709 2.815 2.636 0.493
24 hours post mortem 0.109 2.655 2.675 2.582 0.821
µ-Calpain activity (U/g) 1
1 hour post mortem 0.128 1.681a 2.204b 2.219b < 0.005
24 hours post mortem 0.104 1.481a 1.793b 1.908b < 0.016
m-Calpain activity (U/g)
1 hour post mortem 0.027 0.868 0.850 0.814 0.370
24 hours post mortem 0.032 1.092 1.077 1.115 0.695
Calpastatin / µ-Calpain ratio
1 hour post mortem 0.083 1.715b 1.334a 1.276a < 0.001
24 hours post mortem 0.106 2.255b 1.589a 1.417a < 0.001
Calpastatin / µ-Calpain +
m-Calpain ratio
1 hour post mortem 0.042 1.081b 0.941a 0.893a < 0.007
24 hours post mortem 0.040 1.057b 0.940a 0.863a < 0.004
abc – Means in row with different superscripts differ significantly with the Fishers’ means separation test
1 One unit of calpastatin activity is defined as the amount that inhibited one unit of m-calpain activity
52

0
0.5
1
1.5
2
2.5
Brahman Nguni Simmentaler
Calp
asta
tin
/mu
-calp
ain
1 h p.m 24 h p.m
Figure 4.2: Calpastain / µ-calpain ratio of the M. longissimus dorsi (L1-L6) in the three crossbreds
evaluated (means with different superscripts differ significantly, (p < 0.001). h = hours, p.m = post
mortem.
4.6 Proteolytic degradation
Least square means and standard errors describing myofibrillar fragmentation lengths and proteolytic
degradation profiles of the M. longissimus dorsi (L1-L6) (non-electrically stimulated carcasses) post mortem
in the crossbreds are presented in Table 4.21.
Overall significant differences were found between the different crossbreds for myofibrillar fragment
length (p < 0.001). The influence of ageing period on myofibril fragmentation was found to be different
between days post mortem. The Brahman-crosses had the higher myofibril fragments (tougher) and the
Nguni-crosses with the lowest myofibril fragments (more tender).
Significant differences (p < 0.033) between the crossbreds were found considering an ageing effect
for titin degradation (Table 4.21). The Nguni-crosses indicated a lower degradation rate and were
significantly similar to the Simmentaler-crosses, while the Brahman-crosses differed significantly from the
other two crossbreds. Titin degradation 1 day, 7 and 14 days post mortem did not differ significantly
(p > 0.05) between the crossbreds. On the other hand nebulin degradation showed no significant ageing
effect, but at 7 days, 1-7 days and 1-14 days post mortem significant differences between the crossbreds were
evaluated. At 7 days post mortem the Brahman-crosses were significantly different from the Simmentaler-
b
b
a a
a
a
53

Table 4.21: Least square means and standard errors describing myofibrillar fragmentation lengths
(MFL), proteolytic degradation profiles and an ageing effect in the M. longissimus dorsi (L1-L6) (non-
electrically stimulated carcasses) post mortem of the three crossbreds.
Genotype
Characteristic SEM Brahman-X Simmentaler-X Nguni-X p-Value
MFL (µm)
Ageing effect average 1.102 48.46c 31.89b 25.43a < 0.001
1 day post mortem 1.427 43.28 42.30 41.61 0.710
7 days post mortem 1.259 33.35 31.72 30.07 0.193
14 days post mortem 0.703 25.50 24.94 24.82 0.767
Titin (~ 300 kDa)
Ageing effect average 0.016 0.344ab 0.308a 0.365b < 0.033
1 day post mortem 0.034 0.447 0.383 0.466 0.203
7 days post mortem 0.025 0.327 0.312 0.368 0.264
14 days post mortem 0.021 0.259 0.231 0.264 0.504
1 – 7 days post mortem 0.017 0.120 0.071 0.098 0.138
1 – 14 days post mortem 0.020 0.187 0.149 0.202 0.150
Nebulin (~ 250 kDa)
Ageing effect average 0.004 0.039 0.030 0.040 0.071
1 day post mortem 0.007 0.063 0.069 0.079 0.304
7 days post mortem 0.006 0.036b 0.014a 0.031ab < 0.038
14 days post mortem 0.004 0.019 0.005 0.009 0.078
1 – 7 days post mortem 0.007 0.028a 0.055b 0.047ab < 0.030
1 – 14 days post mortem 0.007 0.043a 0.064b 0.069b < 0.034
Desmin (~ 55 kDa)
Ageing effect average 0.008 0.054b 0.046a 0.052b < 0.018
1 day post mortem 0.004 0.070 0.061 0.066 0.349
7 days post mortem 0.004 0.054 0.046 0.051 0.297
14 days post mortem 0.003 0.039 0.031 0.040 0.118
1 – 7 days post mortem 0.003 0.016 0.015 0.016 0.982
1 - 14 days post mortem 0.004 0.031 0.030 0.026 0.682
~ 32-29 kDa
Ageing effect average 0.014 0.058 0.054 0.061 0.474
1 day post mortem 0.004 0.017 0.018 0.024 0.474
7 days post mortem 0.005 0.054 0.050 0.054 0.773
14 days post mortem 0.009 0.102 0.096 0.105 0.783
1 – 7 days post mortem 0.005 0.037 0.032 0.030 0.526
1 – 14 days post mortem 0.009 0.085 0.079 0.082 0.905
abc – Means in row with different superscripts differ significantly with the Fishers’ means separation test
54

crosses with a higher degradation rate and the Nguni-crosses with an intermediate rate. The degradation rate
(1-7 days post mortem), the Brahman-crosses differed significantly from the Simmentaler-crosses.
The Simmentaler-crosses had the higher rate of nebulin degradation while the Brahman-crosses had
the lowest rate. The Brahman-crosses were significantly different from the Simmentaler- and Nguni-crosses
1-14 days post mortem and had a lower degradation rate, while the Nguni-crosses had the lowest degradation
rate.
Desmin degradation (Table 4.21) was significantly (p < 0.018) similar considering an ageing effect
between the Brahman-crosses and the Nguni-crosses. The Simmentaler-crosses differed significantly from
the other crossbreds with an intermediate degradation rate. Desmin and 30 kDa degradation 1 day, 7 and 14
days post mortem did not differ significantly (p > 0.05) between the crossbreds.
For the 30 kDa protein there was no significant values evaluated 1 day, 7 and 14 days post mortem
as well as for the degradation rate (Table 4.21).
Least square means and standard errors of desmin degradation evaluated with Western-blotting are
presented in Table 4.22.
Table 4.22: Least square means and standard errors of desmin degradation evaluated with Western-
blotting and an ageing effect in the M. longissimus dorsi (L1-L6) (non-electrically stimulated carcasses)
post mortem of the three crossbreds evaluated.
Genotype
Characteristic SEM Brahman-X Simmentaler-X Nguni-X p-Value
Desmin (~55 kDa)
Ageing effect average 0.164 8.31ab 7.90a 8.53b < 0.024
1 day post mortem 0.305 9.33 8.96 9.26 0.657
7 days post mortem 0.270 8.31 7.97 8.48 0.404
14 days post mortem 0.284 7.30ab 6.79a 7.86b < 0.030
1 - 7 days post mortem 0.184 1.03 0.99 0.78 0.600
1 – 14 days post mortem 0.250 2.03 2.17 1.40 0.074
abc – Means in row with different superscripts differ significantly with the Fishers’ means separation test
The degradation of desmin evaluated by means of Western-blotting showed a significant (p < 0.024) ageing
effect difference between the crossbreds and at 14 days post mortem (p < 0.03). The Simmentaler- and
Nguni-crosses differed significantly, where the Brahman-crosses were significantly similar to the
Simmentaler- and Nguni-crosses. The crossbreds did not differ significantly (p > 0.05) 1 day and 7 days post
mortem and 1-14 days post mortem. The degradation of protein 1 day, 7 and 14 days post mortem was
correlated with WBSF. Titin, nebulin and desmin did not correlate significantly (p > 0.05) with WBSF
1 day, 7 and 14 days post mortem. The 30 kDa proteins significantly correlated 1 day and 7 days post
mortem (r = -0.30; r = -0.59 respectively) with WBSF 7 days post mortem. At 7 and 14 days post mortem
55
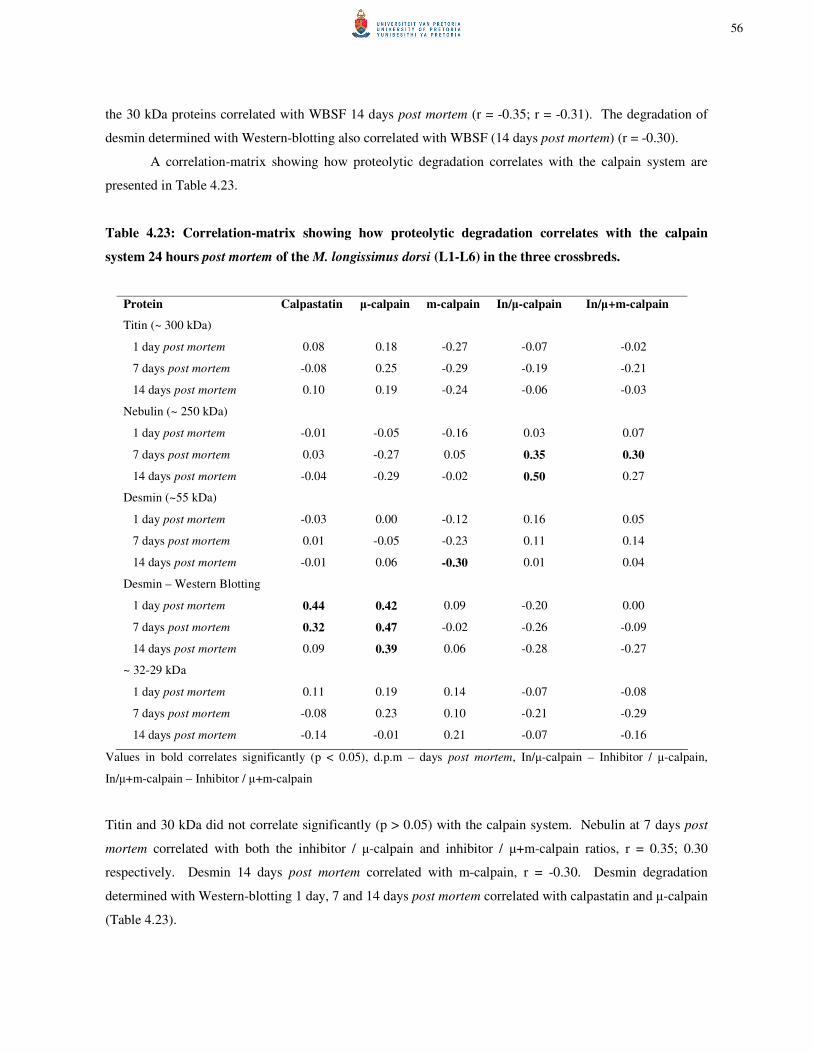
the 30 kDa proteins correlated with WBSF 14 days post mortem (r = -0.35; r = -0.31). The degradation of
desmin determined with Western-blotting also correlated with WBSF (14 days post mortem) (r = -0.30).
A correlation-matrix showing how proteolytic degradation correlates with the calpain system are
presented in Table 4.23.
Table 4.23: Correlation-matrix showing how proteolytic degradation correlates with the calpain
system 24 hours post mortem of the M. longissimus dorsi (L1-L6) in the three crossbreds.
Protein Calpastatin µ-calpain m-calpain In/µ-calpain In/µ+m-calpain
Titin (~ 300 kDa)
1 day post mortem 0.08 0.18 -0.27 -0.07 -0.02
7 days post mortem -0.08 0.25 -0.29 -0.19 -0.21
14 days post mortem 0.10 0.19 -0.24 -0.06 -0.03
Nebulin (~ 250 kDa)
1 day post mortem -0.01 -0.05 -0.16 0.03 0.07
7 days post mortem 0.03 -0.27 0.05 0.35 0.30
14 days post mortem -0.04 -0.29 -0.02 0.50 0.27
Desmin (~55 kDa)
1 day post mortem -0.03 0.00 -0.12 0.16 0.05
7 days post mortem 0.01 -0.05 -0.23 0.11 0.14
14 days post mortem -0.01 0.06 -0.30 0.01 0.04
Desmin – Western Blotting
1 day post mortem 0.44 0.42 0.09 -0.20 0.00
7 days post mortem 0.32 0.47 -0.02 -0.26 -0.09
14 days post mortem 0.09 0.39 0.06 -0.28 -0.27
~ 32-29 kDa
1 day post mortem 0.11 0.19 0.14 -0.07 -0.08
7 days post mortem -0.08 0.23 0.10 -0.21 -0.29
14 days post mortem -0.14 -0.01 0.21 -0.07 -0.16
Values in bold correlates significantly (p < 0.05), d.p.m – days post mortem, In/µ-calpain – Inhibitor / µ-calpain,
In/µ+m-calpain – Inhibitor / µ+m-calpain
Titin and 30 kDa did not correlate significantly (p > 0.05) with the calpain system. Nebulin at 7 days post
mortem correlated with both the inhibitor / µ-calpain and inhibitor / µ+m-calpain ratios, r = 0.35; 0.30
respectively. Desmin 14 days post mortem correlated with m-calpain, r = -0.30. Desmin degradation
determined with Western-blotting 1 day, 7 and 14 days post mortem correlated with calpastatin and µ-calpain
(Table 4.23).
56

4.7 Extent of muscle contraction
The extent of muscle contraction is reflected in the muscle histology (fibre area, fibre type and sarcomere
length) presented in Table 4.24.
Table 4.24: Least square means and standard errors of means and ageing effect describing the
histological characteristics of the M. longissimus dorsi (L1-L6) (non-electrically stimulated carcasses)
in the three crossbreds evaluated.
Genotype
Characteristic SEM Brahman-X Simmentaler-X Nguni-X p-Value
Muscle area (µm2) 161.0 5940 6408 6096 0.122
Muscle fibre areas (µm2)
Red fibre 124.3 2323 2282 2160 0.632
Intermediate fibre 158.2 3302 3166 3072 0.590
White fibre 233.5 5709 5157 5219 0.196
Fibre type distribution (%)
Red fibre 0.696 35.97 34.69 37.08 0.060
Intermediate fibre 0.805 27.43 28.50 27.52 0.584
White fibre 0.924 36.60 35.40 36.81 0.508
Sarcomere length (µm)
1 day post mortem 0.023 1.697b 1.657b 1.611a < 0.035
3 days post mortem 0.022 1.698b 1.681b 1.624a < 0.049
abc – Means in row with different superscripts differ significantly with the Fishers’ means separation test
No significant (p > 0.05) differences for muscle area, fibre areas or fibre type distribution was found between
the three different crossbreds (Table 4.24). However, the average fibre areas correspond to the study of
Frylinck and Heinze (2003), indicating that the Brahman breed had larger fibre areas, as is the case in the
current study and finding that larger areas are a characteristic of tougher meat. It was also shown by
Frylinck and Heinze (2003) that the Simmentaler breed had significant higher percentages white fibres
compared to the Brahman and Nguni. The percentage intermediate fibre values were similar between the
breeds and the Simmentaler breed had the highest percentage red fibres compared to the other breeds.
In this study sarcomere lengths were significantly different between the crossbreds. The sarcomere
length of the Brahman-crosses was significantly longer (more tender) than the sarcomere length of the
Nguni-crosses but similar to the Simmentaler-crosses. This is not unexpected as the Brahman and
Simmentaler carcasses are larger and thus less prone to muscle shortening.
57
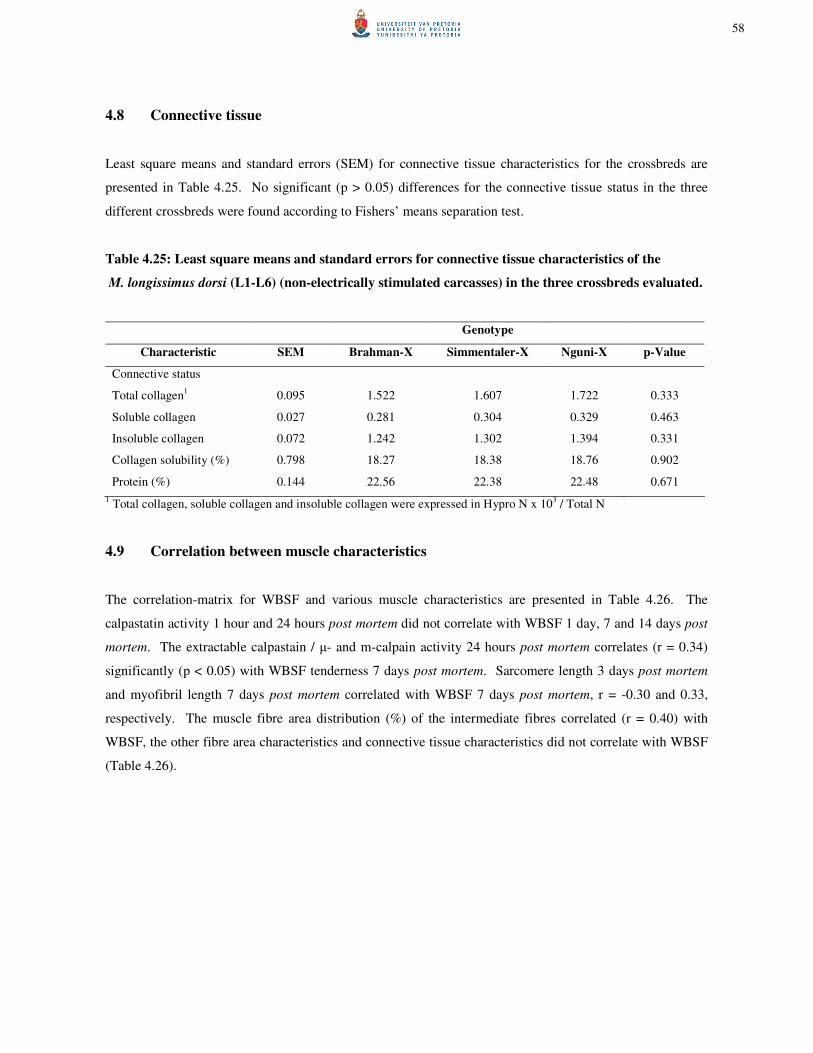
4.8 Connective tissue
Least square means and standard errors (SEM) for connective tissue characteristics for the crossbreds are
presented in Table 4.25. No significant (p > 0.05) differences for the connective tissue status in the three
different crossbreds were found according to Fishers’ means separation test.
Table 4.25: Least square means and standard errors for connective tissue characteristics of the
M. longissimus dorsi (L1-L6) (non-electrically stimulated carcasses) in the three crossbreds evaluated.
Genotype
Characteristic SEM Brahman-X Simmentaler-X Nguni-X p-Value
Connective status
Total collagen1 0.095 1.522 1.607 1.722 0.333
Soluble collagen 0.027 0.281 0.304 0.329 0.463
Insoluble collagen 0.072 1.242 1.302 1.394 0.331
Collagen solubility (%) 0.798 18.27 18.38 18.76 0.902
Protein (%) 0.144 22.56 22.38 22.48 0.671
1 Total collagen, soluble collagen and insoluble collagen were expressed in Hypro N x 103 / Total N
4.9 Correlation between muscle characteristics
The correlation-matrix for WBSF and various muscle characteristics are presented in Table 4.26. The
calpastatin activity 1 hour and 24 hours post mortem did not correlate with WBSF 1 day, 7 and 14 days post
mortem. The extractable calpastain / µ- and m-calpain activity 24 hours post mortem correlates (r = 0.34)
significantly (p < 0.05) with WBSF tenderness 7 days post mortem. Sarcomere length 3 days post mortem
and myofibril length 7 days post mortem correlated with WBSF 7 days post mortem, r = -0.30 and 0.33,
respectively. The muscle fibre area distribution (%) of the intermediate fibres correlated (r = 0.40) with
WBSF, the other fibre area characteristics and connective tissue characteristics did not correlate with WBSF
(Table 4.26).
58

Table 4.26: Correlation-matrix showing simple correlation coefficients between tenderness (WBSF)
and various muscle characteristics in the three crossbreds evaluated.
Characteristics Warner-Bratzler shear force (Kg/12.5mm θ)
1 day post mortem 7 days post mortem 14 days post mortem
Calpastatin
1 hour post mortem -0.06 0.13 0.24
24 hours post mortem -0.01 0.25 -0.02
µ-calpain
1 hour post mortem 0.01 0.18 0.16
24 hours post mortem -0.11 -0.11 -0.13
m-calpain
1 hour post mortem -0.13 -0.25 -0.14
24 hours post mortem -0.18 -0.18 -0.24
Calpastatin / µ-calpain
1 hour post mortem -0.04 -0.19 -0.09
24 hours post mortem 0.04 0.17 0.15
Calpastatin / µ + m-calpain
1 hour post mortem -0.02 -0.04 0.09
24 hours post mortem 0.09 0.34 0.15
Sarcomere length
1 day post mortem -0.29 -0.25 -0.17
3 days post mortem -0.28 -0.30 -0.14
MFL
1 day post mortem -0.08 0.03 0.05
7 days post mortem 0.08 0.33 0.28
14 days post mortem 0.28 0.22 0.28
Total collagen 0.03 0.00 -0.08
Insoluble collagen 0.04 0.04 -0.09
Soluble collagen 0.01 -0.09 -0.03
% Collagen solubility -0.01 -0.16 0.05
% Protein 0.07 -0.11 0.14
Fibre areas
Red fibre -0.24 -0.04 -0.11
Intermediate fibre -0.18 -0.03 0.00
White fibre -0.10 -0.19 -0.05
% Red fibre -0.06 -0.17 0.20
% Intermediate fibre 0.21 0.42 0.10
Values in bold correlates significantly (p < 0.05), MFL – Myofibrillar fragment length
59
CHAPTER 5
DISCUSSION
The tenderness of meat is influenced by various ante mortem and post mortem factors. The ante mortem
factors include the species of the animal, breed or genotype, age of the animal, gender, anatomical location,
size and type of muscle, rate of glycolysis, connective tissue and collagen solubility, adipose tissue, water-
holding capacity and proteolytic enzymes (Koohmaraie, 1994).
It is well documented that tenderness decreases as the percentage Bos indicus increases (Crouse et
al., 1989; De Bruyn, 1991; Shackelford et al., 1991; Shackelford et al., 1995; Whipple et al., 1990a;
Koohmaraie, 1996; Riley et al., 2003). It has been shown that these differences (between Bos indicus and
Bos taurus) occur due to differences in the properties of a specific muscle enzyme system (calpain system
i.e. calpastatin / µ-calpain ratio) and their effects on the myofibrillar properties of the muscle. In this chapter
the comparison of meat tenderness prediction by means of gene technologies (markers) with established
physical estimates of meat tenderness will be discussed.
5.1 Animal characteristics
The characteristics of the animals at slaughter are summarised in Chapter 4, Table 4.1. Testosterone is
involved in collagen synthesis, accumulation and maturation, which impact negatively on meat tenderness
(Cross et al., 1984; Seideman et al., 1989). Muscles of bulls have higher levels of calpastatin with the
consequent lower ability for tenderisation through the ageing process (Morgan et al., 1993). These effects
only come into effect after puberty; therefore bull meat from young animals (A-age) should not be affected.
Water binding capacity did not differ significantly (p > 0.05) between the crossbreds (Table 4.1) and this
corresponds with the study of Frylinck and Heinze (2003).
Silva et al. (1999) reported that meat with a high ultimate pH is dark and more susceptible to
bacterial spoilage. Nevertheless, this meat is associated with a higher rate of tenderisation (Beltran et al.,
1997). Carcasses from the Nguni-crosses cooled down quicker (smaller than the Brahman- and
Simmentaler-crosses) (Figure 4.1), thus the lower carcass temperatures at 24 hours post mortem (Table 4.1).
According to the study of Frylinck and Heinze (2003) the smaller carcasses (Afrikaner and Nguni) cooled
down quicker resulting in significant lower carcass temperature at nine hours post mortem and 24 hours post
mortem and more prone to cold shortening. To prevent cold shortening they hung the carcasses in a cool
room at about 10 °C until 6 hours post mortem, after which the carcasses were shifted into the 4 °C cooler
(Frylinck and Heinze, 2003). Another method to prevent cold shortening is electrical stimulation of the
carcasses. None of these two methods were used in this study, because the emphasis was on the expression
of the inherent tenderness characteristics without external post mortem influences. Thus cold shortening can
be expected in the smaller carcasses (see discussions later). In the USA, typical carcasses are produced
60

bigger (heavier) compared to the carcasses of SA and thus the cool down period is longer, thus their
carcasses are less susceptible to cold shortening. The reason for this is that their younger animals (steers and
heifers) are considered until an age of 24 months to be graded in to the A and B maturity groups (best USA
grades). The USA are more focussed on marbling, thus the marbling level is a primary determinant of the
grade compared to South African conditions, where marbling are not considered (Lebert, 2000).
5.2 Tenderness of loin samples
The most commonly used instruments used to estimate meat tenderness are the Warner-Bratzler Shear device
and the Instron apparatus. Tenderness is measured as the shear force (expressed as a value) required to
cleave a standard cross-sectional area of cooked meat across the muscle cells or fibres (Davey, 1983).
Factors that may affect the accuracy of these measurements include the doneness of the cooked meat,
uniformity of cylindrical sample size, direction of the muscle fibre, amount of connective tissue and fat
deposits present, temperature of the sample and the speed at which the sample is sheared. A lower shear
force value means less force is required to shear through the sample and therefore the meat is tender.
The fact that the Simmentaler-crosses were significantly (p < 0.003) tougher (Table 4.2), than the
other crossbreds was surprising, but agrees with the findings of De Bruyn (1991) and Frylinck and Heinze,
(2003) on none electrical stimulated carcasses. Numerous studies have established that the M. longissimus
dorsi from Bos indicus cattle is usually less tender than meat from Bos taurus breeds (Crouse et al., 1989; De
Bruyn, 1991; Koohmaraie, 1996; Shackelford et al., 1991; Shackelford et al., 1995; Whipple et al., 1990b).
Herring et al. (1965) also reported significantly lower shear force values for the Sanga, compared to the Bos
indicus, and were not found in this research. Although the breed-crosses differed phenotypically the animals
represented in the breed-cross groups could be genotypically more similar (see Chapter 4, section 4.3),
because the contribution of the different breeds represented in the crosses could not be established on
phenotype (unknown). It can be concluded from the overall shear force data (Table 4.2), that the animals in
this study had tough meat in general for the shear force values are above 5 kg, especially after 14 days post
mortem. Tenderness of meat is influenced by various ante mortem and post mortem factors. Ante mortem
factors include the species of the animal, breed or genotype, age of the animal, gender, anatomical location,
size and type of muscle, rate of glycolysis, connective tissue and collagen solubility, adipose tissue, water
holding capacity and the proteolytic enzymes. Post mortem factors include electrical stimulation of the
carcass (which was not a factor in this study), ageing, chilling temperature, cooking method, internal end-
point temperature of the meat, which influence the sarcomere length and the degradation of the myofibrillar
proteins by the proteolytic enzymes (Koohmaraie, 1994). Although all these factors have an impact on
tenderness, electrical stimulation and ageing could have improved the ultimate tenderness of the meat in this
study. Ageing of meat at refrigeration temperature (1 - 5 ˚C) has long been recognised as resulting in a
improvement of meat tenderness (Pearson, 1986). The effect of meat ageing is dependant on a number of
61

factors including age of the animal, gender, muscle type, electrical stimulation and the ageing period (Ouali,
1990).
Frylinck and Heinze (2003) found that only pH measured at 1 hour and 6 hours post mortem
correlated with WBSF at 1day, 3, 7, 14 and 21 days post mortem (correlations = 0.300 - 0.403), and the
carcass temperature at 24 hours post mortem showed a high correlation (r = 0.486) at 21 days post mortem.
5.3 Genetic considerations and the expression of the calpain system
In the past decade various factors contributed to highlighting quality traits, with specific interest in
tenderness. It is necessary to consider the basic principles of genetics in order to gain an understanding of
gene marker technology.
A gene is the physical unit of heredity, composed of a DNA sequence at a specific location on a
chromosome. Gene marker tests are tests for DNA markers that form part of a gene. A DNA marker is a
particular sequence of base pairs (represented as A (Adenine), T (Thiamine), C (Cytosine) and G (Guanine))
that indicate the genotype of an animal for that marker on the chromosome. Each marker located on a gene
has two alleles, one inherited from each parent. Amongst others, the calpain proteolytic system has been
identified as responsible for the post mortem meat tenderisation process. Two enzymes responsible for this
process are the micro molar calcium-activated neutral protease µ-calpain (CAPN1), which is encoded by the
CAPN1 gene, and its inhibitor, calpastatin (CAST), which is encoded by the CAST gene (Koohmaraie, 1996).
The hypothesis is that the effect on tenderness of an allele at one locus may depend on the allele at the other
locus, as variation that influences the ability of CAST to inhibit CAPN1, could depend on the physical state
or concentration of the enzyme (Casas et al., 2006). Identification of genetic markers for meat tenderness
variation would provide some selection criteria to facilitate genetic improvement in this trait (Page et al.,
2004).
5.3.1 Definition of markers, alleles and haplotypes
Two single nucleotide polymorphism (SNP) markers were employed in this study for the bovine CAPN1
gene, which is found or situated on bovine chromosome 29. One SNP marker is situated on exon nine
(CAPN1-316) and the other on intron 17 (CAPN1-4751). The inhibitor, calpastatin (CAST) found on
chromosome seven was also employed in this study. Both the CAST markers (CAST and CAST-Brahman) lie
in the three prime untranslated regions (3' UTR) of the CAST gene.
A report by Page et al. (2004) presents evidence that SNP determining amino acid variation of
glycine or alanine at position 316 in the micro molar calcium-activated neutral protease gene, act as a marker
for meat tenderness variation. There are two nucleotide alleles, C and G. The heterozygote genotype using
standard IUB codes is S. The G-allele results in glycine at position 316 of the amino acid sequence; the
62

C-allele results in alanine. Previous results demonstrate that the C-allele is associated with lower shear force
values (increased tenderness) (Page et al., 2004). Thus, animals inheriting the CC and CG genotypes
produce more tender meat when compared to animals inheriting the GG genotype (Casas et al., 2006).
CAPN1-316 does not segregate at appreciable frequencies in Brahman cattle (Casas et al., 2005).
White et al. (2005) developed and reported the marker developed at the CAPN1 gene which is a
transition from a cytosine (C) to a thymine (T). The marker is referred to as CAPN1-4751. The heterozygote
genotype using standard IUB codes is Y. The C-allele is associated with lower shear force (increase
tenderness). Thus, animals inheriting the CC and CT genotypes produce more tender meat when compared
to animals inheriting the TT genotype (Casas et al., 2006). This marker is associated with tenderness in Bos
taurus and Bos indicus cattle as well as in crossbred cattle (White et al., 2005). White et al. (2005)
concluded that a multiplex marker system incorporating both markers (316 and 4751) provides an optimal
solution in all populations (Bos taurus, Bos indicus and crossbreds) studied to date. The study of Casas et al,
(2006) suggested that the markers developed at the CAST and CAPN1 genes are suitable for the use in
identifying animals with the genetic potential to produce meat that is more tender.
The CAST marker is a transition from a guanine to an adenine at the 3' UTR of the gene. CAST has
alleles C and T. The heterozygote genotype using IUB codes is Y. CAST-Brahman has alleles A and T.
The heterozygote genotype using IUB codes is W. A report by Casas et al. (2006) indicated that animals
inheriting the CC and the CT genotypes (CAST) produce tougher meat when compared with animals that
inherited the TT genotype. The study of Casas et al. (2006) suggested that animals inheriting the CC and the
CT genotypes at the CAST gene produced tougher meat when compared to animals inheriting the TT
genotype.
Haplotypes depend on the alleles of the two markers on individual chromosomes and are defined by
the allele at a marker (i.e. CAST), presented first when discussing haplotype, followed by a slash and the
allele at the other marker (i.e. CAST-Brahman). According to the markers patented by Barendse (2002) it
specifies haplotypes of the two markers in relation with tenderness are C/A and Y/A, associated with
increased shear force relative to the alternative haplotypes (T/A and T/W).
5.4 Association of SNP markers with shear force values
Markers 316 and 4751 (CAPN1 gene) are generally preferred as a tool to guide selection, because they show
association with tenderness in a wide variety of populations, compared to markers 530, 4753 and 5531
(CAPN1 gene) (White et al., 2005).
In a study by Casas et al. (2006) on three defined populations containing about 1000 animals, they
found the following association of SNP markers with shear force values: A SNP marker at the CAST gene
had a significant (p < 0.003) effect on shear force and tenderness scores. Animals inheriting the TT
genotype at the CAST had meat that was more tender than those inheriting the CC genotype. The 4751
marker at the CAPN1 gene was also significant (p < 0.03) for tenderness score. Animals inheriting the CC
63

genotype at CAPN1 had meat that was more tender than those inheriting the TT genotype. An interaction
between CAST and CAPN1 was detected (p < 0.05) for shear force on one of the populations that had Bos
taurus influence. Animals inheriting the CC genotype for CAST produced tougher meat when they inherited
either the CT or the TT genotypes in CAPN1. This report was the first evaluation of the calpastatin marker
in scientific literature (the original finding was patented by Barendse, 2002) of the association of the CAST
SNP with meat tenderness. The findings in the original work gave similar results, and these effects extend
too many, but seemingly not all beef breeds. It seems that the present marker system is not adequately
matched to functional alleles to be useful in Bos taurus populations (Casas et al., 2006).
Currently, the biochemical pathway with the most evidential support for involvement in post mortem
tenderisation is that of the calpain family proteases. In combination with previous studies of crossbred
populations, a report by Smith et al. (2000) provides the first evidence to support the possibility that genetic
variation at the CAPN1 locus could contribute to the heritable component of meat tenderness.
Most of the animals in the study presented the GG genotype at marker 316. This also corresponds
with the WBSF values (Table 4.2) that indicated that overall the meat of the animals of this study is tough,
since the WBSF values were above 5 kg. According to Table 4.12 the Brahman-crosses had the more
favourable WBSF values associated with the CAPN1-316 marker indicating more tender meat compared to
the Simmentaler- and Nguni-crosses and this correspond with Table 4.2. According to White et al. (2005)
the CAPN1-4751 marker has a broad usefulness in cattle of Bos taurus, Bos indicus and crossbred descent.
However, it can be concluded that the data from Table 4.11, 4.12, 4.13, 4.14, 4.16 and 4.17 were not
representative. The results were not significant (p > 0.05) and there were too few CC genotypes for
comparison. For the CAPN1 marker (Table 4.15) the only haplotype that was presented is the GG-CT
combination since the other combinations were absent or too few for comparison. For the CAST haplotype
(Table 4.19) only the YA and TA combinations were presented because the CA and TW combination were
absent or too few for comparison. These results indicate that using genetic markers to improve meat
tenderness in South African crossbreds are not that significant but it could be used as an additional aid when
selecting for preferred traits i.e. tenderness.
5.5 The expressed calpain system
It is reported that the endogenous inhibitor of calpains, rather than calpain activity should be measured,
because calpastatin activity post mortem is highly related to beef tenderness (Whipple et al., 1990b;
Shackelford et al., 1991; Doumit et al., 1996). A high calpastatin activity results in decreased calpain
activity and thus, decreased tenderness (Boehm et al., 1998). In some experiments where large metabolic
differences are measured and calpastatin is expected to be the main component of the calpain system that is
influenced, it is adequate to determine calpastatin activities and levels. In this study where the differences
between crossbreds may not be very large, and where the enzyme activity could be influenced by genotypic
64

characteristics, it is necessary to determine all the factors of the calpain system (i.e. all the enzymes and
inhibitors).
There was no significant difference (p > 0.05) between the different crossbreds for the calpastatin
levels but significant differences were found for the µ-calpain activity and calpain / calpastatin ratios (Table
4.20). This can be an indication that µ-calpain is an essential factor for desired calpain system characteristics
and corresponds with the findings of Koohmaraie and Geesink (2006) that µ-calpain activity is the primary
source of variation in tenderness of muscles.
The intermediate level of the Brahman-crosses was unexpected, because higher levels of calpastatin
activity have been associated with higher percentages of Brahman (Bos indicus) in cattle (Riley et al., 2003;
Pringle et al., 1997). The consistent lower µ-calpain activities for the Brahman-crosses corresponded with
the findings of Frylinck and Heinze (2003). The m-calpain concentration (Table 4.20) corresponds with that
concluded from the literature that m-calpain does not play a significant role in the post mortem tenderising
process (Koohmaraie, 1994; Doumit and Koohmaraie, 1999; Koohmaraie and Geesink, 2006).
The Simmentaler-crosses showed higher toughness ratings than the Brahman-crosses (Table 4.2),
thus the calpain system results (Table 4.20) did not explain the differences in tenderness in this population
tested. Other factors must have played a greater role (i.e. pH: temperature ratio). Table 4.1 indicates that
carcasses of the Simmentaler-crosses compared to the Brahman-crosses cooled down faster between 3 and 6
hours post mortem. The muscle temperature during rigor development is critical in determining meat
tenderness, primarily due to the sarcomere shortening produced by low temperatures (cold temperatures):
cold shortening meat is tougher before ageing and does not tenderise even after prolonged storage when
tested by shear force (Davey and Gilbert, 1975). Lower temperatures also inhibit the calpain enzyme system.
This could also explain the higher WBSF measurements of the Simmentaler-crosses (Table 4.2) and the
consequent tenderness. The calpain system activities seemed to support some of the meat tenderness
similarities and differences of the crossbreds evaluated. On the other hand calpain system results of the
Brahman-crosses partly explain the lower tender characteristics of this breed.
However, a large number of studies (for review see Koohmaraie and Geesink, 2006) have shown that
µ-calpain is largely responsible for post mortem tenderisation. Koohmaraie and Geesink (2006) suggested
that research efforts in this area should focus on elucidation of the regulation of µ-calpain activity in post
mortem muscle, and that discovering the mechanisms of µ-calpain activity regulation and methods to
promote µ-calpain activity should have a dramatic effect on the ability of researchers to develop reliable
methods to predict meat tenderness (i.e. genetic markers) and on the meat industry to produce a consistently
tender product.
The question could be raised that if all the animals in this study had favourable genes, the
environmental factors still have the potential to influence the animals in a positive or negative way? For
example, if the genetic marker data (see Chapter 4, Table 4.5) is considered, the Simmentaler-crosses had the
potential to be more tender than the Brahman-crosses, but the calpain system did not support the tenderness
outcome, thus environmental factors had a negative influence.
65

5.6 Proteolytic degradation
Myofibril fragmentation has been recognised as an important event during the ageing of meat. It is well
established that proteolysis of myofibrillar proteins leads to increased fragmentation of myofibrils and
decreased shear force during post mortem storage (for review see Koohmaraie, 1992a; Koohmaraie, 1992b
and Koohmaraie, 1994). This fragmentation is the result of proteinase action (Ca2+ activated calpain
enzymes). The shorter the myofibril fragment, the higher the proteinase action, resulting in a higher sensory
panel tenderness rating and a lower WBSF measurement. The study of Scheepers (1999) indicated that the
Brahman had the longest myofibrillar fragment length compared to the other breeds used, as was reported by
Frylinck and Heinze (2003) and the current study (Table 4.21). Frylinck and Heinze (2003) concluded that
the meat from the Sanga breeds broke down into shorter myofibril fragments at a much faster rate than those
of Bos taurus and Bos indicus types.
Myofibrillar protein degradation in the M. longissimus dorsi (L1-L6) during post mortem ageing at
the molecular level by means of SDS-PAGE (means to study calpain system substrate disappearance and
product formation) separation of total soluble muscle proteins (sarcoplasmic and myofibrillar) was examined
as a confirmation of the MFL results. Titin, nebulin, desmin and 30 kDa could be identified according to
their molecular mass. Each sample consisted of at least 28 bands, some disappearing (nebulin and desmin)
and some forming (30 kDa) with time post slaughter.
According to literature, titin a structural protein plays a partial role in the development of tenderness
(Huff-Lonergan et al., 1996b; Huff-Lonergan et al., 1995; Taylor et al., 1995 and Robinson et al., 1991).
The study of Huff-Lonergan et al. (1995) indicated that nebulin was degraded by 3 days post mortem in
tender samples and was absent in all 7 days post mortem samples. In the current study there was still nebulin
present at 3 and 7 days post mortem. Huff-Lonergan et al. (1995) suggested that titin and nebulin are
degraded at faster rates in more tender beef samples and that the more tender samples (low shear force
values) exhibited a more rapid post mortem disappearance than the less tender samples. The study of Huff-
Lonergan et al. (1995) indicated that a 30 kDa component intensified with increasing time post mortem and
that more tender samples (low Warner-Bratzler shear force values and high sensory scores) exhibited a more
rapid post mortem appearance than in less tender samples. Desmin were investigated further with Western-
blotting (Table 4.22), because desmin play an important role in organizing and maintaining the integrity and
strength of the contractile myofibrils and the overall cytoskeleton structure of the skeletal muscle cell (Huff-
Lonergan et al., 1996a).
The results represented in Table 4.21 and Table 4.22 are in line with the MFL results and indicate
that the biochemical basis of tenderisation during post mortem ageing involves the breakdown of certain
myofibrillar proteins including nebulin and desmin. This is in accordance with the study of Koohmaraie and
Geesink (2006).
66

5.7 Extent of muscle contraction
No significant differences (p > 0.05) for muscle area, fibre areas or fibre type distribution were found
between the three different crossbreds (Table 4.19). However, the average fibre areas correspond to the
study of Frylinck and Heinze (2003), indicating that Brahman breed had larger fibre areas, as is the case in
the current study and finding that larger areas are a characteristic of tougher meat. The study of Frylinck and
Heinze (2003) indicated that the Simmentaler breed had significantly higher percentage white fibres
compared to the Brahman and Nguni. The percentage intermediate fibre values were similar between the
breeds and the Simmentaler breed had the highest percentage red fibres compared to the other breeds.
The sarcomere lengths in this study were mostly under 1.7 µm, which indicates marginal shortening
(caused by either hot or cold temperatures). Thus high energy content in the muscle and a fast decrease in
carcass temperature (Table 4.1) could lead to cold shortening, especially in the Nguni-crosses (i.e. causing
the short sarcomere lengths in the Nguni-crosses) (Table 4.24). The study of Frylinck and Heinze (2003)
indicated that the sarcomeres of the Brahman and Simmentaler breeds did show a tendency to be marginally
shorter. According to Wheeler and Koohmaraie (1994) sarcomere length may have an indirect effect on
tenderisation during ageing due to its effect on initial tenderness. Denoyelle and Lebihan (2003) reported
that meat tenderness depends on the properties of the muscle fibres and the amount and type of connective
tissue.
5.8 Connective tissue
The connective tissue status did not have a significant effect on the differences in tenderness between the
different crossbreds evaluated (Table 4.25). However, the percentage collagen solubility in the Nguni-
crosses tended to be higher than that of the other crossbreds, which could explain the tendency for their more
favourable meat tenderness. As in the case of the calpain system the ratios of the different components,
soluble and insoluble collagen, play an important role in the ultimate tenderness and not one component
alone.
5.9 Correlation between muscle characteristics
Correlation coefficients reported previously for calpastatin activity and tenderness (WBSF) determined 24
hours post mortem were r = 0.27 (Shackelford et al., 1995) and this corresponds with r = 0.25 at 7 days post
mortem (Table 4.26), 0.66 and 0.39 (Whipple et al., 1990b and Shackelford et al., 1991). However, these
correlations indicate that the calpain system plays an important role during the ageing process
(tenderisation). The correlation between WBSF and the sarcomere lengths indicates that muscle shortening
(cold shortening) influenced tenderness in the current study, which corresponds with the previous data in
Table 4.24 (sarcomere lengths ~ 1.6 µm). Although MFL is also an indicator of toughness, it was rather
67

difficult to determine at day 1. The reason for better correlations at 7 days post mortem between WBSF and
muscle characteristics is because the differences between the characteristics at that stage are a better
indication.
The study of Frylinck and Heinze (2003) also indicated that the percentage intermediate fibres
correlated negatively with WBSF values. This phenomenon indicates that more intermediates fibres favour
meat tenderness, which corresponds with the characteristics of the Nguni.
However, when all the mechanisms (calpain system, collagen (total- and soluble collagen) and
muscle contraction proteins (fibre typing, myofibre areas and sarcomere length) are considered, it can be
concluded that the expression of the calpain system was counteracted by cold shortening for example in the
Nguni-crosses. This means that the muscle contraction protein mechanism played a major role in the
resultant / final tenderness of the various crossbreds evaluated. The muscle contraction protein mechanism
also had a more positive effect on the tenderness of the Brahman-crosses resulting in more favourable
tenderness measurements (WBSF), but which is still regarded as tough (Table 4.2).
It can be concluded from this study that meat quality, and in particular meat tenderness, is
manifested through a complexity of events in the muscle and their interactions with many environmental
stimuli in both the live animal and during the post mortem period. The knowledge gained from genomic
approaches can be an additional aid in defining and optimising management systems for better meat quality.
68
CHAPTER 6
CONCLUSIONS AND RECOMMENDATIONS
The post World War II food production world has been replaced with a modern consumer world where the
emphasis in the food chain is top down (customer driven) not bottom up (producer driven) (Catlett, 2006).
Thus, a current concern in the production of beef cattle is tenderness of the meat product, which has a major
impact on consumer satisfaction. Strydom (1998) suggested that in any country the whole red meat
industry’s mind (research, producer, processor, food service) should be set on: supplying a product with
maximum edible yield (muscle and fat), according to consumer preference and with the best consistent
eating qualities per unit price.
A comparison of crossbreds with regard to the histological, physical and genetic characteristics has
not before been attempted in South Africa. This study of beef animals included three genotype crosses
(Brahman-crosses, Simmentaler-crosses and Nguni-crosses), classified according to the three breed groups
(Bos indicus, Bos taurus and Sanga). Weaned, young bulls (7 - 8 months) were transported to the ARC-
Irene, where they were kept under feedlot conditions until the time of slaughter. The animals were
slaughtered at an age of 10 - 12 months, so as to produce a carcass in the A-age class with a fatness code of
two to three (lean-medium fat) according to the current South African Beef Classification System
(Government Gazette, No. 5092, 1993).
At slaughter the carcasses were not electrical stimulated (NS) because electrical stimulation (ES)
influences the processes of meat tenderness, and the emphasis was on the expression of the inherent
tenderness characteristics without external post mortem influences. After exsanguination the carcasses were
dressed down, halved and chilled at 4 °C within 2 hours of post mortem. The M. longissimus dorsi (L1-L6)
(LL) of each carcass on both sides were used for sampling. Three 20 – 25 cm thick whole-loin cuts were
removed from specific positions along the M. longissimus thoracis et lumborum (LT and LL) on the right
and left sides for shear force evaluations. Each of the three cuts were vacuum packed, and aged for 1 day, 7
and 14 days post mortem at ± 4 °C, then frozen, and stored (-25 °C) for later determination of Warner-
Bratzler shear force (WBSF). The muscle pH and temperature decline were measured at the second last
lumbar vertebrae at 1-hour, 2, 3, 6, 8 and 20 hours post mortem to diagnose pale, soft and exudative (PSE)
type (PSE is only found in pork, but a similar phenomenon exist in beef where a high drip loss takes place
after a quick pH decline and a slow temperature decline) or dark, firm and dry (DFD) phenomena at
slaughter. DFD can influence the ageing process of the meat. The pH and temperature were determined
with a digital handheld meat pH meter (Unitemp) fitted with a polypropylene spear type gel electrode.
Muscle samples for other procedures were removed from M. longissimus dorsi (L1-L6) (LL) at specified
positions and preserved at either -25 °C or -80 °C after ageing at 1 day, 7 and 14 days post mortem.
The results of the present study showed that differences exist in meat quality of the different
crossbreds. Breed had a significant effect on the meat quality characteristics especially with regard to
tenderness. Differences in tenderness do occur between Bos indicus, Bos taurus and Sanga breeds due to
69

differences in the properties of the proteolytic enzyme system (Whipple et al., 1990a; Shackelford et al.,
1991). However, there will always be a place for Bos indicus cattle because of their adaptability to tropical
climates and environments as well as their resistance to tropical parasites (Strydom, 1998).
It is generally accepted that proteolysis of myofibrillar proteins is, at least partly, responsible for post
mortem tenderisation. However the exact mechanisms are still largely unknown and a number of questions
remain to be solved. A large number of muscle proteins have been previously identified and are degraded
during the ageing process, but the relative importance of these proteins with regard to the maintenance of the
structural integrity of meat remains to be determined.
The activities of the calpain system seem to support some of the similarities and differences in meat
tenderness of the crossbreds evaluated. According to Koohmaraie and Geesink (2006) the calpain
proteolytic system plays a central role in post mortem proteolysis and tenderisation. Calpains are calcium-
activated proteases with an optimum activity at a neutral pH. In skeletal muscle, the calpain system consists
of at least three proteases, µ-calpain, m-calpain and skeletal muscle-specific calpain, p94 or calpain 3 and an
inhibitor of µ- and m-calpain, calpastatin.
It is important to keep in mind that sarcomere length and myofibrillar fragment length are not the
only determining factors for tenderness. Other factors, such as collagen content and solubility and the water-
holding capacity should also be considered in explaining differences. It is also possible that proteases other
than calpains, such as the cathepsins (that forms part of the tenderness model study but are not presented in
this study) released from the lysosomes (Ouali et al., 2006), and the multicatalytic proteinase complex
(Rivett, 1989) could affect tenderness of the different breeds.
According to Ouali et al. (2006) attentions of meat scientists were mainly focused on the two best-
known enzymatic systems, i.e. calpains and the cathepsins. Ouali et al. (2006) concluded that apoptosis on
cells engaged in programmed cell death brings possible answers to many questions regarding the conversion
of muscle to meat. It is also suggested that even if the participation of caspases does not fully explain muscle
tenderisation, it is probably an essential element facilitating the action of other intracellular proteolytic
systems such as cathepsins and there also may be other proteolytic enzymes not considered so far as potential
effectors of meat tenderness. In this study not all the enzyme systems and their role on meat tenderness were
evaluated, but considering research studies (Koohmaraie and Geesink, 2006; Ouali et al., 2006) it can be
concluded that there is more than sufficient evidence to suggest that µ-calpain in combination with
calpastatin is the only proteolytic system that influence tenderness (Koohmaraie and Geesink, 2006).
However, when all the mechanisms (calpain system, collagen (total- and soluble collagen) and
muscle contraction characteristics (fibre typing, myofibre areas and sarcomere length) are considered, it can
be concluded that the expression of the calpain system in this study was overshadowed by cold shortening,
especially in the Nguni-crosses (SL = 1.6 µm). This means that the muscle contraction protein mechanism
played a major role in the tenderness outcome of the various crossbreds evaluated. The muscle contraction
protein mechanism may not have been affected by cold shortening in the Brahman-crosses (SL = 1.7 µm),
70
thus the reported more favourable tenderness measurements (WBSF, but is still regarded as tough). With
this in mind the influence and role on tenderness outcome, considering a genetic approach was evaluated.
According to Bradley et al. (1998) the measurement and manipulation of genetic characteristics in
cattle has a long history; for example general characteristics such as horn morphology and coat colouring
have long been noted. There has been significant interest in genetic selection to decrease problems with
variations in meat tenderness. However, the problem of variability in meat tenderness has not diminished, in
part because of an inability to accurately select for increased tenderness. Previous studies (Barendse, 2002;
Page et al., 2002; Page et al., 2004; White et al., 2005) have independently evaluated markers at the CAST
and CAPN1 genes. These studies have shown an association of individual markers at CAST and CAPN1 with
meat tenderness in beef cattle, as in the present study. Considering all the marker data used in this study
(interaction between the genes), it can be concluded that overall the Nguni-crosses had the highest potential
to inherit tender meat, the Brahman-crosses inherited the alleles for tougher meat and the Simmentaler-
crosses were intermediate.
One of the aims of this study was to investigate the relationship between breed and muscle
characteristics, considering a physiological and genetic approach. It is recommended that purebred animals
rather than crossbreds should be used to determine these factors, because the animals were classified
according to phenotype and this could have resulted in a genetic “error” made in the study. From this study
it can be concluded that even if the animal has the potential to produce tender meat, it is not for sure a tender
end product i.e. Nguni-crosses. This is due to the various mechanisms and environmental factors that are
involved, thus enhancing or suppressing mechanisms can play a role and give another outcome compared to
the genetic make up. This means that attention should also be placed on other methods and factors playing a
role to improve tenderness (for example electrical stimulation, pre-slaughter handling and management) and
one should not over emphasize the genetic potential of an animal and only consider it as an aid in selecting
for the desired trait. The reason is that the estimated contribution of gene technology on meat tenderness was
found to be 10 - 12 % and the results of this study suggests that researches should take into account the many
other environmental and non-environmental conditions that play a role in meat tenderness. It is therefore
necessary to integrate the available knowledge in our future projects on meat tenderisation, including the
identification of predictive markers. The introduction of meat quality (meat tenderness) in the genetic
selection programmes in South Africa i.e. Best Linear Unbiased Prediction (BLUP) system should be
considered.
It can be concluded that meat quality and the composition, nutritional value, wholesomeness and
consumer acceptability of beef are largely determined by events and conditions encountered by the embryo,
the live animal and the post mortem musculature. The control of these qualities, and their future
enhancement, are thus dependant on a better understanding of the commodity at all stages of its existence -
from the initial conception, growth and development of the organism to the time of slaughter and to the
ultimate processing, distribution, preparation, cooking and consumption. Though not tested in this study, the
use of various post mortem tenderisation technologies in South Africa may be more cost-effective than
71

attempts to improve tenderness in beef cattle genetically. Results from this study indicates that modern
technologies available for predicting the potential tenderness of beef animals is not adequate to be of
commercial value for the producer. The scientific information obtained from this study can be used to
explain inconsistencies in meat tenderness experienced in the beef industry and help develop technologies to
manipulate and standardise meat tenderness and the tenderising processes.
Future endeavours should focus on a more co-ordinated strategy between the various research
disciplines in the beef industry (genetics, feeding, animal welfare, economics, processing and meat quality)
to ensure that the different sectors have the knowledge to supply an end product, which is not only accepted
but also preferred, by consumers’ worldwide. Addressing one trend (characteristic / trait) is no longer
sufficient; consumers want it all. The influence of cell death (necrosis and apoptosis) on meat quality could
be researched in the future. Further research that should be considered in South Africa is the role of genetic
contribution in meat quality with emphasis on proteomics. The proteome is expressed from the genome,
influenced by environmental and processing conditions, and can be seen as the molecular link between the
genome and the functional quality characteristics of meat (Hollung et al., 2007). Proteomics is a promising
key in meat science to unleash the molecular mechanisms behind different genetic backgrounds or
processing techniques of meat. Understanding the variations and different components of the proteome with
regard to a certain meat quality trait will lead to knowledge that can be used to optimise the tenderisation
process. South Africa should focus on the understanding and identification of markers (i.e. genetic and
protein markers) for meat quality (i.e. tenderness), thus an integrated functional genomic approach should be
considered.
72

Addendum A
The establishment of cattle breeds which are now indigenous to Africa is believed by historians to be very
closely associated with man, his development, migration and specific behaviour from 6 000 years BC
(Payne, 1964; Oliver, 1983; Strydom, 1998; Scheepers, 1999). Due to this movement and behaviour, the
cattle breeds can be classified into three groups: Bos indicus, Bos taurus and the Sanga. It is accepted that
cattle arrived on the continent through three main routes from Asia (Figure 1).
Figure 1: Origin and migration routes of domesticated cattle in Africa (Oliver, 1983)
Longhorn cattle are believed to be the first cattle to be domesticated from the wild Bos primigenius
primigenius (wild aurochs) in Western Asia (the origin of domestication) about 6000 BC. They appeared in
Africa around 5000 BC. Shorthorn cattle originated in the same area as the longhorn cattle and were
introduced in to Africa approximately 2500 BC. Both longhorn and shorthorn cattle were of taurine type
(hump less) and are often classified as Bos taurus longifrons and Bos taurus brachyceros (Oliver, 1983;
Payne and Hodges, 1997; Strydom, 1998). The third group of cattle introduce into Africa were the Zebu
73
cattle about 1500 BC and later introductions around 670 BC. Two major types of Zebu cattle (Bos indicus)
are known; neck humped (cervico-thoracic) and shoulder humped (thoracic types). According to Payne and
Hodges (1997) the African Sanga first evolved in Northeast and East Africa over a period of time (2000 BC -
400 AD) (Figure 1), as their three ancestral cattle types (longhorn, shorthorn and zebu) entered the region.
Although it is accepted that cattle were domesticated around 2100 BC in the Middle East and
migrated south with the tribes that kept them (reaching the area presently known as South Africa around 700
AD) (Gertenbach and Kars, 1999). The first migration southwards was probably that of Sudanic- or
Cushitic-speaking tribes (probably the later Koisan people of southern Africa that originated from inbreeding
of Bushmen and Sudanic / Cushitic people) and their cattle were long horned Sanga types. When Europeans
came to the southern tip of Africa, indigenous cattle (Sanga) were utilised as draught animals as they could
survive the harsh climatic conditions, in contrast to Bos taurus breeds. The Nguni is a Sanga type named
after the Nguni people, which lived on the East coast of South Africa. According to Gertenbach and Kars
(1999) the Sanga have a sub-metacentric Y-chromosome in contrast to the acrocentric Y-chromosome of the
Zebu (Bos indicus) types. The Sanga (Nguni) cattle breeds are also well known for their high fertility and
tick resistance (Maule, 1973; Scholtz, 1988; Schoeman, 1989). Due to the development of new agricultural
practices over the years, Bos taurus (i.e. Simmental) breeds were imported for their perceived higher income
together with better growth performance and carcass quality. The first Simmentalers were imported into
South Africa in 1905 and the breed took a minor position until early sixties when it’s superior performance
in interbreed trials and growth test centres became known (Scholtz et al., 1999). Thus, when commercial
feedlots started in South Africa and became common practice to finish cattle for the market, supplementing
grass feeding, later maturing Bos taurus, such as Simmentaler, became even more popular. In addition, the
Brahman (Bos indicus) was introduced 1954 into South Africa. The breed was now used as a dam as well as
a sire line to overcome the climatic challenges to which the Bos taurus breeds could not adapt, and also for
its pronounced heterosis with non-indicus breeds (Strydom, 1998).
74

Addendum B Table 1: Major characteristics and potential roles of desmin, titin and nebulin in muscle (Robson et al., 1991).
Protein Major characteristics Potential roles in muscle Importance in post mortem
muscle
Desmin 1. Desmin is one of the major types / isomers of proteins comprising 10 nm diameter intermediate filaments (IFs)
that, in turn, are part of the cytoskeleton of virtually all animal cells.
2. Insoluble, myofibrillar /
cytoskeletal protein (Mr of subunit = 53,000) present in skeletal, cardiac and most smooth muscle cells
of vertebrates. 3. The purified protein has the
ability, via several structural intermediates, to
self-assemble into synthetic, 10nm diameter,
very long (> 1-2 µm) filaments.
4. Comprises a set of IFs that
encircle the Z-line periphery and radiate out perpendicular to the myofibril axis to ensnare
and connect adjacent myofibrils.
5. Link myofibrils to sub cellular organelles, such as nuclei, mitochondria and to the cell membrane skeleton.
1. In developing muscle cells, desmin IFs may help align and tie together adjacent
myofibrils, but this remains to be proven.
2. In the developed muscle cell, desmin IFs may help
appear to play an important cytoskeletal role in connecting the myofibrils and, in turn,
tie or anchor the myofibrils to sub cellular organelles and the cell membrane, i.e. desmin
IFs may play a significant role in maintaining overall integrity and organization of the
skeletal muscle cell
1. Unknown
Titin 1. Insoluble, giant
myofibrillar protein (Mr = 2.8 x 10⁶). 2. Present in skeletal and
cardiac muscle cells of vertebrates and invertebrates.
3. Comprises about 8% to 10% of total myofibrillar protein in vertebrate skeletal muscle.
4. Titin is a very long (≥ 1µm) molecule, with a globular head and a very long thin tail.
5. A titin molecule spans one half the width of a sarcomere, i.e. from the M-line to the Z-line and, thus
forms a third filament within the myofibril.
1. In developing muscle,
titin may play a role as part of morphogenetic scaffolding during sarcomeric organisation.
2. In the mature myofibril, titin forms a third filament system that provides sarcomeric alignment (e.g. keeps myosin filaments in register, possibly regulates the length of the
thick filaments). 3. Helps maintain overall
structural integrity of the sarcomeres, myofibrils
and muscle cells.
1. Titin is the third most
abundant myofibrillar protein and plays a significant cytoskeletal role in determining the degree of integrity (strength) of myofibrils, muscle cells and muscle tissue.
2. Titin is the only myofibrillar protein that is present from Z-line to Z-line.
3. Is degraded post
mortem by endogenous proteinases, presumably including
the calpains.
75

Table 1: Major characteristics and potential roles of desmin, titin and nebulin in muscle (Robson et al., 1991).
Titin 6. The part of titin located
within the sarcomeric A-band, where it appears bound to the outside of the thick filament shaft, is relatively inelastic.
7. The part of titin located within the sarcomeric I-
band is “elastic”
4. Post mortem alterations in titin and titin extractability appear to be associated with increased beef and pork muscle water-holding capacity.
Nebulin 1. Insoluble, very high
molecular weight
myofibrillar protein (Mr = 6 to 9 x 10⁵).
2. Present in skeletal muscle cells of vertebrates where it accounts for about 3-4% of total myofibrillar protein.
3. Nebulin is apparently a
very elongated (~ 1µm) molecule.
4. Nebulin’s N-terminus is near the distal (free) end of the thin filament and its C-terminus is located at the
Z-line 5. Nebulin’s repeating
domains can bind to F-actin and perhaps via its
C-terminal domain, to α-actinin (Z-line).
1. In developing muscle cells, nebulin may play an
important role in organisation of the thin filaments during myofibrillogenesis.
2. In the mature sarcomere, nebulin may contribute to act as a template for assembly (i.e. regulate thin filament length) and / or
scaffold for stability of the thin filaments. Nebulin might even comprise part
of the thin filament structure.
3. Nebulin may help link / anchor the thin filament firmly to the Z-line structure.
1. Nebulin is rapidly degraded post
mortem, even faster than titin. This degradation may trigger subsequent post mortem alterations in the myofibril.
2. The degradation of nebulin that occurs
post mortem is presumably due to endogenous
proteinases, including the calpains, but this must be carefully documented.
3. Because nebulin is a long, fibrous, structural protein of the sarcomere, and may anchor thin
filaments to Z-lines, nebulin’s demise post
mortem may decrease
overall cytoskeletal integrity of the myofibrils, muscle cells and muscle tissues. These exact relationships, however, remain nebulous.
76
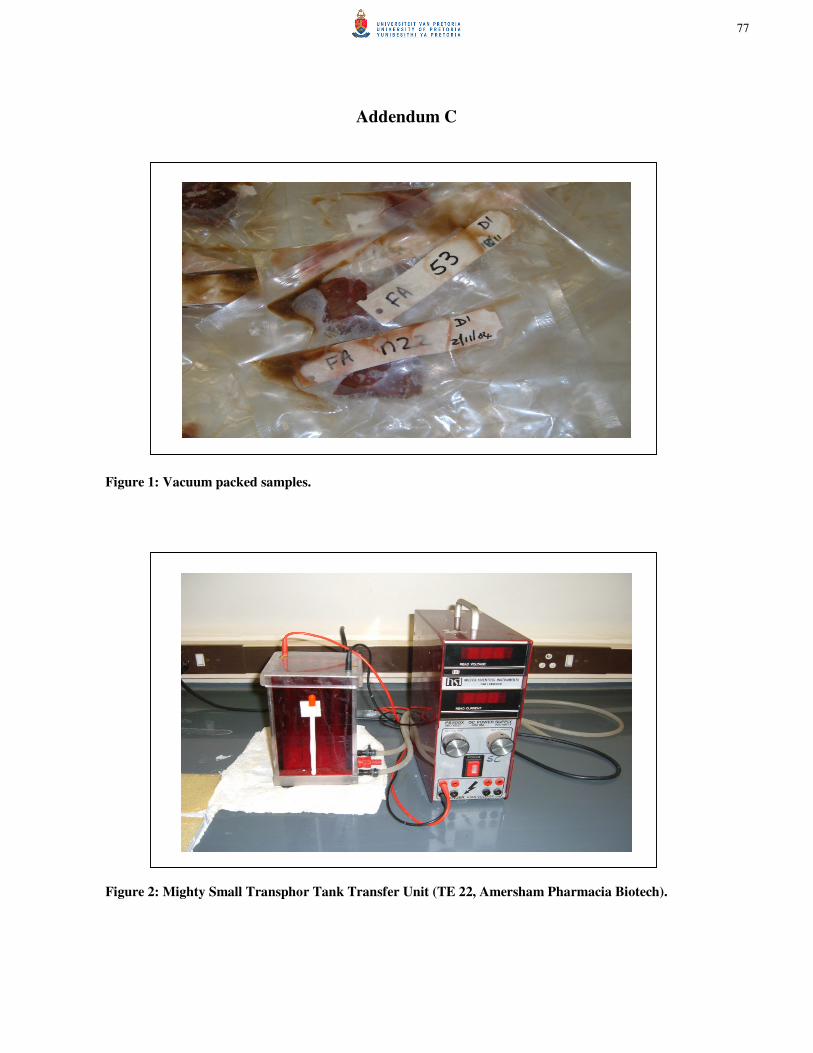
Addendum C
Figure 1: Vacuum packed samples.
Figure 2: Mighty Small Transphor Tank Transfer Unit (TE 22, Amersham Pharmacia Biotech).
77

Figure 3: Nanodrop (ND-1000 Spectrophotometer).
78

References
AEC-Amersham. 2002. ECL Western-blotting detection reagents and analysis system. RPN2106PC, Rev-B:
5.
Alison, V.E. 2006. DNA-based technologies. Beef sire selection manual, National beef cattle evaluation
consortium, 66-73.
AMSA. 1978. Guidelines for cooking and sensory evaluation of meat. American Meat Science
Association, National Livestock and Meat Board, Chicago, IL.
Bailey, A.J. 1972. The basis of meat texture. Journal of Food Agriculture, 23, 995-1007.
Bailey, J.L. 1967. Techniques in protein chemistry. 2nd Ed. Elsevier Publishing Company, Amsterdam.
Barendse, W. 2002. DNA markers for meat tenderness. International patent application PCT/AU02/00122.
International patent publication WO 02/064820 A1.
Beattie, V.E., Weatherup, R.N., Moss, B.W., Walker, N. 1999. The effect of increasing carcass weight of
finishing boars and gilts on joint composition and meat quality. Meat Science, 52, 205-211.
Beltran, J.A., Jaime, I., Santolaria, P., Sanudo, C., Alberti, P., Roncales, P. 1997. Effect of stress-induced
high post mortem pH on protease activity and tenderness of beef. Meat Science, 45 (2), 201-207.
Bergman, I., Loxley, R. 1963. Two improved and simplified methods for the spectrophotometric
determinations of hydroxyproline. Analytic Chemistry, 35, 1967-1970.
Bertrand, J.K., Green, R.D., Herring, W.O., Moser, D.W. 2001. Genetic evaluation for beef carcass traits.
Journal of Animal Science, 79 (E. supplement.): E190-E200.
Beuzen, N.D., Stear, M.J., Chang, K.C. 2000. Molecular markers and their use in animal breeding. The
Veterinary Journal, 160, 42-52.
Boccard, R. 1973. The development and physical structure of muscle collagen in relation to meat toughness.
Journal of South African Veterinary Association, 44 (4), 351-362.
79
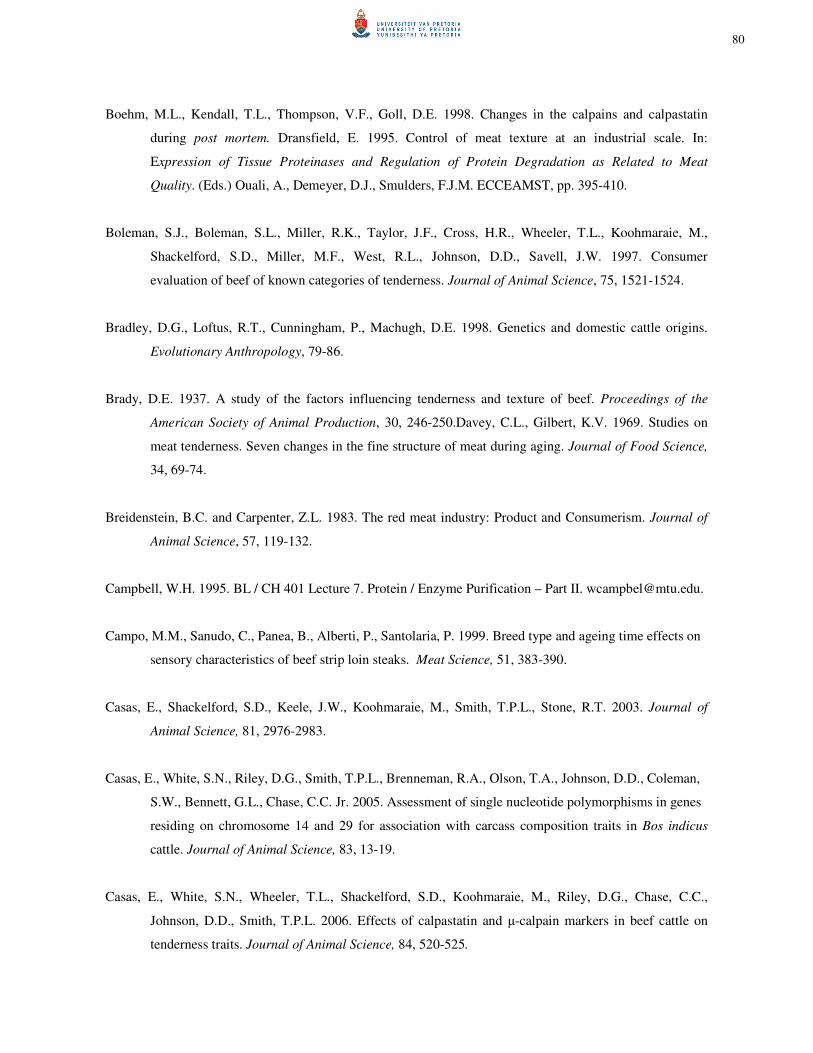
Boehm, M.L., Kendall, T.L., Thompson, V.F., Goll, D.E. 1998. Changes in the calpains and calpastatin
during post mortem. Dransfield, E. 1995. Control of meat texture at an industrial scale. In:
Expression of Tissue Proteinases and Regulation of Protein Degradation as Related to Meat
Quality. (Eds.) Ouali, A., Demeyer, D.J., Smulders, F.J.M. ECCEAMST, pp. 395-410.
Boleman, S.J., Boleman, S.L., Miller, R.K., Taylor, J.F., Cross, H.R., Wheeler, T.L., Koohmaraie, M.,
Shackelford, S.D., Miller, M.F., West, R.L., Johnson, D.D., Savell, J.W. 1997. Consumer
evaluation of beef of known categories of tenderness. Journal of Animal Science, 75, 1521-1524.
Bradley, D.G., Loftus, R.T., Cunningham, P., Machugh, D.E. 1998. Genetics and domestic cattle origins.
Evolutionary Anthropology, 79-86.
Brady, D.E. 1937. A study of the factors influencing tenderness and texture of beef. Proceedings of the
American Society of Animal Production, 30, 246-250.Davey, C.L., Gilbert, K.V. 1969. Studies on
meat tenderness. Seven changes in the fine structure of meat during aging. Journal of Food Science,
34, 69-74.
Breidenstein, B.C. and Carpenter, Z.L. 1983. The red meat industry: Product and Consumerism. Journal of
Animal Science, 57, 119-132.
Campbell, W.H. 1995. BL / CH 401 Lecture 7. Protein / Enzyme Purification – Part II. [email protected].
Campo, M.M., Sanudo, C., Panea, B., Alberti, P., Santolaria, P. 1999. Breed type and ageing time effects on
sensory characteristics of beef strip loin steaks. Meat Science, 51, 383-390.
Casas, E., Shackelford, S.D., Keele, J.W., Koohmaraie, M., Smith, T.P.L., Stone, R.T. 2003. Journal of
Animal Science, 81, 2976-2983.
Casas, E., White, S.N., Riley, D.G., Smith, T.P.L., Brenneman, R.A., Olson, T.A., Johnson, D.D., Coleman,
S.W., Bennett, G.L., Chase, C.C. Jr. 2005. Assessment of single nucleotide polymorphisms in genes
residing on chromosome 14 and 29 for association with carcass composition traits in Bos indicus
cattle. Journal of Animal Science, 83, 13-19.
Casas, E., White, S.N., Wheeler, T.L., Shackelford, S.D., Koohmaraie, M., Riley, D.G., Chase, C.C.,
Johnson, D.D., Smith, T.P.L. 2006. Effects of calpastatin and µ-calpain markers in beef cattle on
tenderness traits. Journal of Animal Science, 84, 520-525.
80

Catlett, L. 2006. Global perspective and consumer needs in a changing world. Proceedings of the 52nd
International Congress of Meat Science and Technology, pp. 25-28.
Cockett, N.E., Shay, T.L., Green, R.D., Hancock, D.L. 1995. Rapid Communication: A Taq I restriction
fragment length polymorphisms in the bovine calpastatin gene. Journal of Animal Science, 73, 3790.
Cornall, A.G., Bardawill, G.J., David, M.M. 1949. Determination of serum proteins by means of the biuret
reaction. Journal of Biological Chemistry, 177, 751-766.
Craig, S.W. and Pardo, J.V. 1983. Gamma actin, spectrin, and intermediate filament proteins colocalize with
vinculin at costameres, myofibril to sarcolemma attachment sites. Cell Motility, 3, 449.
Cross, H.R., Durland, P.R., Seideman, S.C. 1986. Sensory qualities of meat. In Bechtel, P.J. (Eds.) Muscle as
Food, Orlando. Academic Press: pp. 279-320.
Cross, H.R., Schanbacher, B.D., Crouse, J.D. 1984. Sex, age and breed related changes in bovine
testosterone and intra muscular collagen. Meat Science, 10, 187-195.
Crouse, J.D., Cundiff, L.V., Koch, R.M., Koohmaraie, M., Seideman, S.C. 1989. Comparison of Bos indicus
and Bos taurus inheritance for carcass beef characteristics and meat palatability. Journal of Animal
Science, 67, 2661-2668.
Culioli, J. 1995. Meat tenderness: mechanical assessment. In Ouali, A., Demeyer, D.I. and Smulders, J.M.
(Eds.), Expression of tissue proteinases and regulation of protein degradation as related to meat
quality, ECCEAMST, CIP-Gegevens Koninklijke Biblioteek Den Haag: pp. 239-263.
Culler, R.D., Parrish, F.C., Smith, G.C., Cross, H.R. 1978. Relationship of myofibril fragmentation index to
certain chemical, physical and sensory characteristics of bovine longissimus muscle. Journal of
Food Science, 43, 1177-1180.
Davis, G.W., Dutson, T.R., Smith, G.C., Carpenter, Z.L. 1980. Fragmentation procedure for bovine
longissimus muscle as an index of cooked steak tenderness. Journal of Food Science, 45, 880-884.
Davey, C.L. 1983. Post mortem chemical changes in muscle meat ageing. Meat conference Proceedings, 26,
108-115.
81

Davey, C.L. and Gilbert, K.V. 1969. Studies on meat tenderness. Seven changes in the fine structure of meat
during aging. Journal of Food Science, 34, 69-74.
Dayton, W.R. 1982. Comparison of low- and high-calcium requiring forms of the calcium-activated
proteases with their autolytic breakdown products. Biochimica et Biopysica Acta, 709, 166-172.
Dayton, W.R., Goll, D.E., Zeece, M.G., Robson, R.M., Reville, W.J. 1976a. A Ca2+-activated protease
possibly involved in myofibrillar protein turnover. Purification from porcine muscle. Biochemistry,
15, 2150-2158.
Dayton, W.R., Reville, W.J., Goll, D.E., Stromer, M.H. 1976b. A Ca2+-activated protease possibly
involved in myofibrillar protein turnover. Partial characterization of the purified enzyme.
Biochemistry, 15, 2159-2167.
Dayton, W.R., Schollmeyer, J.V., Lepley, R.A., Cortés, L.R. 1981. A calcium-activated protease possibly
involved in myofibrillar protein turnover. Isolation of a low calcium requiring form of the protease.
Biochimica et Biophysica Acta, 659, 48-61.
De Bruyn, J.F. 1991. Production and product characteristics of different cattle genotypes under feedlot
conditions. D.Sc. (Agric) Thesis. University of Pretoria. South Africa.
Denoyelle, C. and Lebihan, E. 2003. Intra muscular variation in beef tenderness. Meat Science, 66, 241-247.
Doumit, M.E., Koohmaraie, M. 1999. Immunoblot analysis of calpastatin degradation: Evidence for cleavage
by calpain in post mortem muscle. Journal of Animal. Science, 77, 1467-1473.
Doumit, M.E., Lonergan, S.M., Arbona, J.R., Killefer, J., Koohmaraie, M. 1996. Development of an enzyme
linked immunosorbent assay (ELISA) for quantification of skeletal muscle calpastatin. Journal of
Animal Science, 74, 2679-2686.
Dransfield, E. 1993. Modelling post mortem tenderisation-IV: Role of calpains and calpastatin in
conditioning. Meat Science, 34, 217-234.
Dransfield, E. 1994. Optimasation of tenderisation, ageing and tenderness. Meat Science, 36, 105-121.
82

Dransfield, E. 1995. Control of meat texture at an industrial scale. In: Expression of Tissue Proteinases and
Regulation of Protein Degradation as Related to Meat Quality. (Eds.) Ouali, A., Demeyer, D.J.,
Smulders, F.J.M. ECCEAMST, pp. 395-410.
Dransfield, E. 1996. Calpains from thaw rigor muscle. Meat Science, 43, 311-320.
Dransfield, E. 2003. Consumer acceptance – meat quality aspects. Consistency of Quality: 11th International
Meat Symposium: 146-159.
Dreyer, J.H., Van Rensburg, A.J.J., Naudé, R.T., Gouws, P.J., Stiemie, S. 1979. The effect of chilling
temperatures and mode of suspension of beef carcasses on sarcomere length and meat tenderness.
South African Journal of Animal Science, 9, 1-9.
Emori, Y., Kawasaki, H., Imajoh, S., Kawasaki, S., Suzuki, K. 1986. Isolation and sequence analysis of
cDNA clones for the small subunit of rabbit calcium-dependant protease. Journal of Biological
Chemistry, 261, 9472-9476.
Eggen, A. and Fries, R. 1994. An integrated cytogenetic and meiotic map of the bovine genome.
www.locus.jouy.inra.fr. Accessed 15 March 2005.
Eggen, A. and Hocquette, J.F. 2003. Genomic approaches to economic trait loci and tissue expression.
Profiling: application to muscle biochemistry and beef quality. Meat Science, 66, 1-9.
Ewing, B. and Green, P. 1998. Base-calling of automated sequencer traces using Phred. II. Error
probabilities. Genome Research, 8, 186-194.
Fritz, J.F. and Greaser, M.L. 1991. Changes in titin and nebulin in post mortem bovine muscle revealed by
gel electrophoresis, western-blotting and immunofluorescence microscopy. Journal of Food Science,
56, 3, 607-615.
Fritz, J.D., Swartz, D.R., Greaser, M.L. 1989. Factors affecting polyacrylamide gel electrophoresis and
electroblotting of high-molecular-weight myofibrillar proteins. Analytical Biochemistry, 180, 205-
210.
Frylinck, L. 2001. Guaranteeing meat tenderness – a research priority for South Africa. Meat Industry
Summit. Holiday Inn, Johannesburg International Airport. South Africa.
83

Frylinck, L. and Heinze, P.H. 2003. Evaluation of meat tenderness of indigenous South African and other
beef breeds. Consistency of Quality: 11th
International Meat Symposium: pp. 28-47.
Furst, D.O., Osborn, M., Nave, R., Weber, K. 1988. The organization of titin filaments in the half-sarcomere
revealed by monoclonal antibodies in immunoelectron microscopy: A map of ten no repetitive
epitoped starting at the Z-line extends close to the M-line. Journal of Cell Biology, 106, 1563-1572.
Gann, G.L. and Merkel, R.A. 1978. Ultra structural changes in bovine longissimus muscle during post
mortem ageing. Meat Science, 2, 129-144.
Gao, Y., Zhang, R., Hu, X., Li, N. 2007. Application of genomic technologies to the improvement of meat
quality of farm animals. Meat Science, 77, 36-45.
Geesink, G.H. 1993. Post mortem muscle proteolysis and beef tenderness with special reference to the action
of the calpain / calpastatin system. Ph.D. Thesis, Rijksuniversiteit te Utrechyt.
Geesink, G.H. and Koohmaraie, M. 1999. A rapid method for quantification of calpain and calpastatin
activities in muscle. Journal of Animal Science, 77, 3225-3229.
Gertenbach, W.D. and Kars, A.A. 1999. Towards the conservation of indigenous cattle of KwaZulu-Natal;
Review Article. South African Journal of Animal Science, 29, 55-63.
Goll, D.E. 1991. Role of proteinases and protein turnover in muscle growth and meat quality. Proc. Ann.
Rec. Meat Conf. 44, 25.
Goll, D.E., Geesink, G.H., Taylor, R.G., Thompson, V.F. 1995a. Does proteolysis cause all post mortem
tenderisation, or are changes in the actin / myosin interaction involved? Proc. 41st Annual
International Congress of Meat Science and Technology, San Antonio, Texas, U.S.A. Vol. II: 537-
544.
Goll, D.E., Otsuka, Y., Nagainis, P.A., Shannon, J.D., Sathe, S.K., Muguruma, M. 1983. Role of muscle
proteinases in maintenance of muscle integrity and mass. Muscle proteinases and their possible roles
in muscle growth and meat texture. Journal of Food Biochemistry, 7, 137-177.
84

Goll, D.E., Taylor, R.G., Christiansen, J.A., Thompson, V.F. 1991. Role of proteinases and protein turnover
in muscle growth and meat quality. Proc. Recip. Meat. Conf. 44, 25-33.
Goll, D.E., Thompson, V.F., Taylor, R.G., Edmunds, T., Cong, J. 1995b. Properties and biological regulation
of the calpain system. In: Expression of Tissue Proteinases and Regulation of Protein Degradation
as Related to Meat Quality. (Eds.) Ouali, A., Demeyer, D.J., Smulders, F.J.M. ECCEAMST: pp. 47-
67.
Gordon, D., Abajian, C., Green, P. 1998. Consed: a graphical tool for sequence finishing. Genome Research,
8, 195-202.
Government Gazette No. 5092. 1993. Regulations regarding the classification and marketing of meat:
Amendment. Vol. 336. No. 14850. South Africa.
Greaser, M.L. 1986. Conversion of muscle to meat. In Muscle as Food, Ed. Bechtel, P.J. Academic Press,
New York. pp. 37-102.
Greaser, M.L. and Fritz, J.D. 1995. Post mortem changes in myofibrillar proteins in relation to meat
texture. In Ouali, D.J. De Meyer and F.J.M. Smulders (Eds.), Expression of tissue proteinases and
regulation of protein degradation as related to Meat Quality: ECCEAMST: pp. 293.
Gregory, K.E., Cundiff, L.V., Koch, R.M. 1995. Genetic and phenotypic (co)variances for growth and
carcass traits of purebred and composite populations of beef cattle. Journal of Animal Science, 73,
1920-1926.
Gustavo, C. and Gresshoff, P.M. 1997. DNA markers, protocols, applications, overviews. 1st ed. Wiley –
Liss, Inc. New York, USA.
Harrington, G. 1994. Consumer demands: Major problems facing industry in a consumer-driven society.
Meat Science, 36, 5-18
Heaton, M.P., Chitko-McKnown, C.G., Grosse, W.M., Keele, J.W., Keen, J.E., Laegreid, W.W. 2001.
Interleukin-8 haplotype structure from nucleotide sequence variation in commercial populations of
U.S. beef cattle. Mammalian Genome, 12, 219-226.
85
Hegarty, P.V.J. and Naudé, R.T. 1970. The accuracy of measurement of individual skeletal muscle fibres
separated by a rapid technique. Laboratory Practice, 19, 161-163.
Heinze, P.H. and Bruggemann, D. 1994. Ageing of beef: Influence of two ageing methods on sensory
properties and myofibrillar proteins. Sciences Des Aliments, 14, 387.
Herring, H.K., Cassens, R.G., Briskey, E.J. 1965. Further studies on bovine muscle tenderness as influenced
by carcass position, sarcomere length, and fibre diameter. Journal of Food Science, 30, 1049-1054.
Hill, J. 1966. The solubility of intramuscular collagen in meat animals of various ages. Journal of Food
Science, 31, 161-166.
Ho, C.Y., Stromer, M.H., Robson, R.M. 1996. Effect of electrical stimulation on post mortem titin, nebulin,
desmin, and troponin-T degradation and ultra structural changes in bovine longissimus muscle.
Journal of Animal Science, 74, 1563-1575.
Ho, C.Y., Stromer, M.H., Rouse, G., Robson, R.M. 1997. Effects of electrical stimulation and post mortem
storage on changes in titin, nebulin, desmin, troponin-T, and muscle ultra structure in Bos indicus
crossbred cattle. Journal of Animal Science, 75, 366-376.
Hofmeyer, J.H. 1981. The cuts of a beef carcass. Republic of South Africa. Department of Agriculture and
Fisheries. Technical Communication. No, 170, 13.
Hollung, K., Veisth, E., Jia, X., Faergestad, E.M., Hildrum, K.I. 2007. Application of proteomics to
understand the molecular mechanisms behind meat quality. Meat Science, 77, 97-104.
Honikel, K.O. 1998. Reference methods for the assessment of Physical Characteristics of meat. Meat
Science, 49, 447-457.
Huff, E.J., Parrish, Jr.F.C., Robson, R.M. 1991. The effects of sex, animal age and post mortem aging time
on selected characteristics of bovine longissimus muscle. Proc. Resip. Meat. Conf. 44, 206.
Huffman, K.L., Miller, M.F., Hoover, L.C., Wu, C.K., Brittin, H.C., Ramsey, C.B. 1996. Effect of beef
tenderness on consumer satisfaction with steaks consumed in the home and restaurant. Journal of
Animal Science, 74, 91-97.
86

Huff-Lonergan, E., Mitsuhashi, T., Beekman, D.D., Parrish, F.C., Olson, Jr, D.G., Robson, R.M. (1996a).
Proteolysis of specific muscle structural proteins by mu-calpain at low pH and temperature is similar
to degradation in post mortem bovine muscle. Journal of Animal Science, 74, 993-1008.
Huff-Lonergan, E., Mitsuhashi, T., Parrish, F.C.,Robson, M. 1996b. Sodium dodecyl sulfate-
polyacrylamide gel electrophoresis and Western-Blotting comparisons of purified myofibrils and
whole muscle preparations for evaluating titin and nebulin in post mortem bovine muscle. Journal of
Animal Science, 74, 779-785.
Huff-Lonergan, E., Parrish, F.C., Robson, R.M. 1995. Effects of post mortem aging time, animal age, and
sex on degradation of titin and nebulin in bovine longissimus muscle. Journal of Animal Science, 73,
1064.
Hwang, I.H., Park, B.Y., Cho, S.H., Lee, J.M. 2004. Effects of muscle shortening and proteolysis on Warner-
Bratzler shear force in beef longissimus and semitendinosus. Meat Science, 68, 497-505.
Instron. 1990. Instron Series IX automated materials testing system. Version 5. Instron Corporation.
Jeacocke, R. 1993. The concentration of free magnesium and free calcium ions both increase in skeletal
muscle fibres entering rigor mortis. Meat Science, 35, 27-45.
Jeremiah, L.E. 1996. The influence of subcutaneous fat thickness and marbling on beef. Palatability and
consumer acceptability. Food Research International, 29, No. 5-6, 513-520.
Jeremiah, L.E. and Phillips, D.M. 2000. Evaluation for predicting beef tenderness. Meat Science, 55,
493-502.
Jiang, S.T. 1998. Contribution of muscle proteinases to meat tenderisation. Review: Proceedings of the
National Science Council, ROC, Part B: Life Sciences, 29, No. 3, 97-107.
Kappes, S.M. 1996. Use of gene technology in animal breeding: The bovine genome-mapping project –
status and future aspects. Gene and Biotechnology in Animal Production and Meat processing: pp.
9-20.
87
Koch, R.M., Cundiff, L.V., Gregory, K.E. 1982. Heritabilities and genetic environmental and phenotypic
correlations of carcass traits in a population of diverse biological types and their implications in
selection programs. Journal of Animal Science, 55, 1319-1329.
Koohmaraie, M. 1992a. The role of the Ca2+- dependant proteases (calpains) in post mortem proteolysis and
meat tenderness. Biochimie, 74, 239-245.
Koohmaraie, M, 1992b. Muscle proteinases and meat aging. Proceedings 38th International Congress of
Meat Science and Technology, Clermont-Ferrand, France, 61-69.
Koohmaraie, M. 1994. Muscle proteinases and meat aging. Meat Science, 36, 93-104.
Koohmaraie, M. 1996. Biochemical factors regulating the toughening the toughening and tenderisation
processes of meat. Meat Science, 42, Supplement, S193-S201.
Koohmaraie, M. and Geesink, G.H. 2006. Contribution of post mortem muscle biochemistry to the delivery
of consistent meat quality with particular focus on the calpain system. Meat Science, 74, 34-43.
Koohmaraie, M., Killefer, J., Bishop, M.D., Shackelford, S.D., Wheeler, T.L., Arbona, J.R. 1995.
Calpastatin-based methods for predicting meat tenderness. In: Ouali, A., Demeyer, D.J., Smulders,
F.J.M. (Eds.), Expression of tissue proteinases and regulation of protein degradation as related to
meat quality. ECCEAMST: pp. 395-410.
Koohmaraie, M., Schollmyer, J.E. and Dutson, T.R. 1986. Effect of the low calcium requiring calcium-
activated factor on myofibrils under varying pH temperature conditions. Journal of Food Science,
51, 28-32.
Koohmaraie, M., Seideman, S.C., Schollmeyer, J.E., Dutson, T.R., Babiker, A.S. 1988. Factors associated
with the tenderness of three bovine muscles. Journal of Food Science, 53, 407-410.
Koohmaraie, M., Veiseth, E., Kent, M.P., Shackelford, S.D., Wheeler, T.L. 2003. Understanding and
managing variation in tenderness. Consistency of quality: 11th International meat symposium: pp. 3-
10.
Laemmli, U.K. 1970. Cleavage of storage proteins during the assembly of the head bacteriophage T4.
Nature, 227, 680.
88
Lawless, H.T. and Heymann, H. 1998. Sensory evaluation of food. Principles and practices. New York.
International Thomson Publishing.
Lawrie, R.A. 1985. “Meat Science”: pp. 401-459, 4th Edition. Pergamon Press, Oxford, UK.
Lebert, A. 2000. Grading systems, yield and meat quality, and evaluation on line. 46th ICoMST: pp. 332-337.
Lee, Y.B. 1986. Measurements and conditioning in assessing and enhancing meat quality. Journal of
Animals Science, 63, 622-632.
Lee, W.J., Ma, H., Takano, E., Yang, H.Q., Hatanaka, M., Maki, M. 1992. Molecular diversity in amino-
terminal domains of human calpastatin by exon skipping. Journal of Biological Chemistry, 267,
8437-8442.
Locker, R.H., Hagyard, C.J. 1963. A cold shortening effect in beef muscles. Journal of the Science of Food
and Agriculture, 14, 787-793.
Lombard, J.H. 1960. ‘n Ondersoek na die groei en ontwikkeling van Afrikaner- en Herefordosse. M.Sc.
Agric. Verhandeling. Universiteit van Pretoria. Suid Afrika.
Maki, M., Takano, E., Osawa, T., Ooi, T., Murachi, J. & Hatanaka, M. 1988. Analysis of structure-function
relationship of pig calpastatin by expression of mutated cDNAs in Escherichia coli. Journal of
Biological Chemistry, 263, 10254-10261.
Marsh, B.B and Leet, N.G. 1966. Studies in meat tenderness. III. The effects of cols shortening on
tenderness. Journal of Food Science, 31, 450-459.
Maule, J.P. 1973. The role of indigenous breeds for beef production in southern Africa. South African
Journal of Animal Science, 3, 11-15.
McCormick, R.J. 1994. The flexibility of the collagen compartment of muscle. Meat Science, 36, 79-91.
Miller, M.F., Carr, M.A., Ramsey, C.B., Crockett, K.L., Hoover, L.C. 2001. Consumer thresholds for
establishing the value of beef tenderness. Journal of Animal Science, 79, 3062-3068.
Monin, G. 1998. Recent methods for predicting quality of whole meat. Meat Science, 49, Supple, S231-243.
89

Morgan, J.B., Savell, J.W., Hale, D.S., Miller, R.K., Griffen, D.B., Cross, H.R., Shackelford, S.D. 1991.
National beef tenderness survey. Journal of Animal Science, 69, 3274-283.
Morgan, J.B., Wheeler, T.L., Koohmaraie, M., Savell, J.W., Crouse, J.D. 1993. Meat tenderness and the
calpain proteolytic system in longissimus muscle of young bulls. Journal of Animal Science, 71,
1471.
Morton, J.D., Bickerstaffe, R., Kent, M.P., Dransfield, E., Keeley, G.M. 1999. Calpain-calpastatin and
toughness in M. longissimus from electrically stimulated lamb and beef carcasses. Meat Science, 52,
71-79.
Nagainis, P.A., Sathe, S.K., Goll, D.E. & Edmunds, T. 1983. Autolysis of high-Ca2+ and low Ca2+-forms of
the Ca2+-dependant proteinases from bovine skeletal muscle. Federation Proceedings, 42, 1780.
Naudé, R.T. 1985. Biological effects on the quality of red meat with special reference to South African
conditions. South African Journal of Animal Science, 51, 109-115.
Naudé, R.T. and Boccard, R. 1973. Carcass and meat quality of Africaner and Jersey crossbred steers.
South African Journal of Animal Science, 3, 95.
O’Connor, S.F., Tatum, J.P., Wulf, D.M., Green, R.D., Smith, G.C. 1997. Genetic effects on beef tenderness
in Bos indicus composite and Bos taurus cattle. Journal of Animal Science, 75, 1822-1830.
Odeh, F.M.T. 2003. Quantitative inheritance of calpastatin activity as an assessment measure for meat
tenderness in Brahman steers. PhD dissertation. Louisiana State University.
Oliver, J. 1983. Beef cattle in Zimbabwe. Zimbabwe Journal of Agricultural Research, 21, 1-17.
Ouali, A. 1990. Meat tenderisation: Possible causes and mechanisms. A review: Journal of Muscle Foods, 1,
129-165.
Ouali, A. 1991. Sensory quality of meat as affected by muscle biochemistry and modern technologies. In
Animal Biotechnology and the Quality of Meat Production. Eds. Fiems, L.O., Cottyn, B.G. and
Demeyer, D.I. Elsevier Science Publishers B.V., Amsterdam: pp. 85-105.
90

Ouali, A., Herreia-Mendez, C.H., Coulis, G., Becila, S., Boudjellal, A., Aubry, L., Sentandreu, M.A. 2006.
Revisiting the conversion of muscle into meat and the underlying mechanisms. Meat Science, 74, 44-
58.
Page, B.T., Casas, E., Heaton, M.P., Cullen, N.G., Hyndman, D.L., Morris, C.A., Crawford, A.M., Wheeler,
T.L., Koohmaraie, M., Keele, J.W., Smith, T.P.L. 2002. Evaluation of single-nucleotide
polymorphism in CAPN1 for association with meat tenderness in cattle. Journal of Animal Science,
80, 3077-3085.
Page, B.T., Casas, E., Quaas, R.L., Thallman, R.M., Wheeler, T.L., Shackelford, S.D., Koohmaraie, M.,
White, S.N., Bennett, G.L., Keele, J.W., Dikeman, M.E., Smith, T.P.L. 2004. Association of markers
in the bovine CAPN1 gene with meat tenderness in large crossbred populations that sample
influential industry sires. Journal of Animal Science, 82, 3474-3481.
Palmer, B.R., Roberst, N., Hickford, J.G.H., Bickerstaffe, R. 1999. Rapid communication: PCR_RFLP for
Msp I and Nco I in the ovine calpastatin gene. Journal of Animal Science, 76, 1499-1500.
Payne, W.J.A. 1964. The origin of domestic cattle in Africa. Empire Journal of Experimental Agriculture,
32 (126), 97.
Payne, W.J.A. and Hodges, J. 1997. Tropical cattle. Ed. Editorial Offices: Oxford Ox2 OEL Osney Mead,
p.1. Blackwell Science Ltd. Oxford.
Pearson, A.M. 1986. Physical and biochemical changes occurring in muscle during storage and preservation.
In P.J. Bechtel (ed.) Orlando, Academic Press, Muscle as Food: pp. 103-134.
Penny, I.F. 1980. The enzymology of conditioning. In Developments in Meat Science. Vol.1. Ed.
R.A.Lawrie, Applied Science, Londen: pp. 115-143.
Penny, I.F., Etherington, D.J., Reeves, J.L., Taylor, M.A.J. 1984. The action of cathepsin L and Ca2+-
activated neutral proteases on myofibrillar proteins. Proc. 30th Eur. Meet. Meat Res. Work. Bristol:
133-134.
Pospiech, E., Grzes, B., Lyczynski, A., Borzuta, K., Szalata, M., Mikolajczak, B. 2003. Muscle proteins and
their changes in the process of meat tenderisation. Animal Science Papers and Reports. Vol. 21.
supplement 1: pp. 133-151. Institute of Genetics and Animal Breeding, Jastrzebiec, Poland.
91

Pringle, T.D., Williams, S.E., Lamb, B.S., Johnson, D.D., West, R.L. 1997. Carcass characteristics, the
calpain proteinase system, and aged tenderness of Angus and Brahman crossbred steers. Journal of
Animal Science, 75, 2955-2961.
Price, M.G. 1991. In “Advances in Structural Biology”, Vol. I., ed. By Melhorta, S.K.J. AI Press,
Greenwich, CT, pp. 175.
Purslow. P.P. 1999. The intramuscular connective tissue matrix and cell-matrix interactions in relation to
meat toughness. In: Proceedings of the 45th international congress of meat science and technology,
Yokohama, Japan: 210-219.
Purslow, P.P. 2005. Intramuscular connective tissue and its role in meat quality. Meat Science, 70, 435-447.
Ramsbottom, J.M., Strandine, E.J., Koonz, C.H. 1945. Comparative tenderness of representative beef
muscles. Food Research, 10, 497-511.
Rhee, M.S., Wheeler, T.L., Shackelford, S.D. Koohmaraie, M. 2004. Variation in palatability and
biochemical traits within and among eleven beef muscles. Journal of Animal Science, 85, 534-550.
Riley, D.G., Chase, C.C., Pringle, T.D., West, R.L., Johnson, D.D., Olson, T.A., Hammond, A.C., Coleman,
S.W. 2003. Effect of sire on µ- and m-calpain activity and rate of tenderisation as indicated by
myofibril fragmentation indices of steaks from Brahman cattle. Journal of Animal Science, 81, 2440-
2447.
Rivett, A.J. 1989. The multicatalytic proteinases. Multiple proteolytic activities. Journal of Biological
Chemistry, 264 (21), 12215-12219.
Robinson, D.L., Ferguson, D.M., Skerritt, J.W. 1998. Genetic parameters for beef tenderness, marbling and
yield. In: Proc. 6th World Cong. Genet. Appl. Livest. Prod. Armidale, New South Wales, 25:169-172.
Robson, R.M., Huiatt, T.W., Parrish, F.C. 1991. Biochemical and structural properties of titin, nebulin and
intermediate filaments in muscle. Muscle biochemistry, 44, 7-20.
Roncales, R., Geesink, G.H., Van Laack, R.L.J.M., Jaime, I., Beltran, J.A., Barnier, V.H.M., Smulders,
F.J.M. 1995. Meat tenderisation: enzymatic mechanims. In A. Ouali, D.J. De Meyer and F.J.M.
Smulders (Eds.), Expression of tissue proteinases and regulation of protein degradation as related to
Meat Quality: ECCEAMST: pp. 293.
92
Rowe, R.W.D. 1977. The effect of pre-rigor stretch and contraction on the post-rigor geometry of meat
samples in relation to meat toughness. Meat Science, 1, 205-218.
Sazili, A.Q., Lee, G.K., Parr, T., Sensky, P.L., Bardsley, R.G., Buttery, P.J. 2003. The effect of altered
growth rates on the calpain proteolytic system and meat tenderness in cattle. Meat Science, 66, 195-
201.
Scheepers, M. 1999. Effect of breed on the quality of beef. Master’s Degree in Home Economics. University
of Pretoria. South Africa.
Schenkel, F.S., Miller, S.P., Jiang, Z., Mandell, I.B., Ye, X., Li, H., Wilton, J.W. 2006. Association of a
single nucleotide polymorphism in the calpastatin gene with carcass and meat quality traits of beef
cattle. Journal of Animal Science, 84, 291-299.
Schoeman, S.J. 1989. Review: Recent research into production potential of indigenous cattle with specific
reference to Sanga. South African Journal of Animal Science, 19 (2), 55-61.
Scholttz, M.M. 1988. Selection possibilities of hardy beef breeds in Africa: The Nguni example. Proceedings
of the 3rd World Congress on Sheep and Beef cattle breeds. Paris, France, 2: 303-304.
Scholtz, M.M., Bergh, L., Bosman, D.J. 1999. Beef breeding in South Africa. Agricultural Research
Council-Animal Improvement Institute, Irene. South Africa
Seideman, S.C., Cross, H.R., Crouse, J.D. 1989. Variations in the sensory properties of beef as affected by
sex condition, muscle and post mortem ageing. Journal of Food Quality, 12, 39.
Sellier, P. 1994.The future role of molecular genetics in the control of meat production and meat quality.
Meat Science, 36, 29-44.
Shackelford, S.D., Koohmaraie, M., Cundiff, L.V., Gregory, K.E., Rohrer, G.A., Savell, J.W. 1994.
Heritabilities and phenotypic and genetic correlations for bovine post-rigor calpastatin activity, intra
muscular fat content, Warner-Bratzler shear force, retail product yield and growth rate. Journal of
Animal Science, 72, 857-863.
Shackelford, S.D., Koohmaraie, M., Miller, M.F., Crouse, J.D., Reagan, J.O. 1991. An evaluation of
tenderness of the longissimus muscle of Angus by Hereford versus Brahman crossbred heifers.
Journal of Animal Science, 69, 171.
93

Shackelford, S.D., Wheeler, T.L., Koohmaraie, M. 1995. Relationship between shear force and trained
sensory panel tenderness ratings of 10 major muscles from Bos indicus and Bos taurus cattle.
Journal of Animal Science, 73, 3333.
Sherbeck, J.A., Tatum, J.D., Field, T.G., Morgen, J.B., Smith, G.C. 1995. Feedlot performance, carcass traits
and palatability traits of the Hereford and Hereford x Brahman steers. Journal of Animal Science, 73,
3613-3620.
Silva, J.A., Patarata, L., Martins, C. 1999. Influence of ultimate pH on bovine meat tenderness during ageing.
Meat Science, 52, 453-459.
Smith, T.P.L., Casas, E., Rexroad, C.E., Kappes, S.M., Keele, J.W. 2000. Bovine CAPN1 maps to a region
of BTA 29 containing a quantitative trait locus for meat tenderness. Journal of Animal Science, 78,
2589-2594.
Smulders, F.J.M., Marsh, B.B., Swartz, D.R., Russel, R.L., Hoenecke, M.E. 1990. Beef tenderness and
sarcomere length. Meat Science, 28, 349-363.
Snedecor, G.W. and Cochran, W.G. 1980. Statistical Methods. Iowa state university press. U.S.A.
Sorimachi, H., Ishiura, S., Suzuki, K. 1989. Molecular cloning of a novel mammalian calcium dependant
protease distinct from both m- and µ-types. Journal of Biological Chemistry, 264, 20106-20111.
Sorimachi, H., Kinbara, K., Kimura, S., Takahashi, M., Ishiura, S., Sasagawa, N. 1995. Muscle specific
calpain, p94, responsible for limb girdle muscular dystrophy type 2A, associates with connectin
through IS2, a p94 specific sequence. Journal of Biological Chemistry, 270, 31158-31162.
Stone, R.T., Grosse, W.M., Casas, E., Smith, T.P.L., Keele, J.M., Bennett, G.L. 2002. Use of bovine EST
data and human genetic sequence to map 100 gene-specific bovine markers. Mammalian Genome,
13, 211-215.
Standine, E.J., Koonz, C.H., Ramsbottom, J.M. 1949. A study of variations in muscles of beef and chicken.
Journal of Animal Science, 8, 483-494.
Strydom, P.E. 1998. The characterisation of indigenous cattle in relation to production and product
characteristics. D.Sc. Thesis. University of the Orange Free State. South Africa.
94

Suzuki, K., Sorimachi, H., Yoshizawa, T., Kinbara, K., Ishiura, S. 1995. Calpain: Novel family m members,
activation, and physiological function. Biological Chemistry, 376, 523-529.
Suzuki, K., Tsuji, S., Ishiura, S., Kimura, Y., Kubota, S., Imahori, K. 1981. Autolysis of calcium-activated
neutral protease of chicken skeletal muscle. Journal of Biochemistry, 90, 1878-1793.
Swanepoel, J. 1988. Die karkas- en vleisgehalte-eienskappe van jong intensief-gevoerde Afrikaner-,
Nguni- en Pedibulle. M.Sc. Agric. Verhandeling. Universiteit van Pretoria. Suid-Afrika.
Takahashi, K. 1996. Structural weakening of skeletal muscle tissue during post mortem ageing of meat: the
non-enzymatic mechanism of meat tenderisation. Meat Science, 43, 67-80.
Taylor, R., Frylinck. L. 2003. Muscle structure, which determine meat tenderness in South African and other
beef breeds. Consistency of Quality: 11th International Meat Symposium: pp. 23-27.
Taylor, R.G., Geesink, G.H., Thompson, V.F., Koohmaraie, M., Goll, D.E. 1995. Is Z-disk degradation
responsible for post mortem tenderization. Journal of Animal Science, 73, 1351-1367.
Thompson, J. 2002. Managing meat tenderness. Meat Science, 62, 295-308.
Thornberg, E. 1996. Biophysical aspects of meat tenderness. Meat Science, 11, 207-225.
Valin, C. 1995. Animal and muscle variability in tenderisation: Possible causes. In A. Ouali, D.I. DeMeyer
and F.M. Smulders (Eds.), Expression of tissue and regulation of protein degradation as related to
meat quality. Utrecht, The Netherlands. ECCEAMST: pp. 435.
Van Marle-Köster, E. and Nel, L.H. 2003. Genetic markers and their application in livestock breeding in
South-Africa: A review. South African Journal of Animal Science, 33 (1), 1-10.
Vidalence, P., Cottin, P., Merdaci, N., Ducastaing, A. 1983. Stability of two Ca2+-dependent neutral
proteinases and their specific inhibitor during post mortem storage of rabbit skeletal muscle. Journal
of Food and Agriculture, 34 (11), 1241-1250.
Wang, K. and Wright, J. 1988. Architecture of the sarcomere matrix of skeletal muscle: Immunoelectron
microscopic evidence that suggest a set of parallel inextensible nebulin filaments anchored at the Z-
line. Journal Cell Biology, 107, 2199-2212.
95

Warkup, C., Marie, S., Harrington, G. 1995. Consumer perception of texture; the most important quality
attributes of meat? In Expression of tissue proteinases and regulation of protein degradation as
related to meat quality. Eds, Ouali, A., Demeyer, D.J., Smulders, F.J.M. ECCEAMST: pp. 225-237.
Warriss, P.D. 2000. Meat Science: An Introductory Text. CABI Publications, New York, USA: pp. 310.
Watanabe, A. and Devine, C. 1996. Effect of meat ultimate pH on rate of titin and nebulin degradation.
Meat Science, 44, 407-413.
Webb, N.B., Kahlenberg, O.J., Naumann, H.D. 1964. Factors influencing beef tenderness. Journal of Animal
Science, 23, 1027-1031.
Wheeler, T.L., Cundiff, L.V., Koch, R.M., Crouse, J.D. 1995. Characterization of biological types of cattle
(Cycle IV): Carcass traits and longissimus palatability. Journal of Animal Science, 74, 1023-1035.
Wheeler, T.L. and Koohmaraie, M. 1994. Pre-rigor and post-rigor changes in tenderness of ovine
longissimus muscle. Journal of Animal Science, 72, 1232-1236.
Wheeler, T.L., Vote, D., Leheska, J.M., Shackelford, S.D., Belk,K.E., Wulf, D.M., Gwartneys, B.L.,
Koohmaraie, M. 2002. The efficacy of three objective systems for identifying beef cuts that
can be guaranteed tender. Journal of Animal Science, 80, 3315-3327.
Whipple, G., Koohmaraie, M., Dikeman, M.E., Crouse, J.D. 1990b. Predicting beef longissimus tenderness
from various biochemical and histological muscle traits. Journal of Animal Science, 68, 4193-4199.
Whipple, G., Koohmaraie, M., Dikeman, M.E., Crouse, J.D., Hunt, M.C., Klemm, R.D. 1990a. Evaluation of
attributes that affect longissimus muscle tenderness in Bos taurus and Bos indicus cattle. Journal of
Animal Science, 68, 2716.
White, S.N., Casas, E., Wheeler, T.L., Shackelford, S.D., Koohmaraie, M., Riley, D.G., Chase, C.C.,
Johnson, D.D., Keele, J.W., Smith, T.P.L. 2005. A new single nucleotide polymorphism in CAPN1
extends the current tenderness marker test to include cattle of Bos indicus, Bos taurus, and crossbred
descent. Journal of Animal Science, 83, 2001-2008.
96

Wolfe, F.H., Sathe. S.K., Goll, D.E., Kleese, W.C., Edmunds, T., Duperret, S.M. 1989. Chicken skeletal
muscle has three Ca2+ -dependant proteinases. Biochimica et Biopysica Acta, 998, 236-250.
http://locus.jouy.inra.fr, INRA bovmap database. Accessed on 12 December 2006.
www.arigbsa.co.za, GeneStar®. Accessed on 21 January 2006.
www.geneticsolutions.com.au, Technical updates October 2006. Accessed on 7 May 2007.
97
Related Documents