Arch Toxicol (2011) 85:589–600 DOI 10.1007/s00204-011-0692-3 123 INORGANIC COMPOUNDS Reproductive toxicity parameters and biological monitoring in occupationally and environmentally boron-exposed persons in BandÂrma, Turkey YalçÂn Duydu · Nuroen Baoaran · Aylin Üstündaf · Sevtap AydÂn · Ülkü Ündefer · Osman Yavuz Ataman · Kaan Aydos · YalçÂn Düker · Katja Ickstadt · Britta Schulze Waltrup · Klaus Golka · Hermann M. Bolt Received: 19 February 2011 / Accepted: 1 March 2011 / Published online: 19 March 2011 © Springer-Verlag 2011 Abstract Boric acid and sodium borates have been considered as being “toxic to reproduction and develop- ment”, following results of animal studies with high doses. Experimentally, a NOAEL (no observed adverse eVect level) of 17.5 mg B/kg-bw/day has been identiWed for the (male) reproductive eVects of boron in a multigeneration study of rats, and a NOAEL for the developmental eVects in rats was identiWed at 9.6 mg B/kg-bw/day. These values are being taken as the basis of current EU safety assess- ments. The present study was conducted to investigate the reproductive eVects of boron exposure in workers employed in boric acid production plant in BandÂrma, Turkey. In order to characterize the external and internal boron exposures, boron was determined in biological sam- ples (blood, urine, semen), in workplace air, in food, and in water sources. Unfavorable eVects of boron exposure on the reproductive toxicity indicators (concentration, motility, morphology of the sperm cells and blood levels of follicle- stimulating hormone (FSH), luteinizing hormone (LH), and total testosterone) were not observed. The mean calculated daily boron exposure (DBE) of the highly exposed group was 14.45 § 6.57 (3.32–35.62) mg/day. These human exposures represent worst-case exposure conditions to boric acid/borates in Turkey. These exposure levels are considerably lower than exposures, which have previously led to reproductive eVects in experimental animals. In con- clusion, this means that dose levels of boron associated with developmental and reproductive toxic eVects in ani- mals are by far not reachable for humans under conditions of normal handling and use. Keywords Boron · Boric acid · Daily boron exposure · Reproductive toxicity · Semen · Biological monitoring Introduction Boron-based compounds have reached widespread indus- trial and commercial use, and the demand is increasing rap- idly. Turkey holds the world’s largest boron deposits and is one of the largest manufacturers of boric acid and sodium borates, world-wide. The boron industry is located in the South Marmara Region of Turkey. Occupational boron exposures are unavoidable for employees working in boron Electronic supplementary material The online version of this article (doi:10.1007/s00204-011-0692-3) contains supplementary material, which is available to authorized users. Y. Duydu (&) · A. Üstündaf Department of Toxicology, Faculty of Pharmacy, Ankara University, 06100 Tandofan, Ankara, Turkey e-mail: [email protected] N. Baoaran · S. AydÂn · Ü. Ündefer Department of Toxicology, Faculty of Pharmacy, Hacettepe University, 06100 SÂhhiye, Ankara, Turkey K. Aydos Department of Urology, Faculty of Medicine, Ankara University, 06100 Ankara, Turkey Y. Düker BandÂrma State Hospital, BandÂrma, Turkey K. Ickstadt · B. S. Waltrup Faculty of Statistics, TU Dortmund, 44221 Dortmund, Germany K. Golka · H. M. Bolt Leibniz Research Centre for Working Environment and Human Factors (IfADo), Ardeystr. 67, 44139 Dortmund, Germany O. Y. Ataman Department of Chemistry, Middle East Technical University, 06531 Ankara, Turkey

Welcome message from author
This document is posted to help you gain knowledge. Please leave a comment to let me know what you think about it! Share it to your friends and learn new things together.
Transcript
Arch Toxicol (2011) 85:589–600DOI 10.1007/s00204-011-0692-3
123
INORGANIC COMPOUNDS
Reproductive toxicity parameters and biological monitoring in occupationally and environmentally boron-exposed persons in BandÂrma, Turkey
YalçÂn Duydu · Nuroen Baoaran · Aylin Üstündaf · Sevtap AydÂn · Ülkü Ündefer · Osman Yavuz Ataman · Kaan Aydos · YalçÂn Düker · Katja Ickstadt · Britta Schulze Waltrup · Klaus Golka · Hermann M. Bolt
Received: 19 February 2011 / Accepted: 1 March 2011 / Published online: 19 March 2011© Springer-Verlag 2011
Abstract Boric acid and sodium borates have beenconsidered as being “toxic to reproduction and develop-ment”, following results of animal studies with high doses.Experimentally, a NOAEL (no observed adverse eVectlevel) of 17.5 mg B/kg-bw/day has been identiWed for the(male) reproductive eVects of boron in a multigenerationstudy of rats, and a NOAEL for the developmental eVectsin rats was identiWed at 9.6 mg B/kg-bw/day. These valuesare being taken as the basis of current EU safety assess-
ments. The present study was conducted to investigate thereproductive eVects of boron exposure in workersemployed in boric acid production plant in BandÂrma,Turkey. In order to characterize the external and internalboron exposures, boron was determined in biological sam-ples (blood, urine, semen), in workplace air, in food, and inwater sources. Unfavorable eVects of boron exposure on thereproductive toxicity indicators (concentration, motility,morphology of the sperm cells and blood levels of follicle-stimulating hormone (FSH), luteinizing hormone (LH), andtotal testosterone) were not observed. The mean calculateddaily boron exposure (DBE) of the highly exposed groupwas 14.45 § 6.57 (3.32–35.62) mg/day. These humanexposures represent worst-case exposure conditions toboric acid/borates in Turkey. These exposure levels areconsiderably lower than exposures, which have previouslyled to reproductive eVects in experimental animals. In con-clusion, this means that dose levels of boron associatedwith developmental and reproductive toxic eVects in ani-mals are by far not reachable for humans under conditionsof normal handling and use.
Keywords Boron · Boric acid · Daily boron exposure · Reproductive toxicity · Semen · Biological monitoring
Introduction
Boron-based compounds have reached widespread indus-trial and commercial use, and the demand is increasing rap-idly. Turkey holds the world’s largest boron deposits and isone of the largest manufacturers of boric acid and sodiumborates, world-wide. The boron industry is located in theSouth Marmara Region of Turkey. Occupational boronexposures are unavoidable for employees working in boron
Electronic supplementary material The online version of this article (doi:10.1007/s00204-011-0692-3) contains supplementary material, which is available to authorized users.
Y. Duydu (&) · A. Üstündaf
Department of Toxicology, Faculty of Pharmacy, Ankara University, 06100 Tandofan, Ankara, Turkeye-mail: [email protected]
N. Baoaran · S. AydÂn · Ü. ÜndeferDepartment of Toxicology, Faculty of Pharmacy, Hacettepe University, 06100 SÂhhiye, Ankara, Turkey
K. AydosDepartment of Urology, Faculty of Medicine, Ankara University, 06100 Ankara, Turkey
Y. DükerBandÂrma State Hospital, BandÂrma, Turkey
K. Ickstadt · B. S. WaltrupFaculty of Statistics, TU Dortmund, 44221 Dortmund, Germany
K. Golka · H. M. BoltLeibniz Research Centre for Working Environment and Human Factors (IfADo), Ardeystr. 67, 44139 Dortmund, Germany
O. Y. AtamanDepartment of Chemistry, Middle East Technical University, 06531 Ankara, Turkey
590 Arch Toxicol (2011) 85:589–600
123
mining areas and in processing plants. Because of mattersof geology, boron concentrations in the drinking water maybe very high in residential areas close to mining areas. Forinstance, Sayli et al. (1998) have reported boron concentra-tions between 8.50 and 29.00 mg/L in the drinking water ofsome villages in the vicinity of Bigadiç, Turkey. Peopleliving in such boron-rich areas have been exposed to highamounts of boron for many years. Therefore, the determi-nation of a safe daily boron intake level is of great impor-tance for public health (Degen and Hengstler 2008).
Boron has recently been addressed to be an importantnutrient in humans (Deviran and Volpe 2003; Nielsen2008). A Tolerable Daily Intake (TDI) for humans waspreviously evaluated by WHO to be 0.4 mg/kg (IPCS 1998),in accordance with an earlier risk assessment of Murray(1995). Boron is an essential element for plants, and there isgrowing evidence that it is also essential for humans. Boronappears to be required for bone and joint functions, possi-bly via eVects on the balance and absorption of calcium,magnesium, and phosphorus (McCoy et al. 1994). A borondeWciency may aVect calcium and magnesium metabolism,inXuencing the composition, structure, and strength of thebone, and Wnally leading to changes similar to osteoporosis(Nielsen 1994).
Recommended daily intake levels have not been estab-lished for boron. However, based on adverse eVects noted inanimal studies, safe boron intake levels were evaluated byinternational organizations and oYcial bodies such as IEHR,ECETOC, IPCS, WHO, NAS FNB, UK EVM, USEPA(Murray and Schlekat 2004, Jensen 2009). Although a com-mon NOAEL (9.6 mg B/kg/day) was used as point of depar-ture in the current health risk assessments of boron, theWnally calculated safe daily boron intake values (0.16–0.4 mg B/kg-bw) show considerable variability (Murray andSchlekat 2004, Jensen 2009). This is mainly due to thechoice of diVerent chemical-speciWc adjustment factors.Therefore, the recommended safe daily boron intake valuesare not fully compatible internationally (Murray and Schle-kat 2004). Recent epidemiological studies have providedadditional data for the risk assessment of boron and for theevaluation of safe boron levels in humans (Yazbeck et al.2005, Xing et al. 2008). Available epidemiological studies,notably from China, show that boron exposures had noadverse eVect on reproductive toxicity biomarkers in occu-pationally boron-exposed workers (Xing et al. 2008,Robbins et al. 2010). These studies are consistent with, andsupported by, the studies on environmentally exposed popu-lations (Sayli et al. 1998, Sayli 1998, 2001, 2003).
The present study has been conducted to provide anindependent data set concerning a possible relationshipbetween chronic boron intake and reproductive toxicityoutcomes in male workers, which is a major issue ofcurrent regulatory concern (ECHA 2008).
Materials and Methods
The project plan was reviewed by Ankara University andHacettepe University, Ankara, Turkey, and was Wnallyapproved by the Ethics Committee of the School of Medi-cine, Hacettepe University, (HEK 08/167, 22.10.2008). Allstudy subjects gave their informed consent prior to partici-pation in the project.
Description of the study area
The study was conducted at the Boric Acid Plant,BandÂrma, Turkey. BandÂrma is located at the south coastof the Marmara Sea, distant from the boron mining areas.The BandÂrma district serves as a production and exporta-tion zone for boric acid and sodium borates. The boric acidproduction zone was the main study area of the present pro-ject. Boron-exposed workers and most of the control work-ers were recruited from this zone (Fig. 1). In addition, 28control workers were from a sulfuric acid production plantlocated at the Marmara Sea. All workers from the boricacid/borax and sulfuric acid production plants worked forthe same mining company. Therefore, the same shift scheduleapplied to all workers. Production continued 24 h per dayand 7 days per week in both the boric acid and sulfuric acidplants. For the entire workforce, lunch and dinner wasprovided by the central cafeteria located in the boric acidproduction zone. Breakfast was not available in this centralcafeteria. The meals (lunch and dinner) prepared in thecentral cafeteria were also transported to the sulfuric acidproduction plant, the route is indicated in map II of Fig. 1.Therefore, the sulfuric acid plant workers had been eatingthe same meals for lunch and dinner as the boric acidproduction workers.
Description of the cohort
All workers, wishing to participate, were enrolled. Theyagreed to provide the biological samples and to complete aquestionnaire with demographic, exposure, reproductive andgeneral health information. The total number of workers(male) working in production of boron products was 428.One hundred and two of them participated in the study. Theoccupationally exposed workers consisted of boric acid[B(OH)3] production workers (n = 57), borax [Na2B4O7·10H2O] production workers (n = 31), “sodium perborate”production unit workers (n = 5), boric acid plus borax pro-duction workers [mixed area] (n = 5), laboratory workers(n = 2), a storage worker (n = 1), and a mechanic technician(n = 1). Actually, the sodium perborate production had beenceased in this plant 4 years ago. After technical adaptations,the sodium perborate production unit had been transformedinto a borax production unit. Therefore, it was borax that
Arch Toxicol (2011) 85:589–600 591
123
was actually produced in this unit. Nevertheless, the tradi-tional name of this transformed production unit had not beenchanged. In the packaging unit, workers were working foran independent contractor. These were seasonal workers,which were replaced every 3 months. These workers werenot under the responsibility of the mining company. There-fore, they were not included in the study.
The total number of workers (male) working in the samezone, but outside of the production area of boron productsand not occupationally exposed to boron, was 432. Onehundred and two of them participated in the study as thecontrol workers. These workers consisted of sulfuric acidworkers (n = 28), steam power plant workers (n = 17),energy suppliers (n = 11), workers in mechanical workshop(n = 19), garage, and steelyard workers (n = 16), deminer-alized water production (DWP) workers (n = 2), construc-tion workers (n = 3), laboratory technicians (n = 3), andoYcers (n = 3).
Biological sampling
Urine, blood, and semen samples were obtained from bothoccupationally boron-exposed and control workers. Thedetails of specimen collection and of the analytical methodsare given in the Electronic Supplementary Material (AnnexI).
BrieXy, post-shift urine samples were collected in poly-propylene containers and kept at ¡20°C until urine andcreatinine analysis. Blood was collected by venipuncture insuitable blood collection tubes. One tube was left to deter-mine the boron concentrations in blood samples. The tubes
containing clot activator (BD vacutainer, SST II Plus plas-tic tubes) were sent immediately to the BandÂrma StateHospital for the determination of follicle-stimulating hor-mone (FSH), luteinizing hormone (LH), total testosterone,and prostate-speciWc antigen (PSA) levels. These parame-ters were determined using an Immulite 2000 ImmunoassayAnalyzer. Semen samples were collected in accordancewith the recommendations of the World Health Organiza-tion (WHO 2003). The workers were informed about theimportance of an abstinence for at least 48 h (but no longerthan 7 days) prior to providing the semen samples. Spermconcentration and motility parameters were determined byusing SQA-V Gold Sperm Quality Analyzer. Additionallysperm morphology was also analyzed as per the Kruger’sstrict criteria (Kruger et al. 1986, 1988) by one experiencedtechnician at the Research Center on Fertility, School ofMedicine, University of Ankara.
Air, water, and food sampling
Personal air monitoring was performed using a personal airsampler (SKC, AirCheck 2000) for the exposed workersworking in boric acid and borax production. The Xow ratewas 2 L/min, and the sampling time was 8 h. Low-ash PVCWlters (SKC, 5 �m, 37 mm, pre-weighed) and SureSealcassettes (SKC, 37 mm) were used in a closed-faced man-ner to assess the inhalable dust. The above-mentioned per-sonal sampling devices and Wlters were also used for themeasurement of the inhalable dust at the workplace (staticsampling) of the control workers. The static samplingpoints are shown in map I and II of Fig. 1.
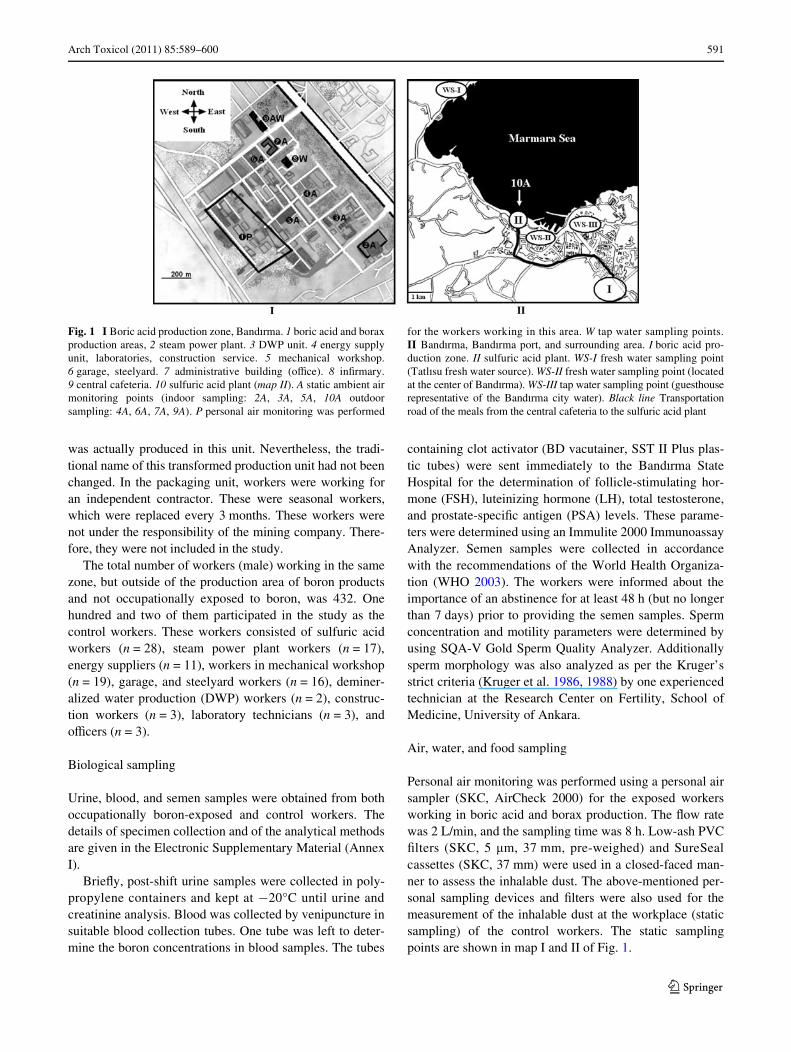
Fig. 1 I Boric acid production zone, BandÂrma. 1 boric acid and boraxproduction areas, 2 steam power plant. 3 DWP unit. 4 energy supplyunit, laboratories, construction service. 5 mechanical workshop.6 garage, steelyard. 7 administrative building (oYce). 8 inWrmary.9 central cafeteria. 10 sulfuric acid plant (map II). A static ambient airmonitoring points (indoor sampling: 2A, 3A, 5A, 10A outdoorsampling: 4A, 6A, 7A, 9A). P personal air monitoring was performed
for the workers working in this area. W tap water sampling points.II BandÂrma, BandÂrma port, and surrounding area. I boric acid pro-duction zone. II sulfuric acid plant. WS-I fresh water sampling point(TatlÂsu fresh water source). WS-II fresh water sampling point (locatedat the center of BandÂrma). WS-III tap water sampling point (guesthouserepresentative of the BandÂrma city water). Black line Transportationroad of the meals from the central cafeteria to the sulfuric acid plant
592 Arch Toxicol (2011) 85:589–600
123
Boron concentrations in the main water sources of theBandÂrma city were determined to assess the possible con-tribution of drinking water to the daily boron exposure.Fresh water samples from TatlÂsu (a village in the vicinityof BandÂrma), fresh water from BandÂrma (city center), andBandÂrma city water (tap water) were taken to determinethe boron concentrations. Tap water samples were alsotaken from the central cafeteria and the inWrmary located inthe boric acid production zone. The water sampling pointsare shown in map I and II of Fig. 1. Boron concentrationsdetermined in these water samples are shown in Table 1.
Food samples were taken from the central cafeterialocated at the boric acid production zone. All common foodtypes in the central cafeteria were sampled and analyzed.The boron concentrations determined in air, water, andfoods were used to calculate the daily boron exposure(DBE) levels for the workers. The boron concentrations insampled air and foods and the details about the calculationmethodology of the DBE levels of the workers weredescribed in the Electronic Supplementary Material (AnnexII).
Boron analysis
Blood, semen, and food samples were analyzed by Induc-tively Coupled Plasma Mass Spectrometry (ICP-MS) witha Xow injection system. Urine, dust, and water sampleswere analyzed by Inductively Coupled Plasma OpticalEmission Spectrometry (ICP-OES). Standard referencematerials were used for quality control. The details of themethod are described in the Electronic SupplementaryMaterial (Annex I).
Statistical analysis
The data are presented separately for the four re-constitutedgroups (Table 2) and are summarized by the mean, theempirical standard deviation, and the range. Moreover,boxplots, Pearson’s correlation coeYcient and linearregressions as shown in Figs. 2 and 3 display the empiricaldistributions and possible linear dependencies.
In order to investigate the global hypotheses that themeans of the four groups are equal, a Kruskal–Wallis testwas used for all variables in Tables 3, 4, 5, 6, 7, and 8except for the categorical variables pH and cytoplasmicdroplets. If the resulting P value was signiWcant (P < 0.05),i.e., if the hypothesis of equal group means was rejected,the two-sided Mann–Whitney U test was applied to Wnddistinct diVerences between each of the pairs of groups. Thecorresponding six P values were adjusted with the Bonfer-roni-Holm method for each variable in order to account forthe problem of multiple testing (Holm 1979). Thesenonparametric tests were deliberately used as some of thevariables show outliers. The dependence of the groups andthe categorical variables (pH and cytoplasmic droplets)were analyzed with Fisher’s exact test. All statistical testswere performed with R, a language and environment forstatistical computing, version 2.11.1 (R Development CoreTeam 2010). The local as well as the multiple signiWcancelevels of the tests were set at 0.05. For theoretical details onthe nonparametric Kruskal–Wallis and Mann–Whitney Utests as well as Fisher’s exact test, see Conover (1999).
Results
The results of the present study represent the situation ofboron exposure of workers working in the BandÂrma boricacid production zone and sulfuric acid plant in 2009(Fig. 1). When planning the study, the workers from theproduction area of boric acid and borax were addressed as“exposed workers”. The “control workers”, not occupation-ally exposed to boron, consisted of workers from the neigh-boring sulfuric acid plant, steam power plant, energysupply unit, demineralized water production unit (DWP),mechanical workshop, garage, steelyard, construction ser-vice, laboratory, and oYce. The locations of these workingunits and plants are shown in Fig. 1.
According to the preliminary results of this study, boronconcentration was lower than the limit of quantiWcation(LOQ) in BandÂrma City and fresh water sources (Table 1).The water used in the boric acid production area was sup-plied by the BandÂrma municipality, therefore representing
Table 1 Boron concentrations in water samples
LOQ Limit of quantiWcation, LOQ (for boron in water): 0.08 mg/L
Food and water samples mg boron/L
Central cafeteria 9.47 § 0.18
InWrmary 9.54 § 0.28
TatlÂsu fresh water source (WS-I) <LOQ
Fresh water source of BandÂrma (WS-II) <LOQ
Tap water in BandÂrma (WS-III) <LOQ
Table 2 Re-constituted control, low, medium, and high-exposuregroups
LOQ Limit of quantiWcation, LOQ (for boron in blood): 48.5 ng/g
Exposure groups n (204) Re-classiWcation (ng boron/g blood)
Control group 49 <LOQ (48.5)
Low exposure group 72 >LOQ–100
Medium exposure group 44 >100–150
High-exposure group 39 >150
Arch Toxicol (2011) 85:589–600 593
123
the BandÂrma City water. The surprising result of thisinvestigation was that high concentrations of boron werepresent in the tap water taken from the central cafeteria(9.47 mg/L) and the inWrmary (9.54 mg/L), both locatedclose to the boric acid production area (Fig. 1, Table 1).The high boron concentration in water obviously reXectedan environmental contamination within the boric acid pro-duction zone. Therefore, there was both occupational andenvironmental boron exposure of the workers assigned tothe occupationally exposed group. More importantly, unex-pected environmental boron exposure occurred also for thecontrol workers (not occupationally exposed) through thecafeteria’s water and meals (lunch/dinner). The workersemployed in the sulfuric acid plant (initially assigned as theremote control group) were also exposed to certain amountsof boron by lunch (Fig. 1). Therefore, all participatingworkers were re-classiWed both according to their calcu-lated daily boron exposure levels and to the blood boronlevels.
The mean DBE, blood, urine, and semen boron levels ofthe original control (n = 102) and exposed group (n = 102)are presented in the Electronic Supplementary Material(Annex I). The biological outcomes versus increasingcalculated daily boron exposure levels were also evaluatedand are comprehensively compiled in the Electronic Sup-plementary Material (Annex II). The biological outcomesof the re-classiWed workers versus the blood boron levelsare evaluated in this main part of the report.
Blood boron levels reported in the earlier epidemiologi-cal studies were taken into consideration when re-constitut-ing the low, medium, and high-exposure groups (Yazbecket al. 2005, Xing et al. 2008). Workers with blood boronconcentrations lower than the limit of quantiWcation (LOQ)of the method (48.5 ng/g) were re-assigned as the controlworkers. The re-constituted control and exposure groupsare shown in Table 2.
The mean ages of the re-constituted exposure groups arestatistically not diVerent (P > 0.05) from the mean age of
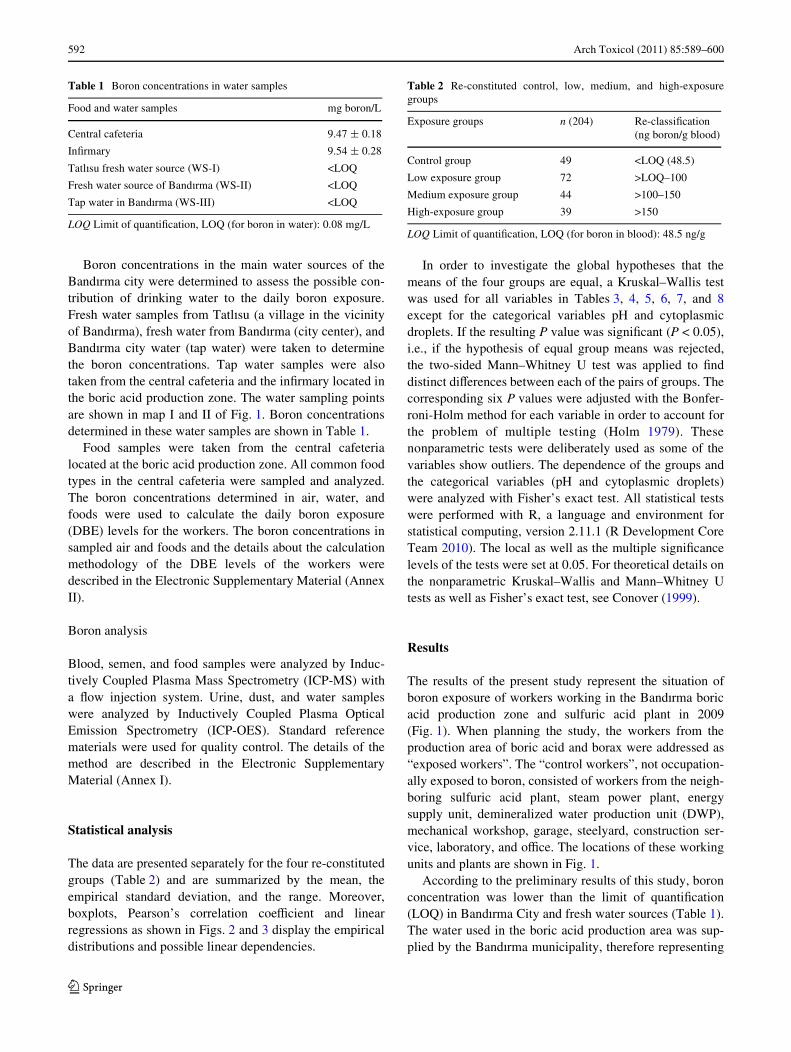
Fig. 2 Calculated daily boron exposure (DBE), urine boron, and semenboron levels versus increasing blood boron levels. Box plot graphs;Chart A and B The mean DBE levels and the mean urine boron levelsin low, medium, and high-exposure groups were signiWcantly higherthan the control (P < 0.05). Chart C The mean semen concentrationsin medium and high-exposure groups were signiWcantly higher than thecontrol group (P < 0.05). Scatter plot graphs; Linear regression with
95% individual prediction interval. Chart I and II Blood boron levelsshow a reasonably high correlation with the calculated DBE levels(Pearson’s corr. coeV.: 0.635) and urine boron levels (Pearson’s corr.coeV.: 0.633) in workers. Chart III The correlation between bloodboron concentration and semen boron concentration is weak (Pearson’scorr. coef.: 0.222)
Chart A
HighMediumLowControl
Dai
ly b
oron
exp
osur
e, m
g/da
y
40
30
20
10
0
Chart B
HighMediumLowControlU
rine
boro
n, m
g/g
crea
t.
40
30
20
10
0
Chart C
HighMediumLowControl
Sem
en b
oron
, ng/
g
10000
8000
6000
4000
2000
0
Chart IDBE=4,19+0,05xblood boron
Pearson corr. coeff.: 0,635
Blood boron, ng/g
0,00
10,00
20,00
30,00
Dai
ly b
oro
n e
xpo
sure
(D
BE
), m
g/d
ay
Chart IIUrine boron=2,6+0,03xblood boron
Pearson corr. coeff.: 0,633
Blood boron, ng/g
0,00
10,00
20,00
30,00
Uri
ne
bo
ron
, mg
/g c
reat
.
Chart: IIISemen bor.=819,53+5,51xbloodboron
Pearson corr. coeff.: 0,222
0,00 100,00 200,00 300,00 400,00 0,00 100,00 200,00 300,00 400,00 0,00 100,00 200,00 300,00 400,00
Blood boron, ng/g
-2000,00
0,00
2000,00
4000,00
6000,00
8000,00
Sem
en b
oro
n, n
g/g
594 Arch Toxicol (2011) 85:589–600
123
the control group as shown in Table 3. The calculated meanDBE and mean urine boron concentrations of the workersin the low, medium, and high exposed groups are signiW-cantly higher (P < 0.05) than those of the control group.The signiWcant increase of calculated DBE levels and urineboron concentrations versus increasing blood boron levelsare presented in the related box plots and scatter plots ofFig. 2. Blood boron concentrations of the workers are cor-related with the calculated DBE levels (Pearson corr. coeV.:0.635) and urine boron concentrations (Pearson corr. coeV.:0.633).
The mean semen boron concentrations of the exposedgroups were also signiWcantly higher (P < 0.05) than thecontrol group (Table 3). However, the increase of the meansemen boron concentrations was not signiWcant (P > 0.05)throughout the exposure groups. The correlation betweensemen boron concentrations and blood boron concentra-tions was very low (Pearson corr. coeV.: 0.222) (Fig. 2).
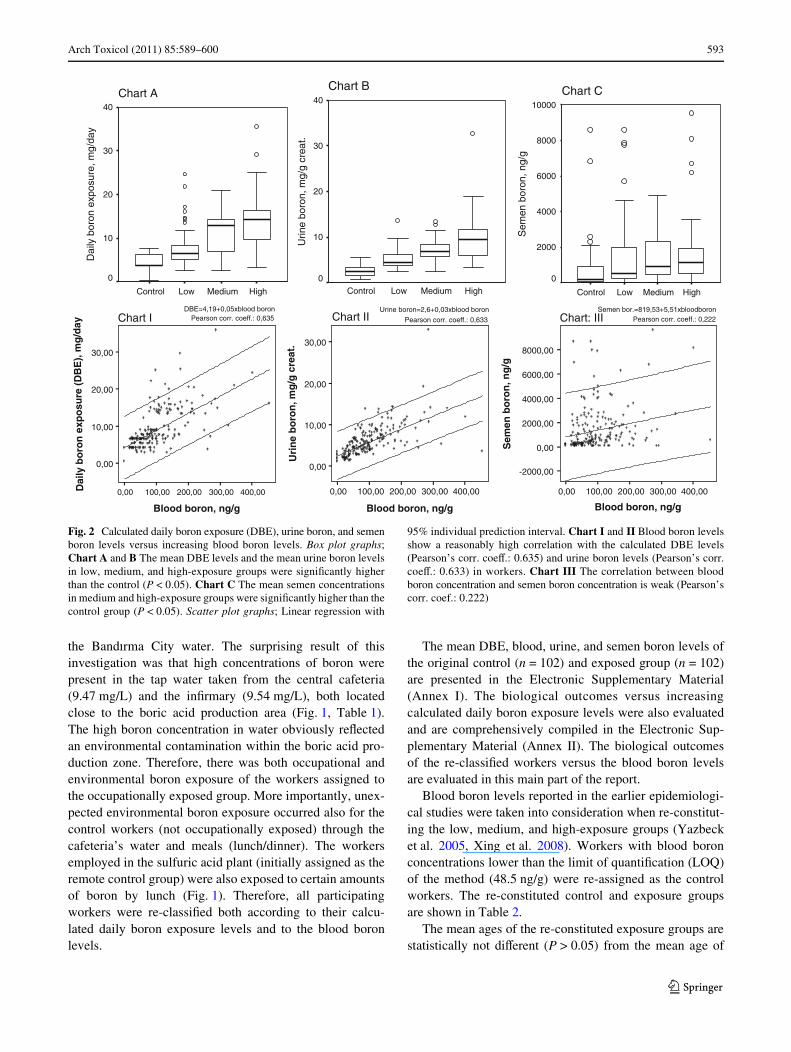
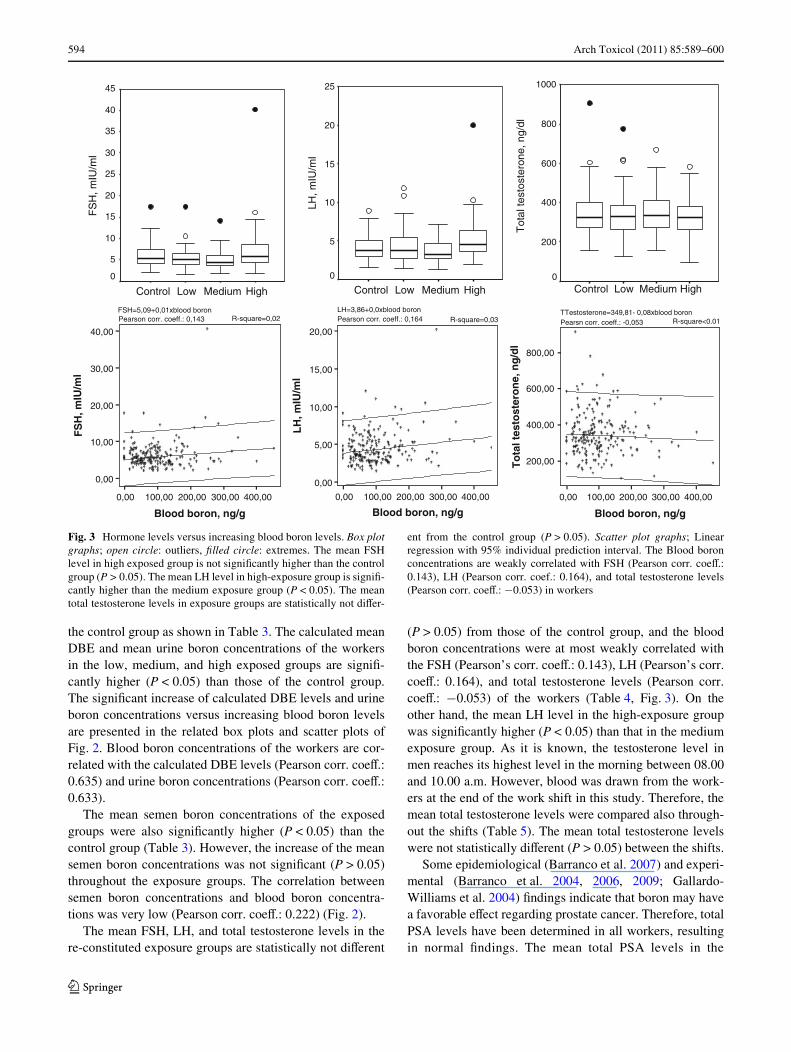
The mean FSH, LH, and total testosterone levels in there-constituted exposure groups are statistically not diVerent
(P > 0.05) from those of the control group, and the bloodboron concentrations were at most weakly correlated withthe FSH (Pearson’s corr. coeV.: 0.143), LH (Pearson’s corr.coeV.: 0.164), and total testosterone levels (Pearson corr.coeV.: ¡0.053) of the workers (Table 4, Fig. 3). On theother hand, the mean LH level in the high-exposure groupwas signiWcantly higher (P < 0.05) than that in the mediumexposure group. As it is known, the testosterone level inmen reaches its highest level in the morning between 08.00and 10.00 a.m. However, blood was drawn from the work-ers at the end of the work shift in this study. Therefore, themean total testosterone levels were compared also through-out the shifts (Table 5). The mean total testosterone levelswere not statistically diVerent (P > 0.05) between the shifts.
Some epidemiological (Barranco et al. 2007) and experi-mental (Barranco et al. 2004, 2006, 2009; Gallardo-Williams et al. 2004) Wndings indicate that boron may havea favorable eVect regarding prostate cancer. Therefore, totalPSA levels have been determined in all workers, resultingin normal Wndings. The mean total PSA levels in the
Fig. 3 Hormone levels versus increasing blood boron levels. Box plotgraphs; open circle: outliers, Wlled circle: extremes. The mean FSHlevel in high exposed group is not signiWcantly higher than the controlgroup (P > 0.05). The mean LH level in high-exposure group is signiW-cantly higher than the medium exposure group (P < 0.05). The meantotal testosterone levels in exposure groups are statistically not diVer-
ent from the control group (P > 0.05). Scatter plot graphs; Linearregression with 95% individual prediction interval. The Blood boronconcentrations are weakly correlated with FSH (Pearson corr. coeV.:0.143), LH (Pearson corr. coef.: 0.164), and total testosterone levels(Pearson corr. coeV.: ¡0.053) in workers
HighMediumLowControl
FS
H, m
IU/m
l45
40
35
30
25
20
15
10
5
0
HighMediumLowControl
LH, m
IU/m
l
25
20
15
10
5
0
HighMediumLowControl
Tot
al te
stos
tero
ne, n
g/dl
1000
800
600
400
200
0
FSH=5,09+0,01xblood boronR-square=0,02Pearson corr. coeff.: 0,143
Blood boron, ng/g
0,00
10,00
20,00
30,00
40,00
FS
H, m
IU/m
l
Blood boron, ng/g
0,00
5,00
10,00
15,00
20,00
LH
, mIU
/ml
LH=3,86+0,0xblood boronR-square=0,03Pearson corr. coeff.: 0,164
TTestosterone=349,81- 0,08xblood boronPearsn corr. coeff.: -0,053 R-square<0.01
0,00 100,00 200,00 300,00 400,00 0,00 100,00 200,00 300,00 400,00 0,00 100,00 200,00 300,00 400,00
Blood boron, ng/g
200,00
400,00
600,00
800,00
To
tal t
esto
ster
on
e, n
g/d
l
Arch Toxicol (2011) 85:589–600 595
123
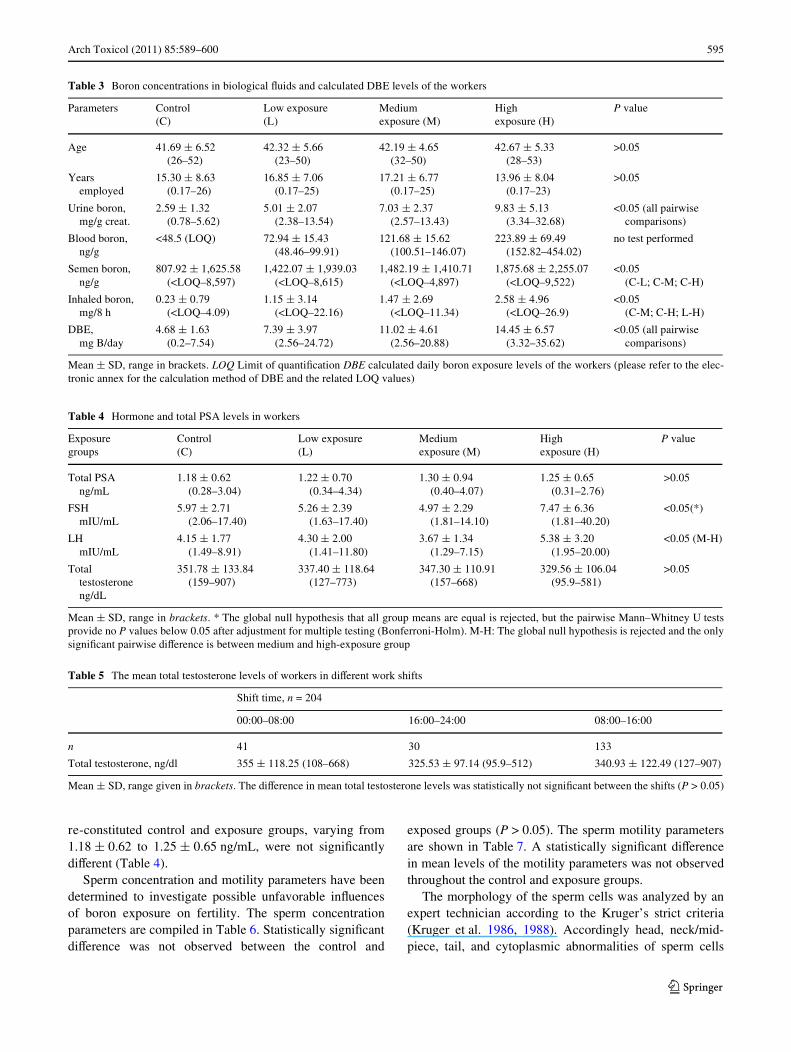
re-constituted control and exposure groups, varying from1.18 § 0.62 to 1.25 § 0.65 ng/mL, were not signiWcantlydiVerent (Table 4).
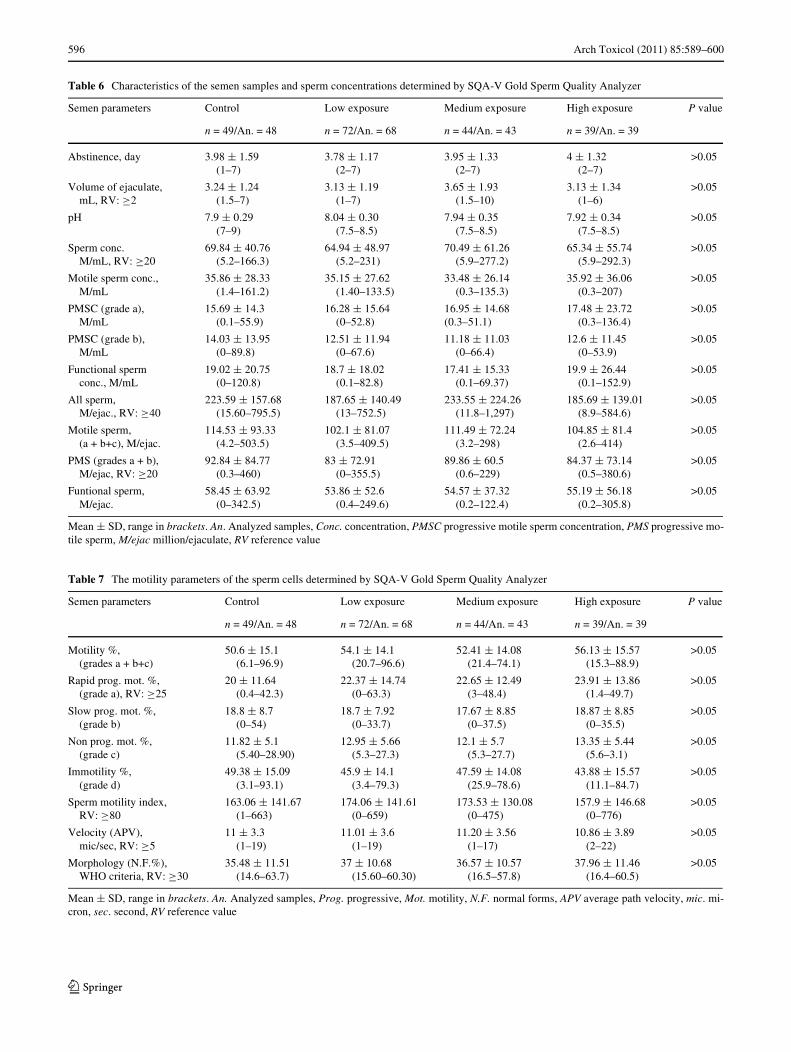
Sperm concentration and motility parameters have beendetermined to investigate possible unfavorable inXuencesof boron exposure on fertility. The sperm concentrationparameters are compiled in Table 6. Statistically signiWcantdiVerence was not observed between the control and
exposed groups (P > 0.05). The sperm motility parametersare shown in Table 7. A statistically signiWcant diVerencein mean levels of the motility parameters was not observedthroughout the control and exposure groups.
The morphology of the sperm cells was analyzed by anexpert technician according to the Kruger’s strict criteria(Kruger et al. 1986, 1988). Accordingly head, neck/mid-piece, tail, and cytoplasmic abnormalities of sperm cells
Table 3 Boron concentrations in biological Xuids and calculated DBE levels of the workers
Mean § SD, range in brackets. LOQ Limit of quantiWcation DBE calculated daily boron exposure levels of the workers (please refer to the elec-tronic annex for the calculation method of DBE and the related LOQ values)
Parameters Control (C)
Low exposure (L)
Medium exposure (M)
High exposure (H)
P value
Age 41.69 § 6.52 (26–52)
42.32 § 5.66 (23–50)
42.19 § 4.65 (32–50)
42.67 § 5.33 (28–53)
>0.05
Years employed
15.30 § 8.63 (0.17–26)
16.85 § 7.06 (0.17–25)
17.21 § 6.77 (0.17–25)
13.96 § 8.04 (0.17–23)
>0.05
Urine boron, mg/g creat.
2.59 § 1.32 (0.78–5.62)
5.01 § 2.07 (2.38–13.54)
7.03 § 2.37 (2.57–13.43)
9.83 § 5.13 (3.34–32.68)
<0.05 (all pairwise comparisons)
Blood boron, ng/g
<48.5 (LOQ) 72.94 § 15.43 (48.46–99.91)
121.68 § 15.62 (100.51–146.07)
223.89 § 69.49 (152.82–454.02)
no test performed
Semen boron, ng/g
807.92 § 1,625.58 (<LOQ–8,597)
1,422.07 § 1,939.03 (<LOQ–8,615)
1,482.19 § 1,410.71 (<LOQ–4,897)
1,875.68 § 2,255.07 (<LOQ–9,522)
<0.05 (C-L; C-M; C-H)
Inhaled boron, mg/8 h
0.23 § 0.79 (<LOQ–4.09)
1.15 § 3.14 (<LOQ–22.16)
1.47 § 2.69 (<LOQ–11.34)
2.58 § 4.96 (<LOQ–26.9)
<0.05 (C-M; C-H; L-H)
DBE, mg B/day
4.68 § 1.63 (0.2–7.54)
7.39 § 3.97 (2.56–24.72)
11.02 § 4.61 (2.56–20.88)
14.45 § 6.57 (3.32–35.62)
<0.05 (all pairwise comparisons)
Table 4 Hormone and total PSA levels in workers
Mean § SD, range in brackets. * The global null hypothesis that all group means are equal is rejected, but the pairwise Mann–Whitney U testsprovide no P values below 0.05 after adjustment for multiple testing (Bonferroni-Holm). M-H: The global null hypothesis is rejected and the onlysigniWcant pairwise diVerence is between medium and high-exposure group
Exposure groups
Control (C)
Low exposure (L)
Medium exposure (M)
High exposure (H)
P value
Total PSA ng/mL
1.18 § 0.62 (0.28–3.04)
1.22 § 0.70 (0.34–4.34)
1.30 § 0.94 (0.40–4.07)
1.25 § 0.65 (0.31–2.76)
>0.05
FSH mIU/mL
5.97 § 2.71 (2.06–17.40)
5.26 § 2.39 (1.63–17.40)
4.97 § 2.29 (1.81–14.10)
7.47 § 6.36 (1.81–40.20)
<0.05(*)
LH mIU/mL
4.15 § 1.77 (1.49–8.91)
4.30 § 2.00 (1.41–11.80)
3.67 § 1.34 (1.29–7.15)
5.38 § 3.20 (1.95–20.00)
<0.05 (M-H)
Total testosterone ng/dL
351.78 § 133.84 (159–907)
337.40 § 118.64 (127–773)
347.30 § 110.91 (157–668)
329.56 § 106.04 (95.9–581)
>0.05
Table 5 The mean total testosterone levels of workers in diVerent work shifts
Mean § SD, range given in brackets. The diVerence in mean total testosterone levels was statistically not signiWcant between the shifts (P > 0.05)
Shift time, n = 204
00:00–08:00 16:00–24:00 08:00–16:00
n 41 30 133
Total testosterone, ng/dl 355 § 118.25 (108–668) 325.53 § 97.14 (95.9–512) 340.93 § 122.49 (127–907)
596 Arch Toxicol (2011) 85:589–600
123
Table 6 Characteristics of the semen samples and sperm concentrations determined by SQA-V Gold Sperm Quality Analyzer
Mean § SD, range in brackets. An. Analyzed samples, Conc. concentration, PMSC progressive motile sperm concentration, PMS progressive mo-tile sperm, M/ejac million/ejaculate, RV reference value
Semen parameters Control Low exposure Medium exposure High exposure P value
n = 49/An. = 48 n = 72/An. = 68 n = 44/An. = 43 n = 39/An. = 39
Abstinence, day 3.98 § 1.59 (1–7)
3.78 § 1.17 (2–7)
3.95 § 1.33 (2–7)
4 § 1.32 (2–7)
>0.05
Volume of ejaculate, mL, RV: ¸2
3.24 § 1.24 (1.5–7)
3.13 § 1.19 (1–7)
3.65 § 1.93 (1.5–10)
3.13 § 1.34 (1–6)
>0.05
pH 7.9 § 0.29 (7–9)
8.04 § 0.30 (7.5–8.5)
7.94 § 0.35 (7.5–8.5)
7.92 § 0.34 (7.5–8.5)
>0.05
Sperm conc. M/mL, RV: ¸20
69.84 § 40.76 (5.2–166.3)
64.94 § 48.97 (5.2–231)
70.49 § 61.26 (5.9–277.2)
65.34 § 55.74 (5.9–292.3)
>0.05
Motile sperm conc., M/mL
35.86 § 28.33 (1.4–161.2)
35.15 § 27.62 (1.40–133.5)
33.48 § 26.14 (0.3–135.3)
35.92 § 36.06 (0.3–207)
>0.05
PMSC (grade a), M/mL
15.69 § 14.3 (0.1–55.9)
16.28 § 15.64 (0–52.8)
16.95 § 14.68 (0.3–51.1)
17.48 § 23.72 (0.3–136.4)
>0.05
PMSC (grade b), M/mL
14.03 § 13.95 (0–89.8)
12.51 § 11.94 (0–67.6)
11.18 § 11.03 (0–66.4)
12.6 § 11.45 (0–53.9)
>0.05
Functional sperm conc., M/mL
19.02 § 20.75 (0–120.8)
18.7 § 18.02 (0.1–82.8)
17.41 § 15.33 (0.1–69.37)
19.9 § 26.44 (0.1–152.9)
>0.05
All sperm, M/ejac., RV: ¸40
223.59 § 157.68 (15.60–795.5)
187.65 § 140.49 (13–752.5)
233.55 § 224.26 (11.8–1,297)
185.69 § 139.01 (8.9–584.6)
>0.05
Motile sperm, (a + b+c), M/ejac.
114.53 § 93.33 (4.2–503.5)
102.1 § 81.07 (3.5–409.5)
111.49 § 72.24 (3.2–298)
104.85 § 81.4 (2.6–414)
>0.05
PMS (grades a + b), M/ejac, RV: ¸20
92.84 § 84.77 (0.3–460)
83 § 72.91 (0–355.5)
89.86 § 60.5 (0.6–229)
84.37 § 73.14 (0.5–380.6)
>0.05
Funtional sperm, M/ejac.
58.45 § 63.92 (0–342.5)
53.86 § 52.6 (0.4–249.6)
54.57 § 37.32 (0.2–122.4)
55.19 § 56.18 (0.2–305.8)
>0.05
Table 7 The motility parameters of the sperm cells determined by SQA-V Gold Sperm Quality Analyzer
Mean § SD, range in brackets. An. Analyzed samples, Prog. progressive, Mot. motility, N.F. normal forms, APV average path velocity, mic. mi-cron, sec. second, RV reference value
Semen parameters Control Low exposure Medium exposure High exposure P value
n = 49/An. = 48 n = 72/An. = 68 n = 44/An. = 43 n = 39/An. = 39
Motility %, (grades a + b+c)
50.6 § 15.1 (6.1–96.9)
54.1 § 14.1 (20.7–96.6)
52.41 § 14.08 (21.4–74.1)
56.13 § 15.57 (15.3–88.9)
>0.05
Rapid prog. mot. %, (grade a), RV: ¸25
20 § 11.64 (0.4–42.3)
22.37 § 14.74 (0–63.3)
22.65 § 12.49 (3–48.4)
23.91 § 13.86 (1.4–49.7)
>0.05
Slow prog. mot. %, (grade b)
18.8 § 8.7(0–54)
18.7 § 7.92 (0–33.7)
17.67 § 8.85 (0–37.5)
18.87 § 8.85 (0–35.5)
>0.05
Non prog. mot. %, (grade c)
11.82 § 5.1 (5.40–28.90)
12.95 § 5.66 (5.3–27.3)
12.1 § 5.7 (5.3–27.7)
13.35 § 5.44 (5.6–3.1)
>0.05
Immotility %, (grade d)
49.38 § 15.09 (3.1–93.1)
45.9 § 14.1 (3.4–79.3)
47.59 § 14.08 (25.9–78.6)
43.88 § 15.57 (11.1–84.7)
>0.05
Sperm motility index, RV: ¸80
163.06 § 141.67 (1–663)
174.06 § 141.61 (0–659)
173.53 § 130.08 (0–475)
157.9 § 146.68 (0–776)
>0.05
Velocity (APV), mic/sec, RV: ¸5
11 § 3.3 (1–19)
11.01 § 3.6 (1–19)
11.20 § 3.56 (1–17)
10.86 § 3.89 (2–22)
>0.05
Morphology (N.F.%), WHO criteria, RV: ¸30
35.48 § 11.51 (14.6–63.7)
37 § 10.68 (15.60–60.30)
36.57 § 10.57 (16.5–57.8)
37.96 § 11.46 (16.4–60.5)
>0.05
Arch Toxicol (2011) 85:589–600 597
123
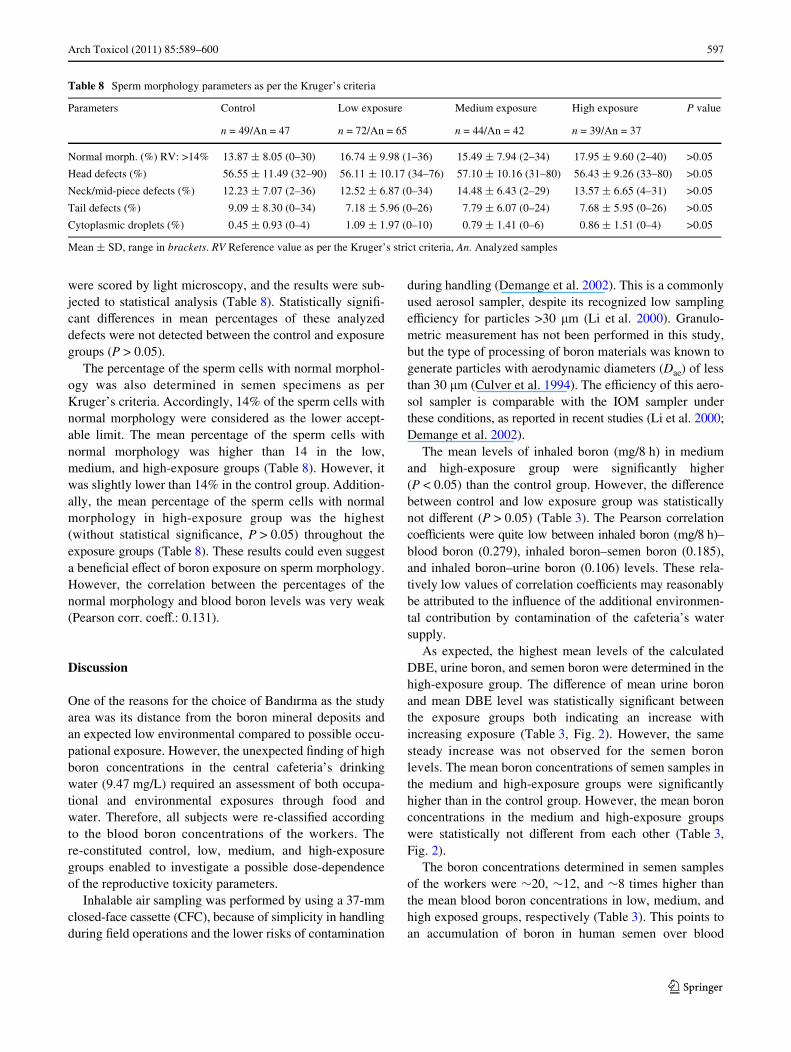
were scored by light microscopy, and the results were sub-jected to statistical analysis (Table 8). Statistically signiW-cant diVerences in mean percentages of these analyzeddefects were not detected between the control and exposuregroups (P > 0.05).
The percentage of the sperm cells with normal morphol-ogy was also determined in semen specimens as perKruger’s criteria. Accordingly, 14% of the sperm cells withnormal morphology were considered as the lower accept-able limit. The mean percentage of the sperm cells withnormal morphology was higher than 14 in the low,medium, and high-exposure groups (Table 8). However, itwas slightly lower than 14% in the control group. Addition-ally, the mean percentage of the sperm cells with normalmorphology in high-exposure group was the highest(without statistical signiWcance, P > 0.05) throughout theexposure groups (Table 8). These results could even suggesta beneWcial eVect of boron exposure on sperm morphology.However, the correlation between the percentages of thenormal morphology and blood boron levels was very weak(Pearson corr. coeV.: 0.131).
Discussion
One of the reasons for the choice of BandÂrma as the studyarea was its distance from the boron mineral deposits andan expected low environmental compared to possible occu-pational exposure. However, the unexpected Wnding of highboron concentrations in the central cafeteria’s drinkingwater (9.47 mg/L) required an assessment of both occupa-tional and environmental exposures through food andwater. Therefore, all subjects were re-classiWed accordingto the blood boron concentrations of the workers. There-constituted control, low, medium, and high-exposuregroups enabled to investigate a possible dose-dependenceof the reproductive toxicity parameters.
Inhalable air sampling was performed by using a 37-mmclosed-face cassette (CFC), because of simplicity in handlingduring Weld operations and the lower risks of contamination
during handling (Demange et al. 2002). This is a commonlyused aerosol sampler, despite its recognized low samplingeYciency for particles >30 �m (Li et al. 2000). Granulo-metric measurement has not been performed in this study,but the type of processing of boron materials was known togenerate particles with aerodynamic diameters (Dae) of lessthan 30 �m (Culver et al. 1994). The eYciency of this aero-sol sampler is comparable with the IOM sampler underthese conditions, as reported in recent studies (Li et al. 2000;Demange et al. 2002).
The mean levels of inhaled boron (mg/8 h) in mediumand high-exposure group were signiWcantly higher(P < 0.05) than the control group. However, the diVerencebetween control and low exposure group was statisticallynot diVerent (P > 0.05) (Table 3). The Pearson correlationcoeYcients were quite low between inhaled boron (mg/8 h)–blood boron (0.279), inhaled boron–semen boron (0.185),and inhaled boron–urine boron (0.106) levels. These rela-tively low values of correlation coeYcients may reasonablybe attributed to the inXuence of the additional environmen-tal contribution by contamination of the cafeteria’s watersupply.
As expected, the highest mean levels of the calculatedDBE, urine boron, and semen boron were determined in thehigh-exposure group. The diVerence of mean urine boronand mean DBE level was statistically signiWcant betweenthe exposure groups both indicating an increase withincreasing exposure (Table 3, Fig. 2). However, the samesteady increase was not observed for the semen boronlevels. The mean boron concentrations of semen samples inthe medium and high-exposure groups were signiWcantlyhigher than in the control group. However, the mean boronconcentrations in the medium and high-exposure groupswere statistically not diVerent from each other (Table 3,Fig. 2).
The boron concentrations determined in semen samplesof the workers were »20, »12, and »8 times higher thanthe mean blood boron concentrations in low, medium, andhigh exposed groups, respectively (Table 3). This points toan accumulation of boron in human semen over blood
Table 8 Sperm morphology parameters as per the Kruger’s criteria
Mean § SD, range in brackets. RV Reference value as per the Kruger’s strict criteria, An. Analyzed samples
Parameters Control Low exposure Medium exposure High exposure P value
n = 49/An = 47 n = 72/An = 65 n = 44/An = 42 n = 39/An = 37
Normal morph. (%) RV: >14% 13.87 § 8.05 (0–30) 16.74 § 9.98 (1–36) 15.49 § 7.94 (2–34) 17.95 § 9.60 (2–40) >0.05
Head defects (%) 56.55 § 11.49 (32–90) 56.11 § 10.17 (34–76) 57.10 § 10.16 (31–80) 56.43 § 9.26 (33–80) >0.05
Neck/mid-piece defects (%) 12.23 § 7.07 (2–36) 12.52 § 6.87 (0–34) 14.48 § 6.43 (2–29) 13.57 § 6.65 (4–31) >0.05
Tail defects (%) 9.09 § 8.30 (0–34) 7.18 § 5.96 (0–26) 7.79 § 6.07 (0–24) 7.68 § 5.95 (0–26) >0.05
Cytoplasmic droplets (%) 0.45 § 0.93 (0–4) 1.09 § 1.97 (0–10) 0.79 § 1.41 (0–6) 0.86 § 1.51 (0–4) >0.05
598 Arch Toxicol (2011) 85:589–600
123
levels. In spite of these high boron concentrations in semi-nal Xuid, the percentage of sperm cells with “normalmorphology” was highest in the high-exposure group(Table 8). An accumulation of boron in seminal Xuid wasalso reported by Robbins et al. (2010). This Wnding may beof relevance for studies on a preventive role of boric acidon prostate cancer, as boric acid has been reported toreduce the risk of prostate cancer, tumor growth, andprostate cancer cell proliferation in humans (Barranco andEckhert 2006, Barranco et al. 2009).
In a study on 898 Turkish volunteers from the KozluZonguldak area, participating in a prostate cancer screeningprogram, the mean total PSA levels increased from 1.6 ng/mL(SD § 1.8; median 1.0, 0.2–7.6) in 30–39-year-old men to4.3 ng/mL (SD § 5.7; median 2.0 ng/mL, 0–42.7) in 60–69-year-old men with benign Wndings (Mungan et al. 2007). Asmaller study on 255 Turkish volunteers from a small villagein the Aegean region of Turkey, also participating in prostatecancer screening, provided mean total PSA levels from1.45 ng/mL (95% CI 0.66–2.55; median 0.74) in the 40–49-year-old men to 1.64 ng/mL in the 60–69-year-old men(95% CI 1.16–2.11; median 1.00) (Müezzinoglu et al. 2005).In these two studies and in the present study, as expected,PSA levels increased with age (total PSA = 0.022 £ age[years] + 0.3067). The total PSA levels in the present studyare comparable with the above-mentioned second study. Inspite of the diVerent results of the two Turkish studies, itmust be considered that PSA levels are diYcult to comparebecause the reference values are diVering from manufactureto manufacture of the reagent (Kort et al. 2006) and maydiVer with ethnicity (Kehinde et al. 2005). Furthermore, PSAlevels may be aVected by other factors. For example, lowerPSA levels were reported in obese white non-Hispanic men,compared to those with a normal body mass index (OR 0.54;95% CI 0.31–0.91). Nevertheless, this eVect was notobserved in African-American or Hispanic men (Culp andPorter 2009). Therefore, the most robust information fromthe determined total PSA levels in this study is that total PSAlevels did not signiWcantly diVer between the control, low,medium, and high-exposure groups.
The calculated DBE and urine boron levels of the work-ers show a reasonably high correlation (Pearson’s corr.coef.: 0.635 and 0.633, respectively) with the blood boronlevels (Fig. 2). The weakest correlation was found betweenthe semen boron concentrations and blood boron concentra-tions of the workers (Pearson’s corr. coeV. = 0.222). Acomparable correlation (Pearson’s corr. coeV.: 0.85)between DBE and boron levels in blood samples has alsobeen reported in occupationally boron-exposed Chineseworkers (Xing et al. 2008). Thus, our results are in generalcompatible with the results of the Chinese study.
EVects of boric acid on the endocrine regulation of thereproductive system have been studied in experimental
animals (Ku et al. 1993, Fail et al. 1998). Decreases in tes-tosterone and increases in FSH and LH levels have beenreported in rats under continuous oral exposure (9,000 ppmin the diet). Increases in FSH levels in rats have beenreported with 4,500 ppm boric acid in the diet. These studiesin experimental animals show that boric acid could be toxicto endocrine system at very high concentrations (Ku et al.1993). Such eVects of boron compounds (boric acid and/orsodium borates) on the human endocrine system have notbeen studied so far. In the present study, total testosterone,FSH, and LH values of the workers have been determinedand evaluated statistically versus increasing blood boronlevels (Fig. 3, Table 4). The only statistically signiWcantdiVerence (P < 0.05) was observed for the mean LH levelsbetween medium and high-exposure groups (Table 4). How-ever, a steady increase in mean LH levels was not observedthroughout the exposure groups (Fig. 3). In spite of the pres-ence of the person with the highest LH value (20 mIU/mL)in the high-exposure group, the diVerence of mean LHvalues between control and high-exposure group wasstatistically not signiWcant (P > 0.05). Additionally, the cor-relation between the LH levels and blood boron levels wasvery low (Pearson corr. coeV.: 0.164).
Based on animal experiments, reproductive toxicityeVects of boron are pivotal for setting regulatory exposurelimits for boron. Depressed testicular weight and testesatrophy (linked with an eVect on spermatogenesis) havebeen reported as the most sensitive endpoints of reproduc-tive toxicity in rats (Ku et al. 1993). However, these toxiceVects of boric acid have not been found in reliable humanstudies so far. The Wrst comprehensive study on semenparameters has been published by Robbins et al. (2010) inhighly boron-exposed Chinese workers. According to theresults of this study, the semen parameters (total spermcount, sperm concentration, motility, morphology, DNAbreakage, apoptosis, and aneuploidy) of the boron-exposedworkers were not adversely aVected with increasing boronexposure. In spite of extremely high average blood boronlevels (mean: 499.2 ppb [ng/g]), statistically signiWcant cor-relations between blood boron and adverse eVects on semenparameters were not reported (Xing et al. 2008, Robbinset al. 2010). The present study, independent of the Wrst, isthe second to evaluate semen parameters versus increasingblood boron levels in boron-exposed workers. The resultsof the quantitative data are shown in Table 6 and Table 7.Statistically signiWcant diVerences in mean levels of spermconcentration (Table 6) and sperm motility parameters(Table 7) could not be determined between the control andexposure groups. In spite of the lack of a statistical signiW-cance, the motility parameters are tending to increase withincreasing blood boron levels. In addition, the mean per-centage of immotility was the lowest in the high-exposuregroup, but without a statistical signiWcance (P > 0.05).
Arch Toxicol (2011) 85:589–600 599
123
Sperm morphology has also been evaluated as perKruger’s strict criteria. Accordingly, a sperm cell withoutdefects (head, neck, midpiece, tail, cytoplasmic droplests)was considered as “normal” (Table 8). The percentage ofthe sperm cells with normal morphology and morphologi-cal defects are shown in Table 8. Statistically signiWcantdiVerences in the percentages of head, neck/midpeace, taildefects, and cytoplasmic droplets were not determinedbetween the control and exposure groups (P > 0.05). Onthe other hand, when comparing the mean percentages ofthe sperm cells with normal morphology between expo-sure groups, it was the highest in the high-exposure groupwithout a statistical signiWcance (P > 0.05). This resultmay even suggest a beneWcial eVect of certain level ofboron exposure on maintaining the normal spermmorphology. However, the correlation between bloodboron levels and percentages of the sperm cells with normalmorphology was very weak (Pearson’s corr. coeV.:0.131).
All these results indicate that boron had no adverseeVects on FSH levels, LH levels, total testosterone levels,sperm concentration parameters, motility parameters, andsperm morphology of workers, under the exposure condi-tions prevailing in BandÂrma.
Studies in experimental animals have been fundamentalto classify boric acid and sodium borates as being toxic tomale fertility and development. However, the results of thepublished environmental and occupational studies do notsupport the outcomes of the animal studies. The dosestested in animal studies are possibly the major reason ofthis discrepancy. For instance, mild inhibited spermiation,followed by atrophy of the testes in rats was seen afteradministration of boric acid in the feed for up to 9 weeks atdaily doses of 26 mg boron/kg/day and 52 mg boron/kg/day, respectively (Ku et al. 1993). These daily boron intakelevels are not reached by boron-exposed humans, evenunder extreme worst-case conditions (Xing et al. 2008,Robbins et al. 2010).
In contrast to animal experiments, an associationbetween boron exposure and toxic eVects on reproductionand/or development have not been identiWed in environ-mental and occupational epidemiology studies so far (Xinget al. 2008, Robbins et al. 2010, Scialli et al. 2010, Sayliet al. 1998, Sayli 1998, 2001, and 2003). These studies con-sistently show that it was not possible to exceed safe bloodboron concentrations during normal activities and evenunder exaggerated exposure conditions for humans (Culveret al. 1994, Yazbeck et al. 2005, Xing et al. 2008, Robbinset al. 2010). In this context, our study is in agreement withthe previously published studies. Consequently, it appearsthat the doses associated with developmental and reproduc-tive toxic eVects in animals are by far not reachable forhumans under normal handling and use conditions.
Acknowledgments This project was funded by National BoronResearch Institute (BOREN) and Eti Mine Works General Manage-ment (2008–G0207). The outline of the study and the processing of theraw data were reviewed by an external expert panel. The authors thankthe reviewers, Professors G. Assennato, Bari, and M. Guillemin,Lausanne, for their scrutiny and dedicated eVort.
References
Barranco WT, Eckhert CD (2004) Boric acid inhibits human prostatecancer cell proliferation. Cancer Lett 216(1):21–29
Barranco WT, Eckhert CD (2006) Cellular changes in boric acid-treat-ed DU-145 prostate cancer cells. Br J Cancer 94:884–890
Barranco WT, Hudak PF, Eckhert CD (2007) Evaluation of ecologicaland in vitro eVects of boron on prostate cancer risk (UnitedStates). Cancer Causes Control 18(1):71–77. Erratum in: CancerCauses Control. 2007 18(5):583–584
Barranco WT, Kim DH, Stella SL Jr, Eckhert CD (2009) Boric acidinhibits stored Ca2 + release in DU-145 prostate cancer cells. CellBiol Toxicol 25(4):309–320
Conover WJ (1999) Practical nonparametric statistics, 3rd edn. JohnWiley, New York
Culp S, Porter M (2009) The eVect of obesity and lower serum pros-tate-speciWc antigen levels on prostate-cancer screening results inAmerican men. BJU Int 104(10):1457–1461
Culver BD, Shen PT, Taylor TH, Lee-Feldstein A, Anton-Culver H,Strong PL (1994) The relationship of blood and urine boron to bo-ron exposure in borax workers and the usefulness of urine-boronas an exposure marker. Environ Health Perspect 102(7):133–137
Degen GH, Hengstler JG (2008) Developments in industrial and occu-pational toxicology: REACH, toxicogenomics, mycotoxins, lead,asbestos, boron, bitumen, deletion polymorphisms and SNP inter-actions. Meeting report of the 16th EUROTOX Training andDiscussion Session. Arch Toxicol 82:483–487
Demange M, Görner P, Elcabache JM, Wrobel R (2002) Field compar-ison of 37 mm closed-faced cassettes and IOM samplers. ApplOccup Environ Hyg 17(3):200–208
Deviran TA, Volpe SL (2003) The physiological eVects of dietaryboron. Crit Rev Food Sci Nutr 43:219–231
ECHA [European Chemicals Agency] (2008) Annex XV Transitionalreports: boric acid. Available online: http://echa.europa.eu/doc/trd_substances/boric_acid/ann_xv_trd/trd_austria_boric_acid.pdf (accessed 28.07.2010)
Fail PA, Chapin RE, Price CJ, Heindel JJ (1998) General, reproduc-tive, developmental, and endocrine toxicity of boronated com-pounds. Reprod Toxicol 12(1):1–18
Gallardo-Williams MT, Chapin RE, King PE, Moser GJ, GoldsworthyTL, Morrison JP, Maronpot RR (2004) Boron supplementationinhibits the growth and local expression of IGF-1 in human pros-tate adenocarcinoma (LNCaP) tumors in nude mice. ToxicolPathol 32(1):73–78
Holm S (1979) A simple sequentially rejective multiple test procedure.Scand J Stat 6:65–70
IPCS (1998) Envieonmenntal health criteria 204; boron. InternationalProgramme on Chemical Safety. World Health Organization(WHO), Geneva
Jensen AA (2009) Risk assessment of boron in glass wool insulation.Environ Sci Pollut Res 16:73–78
Kehinde EO, Mojiminiyi OA, Sheikh M, Al-Awadi KA, Daar AS,Al-Hunayan A, Anim JT, Al-Sumait AA (2005) Age-speciWcreference levels of serum prostate-speciWc antigen and prostatevolume in healthy Arab men. BJU Int 96(3):308–312
Kort SA, Martens F, Vanpoucke H, van Duijnhoven HL, BlankensteinMA (2006) Comparison of 6 automated assays for total and free
600 Arch Toxicol (2011) 85:589–600
123
prostate-speciWc antigen with special reference to their reactivitytoward the WHO 96/670 reference preparation. Clin Chem52(8):1568–1574
Kruger TF, Menkveld R, Stander FSH, Lombard CJ, Van der MerweJP, Van Zyl JA, Smith K (1986) Sperm morphologic features as aprognostic factor in in vitro fertilization. Fertil Steril 46:1118–1123
Kruger TF, Acosta AA, Simmons KF, Swanson RJ, Matta JF, Oehnin-ger S (1988) Predictive value of abnormal sperm morphology inin vitro fertilization. Fertil Steril 49:112–117
Ku WW, Chapin RE, Wine RN, Gladen BC (1993) Testicular toxicityof boric acid (BA): Relationship of dose to lesion developmentand recovery in F344 rat. Reprod Toxicol 7:305–319
Li SN, Lundgren DA, Rovell-Rix D (2000) Evaluation of six inhalableaerosol samplers. Am Ind Hyg Assoc J 61:506–516
McCoy H, Kenney MA, Montgomery C, Irwin A, Williams L, OrrellR (1994) Relation of boron to the composition and mechanicalproperties of bone. Environ Health Perspect 102(7):49–53
Müezzinoflu T, Lekili M, Eser E, Uyanik BS, Büyüksu C (2005) Pop-ulation standards of prostate speciWc antigen values in men over40: community based study in Turkey. Int Urol Nephrol37(2):299–304
Mungan AG, Erol B, Akduman B, Bozdogan G, Kiran S, Yesilli C,Mungan NA (2007) Values for free/total prostate-speciWc antigenratio as a function of age: necessity of reference validation in aTurkish population. Clin Chem Lab Med 45(7):912–916. Erratumin: Clin Chem Lab Med 45(11):1570
Murray FJ (1995) A human health risk assessment of boron (boric acidand borax) in drinking water. Reg Toxicol Pharmacol 22:221–230
Murray FJ, Schlekat CE (2004) Comparison of risk assessments ofboron: alternate approaches to chemical-speciWc adjustmentfactors. Hum Ecol Risk Assess 10:57–58
Nielsen FH (1994) Biochemical and physiologic consequences ofboron deprivation in humans. Environ Health Perspect 102(7):59–63
Nielsen FH (2008) Is boron nutritionally relevant? Nutr Rev 66:183–191
Robbins WA, Xun L, Jia J, Kennedy N, ElashoV DA, Ping L (2010)Chronic boron exposure and human semen parameters. ReprodToxicol 29:184–190
Sayli BS (1998) An assessment of fertility in boron-exposed Turkishsubpopulations, 2. Evidence that boron has no eVect on humanreproduction. Biol Trace Elem Res 66:409–422
Sayli BS (2001) Assessment of fertility among sibs and in “borate fam-ilies”. Biol Trace Elem Res 81:255–267
Sayli BS (2003) Low frequency of infertility among workers in aborate processing facility. Biol Trace Elem Res 93:19–29
Sayli BS, Tüccar E, Elhan AH (1998) An assessment of fertility inboron-exposed Turkish subpopulations. Reprod Toxicol 12(3):297–304
Scialli AR, Bonde JP, Brüske-Hohlfeld I, Culver BD, Li Y, SullivanFM (2010) An overview of male reproductive studies of boronwith an emphasis on studies of highly exposed Chinese workers.Reprod Toxicol 29:10–24
R Development Core Team (2010) R: A language and environment forstatistical computing. R Foundation for Statistical Computing,Vienna, Austria. http://www.R-project.org
WHO [World Health Organization] (2003) Laboratory manual for theexamination and processing of human semen and sperm, 4th edn.WHO Press, Geneva
Xing X, Wu G, Wei F, Liu P, Wei H, Wang C, Xu Y, Xun L, Jia J,Kennedy N, ElashoV D, Robbins W (2008) Biomarkers of envi-ronmental and workplace boron exposure. J Occup Environ Hyg5:141–147
Yazbeck C, Kloppmann W, Cottier R, Sahuquillo J, Debotte G, HuelG (2005) Health impact evaluation of boron in drinking water: ageographical risk assessment in Northern France. Environ Geo-chem Health 27:419–427
1
ELECTRONIC SUPPLEMENTARY MATERIAL
Journal: Archives of Toxicology
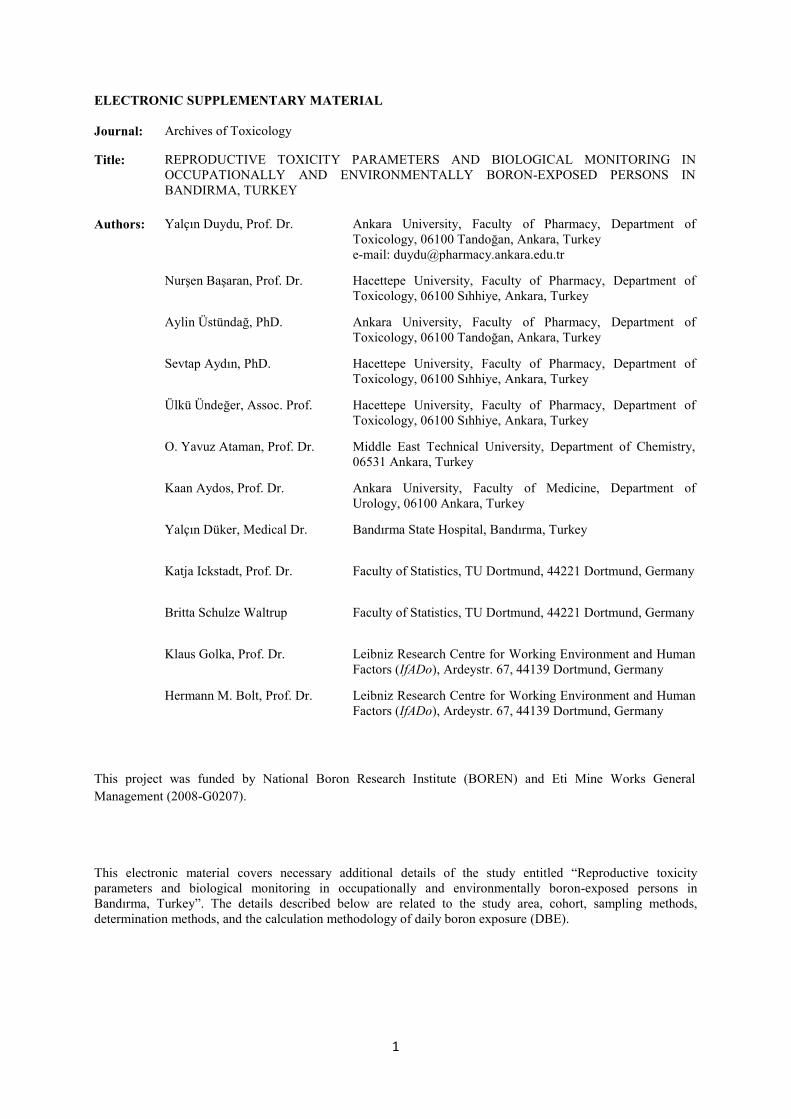
Title: REPRODUCTIVE TOXICITY PARAMETERS AND BIOLOGICAL MONITORING INOCCUPATIONALLY AND ENVIRONMENTALLY BORON-EXPOSED PERSONS INBANDIRMA, TURKEY
Authors: Yalçın Duydu, Prof. Dr. Ankara University, Faculty of Pharmacy, Department ofToxicology, 06100 Tandoğan, Ankara, Turkeye-mail: [email protected]
Nurşen Başaran, Prof. Dr. Hacettepe University, Faculty of Pharmacy, Department ofToxicology, 06100 Sıhhiye, Ankara, Turkey
Aylin Üstündağ, PhD. Ankara University, Faculty of Pharmacy, Department ofToxicology, 06100 Tandoğan, Ankara, Turkey
Sevtap Aydın, PhD. Hacettepe University, Faculty of Pharmacy, Department ofToxicology, 06100 Sıhhiye, Ankara, Turkey
Ülkü Ündeğer, Assoc. Prof. Hacettepe University, Faculty of Pharmacy, Department ofToxicology, 06100 Sıhhiye, Ankara, Turkey
O. Yavuz Ataman, Prof. Dr. Middle East Technical University, Department of Chemistry,06531 Ankara, Turkey
Kaan Aydos, Prof. Dr. Ankara University, Faculty of Medicine, Department ofUrology, 06100 Ankara, Turkey
Yalçın Düker, Medical Dr. Bandırma State Hospital, Bandırma, Turkey
Katja Ickstadt, Prof. Dr. Faculty of Statistics, TU Dortmund, 44221 Dortmund, Germany
Britta Schulze Waltrup Faculty of Statistics, TU Dortmund, 44221 Dortmund, Germany
Klaus Golka, Prof. Dr. Leibniz Research Centre for Working Environment and HumanFactors (IfADo), Ardeystr. 67, 44139 Dortmund, Germany
Hermann M. Bolt, Prof. Dr. Leibniz Research Centre for Working Environment and HumanFactors (IfADo), Ardeystr. 67, 44139 Dortmund, Germany
This project was funded by National Boron Research Institute (BOREN) and Eti Mine Works GeneralManagement (2008-G0207).
This electronic material covers necessary additional details of the study entitled “Reproductive toxicityparameters and biological monitoring in occupationally and environmentally boron-exposed persons inBandırma, Turkey”. The details described below are related to the study area, cohort, sampling methods,determination methods, and the calculation methodology of daily boron exposure (DBE).
2
ANNEX I
MEAN CALCULATED DAILY BORON EXPOSURE (DBE), INHALED BORON, BLOOD BORON,URINARY BORON, AND SEMEN BORON LEVELS OF THE ORIGINAL CONTROL AND EXPOSED
GROUPS
1. Additional information on work shifts, sampling and determination methods;
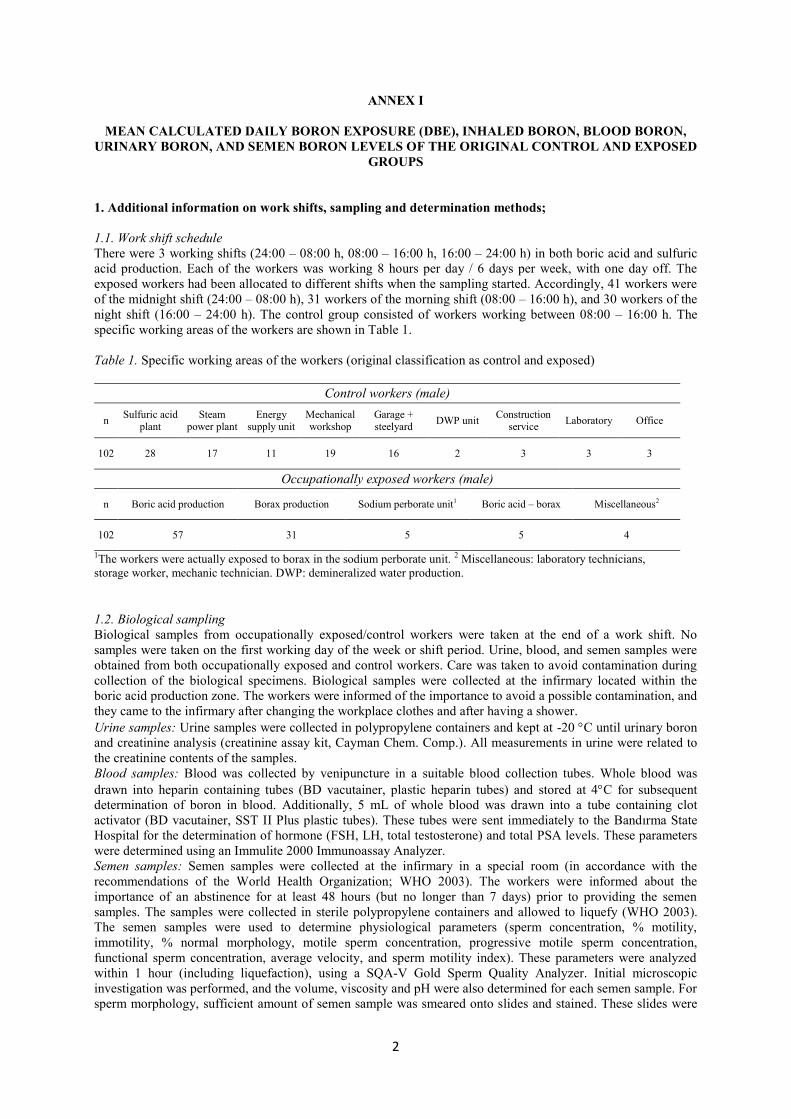
1.1. Work shift scheduleThere were 3 working shifts (24:00 – 08:00 h, 08:00 – 16:00 h, 16:00 – 24:00 h) in both boric acid and sulfuricacid production. Each of the workers was working 8 hours per day / 6 days per week, with one day off. Theexposed workers had been allocated to different shifts when the sampling started. Accordingly, 41 workers wereof the midnight shift (24:00 – 08:00 h), 31 workers of the morning shift (08:00 – 16:00 h), and 30 workers of thenight shift (16:00 – 24:00 h). The control group consisted of workers working between 08:00 – 16:00 h. Thespecific working areas of the workers are shown in Table 1.
Table 1. Specific working areas of the workers (original classification as control and exposed)
Control workers (male)
n Sulfuric acidplant
Steampower plant
Energysupply unit
Mechanicalworkshop
Garage +steelyard DWP unit Construction
service Laboratory Office
102 28 17 11 19 16 2 3 3 3
Occupationally exposed workers (male)
n Boric acid production Borax production Sodium perborate unit1 Boric acid – borax Miscellaneous2
102 57 31 5 5 4
1The workers were actually exposed to borax in the sodium perborate unit. 2 Miscellaneous: laboratory technicians,storage worker, mechanic technician. DWP: demineralized water production.
1.2. Biological samplingBiological samples from occupationally exposed/control workers were taken at the end of a work shift. Nosamples were taken on the first working day of the week or shift period. Urine, blood, and semen samples wereobtained from both occupationally exposed and control workers. Care was taken to avoid contamination duringcollection of the biological specimens. Biological samples were collected at the infirmary located within theboric acid production zone. The workers were informed of the importance to avoid a possible contamination, andthey came to the infirmary after changing the workplace clothes and after having a shower.Urine samples: Urine samples were collected in polypropylene containers and kept at -20 C until urinary boronand creatinine analysis (creatinine assay kit, Cayman Chem. Comp.). All measurements in urine were related tothe creatinine contents of the samples.Blood samples: Blood was collected by venipuncture in a suitable blood collection tubes. Whole blood wasdrawn into heparin containing tubes (BD vacutainer, plastic heparin tubes) and stored at 4C for subsequentdetermination of boron in blood. Additionally, 5 mL of whole blood was drawn into a tube containing clotactivator (BD vacutainer, SST II Plus plastic tubes). These tubes were sent immediately to the Bandırma StateHospital for the determination of hormone (FSH, LH, total testosterone) and total PSA levels. These parameterswere determined using an Immulite 2000 Immunoassay Analyzer.Semen samples: Semen samples were collected at the infirmary in a special room (in accordance with therecommendations of the World Health Organization; WHO 2003). The workers were informed about theimportance of an abstinence for at least 48 hours (but no longer than 7 days) prior to providing the semensamples. The samples were collected in sterile polypropylene containers and allowed to liquefy (WHO 2003).The semen samples were used to determine physiological parameters (sperm concentration, % motility,immotility, % normal morphology, motile sperm concentration, progressive motile sperm concentration,functional sperm concentration, average velocity, and sperm motility index). These parameters were analyzedwithin 1 hour (including liquefaction), using a SQA-V Gold Sperm Quality Analyzer. Initial microscopicinvestigation was performed, and the volume, viscosity and pH were also determined for each semen sample. Forsperm morphology, sufficient amount of semen sample was smeared onto slides and stained. These slides were
3
scored by one experienced technician as per Kruger’s criteria (Kruger et al., 1986, 1988) at the Research Centeron Fertility, School of Medicine, University of Ankara. The remainder of each semen sample was pipetted intocryotubes for storage at -20 C until boron analysis. Six semen samples could not be analyzed because ofinsufficient sample volumes. Of these, three belonged to the exposed group (boric acid production) and three tothe control group (sulfuric acid plant, garage/steelyard and construction service).
1.3. Air samplingBoron exposure by inhalation was determined in two ways, different for the occupationally exposed and thecontrol workers. Personal air monitoring was performed using a personal air sampler (SKC, AirCheck 2000) forthe exposed workers working in boric acid and borax production. The flow rate was 2 L/min, and the samplingtime was 8 hours. Low-ash PVC filters (SKC, 5 m, 37 mm, pre-weighed) and SureSeal cassettes (SKC, 37 mm)were used in a closed-faced manner to assess the inhalable dust. Stationary ambient air monitoring wasperformed for the working areas of the control workers, by assessing the inhalable dust (the control workers didnot wear personal air samplers during work shifts). The above mentioned personal sampling devices and filterswere also used for the measurement of the inhalable dust at the workplace of the control workers (staticsampling). The flow rates of the sampler and sampling times were the same. The results of these measurementswere used to assess the inhalational boron exposure for the control workers. Two samples belonging to theexposed group could not be analyzed because of a problem in the sample digestion process. Therefore, dailyboron intakes could not be calculated for two workers employed in the boric acid production unit.
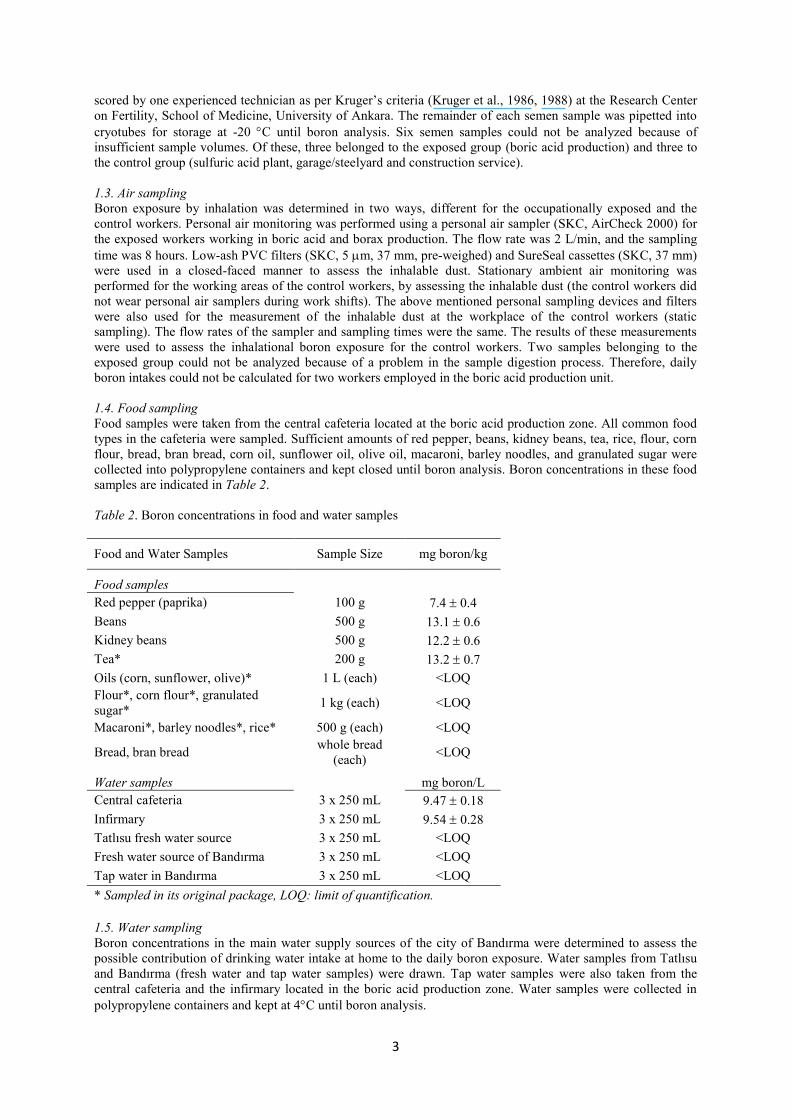
1.4. Food samplingFood samples were taken from the central cafeteria located at the boric acid production zone. All common foodtypes in the cafeteria were sampled. Sufficient amounts of red pepper, beans, kidney beans, tea, rice, flour, cornflour, bread, bran bread, corn oil, sunflower oil, olive oil, macaroni, barley noodles, and granulated sugar werecollected into polypropylene containers and kept closed until boron analysis. Boron concentrations in these foodsamples are indicated in Table 2.
Table 2. Boron concentrations in food and water samples
Food and Water Samples Sample Size mg boron/kg
Food samplesRed pepper (paprika) 100 g 7.4 0.4Beans 500 g 13.1 0.6Kidney beans 500 g 12.2 0.6Tea* 200 g 13.2 0.7Oils (corn, sunflower, olive)* 1 L (each) <LOQFlour*, corn flour*, granulatedsugar* 1 kg (each) <LOQ
Macaroni*, barley noodles*, rice* 500 g (each) <LOQ
Bread, bran bread whole bread(each) <LOQ
Water samples mg boron/LCentral cafeteria 3 x 250 mL 9.47 0.18Infirmary 3 x 250 mL 9.54 0.28Tatlısu fresh water source 3 x 250 mL <LOQFresh water source of Bandırma 3 x 250 mL <LOQTap water in Bandırma 3 x 250 mL <LOQ* Sampled in its original package, LOQ: limit of quantification.
1.5. Water samplingBoron concentrations in the main water supply sources of the city of Bandırma were determined to assess thepossible contribution of drinking water intake at home to the daily boron exposure. Water samples from Tatlısuand Bandırma (fresh water and tap water samples) were drawn. Tap water samples were also taken from thecentral cafeteria and the infirmary located in the boric acid production zone. Water samples were collected inpolypropylene containers and kept at 4C until boron analysis.
4
1.6. Boron analysisBlood, semen, and food samples were analyzed by Inductively Coupled Plasma Mass Spectrometry (ICP-MS)with a flow injection system. A special sample introduction system that included a perfluoroalkoxy (PFA) spraychamber and a nebulizer with an alumina injector tube in a quartz torch was used for this study. Urine, dust, andwater samples were analyzed by Inductively Coupled Plasma Optical Emission Spectrometry (ICP-OES).Standard reference materials were used for quality control.
1.6.1. Analysis of blood samples: Two mL ultrapure HNO3 and 2.0 mL H2O2 were added to 1 mL blood sample(pre-weighed) in a PTFE digestion bomb. The sample was digested using a microwave digestion system(Milestone Ethos PLUS). Beryllium (Be) was used as an internal standard. The signal ratio of 11B/9Be was usedfor quantitation.
1.6.2. Analysis of semen samples: Two mL ultrapure HNO3 and 2.0 mL H2O2 were added to a sufficient amountof pre-weighed semen in a PTFE digestion bomb. The sample was digested using a microwave digestion system.Beryllium was used as an internal standard. The signal ratio of 11B/9Be was used for quantitation. Due to smallsemen sample volumes, duplicate determinations were not possible for some samples.
1.6.3. Analysis of food samples: After grinding, samples were placed into oven for 2 days at 50 0C (except theliquids). Thereafter, 0.2 g of sample was accurately weighed and placed into the PTFE digestion bomb. Thesample was digested with 4.0 mL of ultrapure HNO3 and 4.0 mL of H2O2 by microwave digestion. Berylliumwas used as an internal standard. The signal ratio of 11B/9Be was used for quantitation.
1.6.4. Analysis of urine samples: Five mL of urine sample was transferred into the PTFE digestion bomb, and5.0 mL of ultrapure HNO3 was added. Samples were digested by the microwave digestion system. Indium wasused as an internal standard. The boron (B) to indium (In) signal ratio was used for quantitation.
1.6.5. Analysis of dust samples: A pre-weighed PVC filter, containing the collected dust sample, was placed inthe PTFE digestion bomb. Five mL ultrapure HNO3 and 5.0 mL H2O2 were added. The sample was digested bythe microwave digestion system. Indium was used as an internal standard. The boron to indium signal ratio wascalculated for both calibration and measurement. Duplication was not possible for these samples, since only asingle dust sample was available for each individual.
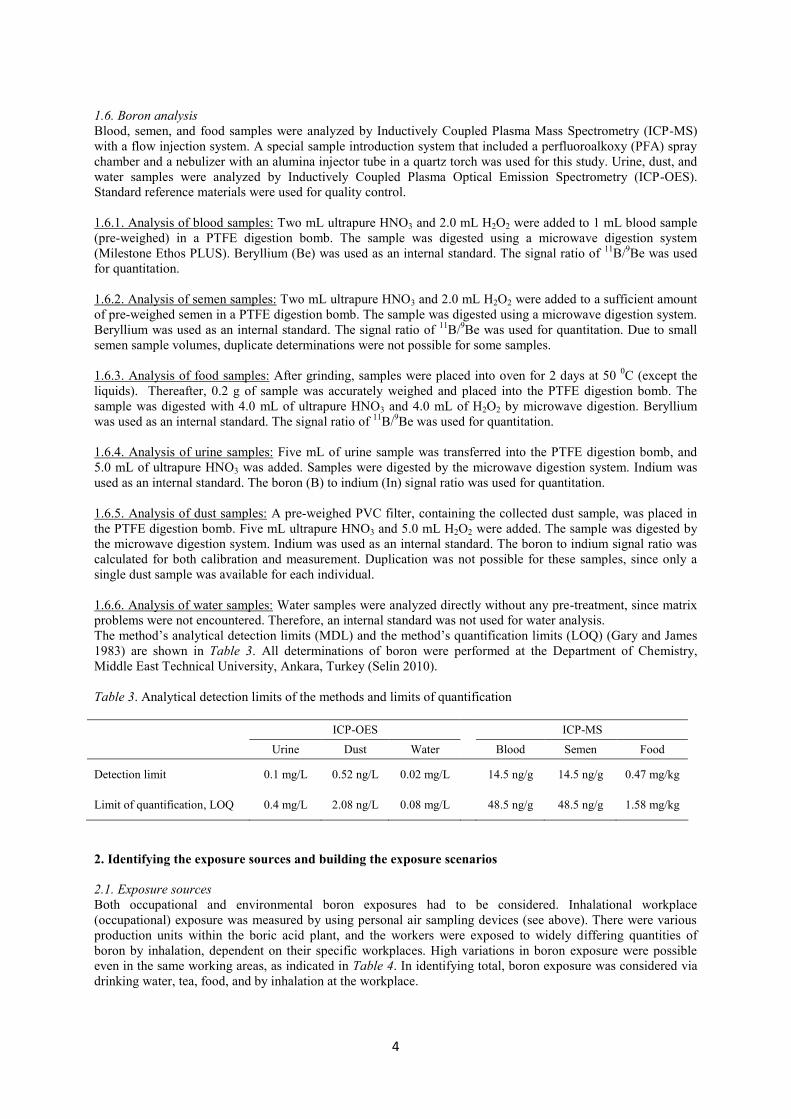
1.6.6. Analysis of water samples: Water samples were analyzed directly without any pre-treatment, since matrixproblems were not encountered. Therefore, an internal standard was not used for water analysis.The method’s analytical detection limits (MDL) and the method’s quantification limits (LOQ) (Gary and James1983) are shown in Table 3. All determinations of boron were performed at the Department of Chemistry,Middle East Technical University, Ankara, Turkey (Selin 2010).
Table 3. Analytical detection limits of the methods and limits of quantification
ICP-OES ICP-MS
Urine Dust Water Blood Semen Food
Detection limit 0.1 mg/L 0.52 ng/L 0.02 mg/L 14.5 ng/g 14.5 ng/g 0.47 mg/kg
Limit of quantification, LOQ 0.4 mg/L 2.08 ng/L 0.08 mg/L 48.5 ng/g 48.5 ng/g 1.58 mg/kg
2. Identifying the exposure sources and building the exposure scenarios
2.1. Exposure sourcesBoth occupational and environmental boron exposures had to be considered. Inhalational workplace(occupational) exposure was measured by using personal air sampling devices (see above). There were variousproduction units within the boric acid plant, and the workers were exposed to widely differing quantities ofboron by inhalation, dependent on their specific workplaces. High variations in boron exposure were possibleeven in the same working areas, as indicated in Table 4. In identifying total, boron exposure was considered viadrinking water, tea, food, and by inhalation at the workplace.
5
2.1.1. Boron exposure at home: Boron exposure via drinking water at home was not significant as boron couldnot be detected in the fresh water sources and in tap water of the adjacent city of Bandırma. Furthermore, mostof the families used to drink bottled water in Bandırma. Also, there was no relevant environmental pollution ofboron via ambient air in Bandırma. Boron was also determined in 4 pilot samples of home-made food (Table 2).Accordingly, boron exposure via food at home appeared to be negligible, when compared with the boronexposures at the workplace. Therefore, boron exposure at home was ignored when calculating the daily boronintakes.
2.1.2. Boron exposure via drinking water at the workplace (Ww): The daily drinking water consumption of eachworker (control and exposed) was known from the questionnaire. The volume of one glass of water used in thecentral cafeteria was 250 mL. The boron concentration in the tap water of the central cafeteria was determined tobe 9.47 mg/L. Boron exposure via drinking water in the central cafeteria was calculated by multiplying the dailydrinking water consumption with the boron concentration in the tap water of central cafeteria.
2.1.3. Boron exposure via tea drinking at the workplace (Tw): In Turkey, it is common to drink considerableamounts of tea at work. The workers working in the boric acid production plant (exposed workers) made theirown tea at work by using tap water. The volume of the Turkish tea cup used by the workers was 90 mL. Teadrinking habits at work of each worker were obtained from the questionnaire. Boron exposures via tea drinkingwere calculated by multiplying the amount of daily consumed tea with the boron concentration in the cafeteria’stap water (9.47 mg/L). Boron concentrations determined in tea leafs (Table 2) were very low compared with theboron concentration in tap water. Therefore, this was neglected.
2.1.4. Boron exposure via food at the workplace (Fw): A boron intake via lunch and dinner at the centralcafeteria was possible for all workers, except for midnight shift workers. Generally, the lunch and dinner menusconsisted of soup, main course, sweets and salad. Boron exposure by meals was also possible for the sulfuricacid workers, owing to the transportation of lunch and dinner menus from the central cafeteria to the sulfuricacid plant. Daily boron intakes via lunch or dinner were calculated based on the water contents of each menu. Ingeneral, the water content of lunch or dinner menus averaged 400 mL (according to our measurements). Boronintake via lunch or dinner was therefore calculated by multiplying the average water content of the menu (400mL) with the boron concentration found in the tap water of the central cafeteria (9.47 mg/L). The contribution ofsome boron containing foodstuff (Table 3) on the daily boron intake via lunch or dinner was negligible,compared to the boron concentration in the cafeteria’s tap water. Therefore, this was neglected.
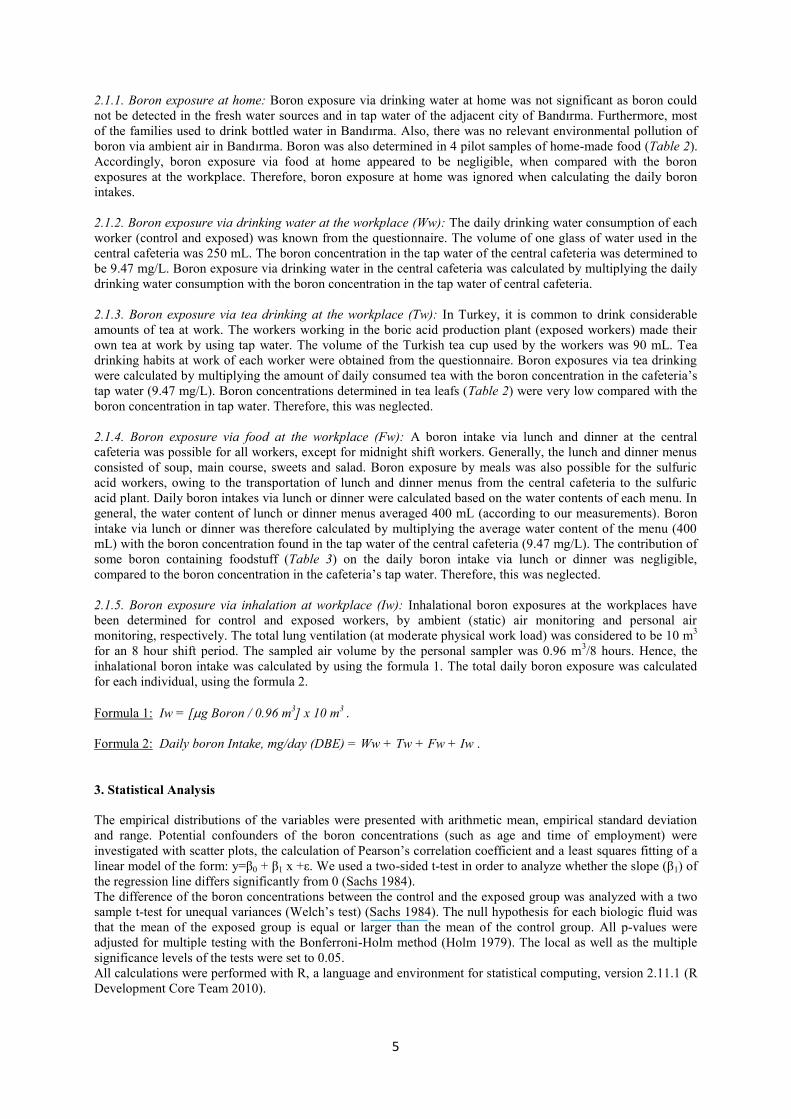
2.1.5. Boron exposure via inhalation at workplace (Iw): Inhalational boron exposures at the workplaces havebeen determined for control and exposed workers, by ambient (static) air monitoring and personal airmonitoring, respectively. The total lung ventilation (at moderate physical work load) was considered to be 10 m3
for an 8 hour shift period. The sampled air volume by the personal sampler was 0.96 m3/8 hours. Hence, theinhalational boron intake was calculated by using the formula 1. The total daily boron exposure was calculatedfor each individual, using the formula 2.
Formula 1: Iw = [g Boron / 0.96 m3] x 10 m3 .
Formula 2: Daily boron Intake, mg/day (DBE) = Ww + Tw + Fw + Iw .
3. Statistical Analysis
The empirical distributions of the variables were presented with arithmetic mean, empirical standard deviationand range. Potential confounders of the boron concentrations (such as age and time of employment) wereinvestigated with scatter plots, the calculation of Pearson’s correlation coefficient and a least squares fitting of alinear model of the form: y=β0 + β1 x +ε. We used a two-sided t-test in order to analyze whether the slope (β1) ofthe regression line differs significantly from 0 (Sachs 1984).The difference of the boron concentrations between the control and the exposed group was analyzed with a twosample t-test for unequal variances (Welch’s test) (Sachs 1984). The null hypothesis for each biologic fluid wasthat the mean of the exposed group is equal or larger than the mean of the control group. All p-values wereadjusted for multiple testing with the Bonferroni-Holm method (Holm 1979). The local as well as the multiplesignificance levels of the tests were set to 0.05.All calculations were performed with R, a language and environment for statistical computing, version 2.11.1 (RDevelopment Core Team 2010).
6
4. Result Tables
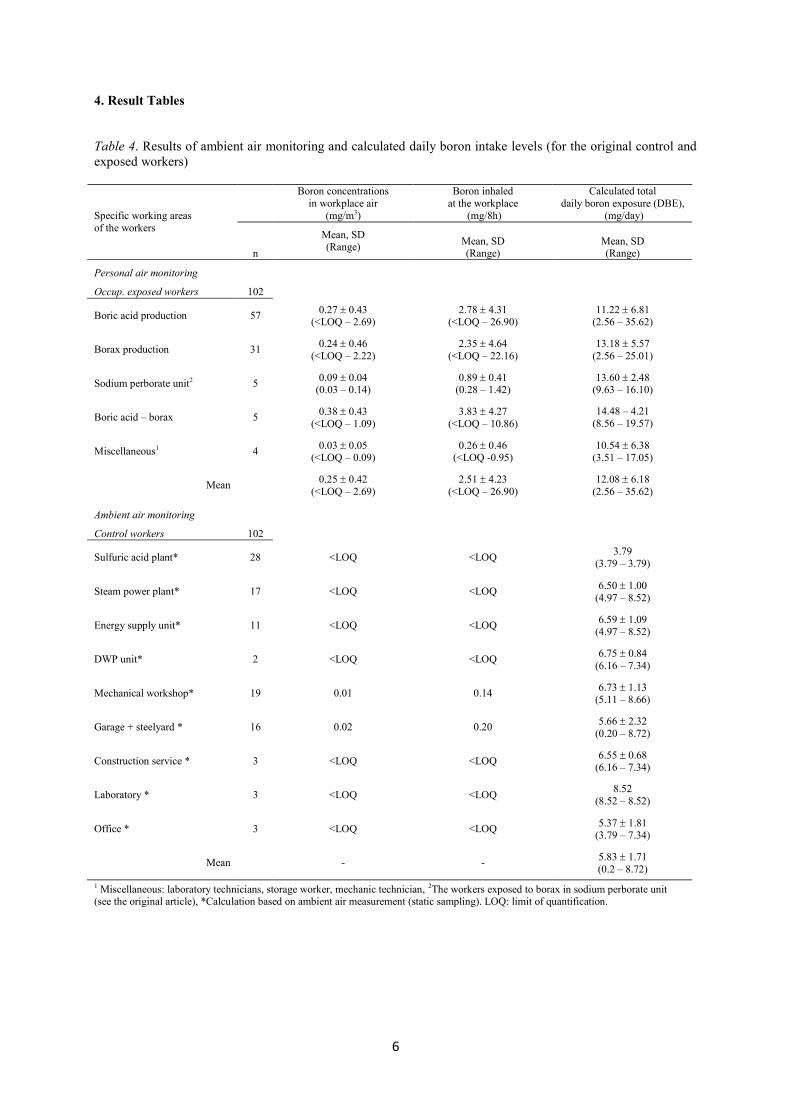
Table 4. Results of ambient air monitoring and calculated daily boron intake levels (for the original control andexposed workers)
Boron concentrationsin workplace air
(mg/m3)
Boron inhaledat the workplace
(mg/8h)
Calculated totaldaily boron exposure (DBE),
(mg/day)Specific working areasof the workers
n
Mean, SD(Range) Mean, SD
(Range)Mean, SD(Range)
Personal air monitoring
Occup. exposed workers 102
Boric acid production 57 0.27 0.43(<LOQ – 2.69)
2.78 4.31(<LOQ – 26.90)
11.22 6.81(2.56 – 35.62)
Borax production 31 0.24 0.46(<LOQ – 2.22)
2.35 4.64(<LOQ – 22.16)
13.18 5.57(2.56 – 25.01)
Sodium perborate unit2 5 0.09 0.04(0.03 – 0.14)
0.89 0.41(0.28 – 1.42)
13.60 2.48(9.63 – 16.10)
Boric acid – borax 5 0.38 0.43(<LOQ – 1.09)
3.83 4.27(<LOQ – 10.86)
14.48 – 4.21(8.56 – 19.57)
Miscellaneous1 4 0.03 0.05(<LOQ – 0.09)
0.26 0.46(<LOQ -0.95)
10.54 6.38(3.51 – 17.05)
Mean 0.25 0.42(<LOQ – 2.69)
2.51 4.23(<LOQ – 26.90)
12.08 6.18(2.56 – 35.62)
Ambient air monitoring
Control workers 102
Sulfuric acid plant* 28 <LOQ <LOQ 3.79(3.79 – 3.79)
Steam power plant* 17 <LOQ <LOQ 6.50 1.00(4.97 – 8.52)
Energy supply unit* 11 <LOQ <LOQ 6.59 1.09(4.97 – 8.52)
DWP unit* 2 <LOQ <LOQ 6.75 0.84(6.16 – 7.34)
Mechanical workshop* 19 0.01 0.14 6.73 1.13(5.11 – 8.66)
Garage + steelyard * 16 0.02 0.20 5.66 2.32(0.20 – 8.72)
Construction service * 3 <LOQ <LOQ 6.55 0.68(6.16 – 7.34)
Laboratory * 3 <LOQ <LOQ 8.52(8.52 – 8.52)
Office * 3 <LOQ <LOQ 5.37 1.81(3.79 – 7.34)
Mean - - 5.83 1.71(0.2 – 8.72)
1 Miscellaneous: laboratory technicians, storage worker, mechanic technician, 2The workers exposed to borax in sodium perborate unit(see the original article), *Calculation based on ambient air measurement (static sampling). LOQ: limit of quantification.
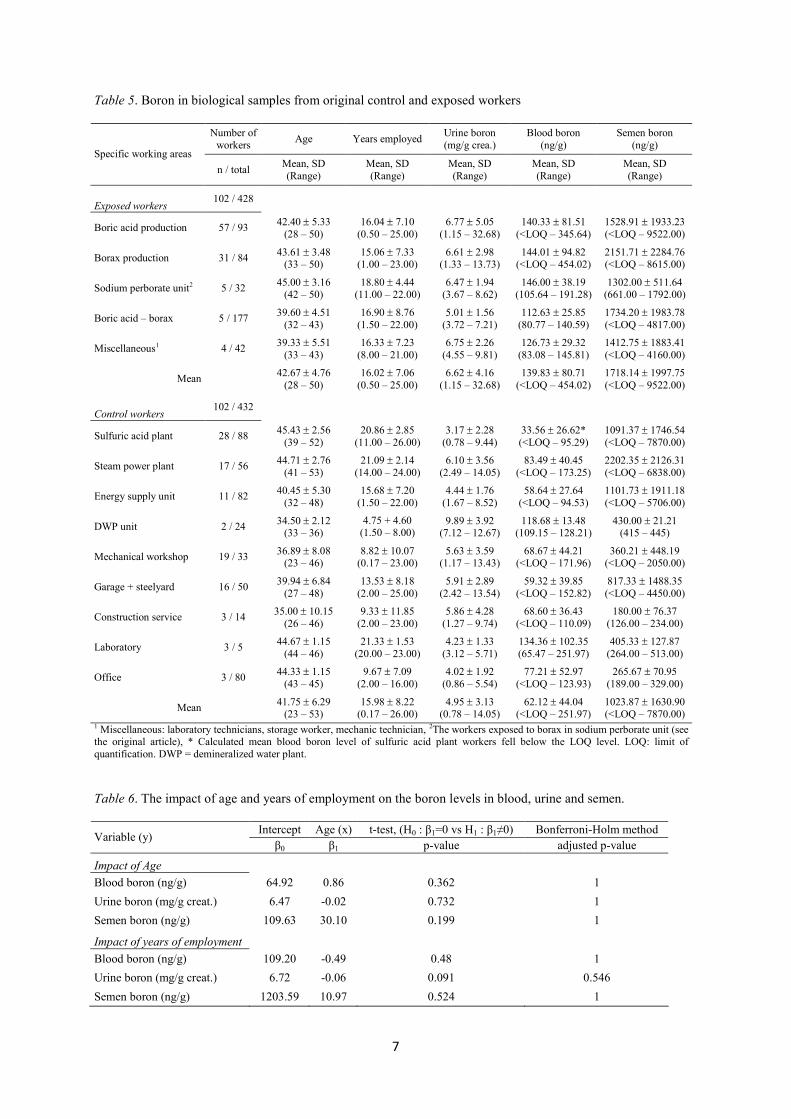
7
Table 5. Boron in biological samples from original control and exposed workers
Number ofworkers Age Years employed Urine boron
(mg/g crea.)Blood boron
(ng/g)Semen boron
(ng/g)Specific working areas
n / total Mean, SD(Range)
Mean, SD(Range)
Mean, SD(Range)
Mean, SD(Range)
Mean, SD(Range)
Exposed workers102 / 428
Boric acid production 57 / 93 42.40 5.33(28 – 50)
16.04 7.10(0.50 – 25.00)
6.77 5.05(1.15 – 32.68)
140.33 81.51(<LOQ – 345.64)
1528.91 1933.23(<LOQ – 9522.00)
Borax production 31 / 84 43.61 3.48(33 – 50)
15.06 7.33(1.00 – 23.00)
6.61 2.98(1.33 – 13.73)
144.01 94.82(<LOQ – 454.02)
2151.71 2284.76(<LOQ – 8615.00)
Sodium perborate unit2 5 / 32 45.00 3.16(42 – 50)
18.80 4.44(11.00 – 22.00)
6.47 1.94(3.67 – 8.62)
146.00 38.19(105.64 – 191.28)
1302.00 511.64(661.00 – 1792.00)
Boric acid – borax 5 / 177 39.60 4.51(32 – 43)
16.90 8.76(1.50 – 22.00)
5.01 1.56(3.72 – 7.21)
112.63 25.85(80.77 – 140.59)
1734.20 1983.78(<LOQ – 4817.00)
Miscellaneous1 4 / 42 39.33 5.51(33 – 43)
16.33 7.23(8.00 – 21.00)
6.75 2.26(4.55 – 9.81)
126.73 29.32(83.08 – 145.81)
1412.75 1883.41(<LOQ – 4160.00)
Mean 42.67 4.76(28 – 50)
16.02 7.06(0.50 – 25.00)
6.62 4.16(1.15 – 32.68)
139.83 80.71(<LOQ – 454.02)
1718.14 1997.75(<LOQ – 9522.00)
Control workers102 / 432
Sulfuric acid plant 28 / 88 45.43 2.56(39 – 52)
20.86 2.85(11.00 – 26.00)
3.17 2.28(0.78 – 9.44)
33.56 26.62*(<LOQ – 95.29)
1091.37 1746.54(<LOQ – 7870.00)
Steam power plant 17 / 56 44.71 2.76(41 – 53)
21.09 2.14(14.00 – 24.00)
6.10 3.56(2.49 – 14.05)
83.49 40.45(<LOQ – 173.25)
2202.35 2126.31(<LOQ – 6838.00)
Energy supply unit 11 / 82 40.45 5.30(32 – 48)
15.68 7.20(1.50 – 22.00)
4.44 1.76(1.67 – 8.52)
58.64 27.64(<LOQ – 94.53)
1101.73 1911.18(<LOQ – 5706.00)
DWP unit 2 / 24 34.50 2.12(33 – 36)
4.75 + 4.60(1.50 – 8.00)
9.89 3.92(7.12 – 12.67)
118.68 13.48(109.15 – 128.21)
430.00 21.21(415 – 445)
Mechanical workshop 19 / 33 36.89 8.08(23 – 46)
8.82 10.07(0.17 – 23.00)
5.63 3.59(1.17 – 13.43)
68.67 44.21(<LOQ – 171.96)
360.21 448.19(<LOQ – 2050.00)
Garage + steelyard 16 / 50 39.94 6.84(27 – 48)
13.53 8.18(2.00 – 25.00)
5.91 2.89(2.42 – 13.54)
59.32 39.85(<LOQ – 152.82)
817.33 1488.35(<LOQ – 4450.00)
Construction service 3 / 14 35.00 10.15(26 – 46)
9.33 11.85(2.00 – 23.00)
5.86 4.28(1.27 – 9.74)
68.60 36.43(<LOQ – 110.09)
180.00 76.37(126.00 – 234.00)
Laboratory 3 / 5 44.67 1.15(44 – 46)
21.33 1.53(20.00 – 23.00)
4.23 1.33(3.12 – 5.71)
134.36 102.35(65.47 – 251.97)
405.33 127.87(264.00 – 513.00)
Office 3 / 80 44.33 1.15(43 – 45)
9.67 7.09(2.00 – 16.00)
4.02 1.92(0.86 – 5.54)
77.21 52.97(<LOQ – 123.93)
265.67 70.95(189.00 – 329.00)
Mean 41.75 6.29(23 – 53)
15.98 8.22(0.17 – 26.00)
4.95 3.13(0.78 – 14.05)
62.12 44.04(<LOQ – 251.97)
1023.87 1630.90(<LOQ – 7870.00)
1 Miscellaneous: laboratory technicians, storage worker, mechanic technician, 2The workers exposed to borax in sodium perborate unit (seethe original article), * Calculated mean blood boron level of sulfuric acid plant workers fell below the LOQ level. LOQ: limit ofquantification. DWP = demineralized water plant.
Table 6. The impact of age and years of employment on the boron levels in blood, urine and semen.
Intercept Age (x) t-test, (H0 : β1=0 vs H1 : β1≠0) Bonferroni-Holm methodVariable (y)β0 β1 p-value adjusted p-value
Impact of AgeBlood boron (ng/g) 64.92 0.86 0.362 1Urine boron (mg/g creat.) 6.47 -0.02 0.732 1Semen boron (ng/g) 109.63 30.10 0.199 1
Impact of years of employmentBlood boron (ng/g) 109.20 -0.49 0.48 1Urine boron (mg/g creat.) 6.72 -0.06 0.091 0.546Semen boron (ng/g) 1203.59 10.97 0.524 1
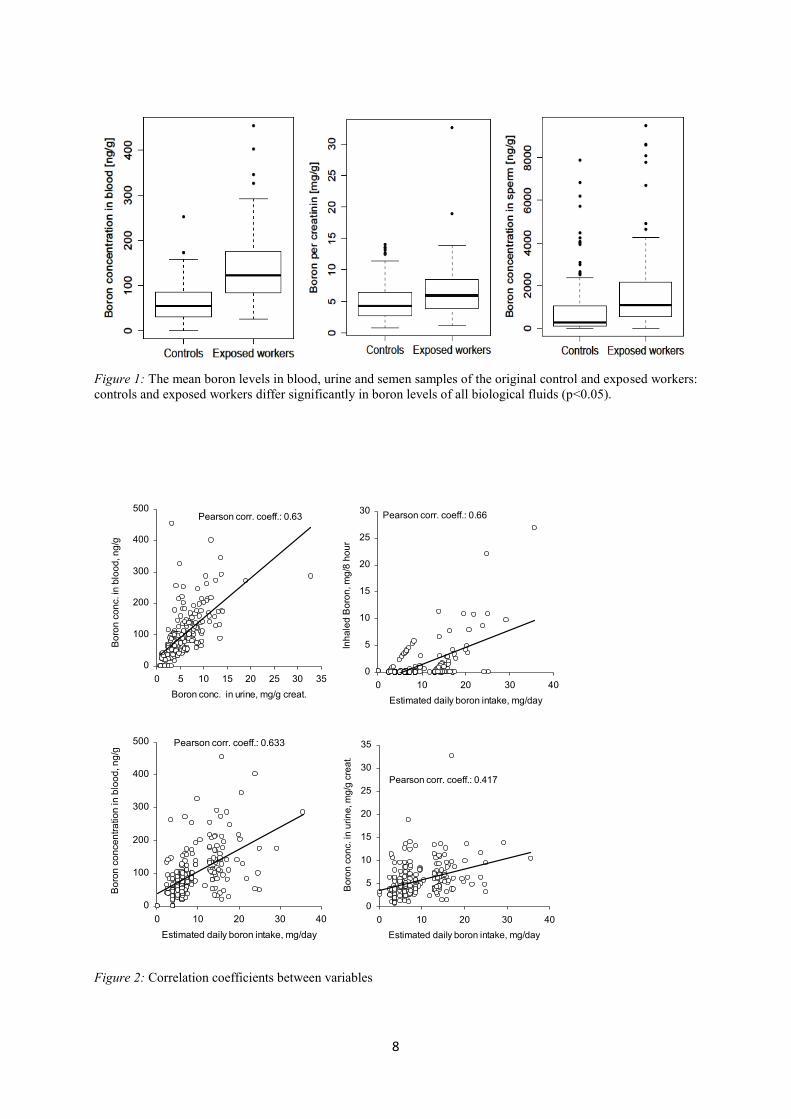
8
Figure 1: The mean boron levels in blood, urine and semen samples of the original control and exposed workers:controls and exposed workers differ significantly in boron levels of all biological fluids (p<0.05).
Figure 2: Correlation coefficients between variables
Pearson corr. coeff.: 0.63
0
100
200
300
400
500
0 5 10 15 20 25 30 35Boron conc. in urine, mg/g creat.
Bor
on c
onc.
in b
lood
, ng/
g...
Pearson corr. coeff.: 0.66
0
5
10
15
20
25
30
0 10 20 30 40Estimated daily boron intake, mg/day
Inha
led
Bor
on, m
g/8
hour…
...
Pearson corr. coeff.: 0.633
0
100
200
300
400
500
0 10 20 30 40Estimated daily boron intake, mg/day
Bor
on c
once
ntra
tion
in b
lood
, ng/
g….
Pearson corr. coeff.: 0.417
0
5
10
15
20
25
30
35
0 10 20 30 40Estimated daily boron intake, mg/day
Bor
on c
onc.
in u
rine,
mg/
g cr
eat.
9
ANNEX II
BIOLOGICAL RESULTS VERSUS CALCULATED DAILY BORON EXPOSURE (DBE) LEVELS
As explained in the original article, a surprising result of the study was the unexpectedly high boron exposure byfood and water. Therefore, the workers initially assigned as “control” or “exposed” group were re-classified intwo different ways. The first way was to re-classify the workers according to their blood boron levels (internalexposure). All biological data were interpreted along with the blood boron levels in the original article. Thesecond way was to re-classify the workers versus calculated DBE levels (external exposure). This was used forconfirmation. The biological outcomes versus the calculated DBE levels are presented in this annex.
1. Re-classification of the workers as per exposure scenarios
Four main boron exposure sources have been identified for the workers as mentioned previously. These were;drinking water at workplace (Ww), tea drinking at workplace (Tw), food (lunch or dinner) at workplace (Fw),and air (inhalation) at workplace (Iw). These main sources of boron exposure have been taken into considerationin re-constituting the exposure groups. Accordingly, 5 exposure groups were formed and named as groups 0, 1,2, 3, and 4.Group 0: workers in which boron exposure through lunch and water supply could be excluded. These were twogarage workers/drivers, not having lunch in the central cafeteria.Group 1: lunch as the only source of boron exposure. This group consisted of the sulfuric acid plant workers(n=28). The sulfuric acid plant was distant from the boric acid production zone. These workers had the samelunch meals as the boric acid production workers.Group 2: exposure to boron mainly via lunch and drinking water. The group consisted of 72 workers; 37workers in this group were mainly exposed to boron via lunch and drinking water only. The remaining 35workers were additionally exposed to boron via inhalation. However, this inhalational daily boron exposure wasvery low (0.14 – 0.20 mg B/8h).Group 3: drinking water, tea drinking, and workplace air (inhalation) being the main sources of boron exposure.Forty-one workers were classified in this group. Lunch was not a source of boron exposure for these workers,owing to sampling period of this study. These group of workers were working in the midnight shift (24:00 –08:00 h) for the month, during which the samplings were performed. Lunch or dinner was not provided in thisshift. Tea drinking was an important source in this group. The workers working in the boric acid productionplant (exposed workers) made their own tea at work by using the plant’s tap water (containing 9.47 mg boron/L).Group 4: lunch, drinking water, tea drinking, and workplace air (inhalation) as main sources of boron exposurefor the workers included into this group (n=61).Groups 0, 1, and 2 were consisted of the initially defined “control group”, Group 3 and 4 were consisted of theinitially defined “exposed group” (Table 6).
2. Statistical analysis
The data are presented separately for the five groups and summarized by the mean, the empirical standarddeviation and the range. Group 0 was excluded from all statistical tests since it consisted of only twoobservations, which is not sufficient. All statistical tests were performed with R, a language and environment forstatistical computing, version 2.11.1 (R Development Core Team 2010). In order to investigate the globalhypotheses, that the means of the four groups are equal, a Kruskal-Wallis test was used for most of the variables.If the resulting p-value was significant (p<0.05), the Mann-Whitney U test was applied to find distinctdifferences between each of the pairs of groups. The corresponding six p-values were adjusted with theBonferroni-Holm method for each variable in order to account for the problem of multiple testing (Holm 1979).For the semen boron variable a Brunner-Munzel test (Brunner and Munzel 2000) was employed to compare eachpair of the group means as the variances of this variable differ strongly between the groups. The dependence ofthe groups and the categorical variables (pH, cytoplasmic droplets) was analyzed with Fisher's exact test. Again,the Bonferroni-Holm method was applied to adjust each of the six p-values. For the sake of comparison with theresults in Xing et al. (2008), a pointwise prediction interval for the log DBE was calculated with log semenboron, log urine boron and log blood boron as independent variable. Furthermore Pearson’s correlationcoefficient between log DBE and each of the log boron concentrations in the three biologic fluids is presented.
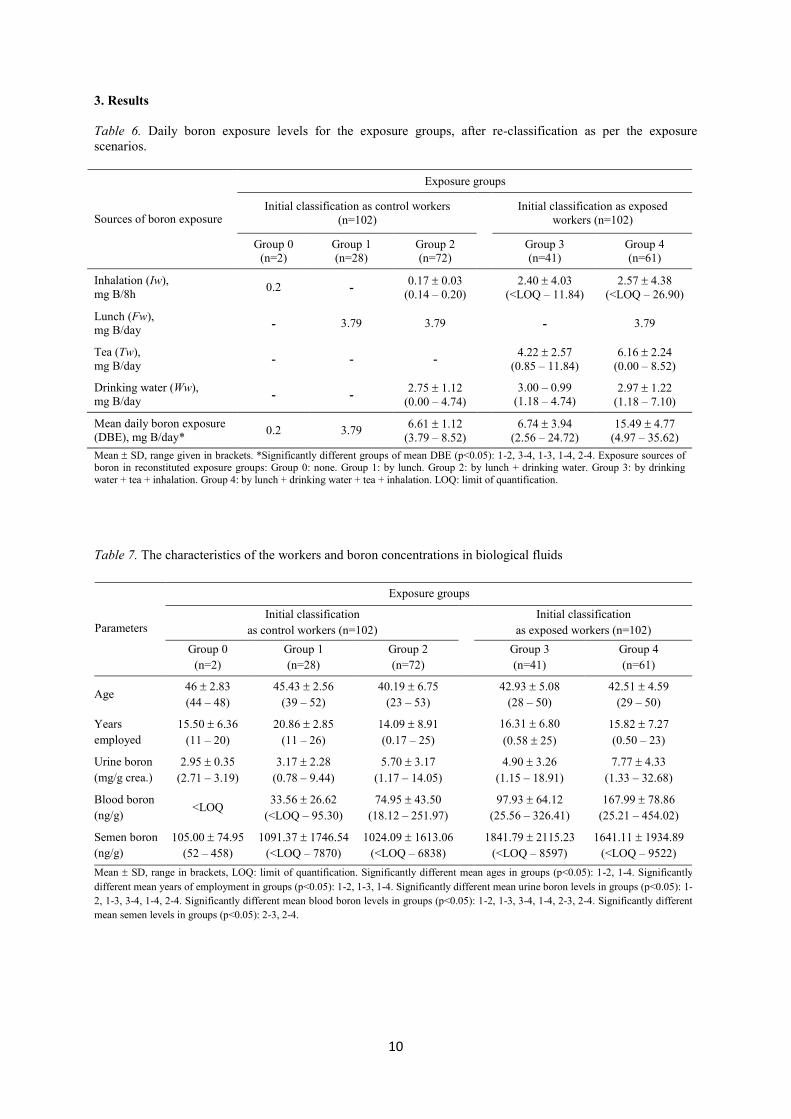
10
3. Results
Table 6. Daily boron exposure levels for the exposure groups, after re-classification as per the exposurescenarios.
Exposure groups
Initial classification as control workers(n=102)
Initial classification as exposedworkers (n=102)Sources of boron exposure
Group 0(n=2)
Group 1(n=28)
Group 2(n=72)
Group 3(n=41)
Group 4(n=61)
Inhalation (Iw),mg B/8h 0.2 - 0.17 0.03
(0.14 – 0.20)2.40 4.03
(<LOQ – 11.84)2.57 4.38
(<LOQ – 26.90)
Lunch (Fw),mg B/day - 3.79 3.79 - 3.79
Tea (Tw),mg B/day - - - 4.22 2.57
(0.85 – 11.84)6.16 2.24
(0.00 – 8.52)
Drinking water (Ww),mg B/day - - 2.75 1.12
(0.00 – 4.74)3.00 – 0.99
(1.18 – 4.74)2.97 1.22
(1.18 – 7.10)
Mean daily boron exposure(DBE), mg B/day* 0.2 3.79 6.61 1.12
(3.79 – 8.52)6.74 3.94
(2.56 – 24.72)15.49 4.77
(4.97 – 35.62)Mean SD, range given in brackets. *Significantly different groups of mean DBE (p<0.05): 1-2, 3-4, 1-3, 1-4, 2-4. Exposure sources ofboron in reconstituted exposure groups: Group 0: none. Group 1: by lunch. Group 2: by lunch + drinking water. Group 3: by drinkingwater + tea + inhalation. Group 4: by lunch + drinking water + tea + inhalation. LOQ: limit of quantification.
Table 7. The characteristics of the workers and boron concentrations in biological fluids
Exposure groups
Initial classificationas control workers (n=102)
Initial classificationas exposed workers (n=102)Parameters
Group 0(n=2)
Group 1(n=28)
Group 2(n=72)
Group 3(n=41)
Group 4(n=61)
Age 46 2.83(44 – 48)
45.43 2.56(39 – 52)
40.19 6.75(23 – 53)
42.93 5.08(28 – 50)
42.51 4.59(29 – 50)
Yearsemployed
15.50 6.36(11 – 20)
20.86 2.85(11 – 26)
14.09 8.91(0.17 – 25)
16.31 6.80(0.58 25)
15.82 7.27(0.50 – 23)
Urine boron(mg/g crea.)
2.95 0.35(2.71 – 3.19)
3.17 2.28(0.78 – 9.44)
5.70 3.17(1.17 – 14.05)
4.90 3.26(1.15 – 18.91)
7.77 4.33(1.33 – 32.68)
Blood boron(ng/g)
<LOQ 33.56 26.62(<LOQ – 95.30)
74.95 43.50(18.12 – 251.97)
97.93 64.12(25.56 – 326.41)
167.99 78.86(25.21 – 454.02)
Semen boron(ng/g)
105.00 74.95(52 – 458)
1091.37 1746.54(<LOQ – 7870)
1024.09 1613.06(<LOQ – 6838)
1841.79 2115.23(<LOQ – 8597)
1641.11 1934.89(<LOQ – 9522)
Mean SD, range in brackets, LOQ: limit of quantification. Significantly different mean ages in groups (p<0.05): 1-2, 1-4. Significantlydifferent mean years of employment in groups (p<0.05): 1-2, 1-3, 1-4. Significantly different mean urine boron levels in groups (p<0.05): 1-2, 1-3, 3-4, 1-4, 2-4. Significantly different mean blood boron levels in groups (p<0.05): 1-2, 1-3, 3-4, 1-4, 2-3, 2-4. Significantly differentmean semen levels in groups (p<0.05): 2-3, 2-4.
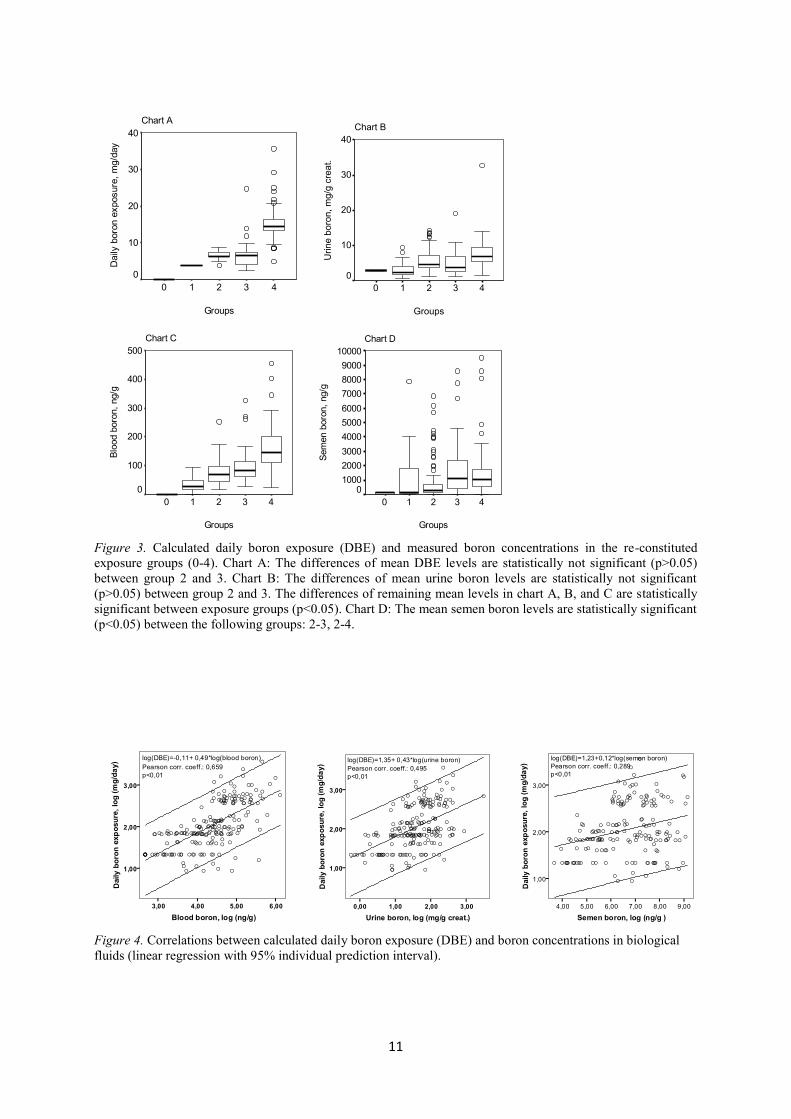
11
Chart A
Groups
43210
Dai
ly b
oron
exp
osur
e, m
g/da
y
40
30
20
10
0
Chart B
Groups
43210
Urin
e bo
ron,
mg/
g cr
eat.
40
30
20
10
0
,
,
,,,,,,
,,
Chart C
Groups
43210
Bloo
d bo
ron,
ng/
g
500
400
300
200
100
0
Chart D
Groups
43210
Sem
en b
oron
, ng/
g
10000900080007000600050004000300020001000
0
Figure 3. Calculated daily boron exposure (DBE) and measured boron concentrations in the re-constitutedexposure groups (0-4). Chart A: The differences of mean DBE levels are statistically not significant (p>0.05)between group 2 and 3. Chart B: The differences of mean urine boron levels are statistically not significant(p>0.05) between group 2 and 3. The differences of remaining mean levels in chart A, B, and C are statisticallysignificant between exposure groups (p<0.05). Chart D: The mean semen boron levels are statistically significant(p<0.05) between the following groups: 2-3, 2-4.
Figure 4. Correlations between calculated daily boron exposure (DBE) and boron concentrations in biologicalfluids (linear regression with 95% individual prediction interval).
log(DBE)=-0,11+ 0,49*log(blood boron)Pearson corr. coeff.: 0,659p<0,01
3,00 4,00 5,00 6,00
Blood boron, log (ng/g)
1,00
2,00
3,00
Dai
ly b
oron
exp
osur
e, lo
g (m
g/da
y)
log(DBE)=1,35+ 0,43*log(urine boron)Pearson corr. coeff.: 0,495p<0,01
0,00 1,00 2,00 3,00
Urine boron, log (mg/g creat.)
1,00
2,00
3,00
Dai
ly b
oron
exp
osur
e, lo
g (m
g/da
y)
log(DBE)=1,23+0,12*log(semen boron)Pearson corr. coeff.: 0,289p<0,01
4,00 5,00 6,00 7,00 8,00 9,00
Semen boron, log (ng/g )
1,00
2,00
3,00
Dai
ly b
oron
exp
osur
e, lo
g (m
g/da
y)
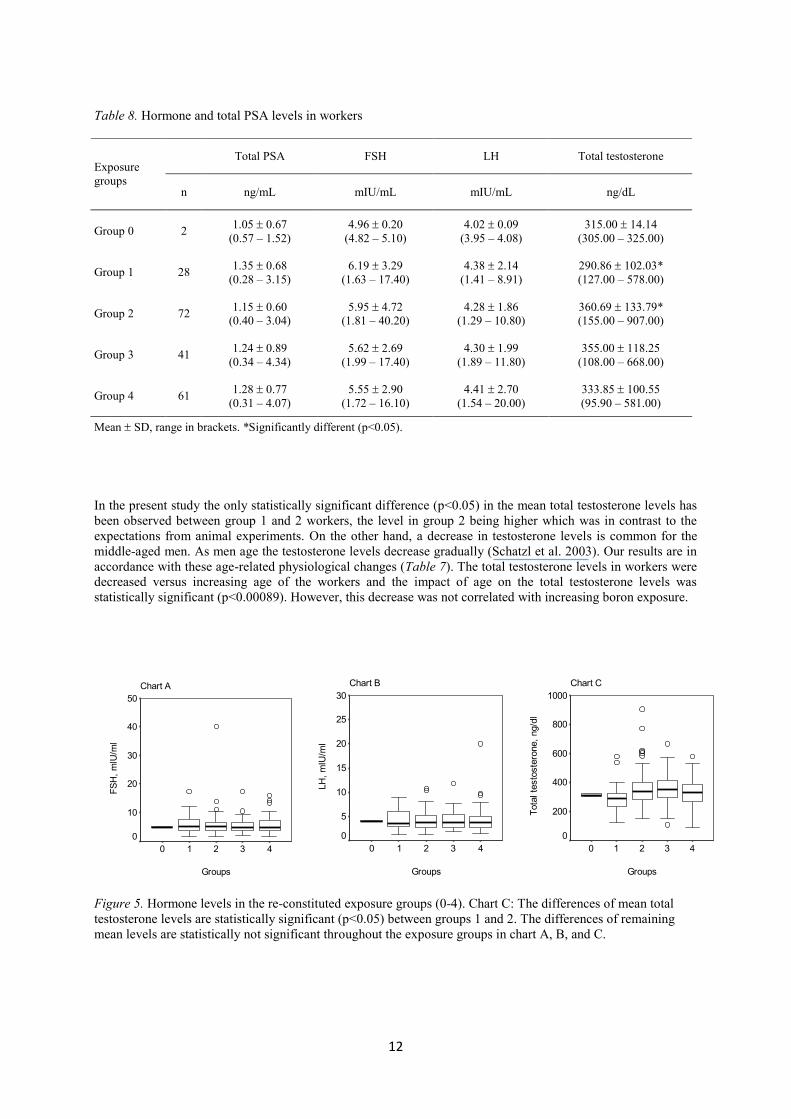
12
Table 8. Hormone and total PSA levels in workers
In the present study the only statistically significant difference (p<0.05) in the mean total testosterone levels hasbeen observed between group 1 and 2 workers, the level in group 2 being higher which was in contrast to theexpectations from animal experiments. On the other hand, a decrease in testosterone levels is common for themiddle-aged men. As men age the testosterone levels decrease gradually (Schatzl et al. 2003). Our results are inaccordance with these age-related physiological changes (Table 7). The total testosterone levels in workers weredecreased versus increasing age of the workers and the impact of age on the total testosterone levels wasstatistically significant (p<0.00089). However, this decrease was not correlated with increasing boron exposure.
Figure 5. Hormone levels in the re-constituted exposure groups (0-4). Chart C: The differences of mean totaltestosterone levels are statistically significant (p<0.05) between groups 1 and 2. The differences of remainingmean levels are statistically not significant throughout the exposure groups in chart A, B, and C.
Total PSA FSH LH Total testosteroneExposuregroups
n ng/mL mIU/mL mIU/mL ng/dL
Group 0 2 1.05 0.67(0.57 – 1.52)
4.96 0.20(4.82 – 5.10)
4.02 0.09(3.95 – 4.08)
315.00 14.14(305.00 – 325.00)
Group 1 28 1.35 0.68(0.28 – 3.15)
6.19 3.29(1.63 – 17.40)
4.38 2.14(1.41 – 8.91)
290.86 102.03*(127.00 – 578.00)
Group 2 72 1.15 0.60(0.40 – 3.04)
5.95 4.72(1.81 – 40.20)
4.28 1.86(1.29 – 10.80)
360.69 133.79*(155.00 – 907.00)
Group 3 41 1.24 0.89(0.34 – 4.34)
5.62 2.69(1.99 – 17.40)
4.30 1.99(1.89 – 11.80)
355.00 118.25(108.00 – 668.00)
Group 4 61 1.28 0.77(0.31 – 4.07)
5.55 2.90(1.72 – 16.10)
4.41 2.70(1.54 – 20.00)
333.85 100.55(95.90 – 581.00)
Mean SD, range in brackets. *Significantly different (p<0.05).
Chart A
Groups
43210
FSH
, mlU
/ml
50
40
30
20
10
0
Chart B
Groups
43210
LH, m
lU/m
l
30
25
20
15
10
5
0
Chart C
Groups
43210
Tota
l tes
tost
eron
e, n
g/dl
1000
800
600
400
200
0
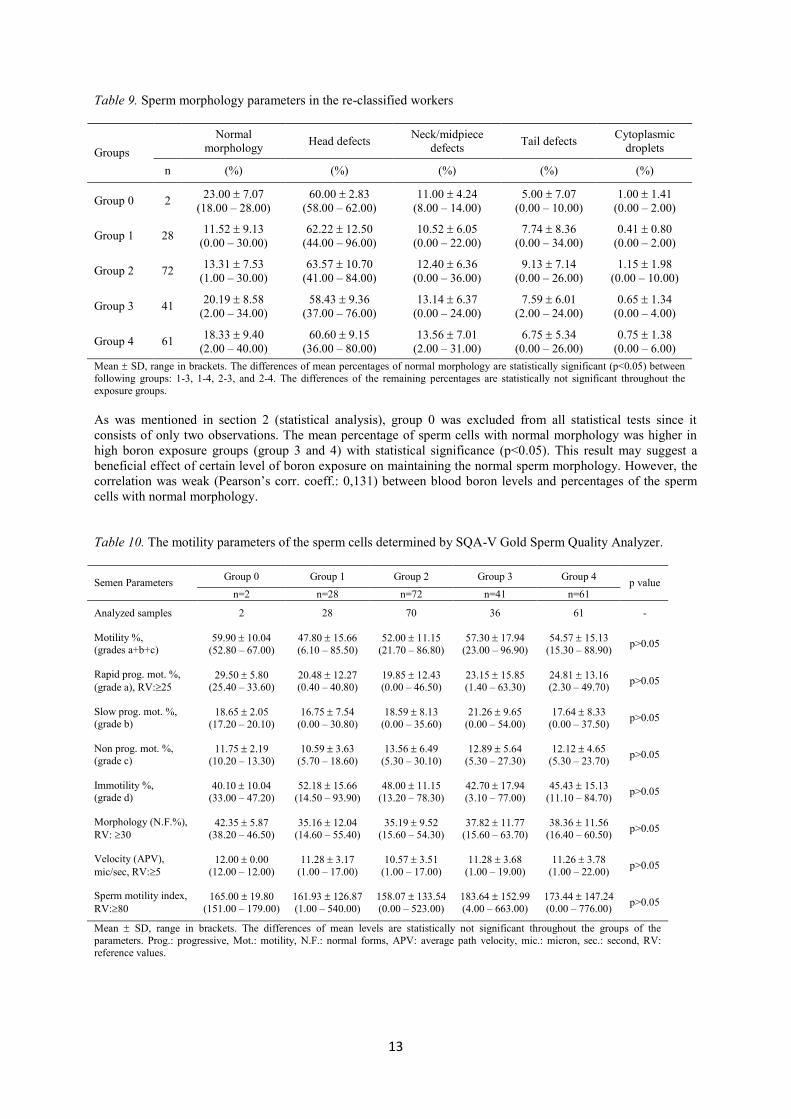
13
Table 9. Sperm morphology parameters in the re-classified workers
Normalmorphology Head defects Neck/midpiece
defects Tail defects CytoplasmicdropletsGroups
n (%) (%) (%) (%) (%)
Group 0 2 23.00 7.07(18.00 – 28.00)
60.00 2.83(58.00 – 62.00)
11.00 4.24(8.00 – 14.00)
5.00 7.07(0.00 – 10.00)
1.00 1.41(0.00 – 2.00)
Group 1 28 11.52 9.13(0.00 – 30.00)
62.22 12.50(44.00 – 96.00)
10.52 6.05(0.00 – 22.00)
7.74 8.36(0.00 – 34.00)
0.41 0.80(0.00 – 2.00)
Group 2 72 13.31 7.53(1.00 – 30.00)
63.57 10.70(41.00 – 84.00)
12.40 6.36(0.00 – 36.00)
9.13 7.14(0.00 – 26.00)
1.15 1.98(0.00 – 10.00)
Group 3 41 20.19 8.58(2.00 – 34.00)
58.43 9.36(37.00 – 76.00)
13.14 6.37(0.00 – 24.00)
7.59 6.01(2.00 – 24.00)
0.65 1.34(0.00 – 4.00)
Group 4 61 18.33 9.40(2.00 – 40.00)
60.60 9.15(36.00 – 80.00)
13.56 7.01(2.00 – 31.00)
6.75 5.34(0.00 – 26.00)
0.75 1.38(0.00 – 6.00)
Mean SD, range in brackets. The differences of mean percentages of normal morphology are statistically significant (p<0.05) betweenfollowing groups: 1-3, 1-4, 2-3, and 2-4. The differences of the remaining percentages are statistically not significant throughout theexposure groups.
As was mentioned in section 2 (statistical analysis), group 0 was excluded from all statistical tests since itconsists of only two observations. The mean percentage of sperm cells with normal morphology was higher inhigh boron exposure groups (group 3 and 4) with statistical significance (p<0.05). This result may suggest abeneficial effect of certain level of boron exposure on maintaining the normal sperm morphology. However, thecorrelation was weak (Pearson’s corr. coeff.: 0,131) between blood boron levels and percentages of the spermcells with normal morphology.
Table 10. The motility parameters of the sperm cells determined by SQA-V Gold Sperm Quality Analyzer.
Group 0 Group 1 Group 2 Group 3 Group 4Semen Parametersn=2 n=28 n=72 n=41 n=61
p value
Analyzed samples 2 28 70 36 61 -
Motility %,(grades a+b+c)
59.90 10.04(52.80 – 67.00)
47.80 15.66(6.10 – 85.50)
52.00 11.15(21.70 – 86.80)
57.30 17.94(23.00 – 96.90)
54.57 15.13(15.30 – 88.90) p>0.05
Rapid prog. mot. %,(grade a), RV:25
29.50 5.80(25.40 – 33.60)
20.48 12.27(0.40 – 40.80)
19.85 12.43(0.00 – 46.50)
23.15 15.85(1.40 – 63.30)
24.81 13.16(2.30 – 49.70) p>0.05
Slow prog. mot. %,(grade b)
18.65 2.05(17.20 – 20.10)
16.75 7.54(0.00 – 30.80)
18.59 8.13(0.00 – 35.60)
21.26 9.65(0.00 – 54.00)
17.64 8.33(0.00 – 37.50) p>0.05
Non prog. mot. %,(grade c)
11.75 2.19(10.20 – 13.30)
10.59 3.63(5.70 – 18.60)
13.56 6.49(5.30 – 30.10)
12.89 5.64(5.30 – 27.30)
12.12 4.65(5.30 – 23.70) p>0.05
Immotility %,(grade d)
40.10 10.04(33.00 – 47.20)
52.18 15.66(14.50 – 93.90)
48.00 11.15(13.20 – 78.30)
42.70 17.94(3.10 – 77.00)
45.43 15.13(11.10 – 84.70) p>0.05
Morphology (N.F.%),RV: 30
42.35 5.87(38.20 – 46.50)
35.16 12.04(14.60 – 55.40)
35.19 9.52(15.60 – 54.30)
37.82 11.77(15.60 – 63.70)
38.36 11.56(16.40 – 60.50) p>0.05
Velocity (APV),mic/sec, RV:5
12.00 0.00(12.00 – 12.00)
11.28 3.17(1.00 – 17.00)
10.57 3.51(1.00 – 17.00)
11.28 3.68(1.00 – 19.00)
11.26 3.78(1.00 – 22.00) p>0.05
Sperm motility index,RV:80
165.00 19.80(151.00 – 179.00)
161.93 126.87(1.00 – 540.00)
158.07 133.54(0.00 – 523.00)
183.64 152.99(4.00 – 663.00)
173.44 147.24(0.00 – 776.00) p>0.05
Mean SD, range in brackets. The differences of mean levels are statistically not significant throughout the groups of theparameters. Prog.: progressive, Mot.: motility, N.F.: normal forms, APV: average path velocity, mic.: micron, sec.: second, RV:reference values.
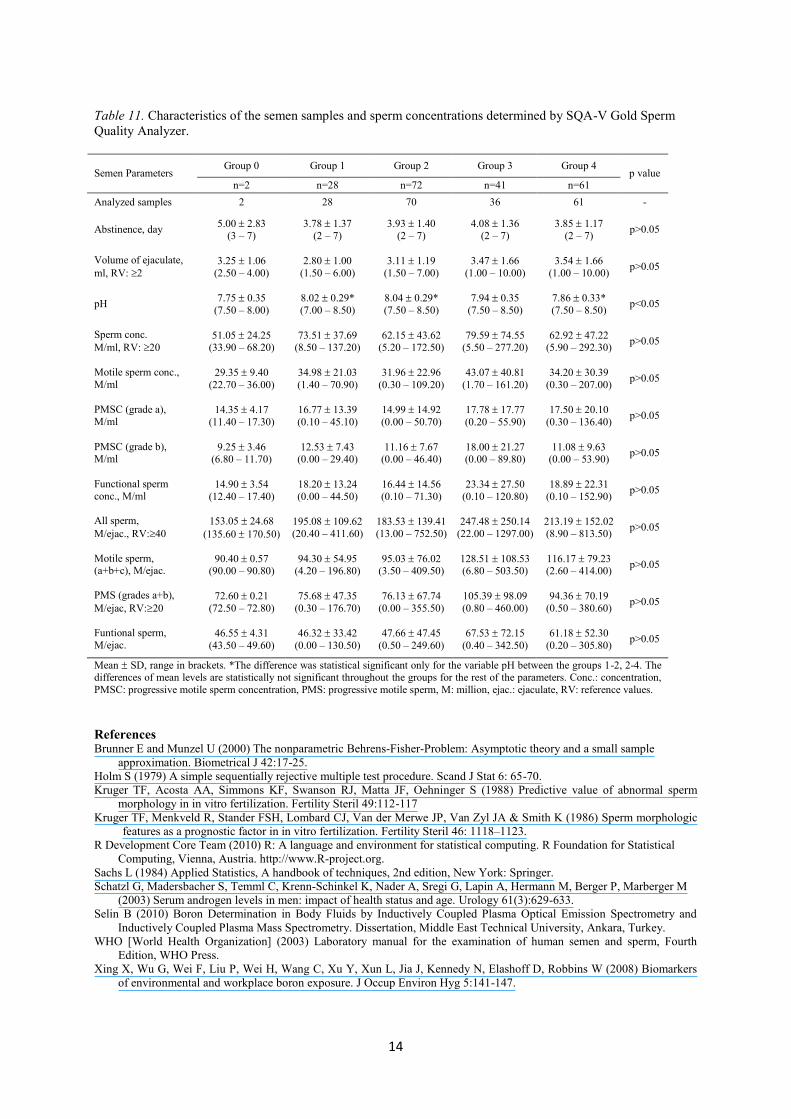
14
Table 11. Characteristics of the semen samples and sperm concentrations determined by SQA-V Gold SpermQuality Analyzer.
Group 0 Group 1 Group 2 Group 3 Group 4Semen Parameters
n=2 n=28 n=72 n=41 n=61p value
Analyzed samples 2 28 70 36 61 -
Abstinence, day 5.00 2.83(3 – 7)
3.78 1.37(2 – 7)
3.93 1.40(2 – 7)
4.08 1.36(2 – 7)
3.85 1.17(2 – 7) p>0.05
Volume of ejaculate,ml, RV: 2
3.25 1.06(2.50 – 4.00)
2.80 1.00(1.50 – 6.00)
3.11 1.19(1.50 – 7.00)
3.47 1.66(1.00 – 10.00)
3.54 1.66(1.00 – 10.00) p>0.05
pH 7.75 0.35(7.50 – 8.00)
8.02 0.29*(7.00 – 8.50)
8.04 0.29*(7.50 – 8.50)
7.94 0.35(7.50 – 8.50)
7.86 0.33*(7.50 – 8.50) p<0.05
Sperm conc.M/ml, RV: 20
51.05 24.25(33.90 – 68.20)
73.51 37.69(8.50 – 137.20)
62.15 43.62(5.20 – 172.50)
79.59 74.55(5.50 – 277.20)
62.92 47.22(5.90 – 292.30) p>0.05
Motile sperm conc.,M/ml
29.35 9.40(22.70 – 36.00)
34.98 21.03(1.40 – 70.90)
31.96 22.96(0.30 – 109.20)
43.07 40.81(1.70 – 161.20)
34.20 30.39(0.30 – 207.00) p>0.05
PMSC (grade a),M/ml
14.35 4.17(11.40 – 17.30)
16.77 13.39(0.10 – 45.10)
14.99 14.92(0.00 – 50.70)
17.78 17.77(0.20 – 55.90)
17.50 20.10(0.30 – 136.40) p>0.05
PMSC (grade b),M/ml
9.25 3.46(6.80 – 11.70)
12.53 7.43(0.00 – 29.40)
11.16 7.67(0.00 – 46.40)
18.00 21.27(0.00 – 89.80)
11.08 9.63(0.00 – 53.90) p>0.05
Functional spermconc., M/ml
14.90 3.54(12.40 – 17.40)
18.20 13.24(0.00 – 44.50)
16.44 14.56(0.10 – 71.30)
23.34 27.50(0.10 – 120.80)
18.89 22.31(0.10 – 152.90) p>0.05
All sperm,M/ejac., RV:40
153.05 24.68(135.60 170.50)
195.08 109.62(20.40 – 411.60)
183.53 139.41(13.00 – 752.50)
247.48 250.14(22.00 – 1297.00)
213.19 152.02(8.90 – 813.50) p>0.05
Motile sperm,(a+b+c), M/ejac.
90.40 0.57(90.00 – 90.80)
94.30 54.95(4.20 – 196.80)
95.03 76.02(3.50 – 409.50)
128.51 108.53(6.80 – 503.50)
116.17 79.23(2.60 – 414.00) p>0.05
PMS (grades a+b),M/ejac, RV:20
72.60 0.21(72.50 – 72.80)
75.68 47.35(0.30 – 176.70)
76.13 67.74(0.00 – 355.50)
105.39 98.09(0.80 – 460.00)
94.36 70.19(0.50 – 380.60) p>0.05
Funtional sperm,M/ejac.
46.55 4.31(43.50 – 49.60)
46.32 33.42(0.00 – 130.50)
47.66 47.45(0.50 – 249.60)
67.53 72.15(0.40 – 342.50)
61.18 52.30(0.20 – 305.80) p>0.05
Mean SD, range in brackets. *The difference was statistical significant only for the variable pH between the groups 1-2, 2-4. Thedifferences of mean levels are statistically not significant throughout the groups for the rest of the parameters. Conc.: concentration,PMSC: progressive motile sperm concentration, PMS: progressive motile sperm, M: million, ejac.: ejaculate, RV: reference values.
ReferencesBrunner E and Munzel U (2000) The nonparametric Behrens-Fisher-Problem: Asymptotic theory and a small sample
approximation. Biometrical J 42:17-25.Holm S (1979) A simple sequentially rejective multiple test procedure. Scand J Stat 6: 65-70.Kruger TF, Acosta AA, Simmons KF, Swanson RJ, Matta JF, Oehninger S (1988) Predictive value of abnormal sperm
morphology in in vitro fertilization. Fertility Steril 49:112-117Kruger TF, Menkveld R, Stander FSH, Lombard CJ, Van der Merwe JP, Van Zyl JA & Smith K (1986) Sperm morphologic
features as a prognostic factor in in vitro fertilization. Fertility Steril 46: 1118–1123.R Development Core Team (2010) R: A language and environment for statistical computing. R Foundation for Statistical
Computing, Vienna, Austria. http://www.R-project.org.Sachs L (1984) Applied Statistics, A handbook of techniques, 2nd edition, New York: Springer.Schatzl G, Madersbacher S, Temml C, Krenn-Schinkel K, Nader A, Sregi G, Lapin A, Hermann M, Berger P, Marberger M
(2003) Serum androgen levels in men: impact of health status and age. Urology 61(3):629-633.Selin B (2010) Boron Determination in Body Fluids by Inductively Coupled Plasma Optical Emission Spectrometry and
Inductively Coupled Plasma Mass Spectrometry. Dissertation, Middle East Technical University, Ankara, Turkey.WHO [World Health Organization] (2003) Laboratory manual for the examination of human semen and sperm, Fourth
Edition, WHO Press.Xing X, Wu G, Wei F, Liu P, Wei H, Wang C, Xu Y, Xun L, Jia J, Kennedy N, Elashoff D, Robbins W (2008) Biomarkers
of environmental and workplace boron exposure. J Occup Environ Hyg 5:141-147.
Related Documents