Evaluation of Fat Suppression in Contrast-Enhanced MR of Neoplastic and Inflammatory Spine Disease Bassem A. Georgy and John R. Hesselink PURPOSE: To determine the benefit of fat suppression in conjunction with gadolinium enhance- ment for evaluating neoplastic and inflammatory diseases of the spine. METHODS: Contrast- enhanced T1-weighted images were compared with the corresponding contrast-enhanced T1- weighted images with fat suppression in 14 patients with various neoplastic and inflammatory spine diseases. RESULTS: Contrast-enhanced T1-weighted images with fat suppression showed enhancing lesions in all cases of vertebral disease (five cases), but in one case some metastases did not enhance. Paravertebral (nine lesions), epidural (seven lesions), and intradural-extramedullary (six lesions) were delineated better with contrast-enhanced fat suppression. In the 14 cases (29 lesions), nine lesions were seen only on contrast-enhanced images with fat suppression. Integrity of the vertebral end plates was assessed more accurately on fat-suppressed images. CONCLUSION: Although noncontrast T1-weighted images are sufficient to screen for vertebral disease, contrast- enhanced images with fat suppression may detect additional lesions. Fat suppression should be used in conjunction with gadolinium for evaluating epidural, paravertebral , and intradural-extra- medullary spinal lesions. Index terms: Spine, inflammation; Spine, magnetic resonance; Spine, neoplasms; Magnetic resonance, contrast enhancement; Magnetic resonance, fat suppression AJNR Am J Neuroradiol 15:409-417, Mar 1994 Fat suppression in conjunction with gadolinium enhancement has been used successfully in mag- netic resonance (MR) imaging of the orbit (1), the head and neck (2), the upper abdomen (3), and breast implants (Middleton MS, Udkoff R, Mattrey R, Hesselink JR, Dobke M, Freeman WR, Silicone Suppression MRI Techniques in Breast Implant Imaging, abstract submitted to 1Oth Annual Meet- ing of the Society of the Magnetic Resonance Imaging, New York, April 25-29, 1992). Fat suppression improves visibility of subtle contrast enhancement by suppressing the high signal of fat, increasing the dynamic range of gray scale contrast, and eliminating the chemical shift arti- fact. Received December 22, 1992; accepted pending revision March 1, 1993; revision received May 14, 1993. From the Department of Radiology, School of Medicine, University of California, San Diego. Address reprint requests to John R. Hesselink, MD , Department of Radiology, University of California San Diego Medical Center, 200 West Arbor Dr, San Diego, CA 92103-8756. AJNR 15:409-417, Mar 1994 0195-6108/94/ 1503-0409 © American Society of Neuroradiology 409 The spine has a significant component of fat in the epidural space, neural foramina, and sur- rounding paras pinal structures. On T 1-weighted images the hyperintense fat improves contrast between diseased and normal tissues, but it often obscures enhancement after contrast infusion . Based on our favorable experience with fat suppression in other extracranial compartments, we sought to determine whether contrast-en- hanced studies performed with fat suppression improve the detection and evaluation of neoplas- tic and inflammatory diseases of the spine over routine non-fat-suppressed contrast-enhanced T1-weighted images. Materials and Methods MR images of the spine were reviewed retrospectively in 14 patients (10 female and 4 male), ranging in age from 3 to 73 years (average 37.1). Our study material includes five cases of metastatic spinal lesions, two paraspinal infections, two cases with follow-up scans of filum termi- nale ependymoma and lumbar arachnoid cyst, and one case each of sacral tumor , Hodgkin disease, postoperative arachnoiditis, neuroblastoma of the dorsal spine, and Guil- lain-Barre syndrome .

Welcome message from author
This document is posted to help you gain knowledge. Please leave a comment to let me know what you think about it! Share it to your friends and learn new things together.
Transcript

Evaluation of Fat Suppression in Contrast-Enhanced MR of Neoplastic and Inflammatory Spine Disease
Bassem A. Georgy and John R. Hesselink
PURPOSE: To determine the benefit of fat suppression in conjunction with gadolinium enhance
ment for evaluating neoplastic and inflammatory diseases of the spine. METHODS: Contrast
enhanced T1-weighted images were compared with the corresponding contrast-enhanced T1-
weighted images with fat suppression in 14 patients with various neoplastic and inflammatory
spine diseases. RESULTS: Contrast-enhanced T1-weighted images with fat suppression showed
enhancing lesions in all cases of vertebral disease (five cases), but in one case some metastases
did not enhance. Paravertebral (nine lesions), epidural (seven lesions), and intradural-extramedullary
(six lesions) were delineated better with contrast-enhanced fat suppression. In the 14 cases (29
lesions), nine lesions were seen only on contrast-enhanced images with fat suppression. Integrity
of the vertebral end plates was assessed more accurately on fat-suppressed images. CONCLUSION:
Although noncontrast T1-weighted images are sufficient to screen for vertebral disease, contrast
enhanced images with fat suppression may detect additional lesions. Fat suppression should be
used in conjunction with gadolinium for evaluating epidural, paravertebral , and intradural-extra
medullary spinal lesions.
Index terms: Spine, inflammation; Spine, magnetic resonance; Spine, neoplasms; Magnetic
resonance, contrast enhancement; Magnetic resonance, fat suppression
AJNR Am J Neuroradiol 15:409-417, Mar 1994
Fat suppression in conjunction with gadolinium enhancement has been used successfully in magnetic resonance (MR) imaging of the orbit (1), the head and neck (2), the upper abdomen (3), and breast implants (Middleton MS, Udkoff R, Mattrey R, Hesselink JR, Dobke M, Freeman WR, Silicone Suppression MRI Techniques in Breast Implant Imaging, abstract submitted to 1Oth Annual Meeting of the Society of the Magnetic Resonance Imaging, New York, April 25-29, 1992). Fat suppression improves visibility of subtle contrast enhancement by suppressing the high signal of fat, increasing the dynamic range of gray scale contrast, and eliminating the chemical shift artifact.
Received December 22, 1992; accepted pending revision March 1,
1993; revision received May 14, 1993. From the Department of Radiology, School of Medicine, University of
California, San Diego. Address reprint requests to John R. Hesselink, MD, Department of
Radiology, University of California San Diego Medical Center, 200 West
Arbor Dr, San Diego, CA 92103-8756.
AJNR 15:409-417, Mar 1994 0195-6108/ 94/ 1503-0409 © American Society of Neuroradiology
409
The spine has a significant component of fat in the epidural space, neural foramina, and surrounding paras pinal structures. On T 1-weighted images the hyperintense fat improves contrast between diseased and normal tissues, but it often obscures enhancement after contrast infusion . Based on our favorable experience with fat suppression in other extracranial compartments, we sought to determine whether contrast-enhanced studies performed with fat suppression improve the detection and evaluation of neoplastic and inflammatory diseases of the spine over routine non-fat-suppressed contrast-enhanced T1-weighted images.
Materials and Methods
MR images of the spine were reviewed retrospectively in 14 patients (10 female and 4 male), ranging in age from 3 to 73 years (average 37.1). Our study material includes five cases of metastatic spinal lesions, two paraspinal infections, two cases with follow-up scans of filum terminale ependymoma and lumbar arachnoid cyst, and one case each of sacral tumor, Hodgkin disease, postoperative arachnoiditis, neuroblastoma of the dorsal spine, and Guillain-Barre syndrome.
410 GEORGY AJNR: 15, March 1994
TABLE I: Comparison of enhanced images with and without fat suppression
Case Diagnosis Plane
Hodgkin Disease Axial
2 Metastatic lung carcinoma Axial
3 Guillain-Barre syndrome Axial
4 Postoperative arachnoiditis Axial
5 Staphylococcus septicemia Sagittal
6 Postoperative infection Sagittal
7 Follow-up filum terminale ependy- Sagittal
moma
8 Metastatic carcinoma prostate Sagittal
9 Neuroectodermal tumor of sacrum Coronal
10 Metastatic renal sarcoma Axial
II Metastatic lung carcinoma Axial
12 Follow-up lumbar arachnoid cyst Axial
13 Neuroblastoma Coronal
14 Metastatic lung carcinoma Sagittal
Enhancing Lesions
Vertebral
Epidural
Paravertebral
Vertebral
Epidural
Paravertebral
Psoas muscle
Enhancing nerve roots
Postoperative scar
Clumped/ enhancing nerve roots
2 enhancing rootlets
Dural enhancement
Paravertebral abscess
Dural enhancement
Paravertebral
Epidural
Enhancing nerve roots
Vertebral
Epidural
Vertebral
Epidural
Paravertebral
Vertebral
Paravertebral
Vertebral
Paravertebral
Epidural granulation tissue
Epidural involvement
Vertebral lesion
Better
With Fat
Suppression
++' ++
+
+ ++ + + +
++ ++ ++ ++ + +
++
+
+ + + + + +
++ + + +
No Difference
With Fat
Suppression
+
+
+
' ++ indicates lesion seen only in contrast-enhanced fat-suppressed images.
All examinations were done on a 1.5-T MR system with a surface coil. A selective excitation method of fat-suppression technique was used in all cases. Study sequences included a conventional unenhanced T1-weighted spinecho series (500-700/12-20/2,4 [repetition time/echo time/excitations)) and contrast-enhanced T1-weighted (500-700/12-20/2,4) images. Contrast-enhanced T1-weighted images (500-800/12-20/2,4) with fat suppression were obtained in all the cases for comparison. The repetition time was increased slightly for the fat-suppressed sequences to accommodate the same number and position of the corresponding sections without fat suppression. Both sequences were filmed with window widths and window levels that resulted in maximum conspicuity of the lesions. Contrast-enhanced images with fat suppression were done before contrast-enhanced T1-weighted images in eight cases, and the reverse order was used in the other six cases. Other MR parameters included field of view of 20-28 em, section thickness of 4 mm with a 2-mm intersection gap, and matrix of 256 X 128 or 256 X 192. For the enhanced images, the patients received intravenous injection of 0.1 mmol/kg of gadopentetate dimeglumine.
Pathologic diagnosis was available for all the primary spine and cord tumors and the primary lesions in all cases
of spine metastases. Diagnosis of metastatic lesions was further established with clinical follow-up. Diagnosis of Guillain-Barre syndrome was made by clinical and cerebrospinal fluid examination. Inflammatory diseases were proved by direct aspiration biopsy of the lesions. Diagnosis of postoperative arachnoiditis was established clinically and radiologically.
Enhanced images with and without fat suppression were carefully evaluated with regard to the ability to demonstrate normal anatomic details, conspicuity of lesions, delineation of lesion margins and extent, and detection of other lesions. Evaluation was done by two radiologists separately; in cases of disagreement the final results were determined by consensus. For more critical assessment, cases were reviewed on the basis of the anatomic location of the lesions. Consequently, we had seven vertebral lesions, nine paravertebral lesions, seven epidural lesions, and six intraduralextramedullary lesions.
Results
Table 1 summarizes the results obtained in all our study population. Normally enhanced vertebral venous plexus and nerve root ganglia were
AJNR: 15, March 1994
A B c
A B c
demonstrated clearly after using the fat-suppression technique. Of the seven vertebral lesions of the spine, six were seen better after fat suppression, and one was seen only after fat suppression. Metastatic lesions on Tl-weighted images were of lower signal intensity than the surrounding bone marrow. In contrast-enhanced fat-suppressed images, lesions enhanced against a low signal background of suppressed bone marrow fat. Comparing plain Tl-weighted, contrast-enhanced Tl-weighted, and contrast-enhanced fat-
FAT SUPPRESSION 411
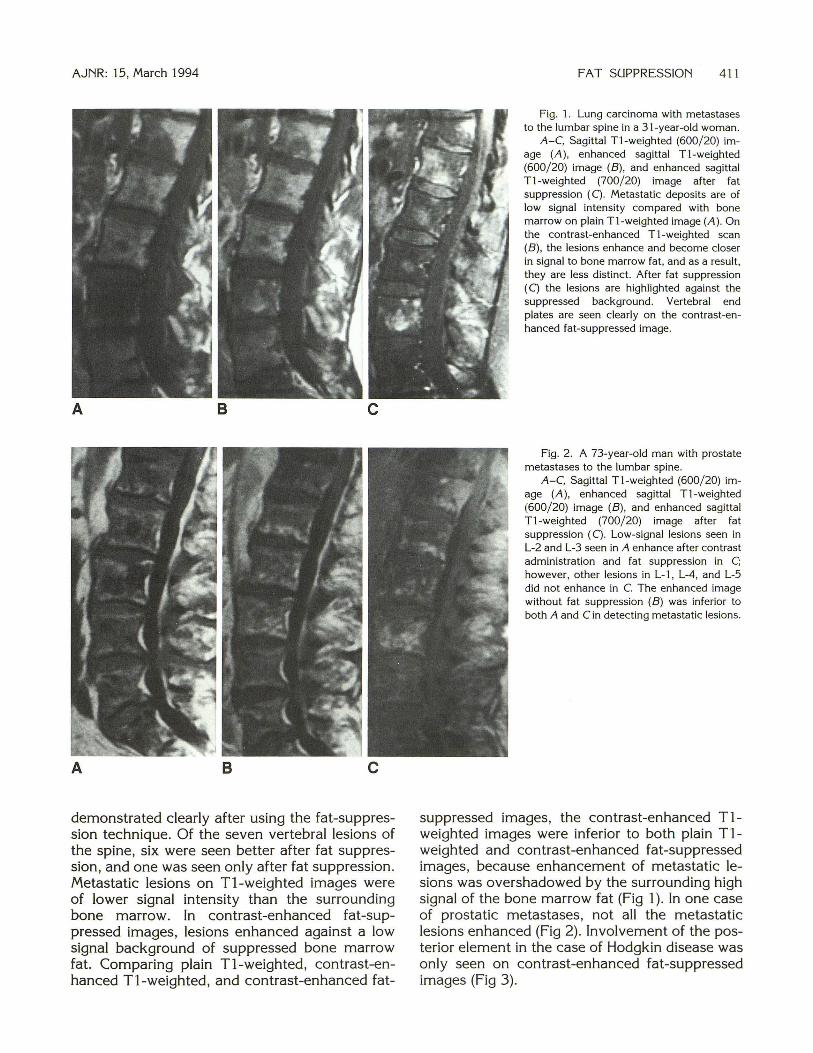
Fig. 1. Lung carcinoma with metastases to the lumbar spine in a 31-year-old woman.
A-C. Sagittal T1-weighted (600/20) image (A), enhanced sagittal T1-weighted (600/20) image (B), and enhanced sagittal T1-weighted (700/20) image after fat suppression (C) . Metastatic deposits are of low signal intensity compared with bone marrow on plain T1-weighted image (A). On the contrast-enhanced T1-weighted scan (B), the lesions enhance and become closer in signal to bone marrow fat, and as a result, they are less distinct. After fat suppression (C) the lesions are highlighted against the suppressed background. Vertebral end plates are seen clearly on the contrast-enhanced fat-suppressed image.
Fig . 2. A 73-year-old man with prostate metastases to the lumbar spine.
A-C, Sagittal T1-weighted (600/20) image (A), enhanced sagittal T1-weighted (600/20) image (B), and enhanced sagittal T1-weighted (700/ 20) image after fat suppression (C). Low-signal lesions seen in L-2 and L-3 seen in A enhance after contrast administration and fat suppression in C; however, other lesions in L-1, L-4 , and L-5 did not enhance in C. The enhanced image without fat suppression (B) was inferior to both A and C in detecting metastatic lesions.
suppressed images, the contrast-enhanced Tlweighted images were inferior to both plain Tlweighted and contrast-enhanced fat-suppressed images, because enhancement of metastatic lesions was overshadowed by the surrounding high signal of the bone marrow fat (Fig 1 ). In one case of prostatic metastases, not all the metastatic lesions enhanced (Fig 2). Involvement of the posterior element in the case of Hodgkin disease was only seen on contrast-enhanced fat-suppressed images (Fig 3).

412 GEORGY AJNR: 15, March 1994
A 8 c Fig. 3. 25-year-old woman with biopsy-proved Hodgkin disease. A-C, Enhanced sagittal T1-weighted (500/20) image (A), enhanced axial T1-weighted (650/12) image (B), and the corresponding
axial T1-weighted (750/20) image (C) after fat suppression. Enhancing vertebral, paravertebral, and epidural lesions are sharply delineated in A. Note also involvement of the posterior elements as well (arrow). Axial sections disclose a paraspinal mass (short arrow). Involvement of the right transverse process of the T-3 vertebra (long arrow) is seen only after using fat suppression in C.
In all cases of paravertebral and epidural lesions, either benign or malignant, both the paraspinal and the epidural lesions enhanced and were identified with clearly defined edges against a suppressed background on contrast-enhanced fat-suppressed images. Among the 16 lesions included in the study, four were seen only after fat suppression (Fig 4); 10 seen better after fat suppression (Fig 5); and two were equally displayed. Of the oblique coronal contrast-enhanced fat-suppressed and contrast-enhanced T1-weighted images in the case of neuroectodermal tumor of the sacrum, the paravertebral extension and its relation to the neural foramina were better appreciated on contrast-enhanced fat-suppressed images than on the contrast-enhanced T1-weighted images (Fig 6).
Among six intradural-extramedullary lesions included in the study, four were seen only after fat suppression, and the other two were better displayed after fat suppression. In the case of postoperative arachnoiditis (Fig 7) after laminectomy, a comparison of the axial enhanced images showed not only that the enhanced nerve roots were more clear on the fat-suppressed images, but also that two other lesions were detected only on this sequence; enhancement of the thecal sac
wall was seen along with two other enhancing nerve roots. Meningeal enhancement was seen only after fat suppression (Fig 4). Better delineation of the vertebral endplates (both superior and inferior) was noted on sagittal images after fat suppression in nearly all of the lumbar examinations.
Discussion
Fat suppression in conjunction with gadolinium enhancement has been proposed to improve contrast between enhancing lesions and background tissues on MR images (4). Several fat-suppression techniques have been described for MR imaging (5, 6).
Selective Excitation (Suppression) Method
In this method, a frequency-specific preexcitation pulse is used to excite fat protons selectively and is followed by a gradient spoiler pulse to dephase the excited protons and eliminate their signal. Then a conventional spin-echo pulse sequence is immediately applied to generate signal from the nonfat tissues that have not been saturated (7, 8). Because this method is based on
AJNR: 15, March 1994 FAT SUPPRESSION 413
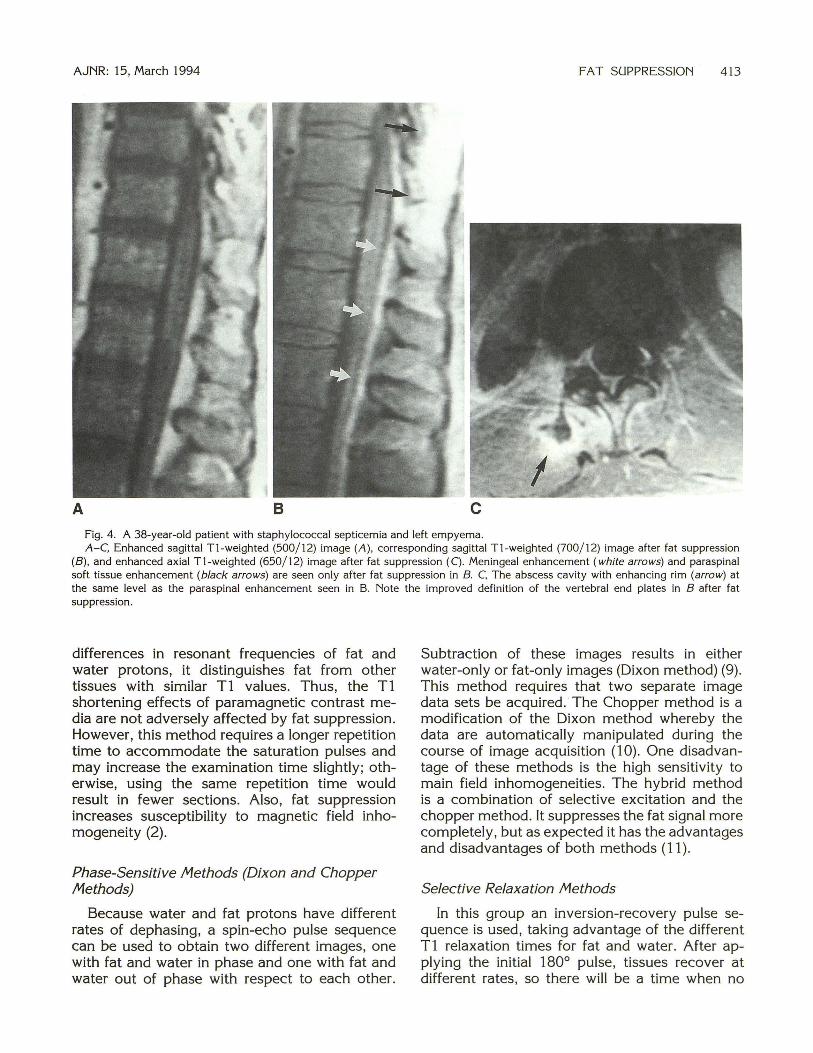
A B c Fig. 4. A 38-year-old patient with staphylococcal septicemia and left empyema. A-C, Enhanced sagittal T1-weighted (500/ 12) image (A), corresponding sagittal T1-weighted (700/ 12) image after fat suppression
(B), and enhanced axial T1-weighted (650/ 12) image after fat suppression (C) . Meningeal enhancement (white arrows) and paraspinal soft tissue enhancement (black arrows) are seen only after fat suppression in B. C, The abscess cavity with enhancing rim (arrow) at the same level as the paraspinal enhancement seen in B. Note the improved definition of the vertebral end plates in B after fat suppression.
differences in resonant frequencies of fat and water protons, it distinguishes fat from other tissues with similar Tl values. Thus, the T1 shortening effects of paramagnetic contrast media are not adversely affected by fat suppression. However, this method requires a longer repetition time to accommodate the saturation pulses and may increase the examination time slightly; otherwise, using the same repetition time would result in fewer sections. Also, fat suppression increases susceptibility to magnetic field inhomogeneity (2).
Phase-Sensitive Methods (Dixon and Chopper Methods)
Because water and fat protons have different rates of dephasing, a spin-echo pulse sequence can be used to obtain two different images, one with fat and water in phase and one with fat and water out of phase with respect to each other.
Subtraction of these images results in either water-only or fat-only images (Dixon method) (9). This method requires that two separate image data sets be acquired. The Chopper method is a modification of the Dixon method whereby the data are automatically manipulated during the course of image acquisition (10). One disadvantage of these methods is the high sensitivity to main field inhomogeneities. The hybrid method is a combination of selective excitation and the chopper method. It suppresses the fat signal more completely, but as expected it has the advantages and disadvantages of both methods (11).
Selective Relaxation Methods
In this group an inversion-recovery pulse sequence is used, taking advantage of the different T 1 relaxation times for fat and water. After applying the initial 180° pulse, tissues recover at different rates, so there will be a time when no

414 GEORGY AJNR: 15, March 1994
A B c Fig. 5. A 46-year-old woman with metastatic renal sarcoma to the lumbar spine. A-C, Enhanced sagittal Tl-weighted (700/ 12) image of the lumbar vertebrae after fat suppression (A), enhanced axial T1-weighted
(700/ 12) image (B), and the corresponding axial T1-weighted (800/12) image after fat suppression (C). Metastatic lesions enhance relative to the suppressed bone marrow background in A. Unenhanced areas may represent areas of necrosis or hemorrhage. Involvement of the vertebral body and the paravertebral extension (arrow) is seen more clearly after fat suppression in C.
net longitudinal magnetization remains from fat protons, but longitudinal magnetization from water still persists. If a spin-echo pulse sequence is applied at that point, no signal will be contributed by fat (12, 13). A major drawback of this method is that it also suppresses signals from tissue with T1 relaxation times similar to fat (eg, subacute hemorrhage and paramagnetic enhancement). Short tau inversion recovery is also very sensitive to water content (14). Thus, cerebrospinal fluid and many inflammatory and neoplastic lesions will have very high signal intensity. For this reason, short tau inversion recovery also has been described to overestimate lesion margins if used alone (15). Consequently, we believe that short tau inversion recovery is not useful in the evaluation of spinal diseases in conjunction with paramagnetic contrast injection.
In general , the disadvantages of fat-suppression techniques include decreased signal-to-noise ratio and increased artifacts from magnetic field inhomogeneities, increased magnetic susceptibility artifacts , asymmetric fat suppression and potentially water suppression, and increased examination time.
The tissue contrast properties of the contrastenhanced fat-suppressed images differ from those of noncontrast images and contrast-enhanced T1-weighted images. At normal levels the enhanced paravertebral venous plexus is quite prominent and may be confused with enhanced dural and epidural lesions, particularly on axial images; however, on sagittal cuts the venous plexus usually is interrupted at the intervertebral disk level and more prominent in the midvertebral level. Understanding these features, interpretation of pathologic changes in these areas on fatsuppressed images is seldom difficult. Enhancing nerve root ganglia are seen as distinct structures within the neural foramina in most of the patients. Nerve root ganglia enhance, normally owing to the absence of the blood-brain barrier (16).
In vertebral diseases, contrast-enhanced fatsuppressed images provide a pattern of signal reversal; lesions of low signal intensity on T1-weighted images in comparison with the background high-signal bone marrow fat become high signal intensity compared with the suppressed bone marrow fat on contrast-enhanced fat-suppressed images. Involvement of posterior ele-
AJNR: 15, March 1994
A B
c D
ments may be detected better with contrastenhanced fat-suppressed sequences (Fig 3). This is a good example of how fat suppression increases lesion contrast by adjusting the image dynamic gray scale (2). The portion of the image with the highest signal intensity, typically fat, is assigned as the brightest part of the image. Subsequently, all lower signal intensities are rank ordered beneath fat. Once fat is removed from the image, the next highest signal, which may have been of intermediate brightness-usually the enhanced lesion-will now be assigned as the brightest signal. In this manner, with the removal of fat, the dynamic gray scale is expanded over the remaining contrast range. The fact remains that not all metastatic lesions of low signal intensity on T1-weighted images enhance after contrast injection. Lack of enhancement could represent an area of necrosis, sclerotic metastasis, poor vascular supply, or effect of radiotherapy. Detection of vertebral low-signal-intensity lesions in patients with diminished amount of fat signal may be difficult; however, if these lesions are
FAT SUPPRESSION 415
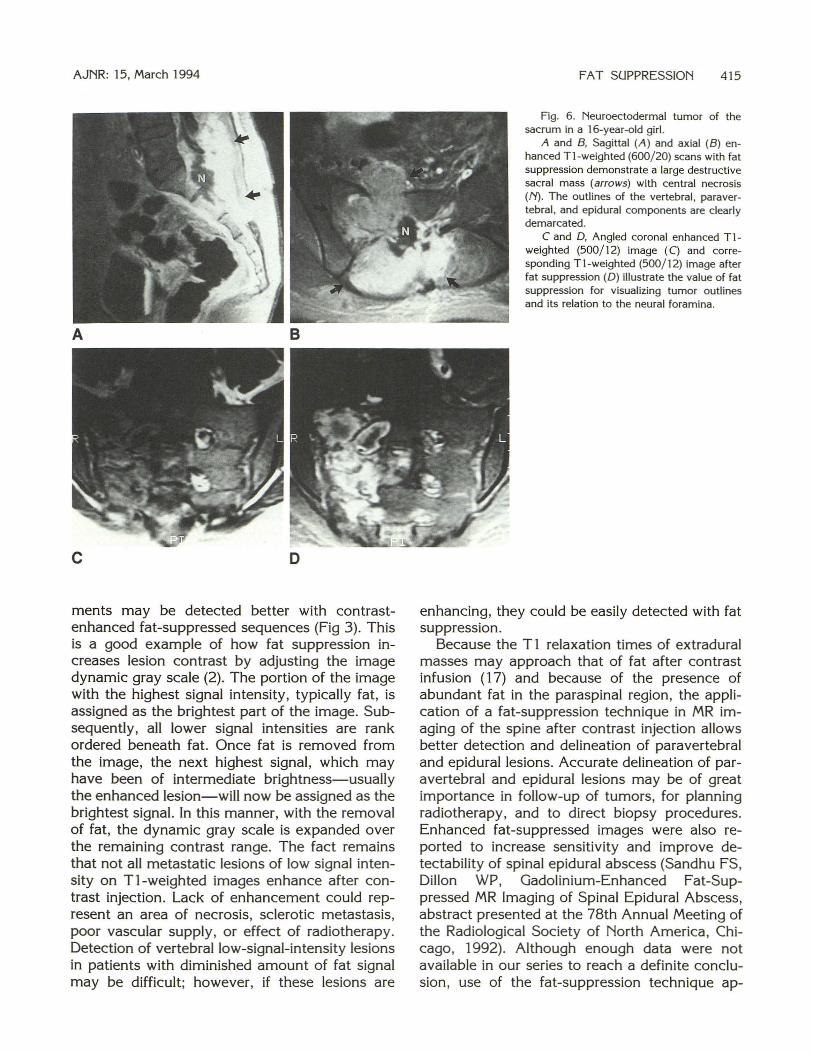
Fig. 6. Neuroectodermal tumor of the sacrum in a 16-year-old girl.
A and B, Sagittal (A ) and axial (B) enhanced T1-weighted (600/ 20) scans with fat suppression demonstrate a large destructive sacral mass (arrows) with central necrosis (/'{). The outlines of the vertebral , paravertebral , and epidural components are clearly demarcated.
C and D, Angled coronal enhanced T1-weighted (500/12) image (C) and corresponding Tl-weighted (500/12) image after fat suppression (D) illustrate the value of fat suppression for visualizing tumor outlines and its relation to the neural foramina .
enhancing, they could be easily detected with fat suppression.
Because the T1 relaxation times of extradural masses may approach that of fat after contrast infusion ( 17) and because of the presence of abundant fat in the paraspinal region, the application of a fat-suppression technique in MR imaging of the spine after contrast injection allows better detection and delineation of paravertebral and epidural lesions. Accurate delineation of paravertebral and epidural lesions may be of great importance in follow-up of tumors, for planning radiotherapy, and to direct biopsy procedures. Enhanced fat-suppressed images were also reported to increase sensitivity and improve detectability of spinal epidural abscess (Sandhu FS, Dillon WP, Gadolinium-Enhanced Fat-Suppressed MR Imaging of Spinal Epidural Abscess, abstract presented at the 78th Annual Meeting of the Radiological Society of North America , Chicago, 1992). Although enough data were not available in our series to reach a definite conclusion, use of the fat-suppression technique ap-
416 GEORGY
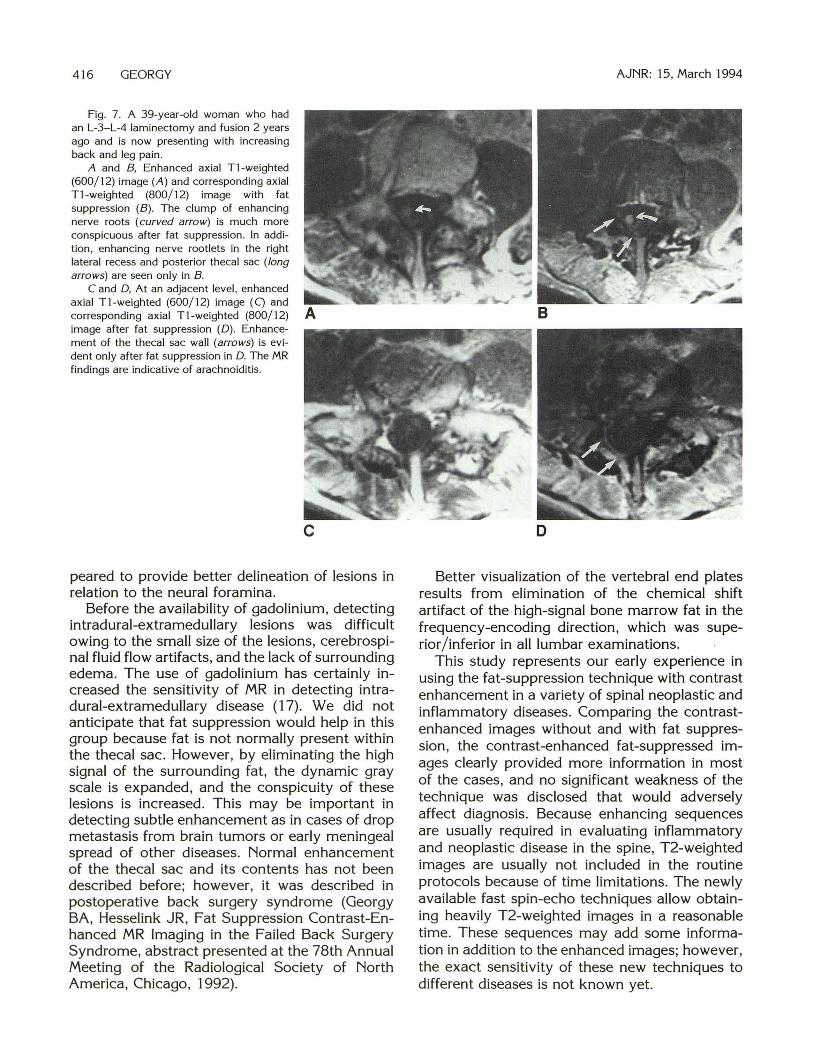
Fig. 7. A 39-year-old woman who had an L-3- L-4 laminectomy and fusion 2 years ago and is now presenting with increasing back and leg pain.
A and B, Enhanced axial T1-weighted (600/ 12) image (A) and corresponding axial T1 -weighted (800/ 12) image with fat suppression (B). The clump of enhancing nerve roots (curved arrow) is much more conspicuous after fat suppression. In addition , enhancing nerve rootlets in the right lateral recess and posterior thecal sac (long arrows) are seen only in B.
C and D, At an adjacent level , enhanced axial T1-weighted (600/ 12) image (C) and corresponding axial Tl-weighted (800/ 12) image after fat suppression (D) . Enhancement of the thecal sac wall (arrows) is evident only after fat suppression in D. The MR findings are indicative of arachnoiditis.
c
peared to provide better delineation of lesions in relation to the neural foramina.
Before the availability of gadolinium, detecting intradural-extramedullary lesions was difficult owing to the small size of the lesions, cerebrospinal fluid flow artifacts, and the lack of surrounding edema. The use of gadolinium has certainly increased the sensitivity of MR in detecting intradural-extramedullary disease (17). We did not anticipate that fat suppression would help in this group because fat is not normally present within the thecal sac. However, by eliminating the high signal of the surrounding fat , the dynamic gray scale is expanded, and the conspicuity of these lesions is increased. This may be important in detecting subtle enhancement as in cases of drop metastasis from brain tumors or early meningeal spread of other diseases. Normal enhancement of the thecal sac and its contents has not been described before; however, it was described in postoperative back surgery syndrome (Georgy BA, Hesselink JR, Fat Suppression Contrast-Enhanced MR Imaging in the Failed Back Surgery Syndrome, abstract presented at the 78th Annual Meeting of the Radiological Society of North America , Chicago, 1992).
AJNR: 15, March 1994
D
Better visualization of the vertebral end plates results from elimination of the chemical shift artifact of the high-signal bone marrow fat in the frequency-encoding direction, which was superior /inferior in all lumbar examinations.
This study represents our early experience in using the fat-suppression technique with contrast enhancement in a variety of spinal neoplastic and inflammatory diseases. Comparing the contrastenhanced images without and with · fat suppression , the contrast-enhanced fat-suppressed images clearly provided more information in most of the cases, and no significant weakness of the technique was disclosed that would adversely affect diagnosis. Because enhancing sequences are usually required in evaluating inflammatory and neoplastic disease in the spine, T2-weighted images are usually not included in the routine protocols because of time limitations. The newly available fast spin-echo techniques allow obtaining heavily T2-weighted images in a reasonable time. These sequences may add some information in addition to the enhanced images; however, the exact sensitivity of these new techniques to different diseases is not known yet.
AJNR: 15, March 1994
In conclusion, our study shows that plain Tlweighted images are still effective for screening vertebral disease, but contrast-enhanced fat suppressed images are helpful in detecting subtle lesions, posterior element involvement, interruption of vertebral end plates, and extension of disease into the neural foramina, epidural, and paraspinal regions. Also, contrast-enhanced fat suppression is helpful for elucidating equivocal areas of vertebral disease after initial screening with plain Tl-weighted images. Based on our data and experience, we recommend that whenever contrast enhancement is used in spine imaging, fat suppression also should be used.
Acknowledgments
We acknowledge Marcia Earnshaw for photography, Judy Mefford for her secretarial assistance, and Kathy Fix for professional editing.
References
1. Tien RD, Chu PK, Hesselink JR, Szumowski J . Intra- and paraorbital
lesions: value of fat-suppression MR imaging with paramagnetic
contrast enhancement. AJR Am J Roentgeno11991; 156: I 059-1 067
2. Barakos JA, Dillon WP, Chew WM. Orbit, skull base and pharynx:
contrast-enhanced fat suppression MR imaging. Radiology 1991 ;179:191-198
3. Semelka RC, Chew W, Hricak H, Tomei E, Higgins CB. Fat saturation
MR imaging of the upper abdomen. AJR Am J Roentgenol 1990;155:1111-1116
FAT SUPPRESSION 417
4. Simon J , Szumowski J. Chemical shift imaging with paramagnetic
contrast material enhancement for improved lesion depiction. Radiology 1989; 17 I :539-543
5. Bratemen L. Chemica l shift imaging: a rev iew. AJR Am J Roentgenol 1986;146:971-980
6. Tien RD. Fat-suppression MR imaging in neuroradiology: techniques
and clinical application. AJR Am J Roentgenoll992; 158:369-379 7. Frahm J, Haase A, Hanicke W, Matthaei D, Bomsdorf H, Halzel T.
Chemical shift selective MR imaging using a whole-body magnet.
Radiology 1985; 156:441-444 8. Keller RJ, Hunter WW, Schmalbrock P. Multisection fat-water imaging
with chemica l shift selective presaturation. Radiology 1987; 164: 539-541
9. Dixon WT. Simple proton spectroscopic imaging. Radiology 1984;1 53:189-194
10. Szumowski J, Plewes DB. Separation of lipid and water MR imaging
signals by Chopper averaging in the time domain. Radiology 1987;165:247-250
II . Szumowski J , Eisen JK, Vinitsk i S, et al. Hybrid methods of chemical
shift imaging. Magn Reson Med 1989;9:379-388 12. Dwyer AJ, Frank JA, Sank VJ, Reinig JW, Hickey AM , Doppman
JL. Short Tl inversion recovery pulse sequence: analysis and initial
experience in cancer imaging. Radiology 1988; 168:827-836 13. Bydder GM, Young IR. MR imaging: cl inical use of the inversion
recovery sequence. J Comput Assist Tomogr 1985;9:659-675 14. Jones KM, Unger EC. Granstrom P, Seeger JF, Carmody FR, Yosh ino
M. Bone marrow imaging using STIR at 0.5 and 1.5 T . Magn Reson Imaging 1992; I 0: 169-176
15. Shuman WP, Patten RM, Baron RL, Liddell RM, Conrad EU, Richard
son ML. Comparison of STIR and spin-echo imaging at 1.5 T in 45 suspected extremity tumors: lesion conspicuity and ex tent. Radiology 1991; 179:247-252
16. Berger RK , Williams AL, Daniels DL, et al. Contrast enhancement in
spina l MR imaging. AJR Am J Roentgeno11989;153:387-391 17. Sze G, Abramson A, Krol G, et al. Gd-DTPA in evaluation of intradural
extramedullary spinal d iseases. AJNR Am J Neuroradiol 1988;9: 153-163
Related Documents


![Suppression of intrinsic roughness in encapsulated graphene · tilt analysis in the transmission electron microscope (TEM) [2,20]. In contrast to scanning probe techniques, this method](https://static.cupdf.com/doc/110x72/5f3ed37e48dd6e68c82ac328/suppression-of-intrinsic-roughness-in-encapsulated-graphene-tilt-analysis-in-the.jpg)