Evaluation of Explore-Exploit Policies in Multi-result Ranking Systems Dragomir Yankov [email protected] Microsoft Corporation Pavel Berkhin [email protected] Microsoft Corporation Lihong Li [email protected] Microsoft Corporation ABSTRACT We analyze the problem of using Explore-Exploit techniques to improve precision in multi-result ranking systems such as web search, query autocompletion and news recommenda- tion. Adopting an exploration policy directly online, with- out understanding its impact on the production system, may have unwanted consequences - the system may sustain large losses, create user dissatisfaction, or collect exploration data which does not help improve ranking quality. An offline framework is thus necessary to let us decide what policy and how we should apply in a production environment to ensure positive outcome. Here, we describe such an offline framework. Using the framework, we study a popular exploration pol- icy — Thompson sampling. We show that there are differ- ent ways of implementing it in multi-result ranking systems, each having different semantic interpretation and leading to different results in terms of sustained click-through-rate (CTR) loss and expected model improvement. In particu- lar, we demonstrate that Thompson sampling can act as an online learner optimizing CTR, which in some cases can lead to an interesting outcome: lift in CTR during exploration. The observation is important for production systems as it suggests that one can get both valuable exploration data to improve ranking performance on the long run, and at the same time increase CTR while exploration lasts. Categories and Subject Descriptors H.4 [Information Systems Applications]: Miscellaneous Keywords explore-exploit, ranking, evaluation, thompson sampling 1. INTRODUCTION We study “multi-result” ranking systems, i.e., systems which rank a number of candidate results and present the top N to the user. Examples of such systems are web search, query autocompletion (see Figure 1), news recommendation, etc. This is in contrast to “single-result” ranking systems which also internally utilize ranking mechanisms but in the end display only one result to the user. One challenge with ranking systems in general is their counterfactual nature [2]: We cannot directly answer ques- tions of the sort“Given a query, what would have happened if we had shown a different set of results?” as this is counter the fact. The fact is that we showed whatever results the current production model considered best. Learning new models is thus biased and limited by the deployed rank- ing model. One sound and popular approach to breaking the dependence on an already deployed model is to inte- grate an Explore-Exploit (EE) component into the produc- tion system [12]. Exploration allows for occasionally ran- domizing the results presented to the user by overriding some of the top choices of the deployed model and replac- ing them with potentially suboptimal results. This leads to collecting in our data certain random results generated with small probabilities. When training subsequent rank- ing models, these results are often assigned higher weights, inversely proportional to the probabilities with which they were explored [2, 17]. As theoretically justified and empiri- cally demonstrated, exploration usually allows better models to be learned. However, adopting exploration in a produc- tion system prompts a set of essential questions: which EE policy is most suitable for the system; what would be the actual cost of running EE; and most importantly, how to best use the exploration data to train improved models and what improvements are to be expected? Here, we present an offline framework which allows “re- playing” query logs to answer counterfactual questions. The framework can be used to answer the above exploration questions, allowing one to compare different EE policies prior to their integration in the online system. This is very important as running an inadequate policy online can quickly lead to significant money loss, cause broad user dis- satisfaction, or collect exploration data which is altogether useless in improving the ranking model. As a concrete example, we use the offline framework to evaluate Thompson sampling, a popular EE method which is simple to implement and is very effective at trading off explo- ration and exploitation [4,16,18]. We point out that in fact there are multiple ways of implementing Thompson sam-

Evaluation of Explore-Exploit Policies in Multi-result Ranking …€¦ · Evaluation of Explore-Exploit Policies in Multi-result Ranking Systems Dragomir Yankov [email protected]
Apr 19, 2020
Welcome message from author
This document is posted to help you gain knowledge. Please leave a comment to let me know what you think about it! Share it to your friends and learn new things together.
Transcript
Evaluation of Explore-Exploit Policiesin Multi-result Ranking Systems
Dragomir [email protected] Corporation
Pavel [email protected]
Microsoft Corporation
Lihong [email protected] Corporation
ABSTRACTWe analyze the problem of using Explore-Exploit techniquesto improve precision in multi-result ranking systems such asweb search, query autocompletion and news recommenda-tion. Adopting an exploration policy directly online, with-out understanding its impact on the production system, mayhave unwanted consequences - the system may sustain largelosses, create user dissatisfaction, or collect exploration datawhich does not help improve ranking quality. An offlineframework is thus necessary to let us decide what policyand how we should apply in a production environment toensure positive outcome. Here, we describe such an offlineframework.
Using the framework, we study a popular exploration pol-icy — Thompson sampling. We show that there are differ-ent ways of implementing it in multi-result ranking systems,each having different semantic interpretation and leadingto different results in terms of sustained click-through-rate(CTR) loss and expected model improvement. In particu-lar, we demonstrate that Thompson sampling can act as anonline learner optimizing CTR, which in some cases can leadto an interesting outcome: lift in CTR during exploration.The observation is important for production systems as itsuggests that one can get both valuable exploration data toimprove ranking performance on the long run, and at thesame time increase CTR while exploration lasts.
Categories and Subject DescriptorsH.4 [Information Systems Applications]: Miscellaneous
Keywordsexplore-exploit, ranking, evaluation, thompson sampling
1. INTRODUCTIONWe study “multi-result” ranking systems, i.e., systems
which rank a number of candidate results and present thetop N to the user. Examples of such systems are web search,query autocompletion (see Figure 1), news recommendation,etc. This is in contrast to “single-result” ranking systemswhich also internally utilize ranking mechanisms but in theend display only one result to the user.
One challenge with ranking systems in general is theircounterfactual nature [2]: We cannot directly answer ques-tions of the sort “Given a query, what would have happenedif we had shown a different set of results?” as this is counterthe fact. The fact is that we showed whatever results thecurrent production model considered best. Learning newmodels is thus biased and limited by the deployed rank-ing model. One sound and popular approach to breakingthe dependence on an already deployed model is to inte-grate an Explore-Exploit (EE) component into the produc-tion system [12]. Exploration allows for occasionally ran-domizing the results presented to the user by overridingsome of the top choices of the deployed model and replac-ing them with potentially suboptimal results. This leadsto collecting in our data certain random results generatedwith small probabilities. When training subsequent rank-ing models, these results are often assigned higher weights,inversely proportional to the probabilities with which theywere explored [2, 17]. As theoretically justified and empiri-cally demonstrated, exploration usually allows better modelsto be learned. However, adopting exploration in a produc-tion system prompts a set of essential questions: which EEpolicy is most suitable for the system; what would be theactual cost of running EE; and most importantly, how tobest use the exploration data to train improved models andwhat improvements are to be expected?
Here, we present an offline framework which allows “re-playing” query logs to answer counterfactual questions. Theframework can be used to answer the above explorationquestions, allowing one to compare different EE policiesprior to their integration in the online system. This isvery important as running an inadequate policy online canquickly lead to significant money loss, cause broad user dis-satisfaction, or collect exploration data which is altogetheruseless in improving the ranking model.
As a concrete example, we use the offline framework toevaluate Thompson sampling, a popular EE method which issimple to implement and is very effective at trading off explo-ration and exploitation [4,16,18]. We point out that in factthere are multiple ways of implementing Thompson sam-
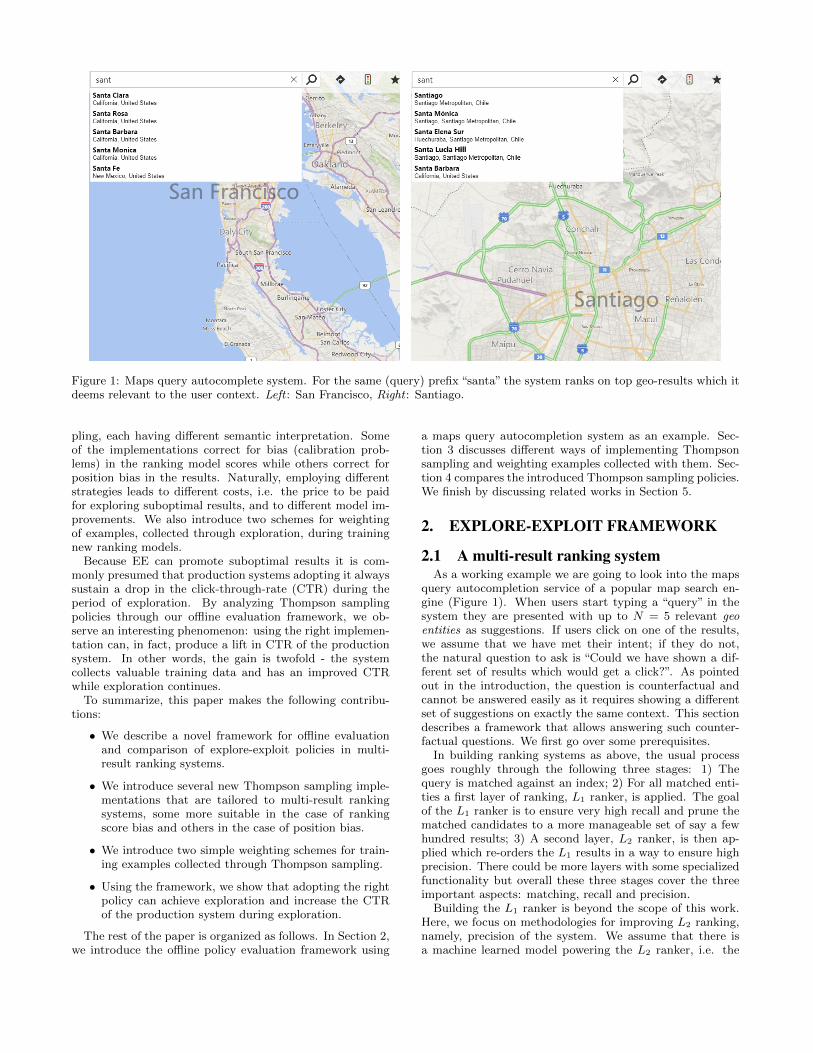
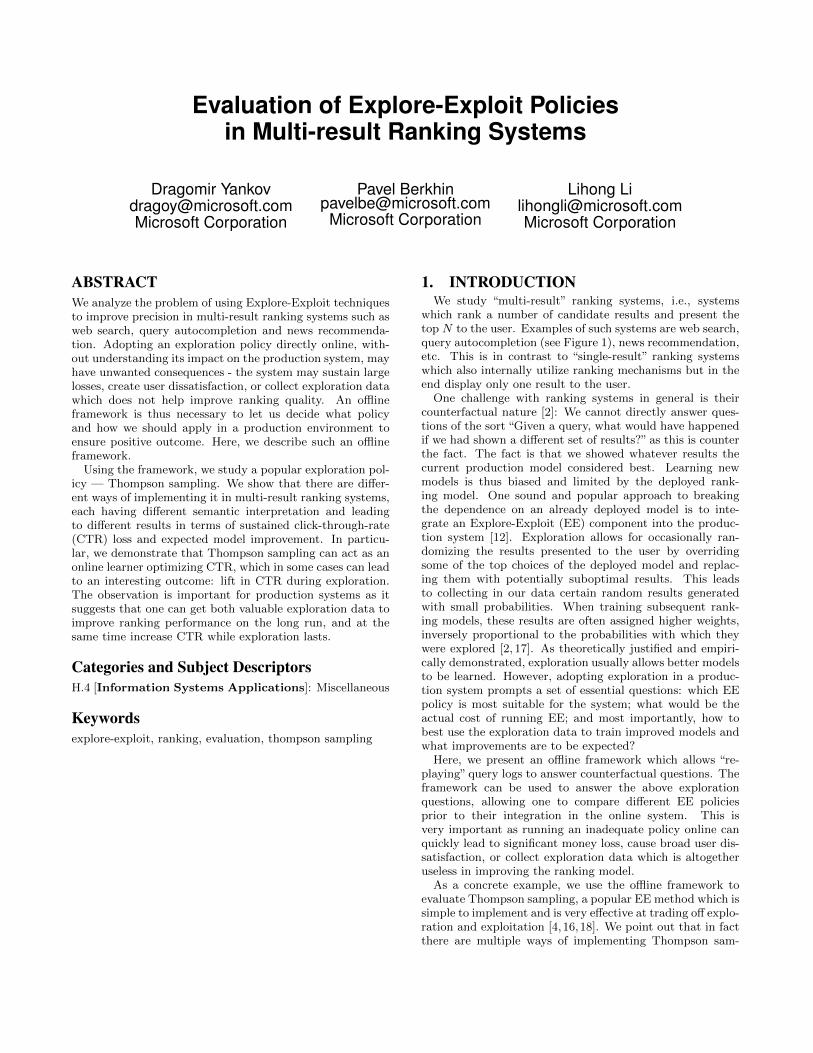
Figure 1: Maps query autocomplete system. For the same (query) prefix “santa” the system ranks on top geo-results which itdeems relevant to the user context. Left : San Francisco, Right : Santiago.
pling, each having different semantic interpretation. Someof the implementations correct for bias (calibration prob-lems) in the ranking model scores while others correct forposition bias in the results. Naturally, employing differentstrategies leads to different costs, i.e. the price to be paidfor exploring suboptimal results, and to different model im-provements. We also introduce two schemes for weightingof examples, collected through exploration, during trainingnew ranking models.
Because EE can promote suboptimal results it is com-monly presumed that production systems adopting it alwayssustain a drop in the click-through-rate (CTR) during theperiod of exploration. By analyzing Thompson samplingpolicies through our offline evaluation framework, we ob-serve an interesting phenomenon: using the right implemen-tation can, in fact, produce a lift in CTR of the productionsystem. In other words, the gain is twofold - the systemcollects valuable training data and has an improved CTRwhile exploration continues.
To summarize, this paper makes the following contribu-tions:
• We describe a novel framework for offline evaluationand comparison of explore-exploit policies in multi-result ranking systems.
• We introduce several new Thompson sampling imple-mentations that are tailored to multi-result rankingsystems, some more suitable in the case of rankingscore bias and others in the case of position bias.
• We introduce two simple weighting schemes for train-ing examples collected through Thompson sampling.
• Using the framework, we show that adopting the rightpolicy can achieve exploration and increase the CTRof the production system during exploration.
The rest of the paper is organized as follows. In Section 2,we introduce the offline policy evaluation framework using
a maps query autocompletion system as an example. Sec-tion 3 discusses different ways of implementing Thompsonsampling and weighting examples collected with them. Sec-tion 4 compares the introduced Thompson sampling policies.We finish by discussing related works in Section 5.
2. EXPLORE-EXPLOIT FRAMEWORK
2.1 A multi-result ranking systemAs a working example we are going to look into the maps
query autocompletion service of a popular map search en-gine (Figure 1). When users start typing a “query” in thesystem they are presented with up to N = 5 relevant geoentities as suggestions. If users click on one of the results,we assume that we have met their intent; if they do not,the natural question to ask is “Could we have shown a dif-ferent set of results which would get a click?”. As pointedout in the introduction, the question is counterfactual andcannot be answered easily as it requires showing a differentset of suggestions on exactly the same context. This sectiondescribes a framework that allows answering such counter-factual questions. We first go over some prerequisites.
In building ranking systems as above, the usual processgoes roughly through the following three stages: 1) Thequery is matched against an index; 2) For all matched enti-ties a first layer of ranking, L1 ranker, is applied. The goalof the L1 ranker is to ensure very high recall and prune thematched candidates to a more manageable set of say a fewhundred results; 3) A second layer, L2 ranker, is then ap-plied which re-orders the L1 results in a way to ensure highprecision. There could be more layers with some specializedfunctionality but overall these three stages cover the threeimportant aspects: matching, recall and precision.
Building the L1 ranker is beyond the scope of this work.Here, we focus on methodologies for improving L2 ranking,namely, precision of the system. We assume that there isa machine learned model powering the L2 ranker, i.e. the
system adopts a learning-to-rank approach [3].Let us now focus on the structure of the logs generated
by the system as well as how an EE policy can be appliedin it. Table 1 shows what information can be logged by amulti-result ranking system for a query.
Position (i) Label (y) Result(r) Rank score (s)
i = 1 0 Suggestion 1 s1 = 0.95i = 2 0 Suggestion 2 s2 = 0.90i = 3 1 Suggestion 3 s3 = 0.60i = 4 0 Suggestion 4 s4 = 0.45i = 5 0 Suggestion 5 s5 = 0.40
Table 1: Original system: example logs for one query.
Suppose that L1 ranking extracted M ≥ N relevant re-sults which then L2 re-ranked and produced the top N = 5suggestions from Table 1. We assume that, for at least afraction of the queries, the suggestions from the table andthe user actions are logged by the production system.
The first column in the table shows the ranking positionof the suggested result. The Label column reflects the ob-served clicks — 1 if the result was clicked and 0 otherwise.The Result column contains some context about the resultthat was suggested, part of which is only displayed to theuser and the rest is used to extract features to train theranking model. The last column shows the score which theL2 ranking model has assigned to the results.
2.2 Explore-Exploit in the online environmentWe assume a relatively conservative exploration process
taking place in the online environment. Namely, it is allowedto replace only suggestions appearing at position i = N .This is to ensure that we do not generate large user dissat-isfaction by placing potentially bad results as top sugges-tions. For exploration in addition to the candidate at posi-tion i = N we choose among the candidates which L1 returnsand L2 ranks at positions i = N + 1, . . . , i = N + t ≤M , forsome relatively small t. By doing so, we do not explore re-sults which are very low down the ranking list of L2 as theyare probably not very relevant. Requiring that a candidatefor exploration meets some minimum threshold for its rank-ing score is also a good idea. Naturally, if for a query thereare less than N = 5 candidates, then no exploration takesplace for it.
To enable EE online we also need to define a policy — amechanism which selects with a certain probability a sugges-tion different from the one that the deployed ranking modelwould recommend. Different policies can be implemented.In Section 3 we study several such policies and how theycan be simulated in an offline environment. We also discusshow the data collected from them can be weighted suitablyfor training better ranking models; details can be found inSection 3.2.
2.3 Offline simulation environmentRunning the above EE process directly in the production
environment can lead to costly consequences: it may startdisplaying inadequate results which can cause the system tosustain significant loss in CTR in a very short time. It isfurther unclear whether it will help us collect training exam-ples that will lead to improving the quality of the rankingmodel. We therefore want to simulate the above online pro-
cess a priori in an offline system that closely approximatesit. Here, we present such an offline system.
The main idea of the offline system is to mimic a scaled-down version of the production system. Specifically, we as-sume offline that our Autocomplete system displays k < Nresults to the user instead of N = 5. Again, to replicate theonline EE process from Section 2.2, different policies evalu-ated in the offline system will be allowed to show on its lastposition (i.e., on position k) any of the results from positionsi = k, ..., N .
To understand the offline process better, let us look intotwo concrete instantiations of the simulation environmentwhich use the logged results from Table 1.
In the first instantiation, we set k = 2. It means that theoffline system displays to the user two suggestions, as seen inTable 2. Position i = 2 is going to be used for exploration,and the result to be displayed will be selected among thecandidates at position i = 2, . . . , i = 5.
Pos Label Result Score(s)Dis- i = 1 0 Sugg. 1 s1 = 0.95
played i = 2 0 Sugg. 2 s2 = 0.90EE Can-
i = 3 1 Sugg. 3 s3 = 0.60didates
i = 4 0 Sugg. 4 s4 = 0.45i = 5 0 Sugg. 5 s5 = 0.40
Table 2: Offline system with k = 2. Logs for one queryderived from the logs from Table 1. Position i = 2 (in blue)is used for exploration.
In the second instantiation, we set k = 3; that is, theoffline system is assumed to display three suggestions. Po-sition i = 3 is used for exploration and the candidates for itare the results from the original logs at positions i = 3, 4, 5.This setting is depicted in Table 3.
Pos Label Result Score(s)
Dis-i = 1 0 Sugg. 1 s1 = 0.95
playedi = 2 0 Sugg. 2 s2 = 0.90i = 3 1 Sugg. 3 s3 = 0.60
EE Can-i = 4 0 Sugg. 4 s4 = 0.45
didatesi = 5 0 Sugg. 5 s5 = 0.40
Table 3: Offline system with k = 3 suggestions. Logs for onequery derived from the logs from Table 1. Position i = 3 (inblue) is used for exploration.
Suppose we use k = 2. Using only the production systemwe would display in our simulated environment “Suggestion1”and“Suggestion 2”and we would not observe a click as thelabel in the logs for both position i = 1 and i = 2 is zero.Now suppose we use the described framework to comparetwo EE policies, π1 and π2, each selecting a different resultto display at position i = 2. For example, π1 can select topreserve the result at position i = 2 (“Suggestion 2”) whileπ2 can select to display instead the result at position i = 3(“Suggestion 3”). Now we can ask the counterfactual, withrespect to the simulated system, question“What would havehappened had we applied either of the two policies?”. Theanswer is, with π2 we would have observed a click, which weknow from the original system logs (Table 1) and with π1
we would not have. If this is the only exploration which weperform the information obtained with π2 would be more
valuable and would probably lead to training a better newranking model. Note also that applying π2 would actuallylead to a higher CTR than simply using the production sys-tem. This gives an intuitive idea of why CTR can increaseduring exploration as demonstrated in the evaluation in Sec-tion 4.2.
It should be noted that our simulation environment effec-tively assumes the same label for an item when it is movedto position k from another, lower position k′ > k. Due toposition bias, CTR of an item tends to be smaller if the itemis displayed in a lower position. Therefore, our simulationenvironment has a one-sided bias, favoring the productionbaseline that collects the data. While the bias makes theoffline simulation results less accurate, its one-sided natureimplies the results which we show in Section 4.2 are conser-vative: if a new policy is shown to have a higher offline CTRin the simulation environment than the production baseline,its online CTR can only be higher in expectation.
3. THOMPSON SAMPLING FOR MULTI-RESULT RANKING
We now demonstrate the offline framework by comparingseveral implementations of Thompson sampling, a popularpolicy due to its simplicity and effectiveness [4, 16, 18]. Inthe process we identify two interesting observations. First,there are multiple ways to implement Thompson samplingfor multi-result ranking problems. They have different in-terpretations and lead to different results. Second, if the“right” implementation for the problem at hand is selected,then Thompson sampling can refine the ranking model CTRestimates to yield better ranking results. The method thenessentially works as an online learner, improving the CTRof the underlying model by identifying segments where themodel is unreliable and overriding its choice with a betterone. This in turn can lead to an important result — adopt-ing EE can entail a twofold benefit: it can collect valuabledata for improving ranking precision, and at the same timelift the CTR of the production system during the period ofexploration.
Algorithm 1 outlines our generic implementation ofThompson sampling. The algorithm closely follows the im-plementation suggested by [4] with two subtle modifications:1) defining exploration buckets1 in line 1; and 2) samplingfrom the subset of buckets relevant only to the current it-eration in line 4. We elaborate on these points below, andwill show they are essential and lead to very different re-sults with different instantiations. In the evaluation sectionwe also discuss how we set the exploration constant ε (lines9, 11) to update the parameters of the beta distributions.
3.1 Thompson sampling policiesHere we describe three policies based on Thompson sam-
pling. Each is characterized by: 1) how it defines the buckets(line 1 in the algorithm); 2) What probability estimate is thebucket definition semantically representing.
Sampling over positions policy.This is probably the most straight-forward, but not very
effective implementation of Thompson sampling. It definesbuckets over the ranking positions used for drawing explo-ration candidates. More specifically we have:
1Aka “arms” in the multi-arm bandits literature.
Algorithm 1 Thompson Sampling for Multi-result Ranking
1: Define buckets: P = {P1, P2, . . . , Pn}2: Initialize Beta distributions: {B(α1, β1), . . . , B(αn, βn)}. One per bucket
3: while (ExplorationIsEnabled) do
4: P← {Pc1 , . . . , Pcl} ⊆ P . Select the bucketsinvolved in the current iteration
5: Draw θi ∼ B(αi, βi), ∀i ∈ {c1, . . . , cl}6: m← argmaxiθi7: Display rm for exploration . rm is the result
associated with the selected bucket Pm
8: if (rm clicked) then9: αm ← αm + ε . Increment with constant
10: else11: βm ← βm + ε . Increment with constant
Bucket definition: There are n = N − k + 1 buck-ets each corresponding to one of the candidate positionsi = k, ..., i = N . All of them can be selected in each it-eration so P = P. For instance, if we have instantiation asper Table 3 we would have three buckets, n = 3, for positionsi = 3, i = 4, and i = 5 — the positions of the candidates forexploration.Probability estimate: P (click|i, k). In this implementa-tion Thompson sampling estimates the probability of clickgiven that a result from position i is shown on position k.This implementation allows for correction in the estimate ofCTR per position. The approach allows also for correctingposition bias. Indeed, results which are clicked simply be-cause of their position may impact the ranking model andduring exploration we may through them away eliminatingtheir effect on the system. This makes the approach espe-cially valuable in systems with pronounced position bias.
Sampling over scores policy.In this implementation we define the buckets over the
scores of the ranking model. Each bucket covers a particularscore range. For simplicity let us assume that the score inter-val [0, 1] is divided into one hundred equal subintervals oneper each percentage point: [0, 0.01), [0.01, 0.02), . . . , [0.99, 1].For the suggested division we have:Bucket definition: There are n = 100 buckets one perscore interval P1 = [0, 0.01), . . . , P100 = [0.99, 1]. In eachiteration only a small subset of these are active. In theexample from Table 3 only the following three buckets areactive Pc1 = P61 = [0.60, 0.61), Pc2 = P46 = [0.45, 0.46),and Pc3 = P41 = [0.40, 0.41). Suppose after drawing fromtheir respective Beta distributions we observe that m = 61,i.e. we should show the first of the three candidates whichturns out to result in a click. In this case, we update thepositive outcome parameter for the corresponding Beta toα61 = α61 + ε.Probability estimate: P (click|s, k). In this implementa-tion Thompson sampling estimates the probability of clickgiven a ranking score s for a result when shown at positionk. In general, if we run a calibration procedure then thescores are likely to be close to the true posterior click prob-abilities for the results [15], but this is only true if we lookat them agnostic of position. With respect to position i = kthey may not be calibrated. We can think of Thompsonsampling as a procedure for calibrating the scores from the
10K 50K 100K 1M0.87
0.875
0.88
0.885
0.89
0.895
0.9
0.905
0.91
0.915
Number of training Autocomplete(AC) Queries
CT
RModel improvement. Maps Autocomplete with k=2 suggestion
No ExplorationThompson ScoresThompson PositionsThompson Scores&Position
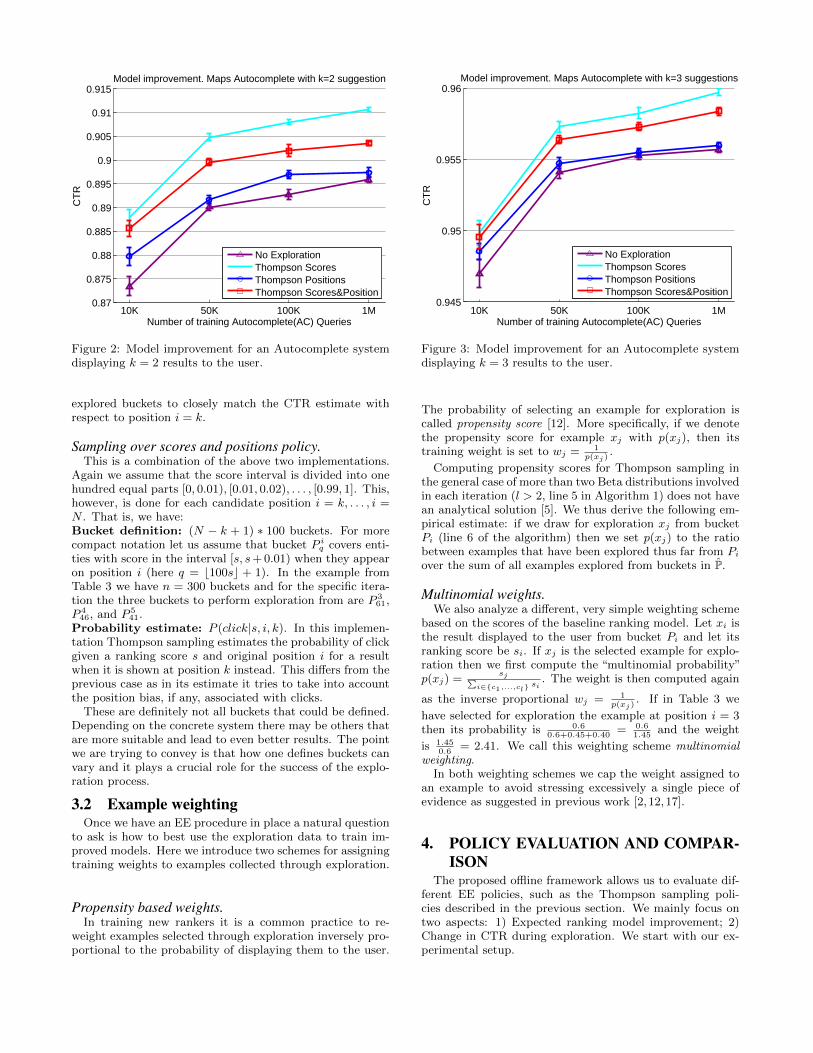
Figure 2: Model improvement for an Autocomplete systemdisplaying k = 2 results to the user.
explored buckets to closely match the CTR estimate withrespect to position i = k.
Sampling over scores and positions policy.This is a combination of the above two implementations.
Again we assume that the score interval is divided into onehundred equal parts [0, 0.01), [0.01, 0.02), . . . , [0.99, 1]. This,however, is done for each candidate position i = k, . . . , i =N . That is, we have:Bucket definition: (N − k + 1) ∗ 100 buckets. For morecompact notation let us assume that bucket P i
q covers enti-ties with score in the interval [s, s+ 0.01) when they appearon position i (here q = b100sc + 1). In the example fromTable 3 we have n = 300 buckets and for the specific itera-tion the three buckets to perform exploration from are P 3
61,P 446, and P 5
41.Probability estimate: P (click|s, i, k). In this implemen-tation Thompson sampling estimates the probability of clickgiven a ranking score s and original position i for a resultwhen it is shown at position k instead. This differs from theprevious case as in its estimate it tries to take into accountthe position bias, if any, associated with clicks.
These are definitely not all buckets that could be defined.Depending on the concrete system there may be others thatare more suitable and lead to even better results. The pointwe are trying to convey is that how one defines buckets canvary and it plays a crucial role for the success of the explo-ration process.
3.2 Example weightingOnce we have an EE procedure in place a natural question
to ask is how to best use the exploration data to train im-proved models. Here we introduce two schemes for assigningtraining weights to examples collected through exploration.
Propensity based weights.In training new rankers it is a common practice to re-
weight examples selected through exploration inversely pro-portional to the probability of displaying them to the user.
10K 50K 100K 1M0.945
0.95
0.955
0.96
Number of training Autocomplete(AC) Queries
CT
R
Model improvement. Maps Autocomplete with k=3 suggestions
No ExplorationThompson ScoresThompson PositionsThompson Scores&Position
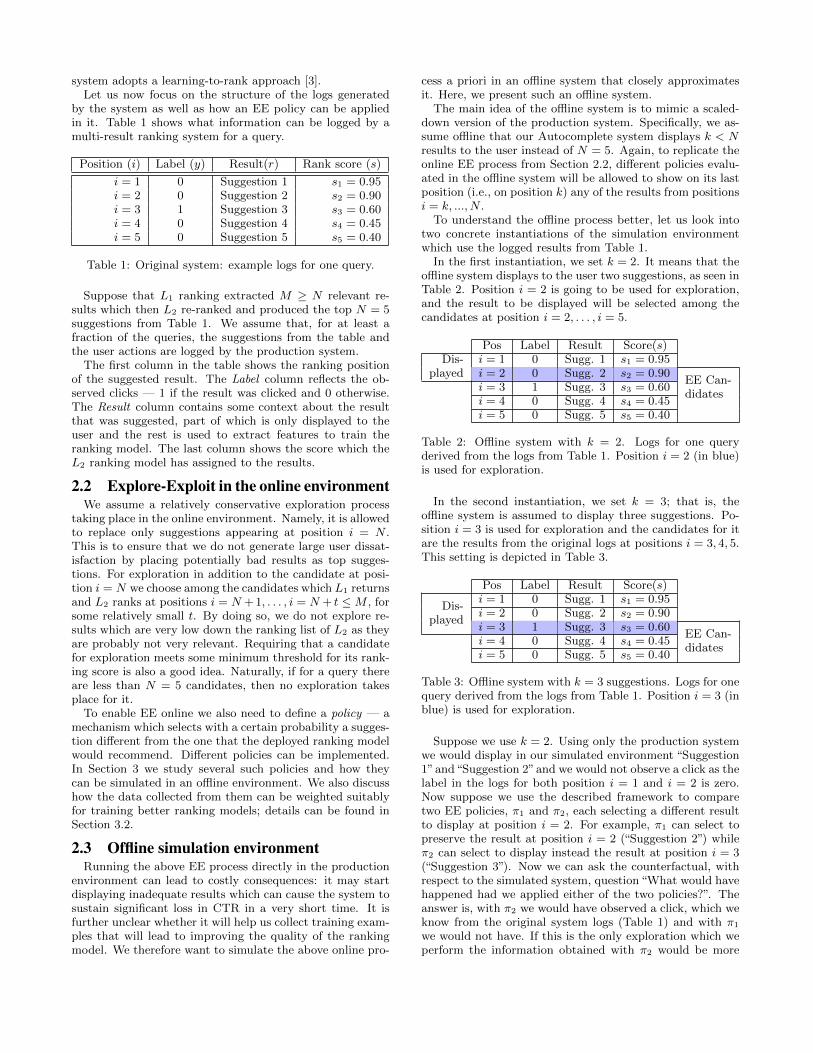
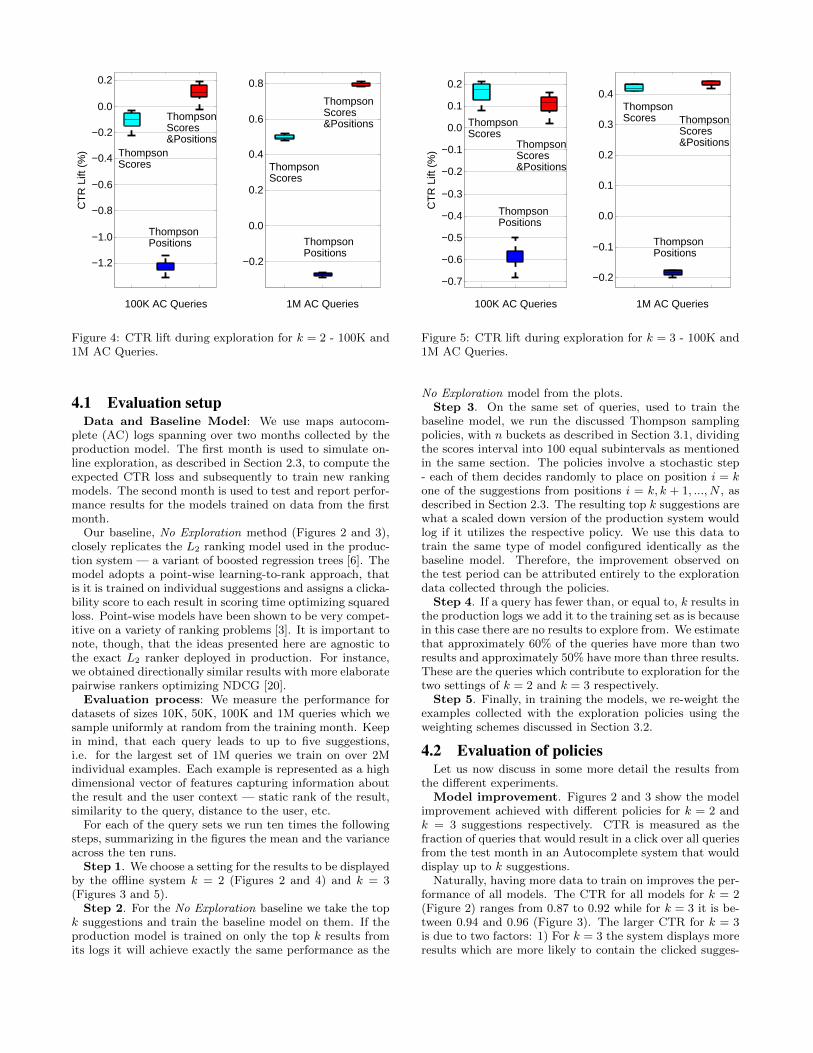
Figure 3: Model improvement for an Autocomplete systemdisplaying k = 3 results to the user.
The probability of selecting an example for exploration iscalled propensity score [12]. More specifically, if we denotethe propensity score for example xj with p(xj), then itstraining weight is set to wj = 1
p(xj).
Computing propensity scores for Thompson sampling inthe general case of more than two Beta distributions involvedin each iteration (l > 2, line 5 in Algorithm 1) does not havean analytical solution [5]. We thus derive the following em-pirical estimate: if we draw for exploration xj from bucketPi (line 6 of the algorithm) then we set p(xj) to the ratiobetween examples that have been explored thus far from Pi
over the sum of all examples explored from buckets in P.
Multinomial weights.We also analyze a different, very simple weighting scheme
based on the scores of the baseline ranking model. Let xi isthe result displayed to the user from bucket Pi and let itsranking score be si. If xj is the selected example for explo-ration then we first compute the “multinomial probability”p(xj) =
sj∑i∈{c1,...,cl}
si. The weight is then computed again
as the inverse proportional wj = 1p(xj)
. If in Table 3 we
have selected for exploration the example at position i = 3then its probability is 0.6
0.6+0.45+0.40= 0.6
1.45and the weight
is 1.450.6
= 2.41. We call this weighting scheme multinomialweighting.
In both weighting schemes we cap the weight assigned toan example to avoid stressing excessively a single piece ofevidence as suggested in previous work [2, 12,17].
4. POLICY EVALUATION AND COMPAR-ISON
The proposed offline framework allows us to evaluate dif-ferent EE policies, such as the Thompson sampling poli-cies described in the previous section. We mainly focus ontwo aspects: 1) Expected ranking model improvement; 2)Change in CTR during exploration. We start with our ex-perimental setup.
−1.2
−1.0
−0.8
−0.6
−0.4
−0.2
0.0
0.2
100K AC Queries
ThompsonScores
ThompsonPositions
ThompsonScores&Positions
CT
R L
ift (
%)
−0.2
0.0
0.2
0.4
0.6
0.8
1M AC Queries
ThompsonScores
ThompsonPositions
ThompsonScores&Positions
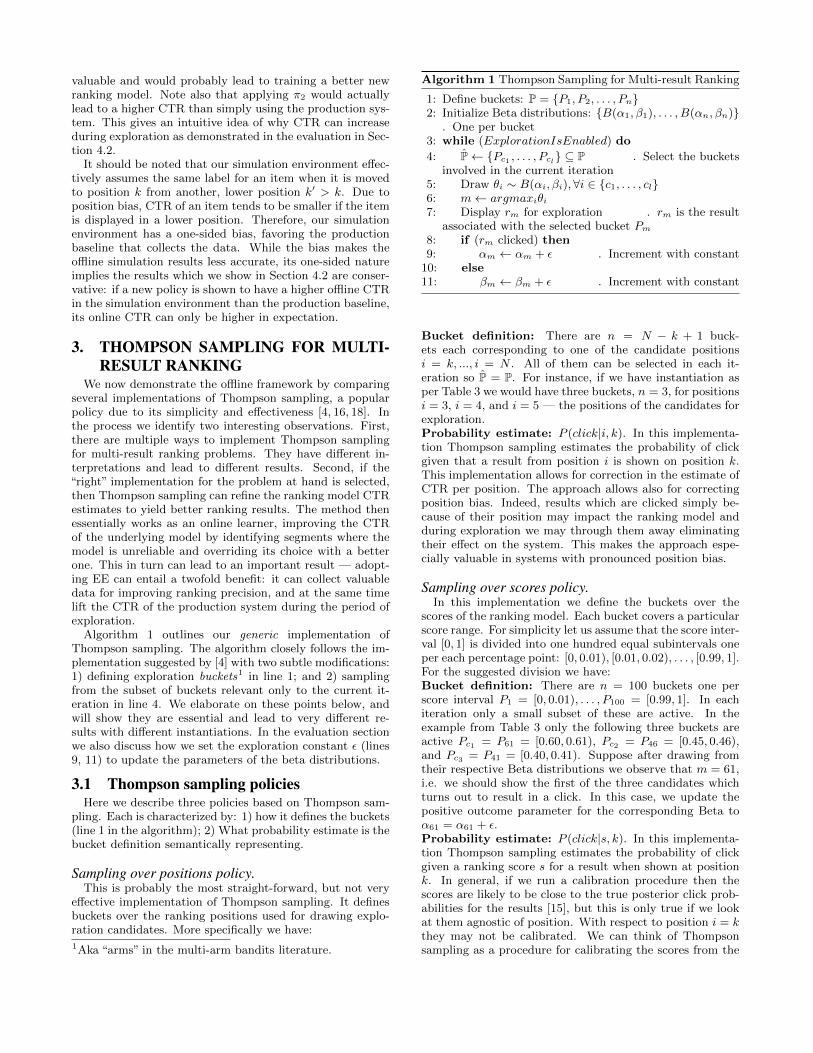
Figure 4: CTR lift during exploration for k = 2 - 100K and1M AC Queries.
4.1 Evaluation setupData and Baseline Model: We use maps autocom-
plete (AC) logs spanning over two months collected by theproduction model. The first month is used to simulate on-line exploration, as described in Section 2.3, to compute theexpected CTR loss and subsequently to train new rankingmodels. The second month is used to test and report perfor-mance results for the models trained on data from the firstmonth.
Our baseline, No Exploration method (Figures 2 and 3),closely replicates the L2 ranking model used in the produc-tion system — a variant of boosted regression trees [6]. Themodel adopts a point-wise learning-to-rank approach, thatis it is trained on individual suggestions and assigns a clicka-bility score to each result in scoring time optimizing squaredloss. Point-wise models have been shown to be very compet-itive on a variety of ranking problems [3]. It is important tonote, though, that the ideas presented here are agnostic tothe exact L2 ranker deployed in production. For instance,we obtained directionally similar results with more elaboratepairwise rankers optimizing NDCG [20].
Evaluation process: We measure the performance fordatasets of sizes 10K, 50K, 100K and 1M queries which wesample uniformly at random from the training month. Keepin mind, that each query leads to up to five suggestions,i.e. for the largest set of 1M queries we train on over 2Mindividual examples. Each example is represented as a highdimensional vector of features capturing information aboutthe result and the user context — static rank of the result,similarity to the query, distance to the user, etc.
For each of the query sets we run ten times the followingsteps, summarizing in the figures the mean and the varianceacross the ten runs.
Step 1. We choose a setting for the results to be displayedby the offline system k = 2 (Figures 2 and 4) and k = 3(Figures 3 and 5).
Step 2. For the No Exploration baseline we take the topk suggestions and train the baseline model on them. If theproduction model is trained on only the top k results fromits logs it will achieve exactly the same performance as the
−0.7
−0.6
−0.5
−0.4
−0.3
−0.2
−0.1
0.0
0.1
0.2
100K AC Queries
ThompsonScores
ThompsonPositions
ThompsonScores&Positions
CT
R L
ift (
%)
−0.2
−0.1
0.0
0.1
0.2
0.3
0.4
1M AC Queries
ThompsonScores
ThompsonPositions
ThompsonScores&Positions
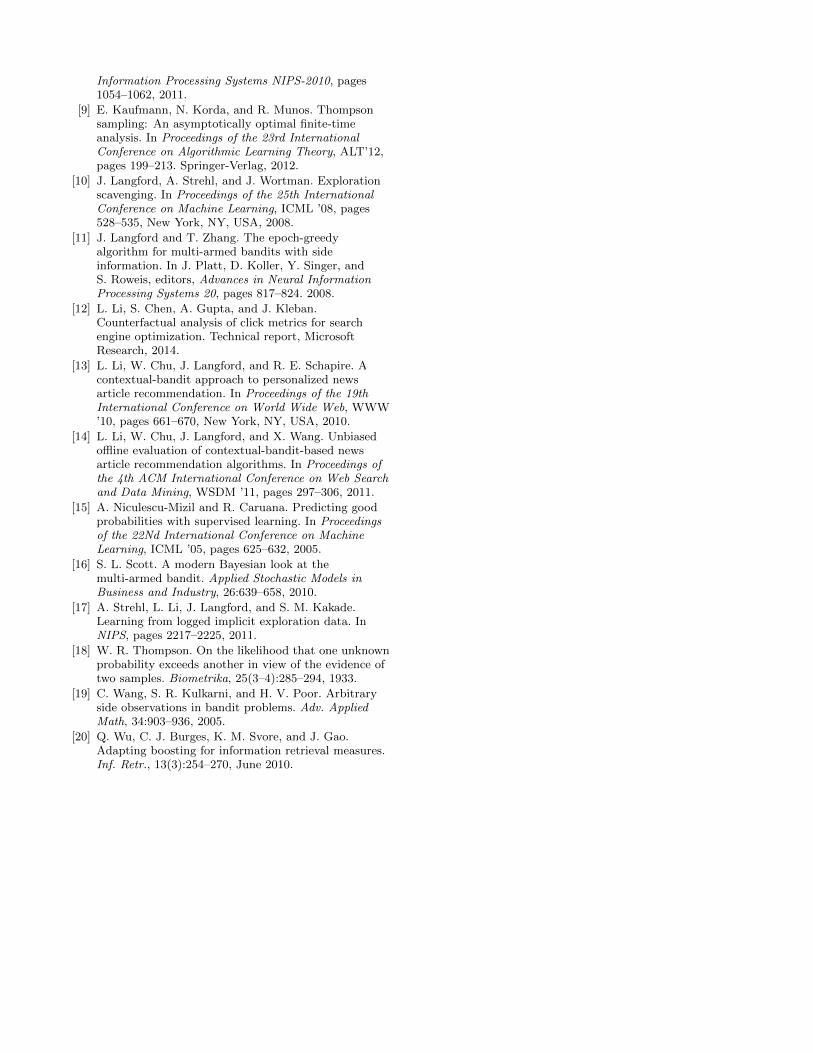
Figure 5: CTR lift during exploration for k = 3 - 100K and1M AC Queries.
No Exploration model from the plots.Step 3. On the same set of queries, used to train the
baseline model, we run the discussed Thompson samplingpolicies, with n buckets as described in Section 3.1, dividingthe scores interval into 100 equal subintervals as mentionedin the same section. The policies involve a stochastic step- each of them decides randomly to place on position i = kone of the suggestions from positions i = k, k + 1, ..., N , asdescribed in Section 2.3. The resulting top k suggestions arewhat a scaled down version of the production system wouldlog if it utilizes the respective policy. We use this data totrain the same type of model configured identically as thebaseline model. Therefore, the improvement observed onthe test period can be attributed entirely to the explorationdata collected through the policies.
Step 4. If a query has fewer than, or equal to, k results inthe production logs we add it to the training set as is becausein this case there are no results to explore from. We estimatethat approximately 60% of the queries have more than tworesults and approximately 50% have more than three results.These are the queries which contribute to exploration for thetwo settings of k = 2 and k = 3 respectively.
Step 5. Finally, in training the models, we re-weight theexamples collected with the exploration policies using theweighting schemes discussed in Section 3.2.
4.2 Evaluation of policiesLet us now discuss in some more detail the results from
the different experiments.Model improvement. Figures 2 and 3 show the model
improvement achieved with different policies for k = 2 andk = 3 suggestions respectively. CTR is measured as thefraction of queries that would result in a click over all queriesfrom the test month in an Autocomplete system that woulddisplay up to k suggestions.
Naturally, having more data to train on improves the per-formance of all models. The CTR for all models for k = 2(Figure 2) ranges from 0.87 to 0.92 while for k = 3 it is be-tween 0.94 and 0.96 (Figure 3). The larger CTR for k = 3is due to two factors: 1) For k = 3 the system displays moreresults which are more likely to contain the clicked sugges-

i=2 i=3 i=4 i=50
0.1
0.2
0.3
0.4
0.5
0.6
0.7
0.8
0.9E
xplo
red
exam
ples
per
pos
ition
100K AC Queries
i=2 i=3 i=4 i=50
0.1
0.2
0.3
0.4
0.5
0.6
0.7
0.8
0.9
11M AC Queries
Th. PositionsTh. Scores&PositionsTh. Scores
Figure 6: Examples explored from different positions fork = 2.
tion from the production logs; 2) There is difference in thenumber of training examples too. For instance, for k = 2we still use 1M queries in the largest experiment, but eachquery contributes with up to two results, i.e. we have ap-proximately 1.5M training examples in total. For k = 3there are approximately 2.5M examples for the same set ofqueries.
We can see from the figures that in both cases the poli-cies which account for bias in the model scores, Thomp-son over Scores (Scores for simplicity) and Thompson overScores&Positions (Scores&Positions for simplicity), achievelarge improvement over the production No Exploration sys-tem. The advantage of the Scores policy is especially strik-ing for k = 2 yielding a consistent 1.5% model improve-ment across all query set sizes. In fact, using Scores orScores&Positions with just 50K training queries results inmodels which have better test performance for both settingsof k than the production No Exploration model trained on1M queries!
What is the reason for Scores to perform better thanScores&Positions, and for both of them to outperform Po-sitions which barely improves on the production model for1M queries? We believe the answer is twofold.
First, there is a not too pronounced position bias associ-ated with the problem. In web search often multiple resultsare relevant to a query. Showing them on different positionsfrequently yields different CTR. Here the intent is usuallyvery well specified. Users are mostly interested in one par-ticular geo-entity, e.g. a specific restaurant, park or a resi-dential address. There are also only up to five suggestionsper query which are easy to inspect visually.
Second, there is very stable CTR associated with each po-sition. Higher positions have higher CTR. Thompson sam-pling policies that utilize position information quickly iden-tify this and start apportioning most of the exploration tothe optimal position. Therefore, exploration stops too early.
Exploration rate ε. For all experiments we use explo-ration rate ε = 1 (line 9, 11 in Algorithm 1). Decreasing εforces Thompson sampling to continue exploration longer.As we mentioned above, Positions stops exploration too
i=3 i=4 i=50
0.1
0.2
0.3
0.4
0.5
0.6
0.7
Exp
lore
d ex
ampl
es p
er p
ositi
on
100K AC Queries
i=3 i=4 i=50
0.1
0.2
0.3
0.4
0.5
0.6
0.7
0.8
0.9
11M AC Queries
Th. PositionsTh. Scores&PositionsTh. Scores
Figure 7: Examples explored from different positions fork = 3.
early. To force further exploration, for this policy only, wedecrease the rate to ε = 0.01. Still, as we see in Figures 2and 3 Positions only marginally improves on No Explorationfor 1M examples. It should be noted that one cannot de-crease ε dramatically because then there is significant dropin CTR during exploration, which might be too steep of aprice to pay for model improvement.
Weighting scheme. We repeated all experiments fromFigures 2 and 3 with both weighting schemes discussed inSection 3.2. Though propensity based weighting is consid-ered a more suitable weighting scheme in the literature [14],for our multi-result ranking problem we observed a differentoutcome. For k = 2 the multinomial weighting producedover 0.5% improvement compared to propensity weights.Multinomial weighting was also slightly better, though lesspronounced, in the case of k = 3. All model improvementresults presented here reflect multinomial weighting.
CTR lift in exploration. So far we saw that we cantrain models that outperform the production one by usingexploration data from specific policies. We now look intowhat price the production system will pay for this model im-provement. The common understanding is that as EE selectspotentially suboptimal results production systems should al-ways sustain a drop in CTR during the period of exploration.
Figure 4 and 5 demonstrate one of the major contribu-tions of this work. They show that the above assumption isnot necessarily true. On the contrary, if the right policy isselected multi-result ranking systems can even record a liftin their CTR. Here, CTR lift during exploration is definedas the CTR of each policy minus the CTR of the produc-tion No Explore system both computed during the trainingmonth.
The Positions policy indeed impacts the CTR of the pro-duction system negatively: 1.2% and 0.3% drop in CTR fork = 2, 100K and 1M queries Figure 4, and 0.6% and 0.2%drop in CTR for k = 3 Figure 5. The results are for ε = 0.01,yet even for ε = 1 we observe a drop in CTR.
With the Scores and Scores&Positions policies, however,we observe stable lift in CTR especially as the query set sizegrows to 1M. For k = 2 and dataset size of 1M queries the
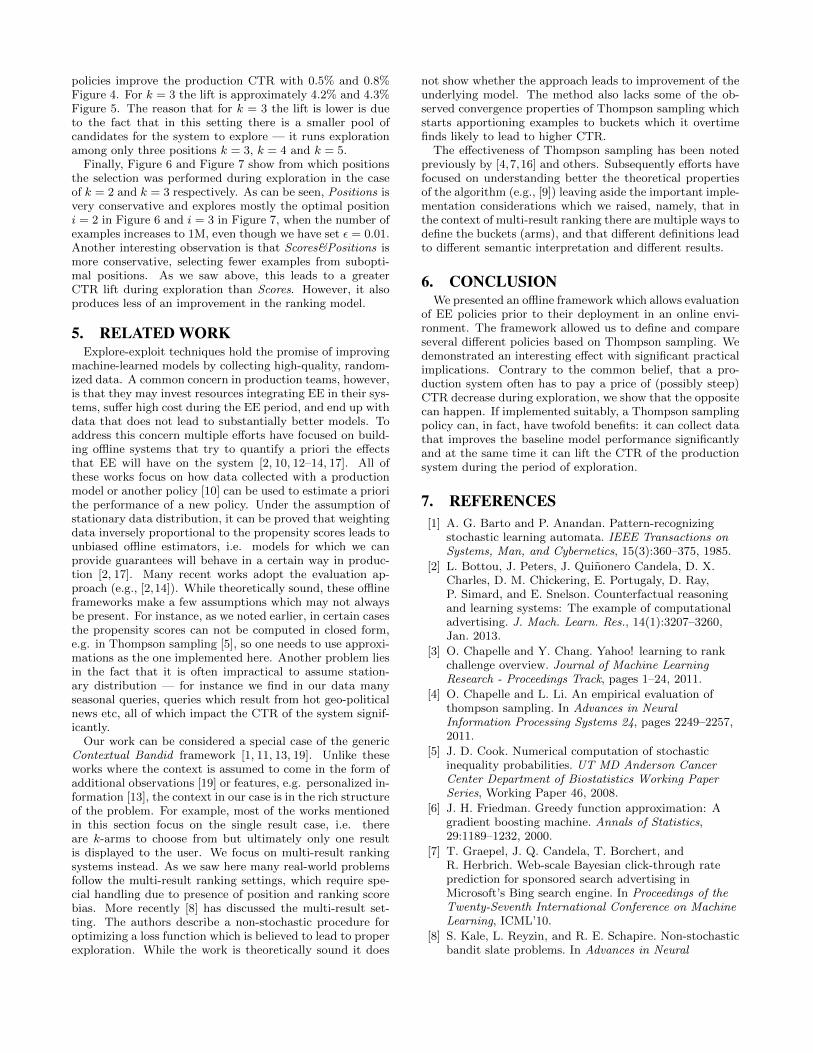
policies improve the production CTR with 0.5% and 0.8%Figure 4. For k = 3 the lift is approximately 4.2% and 4.3%Figure 5. The reason that for k = 3 the lift is lower is dueto the fact that in this setting there is a smaller pool ofcandidates for the system to explore — it runs explorationamong only three positions k = 3, k = 4 and k = 5.
Finally, Figure 6 and Figure 7 show from which positionsthe selection was performed during exploration in the caseof k = 2 and k = 3 respectively. As can be seen, Positions isvery conservative and explores mostly the optimal positioni = 2 in Figure 6 and i = 3 in Figure 7, when the number ofexamples increases to 1M, even though we have set ε = 0.01.Another interesting observation is that Scores&Positions ismore conservative, selecting fewer examples from subopti-mal positions. As we saw above, this leads to a greaterCTR lift during exploration than Scores. However, it alsoproduces less of an improvement in the ranking model.
5. RELATED WORKExplore-exploit techniques hold the promise of improving
machine-learned models by collecting high-quality, random-ized data. A common concern in production teams, however,is that they may invest resources integrating EE in their sys-tems, suffer high cost during the EE period, and end up withdata that does not lead to substantially better models. Toaddress this concern multiple efforts have focused on build-ing offline systems that try to quantify a priori the effectsthat EE will have on the system [2, 10, 12–14, 17]. All ofthese works focus on how data collected with a productionmodel or another policy [10] can be used to estimate a priorithe performance of a new policy. Under the assumption ofstationary data distribution, it can be proved that weightingdata inversely proportional to the propensity scores leads tounbiased offline estimators, i.e. models for which we canprovide guarantees will behave in a certain way in produc-tion [2, 17]. Many recent works adopt the evaluation ap-proach (e.g., [2,14]). While theoretically sound, these offlineframeworks make a few assumptions which may not alwaysbe present. For instance, as we noted earlier, in certain casesthe propensity scores can not be computed in closed form,e.g. in Thompson sampling [5], so one needs to use approxi-mations as the one implemented here. Another problem liesin the fact that it is often impractical to assume station-ary distribution — for instance we find in our data manyseasonal queries, queries which result from hot geo-politicalnews etc, all of which impact the CTR of the system signif-icantly.
Our work can be considered a special case of the genericContextual Bandid framework [1, 11, 13, 19]. Unlike theseworks where the context is assumed to come in the form ofadditional observations [19] or features, e.g. personalized in-formation [13], the context in our case is in the rich structureof the problem. For example, most of the works mentionedin this section focus on the single result case, i.e. thereare k-arms to choose from but ultimately only one resultis displayed to the user. We focus on multi-result rankingsystems instead. As we saw here many real-world problemsfollow the multi-result ranking settings, which require spe-cial handling due to presence of position and ranking scorebias. More recently [8] has discussed the multi-result set-ting. The authors describe a non-stochastic procedure foroptimizing a loss function which is believed to lead to properexploration. While the work is theoretically sound it does
not show whether the approach leads to improvement of theunderlying model. The method also lacks some of the ob-served convergence properties of Thompson sampling whichstarts apportioning examples to buckets which it overtimefinds likely to lead to higher CTR.
The effectiveness of Thompson sampling has been notedpreviously by [4,7,16] and others. Subsequently efforts havefocused on understanding better the theoretical propertiesof the algorithm (e.g., [9]) leaving aside the important imple-mentation considerations which we raised, namely, that inthe context of multi-result ranking there are multiple ways todefine the buckets (arms), and that different definitions leadto different semantic interpretation and different results.
6. CONCLUSIONWe presented an offline framework which allows evaluation
of EE policies prior to their deployment in an online envi-ronment. The framework allowed us to define and compareseveral different policies based on Thompson sampling. Wedemonstrated an interesting effect with significant practicalimplications. Contrary to the common belief, that a pro-duction system often has to pay a price of (possibly steep)CTR decrease during exploration, we show that the oppositecan happen. If implemented suitably, a Thompson samplingpolicy can, in fact, have twofold benefits: it can collect datathat improves the baseline model performance significantlyand at the same time it can lift the CTR of the productionsystem during the period of exploration.
7. REFERENCES[1] A. G. Barto and P. Anandan. Pattern-recognizing
stochastic learning automata. IEEE Transactions onSystems, Man, and Cybernetics, 15(3):360–375, 1985.
[2] L. Bottou, J. Peters, J. Quinonero Candela, D. X.Charles, D. M. Chickering, E. Portugaly, D. Ray,P. Simard, and E. Snelson. Counterfactual reasoningand learning systems: The example of computationaladvertising. J. Mach. Learn. Res., 14(1):3207–3260,Jan. 2013.
[3] O. Chapelle and Y. Chang. Yahoo! learning to rankchallenge overview. Journal of Machine LearningResearch - Proceedings Track, pages 1–24, 2011.
[4] O. Chapelle and L. Li. An empirical evaluation ofthompson sampling. In Advances in NeuralInformation Processing Systems 24, pages 2249–2257,2011.
[5] J. D. Cook. Numerical computation of stochasticinequality probabilities. UT MD Anderson CancerCenter Department of Biostatistics Working PaperSeries, Working Paper 46, 2008.
[6] J. H. Friedman. Greedy function approximation: Agradient boosting machine. Annals of Statistics,29:1189–1232, 2000.
[7] T. Graepel, J. Q. Candela, T. Borchert, andR. Herbrich. Web-scale Bayesian click-through rateprediction for sponsored search advertising inMicrosoft’s Bing search engine. In Proceedings of theTwenty-Seventh International Conference on MachineLearning, ICML’10.
[8] S. Kale, L. Reyzin, and R. E. Schapire. Non-stochasticbandit slate problems. In Advances in Neural
Information Processing Systems NIPS-2010, pages1054–1062, 2011.
[9] E. Kaufmann, N. Korda, and R. Munos. Thompsonsampling: An asymptotically optimal finite-timeanalysis. In Proceedings of the 23rd InternationalConference on Algorithmic Learning Theory, ALT’12,pages 199–213. Springer-Verlag, 2012.
[10] J. Langford, A. Strehl, and J. Wortman. Explorationscavenging. In Proceedings of the 25th InternationalConference on Machine Learning, ICML ’08, pages528–535, New York, NY, USA, 2008.
[11] J. Langford and T. Zhang. The epoch-greedyalgorithm for multi-armed bandits with sideinformation. In J. Platt, D. Koller, Y. Singer, andS. Roweis, editors, Advances in Neural InformationProcessing Systems 20, pages 817–824. 2008.
[12] L. Li, S. Chen, A. Gupta, and J. Kleban.Counterfactual analysis of click metrics for searchengine optimization. Technical report, MicrosoftResearch, 2014.
[13] L. Li, W. Chu, J. Langford, and R. E. Schapire. Acontextual-bandit approach to personalized newsarticle recommendation. In Proceedings of the 19thInternational Conference on World Wide Web, WWW’10, pages 661–670, New York, NY, USA, 2010.
[14] L. Li, W. Chu, J. Langford, and X. Wang. Unbiasedoffline evaluation of contextual-bandit-based newsarticle recommendation algorithms. In Proceedings ofthe 4th ACM International Conference on Web Searchand Data Mining, WSDM ’11, pages 297–306, 2011.
[15] A. Niculescu-Mizil and R. Caruana. Predicting goodprobabilities with supervised learning. In Proceedingsof the 22Nd International Conference on MachineLearning, ICML ’05, pages 625–632, 2005.
[16] S. L. Scott. A modern Bayesian look at themulti-armed bandit. Applied Stochastic Models inBusiness and Industry, 26:639–658, 2010.
[17] A. Strehl, L. Li, J. Langford, and S. M. Kakade.Learning from logged implicit exploration data. InNIPS, pages 2217–2225, 2011.
[18] W. R. Thompson. On the likelihood that one unknownprobability exceeds another in view of the evidence oftwo samples. Biometrika, 25(3–4):285–294, 1933.
[19] C. Wang, S. R. Kulkarni, and H. V. Poor. Arbitraryside observations in bandit problems. Adv. AppliedMath, 34:903–936, 2005.
[20] Q. Wu, C. J. Burges, K. M. Svore, and J. Gao.Adapting boosting for information retrieval measures.Inf. Retr., 13(3):254–270, June 2010.
Related Documents