Published: March 11, 2011 r2011 American Chemical Society 2754 dx.doi.org/10.1021/ac200050n | Anal. Chem. 2011, 83, 2754–2760 ARTICLE pubs.acs.org/ac Evaluation of Electrochemiluminescent Metabolic Toxicity Screening Arrays Using a Multiple Compound Set Shenmin Pan, † Linlin Zhao, † John B. Schenkman, § and James F. Rusling* ,†,‡,§ † Department of Chemistry and ‡ Institute of Materials Science, University of Connecticut, Storrs, Connecticut 06269, United States § Department of Cell Biology, University of Connecticut Health Center, Farmington, Connecticut 06032, United States b S Supporting Information R eactive metabolites of foreign chemicals can react with DNA bases to form covalent adducts that are good biomarkers for toxicity exposure. 13 Consequently, detecting reactions of me- tabolites with DNA is an effective approach for safety assessment of new chemicals and drugs. 4,5 DNA damage resulting from parent compounds or reactive metabolites is often referred to as genotoxicity. Species reacting with DNA may also react with proteins and other biomolecules. 6 In vitro bioassays are used extensively in the pharmaceutical industry to help predict human toxicity. 4,5,7 Toxicity bioassays are generally combined into a panel that provides a reasonably good prediction of human toxicity. 7 However, behavior of a given chemical in specific individuals with unique biochemistry is difficult to predict from assay panel results. Animal testing is widely used but can over- or underestimate risk to humans because of species differences. 8 Due to these difficulties, ∼30% of new drug candidates fail due to toxicity issues that are not discovered until clinical testing. 9,10 Simple, fast, reliable, and inexpensive molecular-based in vitro methods for initial screening of compounds to complement cell- based bioassays are largely nonexistent. Realizing this fact, we recently developed inexpensive electro-optical arrays based on visible electrochemiluminescence (ECL) light emission to detect chemical reactions between metabolites and DNA. These arrays measure relative DNA damage rates from reactive metabolites generated by enzymes in ultrathin films. 1113 The arrays feature multiple spots constructed layer-by-layer (LbL) from metabolic enzymes, DNA, and the ECL-emitting ruthenium(II)polyvinylpyridine polymer [Ru(bpy) 2 PVP 10 ] 2þ (RuPVP) on a 1 1 in. chip of conductive pyrolytic graphite (PG). The chip is a solid electrode with up to 50 spots di fferentiated by position and allows measurement of ECL with a charge coupled device (CCD) camera from an open-top electrochemical cell (Supporting Information, Scheme S1). In the measurement step, Ru II PVP is electrochemically oxidized to Ru III PVP, which reacts with DNA in a complex pathway to produce excited state *Ru II PVP sites that decay to give ECL at 610 nm. 14 Toxicity screening is achieved by first using the ECL arrays to enzymatically convert test chemicals into metabolites. Reactive metabolites are trapped in the spots by ds-DNA as covalent nucleobase adducts (Supporting Information, Scheme S1A). The second step is detection of DNA damage by applying voltage to the array and capturing the ECL image (Supporting Information, Scheme S1B). Integrated ECL intensity increases when DNA is damaged because of the partially disrupted DNA structure, facilitating faster oxidation of guanines by Ru III PVP sites by shortening the average distance between them. 14 The ds-DNA here is not protected by histones or other cell compo- nents, so the arrays predict only the possibility of DNA damage from reactive metabolites produced by the enzyme reactions. Received: January 7, 2011 Accepted: February 26, 2011 ABSTRACT: Arrays for screening metabolite-generated toxicity utiliz- ing spots containing DNA, enzyme, and electroluminescent (ECL) polymer ([Ru(bpy) 2 PVP 10 ] 2þ ) were extended to include a fully repre- sentative set of metabolic enzymes from human and rat liver microsomes, human and rat liver cytosol, and mouse liver S9 fractions. Array use involves two steps: (1) enzyme activation of the test chemical and metabolite reaction with DNA, and then, (2) capture of ECL resulting from DNA damage using a charge coupled device (CCD) camera. Plots of ECL increase vs enzyme reaction time monitor relative rates of DNA damage and were converted into turnover rates for enzymic production of DNA-reactive metabolites. ECL turnover rates were defined by R, the initial slope of ECL increase versus enzyme reaction time normalized for amounts of enzyme and test chemical. R-values were used to establish correlations for 11 toxic compounds with the standard toxicity metrics rodent liver TD 50 and lethal dose (LD 50 ), Ames tests, and Comet assays for in vitro DNA damage. Results support the value of the ECL genotoxicity arrays together with toxicity bioassays for early screening of new chemicals and drug candidates.

Welcome message from author
This document is posted to help you gain knowledge. Please leave a comment to let me know what you think about it! Share it to your friends and learn new things together.
Transcript
Published: March 11, 2011
r 2011 American Chemical Society 2754 dx.doi.org/10.1021/ac200050n |Anal. Chem. 2011, 83, 2754–2760
ARTICLE
pubs.acs.org/ac
Evaluation of Electrochemiluminescent Metabolic Toxicity ScreeningArrays Using a Multiple Compound SetShenmin Pan,† Linlin Zhao,† John B. Schenkman,§ and James F. Rusling*,†,‡,§
†Department of Chemistry and ‡Institute of Materials Science, University of Connecticut, Storrs, Connecticut 06269, United States§Department of Cell Biology, University of Connecticut Health Center, Farmington, Connecticut 06032, United States
bS Supporting Information
Reactive metabolites of foreign chemicals can react with DNAbases to form covalent adducts that are good biomarkers for
toxicity exposure.1�3 Consequently, detecting reactions of me-tabolites with DNA is an effective approach for safety assessmentof new chemicals and drugs.4,5 DNA damage resulting fromparent compounds or reactive metabolites is often referred to asgenotoxicity. Species reacting with DNA may also react withproteins and other biomolecules.6
In vitro bioassays are used extensively in the pharmaceuticalindustry to help predict human toxicity.4,5,7 Toxicity bioassaysare generally combined into a panel that provides a reasonablygood prediction of human toxicity.7 However, behavior of a givenchemical in specific individuals with unique biochemistry isdifficult to predict from assay panel results. Animal testing iswidely used but can over- or underestimate risk to humansbecause of species differences.8 Due to these difficulties,∼30% ofnew drug candidates fail due to toxicity issues that are notdiscovered until clinical testing.9,10
Simple, fast, reliable, and inexpensive molecular-based in vitromethods for initial screening of compounds to complement cell-based bioassays are largely nonexistent. Realizing this fact, werecently developed inexpensive electro-optical arrays based on visibleelectrochemiluminescence (ECL) light emission to detect chemicalreactions between metabolites and DNA. These arrays measurerelative DNA damage rates from reactive metabolites generated byenzymes in ultrathin films.11�13 The arrays feature multiple spotsconstructed layer-by-layer (LbL) from metabolic enzymes, DNA,
and the ECL-emitting ruthenium(II)polyvinylpyridine polymer[Ru(bpy)2PVP10]
2þ (RuPVP) on a 1 � 1 in. chip of conductivepyrolytic graphite (PG). The chip is a solid electrode with up to 50spots differentiated by position and allows measurement of ECLwith a charge coupled device (CCD) camera from an open-topelectrochemical cell (Supporting Information, Scheme S1). In themeasurement step, RuIIPVP is electrochemically oxidized toRuIIIPVP, which reacts with DNA in a complex pathway to produceexcited state *RuIIPVP sites that decay to give ECL at 610 nm.14
Toxicity screening is achieved by first using the ECL arrays toenzymatically convert test chemicals into metabolites. Reactivemetabolites are trapped in the spots by ds-DNA as covalentnucleobase adducts (Supporting Information, Scheme S1A).The second step is detection of DNA damage by applyingvoltage to the array and capturing the ECL image (SupportingInformation, Scheme S1B). Integrated ECL intensity increaseswhen DNA is damaged because of the partially disrupted DNAstructure, facilitating faster oxidation of guanines by RuIIIPVPsites by shortening the average distance between them.14 Theds-DNA here is not protected by histones or other cell compo-nents, so the arrays predict only the possibility of DNA damagefrom reactive metabolites produced by the enzyme reactions.
Received: January 7, 2011Accepted: February 26, 2011
ABSTRACT: Arrays for screening metabolite-generated toxicity utiliz-ing spots containing DNA, enzyme, and electroluminescent (ECL)polymer ([Ru(bpy)2PVP10]
2þ) were extended to include a fully repre-sentative set of metabolic enzymes from human and rat livermicrosomes,human and rat liver cytosol, and mouse liver S9 fractions. Array useinvolves two steps: (1) enzyme activation of the test chemical andmetabolite reaction with DNA, and then, (2) capture of ECL resultingfrom DNA damage using a charge coupled device (CCD) camera. Plotsof ECL increase vs enzyme reaction time monitor relative rates of DNAdamage and were converted into turnover rates for enzymic productionof DNA-reactive metabolites. ECL turnover rates were defined by R, the initial slope of ECL increase versus enzyme reaction timenormalized for amounts of enzyme and test chemical. R-values were used to establish correlations for 11 toxic compounds with thestandard toxicity metrics rodent liver TD50 and lethal dose (LD50), Ames tests, and Comet assays for in vitro DNA damage. Resultssupport the value of the ECL genotoxicity arrays together with toxicity bioassays for early screening of new chemicals and drugcandidates.
2755 dx.doi.org/10.1021/ac200050n |Anal. Chem. 2011, 83, 2754–2760
Analytical Chemistry ARTICLE
Slopes of ECL increase vs enzyme reaction time using thesearrays were proven to correspond to relative DNA damage ratesby correlations with formation rates of major nucleobase adductsmeasured by liquid chromatography (LC)-MS using DNA/enzyme films on nanoparticles.11�13,15 Slopes of ECL increasevs reaction time also correlated with rodent liver TD50, thechronic dose for inducing liver tumors, for a limited set ofcompounds.13 We also used these arrays to confirm speciesdifferences in ds-DNA damage rates by tamoxifen using enzymesfrom rat vs human liver.16
A universal ECL array genotoxicity platform would be avaluable addition to in vitro toxicity bioassays for early screeningof commercial chemical candidates. To move toward this goal,we report here a representative array platform featuring a broadrange of microsomal and cytosolic enzymes17 that facilitatesdetection of DNA-reactive species from nearly all commonmetabolic pathways. The array utilizes metabolic enzymes fromrat and human liver microsomes and rat and human liver cytosoland includes mouse liver S9 fractions for the first time torepresent human and rodent metabolism. We evaluate this newarray by comparing 11 chemicals under identical conditions atoptimal concentrations for signal development. Correlations ofECL array data to genotoxicity bioassay data and rodent toxicitymetrics were evaluated for this group of compounds.
’EXPERIMENTAL SECTION
Chemicals and Materials. Full experimental details andsources of chemicals are reported in the Supporting Information.Array Fabrication. ECL arrays were made as previously
described.12,13 Calf thymus ds-DNA, RuPVP, and enzyme weredeposited by pipetting 0.5 μL drops of solution on PGblocks. Finalspot compositions represented as the order of layer deposition areDNA/(RuPVP/DNA)2/RuPVP/DNA/human liver cytosol/RuPVP/DNA/human liver microsomes, DNA/(RuPVP/DNA)2/RuPVP/DNA/rat liver cytosol/RuPVP/DNA/rat livermicrosomes, and DNA/(RuPVP/DNA)2/(RuPVP/DNA/MouseS9)2. For brevity, spots are generally denoted as DNA/RuPVP/enzyme, DNA/RuPVP/HLE, DNA/RuPVP/RLE, DNA/RuPVP/MLE, where HLE denotes human liver enzymes fromliver microsomes/cytosol, RLE represents the corresponding ratliver enzymes, and MLE is mouse S9 liver fraction.
Reaction with DNA Damaging Agents. Safety Note: all testcompounds are suspected human carcinogens. Procedures should bedone wearing gloves in a closed hood. Incubations were done onarrays by spotting 50 μL incubating solutions containing testchemical and enzyme cofactors onto four DNA/RuPVP/enzymespots at 37 �C for up to 60 s. The array was rinsed rapidly withwater to stop the reaction.ECL Measurement. After enzyme reactions, the array was
placed in an open top electrochemical cell filled with pH 5.5,10 mM buffer þ 0.15 M NaCl.12 A potential of 1.25 V vs Ag/AgCl was applied to the array for 30 s to develop ECL which isacquired over this time by the CCD camera.
’RESULTS
Film Characterization. Film compositions used in the arraywere characterized by making the films on 9 MHz quartz crystalmicrobalance (QCM) gold-quartz resonators. Frequency shiftsafter each layer were deposited, dried, and used to calculate theweight of each component and nominal film thickness(Supporting Information, Table S1).18 QCM frequency de-creased linearly with increasing layer number, indicative of stable,reproducible film growth (Supporting Information, Figure S1).Films had about 40 nm thicknesses, suggesting that reactions willnot be limited mass transport processes.19
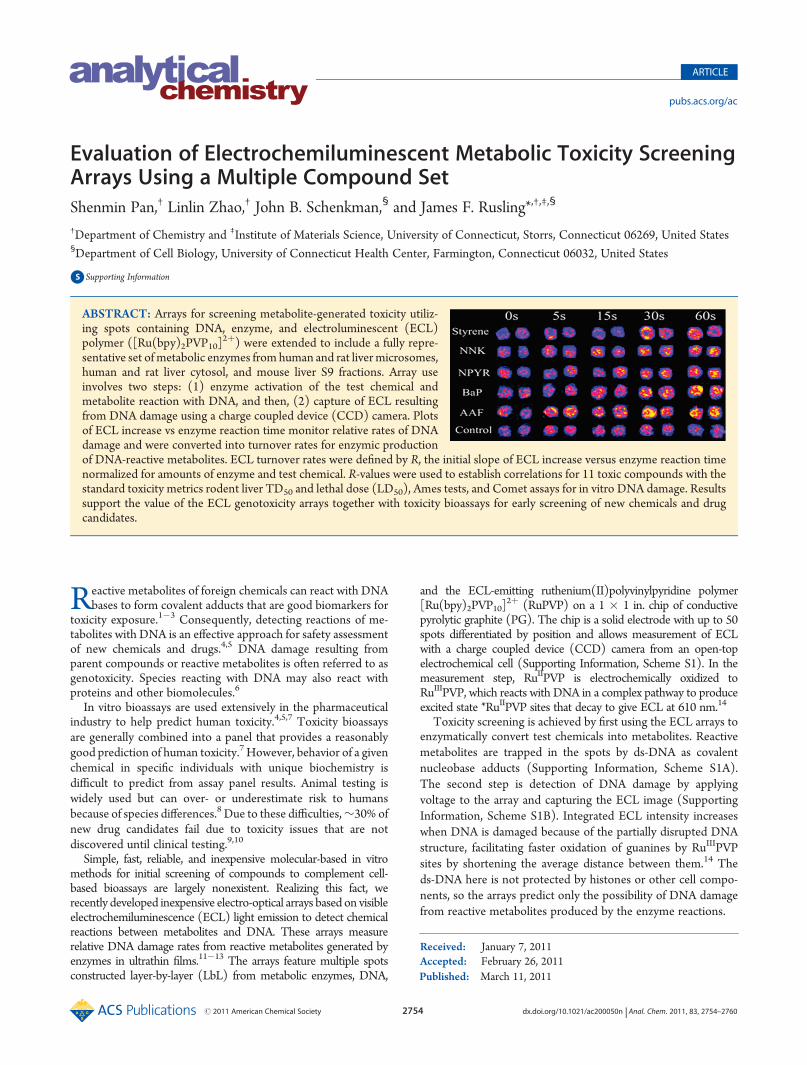
Single-Enzyme Bioactivation. Test chemicals were N-acetyl-2-aminofluorene (2-AAF), N-nitrosopyrrolidine (NPYR), 4-(methylnitrosamino)-1-(3-pyridyl)-1-butanone (NNK), benzo-[a]pyrene (BaP), and styrene. These compounds have well under-stood DNA-metabolite adduct formation via cytochrome P450(cyt P450)-catalyzed oxidations. Figure 1 portrays reconstructedECL images of a representative set of array spots containing (A)human liver microsomes/cytosol (HLE) and (B) rat liver micro-somes/cytosol (RLE), exposed to low, medium, and high con-centrations of substrates using an NADPH regenerating system toactivate cyt P450s. Increased ECL intensity was observed after theDNA/RuPVP/enzyme film spots were exposed to different sub-strates suggesting DNA damage. As mentioned earlier, the rate ofECL increase versus enzyme reaction time in the ECL arraysreflects the relative rate of DNA damage.12,13,17 Control spotsexposed to only an NADPH generating system showed negligibleECL increases (Figure 1). Control spots with enzymes incubated
Figure 1. Reconstructed ECL array data for a series of enzyme reaction times using DNA/RuPVP/enzyme spots. Enzyme sources were humanmicrosomes/cytosol (human liver enzymes, HLE) for (A) and rat liver microsomes/cytosol (rat liver enzymes, RLE) for (B). Concentrations ofsubstrates: 0.2 mM styrene, 0.2 mMNNK, 0.2 mMNPYR, 0.05mMBaP, and 0.025mM2-AAF using an NADPH regeneration system for denoted timein seconds. Controls were exposed to only NADPH.
2756 dx.doi.org/10.1021/ac200050n |Anal. Chem. 2011, 83, 2754–2760
Analytical Chemistry ARTICLE
with substrates, but no NADPH, did not generate ECL increases(not shown).Relative ECL intensities normalized for enzyme mass in the
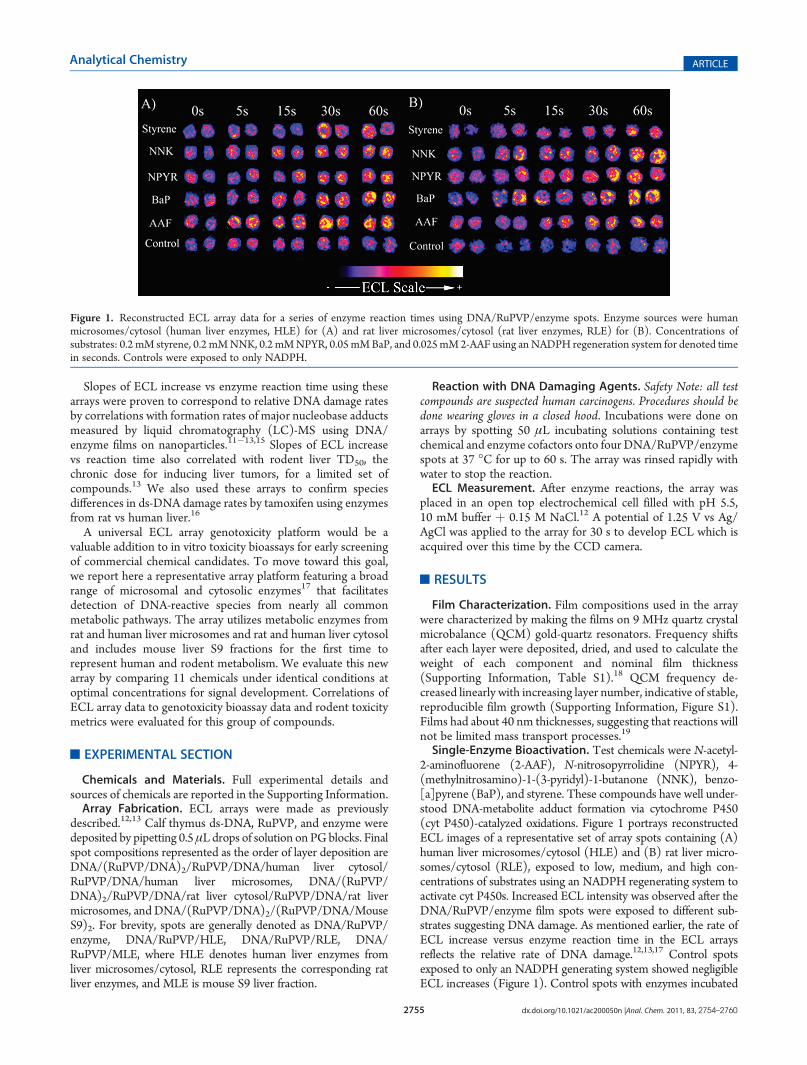
spot are presented as %ECL increase vs enzyme reaction time(Figure 2). Error bars reflect ECL reproducibility within(8% for12 replicates on 3 or more arrays at each reaction time. ECLincreases ranged from 70% to 300% for array spots for differentsubstrates using HLE and RLE (red and black). Control spotsexposed to only substrates produced negligible ECL changes(green and blue), suggesting no detectable DNA damage. Differ-ent ECL responses were found for reactions catalyzed by RLE andHLE for styrene, NNK, NPYR, and 2-AAF. There was nostatistically significant difference for BaP when RLE or HLE wasused (student t test, 95% confidence). These data were obtainedafter identifying the range of substrate concentrations givingreadily measurable ECL increases for 1 min enzyme reactions.Slopes of normalized ECL increases for different concentrationswere within (10% when divided by substrate concentration. At0.2 mM, NNK and NPYR produced about 2�3 times more ECLthan styrene using either RLE orHLE (Figure 2), suggestingmoreDNA damage. A lower concentration (0.025�0.05 mM) wassufficient for 2-AAF and BaP to generate comparable ECLincreases. 2-AAF gave a nonlinear ECL increase using HLE anda linear increase using RLE. BaP gave a similar linear ECL increaseusing both RLE and HLE (Figure 2). As discussed later, theseobservations led us to use the initial slopes of ECL vs reaction timeestimated at zero reaction time and normalized for enzyme andsubstrate mass to compare array results with other toxicity indices.Multienzyme Bioactivations. These experiments were done
on 1-naphthylamine (1-NA), 2-naphthylamine (2-NA), 2,4-diami-notoluene (2,4-DAT), 2,6-diaminotoluene (2,6-DAT), 4-amino-biphenyl (4-ABP), and 2-aminoflurene (2-AF). These arylamines
are environmental contaminants derived from tobacco, industrial,and agricultural uses.20�22 Arylamines form reactive N-hydroxy-lated derivatives by cyt P450 oxidation.23 Further conjugation ofN-hydroxy arylamines by acetyl- or sulfo-transferases producesconjugates subject to acid hydrolysis to DNA-reactive nitreniumintermediates.24
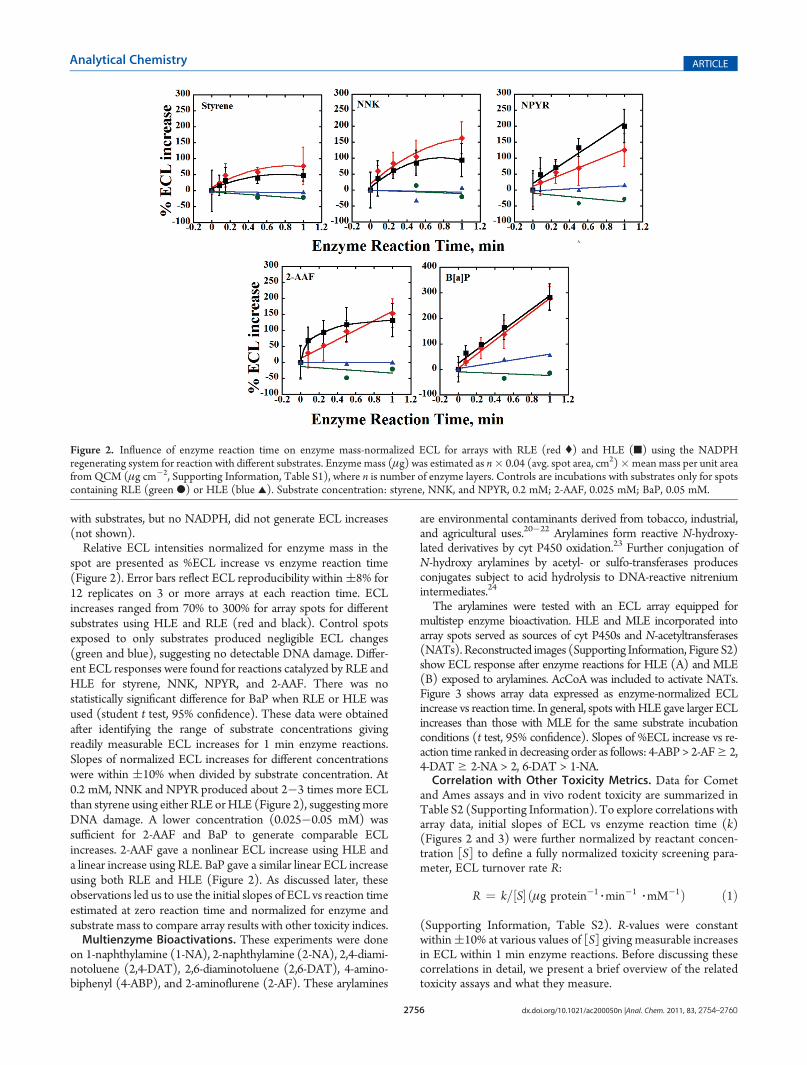
The arylamines were tested with an ECL array equipped formultistep enzyme bioactivation. HLE and MLE incorporated intoarray spots served as sources of cyt P450s and N-acetyltransferases(NATs). Reconstructed images (Supporting Information, Figure S2)show ECL response after enzyme reactions for HLE (A) and MLE(B) exposed to arylamines. AcCoA was included to activate NATs.Figure 3 shows array data expressed as enzyme-normalized ECLincrease vs reaction time. In general, spots withHLE gave larger ECLincreases than those with MLE for the same substrate incubationconditions (t test, 95% confidence). Slopes of %ECL increase vs re-action time ranked in decreasing order as follows: 4-ABP> 2-AFg 2,4-DAT g 2-NA > 2, 6-DAT > 1-NA.Correlation with Other Toxicity Metrics. Data for Comet
and Ames assays and in vivo rodent toxicity are summarized inTable S2 (Supporting Information). To explore correlations witharray data, initial slopes of ECL vs enzyme reaction time (k)(Figures 2 and 3) were further normalized by reactant concen-tration [S] to define a fully normalized toxicity screening para-meter, ECL turnover rate R:
R ¼ k=½S� ðμg protein�13min�1
3mM�1Þ ð1Þ
(Supporting Information, Table S2). R-values were constantwithin(10% at various values of [S] giving measurable increasesin ECL within 1 min enzyme reactions. Before discussing thesecorrelations in detail, we present a brief overview of the relatedtoxicity assays and what they measure.
Figure 2. Influence of enzyme reaction time on enzyme mass-normalized ECL for arrays with RLE (red () and HLE (9) using the NADPHregenerating system for reaction with different substrates. Enzyme mass (μg) was estimated as n� 0.04 (avg. spot area, cm2)�mean mass per unit areafrom QCM (μg cm�2, Supporting Information, Table S1), where n is number of enzyme layers. Controls are incubations with substrates only for spotscontaining RLE (green b) or HLE (blue 2). Substrate concentration: styrene, NNK, and NPYR, 0.2 mM; 2-AAF, 0.025 mM; BaP, 0.05 mM.
2757 dx.doi.org/10.1021/ac200050n |Anal. Chem. 2011, 83, 2754–2760
Analytical Chemistry ARTICLE
Ames Salmonella mutation tests are widely used to assessmutagenicity. The Ames test utilizes strains of Salmonella typhi-murium containing a number of mutations in genes requiringhistidine for growth.25 Gene mutagens can induce reversemutation of the bacteria yielding revertant colonies in theabsence of histidine. The variable measured is the number ofrevertant colonies, also called revertants, taken to correspond tothe mutagenic potential of the test chemical. Bacterial strains likeTA1538 and TA1535 are specifically designed to detect respec-tive frameshift (insertion or deletion of a nucleotide) andmissense (change in one nucleotide) mutations.26 Liver homo-genates from rat or human are used as enzyme sources.26
The Comet assay detects DNA damage caused by single ordouble strand breaks, base damage, and cross-links. Cell linesincubated with toxic chemicals generate broken DNA fragmentswhich stream further from the nucleus during electrophoresisthan intact DNA, creating a “tail”. The product of tail length andfractional amount of DNA in the tail is defined as olive tailmoment (OTM) and used as ameasure of DNA damage.27,28 Forconsistency of metabolic enzyme sources, Comet assay data fromhuman hepatic cell lines were chosen for comparison if available.In vivo animal toxicity is represented by lethal dose (LD50)
and TD50 from rodents. Liver TD50 is the chronic dose (mg/kgbody weight per day) inducing mixed liver tumors in half of a testmale rodent population at the end of the standard life span.29
LD50 is the lethal single dose in mg/kg body weight of a chemicalthat causes the death of 50% of the rodents and is a measure ofacute toxicity.30 The Berkeley Carcinogenic Potency31 andUnited States National Library of Medicine32 databases werethe sources of rodent TD50 and LD50 values. Due to incompleteavailable data, values from rat species were employed for BaP,2-AAF, NPYR, NNK, and styrene while mouse LD50 and liverTD50 (labeled with /) were used for arylamines. Obviously, achemical with small LD50 and liver TD50 values is a very potent
poison, but TD50 measures chronic liver tumorgenicity and LD50
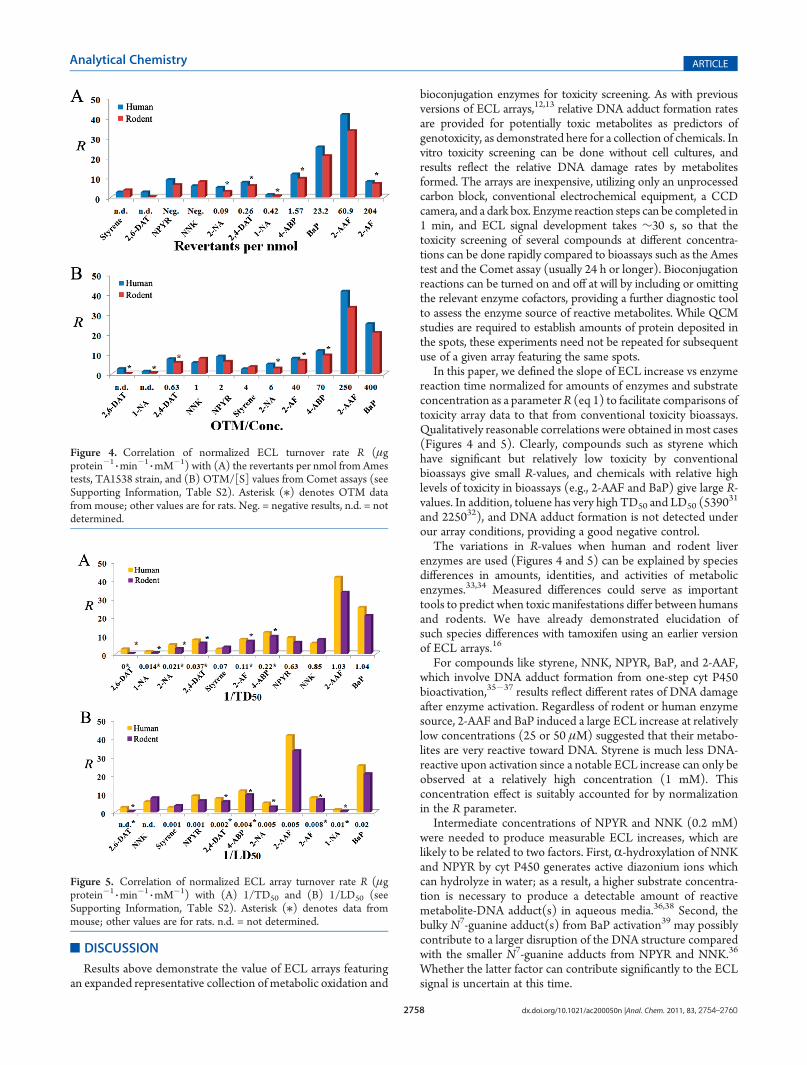
measures general acute toxicity.Figure 4 shows correlations between normalized ECL turn-
over rates (R, eq 1) and Ames and Comet assay data. Figure 5presents correlations of R with TD50 and LD50. All R-values inthese figures indicate a significant rate of DNA damage related tosubstrate metabolism. First, array results show slightly differentECL R-values for human liver enzymes and rodent liver enzymesfor the same substrate. These variations may be related to speciesgenotoxicity differences.16
Correlations of R with Ames data for BaP, 2-AAF, arylamine2-NA, 2,4-DAT, and 4-ABP using TA 1538 strains (Figure 4A)were quite good. However, known tobacco carcinogens NNKand NPYR generated moderate R-values but are not mutagenicusing Ames TA1538 strains and only slightly mutagenic usingTA1535 (Supporting Information, Table S2). Similarly, 2-AFgives a moderate R-value and does not induce mutations usingTA1535 but is highly mutagenic using TA1538.Correlation of R with Comet assay data was good for most
substrates (Figure 4B). Compounds with small OTM/conc. havelow R including styrene, NNK, and NPYR, and those with largeOTM/conc. have large R-values like 2-AAF and BaP.Low LD50 or TD50 are indicative of high toxicity, so inverse
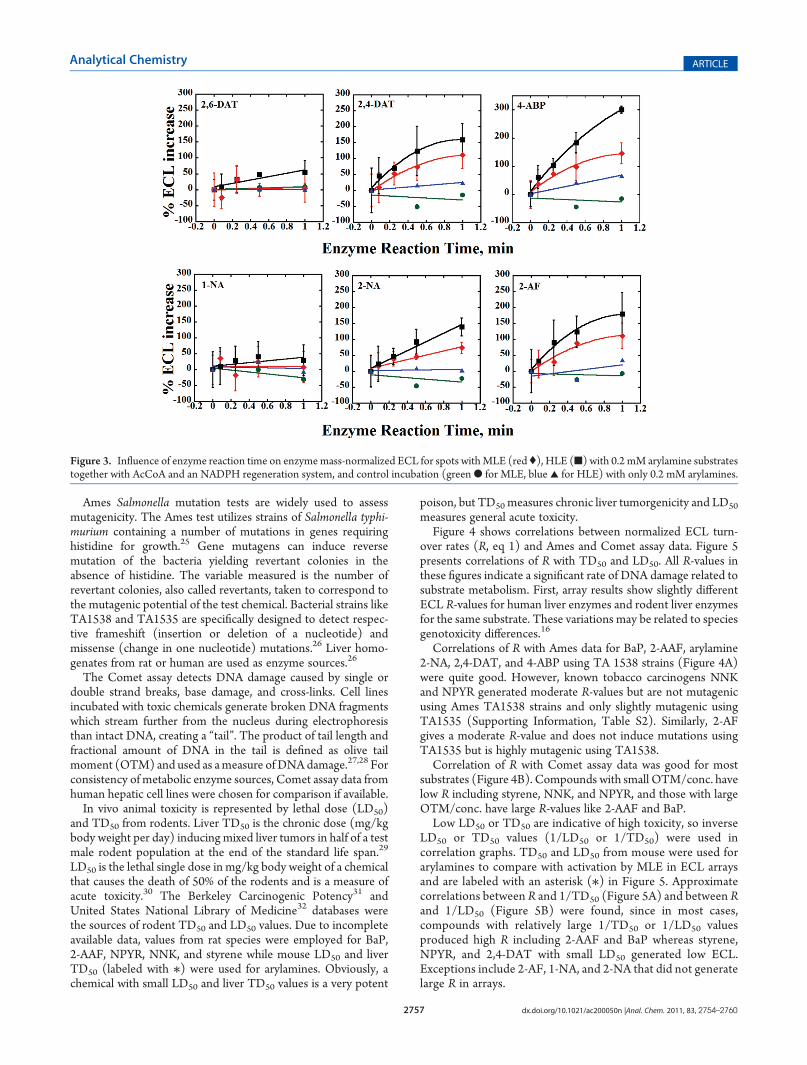
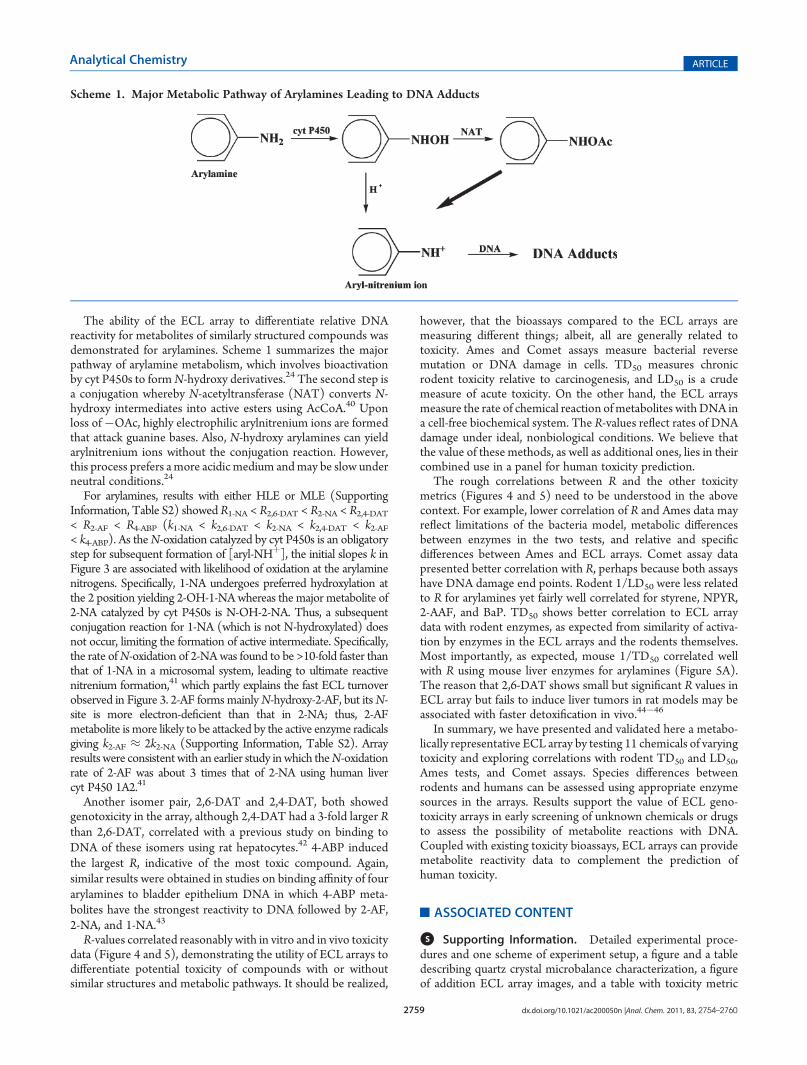
LD50 or TD50 values (1/LD50 or 1/TD50) were used incorrelation graphs. TD50 and LD50 from mouse were used forarylamines to compare with activation by MLE in ECL arraysand are labeled with an asterisk (/) in Figure 5. Approximatecorrelations between R and 1/TD50 (Figure 5A) and between Rand 1/LD50 (Figure 5B) were found, since in most cases,compounds with relatively large 1/TD50 or 1/LD50 valuesproduced high R including 2-AAF and BaP whereas styrene,NPYR, and 2,4-DAT with small LD50 generated low ECL.Exceptions include 2-AF, 1-NA, and 2-NA that did not generatelarge R in arrays.
Figure 3. Influence of enzyme reaction time on enzymemass-normalized ECL for spots withMLE (red (), HLE (9) with 0.2 mM arylamine substratestogether with AcCoA and an NADPH regeneration system, and control incubation (greenb for MLE, blue 2 for HLE) with only 0.2 mM arylamines.
2758 dx.doi.org/10.1021/ac200050n |Anal. Chem. 2011, 83, 2754–2760
Analytical Chemistry ARTICLE
’DISCUSSION
Results above demonstrate the value of ECL arrays featuringan expanded representative collection of metabolic oxidation and
bioconjugation enzymes for toxicity screening. As with previousversions of ECL arrays,12,13 relative DNA adduct formation ratesare provided for potentially toxic metabolites as predictors ofgenotoxicity, as demonstrated here for a collection of chemicals. Invitro toxicity screening can be done without cell cultures, andresults reflect the relative DNA damage rates by metabolitesformed. The arrays are inexpensive, utilizing only an unprocessedcarbon block, conventional electrochemical equipment, a CCDcamera, and a dark box. Enzyme reaction steps can be completed in1 min, and ECL signal development takes ∼30 s, so that thetoxicity screening of several compounds at different concentra-tions can be done rapidly compared to bioassays such as the Amestest and the Comet assay (usually 24 h or longer). Bioconjugationreactions can be turned on and off at will by including or omittingthe relevant enzyme cofactors, providing a further diagnostic toolto assess the enzyme source of reactive metabolites. While QCMstudies are required to establish amounts of protein deposited inthe spots, these experiments need not be repeated for subsequentuse of a given array featuring the same spots.
In this paper, we defined the slope of ECL increase vs enzymereaction time normalized for amounts of enzymes and substrateconcentration as a parameterR (eq 1) to facilitate comparisons oftoxicity array data to that from conventional toxicity bioassays.Qualitatively reasonable correlations were obtained inmost cases(Figures 4 and 5). Clearly, compounds such as styrene whichhave significant but relatively low toxicity by conventionalbioassays give small R-values, and chemicals with relative highlevels of toxicity in bioassays (e.g., 2-AAF and BaP) give large R-values. In addition, toluene has very high TD50 and LD50 (5390
31
and 225032), and DNA adduct formation is not detected underour array conditions, providing a good negative control.
The variations in R-values when human and rodent liverenzymes are used (Figures 4 and 5) can be explained by speciesdifferences in amounts, identities, and activities of metabolicenzymes.33,34 Measured differences could serve as importanttools to predict when toxic manifestations differ between humansand rodents. We have already demonstrated elucidation ofsuch species differences with tamoxifen using an earlier versionof ECL arrays.16
For compounds like styrene, NNK, NPYR, BaP, and 2-AAF,which involve DNA adduct formation from one-step cyt P450bioactivation,35�37 results reflect different rates of DNA damageafter enzyme activation. Regardless of rodent or human enzymesource, 2-AAF and BaP induced a large ECL increase at relativelylow concentrations (25 or 50 μM) suggested that their metabo-lites are very reactive toward DNA. Styrene is much less DNA-reactive upon activation since a notable ECL increase can only beobserved at a relatively high concentration (1 mM). Thisconcentration effect is suitably accounted for by normalizationin the R parameter.
Intermediate concentrations of NPYR and NNK (0.2 mM)were needed to produce measurable ECL increases, which arelikely to be related to two factors. First, R-hydroxylation of NNKand NPYR by cyt P450 generates active diazonium ions whichcan hydrolyze in water; as a result, a higher substrate concentra-tion is necessary to produce a detectable amount of reactivemetabolite-DNA adduct(s) in aqueous media.36,38 Second, thebulky N7-guanine adduct(s) from BaP activation39 may possiblycontribute to a larger disruption of the DNA structure comparedwith the smaller N7-guanine adducts from NPYR and NNK.36
Whether the latter factor can contribute significantly to the ECLsignal is uncertain at this time.
Figure 5. Correlation of normalized ECL array turnover rate R (μgprotein�1
3min�1
3mM�1) with (A) 1/TD50 and (B) 1/LD50 (see
Supporting Information, Table S2). Asterisk (/) denotes data frommouse; other values are for rats. n.d. = not determined.
Figure 4. Correlation of normalized ECL turnover rate R (μgprotein�1
3min�1
3mM�1) with (A) the revertants per nmol from Ames
tests, TA1538 strain, and (B) OTM/[S] values from Comet assays (seeSupporting Information, Table S2). Asterisk (/) denotes OTM datafrom mouse; other values are for rats. Neg. = negative results, n.d. = notdetermined.
2759 dx.doi.org/10.1021/ac200050n |Anal. Chem. 2011, 83, 2754–2760
Analytical Chemistry ARTICLE
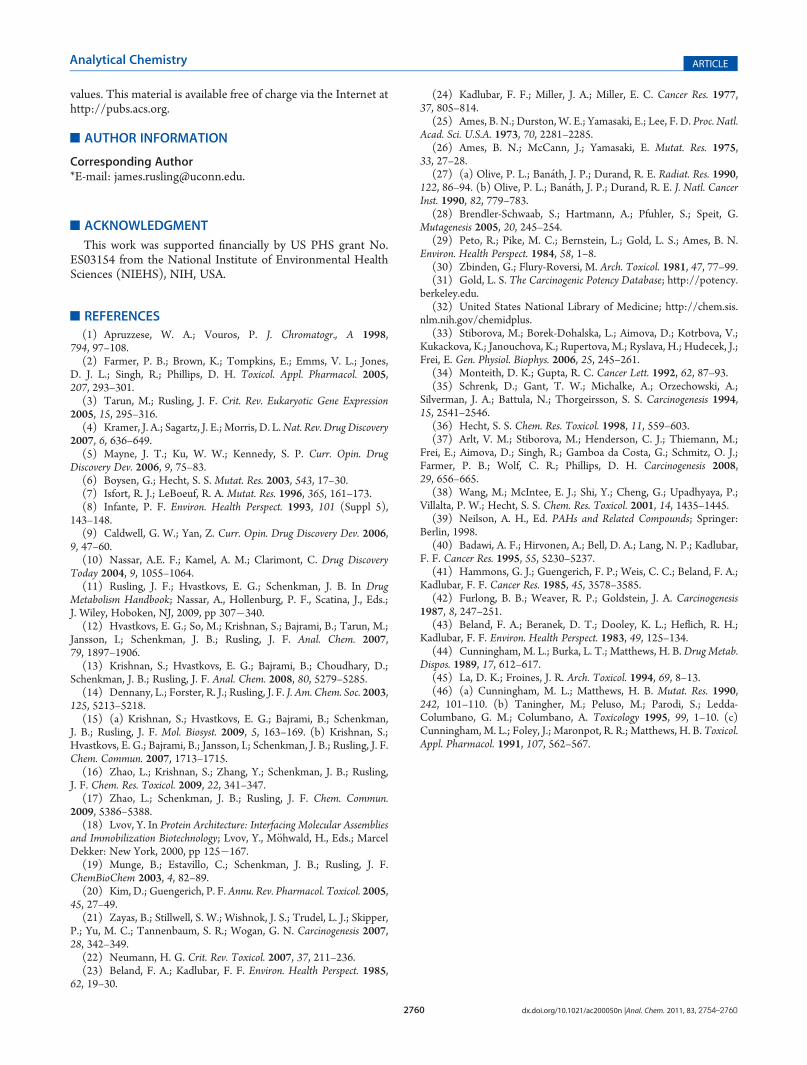
The ability of the ECL array to differentiate relative DNAreactivity for metabolites of similarly structured compounds wasdemonstrated for arylamines. Scheme 1 summarizes the majorpathway of arylamine metabolism, which involves bioactivationby cyt P450s to formN-hydroxy derivatives.24 The second step isa conjugation whereby N-acetyltransferase (NAT) converts N-hydroxy intermediates into active esters using AcCoA.40 Uponloss of�OAc, highly electrophilic arylnitrenium ions are formedthat attack guanine bases. Also, N-hydroxy arylamines can yieldarylnitrenium ions without the conjugation reaction. However,this process prefers a more acidic medium andmay be slow underneutral conditions.24
For arylamines, results with either HLE or MLE (SupportingInformation, Table S2) showed R1-NA < R2,6-DAT < R2-NA < R2,4-DAT< R2-AF < R4-ABP (k1-NA < k2,6-DAT < k2-NA < k2,4-DAT < k2-AF< k4-ABP). As theN-oxidation catalyzed by cyt P450s is an obligatorystep for subsequent formation of [aryl-NHþ], the initial slopes k inFigure 3 are associated with likelihood of oxidation at the arylaminenitrogens. Specifically, 1-NA undergoes preferred hydroxylation atthe 2 position yielding 2-OH-1-NA whereas the major metabolite of2-NA catalyzed by cyt P450s is N-OH-2-NA. Thus, a subsequentconjugation reaction for 1-NA (which is not N-hydroxylated) doesnot occur, limiting the formation of active intermediate. Specifically,the rate ofN-oxidation of 2-NAwas found to be >10-fold faster thanthat of 1-NA in a microsomal system, leading to ultimate reactivenitrenium formation,41 which partly explains the fast ECL turnoverobserved in Figure 3. 2-AF formsmainlyN-hydroxy-2-AF, but itsN-site is more electron-deficient than that in 2-NA; thus, 2-AFmetabolite is more likely to be attacked by the active enzyme radicalsgiving k2-AF ≈ 2k2-NA (Supporting Information, Table S2). Arrayresults were consistent with an earlier study inwhich theN-oxidationrate of 2-AF was about 3 times that of 2-NA using human livercyt P450 1A2.41
Another isomer pair, 2,6-DAT and 2,4-DAT, both showedgenotoxicity in the array, although 2,4-DAT had a 3-fold larger Rthan 2,6-DAT, correlated with a previous study on binding toDNA of these isomers using rat hepatocytes.42 4-ABP inducedthe largest R, indicative of the most toxic compound. Again,similar results were obtained in studies on binding affinity of fourarylamines to bladder epithelium DNA in which 4-ABP meta-bolites have the strongest reactivity to DNA followed by 2-AF,2-NA, and 1-NA.43
R-values correlated reasonably with in vitro and in vivo toxicitydata (Figure 4 and 5), demonstrating the utility of ECL arrays todifferentiate potential toxicity of compounds with or withoutsimilar structures and metabolic pathways. It should be realized,
however, that the bioassays compared to the ECL arrays aremeasuring different things; albeit, all are generally related totoxicity. Ames and Comet assays measure bacterial reversemutation or DNA damage in cells. TD50 measures chronicrodent toxicity relative to carcinogenesis, and LD50 is a crudemeasure of acute toxicity. On the other hand, the ECL arraysmeasure the rate of chemical reaction ofmetabolites withDNA ina cell-free biochemical system. The R-values reflect rates of DNAdamage under ideal, nonbiological conditions. We believe thatthe value of these methods, as well as additional ones, lies in theircombined use in a panel for human toxicity prediction.
The rough correlations between R and the other toxicitymetrics (Figures 4 and 5) need to be understood in the abovecontext. For example, lower correlation of R and Ames data mayreflect limitations of the bacteria model, metabolic differencesbetween enzymes in the two tests, and relative and specificdifferences between Ames and ECL arrays. Comet assay datapresented better correlation with R, perhaps because both assayshave DNA damage end points. Rodent 1/LD50 were less relatedto R for arylamines yet fairly well correlated for styrene, NPYR,2-AAF, and BaP. TD50 shows better correlation to ECL arraydata with rodent enzymes, as expected from similarity of activa-tion by enzymes in the ECL arrays and the rodents themselves.Most importantly, as expected, mouse 1/TD50 correlated wellwith R using mouse liver enzymes for arylamines (Figure 5A).The reason that 2,6-DAT shows small but significant R values inECL array but fails to induce liver tumors in rat models may beassociated with faster detoxification in vivo.44�46
In summary, we have presented and validated here a metabo-lically representative ECL array by testing 11 chemicals of varyingtoxicity and exploring correlations with rodent TD50 and LD50,Ames tests, and Comet assays. Species differences betweenrodents and humans can be assessed using appropriate enzymesources in the arrays. Results support the value of ECL geno-toxicity arrays in early screening of unknown chemicals or drugsto assess the possibility of metabolite reactions with DNA.Coupled with existing toxicity bioassays, ECL arrays can providemetabolite reactivity data to complement the prediction ofhuman toxicity.
’ASSOCIATED CONTENT
bS Supporting Information. Detailed experimental proce-dures and one scheme of experiment setup, a figure and a tabledescribing quartz crystal microbalance characterization, a figureof addition ECL array images, and a table with toxicity metric
Scheme 1. Major Metabolic Pathway of Arylamines Leading to DNA Adducts
2760 dx.doi.org/10.1021/ac200050n |Anal. Chem. 2011, 83, 2754–2760
Analytical Chemistry ARTICLE
values. This material is available free of charge via the Internet athttp://pubs.acs.org.
’AUTHOR INFORMATION
Corresponding Author*E-mail: [email protected].
’ACKNOWLEDGMENT
This work was supported financially by US PHS grant No.ES03154 from the National Institute of Environmental HealthSciences (NIEHS), NIH, USA.
’REFERENCES
(1) Apruzzese, W. A.; Vouros, P. J. Chromatogr., A 1998,794, 97–108.(2) Farmer, P. B.; Brown, K.; Tompkins, E.; Emms, V. L.; Jones,
D. J. L.; Singh, R.; Phillips, D. H. Toxicol. Appl. Pharmacol. 2005,207, 293–301.(3) Tarun, M.; Rusling, J. F. Crit. Rev. Eukaryotic Gene Expression
2005, 15, 295–316.(4) Kramer, J. A.; Sagartz, J. E.; Morris, D. L.Nat. Rev. Drug Discovery
2007, 6, 636–649.(5) Mayne, J. T.; Ku, W. W.; Kennedy, S. P. Curr. Opin. Drug
Discovery Dev. 2006, 9, 75–83.(6) Boysen, G.; Hecht, S. S. Mutat. Res. 2003, 543, 17–30.(7) Isfort, R. J.; LeBoeuf, R. A. Mutat. Res. 1996, 365, 161–173.(8) Infante, P. F. Environ. Health Perspect. 1993, 101 (Suppl 5),
143–148.(9) Caldwell, G. W.; Yan, Z. Curr. Opin. Drug Discovery Dev. 2006,
9, 47–60.(10) Nassar, A.E. F.; Kamel, A. M.; Clarimont, C. Drug Discovery
Today 2004, 9, 1055–1064.(11) Rusling, J. F.; Hvastkovs, E. G.; Schenkman, J. B. In Drug
Metabolism Handbook; Nassar, A., Hollenburg, P. F., Scatina, J., Eds.;J. Wiley, Hoboken, NJ, 2009, pp 307�340.(12) Hvastkovs, E. G.; So, M.; Krishnan, S.; Bajrami, B.; Tarun, M.;
Jansson, I.; Schenkman, J. B.; Rusling, J. F. Anal. Chem. 2007,79, 1897–1906.(13) Krishnan, S.; Hvastkovs, E. G.; Bajrami, B.; Choudhary, D.;
Schenkman, J. B.; Rusling, J. F. Anal. Chem. 2008, 80, 5279–5285.(14) Dennany, L.; Forster, R. J.; Rusling, J. F. J. Am. Chem. Soc. 2003,
125, 5213–5218.(15) (a) Krishnan, S.; Hvastkovs, E. G.; Bajrami, B.; Schenkman,
J. B.; Rusling, J. F. Mol. Biosyst. 2009, 5, 163–169. (b) Krishnan, S.;Hvastkovs, E. G.; Bajrami, B.; Jansson, I.; Schenkman, J. B.; Rusling, J. F.Chem. Commun. 2007, 1713–1715.(16) Zhao, L.; Krishnan, S.; Zhang, Y.; Schenkman, J. B.; Rusling,
J. F. Chem. Res. Toxicol. 2009, 22, 341–347.(17) Zhao, L.; Schenkman, J. B.; Rusling, J. F. Chem. Commun.
2009, 5386–5388.(18) Lvov, Y. In Protein Architecture: Interfacing Molecular Assemblies
and Immobilization Biotechnology; Lvov, Y., M€ohwald, H., Eds.; MarcelDekker: New York, 2000, pp 125�167.(19) Munge, B.; Estavillo, C.; Schenkman, J. B.; Rusling, J. F.
ChemBioChem 2003, 4, 82–89.(20) Kim, D.; Guengerich, P. F. Annu. Rev. Pharmacol. Toxicol. 2005,
45, 27–49.(21) Zayas, B.; Stillwell, S. W.; Wishnok, J. S.; Trudel, L. J.; Skipper,
P.; Yu, M. C.; Tannenbaum, S. R.; Wogan, G. N. Carcinogenesis 2007,28, 342–349.(22) Neumann, H. G. Crit. Rev. Toxicol. 2007, 37, 211–236.(23) Beland, F. A.; Kadlubar, F. F. Environ. Health Perspect. 1985,
62, 19–30.
(24) Kadlubar, F. F.; Miller, J. A.; Miller, E. C. Cancer Res. 1977,37, 805–814.
(25) Ames, B. N.; Durston, W. E.; Yamasaki, E.; Lee, F. D. Proc. Natl.Acad. Sci. U.S.A. 1973, 70, 2281–2285.
(26) Ames, B. N.; McCann, J.; Yamasaki, E. Mutat. Res. 1975,33, 27–28.
(27) (a) Olive, P. L.; Ban�ath, J. P.; Durand, R. E. Radiat. Res. 1990,122, 86–94. (b) Olive, P. L.; Ban�ath, J. P.; Durand, R. E. J. Natl. CancerInst. 1990, 82, 779–783.
(28) Brendler-Schwaab, S.; Hartmann, A.; Pfuhler, S.; Speit, G.Mutagenesis 2005, 20, 245–254.
(29) Peto, R.; Pike, M. C.; Bernstein, L.; Gold, L. S.; Ames, B. N.Environ. Health Perspect. 1984, 58, 1–8.
(30) Zbinden, G.; Flury-Roversi, M. Arch. Toxicol. 1981, 47, 77–99.(31) Gold, L. S. The Carcinogenic Potency Database; http://potency.
berkeley.edu.(32) United States National Library of Medicine; http://chem.sis.
nlm.nih.gov/chemidplus.(33) Stiborova, M.; Borek-Dohalska, L.; Aimova, D.; Kotrbova, V.;
Kukackova, K.; Janouchova, K.; Rupertova, M.; Ryslava, H.; Hudecek, J.;Frei, E. Gen. Physiol. Biophys. 2006, 25, 245–261.
(34) Monteith, D. K.; Gupta, R. C. Cancer Lett. 1992, 62, 87–93.(35) Schrenk, D.; Gant, T. W.; Michalke, A.; Orzechowski, A.;
Silverman, J. A.; Battula, N.; Thorgeirsson, S. S. Carcinogenesis 1994,15, 2541–2546.
(36) Hecht, S. S. Chem. Res. Toxicol. 1998, 11, 559–603.(37) Arlt, V. M.; Stiborova, M.; Henderson, C. J.; Thiemann, M.;
Frei, E.; Aimova, D.; Singh, R.; Gamboa da Costa, G.; Schmitz, O. J.;Farmer, P. B.; Wolf, C. R.; Phillips, D. H. Carcinogenesis 2008,29, 656–665.
(38) Wang, M.; McIntee, E. J.; Shi, Y.; Cheng, G.; Upadhyaya, P.;Villalta, P. W.; Hecht, S. S. Chem. Res. Toxicol. 2001, 14, 1435–1445.
(39) Neilson, A. H., Ed. PAHs and Related Compounds; Springer:Berlin, 1998.
(40) Badawi, A. F.; Hirvonen, A.; Bell, D. A.; Lang, N. P.; Kadlubar,F. F. Cancer Res. 1995, 55, 5230–5237.
(41) Hammons, G. J.; Guengerich, F. P.; Weis, C. C.; Beland, F. A.;Kadlubar, F. F. Cancer Res. 1985, 45, 3578–3585.
(42) Furlong, B. B.; Weaver, R. P.; Goldstein, J. A. Carcinogenesis1987, 8, 247–251.
(43) Beland, F. A.; Beranek, D. T.; Dooley, K. L.; Heflich, R. H.;Kadlubar, F. F. Environ. Health Perspect. 1983, 49, 125–134.
(44) Cunningham, M. L.; Burka, L. T.; Matthews, H. B. Drug Metab.Dispos. 1989, 17, 612–617.
(45) La, D. K.; Froines, J. R. Arch. Toxicol. 1994, 69, 8–13.(46) (a) Cunningham, M. L.; Matthews, H. B. Mutat. Res. 1990,
242, 101–110. (b) Taningher, M.; Peluso, M.; Parodi, S.; Ledda-Columbano, G. M.; Columbano, A. Toxicology 1995, 99, 1–10. (c)Cunningham, M. L.; Foley, J.; Maronpot, R. R.; Matthews, H. B. Toxicol.Appl. Pharmacol. 1991, 107, 562–567.
Related Documents


