Application Note Biopharma Authors Gerd Vanhoenacker, Cindy Lecluyse, Griet Debyser, Pat Sandra, and Koen Sandra RIC Biologics Belgium Sonja Schipperges, Sonja Schneider, and Udo Huber Agilent Technologies, Inc. Germany Abstract The effect of various ion pairing reagents (amines and acidic counterions) on the LC/UV and LC/MS analysis of oligonucleotides (ONs) has been studied. The type of amine and concentration of the counterion play a significant role in the retention and resolution of the ONs and strongly affect the MS data. Charge state and adduct formation are influenced by the mobile phase composition. This application note shows that there are numerous variables available for optimization of the analytical conditions for ONs. The analyses were carried out on an Agilent 1290 Infinity II LC System with UV detection by DAD and an Agilent 6530 LC/Q-TOF. Evaluation of Different Ion-Pairing Reagents for LC/UV and LC/MS Analysis of Oligonucleotides

Welcome message from author
This document is posted to help you gain knowledge. Please leave a comment to let me know what you think about it! Share it to your friends and learn new things together.
Transcript

Application Note
Biopharma
AuthorsGerd Vanhoenacker, Cindy Lecluyse, Griet Debyser, Pat Sandra, and Koen Sandra RIC Biologics Belgium
Sonja Schipperges, Sonja Schneider, and Udo Huber Agilent Technologies, Inc. Germany
AbstractThe effect of various ion pairing reagents (amines and acidic counterions) on the LC/UV and LC/MS analysis of oligonucleotides (ONs) has been studied. The type of amine and concentration of the counterion play a significant role in the retention and resolution of the ONs and strongly affect the MS data. Charge state and adduct formation are influenced by the mobile phase composition. This application note shows that there are numerous variables available for optimization of the analytical conditions for ONs. The analyses were carried out on an Agilent 1290 Infinity II LC System with UV detection by DAD and an Agilent 6530 LC/Q-TOF.
Evaluation of Different Ion-Pairing Reagents for LC/UV and LC/MS Analysis of Oligonucleotides
2
IntroductionSynthetic ONs are increasingly being developed and used for treatment of various diseases. These therapeutics are mainly short, linear polymers of nucleobases, ribose, or deoxyribose sugars (RNA or DNA, respectively), and phosphate.1,2 ONs come in different sizes and forms and are often chemically modified to alter or enhance the therapeutic effects, increase specificity towards specific targets, improve stability, delivery, uptake, etc. The wide variety of ON types has led to the generation of different classes such as small interfering RNA (siRNA), microRNA (miRNA), antisense oligonucleotides (ASO), and aptamers, among others.
ONs are generally manufactured in a multistep process where nucleotides are added one by one to extend the chain to a predefined size (i.e., number of nucleotides (n)). The synthesis can be carried out in different ways and generally involves the use of a support and protecting groups. All the steps involved in ON synthesis can potentially give rise to impurities. Commonly encountered impurities involve shortmers in which the reaction was incomplete (e.g., n-1, n-2). The yield of the target ON decreases as the number of cycles increases. Alternatively, longmers (e.g., n+1) can also be formed as well as other impurities coming from deamination or depurination, oxidation (typically guanine), and other undesirable reactions. In addition to impurities introduced from production, storage of the ON can lead to degradation products.
The analysis of ONs, such as assay of the main product, determination of the purity, and quantification and identification of impurities is a challenge due to the nature and the size of the compounds. A comprehensive review about types of synthetic ONs and
their analysis by LC has recently been published.1 ONs are by nature very polar products and carry many anionic groups (normally one phosphate group on each nucleotide). When the ON is not modified or if the impact of the chemical modification on the total polarity is modest (as is generally the case), conventional reversed-phase LC will not provide sufficient retention, and application of alternative modes is mandatory. A wide variety of LC modes such as anion exchange chromatography (AEX), hydrophilic interaction liquid chromatography (HILIC), mixed mode chromatography (MMC), ion-pairing liquid chromatography (IPLC), and size exclusion chromatography (SEC) have been applied in the characterization of ONS.1,2 In some cases, combinations of the above are used in a multidimensional setup. This can be done in a comprehensive 2D-LC3 or in a (multiple) heart-cutting 2D-LC setup.4 Depending on the required analysis (QA/QC or R&D), UV-based detectors and/or mass spectrometers are applied.
IPLC is by far the most applied LC mode for ON analysis. In IPLC, a reversed-phase stationary phase is combined with a mobile phase containing an ion pairing reagent. These reagents are generally amines that interact with the anionic ONs to form a hydrophobic pair. This pair can then be retained on the reversed-phase column where separation will occur according to the ON length, type, and presence of chemical modifications.
Proper selection of the mobile phase is of utmost importance. The mobile phase is prepared by mixing the amine ion pairing reagent with an acidic counterion in water at a well defined concentration and ratio. This combination will provide the required retention of the ONs. Elution will be promoted by using organic modifiers such as methanol
and acetonitrile, and gradient elution will deliver the best result in terms of resolving power. The result for a given sample is determined by the complex interaction of the selected stationary phase, concentration and type of mobile phase additives, column temperature, and sample properties. Not only will the chromatography be influenced by the mobile phase composition: when using LC/MS, the MS data (sensitivity, charge state, adduct ions, etc.) will be strongly affected by the mobile phase composition.
Various groups have investigated the impact of the mobile phase composition on chromatographic and mass spectrometric behavior of ONs.5-9 Significant improvement of resolution and sensitivity could be obtained by careful development of the method. However, identifying a generic single set of conditions that will perform optimally for the large family of ONs appears infeasible. For each ON, the ion pairing reagent type and concentration, counterion type and concentration, and the concentration ratio of both additives can be optimized to maximize the separation and improve MS detection.
This application note shows results obtained with various mobile phases using an Agilent AdvanceBio oligonucleotide column. Analyses were carried out on a 1290 Infinity II LC System using diode-array detection (DAD) and a 6530 LC/Q-TOF. The impact of different mobile phase combinations on chromatographic and mass spectrometric results were evaluated on a DNA and RNA ON reference sample and on a selection of therapeutic ONs. The data show that there are viable alternatives to the more conventionally used mobile phases in ON analysis. These alternatives not only perform equally well or better, but can also be run at significantly less cost.

3
Experimental
MaterialsThe following amines and acids were purchased from Sigma-Aldrich (St. Louis, MO, USA): triethylamine (TEA), n-butylamine (BA), dibutylamine (DBA), n-hexylamine (HA), triethylammonium acetate (TEAA), acetic acid (AA), and 1,1,1,3,3,3-hexafluoro-2-propanol (HFIP). Acetonitrile (HPLC-S), methanol (ULC/MS), and water (ULC/MS) were obtained from Biosolve (Valkenswaard, The Netherlands). Samples were diluted in diethylpyrocarbonate (DEPC)-treated water (Thermo Fisher Scientific, Waltham, MA, USA).
Samples – Standard mixtures:
– DNA ladder standard (part number 5190-9029)
– RNA resolution standard (part number 5190-9028)
– Samples:
– Therapeutic ONs were obtained from local biotechnology companies.
Mobile phase preparationAcetate mobile phases were equimolar solutions of acetic acid and the respective amine. To prepare 500 mL, acetic acid was added to approximately 450 mL of water and mixed. The respective amine was added and mixed and water was added to complete to 500 mL. The pH of this solution was carefully adjusted by addition of small volumes of acetic acid or the respective amine.
100 mM TEAA, pH 7 Acetic acid: 3 g Triethylamine: 5.06 g
100 mM HAA, pH 7 Acetic acid: 3 g Hexylamine: 5.06 g
100 mM DBAA, pH 7 Acetic acid: 3 g Dibutylamine: 6.46 g
HFIP mobile phases were prepared as follows. To prepare 500 mL, the defined amount of HFIP was added to approximately 400 mL of water and mixed. The respective amine was added and mixed and water was added to complete to 500 mL. These mobile phases were used without pH adjustment.
15 mM TEAA/400 mM HFIPpH 7.8 to 7.9
HFIP: 33.6 g Triethylamine: 0.759 g
15 mM TEAA/100 mM HFIPpH 8.6 to 8.7
HFIP: 8.4 g Triethylamine: 0.759 g
15 mM TEAA/25 mM HFIPpH 9.4 to 9.6
HFIP: 2.1 g Triethylamine: 0.759 g
15 mM HA/25 mM HFIPpH 9.4 to 9.6
HFIP: 2.1 g Hexylamine: 0.759 g
15 mM DBA/25 mM HFIPpH 9.4 to 9.6
HFIP: 2.1 g Dibutylamine: 0.969 g
Sample preparation – DNA ladder standard
(part number 5190-9029) was dissolved in 1 mL of DEPC water.
– RNA resolution standard (part number 5190-9028) was dissolved in 1 mL of DEPC water.
– Samples were prepared and diluted in DEPC water.
InstrumentationAn Agilent 1290 Infinity II LC System was used in combination with an Agilent 6530 LC/Q-TOF.
– Agilent 1290 Infinity II High-Speed Pump (G7120A)
– Agilent 1290 Infinity II Multisampler (G7167B) with Sample Thermostat (option 101)
– Agilent 1290 Infinity II Multicolumn Thermostat (G7116B)
– Agilent 1290 Infinity II Diode Array Detector (G7117B) with a 10 mm InfinityLab Max-Light Cartridge Cell (G4212-60008)
– Agilent 6530 LC/Q-TOF (G6530A) with Agilent Jet Stream technology ESI source
Software – For LC-DAD only
– Agilent OpenLab CDS ChemStation revision C.01.07 SR4 [505] or later versions
– For LC-DAD-MS
– Acquisition: Agilent MassHunter for instrument control (B.08.00) or later versions
– Data analysis: Agilent MassHunter Qualitative Analysis (B.07.00) or later versions
4
Results and discussion
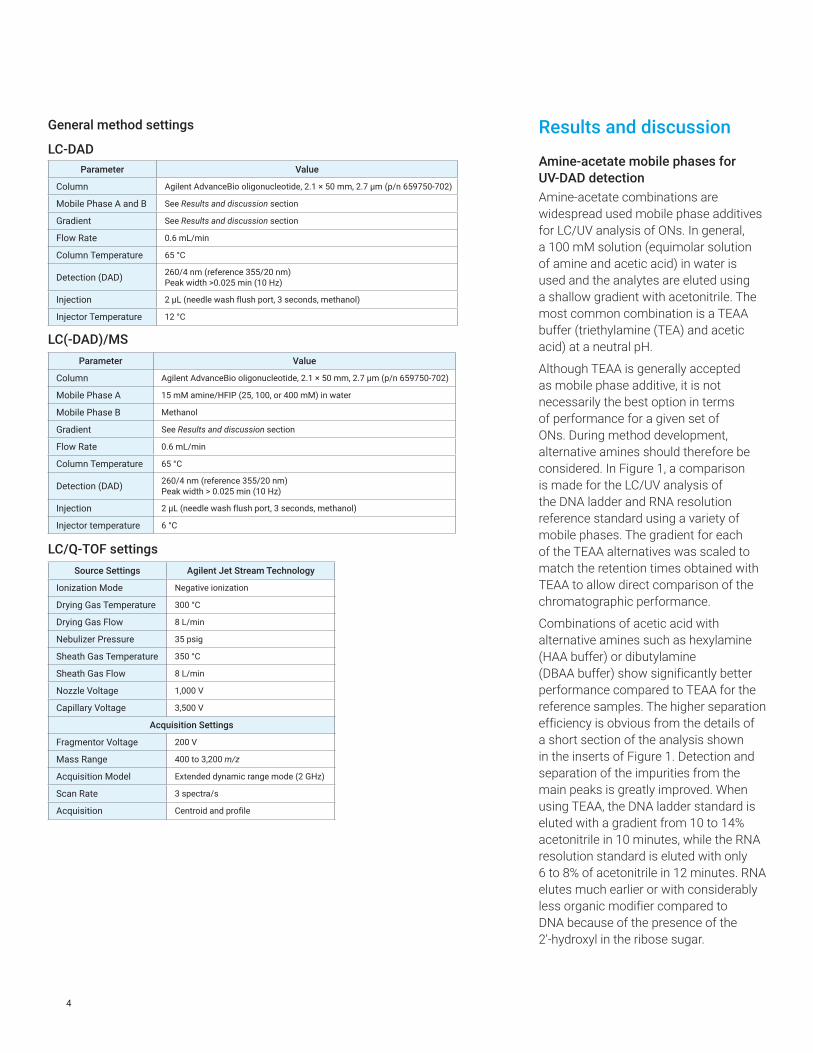
Amine-acetate mobile phases for UV-DAD detectionAmine-acetate combinations are widespread used mobile phase additives for LC/UV analysis of ONs. In general, a 100 mM solution (equimolar solution of amine and acetic acid) in water is used and the analytes are eluted using a shallow gradient with acetonitrile. The most common combination is a TEAA buffer (triethylamine (TEA) and acetic acid) at a neutral pH.
Although TEAA is generally accepted as mobile phase additive, it is not necessarily the best option in terms of performance for a given set of ONs. During method development, alternative amines should therefore be considered. In Figure 1, a comparison is made for the LC/UV analysis of the DNA ladder and RNA resolution reference standard using a variety of mobile phases. The gradient for each of the TEAA alternatives was scaled to match the retention times obtained with TEAA to allow direct comparison of the chromatographic performance.
Combinations of acetic acid with alternative amines such as hexylamine (HAA buffer) or dibutylamine (DBAA buffer) show significantly better performance compared to TEAA for the reference samples. The higher separation efficiency is obvious from the details of a short section of the analysis shown in the inserts of Figure 1. Detection and separation of the impurities from the main peaks is greatly improved. When using TEAA, the DNA ladder standard is eluted with a gradient from 10 to 14% acetonitrile in 10 minutes, while the RNA resolution standard is eluted with only 6 to 8% of acetonitrile in 12 minutes. RNA elutes much earlier or with considerably less organic modifier compared to DNA because of the presence of the 2'-hydroxyl in the ribose sugar.
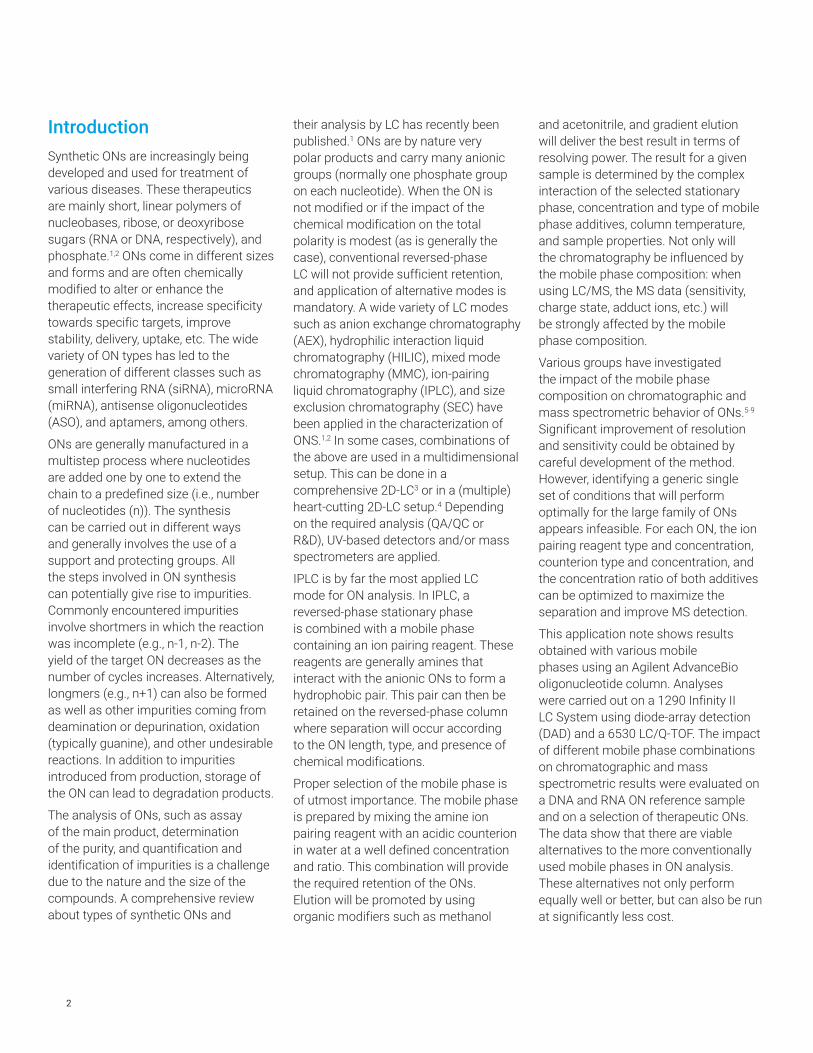
General method settings
LC-DAD
LC(-DAD)/MS
LC/Q-TOF settings
Parameter Value
Column Agilent AdvanceBio oligonucleotide, 2.1 × 50 mm, 2.7 µm (p/n 659750-702)
Mobile Phase A and B See Results and discussion section
Gradient See Results and discussion section
Flow Rate 0.6 mL/min
Column Temperature 65 °C
Detection (DAD) 260/4 nm (reference 355/20 nm) Peak width >0.025 min (10 Hz)
Injection 2 µL (needle wash flush port, 3 seconds, methanol)
Injector Temperature 12 °C
Parameter Value
Column Agilent AdvanceBio oligonucleotide, 2.1 × 50 mm, 2.7 µm (p/n 659750-702)
Mobile Phase A 15 mM amine/HFIP (25, 100, or 400 mM) in water
Mobile Phase B Methanol
Gradient See Results and discussion section
Flow Rate 0.6 mL/min
Column Temperature 65 °C
Detection (DAD) 260/4 nm (reference 355/20 nm) Peak width > 0.025 min (10 Hz)
Injection 2 µL (needle wash flush port, 3 seconds, methanol)
Injector temperature 6 °C
Source Settings Agilent Jet Stream Technology
Ionization Mode Negative ionization
Drying Gas Temperature 300 °C
Drying Gas Flow 8 L/min
Nebulizer Pressure 35 psig
Sheath Gas Temperature 350 °C
Sheath Gas Flow 8 L/min
Nozzle Voltage 1,000 V
Capillary Voltage 3,500 V
Acquisition Settings
Fragmentor Voltage 200 V
Mass Range 400 to 3,200 m/z
Acquisition Model Extended dynamic range mode (2 GHz)
Scan Rate 3 spectra/s
Acquisition Centroid and profile
5
Figure 1. LC/UV analysis at 260 nm using various mobile phase additives for IPLC. (A) DNA ladder standard; (B) RNA resolution standard. Mobile phase gradients are indicated in the figures. For other method parameters, see the Experimental section.
1 2 3 4 5 6 7 8 9
mAU
05
101520253035
1 2 3 4 5 6 7 8 9
mAU
05
101520253035
1 2 3 4 5 6 7 8 9
mAU
05
101520253035
1 2 3 4 5 6 7
mAU
05
101520253035
4.0 4.5 5.0 5.5
25mer
25mer
30mer
30mer
35mer
35mer
40mer
40mer
15mer 20mer
A = 100 mM TEAA in water, B = ACN10 to 14% B in 10 minutes
A = 100 mM HAA in water, B = ACN29 to 47% B in 10 minutes
A = 100 mM DBAA in water, B = ACN28 to 48% B in 10 minutes
A = 15 mM TEA/400 mM HFIP in water (pH 7.9), B = MeOH17 to 30% B in 10 minutes
2 4 6 8 10
mAU
05
1015202530
2 4 6 8 10
mAU
05
1015202530
2 4 6 8 10
mAU
05
1015202530
2 4 6 8
mAU
05
1015202530
5.0 5.5 6.0 6.5 7.0 7.5 8.0
A = 100 mM TEAA in water, B = ACN6 to 8% B in 12 minutes
A = 100 mM HAA in water, B = ACN26 to 36% B in 12 minutes
A = 100 mM DBAA in water, B = ACN24 to 34% B in 12 minutes
A = 15 mM TEA/400 mM HFIP in water (pH 7.9), B = MeOH10 to 20% B in 12 minutes
14mer 17mer
17mer
20mer
21mer
20mer21mer
Time (min)
Time (min)
A
B
6
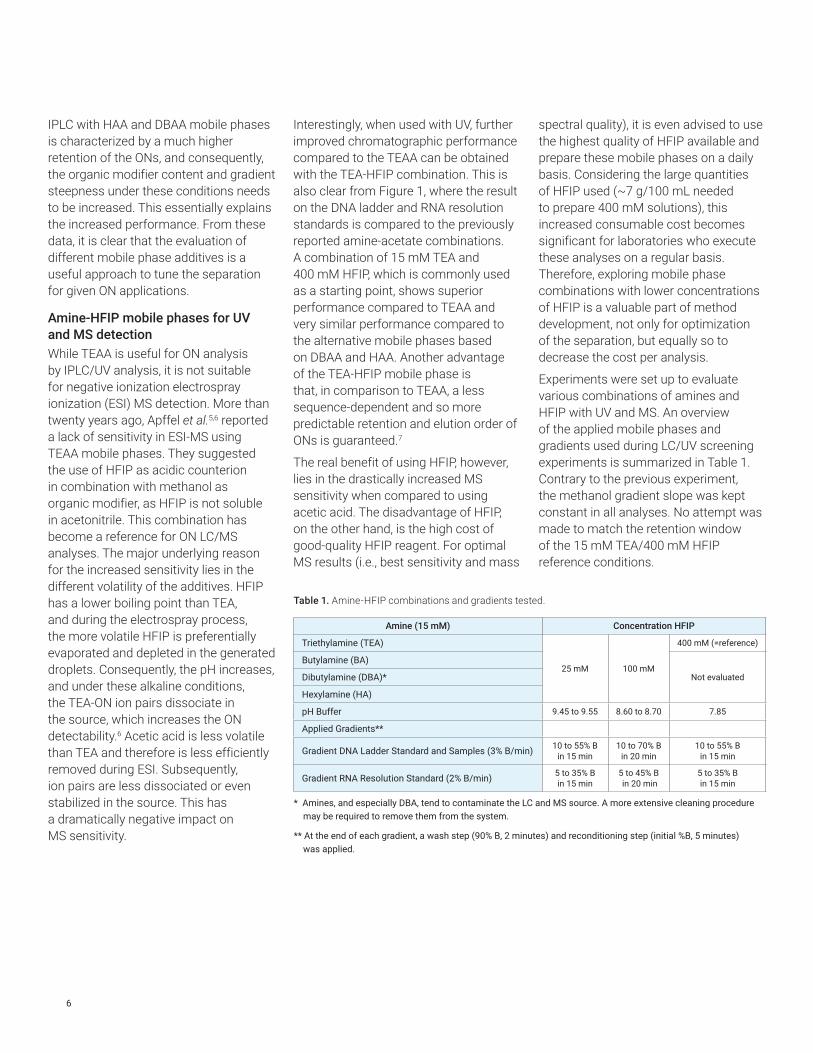
IPLC with HAA and DBAA mobile phases is characterized by a much higher retention of the ONs, and consequently, the organic modifier content and gradient steepness under these conditions needs to be increased. This essentially explains the increased performance. From these data, it is clear that the evaluation of different mobile phase additives is a useful approach to tune the separation for given ON applications.
Amine-HFIP mobile phases for UV and MS detectionWhile TEAA is useful for ON analysis by IPLC/UV analysis, it is not suitable for negative ionization electrospray ionization (ESI) MS detection. More than twenty years ago, Apffel et al.5,6 reported a lack of sensitivity in ESI-MS using TEAA mobile phases. They suggested the use of HFIP as acidic counterion in combination with methanol as organic modifier, as HFIP is not soluble in acetonitrile. This combination has become a reference for ON LC/MS analyses. The major underlying reason for the increased sensitivity lies in the different volatility of the additives. HFIP has a lower boiling point than TEA, and during the electrospray process, the more volatile HFIP is preferentially evaporated and depleted in the generated droplets. Consequently, the pH increases, and under these alkaline conditions, the TEA-ON ion pairs dissociate in the source, which increases the ON detectability.6 Acetic acid is less volatile than TEA and therefore is less efficiently removed during ESI. Subsequently, ion pairs are less dissociated or even stabilized in the source. This has a dramatically negative impact on MS sensitivity.
Interestingly, when used with UV, further improved chromatographic performance compared to the TEAA can be obtained with the TEA-HFIP combination. This is also clear from Figure 1, where the result on the DNA ladder and RNA resolution standards is compared to the previously reported amine-acetate combinations. A combination of 15 mM TEA and 400 mM HFIP, which is commonly used as a starting point, shows superior performance compared to TEAA and very similar performance compared to the alternative mobile phases based on DBAA and HAA. Another advantage of the TEA-HFIP mobile phase is that, in comparison to TEAA, a less sequence-dependent and so more predictable retention and elution order of ONs is guaranteed.7
The real benefit of using HFIP, however, lies in the drastically increased MS sensitivity when compared to using acetic acid. The disadvantage of HFIP, on the other hand, is the high cost of good-quality HFIP reagent. For optimal MS results (i.e., best sensitivity and mass
spectral quality), it is even advised to use the highest quality of HFIP available and prepare these mobile phases on a daily basis. Considering the large quantities of HFIP used (~7 g/100 mL needed to prepare 400 mM solutions), this increased consumable cost becomes significant for laboratories who execute these analyses on a regular basis. Therefore, exploring mobile phase combinations with lower concentrations of HFIP is a valuable part of method development, not only for optimization of the separation, but equally so to decrease the cost per analysis.
Experiments were set up to evaluate various combinations of amines and HFIP with UV and MS. An overview of the applied mobile phases and gradients used during LC/UV screening experiments is summarized in Table 1. Contrary to the previous experiment, the methanol gradient slope was kept constant in all analyses. No attempt was made to match the retention window of the 15 mM TEA/400 mM HFIP reference conditions.
Table 1. Amine-HFIP combinations and gradients tested.
Amine (15 mM) Concentration HFIP
Triethylamine (TEA)
25 mM 100 mM
400 mM (=reference)
Butylamine (BA)
Not evaluatedDibutylamine (DBA)*
Hexylamine (HA)
pH Buffer 9.45 to 9.55 8.60 to 8.70 7.85
Applied Gradients**
Gradient DNA Ladder Standard and Samples (3% B/min) 10 to 55% B in 15 min
10 to 70% B in 20 min
10 to 55% B in 15 min
Gradient RNA Resolution Standard (2% B/min) 5 to 35% B in 15 min
5 to 45% B in 20 min
5 to 35% B in 15 min
* Amines, and especially DBA, tend to contaminate the LC and MS source. A more extensive cleaning procedure may be required to remove them from the system.
** At the end of each gradient, a wash step (90% B, 2 minutes) and reconditioning step (initial %B, 5 minutes) was applied.
7
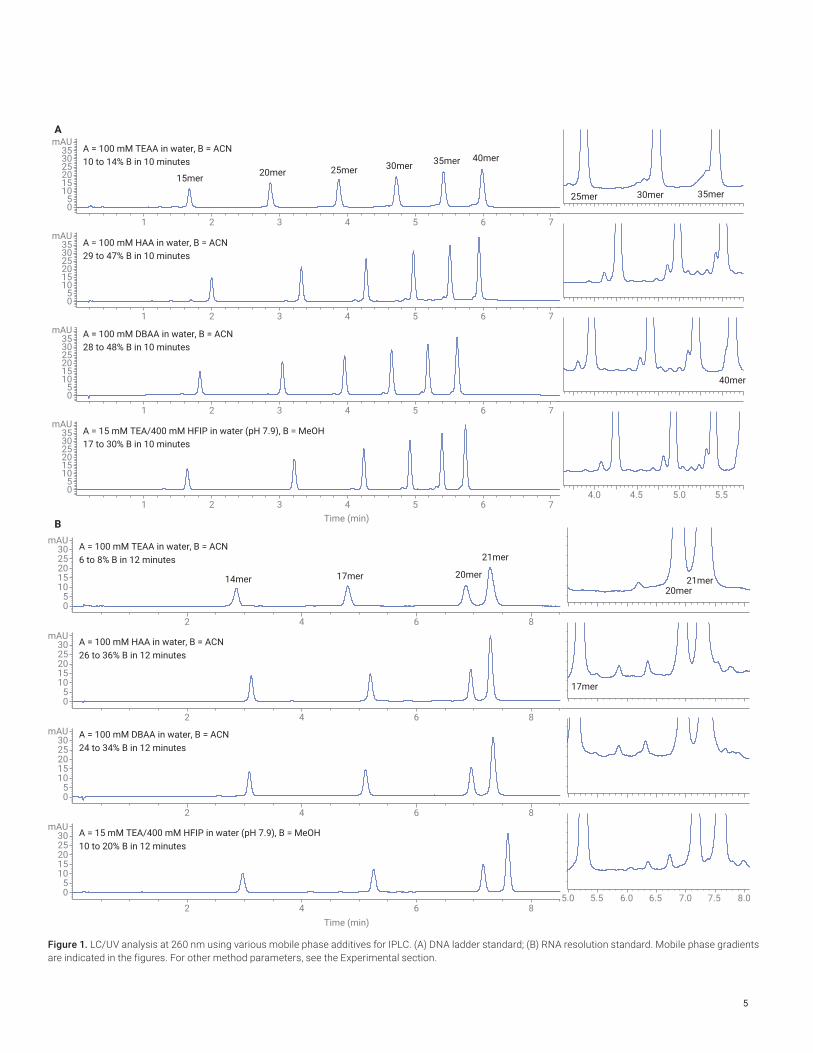
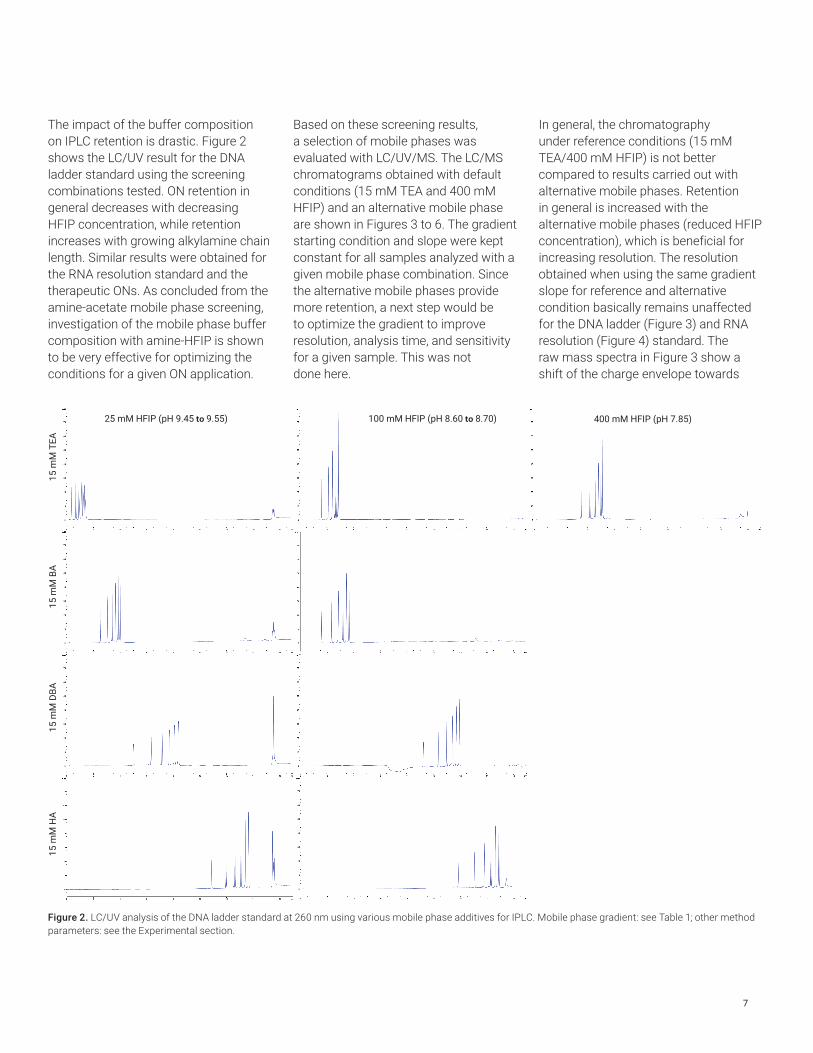
The impact of the buffer composition on IPLC retention is drastic. Figure 2 shows the LC/UV result for the DNA ladder standard using the screening combinations tested. ON retention in general decreases with decreasing HFIP concentration, while retention increases with growing alkylamine chain length. Similar results were obtained for the RNA resolution standard and the therapeutic ONs. As concluded from the amine-acetate mobile phase screening, investigation of the mobile phase buffer composition with amine-HFIP is shown to be very effective for optimizing the conditions for a given ON application.
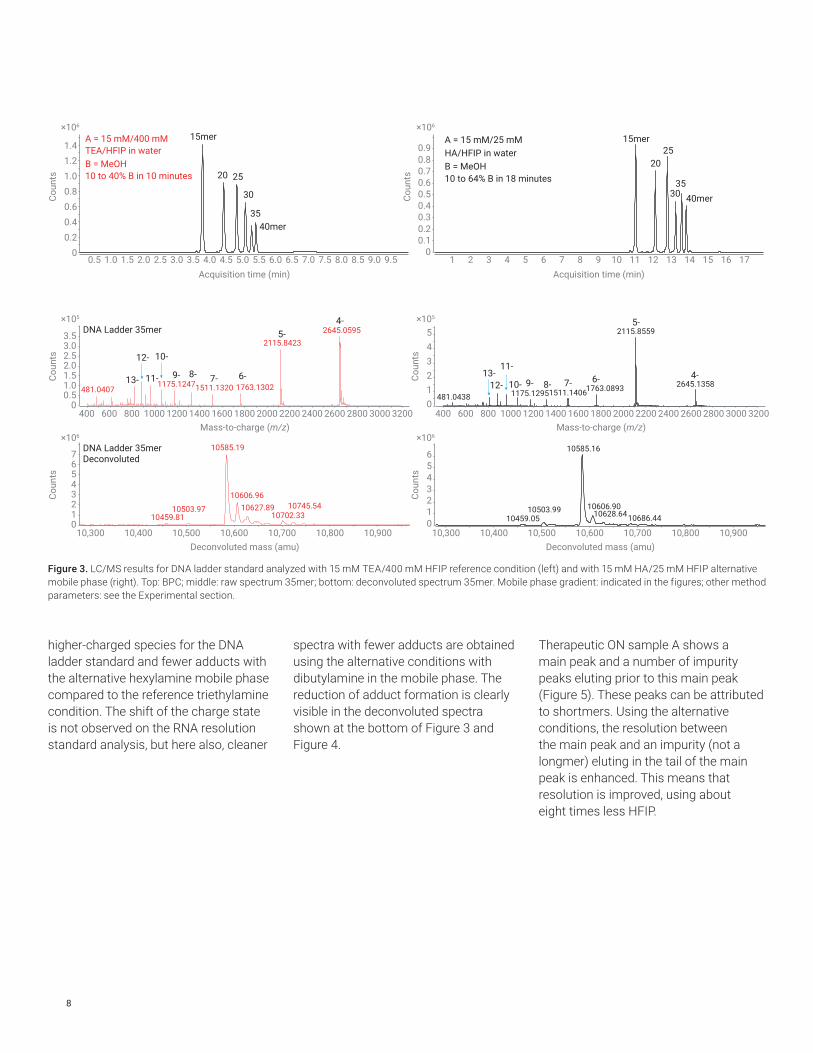
Based on these screening results, a selection of mobile phases was evaluated with LC/UV/MS. The LC/MS chromatograms obtained with default conditions (15 mM TEA and 400 mM HFIP) and an alternative mobile phase are shown in Figures 3 to 6. The gradient starting condition and slope were kept constant for all samples analyzed with a given mobile phase combination. Since the alternative mobile phases provide more retention, a next step would be to optimize the gradient to improve resolution, analysis time, and sensitivity for a given sample. This was not done here.
In general, the chromatography under reference conditions (15 mM TEA/400 mM HFIP) is not better compared to results carried out with alternative mobile phases. Retention in general is increased with the alternative mobile phases (reduced HFIP concentration), which is beneficial for increasing resolution. The resolution obtained when using the same gradient slope for reference and alternative condition basically remains unaffected for the DNA ladder (Figure 3) and RNA resolution (Figure 4) standard. The raw mass spectra in Figure 3 show a shift of the charge envelope towards
Figure 2. LC/UV analysis of the DNA ladder standard at 260 nm using various mobile phase additives for IPLC. Mobile phase gradient: see Table 1; other method parameters: see the Experimental section.
25 mM HFIP (pH 9.45 to 9.55) 400 mM HFIP (pH 7.85)100 mM HFIP (pH 8.60 to 8.70)
15 m
M T
EA15
mM
BA
15 m
M D
BA15
mM
HA
8
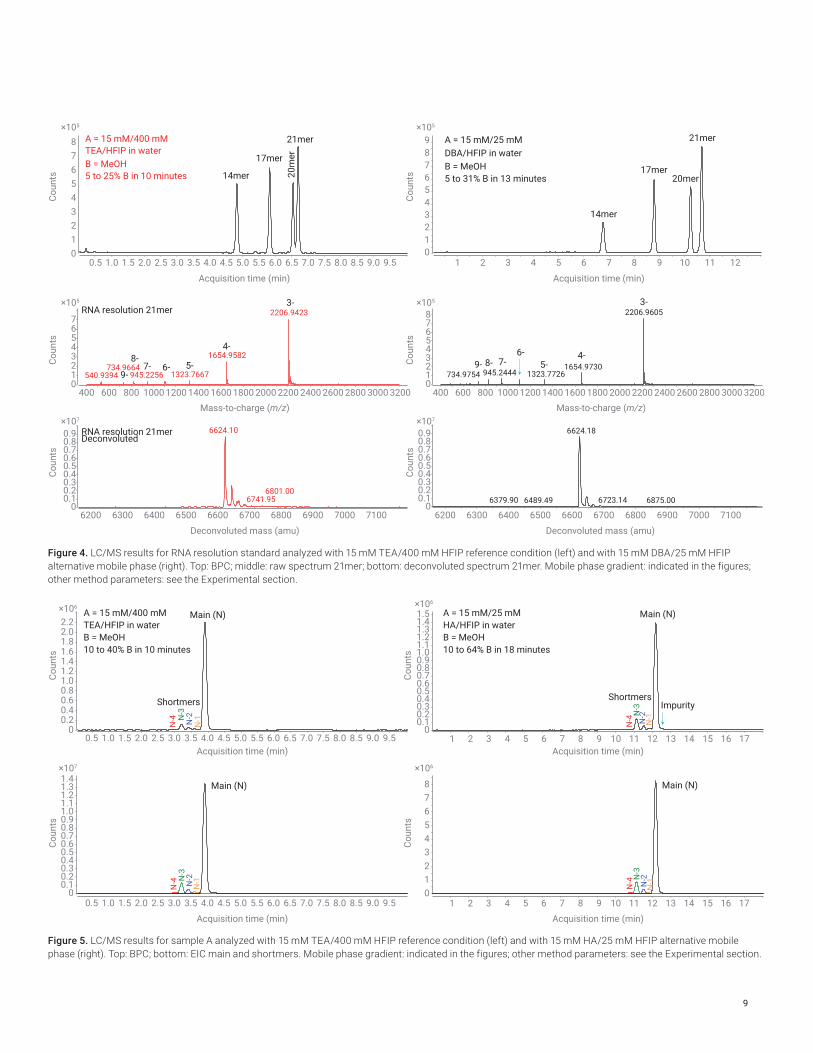
higher-charged species for the DNA ladder standard and fewer adducts with the alternative hexylamine mobile phase compared to the reference triethylamine condition. The shift of the charge state is not observed on the RNA resolution standard analysis, but here also, cleaner
spectra with fewer adducts are obtained using the alternative conditions with dibutylamine in the mobile phase. The reduction of adduct formation is clearly visible in the deconvoluted spectra shown at the bottom of Figure 3 and Figure 4.
Therapeutic ON sample A shows a main peak and a number of impurity peaks eluting prior to this main peak (Figure 5). These peaks can be attributed to shortmers. Using the alternative conditions, the resolution between the main peak and an impurity (not a longmer) eluting in the tail of the main peak is enhanced. This means that resolution is improved, using about eight times less HFIP.
Figure 3. LC/MS results for DNA ladder standard analyzed with 15 mM TEA/400 mM HFIP reference condition (left) and with 15 mM HA/25 mM HFIP alternative mobile phase (right). Top: BPC; middle: raw spectrum 35mer; bottom: deconvoluted spectrum 35mer. Mobile phase gradient: indicated in the figures; other method parameters: see the Experimental section.
00.20.40.60.81.01.21.4
0.5 1.0 1.5 2.0 2.5 3.0 3.5 4.0 4.5 5.0 5.5 6.0 6.5 7.0 7.5 8.0 8.5 9.0 9.50
0.10.20.30.40.50.60.70.80.9
1 2 3 4 5 6 7 8 9 10 11 12 13 14 15 16 17
00.51.01.52.02.53.03.5 2645.0595
2115.8423
1175.1247 1763.13021511.1320481.0407
400 600 800 1000 1200 1400 1600 1800 2000 2200 2400 2600 2800 3000 3200
01234567
10585.19
10606.9610627.89
10702.3310503.97 10745.54
10459.81
10,300 10,400 10,500 10,600 10,700 10,800 10,900
4-
6-7-8-9-
5-
10-
11-
12-
13-
DNA Ladder 35mer
DNA Ladder 35merDeconvoluted
012345 2115.8559
2645.13581763.08931511.14061175.1295481.0438
0123456 10585.16
10606.9010628.6410503.99
10686.4410459.05
4-6-7-8-9-
5-
10-
11-
12-13-
×106 ×106
×106 ×106
×105 ×105
Acquisition time (min)
Coun
ts
Acquisition time (min)
Coun
ts
Coun
ts
Coun
ts
Coun
ts
Coun
ts
A = 15 mM/400 mM TEA/HFIP in waterB = MeOH10 to 40% B in 10 minutes
40mer
15mer A = 15 mM/25 mM HA/HFIP in waterB = MeOH10 to 64% B in 18 minutes20 25
30
3540mer
15mer
2025
3035
Mass-to-charge (m/z)400 600 800 1000 1200 1400 1600 1800 2000 2200 2400 2600 2800 3000 3200
Mass-to-charge (m/z)
Deconvoluted mass (amu)10,300 10,400 10,500 10,600 10,700 10,800 10,900
Deconvoluted mass (amu)
9
Figure 4. LC/MS results for RNA resolution standard analyzed with 15 mM TEA/400 mM HFIP reference condition (left) and with 15 mM DBA/25 mM HFIP alternative mobile phase (right). Top: BPC; middle: raw spectrum 21mer; bottom: deconvoluted spectrum 21mer. Mobile phase gradient: indicated in the figures; other method parameters: see the Experimental section.
×105 ×105
×107 ×107
×105 ×105
Acquisition time (min)
Coun
ts
Acquisition time (min)
Coun
ts
Coun
ts
Coun
ts
Coun
ts
Coun
ts
A = 15 mM/400 mM TEA/HFIP in waterB = MeOH5 to 25% B in 10 minutes
A = 15 mM/25 mM DBA/HFIP in waterB = MeOH5 to 31% B in 13 minutes
Mass-to-charge (m/z) Mass-to-charge (m/z)
Deconvoluted mass (amu) Deconvoluted mass (amu)
012345678
0.5 1.0 1.5 2.0 2.5 3.0 3.5 4.0 4.5 5.0 5.5 6.0 6.5 7.0 7.5 8.0 8.5 9.0 9.50123456789
1 2 3 4 5 6 7 8 9 10 11 12
01234567
2206.9423
1654.9582
1323.7667945.2256540.9394734.9664
400 600 800 1000 1200 1400 1600 1800 2000 2200 2400 2600 2800 3000 3200 400 600 800 1000 1200 1400 1600 1800 2000 2200 2400 2600 2800 3000 3200
00.10.20.30.40.50.60.70.80.9 6624.10
6741.956801.00
6200 6300 6400 6500 6600 6700 6800 6900 7000 7100 6200 6300 6400 6500 6600 6700 6800 6900 7000 7100
RNA resolution 21mer
RNA resolution 21merDeconvoluted
012345678 2206.9605
1654.9730945.2444 1323.7726734.9754
00.10.20.30.40.50.60.70.80.9 6624.18
6723.146379.90 6489.49 6875.00
14mer
17mer
20m
er
21mer
14mer
17mer20mer
21mer
9-
8-7- 6- 5-
4-
3-
9- 8- 7-6-
5-4-
3-
00.20.40.60.81.01.21.41.61.82.02.2
00.10.20.30.40.50.60.70.80.91.01.11.21.31.41.5
1 2 3 4 5 6 7 8 9 10 11 12 13 14 15 16 17
00.10.20.30.40.50.60.70.80.91.01.11.21.31.4
0.5 1.0 1.5 2.0 2.5 3.0 3.5 4.0 4.5 5.0 5.5 6.0 6.5 7.0 7.5 8.0 8.5 9.0 9.5
0.5 1.0 1.5 2.0 2.5 3.0 3.5 4.0 4.5 5.0 5.5 6.0 6.5 7.0 7.5 8.0 8.5 9.0 9.5
012345678
1 2 3 4 5 6 7 8 9 10 11 12 13 14 15 16 17
×106
×107
×106
×106
Acquisition time (min)
Coun
ts
Acquisition time (min)
Coun
ts
Acquisition time (min)
Coun
ts
Acquisition time (min)
Coun
ts
A = 15 mM/400 mM TEA/HFIP in waterB = MeOH10 to 40% B in 10 minutes
A = 15 mM/25 mM HA/HFIP in waterB = MeOH10 to 64% B in 18 minutes
Main (N) Main (N)
ImpurityShortmers
N-4 N
-3N
-2N
-1
N-4 N
-3N
-2N
-1
N-4 N
-3N
-2N
-1
Shortmers
N-4
N-3
N-2
N-1
Main (N) Main (N)
Figure 5. LC/MS results for sample A analyzed with 15 mM TEA/400 mM HFIP reference condition (left) and with 15 mM HA/25 mM HFIP alternative mobile phase (right). Top: BPC; bottom: EIC main and shortmers. Mobile phase gradient: indicated in the figures; other method parameters: see the Experimental section.

10
The LC/MS data for therapeutic ON sample B, which is a mixture of two double-stranded siRNA therapeutics (13.5 to 15.0 kDa, 0.5 µM) comprised of pharmacological active 21mer and 22mer antisense strands (as) and modified 21mer and 22mer sense strands (ss), is presented in Figure 6. Note that under the operational conditions of 65 °C, the double strands melt, giving rise to single-stranded (as)RNA and (ss)RNA. Compared to the default conditions (15 mM TEA and 400 mM HFIP), retention is increased using the alternative mobile phase (15 mM HA and 25 mM HFIP) and resolution between the 21mer and 22mer (ss)RNA is significantly
enhanced. Note that the 21 and 22mer (ss)RNA are differentially modified with a ligand to achieve cellular uptake. These chromatographic observations once more demonstrate that the mobile phase and gradient conditions can and should be optimized for any given type of ON sample depending on its nature, complexity, and the goal of the analysis. As previously observed for the DNA ladder standard, the raw mass spectra show a shift of the charge envelope towards higher-charged species with the alternative conditions and fewer adducts.
The MS results show that next to the benefit of lower HFIP consumption, the alternative mobile phases in general provide better quality MS results. In
particular, the formation of adducts is significantly reduced compared to the TEA-HFIP reference conditions. Adduct formation is a well-known phenomenon in IPLC/MS analyses of ONs because of the affinity of the phosphodiester in the ON backbone for salts present in the flow path. The amount of adducts (mainly sodium and potassium) is influenced by several factors. The quality of the mobile phase and especially HFIP has a major impact on the presence or absence of the adducts. For this reason, it is advised to use freshly prepared mobile phases and the highest-quality HFIP available. The HFIP used in this work was of ≥99% purity. Higher purity is available, but the cost increases accordingly
Figure 6. LC/MS results for sample B analyzed with 15 mM TEA/400 mM HFIP reference condition (left) and with 15 mM HA/25 mM HFIP alternative mobile phase (right). Top: BPC; middle: raw spectra (as) RNA 21mer and 22mer; bottom: deconvoluted spectra (as) RNA 21mer and 22mer. Mobile phase gradient: indicated in the figures; other method parameters: see the Experimental section.
×105 ×105
×106
×106
×102
×102
×104
×104
×104
×104
Acquisition time (min)
Coun
ts
Acquisition time (min)
Coun
ts
Coun
tsCo
unts
Coun
tsCo
unts
Coun
tsCo
unts
Coun
tsCo
unts
Mass-to-charge (m/z) Mass-to-charge (m/z)
Deconvoluted mass (amu) Deconvoluted mass (amu)
0123456789
0.5 1.0 1.5 2.0 2.5 3.0 3.5 4.0 4.5 5.0 5.5 6.0 6.5 7.0 7.5 8.0 8.5 9.0 9.50
1
2
3
4
5
6
1 2 3 4 5 6 7 8 9 10 11 12 13 14 15 16 17
00.51.0
6605.78
6723.00
00.51.0 6958.38
7075.72
6400 6500 6600 6700 6800 6900 7000 7100 7200
04
2200.9474
1650.4572730.92421319.9352
1099.9838942.6884
0
42318.3066
1738.4762
723.9076 1390.47771158.6432868.7304
992.9556
700 900 1100 1300 1500 1700 1900 2100 2300 2500 700 900 1100 1300 1500 1700 1900 2100 2300 2500
(as) RNA 21mer
(as) RNA 22mer
(as) RNA 21merDeconvoluted
(as) RNA 22merDeconvoluted
00.51.0 6606.12
6707.00 7153.846958.51
00.51.0 6958.37
7059.407154.006350 6450 6550 6650 6750 6850 6950 7050 7150 7250
024
1650.46752200.9599
1319.9799942.6836
1099.9490 1787.4961
0246
1738.4849
2318.31541390.47271158.6213868.7449
992.9693
(as) RNA
21mer22mer
(ss) RNA
21mer 22mer
(as) RNA
21mer22mer (ss) RNA
21mer
22merA = 15 mM/400 mM TEA/HFIP in waterB = MeOH10 to 40% B in 10 minutes
A = 15 mM/25 mM HA/HFIP in waterB = MeOH10 to 64% B in 18 minutes
8-
8-
7-
7-
6-
6-
5-
5-
4-
4-
3-
8-
7-6- 5-
4-3-
8-
7-
6- 5-
4-
3-
3-
11
(i.e., approximately five times). Mobile phase bottles and LC system and capillaries should all be as clean as possible. Preconditioning or cleaning of the LC system may be required to enhance the quality of the MS spectra and reduce the amount of adducts.
ConclusionResults have shown that for the analysis of various ONs, mobile phase selection plays an important role in both chromatographic and mass spectrometric behavior. Classic mobile phase compositions have proven their value for general ON analyses, but it has been demonstrated that the mobile phase composition can be optimized for a given sample. Acetic acid-based mobile phases, generally used for LC/UV, are mainly based on combinations of triethylamine and acetic acid. The data in this application note have shown that the use of alternative amines such as hexylamine and dibutylamine are often better choices to improve chromatographic quality. For LC/MS work, HFIP-based mobile phases are preferred because of the increased sensitivity. Here again, the selection of the amine type and the concentration of the HFIP will greatly influence the result. An additional benefit of reducing the concentration of the expensive HFIP in the mobile phase is the lower cost of analysis when ONs are analyzed on a routine basis.
References1. Goyon, A.; Yehl, P.; Zhang, K.
Characterization of Therapeutic Oligonucleotides by Liquid Chromatography. J. Pharm. Biomed. Anal. 2020, 182, 113105.
2. Vanhinsbergh, C. J. Analytical Separation Methods for Therapeutic Oligonucleotides. LC-GC, Chromatography Online, Advances in Biopharmaceutical Analysis (Special Issue) 2020, 33(10), 20–26.
3. Li, Q. et al. Comprehensive Hydrophilic Interaction and Ion-Pair Reversed-Phase Liquid Chromatography for Analysis of Di- to Deca-Oligonucleotides. J. Chromatogr. A 2012, 1255, 237–243.
4. Krieger, S.; Dickhut, C. Direct Analysis of In-Process Oligonucleotides Without Manual Purification. Agilent Technologies application note, publication number 5991-9490EN, 2018.
5. Apffel, A. et al. Analysis of Oligonucleotides by HPLC-Electrospray Ionization Mass Spectrometry. Anal. Chem. 1997, 69, 1320–1325.
6. Apffel, A. et al. New Procedure for the Use of High-Performance Liquid Chromatography-Electrospray Ionization Mass Spectrometry for the Analysis of Nucleotides and Oligonucleotides. J. Chromatogr. A 1997, 777, 3–21.
7. Gilar, M. et al. Ion-Pair Reversed-Phase High-Performance Liquid Chromatography Analysis of Oligonucleotides: Retention Prediction. J. Chromatogr. A 2002, 958(1–2), 167–182.
8. McGinnis, A. C.; Grubb, E. C.; Bartlett, M. G. Systematic Optimization of Ion‐Pairing Agents and Hexafluoroisopropanol for Enhanced Electrospray Ionization Mass Spectrometry of Oligonucleotides. Rapid Commun. Mass Spectrom. 2013, 27(23), 2655–2664.
9. Gong, L.; McCullagh, J. S. O. Comparing Ion‐Pairing Reagents and Sample Dissolution Solvents for Ion‐Pairing Reversed‐Phase Liquid Chromatography/Electrospray Ionization Mass Spectrometry Analysis of Oligonucleotides. Rapid Commun. Mass Spectrom. 2014, 28(4), 339–350.

www.agilent.com/chem
DE44180.3438773148
This information is subject to change without notice.
© Agilent Technologies, Inc. 2021 Printed in the USA, January 4, 2021 5994-2957EN
Related Documents