Evaluation of deep learning software tool for CT based lung nodule growth assessment Poster No.: C-3685 Congress: ECR 2019 Type: Scientific Exhibit Authors: J. Murchison, G. Ritchie, D. Senyszak, E. J. R. Van Beek ; Edinburgh/UK Keywords: Artificial Intelligence, Lung, Oncology, CT, CAD, CT-Quantitative, Computer Applications-Detection, diagnosis, Segmentation, Cancer DOI: 10.26044/ecr2019/C-3685 Any information contained in this pdf file is automatically generated from digital material submitted to EPOS by third parties in the form of scientific presentations. References to any names, marks, products, or services of third parties or hypertext links to third- party sites or information are provided solely as a convenience to you and do not in any way constitute or imply ECR's endorsement, sponsorship or recommendation of the third party, information, product or service. ECR is not responsible for the content of these pages and does not make any representations regarding the content or accuracy of material in this file. As per copyright regulations, any unauthorised use of the material or parts thereof as well as commercial reproduction or multiple distribution by any traditional or electronically based reproduction/publication method ist strictly prohibited. You agree to defend, indemnify, and hold ECR harmless from and against any and all claims, damages, costs, and expenses, including attorneys' fees, arising from or related to your use of these pages. Please note: Links to movies, ppt slideshows and any other multimedia files are not available in the pdf version of presentations. www.myESR.org Page 1 of 15

Welcome message from author
This document is posted to help you gain knowledge. Please leave a comment to let me know what you think about it! Share it to your friends and learn new things together.
Transcript

Evaluation of deep learning software tool for CT based lungnodule growth assessment
Poster No.: C-3685
Congress: ECR 2019
Type: Scientific Exhibit
Authors: J. Murchison, G. Ritchie, D. Senyszak, E. J. R. Van Beek;Edinburgh/UK
Keywords: Artificial Intelligence, Lung, Oncology, CT, CAD, CT-Quantitative,Computer Applications-Detection, diagnosis, Segmentation,Cancer
DOI: 10.26044/ecr2019/C-3685
Any information contained in this pdf file is automatically generated from digital materialsubmitted to EPOS by third parties in the form of scientific presentations. Referencesto any names, marks, products, or services of third parties or hypertext links to third-party sites or information are provided solely as a convenience to you and do not inany way constitute or imply ECR's endorsement, sponsorship or recommendation of thethird party, information, product or service. ECR is not responsible for the content ofthese pages and does not make any representations regarding the content or accuracyof material in this file.As per copyright regulations, any unauthorised use of the material or parts thereof aswell as commercial reproduction or multiple distribution by any traditional or electronicallybased reproduction/publication method ist strictly prohibited.You agree to defend, indemnify, and hold ECR harmless from and against any and allclaims, damages, costs, and expenses, including attorneys' fees, arising from or relatedto your use of these pages.Please note: Links to movies, ppt slideshows and any other multimedia files are notavailable in the pdf version of presentations.www.myESR.org
Page 1 of 15

Aims and objectives
Despite lung cancer preventive strategies, lung cancer remains the third highest causeof cancers worldwide [1] with a rising incidence of the disease still being reported [2]. Inaddition, lung cancer is the commonest cause of cancer related deaths [3] accountingfor around 1.7 million deaths globally each year. This high mortality rate is at least inpart due to the fact that lung cancer is often diagnosed at an advanced stage of disease.The results of the National Lung Screening Trial (NLST) showed that early detectionof lung cancer is possible using low-dose CT in a high-risk population and that this isassociated with a decrease in both lung cancer related and overall mortality. This hasled to the approval of lung cancer screening in the USA [4]. The benefits of lung cancerscreening and early detection of lung cancer are also supported by the findings of theBenelux NELSON trial.
Lung cancer is ideally diagnosed by histopathological confirmation on a tissue sample.However, the diagnostic process usually begins with detection of pulmonary nodulesor masses, usually through medical imaging. Pulmonary nodules are very commonand most are benign, however benign and malignant nodules can have identicalappearances, so all should be flagged up as potential cancers. The biggest challengeswhen it comes to pulmonary nodule detection on CT are acceptable sensitivity levelsand reading times. The importance of high sensitivity for pulmonary nodule detection isunderscored by the fact that many failures in lung cancer diagnosis are due to errors ofdetection rather than interpretation [5,6]. Over the last two decades a substantial numberof studies [7,8,9] have evaluated the performance of (sub-specialist) radiologists for thespecific task of detecting pulmonary nodules and have shown that there is room forimprovement.
In addition, pulmonary nodule guidelines recommend the use of different cut-off levels fornodule size and/or volume and volume doubling time as metrics to assess nodule sizeand growth [10-16]. Most recently, there seems to be consensus that semi-automatedvolume assessment gives the most robust assessment for lung nodules and is mosthelpful for determining growth during follow up. [14-16] Apart from the measurement ofsize and/or volume, another important parameter to consider is the makeup of pulmonarynodules (solid vs sub-solid), as their malignant potential is significantly different. [17] Inspite of both these size/volume and composition management guidelines, many hospitalscurrently do not have the the tools to perform these measurements in a timely andaccurate manner, both due to a lack of software and due to a lack of suitably trainedradiologists. Therefore, software aided detection and classification of lung nodules wouldbe a welcome addition to the radiologist's diagnostic arsenal and could facilitate the roll-out of CT lung cancer screening as has been advocated [18].
Page 2 of 15

The objective of this study was to evaluate the clinical performance of a Deep Learningcomputer assisted diagnosis system (CAD) for growth assessment of lung nodules onCT Chest.
Page 3 of 15
Methods and materials
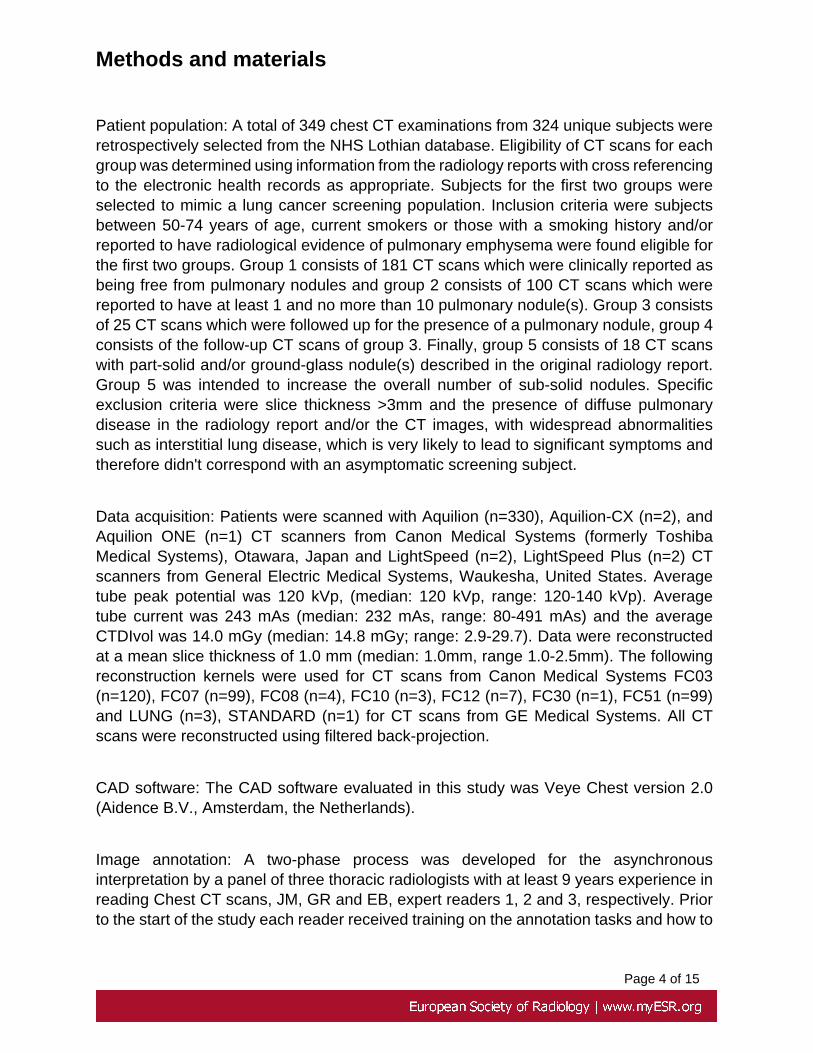
Patient population: A total of 349 chest CT examinations from 324 unique subjects wereretrospectively selected from the NHS Lothian database. Eligibility of CT scans for eachgroup was determined using information from the radiology reports with cross referencingto the electronic health records as appropriate. Subjects for the first two groups wereselected to mimic a lung cancer screening population. Inclusion criteria were subjectsbetween 50-74 years of age, current smokers or those with a smoking history and/orreported to have radiological evidence of pulmonary emphysema were found eligible forthe first two groups. Group 1 consists of 181 CT scans which were clinically reported asbeing free from pulmonary nodules and group 2 consists of 100 CT scans which werereported to have at least 1 and no more than 10 pulmonary nodule(s). Group 3 consistsof 25 CT scans which were followed up for the presence of a pulmonary nodule, group 4consists of the follow-up CT scans of group 3. Finally, group 5 consists of 18 CT scanswith part-solid and/or ground-glass nodule(s) described in the original radiology report.Group 5 was intended to increase the overall number of sub-solid nodules. Specificexclusion criteria were slice thickness >3mm and the presence of diffuse pulmonarydisease in the radiology report and/or the CT images, with widespread abnormalitiessuch as interstitial lung disease, which is very likely to lead to significant symptoms andtherefore didn't correspond with an asymptomatic screening subject.
Data acquisition: Patients were scanned with Aquilion (n=330), Aquilion-CX (n=2), andAquilion ONE (n=1) CT scanners from Canon Medical Systems (formerly ToshibaMedical Systems), Otawara, Japan and LightSpeed (n=2), LightSpeed Plus (n=2) CTscanners from General Electric Medical Systems, Waukesha, United States. Averagetube peak potential was 120 kVp, (median: 120 kVp, range: 120-140 kVp). Averagetube current was 243 mAs (median: 232 mAs, range: 80-491 mAs) and the averageCTDIvol was 14.0 mGy (median: 14.8 mGy; range: 2.9-29.7). Data were reconstructedat a mean slice thickness of 1.0 mm (median: 1.0mm, range 1.0-2.5mm). The followingreconstruction kernels were used for CT scans from Canon Medical Systems FC03(n=120), FC07 (n=99), FC08 (n=4), FC10 (n=3), FC12 (n=7), FC30 (n=1), FC51 (n=99)and LUNG (n=3), STANDARD (n=1) for CT scans from GE Medical Systems. All CTscans were reconstructed using filtered back-projection.
CAD software: The CAD software evaluated in this study was Veye Chest version 2.0(Aidence B.V., Amsterdam, the Netherlands).
Image annotation: A two-phase process was developed for the asynchronousinterpretation by a panel of three thoracic radiologists with at least 9 years experience inreading Chest CT scans, JM, GR and EB, expert readers 1, 2 and 3, respectively. Priorto the start of the study each reader received training on the annotation tasks and how to
Page 4 of 15

use the annotation tool. A comprehensive set of written instructions was available duringthe entire annotation process.
In summary, the initial "blinded" phase required readers 1 and 2 to independentlyperform a free search on all CT scans on a radiology reporting workstation. In halfof the CT scans, which were selected at random, the detection results of CAD weremade available. The study design ensured that each CT scan was reviewed twice,once by each reader, once by one reader with the results of CAD (AIDED) and onceby the other reader without (UNAIDED). Readers were asked to identify all lesionswhich they considered to be a pulmonary nodule without clear benign morphologicalcharacteristics (i.e. calcified nodules). They could mark a pulmonary nodule by addinga manual annotation or classify a CAD prompt as either a true positive or false positive.They were required to register all nodules that were present on CT scans from bothgroups 3 and 4, where possible. Finally, the readers also classified all false positiveprompts in three different groups: micro-nodules (largest axial diameter <3mm), masses(largest axial diameter >30mm), benign nodules (benign calcification pattern or clearbenign perifissural appearance), non-nodules (any finding that could not be classifiedin any of the other sub-groups). Subsequently, non-nodules were further classified as:pleural plaque, scar tissue, atelectasis, fibrosis, fissure thickening, pleural fluid, pleuralthickening, intrapulmonary vessels, consolidations, outside of lung tissue, or other (freeformat). After completing all the readings on the workstations the readers subsequentlyreviewed their own previously identified nodules on a tablet (iPad Pro). The reader wasasked to determine the composition (solid or sub-solid) of the nodule and subsequentlysegment the nodule on every slice by delineating the border using a stylus (ApplePencil). After the blinded phase was completed the results from readers 1 and 2 wereevaluated for the presence of any discrepancies. Discrepancies were defined as adifference between the results in terms of: location (3D dice coefficient of 0); composition;segmentation (3D dice coefficient < -1 standard deviation of the mean 3D dice coefficient)and nodule registration. The second "unblinded" phase required reader 3 to adjudicateall discrepancies from the blinded phase without the results of CAD, free search was notallowed. The review was performed using the same materials used in the blinded phase.Reader 3 created a third independent reading for each nodule that had a discrepancyfor at least one characteristic.
Reference standard: The reference standard for nodule registration was created usingCT scans from groups 3 and 4, subsequently growth rate was determined as the relativevolume difference between a nodule visible on a CT scan from group 3 and on a studyfrom group 4.
Data analysis: When looking at nodules visible on sequential scans nodule registrationfrom CAD was scored as either a true positive-pair (TP-pair), if the detected registrationwas included in the nodule registration reference standard, or otherwise as a false
Page 5 of 15

positive-pair (FP-pair). The mean discrepancy between growth percentages determinedby readers and CAD alone was calculated.
Page 6 of 15
Images for this section:
Table 1: Table 1: Demographics of the groups included in the study.
© Queen's Medical Research Institute, Clinical Research Imaging Centre - Edinburgh/UK
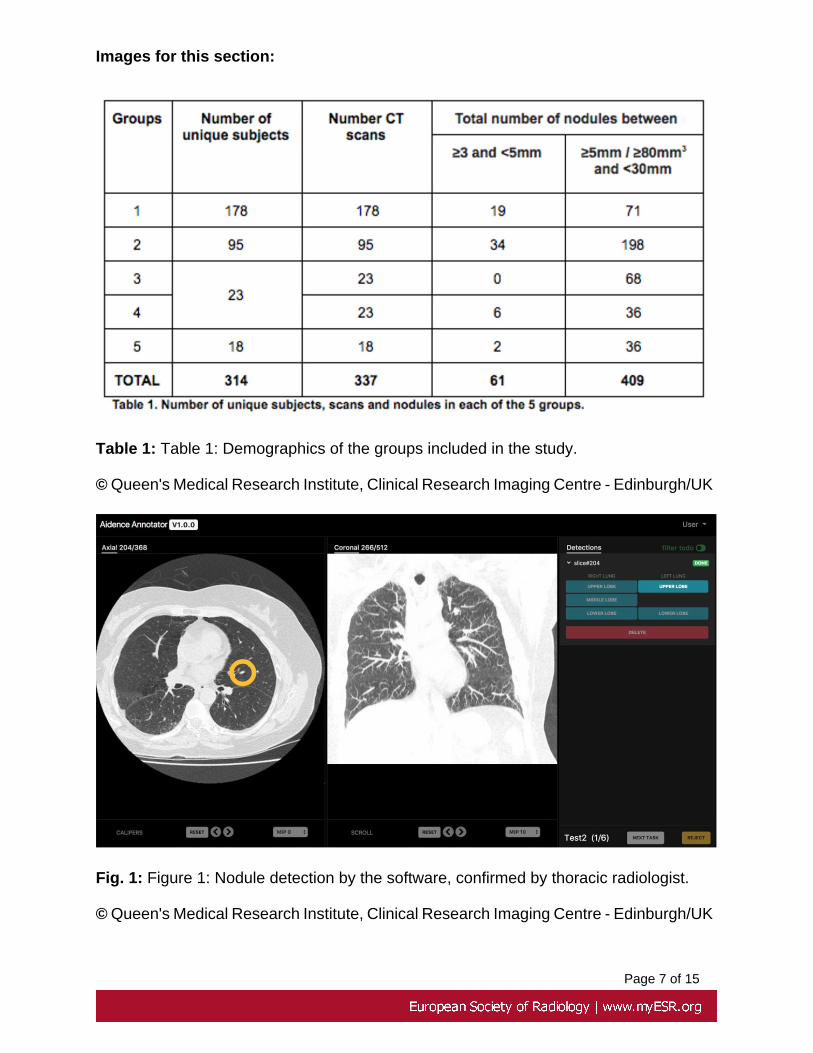
Fig. 1: Figure 1: Nodule detection by the software, confirmed by thoracic radiologist.
© Queen's Medical Research Institute, Clinical Research Imaging Centre - Edinburgh/UK
Page 7 of 15

Results
A total of 337 CT scans from 314 subjects (173 women, 164 men) with a total of 470pulmonary nodules (largest axial diameter between #3mm and #30mm) were included inthis study. The mean age of all the subjects was 63 ± 7 years (range 32-88 years). Detailsregarding the number of CT scans and nodules per group are described in table 1. Themean largest axial diameter of all nodules in groups 1 to 5 was 7.68 ± 3.50 mm (range:3.42 - 28.45 mm) and the mean volume was 198 ± 333 mm3 (range: 21 - 2797 mm3).
The total number of nodules in group 3 and 4 was 68 and 42, respectively. The totalnumber of nodule-pairs in groups 3 and 4 was 23. The sensitivity for detecting nodulepairs of CAD alone was 100.0% and the average number of FP-pairs was 0.0. The meangrowth percentage discrepancy of readers and CAD alone was 1.30 (95% CI: 1.02, 2.21)and 1.35 (95% CI: 1.01, 4.99), respectively.
Page 8 of 15

Images for this section:
Table 1: Table 1: Demographics of the groups included in the study.
© Queen's Medical Research Institute, Clinical Research Imaging Centre - Edinburgh/UK
Page 9 of 15

Fig. 2: Figure 2: Nodule segmentation and volume measurement, with follow-up studydemonstrating volume doubling time capabilities.
© Aidence BV, Amsterdam, the Netherlands
Page 10 of 15

Conclusion
The mean growth percentage of lung nodule pairs was similar between readers and bystand-alone CAD. These results show that the tool has the potential to assist radiologistsat pulmonary nodule management, although visual verification of the segmentation is stilladvised at present.
Page 11 of 15

Personal information
Address for correspondence:
Professor John T Murchison, Consultant Radiologist, Royal Infirmary of Edinburgh, LittleFrance Crescent, Edinburgh, UK. Email: [email protected]
Declaration of interest:
This study was funded by NHS England via the SBRI Phase 1 grant for earlier detectionand treatment of cancer. Aidence BV received the grant from SBRI and commissioned theUniversity of Edinburgh and Royal Infirmary of Edinburgh to perform the study. Prof. J.T.Murchison, Dr. G. Ritchie and Prof J.R. van Beek received a consulting fee for readingand annotating the studies.
Prof. Van Beek is a member of the Advisory Board of Aidence.
Prof. Murchison, Dr. Ritchie and Mr. Senyszak declare no interest.
Page 12 of 15

References
1. International Agency for Research on Cancer (IARC). GLOBOCAN 2018.
2. Jemal A, Bray F, Center MM, Ferlay J, Ward E and Forman D (2011) Global cancerstatistics. CA Cancer J Clin 61:69-90
3. International Agency for Research on Cancer (IARC). GLOBOCAN Cancer FactSheets: Lung Cancer. International Agency for Research on Cancer (IARC); 2017,
Page 13 of 15

http://gco.iarc.fr/today/data/factsheets/cancers/15-Lung-fact-sheet.pdf. Accessed 2018.
4. Centers for Medicare & Medicaid Services (CMS).(2015) Decision memo for screeningfor lung cancer with low dose computed tomography (LDCT) (CAG-00439N). CMSwebsite. www.cms.gov/medicare-coverage-database/details/nca-decision-memo.aspx?NCAId=274. Accessed February 19, 2017
5. Kakinuma R, Ohmatsu H, Kaneko M et al. (1999) Detection failures in spiral CTscreening for lung cancer: analysis of CT findings. Radiology 212: 61-6
6. White CS, Romney BM, Mason AC, Austin JH, Miller BH, Protopapas Z (1996) Primarycarcinoma of the lung overlooked at CT: analysis of findings in 14 patients. Radiology199:109-15
7. Kakinuma R, Ashizawa K, Kobayashi T et al (2012) Comparison of sensitivity of lungnodule detection between radiologists and technologists on low-dose CT lung cancerscreening images. Br J Radiol 85:e603-8
8 Roos JE, Paik D, Olsen D et al. (2010) Computer-aided detection (CAD) of lung nodulesin CT scans: radiologist performance and reading time with incremental CAD assistance.Eur Radiol 20: 549-57
9. Nair A, Gartland N, Barton B et al (2016) Comparing the performance of trainedradiographers against experienced radiologists in the UK lung cancer screening (UKLS)trial. Br J Radiol 89:20160301
10. Church TR, Black WC, Aberle D, et al. (2013) National Lung Screening Trial. NewEngl J Med 368:1980-91.
11. Callister MEJ, Baldwin DR, Akram AR, et al.(2015) The BTS guideline for theinvestigation and management of pulmonary nodules. Thorax 2015;70 (suppl 2).
12. MacMahon H, Naidich DP, Goo JM, et al. Guidelines for management of incidentalpulmonary nodules detected on CT imaging: From the Fleischner Society 2017.Radiology 284:228-43.
13. McKee BJ, Regis SM, McKee AB, Flacke S, Wald C. (2015) Performance of ACRlung-RADS in a clinical CT lung screening program. J Am Coll Radiol 12:273-6.
Page 14 of 15

14. Bankier AA, MacMahon H, Goo JM, Rubin GD, Schaefer-Prokop CM, Naidich DP.(2017) Recommendations for measuring pulmonary nodules at CT: A statement from theFleischner Society. Radiology 285:584-600.
15. Deveraj A, van Ginneken B, Nair A, Baldwin D. (2017) Use of volumetry for lungnodule management: theory and practice. Radiology 284:630-44.
16. Heuvelmans MA, Walter JE, Vliegenthart R, et al. (2018) Disagreement of diameterand volume measurements for pulmonary nodule size estimation in CT lung cancerscreening. Thorax 73:779-81.
17. Oudkerk M, Deveraj A, Vliegenthart R, et al. (2017). European position statement onlung cancer screening. Lancet Oncol 18:e754-66.
18. Naidich DP, Bankier AA, MacMahon H, et al. (2013) Recommendations for themanagement of subsolid pulmonary nodules detected at CT: A statement from theFleischner Society. Radiology 266:304-17.
Page 15 of 15
Related Documents