1 EVALUATION OF COOLING SYSTEM ALTERNATIVES PROPOSED MORRO BAY POWER PLANT May 2002 I. Introduction Tetra Tech, Inc. was requested by the San Luis Obispo Regional Water Quality Control Board (Board) to assist in reviewing the feasibility and cost estimates for specific alternatives for minimizing adverse impacts from the cooling water intake structure at the Morro Bay Power Plant (MBPP) in Morro Bay, California. Specifically, Tetra Tech, Inc. was requested to develop cost estimates for: (1) an aquatic filter barrier system (i.e., Gunderboom), (2) a wet closed cycle cooling tower system, (3) a dry closed cycle cooling tower system, and (4) a hybrid dry/wet closed cycle cooling system. Tetra Tech, Inc. was also requested to specifically comment on the feasibility and likely effectiveness of the Gunderboom system that has been proposed by Duke Energy, Inc. (Duke) and a wet cooling tower system that uses salt water make-up. The feasibility of salt water make-up systems has been questioned because of the belief that there are few existing salt water cooling tower systems in North America. Tetra Tech, Inc. was further asked to consider the costs associated with extending the thermal discharge pipeline approximately 600 feet offshore away from the biological communities along Morro Rock that are potentially being impacted by thermal discharges from the existing facility. Finally, after Duke’s January 2002 comments on the California Energy Commission’s (CEC) Staff Report, Tetra Tech Inc. was requested to: 1) estimate the cost to retrofit the existing screens and provide a fish handling and return system, 2) project the long term revenue from the proposed Morro Bay Power Plant, and 3) research EPA’s definition of “wholly disproportionate” costs. To complete this project, Tetra Tech, Inc considered EPA’s cost estimates for cooling water intake technologies currently being refined for national new and existing facility rulemakings. In addition, Tetra Tech, Inc. worked with Hatch, Inc. in developing engineering costs specifically for the proposed Morro Bay project. Hatch, Inc. has designed a wide range of cooling systems throughout the world. In addition, Tetra Tech, Inc. and Hatch, Inc. contacted a number of equipment manufacturers (Marley Cooling Tower, PSI, Inc., BetzDearborn, GEA) to obtain specifications and quotes. In determining fuel costs and estimating revenue generation, Tetra Tech Inc. worked with Abt Associates Inc. (Abt), which is supporting EPA in performing economic analyses for the national Clean Water Act Section 316(b) rulemakings. All cost estimates are somewhat dependant on site- and facility-specific conditions. Duke provided limited details on the assumptions made for costing in its alternatives analysis and subsequent June 29, 2001 letter to the Board. Additional design information was sent to Tetra Tech, Inc. during Fall 2001 and was included in the CEC Staff Report and Duke’s associated comments. All of this data still only allows for a “conceptual” cost estimate to be completed for purposes of this review.

Welcome message from author
This document is posted to help you gain knowledge. Please leave a comment to let me know what you think about it! Share it to your friends and learn new things together.
Transcript

1
EVALUATION OF COOLING SYSTEM ALTERNATIVES PROPOSED MORRO BAY POWER PLANT
May 2002
I. Introduction Tetra Tech, Inc. was requested by the San Luis Obispo Regional Water Quality Control Board (Board) to assist in reviewing the feasibility and cost estimates for specific alternatives for minimizing adverse impacts from the cooling water intake structure at the Morro Bay Power Plant (MBPP) in Morro Bay, California. Specifically, Tetra Tech, Inc. was requested to develop cost estimates for: (1) an aquatic filter barrier system (i.e., Gunderboom), (2) a wet closed cycle cooling tower system, (3) a dry closed cycle cooling tower system, and (4) a hybrid dry/wet closed cycle cooling system. Tetra Tech, Inc. was also requested to specifically comment on the feasibility and likely effectiveness of the Gunderboom system that has been proposed by Duke Energy, Inc. (Duke) and a wet cooling tower system that uses salt water make-up. The feasibility of salt water make-up systems has been questioned because of the belief that there are few existing salt water cooling tower systems in North America. Tetra Tech, Inc. was further asked to consider the costs associated with extending the thermal discharge pipeline approximately 600 feet offshore away from the biological communities along Morro Rock that are potentially being impacted by thermal discharges from the existing facility. Finally, after Duke’s January 2002 comments on the California Energy Commission’s (CEC) Staff Report, Tetra Tech Inc. was requested to: 1) estimate the cost to retrofit the existing screens and provide a fish handling and return system, 2) project the long term revenue from the proposed Morro Bay Power Plant, and 3) research EPA’s definition of “wholly disproportionate” costs. To complete this project, Tetra Tech, Inc considered EPA’s cost estimates for cooling water intake technologies currently being refined for national new and existing facility rulemakings. In addition, Tetra Tech, Inc. worked with Hatch, Inc. in developing engineering costs specifically for the proposed Morro Bay project. Hatch, Inc. has designed a wide range of cooling systems throughout the world. In addition, Tetra Tech, Inc. and Hatch, Inc. contacted a number of equipment manufacturers (Marley Cooling Tower, PSI, Inc., BetzDearborn, GEA) to obtain specifications and quotes. In determining fuel costs and estimating revenue generation, Tetra Tech Inc. worked with Abt Associates Inc. (Abt), which is supporting EPA in performing economic analyses for the national Clean Water Act Section 316(b) rulemakings. All cost estimates are somewhat dependant on site- and facility-specific conditions. Duke provided limited details on the assumptions made for costing in its alternatives analysis and subsequent June 29, 2001 letter to the Board. Additional design information was sent to Tetra Tech, Inc. during Fall 2001 and was included in the CEC Staff Report and Duke’s associated comments. All of this data still only allows for a “conceptual” cost estimate to be completed for purposes of this review.

2
II. Background Duke has proposed to construct a new 1200 megawatt (MW), combined cycle power generation facility at the site of the existing 1002 MW Morro Bay Power Plant. The capacity of the new plant has been subject of significant discussion between Duke and CEC. Duke’s proposed facility includes baseloaded operation with duct firing to reach a nominal 1200 MW, while CEC has considered a facility without duct firing that would generate, on average, 1032 MW. Because an evaluation of the long term generating capacity need is beyond the scope of this review, Tetra Tech Inc. has considered both scenarios in this report. The existing facility has a once through cooling water system with a design maximum cooling water flow rate of 668 million gallons per day (MGD) and an average flow rate of 567 MGD. The new facility will have a design cooling water flow rate of 475 MGD and an average flow rate of 372 MGD. The lower flow rate is due to the increased efficiency of the new unit. The new facility must be permitted/approved by both the CEC and the Board. As part of the Board’s review and permitting process, it must address the requirements of Sections 316(a), thermal discharge, and 316(b), cooling water intake structures of the Clean Water Act. Section 316(b) specifically requires permittees to design their cooling water intake structures using the best technology available (BTA) for minimizing adverse environmental impact. Tetra Tech, Inc. is currently supporting EPA Headquarters in developing national cooling water intake regulations for new and existing sources. III. Gunderboom Effectiveness Duke has proposed that use of an aquatic filter barrier (i.e., Gunderboom) in Morro Bay would minimize losses of aquatic organisms from both entrainment and impingement. In theory, the fine mesh composition of the Gunderboom should protect the intake structure from most larvae and eggs. EPA Headquarters also considers that Gunderboom is a very promising technology for national use in minimizing impingement and entrainment. However, experience in using this technology specifically to reduce impingement and entrainment at cooling water intake structures is very limited, especially under the generally severe environmental conditions found in Morro Bay. In it’s 1999 “Fish Protection at Cooling Water Intakes,” the Electric Power Research Institute (EPRI) acknowledges that Gunderboom technology is currently “experimental in nature.” The only power plant where the Gunderboom has been used at a “full-scale” level is the Lovett Generating Station along the Hudson River in New York, where pilot testing began in the mid-1990s. Initial testing at this facility showed significant promise for reducing impingement and entrainment. Entrainment reductions up to 82 percent were observed and impingement was essentially eliminated. However, while the Gunderboom has been implemented on a full-scale level at Lovett, it has encountered some significant operational difficulties that have affected long-term performance. These difficulties include tearing, overtopping, and plugging/clogging that have been addressed through subsequent design modifications. Each of these challenges could be a significantly greater concern at Morro Bay because of the higher wave action and debris flows. Similar Gunderboom systems have been deployed in marine conditions to prevent

3
migration of particulates and bacteria. They have been used successfully in areas with waves up to five feet. During recent conversations with EPA Headquarters staff involved in national 316(b) rulemakings, Gunderboom’s management specifically indicated their preference to have their own staff actually install and operate their systems because of the day-to-day need to measure/optimize performance, maintain the net, and address problems. Because the technology is not fully proven, we believe that Duke’s cost estimates should be escalated to reflect more frequent than normal operation and maintenance and the costs of replacement equipment. In a letter dated June 25, 2001, Campbell, George & Strong, L.L.P submitted comments on Gunderboom, Inc.’s behalf in response to EPA’s published Notice of Data Availability for further 316(b) rulemaking activities. In these comments, operation and maintenance costs are estimated to be $500,000-700,000, compared to Duke’s estimate of $300,000-500,000, and capital cost for a 500 MGD Gunderboom system is estimated to be $5.2 - $6.9 million. We are not indicating that the Gunderboom cannot be used successfully for impingement and entrainment control at Morro Bay. We simply do not believe that the existing performance data supports it’s designation as a proven BTA. However, we support the concept of allowing Duke the opportunity to demonstrate it’s waterbody-specific performance as a potential alternative to the Board’s other designation of BTA (e.g., dry/wet cooling or habitat restoration). Ideally, Duke would conduct pilot and full-scale testing of the system prior to initiating cooling water withdrawals and/or perform verification testing prior to the Board allowing any kind of “allowance” from other BTA requirements (e.g., restoration costs). This idea is consistent with some of the options that EPA Headquarters is considering at the national level to allow the further development of “innovative” technologies. It is important to recognize that there are other technologies with similar levels of promise specifically for entrainment avoidance, e.g., fine mesh (0.5-1 mm) traveling screens and fine mesh wedgewire screens. Fine mesh traveling screens have been used with some level of success (greater than 50 percent entrainment reduction) at Florida Power & Light’s (FPL) Big Bend Units 3 and 4. FPL has undertaken efforts to optimize the use of these screens in a marine environment through frequent maintenance. Although wide mesh (6-9.5 mm) wedgewire screens have been used at two large fresh water power plants in Pennsylvania and Wisconsin, fine mesh wedgewire screens have only been used/tested at lower flow applications. We believe that both these types of screen systems currently have a comparable level of “proven” performance to Gunderboom systems. Unlike the Gunderboom, they would require significant redesign/reconstruction of the existing screen systems at Morro Bay (with the associated costs). However, they would not have the effects on bay-wide activities that the 2,000 foot Gunderboom system could have. IV. Feasibility of Salt Water Cooling Systems The May 23, 2001 staff report for the July 12 and 13, 2001 Regional Water Quality Control Board meeting discussed an alternative related to the use of wet cooling towers for the new Morro Bay Power Plant Project. The staff indicated that the Board was generally not aware of cooling towers using salt water as a make-up flow. Based on this, the report further suggested

4
the need for a fresh water supply, including the potential design and construction of a desalination plant. The staff subsequently requested that Tetra Tech, Inc. further investigate the use of salt water make-up cooling tower systems. From an engineering perspective, Tetra Tech, Inc. is not aware of any constraints on using salt water intake other than the need to use corrosion resistant materials. EPA proposed wet cooling towers as an alternative for both salt and fresh water conditions in the November 2000 new facility rulemaking. EPA did not receive any comments that cooling towers could not be implemented in salt water conditions and wet towers were required as part of the November 2001 final new facility rulemaking. To further justify the use of wet cooling towers in salt water applications, Tetra Tech, Inc. contacted Marley Cooling Tower, which is one of the largest cooling tower manufacturers in the world. Marley provided the lists of facilities included in Attachment 1 that have installed cooling towers with marine or otherwise high total dissolved solids/brackish make-up water. It is important to recognize that this represents only the subset of facilities constructed by Marley worldwide; this does not include facilities constructed by other cooling tower manufacturers. For example, FPL’s Crystal River Units 4 and 5 (about 1500 MW) use estuarine water make-up. In developing the cost estimates included in Section V, we also obtained pricing information from PSI, Inc. (a subsidiary of Global Water Technology), another leading cooling tower manufacturer. PSI, Inc. confirmed their ability to design and construct a salt water cooling tower for the Morro Bay facility. In developing independent estimates for wet and hybrid (dry/wet) cooling systems, we have taken into account that salt water cooling tower’s would require more expensive corrosion resistant materials and more frequent/intensive maintenance and equipment replacement. Our cost estimates are discussed in the following sections. V. Cost Estimates for Cooling System Alternatives The following sections present Tetra Tech Inc.'s cost estimates for dry, wet, and hybrid cooling systems at the new Morro Bay Power Plant. In developing alternatives, Tetra Tech specifically addressed the differences between Duke and CEC's design criteria. Under Duke's proposal, the facility design focuses on Duke being able to generate 1200 MW using duct-firing; i.e., technology that raises turbine exhaust gas temperature to increase steam production. Duke’s design would maintain full capacity during peakload periods in the summer months when ambient temperatures reach 85 degrees F. The CEC design does not include duct firing and will produce an average of 1032 MW. Specifically, for dry cooling alternatives, CEC’c assumption is that the 64 degree F dry bulb will not be exceeded most of the time. However, at higher dry bulb temperatures (during the summer months), the CEC design with dry cooling will result in reduced power output. For example, at 74 degrees F, the net power output will drop to 930 MW according to Duke's analysis. It is beyond the scope of this analysis for Tetra Tech to determine which design most appropriately reflects likely energy demand in California and future operating scenarios for the facility. Therefore, Tetra Tech Inc.'s alternatives, as described below, consider both the Duke and CEC options.

5
In addition, both the CEC Staff Report and Duke’s January 2002 comments, suggest the potential need for noise mitigation for recirculating cooling water systems. It is also beyond the scope of this analysis to determine the specific need for noise mitigation at Morro Bay. Therefore, Tetra Tech Inc. has provided costs for alternatives with and without noise reduction technology. Wet Cooling Systems A. Capital Cost Duke estimated $15 million of capital costs for a wet cooling tower system. For the Morro Bay Power Plant, Tetra Tech, Inc. and Hatch, Inc. worked with two leading cooling tower vendors (Marley Cooling Tower and PSI, Inc.) to develop facility-specific cost estimates for four alternative wet cooling systems, each using salt water makeup. A summary of these alternatives and corresponding capital cost estimates is presented below in Table 1. Detailed figures and related assumptions are presented in Attachment 2. The height of the wet cooling towers would be approximately 50 feet for all alternatives, and the area needed is approximately the same for each. Note that the total cost estimates are generally in the range of Duke’s capital cost estimate of $15 million. Table 1 - Wet Cooling Alternatives, Morro Bay Power Plant Option # System Description Capacity (MW) Total Cost ($M)
1 salt water makeup, no noise reduction, duct firing
970 $17.1
2 salt water makeup, with noise reduction, duct firing
970 $17.4
3 salt water makeup, no noise reduction, without duct firing
700 $16.3
4 salt water makeup, with noise reduction, without duct firing
700 $16.9
Note: Option #s, above, correspond to those presented in Attachment 2. B. Operation and Maintenance Cost Duke estimated annual operation and maintenance costs for a wet cooling system of $600,000. PSI, Inc. estimated $100,000 per tower annually for routine operation and maintenance and long-term equipment replacement, as appropriate. PSI, Inc.’s estimate did not include intake water chemical treatment costs. Based on experience and quotes from suppliers (BetzDearborn, Inc.), such chemicals average approximately $2 per gallon per minute (gpm). Using the average cooling water flow provided by Duke of 258,000 gpm, the annual chemical cost would be $516,000. Adding this value to PSI, Inc.’s cost, the total operation and maintenance cost would be about $716,000. Marley Cooling Tower also provided a spreadsheet that they have used to calculate operation and maintenance costs for salt water towers. This spreadsheet provided for replacement of 5 percent of the mechanical equipment beginning in year 12 of operations and

6
complete replacement of fill and eliminators in year 20. The calculated spreadsheet costs combined with the chemical costs above yield total average operation and maintenance costs comparable to Duke’s and PSI, Inc.’s estimates. Therefore, Tetra Tech, Inc. has used Duke’s estimate of $600,000 annually in calculating the cost of the wet cooling alternatives. Tetra Tech, Inc. has specifically assumed that cooling blowdown would not require treatment prior to discharge (presumably to Morro Bay). Historically, power plants have used zinc, chromium, chlorine, and other potentially toxic chemicals in cooling water systems. However, due to discharge limitations, these chemicals have largely been replaced by non-toxic alternatives. A detailed analysis of the expected discharge composition, likely permit requirements, and the potential need for treatment is beyond the scope of this study. The staff report indicated that EPA’s national figures for operation and maintenance of a wet cooling tower comparable to Morro Bay have been reported as about $2.5 million annually. This figure is intended to represent a very conservative, national value. It is not intended to represent the costs at any individual facility. Considering the consistency among Duke’s, PSI, Inc.’s, and Marley Cooling Tower’s estimates, we believe that $600,000 per year is a reasonable value to use for all alternatives examined, taking into account routine operation and maintenance, equipment replacement, and intake water chemical treatment. C. Energy Penalty Ambient conditions (high temperatures and humidity) generally cause less efficient cooling when using recirculating cooling than when using once through cooling. Therefore, one part of the “energy penalty” is the lost power associated with the lower efficiency. Tetra Tech Inc. has reviewed Duke’s estimates of the energy penalty associated with a cooling tower system used for cooling at the Morro Bay facility instead of using the existing once through system. It is important to recognize that the energy penalty in a combined cycle plant is only associated with the steam cycle component of the process. Therefore, lower energy penalties would generally be anticipated for combined cycle plants than conventional fossil-fired steam turbines. The other part of the “energy penalty” is the difference in power required to operate the recirculating system compared to a once through system. In a June 29, 2001 letter from Duke to the Board, Duke estimated that a wet cooling system would a result in an average loss of about 50 MW compared to a once through system. As indicated above, Tetra Tech, Inc. is currently evaluating this question in conjunction with ongoing EPA rulemaking activities at the national level. To determine the average energy penalty for a wet cooling system compared to a once through system at Morro Bay, Tetra Tech, Inc. has taken into consideration the expected difference in turbine back pressure between the two cooling alternatives, as well as the increased in-plant energy requirement created by the wet cooling system. At a wet bulb temperature of 58 degrees F and an approach of 18 degrees F (figures provided by Duke), the average turbine back pressure will be 2.32 inches mercury for the wet system. For once through cooling, month-to-month back pressures were calculated based on monthly intake water temperature at Morro Bay obtained from the National Oceanic and Atmospheric Administration’s website. To determine the increased in-plant energy requirement for a cooling tower system, Tetra Tech Inc. assumed that the energy use of once through cooling

7
water pumps is approximately the same as for recirculating water pumps in a cooling tower cycle system. The increased energy requirement for each wet cooling alternative was then calculated based on the continuous use of the cooling tower fans within the mechanical draft cooling towers. Table 2 presents the energy penalty associated with decreased turbine efficiency for each wet cooling option. Table 2 - Energy Penalties Due to Decreased Turbine Efficiency – Wet Cooling Alternatives Percent Option #s 1 and 2 Option #s 3 and 4 1200 MW - full load with duct firing
0.10 % 1.2 MW
804 MW – 67% load with duct firing
0.30 % 2.4 MW
1032 MW – full load without duct firing
0.10 % 1.0 MW
691 MW – 67% load without duct firing
0.30 % 2.1 MW
For option #s 1 and 2, the energy penalty associated with increased in-plant energy use will be approximately 1.5 MW; and for option #s 3 and 4, the increased in-plant energy use will be approximately 1.6 MW. The total energy penalty for each wet cooling alternative is presented in Table 3. Table 3 – Total Energy Penalties – Wet Cooling Alternatives Option #s 1 and 2 Option #s 3 and 4 1200 MW - full load with duct firing
2.7 MW
804 MW – 67% load with duct firing
3.9 MW
1032 MW – full load without duct firing
2.6 MW
691 MW – 67% load without duct firing
3.7 MW
Based on anticipated new power plant construction over the next several years, Tetra Tech, Inc. does not accept Duke’s argument that additional power plants would have to be constructed to make up for the lost capacity. Therefore, the costs of lost capacity could be addressed in 2 ways: (1) if the facility is not operating at a full capacity, Duke could burn more fuel to generate the power commensurate with a once through system, or (2) Duke could elect to lose the revenue associated with the lost power sales. Under the ‘burn more fuel’ first scenario, Tetra Tech Inc. assumes that the plant would be operating at 67 percent of maximum capacity; and Duke would need to burn the additional natural gas equivalent to 116,600 mmBTU (options #s 1 and 2) and 110,700 mmBTU (option #s 3 and 4), operating with and without duct firing, respectively. Duke’s June 29, 2001 letter to the Board assumed a natural gas price of $5/mmBTU; whereas, Tetra Tech Inc. initially considered
8
an energy penalty associated with natural gas pricing at both $5/mmBTU and $3.50/mmBTU, which appeared to be a more realistic figure based on the current price of natural gas and longterm projections by the CEC. As shown in Attachment 3, Abt Associates, Inc. has recently considered three forecasts of natural gas pricing: one prepared by the US DOE in 2001 for the Pacific Region, one by the CEC in 2002 for California, and one by the US EPA in 2002. These forecasts project similar price increases for natural gas over the next 10 to 30 years. In revising the cost for this energy penalty scenario, Tetra Tech Inc. has used the CEC price projections for natural gas, which begin at $2.94 per mmBTU in 2002 and are extrapolated to $5.40 per mmBTU in 2031. Using CEC unit prices, the additional fuel needed under this ‘burn more fuel’ energy penalty scenario for each wet cooling alternative would be as follows: • $343,000 (option #s 1 and 2, with duct firing, 2002 pricing) • $630,000 (option #s 1 and 2, with duct firing, 2031 pricing) • $326,000 (option #s 3 and 4, without duct firing, 2002 pricing) • $598,000 (option #s 3 and 4, without duct firing, 2031 pricing) Under the second energy penalty scenario, Duke would not increase generation to makeup for the energy penalty. The energy penalty cost would be the lost revenue from lower power generation. In its initial analysis, Tetra Tech assumed a wholesale electricity price of $100/MWh. Based on Duke comments, Abt assessed the long term revenue potential of the Morro Bay Power Plant through a comparison of Duke Energy’s analysis of future revenues, as presented in its Comments on Draft Appendix A: Morro Bay Power Plant Cooling Options Report of February 15, 2002, with alternative revenue estimates based on electricity market model forecasts for California power plants. Abt found that Duke Energy had used a future wholesale electricity price of $32.50/MWh, which likely reflected 1997 dollars as reported by POEMS (the Policy Office Electricity Modeling System) in a 1999 DOE study, and which would be approximately $34 in 2001 dollars. The annual revenue loss is then calculated as follows, using a wholesale electricity price of $34/MWh. (MW lost) ($34/MWh) (24 hours/day) (365 days/year) = annual lost revenue Assuming operation at maximum load, the revenue loss for each wet cooling alternative would be approximately: • $804,000 (option #s 1 and 2, with duct firing) • $774,000 (option #s 3 and 4, without duct firing) D. Total Costs The net present value (NPV) of combined capital, operation and maintenance, and energy penalty costs for each wet cooling alternative is presented in Table 4. Both energy penalty scenarios are included for each alternative. Corresponding amortized annual values over a thirty year period are also presented in Table 4.

9
Table 4 - Net Present Value (NPV) of Combined Capital, O&M, and Energy Penalty Costs and Corresponding Annual Amortized Cost Over 30 Years – Wet Cooling Systems Option 1 Option 2 Option 3 Option 4
Energy Penalty Scenario 1 – Additional Fuel Burned to Makeup for the Energy Penalty NPV – Total Capital, O&M, plus Scenario 1 Energy Penalty (add’l fuel burned at CEC projected pricing)
$ 27.9 million $ 28.2 $ 27.0 million $27.5
Corresponding (to above NPV)Annual Amortized Cost over 30 Years at 7% Discount Rate
$ 2.5 million $ 2.5 $ 2.4 $ 2.4
Energy Penalty Scenario 2 – Revenue Lost at $34/MWh NPV – Total Capital, O&M, plus Scenario 2 Energy Penalty (revenue lost @ $34/MWh)
$ 32.3 $ 32.6 $ 31.2 $ 31.7
Corresponding (to above NPV) Annual Amortized Cost over 30 Years at 7% Discount Rate
$ 2.8 $ 2.8 $ 2.7 $ 2.7
The cost figures for each wet cooling system considered are considerably lower than Duke’s estimates ($165 million NPV and $13 million annual amortized costs) due to the lower anticipated energy penalty costs. Dry Cooling A. Capital Cost In its June 29, 2001 letter to the Board, Duke estimated that the capital cost for a dry cooling system would be approximately $39 million. EPA’s national estimate for a new dry cooling facility is $69 million. Tetra Tech, Inc. and Hatch, Inc. worked with a dry cooling tower vendor (GEA) to develop specific capital cost estimates for four variations of dry cooling systems at the Morro Bay facility. Using design information provided by Duke Energy, these total capital cost estimates range from $27.3 to $86 million depending upon plant operating capacity, operation with or without duct firing, and use of noise mitigation technology. The height of the dry cooling units ranges from 100 to 120 feet, although the footprint would be larger with duct firing and noise reduction. The four dry cooling system alternatives and corresponding capital cost estimates are summarized below in Table 5. Detailed cost information and design assumptions are presented in Attachment 2.

10
Table 5 - Dry Cooling Alternatives, Morro Bay Power Plant Option # System Description Capacity (MW) Capital Cost ($M)
5 no noise reduction; duct firing 970 $68.2
6 with noise reduction, duct firing 970 $86.0
7 no noise reduction; without duct firing 700 $27.3
8 with noise reduction; without duct firing 700 $35.1
Note: Option #s, above, correspond to those presented in Attachment 2. B. Operation and Maintenance Cost Duke’s June 29, 2001 letter to the Board provides an estimate of annual operation and maintenance costs of $300,000 for a dry cooling system. The staff report for the July 12, 2001 Board meeting provided EPA’s estimated annual operation and maintenance costs of about $9.75 million per year, developed for the Section 316(b) rulemaking. EPA’s values have since been refined to about $7.4 million for the Agency’s national rulemaking activities. Technical Development Document for the Final Regulations Addressing Cooling Water Intake Structures for New Facilities (EPA-821-R-01-036), 2001. GEA has indicated that its towers would require limited routine maintenance, and equipment replacement should be minimal over a 30-year operating period. Therefore, GEA suggested $50,000-$100,000 per year of operation and maintenance costs. Recognizing that GEA is a supplier and its estimates are likely to be low, Tetra Tech, Inc. believes that Duke’s estimate of $300,000 per year is reasonable. C. Energy Penalty Tetra Tech, Inc. has reviewed Duke’s estimates of the energy penalty associated with constructing a dry cooling system at Morro Bay instead of using the existing once through cooling. This included evaluating the estimated loss of power and costs for replacing the lost power. In a June 29, 2001 letter from Duke to the Board, Duke estimated that a dry cooling system would result in an average loss of 102 MW compared to a similarly sized once through system. Tetra Tech, Inc. is currently evaluating this question in conjunction with ongoing EPA rulemaking activities at the national level. The energy penalty for dry cooling is based on the difference in turbine back pressures between dry cooling and once through cooling systems and the difference in the in-plant energy requirements of the two cooling systems. For dry cooling, Tetra Tech, Inc. used the back pressure of 3.87 inches Hg, as provided by Duke. Presumably, this is an average annual value, since the back pressure will vary to some extent on a month-to-month basis depending on ambient temperatures. For once through cooling, month-to-month back pressures were calculated based on monthly intake water temperature at Morro Bay obtained from the National Oceanic and Atmospheric Administration’s website.
11
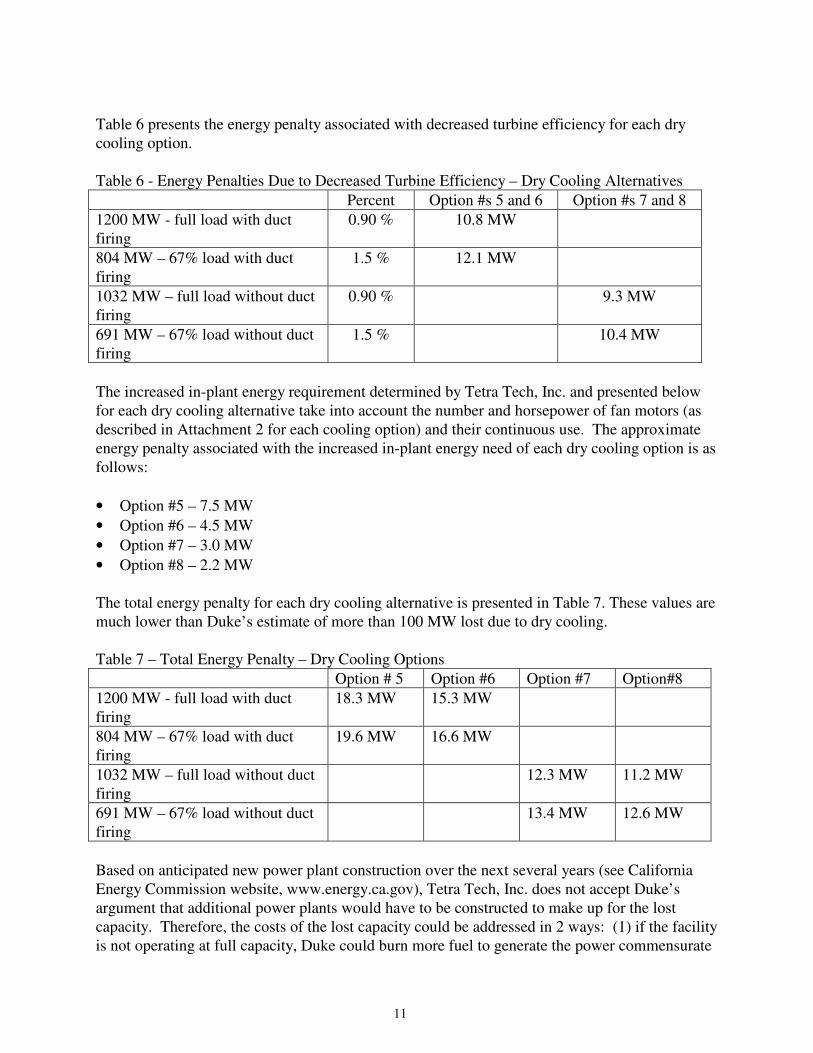
Table 6 presents the energy penalty associated with decreased turbine efficiency for each dry cooling option. Table 6 - Energy Penalties Due to Decreased Turbine Efficiency – Dry Cooling Alternatives Percent Option #s 5 and 6 Option #s 7 and 8 1200 MW - full load with duct firing
0.90 % 10.8 MW
804 MW – 67% load with duct firing
1.5 % 12.1 MW
1032 MW – full load without duct firing
0.90 % 9.3 MW
691 MW – 67% load without duct firing
1.5 % 10.4 MW
The increased in-plant energy requirement determined by Tetra Tech, Inc. and presented below for each dry cooling alternative take into account the number and horsepower of fan motors (as described in Attachment 2 for each cooling option) and their continuous use. The approximate energy penalty associated with the increased in-plant energy need of each dry cooling option is as follows: • Option #5 – 7.5 MW • Option #6 – 4.5 MW • Option #7 – 3.0 MW • Option #8 – 2.2 MW The total energy penalty for each dry cooling alternative is presented in Table 7. These values are much lower than Duke’s estimate of more than 100 MW lost due to dry cooling. Table 7 – Total Energy Penalty – Dry Cooling Options Option # 5 Option #6 Option #7 Option#8 1200 MW - full load with duct firing
18.3 MW 15.3 MW
804 MW – 67% load with duct firing
19.6 MW 16.6 MW
1032 MW – full load without duct firing
12.3 MW 11.2 MW
691 MW – 67% load without duct firing
13.4 MW 12.6 MW
Based on anticipated new power plant construction over the next several years (see California Energy Commission website, www.energy.ca.gov), Tetra Tech, Inc. does not accept Duke’s argument that additional power plants would have to be constructed to make up for the lost capacity. Therefore, the costs of the lost capacity could be addressed in 2 ways: (1) if the facility is not operating at full capacity, Duke could burn more fuel to generate the power commensurate

12
with a once through system, or (2) Duke could elect to lose the revenue associated with the lost power sales. Under the first scenario, where the MBPP would be operating at less than full capacity, Duke would be required to burn the following additional natural gas equivalent, annually, assuming operation at 67 percent of maximum. • Option #5 – 586,000 mmBTU • Option #6 – 497,000 mmBTU • Option #7 – 401,000 mmBTU • Option #8 – 377,000 mmBTU Based on the CEC price projections for natural gas presented in Attachment 3, which show a range from $2.94 mmBTU in 2002 to $5.40 per mmBTU in 2031, the cost of fuel needed under this energy penalty scenario for each dry cooling option would increase annually as follows: • Option #5 – $1,723,000 - $3,166,000 (2002 – 2031) • Option #6 – $1,460,000 - $2,681,000 (2002 – 2031) • Option #7 – $1,178,000 - $2,164,000 (2002 – 2031) • Option #8 – $1,108,000 - $2,035,000 (2002 – 2031) Under the second energy penalty scenario, where Duke could elect to simply lose revenue associated with the energy penalty, Tetra Tech, Inc. assumes that the MBPP would be operating at maximum load. This scenario is conceivable because the energy penalty would largely be expected to occur during the summer months, when presumably the facility would be at peak load operation. At a wholesale electricity price of $34/MWh, lost revenue will be approximately as follows: • Option #5 – $5,451,000 • Option #6 – $4,557,000 • Option #7 – $3,663,000 • Option #8 – $3,336,000
D. Total Costs The net present value (NPV) of combined capital, operation and maintenance, and energy penalty costs for each dry cooling alternative is presented in Table 8. Both energy penalty scenarios are included for each alternative. Corresponding amortized annual values over a thirty year period are also presented in Table 8.

13
Table 8 - Net Present Value (NPV) of Combined Capital, O&M, and Energy Penalty Costs and Corresponding Annual Amortized Cost Over 30 Years – Dry Cooling Alternatives Option #5 Option #6 Option #7 Option #8
Energy Penalty Scenario 1 – Additional Fuel Burned to Makeup for the Energy Penalty NPV – Total Capital, O&M, plus Scenario 1 Energy Penalty (add’l fuel burned at CEC projected pricing)
$ 92.4 million $ 104.9 $ 46.2 $ 52.5
Corresponding (to above NPV)Annual Amortized Cost over 30 Years at 7% Discount Rate
$ 8.2 million $ 9.3 $ 4.1 $ 4.7
Energy Penalty Scenario 2 – Revenue Lost at $34/MWh NPV – Total Capital, O&M, plus Scenario 2 Energy Penalty (revenue lost @ $34/MWh)
$ 130.4 $ 136.7 $ 71.5 $ 75.0
Corresponding (to above NPV) Annual Amortized Cost over 30 Years at 7% Discount Rate
$ 11.3 $ 11.8 $ 6.2 $ 6.5
The cost figures for each dry cooling system considered are considerably lower than Duke’s estimates ($301 million NPV and $24 million annual amortized costs), primarily due to the lower anticipated energy penalty costs. Hybrid Dry/Wet Cooling Tower System A. Capital Cost The Board requested that Tetra Tech, Inc. provide a cost estimate for a 60 percent dry/40 percent wet cooling system. Using the additional design information provided by Duke Energy, Tetra Tech, Inc.’s total capital cost estimates for four such hybrid cooling alternatives, each using sea water makeup, is summarized below in Table 9. The height of the wet cooling system portion would be approximately 40 feet, and the dry system would be 97 to 125 feet. The footprint for the dry system would be substantially larger with duct firing and noise reduction. Detailed cost information and design assumptions for these alternatives are presented in Attachment 2.

14
Table 9 - Hybrid (Wet/Dry) Cooling System Alternatives, Morro Bay Power Plant Option # System Description Capacity (MW) Total Cost ($M)
9 salt water makeup, no noise reduction, duct firing
970 $62.6
10 salt water makeup, with noise reduction, duct firing
970 $82.5
11 salt water makeup, no noise reduction, without duct firing
710 $31.2
12 salt water makeup, with noise reduction, without duct firing
710 $37.2
Note: Option #s, above, correspond to those presented in Attachment 2. B. Operation and Maintenance Cost Tetra Tech, Inc.’s estimated annual operation and maintenance costs for the hybrid system would be $420,000. This figure is simply based on the relative proportion of the full scale dry system O&M cost (60% of $300,000) plus the full scale wet system O&M cost (40% of $600,000). C. Energy Penalty The total energy penalty for the hybrid system is the combined losses from the wet and dry portions of the cooling system, taking into account decreased turbine efficiencies and the increased in-plant energy requirements, as compared to a once through cooling system. Table 10 presents the energy penalty associated with decreased turbine efficiency for each hybrid cooling option. Table 10 - Energy Penalties Due to Decreased Turbine Efficiency – Hybrid Cooling Alternatives Percent Option #s 9 and 10 Option #s 11 and 12 1200 MW - full load with duct firing
0.90 % (dry) 0.10% (wet)
7.0 MW
804 MW – 67% load with duct firing
1.5 % (dry) 0.30% (wet)
8.2 MW
1032 MW – full load without duct firing
0.90 % (dry) 0.10% (wet)
6.0 MW
691 MW – 67% load without duct firing
1.5 % (dry) 0.30% (wet)
7.1 MW
The increased in-plant energy requirements, determined by Tetra Tech, Inc., take into account the number and horsepower of fan motors (as described in Attachment 2) and their continuous use. The approximate energy penalty associated with the increased in-plant energy need of each hybrid cooling option is as follows:

15
• Option #9 – 6.3 MW • Option #10 – 4.0 MW • Option #11 – 3.1 MW • Option #12 – 1.9 MW The total energy penalty for each hybrid cooling option is presented in Table 11. Table 11 – Total Energy Penalty – Hybrid Cooling Options Option # 9 Option #10 Option #11 Option #12 1200 MW - full load with duct firing
13.3 MW 11.0 MW
804 MW – 67% load with duct firing
14.5 MW 12.2 MW
1032 MW – full load without duct firing
9.1 MW 7.9 MW
691 MW – 67% load without duct firing
10.2 MW 9.0 MW
Based on anticipated new power plant construction over the next several years (see California Energy Commission website, www.energy.ca.gov), Tetra Tech, Inc. did not accept Duke’s argument that additional power plants would have to constructed to make up for the lost capacity. Therefore, the costs of the lost capacity could be addressed in 2 ways: (1) if the facility is not operating at full capacity, Duke could burn more fuel to generate the power commensurate with a once through system, or (2) Duke could elect to lose the revenue associated with the lost power sales. Under the first scenario, where the MBPP would be operating at less than full capacity, Duke would be required to burn the following additional natural gas equivalent, annually, assuming operation at 67 percent of maximum. • Option #9 – 434,000 mmBTU • Option #10 –365,000 mmBTU • Option #11 – 305,000 mmBTU • Option #12 – 269,000 mmBTU Based on the CEC price projections for natural gas presented in Attachment 3, which show a range from $2.94 mmBTU in 2002 to $5.40 per mmBTU in 2031, the cost of fuel needed under this energy penalty scenario for each dry cooling option would increase annually as follows: • Option #9 – $1,275,000 - $2,342,000 (2002 – 2031) • Option #10 – $1,073,000 - $1,971,000 (2002 – 2031) • Option #11 – $897,000 - $1,648,000 (2002 – 2031) • Option #12 – $791,000 - $1,454,000 (2002 – 2031)

16
Under the second energy penalty scenario, where Duke could elect to simply lose revenue associated with the energy penalty, Tetra Tech, Inc. assumes that the MBPP would be operating at maximum load. At a wholesale electricity price of $34/MWh, lost revenue will be as follows: • Option #9 – $3,961,000 • Option #10 – $3,276,000 • Option #11 – $2,710,000 • Option #12 – $2,681,000 D. Total Costs The net present value (NPV) of combined capital, operation and maintenance, and energy penalty costs for each hybrid cooling alternative is presented in Table 12. Both energy penalty scenarios are presented for each alternative. Corresponding amortized annual values over a thirty year period are also presented in Table 12. Table 12 - Net Present Value (NPV) of Combined Capital, O&M, and Energy Penalty Costs and Corresponding Annual Amortized Cost Over 30 Years – Hybrid Cooling Systems Option 9 Option 10 Option 11 Option 12
Energy Penalty Scenario 1 – Additional Fuel Burned to Makeup for the Energy Penalty NPV – Total Capital, O&M, plus Scenario 1 Energy Penalty (add’l fuel burned at CEC projected pricing)
$ 82.0 million $ 97.6 $ 47.1 million $ 51.2
Corresponding (to above NPV)Annual Amortized Cost over 30 Years at 7% Discount Rate
$ 7.2 million $ 8.6 $ 4.2 $ 4.5
Energy Penalty Scenario 2 – Revenue Lost at $34/MWh NPV – Total Capital, O&M, plus Scenario 2 Energy Penalty (revenue lost @ $34/MWh)
$ 109.3 $ 120.0 $ 65.5 $ 70.7
Corresponding (to above NPV) Annual Amortized Cost over 30 Years at 7% Discount Rate
$ 9.4 $ 10.3 $ 5.6 $ 6.1
VII. Extension of the Thermal Discharge Pipeline Tetra Tech, Inc. with assistance from Hatch, Inc. evaluated the cost of extending the thermal discharge 600 feet offshore. The plume would then avoid Morro Rock biological communities where the only temperature related impacts have been observed to date. In the evaluation, Tetra Tech, Inc. and Hatch, Inc. considered Duke’s June 29, 2001 Evaluation of an Alternative Offshore Submerged Cooling Water Discharge for the Modernized Morro Bay Power Plant. Based on this document, there would be no additional pump costs, since Duke plans on replacing the existing pumps under the currently proposed system. Two 96" diameter pipelines would have

17
to be laid underwater for 600 feet. We propose to use Hyprescon concrete pipe at a cost of about $500 per foot. According to Hyprescon, Inc., the installation costs in California could range from $1,000-$3,000 per foot depending highly on local labor rates and site conditions. For this estimate, we chose the middle of the installation range ($2,000) for a total underwater cost of $2,500 per foot. Therefore, the cost of laying the two underwater pipelines would be $3,000,000. For the required 2,400 feet of on-land pipe laying (underground), Hyprescon, Inc. indicated that installation costs in California would be approximately $300 per foot. Therefore the costs of laying two 2,400 foot buried, on-land pipelines would be about $3,840,000. Allowing an additional $1 million for the diffuser and other miscellaneous costs, the total cost is estimated to be $7,840,000. Using these unit costs, if the 3,500 foot underwater pipelines originally proposed by Duke were constructed, the total cost would be about $22-23 million. In it’s Economic and Engineering Analyses of the Proposed Section 316(b) New Facility Rule, EPA evaluated the cost of extending intake pipelines offshore. Such costs would be comparable to extending the discharge pipeline. Using microtunneling (the most expensive pipe laying approach considered), EPA estimated the cost of underwater pipe laying would be $1,000-$2,000 per foot, including both equipment and labor. Applying the upper end of this range ($2,000 per foot), the cost of laying the underwater pipelines at Morro Bay would be $2,400,000 and the total cost with the on-land pipe laying and diffuser/miscellaneous costs would be $7,240,000. Using EPA’s unit costs, if the 3,500 foot underwater pipelines originally proposed by Duke were constructed, the total cost would be about $19 million. The comparable cost estimates for the 3,500 foot pipelines developed using both Hyprescon and EPA’s unit costs are significantly lower than Duke’s estimate of about $35 million. Note that the total costs approach $30 million if the high end of Hyprescon’s estimated underwater installation cost range ($3,000 per foot) is used. One of the items in Duke’s alternative evaluation merits comment. While it is true that recent studies show that some larvae and eggs survive entrainment, see EPRI’s Review of Entrainment Survival Studies: 1970-2000, survival is highly variable. EPRI cited the following factors as affecting entrainment survival: (1) the species entrained, (2) the size of organism entrained, (3) biocide use, (4) mechanical effects such as abrasion, and (5) the temperature of the discharge water. The discharge temperature was found to be an especially important factor, and survival was found to decrease significantly above 30-32 degrees F. While duration of exposure to high temperatures likely has some influence, this effect has not been quantified. Therefore, there is no substantive evidence to support Duke’s conclusion that “any small benefit (to Morro Rock’s algal community) would likely be outweighed by the increase in mortalities of entrained fish and shellfish.” This is especially true if the discharge pipeline is only extended 600 feet underwater.

18
VIII. Long Term Revenue Projection for the Morro Bay Power Plant Abt has prepared the memorandum included in Attachment 3, which assesses the long term revenue potential of the Morro Bay Power Plant. Abt compared Duke’s analysis of future revenues, as presented in its Comments on Draft Appendix A: Morro Bay Power Plant Cooling Options Report of February 15, 2002, with alternative revenue estimates based on electricity market model forecasts for new and existing California power plants. Abt points out that Duke, in its Comments on Draft Appendix A, did not prepare an explicit estimate of future revenues but did project estimates of revenue losses that would occur through implementation of alternative cooling designs. Using these projections of revenue losses, a future wholesale price of electricity of $34.26/MWh, a plant capacity of 1200 MW, and Duke’s assumption of operation for 8,000 hours/year, the annual revenue from the sale of electricity generated by the Morro Bay Power Plant would be approximately $329 million or $274,000 per MW of generating capacity. For comparison, Abt examined actual revenue figures and projected figures for several power plants in California. These revenue models had been assembled in support of rulemaking for EPA’s Existing Facilities, Section 316(b) rule regarding cooling water intake structures. Abt evaluated figures for three baseloaded, two intermediate load, and one peaking plant and determined that revenue for baseloaded plants, based on the modeled facilities, would be expected in the range of $241,000 to $250,000 per MW of generating capacity – a range that is comparable to Duke’s figure showing a projected revenue of $274,000 per MW of generating capacity. The modeled plants show that revenues could be lower, in the range of $49,000 to $194,000 per MW of generating capacity, if the Morro Bay Power Plant is not operated as a baseloaded facility. IX. CWA ‘Wholly Disproportionate’ Standard for Assessing Costs vs Benefits Because of Tetra Tech, Inc.'s involvement in ongoing national Section 316(b) rulemaking, the Board requested that Tetra Tech research the definition and application of the term "wholly disproportionate" as used to assess the relationship of costs and benefits of CWA regulations. This is discussed in the memorandum included in Attachment 4. Tetra Tech, Inc. is not aware of any new rulings or determinations that have occurred since the memorandum was prepared in September 1998. The recent new and existing facility Section 316(b) rulemakings acknowledge the "wholly disproportionate" standard but do not give specific guidance on its application. As indicated in Attachment 4, EPA has never promulgated a national definition of "wholly disproportionate" nor has it been fully defined by the Courts. The application to specific sites where closed cycle versus once through cooling has been considered has varied. However, it is frequently tied to the relative percent reduction in impingement and entrainment compared to overall technology cost. In a number of cases, this has been carried forward to evaluate the likely increase in energy costs paid by consumers. The costs of technologies have not generally been equated directly to the equivalent monetary value of resource losses. EPA Region IV did historically apply a standard where the Region considered that an expenditure by a facility of up

19
to ten times the dollar value of environmental damages that could be quantified would be construed as being within the concept of “Wholly Disproportionate." In summary, the Board would appear to have great discretion in determining the "wholly disproportionate" standard to be applied to Morro Bay. VIII. Retrofit with Travelling Screens The construction cost to retrofit the Morro Bay Power Plant cooling water intake structure with travelling screens is estimated to be $7,972,000. Tetra Tech Inc. does not have detailed information on the existing Morro Bay intake facility; therefore, this cost estimate was developed using the following general assumptions: • 475 MGD design intake flow • 8 cooling water pumps • 16 cooling water intake bays • Cooling water intake wells (and screens) at 10’ (depth) x 10’ (width) The total construction costs (capital costs plus installation costs) are based on cost curves presented in EPA’s Proposed Section 316(b) Phase II Existing Facilities Rule Technical Development Document (TDD), April 2002 (EPA-821-R-02-003). For a new facility, the initial capital cost is estimated at $292,000 per screen (16 screens) or $4,675,760 total. With the addition of a 30 percent factor to take into account costs for retrofit of existing facilities, total capital costs for Morro Bay are projected at $6,079,000. From the TDD, installation costs are estimated at $91,000 per screen or $1,456,000 for installation of all screens ($1,893,000 with an additional 30% for a retrofit); and a total construction cost is calculated as the sum of $6,079,000 and $1,893,000. These costs assume a 0.5 ft/sec through screen velocity and take into consideration carbon steel structure, epoxy paint, troughs, a spray system, housing and transitions, continuous operation features, drive units, frame seals, and engineering. Annual operation and maintenance costs are estimated at $4,820 per screen or $77,000 per year, total. XI. Summary Overall, Tetra Tech, Inc.’s findings include: • The proposed Gunderboom is a promising technology but has seen limited application for
impingement and entrainment control, especially in marine waters. At a minimum, successful application of this technology at Morro Bay will likely require significant pilot testing and intensive maintenance/optimization during the initial years of operation
• Construction of salt water make-up cooling towers should be feasible at Morro Bay. There are a number of examples of comparable plants and two of the largest cooling tower suppliers provided costs and design specifications for salt water make-up towers that could be constructed at Morro Bay.
20
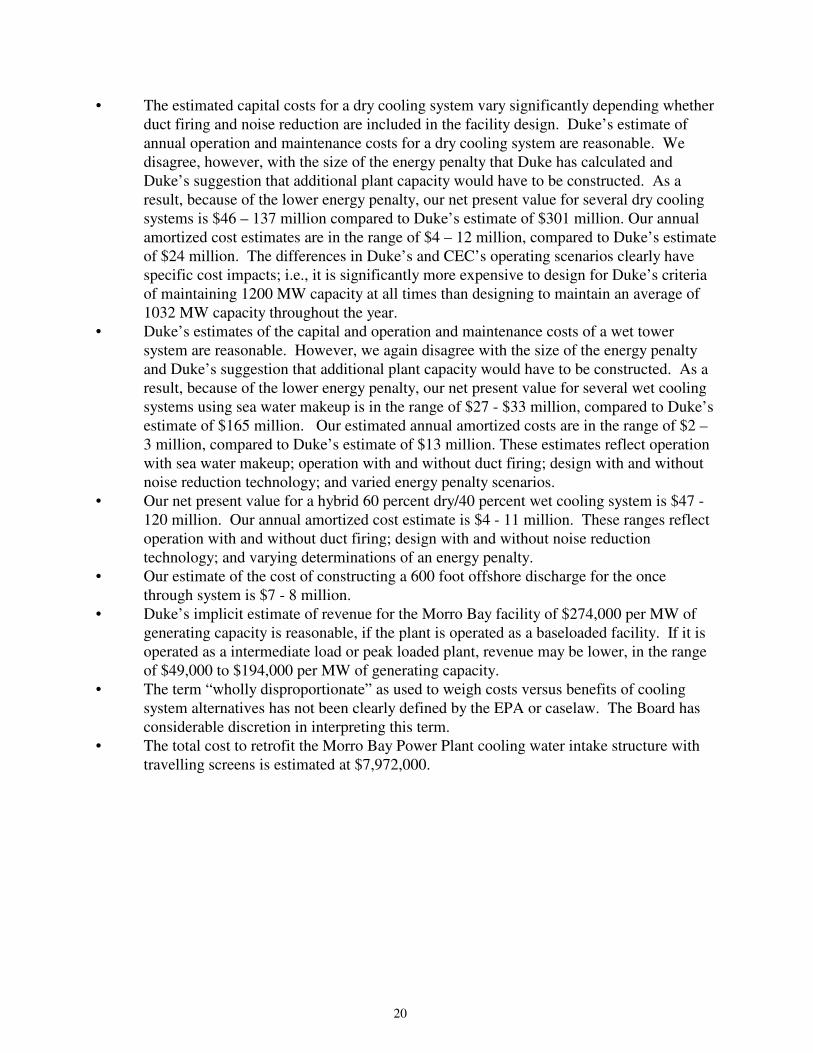
• The estimated capital costs for a dry cooling system vary significantly depending whether duct firing and noise reduction are included in the facility design. Duke’s estimate of annual operation and maintenance costs for a dry cooling system are reasonable. We disagree, however, with the size of the energy penalty that Duke has calculated and Duke’s suggestion that additional plant capacity would have to be constructed. As a result, because of the lower energy penalty, our net present value for several dry cooling systems is $46 – 137 million compared to Duke’s estimate of $301 million. Our annual amortized cost estimates are in the range of $4 – 12 million, compared to Duke’s estimate of $24 million. The differences in Duke’s and CEC’s operating scenarios clearly have specific cost impacts; i.e., it is significantly more expensive to design for Duke’s criteria of maintaining 1200 MW capacity at all times than designing to maintain an average of 1032 MW capacity throughout the year.
• Duke’s estimates of the capital and operation and maintenance costs of a wet tower system are reasonable. However, we again disagree with the size of the energy penalty and Duke’s suggestion that additional plant capacity would have to be constructed. As a result, because of the lower energy penalty, our net present value for several wet cooling systems using sea water makeup is in the range of $27 - $33 million, compared to Duke’s estimate of $165 million. Our estimated annual amortized costs are in the range of $2 – 3 million, compared to Duke’s estimate of $13 million. These estimates reflect operation with sea water makeup; operation with and without duct firing; design with and without noise reduction technology; and varied energy penalty scenarios.
• Our net present value for a hybrid 60 percent dry/40 percent wet cooling system is $47 - 120 million. Our annual amortized cost estimate is $4 - 11 million. These ranges reflect operation with and without duct firing; design with and without noise reduction technology; and varying determinations of an energy penalty.
• Our estimate of the cost of constructing a 600 foot offshore discharge for the once through system is $7 - 8 million.
• Duke’s implicit estimate of revenue for the Morro Bay facility of $274,000 per MW of generating capacity is reasonable, if the plant is operated as a baseloaded facility. If it is operated as a intermediate load or peak loaded plant, revenue may be lower, in the range of $49,000 to $194,000 per MW of generating capacity.
• The term “wholly disproportionate” as used to weigh costs versus benefits of cooling system alternatives has not been clearly defined by the EPA or caselaw. The Board has considerable discretion in interpreting this term.
• The total cost to retrofit the Morro Bay Power Plant cooling water intake structure with travelling screens is estimated at $7,972,000.

ATTACHMENT 1
EXAMPLES OF SALT WATER COOLING TOWERS INSTALLED/DESIGNED BY MARLEY COOLING TOWER
1
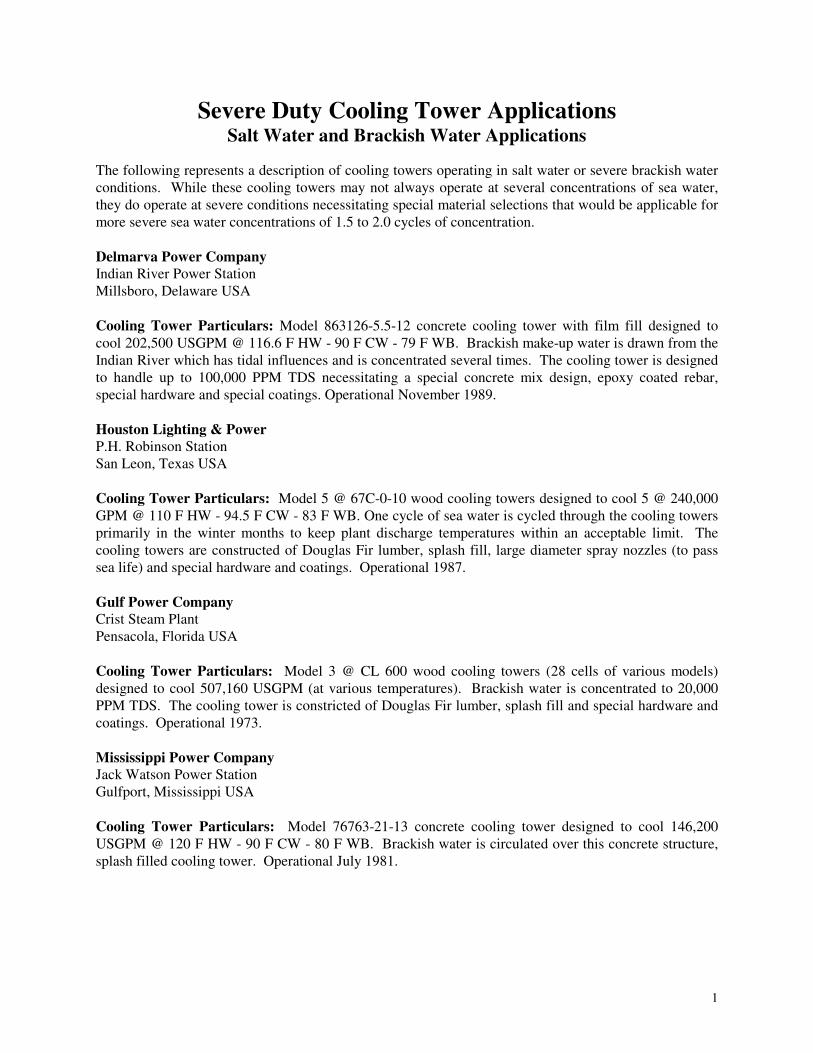
Severe Duty Cooling Tower Applications
Salt Water and Brackish Water Applications The following represents a description of cooling towers operating in salt water or severe brackish water conditions. While these cooling towers may not always operate at several concentrations of sea water, they do operate at severe conditions necessitating special material selections that would be applicable for more severe sea water concentrations of 1.5 to 2.0 cycles of concentration. Delmarva Power Company Indian River Power Station Millsboro, Delaware USA Cooling Tower Particulars: Model 863126-5.5-12 concrete cooling tower with film fill designed to cool 202,500 USGPM @ 116.6 F HW - 90 F CW - 79 F WB. Brackish make-up water is drawn from the Indian River which has tidal influences and is concentrated several times. The cooling tower is designed to handle up to 100,000 PPM TDS necessitating a special concrete mix design, epoxy coated rebar, special hardware and special coatings. Operational November 1989. Houston Lighting & Power P.H. Robinson Station San Leon, Texas USA Cooling Tower Particulars: Model 5 @ 67C-0-10 wood cooling towers designed to cool 5 @ 240,000 GPM @ 110 F HW - 94.5 F CW - 83 F WB. One cycle of sea water is cycled through the cooling towers primarily in the winter months to keep plant discharge temperatures within an acceptable limit. The cooling towers are constructed of Douglas Fir lumber, splash fill, large diameter spray nozzles (to pass sea life) and special hardware and coatings. Operational 1987. Gulf Power Company Crist Steam Plant Pensacola, Florida USA Cooling Tower Particulars: Model 3 @ CL 600 wood cooling towers (28 cells of various models) designed to cool 507,160 USGPM (at various temperatures). Brackish water is concentrated to 20,000 PPM TDS. The cooling tower is constricted of Douglas Fir lumber, splash fill and special hardware and coatings. Operational 1973. Mississippi Power Company Jack Watson Power Station Gulfport, Mississippi USA Cooling Tower Particulars: Model 76763-21-13 concrete cooling tower designed to cool 146,200 USGPM @ 120 F HW - 90 F CW - 80 F WB. Brackish water is circulated over this concrete structure, splash filled cooling tower. Operational July 1981.

2
Additional Information on Salt/Brackish Water Cooling Towers Installed by Marley Cooling Tower
Facility/Unit Flow
(gpm) #. of Fans
Year Installed
Description
Arizona Public Service Palo Verde 1, Arizona
587,000 48
1986 3 units round crossflow, concrete cooling tower, Dimensions: 303' diameter base
Arizona Public Service Palo Verde 2, Arizona
587,000 48 1987 3 units round crossflow, concrete cooling tower, Dimensions: 303' diameter base
Arizona Public Service Palo Verde 3, Arizona
587,000 48 1987 3 units round crossflow, concrete cooling tower, Dimensions: 303' diameter base
Delmarva Power & Light Indian River 4, Delaware
202,500 12 1989 Rectangular counterflow concrete cooling tower
Mississippi Power Company Jack Watson, Mississippi
146,200 13 1975 Round crossflow concrete cooling tower serving a 550 MW Fossil power plant
Mississippi Power Company Jack Watson, Mississippi
25,800 3 NA Round crossflow concrete cooling tower
Orlando Utilities Comm. Stanton Energy 1, Florida
200,000 None 1986 Concrete hyperbolic cooling tower. Natural draft - no fans. 297' diameter base, 425 height
Orlando Utilities Comm. Stanton Energy 2, Florida
200,000 None 1986 Concrete hyperbolic cooling tower. Natural draft - no fans. 297' diameter base, 425 height
Potomac Electric Power Co. Chalk Point 3, Maryland
260,000 None 1975 Concrete hyperbolic cooling tower. Natural draft - no fans. 370' diameter base, 400 height
Potomac Electric Power Co. Chalk Point 4, Maryland
260,000 None 1981 Concrete hyperbolic cooling tower. Natural draft - no fans, 370' diameter base, 400 height
Jeffrey Energy Center 2 Kansas Power & Light, Kansas
166,000 8 NA Round concrete/wood crossflow cooling tower. Mechanical induced draft - 2 units
W.A. Parish Station 7 Houston Lighting & Power Co., Texas
212,410 16 NA Round concrete crossflow cooling tower. Mechanical induced draft
Ottumwa Generating Station Iowa So. Utilities, Iowa,
139,000 8 NA Round concrete/wood crossflow cooling tower. Mechanical induced draft - 2 units
Indian River Plant Delaware Power & Light, Delaware
190,000 13 NA Round concrete crossflow cooling tower. Mechanical induced draft
Fish ENH/Aracdian Trinidad & Tobago
44,300 4 1995 Class 600 Wood crossflow, induced draft
ATTACHMENT 1

ATTACHMENT 2
Detailed Cost Information and Design Assumptions

OPTION #
SYSTEM DESCRIPTION CAPACITY (MW) TOTAL COST ADDITION ($M)
1 WET COOLING TOWERS; SALT WATER APPLICATION; NO NOISE REDUCTION; DUCT FIRING
970 17.1
2 WET COOLING TOWERS; SALT WATER APPLICATION; WITH NOISE REDUCTION; DUCT FIRING
970 17.4
3 WET COOLING TOWERS; SALT WATER APPLICATION; NO NOISE REDUCTION; WITHOUT DUCT FIRING
700 16.3
4 WET COOLING TOWERS; SALT WATER APPLICATION; WITH NOISE REDUCTION; WITHOUT DUCT FIRING
700 16.9
5 DRY COOLING TOWERS; NO NOISE REDUCTION; DUCT FIRING 970 68.2 6 DRY COOLING TOWERS; WITH NOISE REDUCTION; DUCT FIRING 970 86.0 7 DRY COOLING TOWERS; NO NOISE REDUCTION; WITHOUT DUCT FIRING 700 27.3 8 DRY COOLING TOWERS; WITH NOISE REDUCTION; WITHOUT DUCT FIRING 700 35.1 9 HYBRID (WET/DRY); SALT WATER APPLICATION; NO NOISE REDUCTION;
DUCT FIRING 970 62.6
10 HYBRID (WET/DRY); SALT WATER APPLICATION; WITH NOISE REDUCTION; DUCT FIRING
970 82.5
11 HYBRID (WET/DRY); SALT WATER APPLICATION; NO NOISE REDUCTION; WITHOUT DUCT FIRING
710 31.2
12 HYBRID (WET/DRY); SALT WATER APPLICATION; WITH NOISE REDUCTION; WITHOUT DUCT FIRING
710 37.2

ITEM CAPITAL COST ($M)
Option #1 Option #2 Option #3 Option #4 Cooling
Towers Only
Cooling Towers
Only
Cooling Towers
Only
Cooling Towers
Only Cooling Towers (2 Off) 7.7 8.0 8.3 8.9 Cooling Tower Make-up (4 Pumps) and Recirculating Water Pumps (8 Pumps) - Incremental cost over once thru system
1.3 1.3 1 1
Piping for Cooling Tower and Pumphouse
1.9 1.9 1.5 1.5
Cold Water Basin and Recirculating Water Pump Sumps (10 Min. Retention)
4.9 4.9 4.5 4.5
Air-Cooled Steam Condensers (2 off)
N/A N/A N/A N/A
Condensate Pumps 4 Per Condenser
N/A N/A N/A N/A
Foundations for Air-Cooled Steam Condensers
N/A N/A N/A N/A
Electrical Components 1.3 1.3 1 1 Deduction For Once thru System
TOTAL COST ADDITION ($M)
17.1 17.4 16.3 16.9
TOTAL DESIGN CAPAITY (MW) 970 970 700 700 DUCT-FIRED? YES YES NO NO FRESH WATER (FW)/SALT WATER (SW)?
SW SW SW SW
NOISE ABATEMENT? NO YES NO YES COOLING TOWER DATA :(EACH)
- Thermal Duty (MW) 485 485 350 350 - USgpm 165,000 165,000 120,000 120,000
- TempIn/Tempout/Wet Bulb (Deg F) 105/85/70 105/85/70 90/70/58 90/70/58 - Motors (Number @ HP) 10 @ 200 10 @ 200 11 @ 200 11 @ 200
- Size (Length x Width x Height) 541'x60'x47' 541'x60'x47' 595'x55'x50' 595'x55'x50' BASIN SIZE 541' x 66' 541' x 66' 595' x 61' 595' x 61' CONDENSER DATA : (EACH)
- Thermal Duty (MW) N/A N/A N/A N/A - Motors (Number @ HP) N/A N/A N/A N/A
- Size (Length x Width x Height) N/A N/A N/A N/A

ITEM CAPITAL COST
($M)
Option #5 Option #6 Option #7 Option #8 Air-cooled
Condensers Only
Air-cooled Condensers
Only
Air-cooled Condensers
Only
Air-cooled Condensers
Only Cooling Towers (2 Off) Cooling Tower Make-up (4 Pumps) and Recirculating Water Pumps (8 Pumps) - Incremental cost over once thru system
Piping for Cooling Tower and Pumphouse
Cold Water Basin and Recirculating Water Pump Sumps (10 Min. Retention)
Air-Cooled Steam Condensers (2 off) 69.7 87 29.8 37.2 Condensate Pumps 4 Per Condenser 0.2 0.2 0.2 0.2 Foundations for Air-Cooled Steam Condensers
0.5 0.6 0.3 0.5
Electrical Components 2 2.4 1.2 1.4 Deduction For Once thru System -4.2 -4.2 -4.2 -4.2
TOTAL COST ADDITION ($M)
68.2 86 27.3 35.1
TOTAL DESIGN CAPAITY (MW) 970 970 700 700 DUCT-FIRED? YES YES NO NO FRESH WATER (FW)/SALT WATER (SW)?
N/A N/A N/A N/A
NOISE ABATEMENT? NO YES NO YES COOLING TOWER DATA :(EACH)
- Thermal Duty (MW) N/A N/A N/A N/A - USgpm N/A N/A N/A N/A
- TempIn/Tempout/Wet Bulb (Deg F) N/A N/A N/A N/A - Motors (Number @ HP) N/A N/A N/A N/A
- Size (Length x Width x Height) N/A N/A N/A N/A BASIN SIZE N/A N/A N/A N/A CONDENSER DATA : (EACH)
- Thermal Duty (MW) 485 485 350 350 - Motors (Number @ HP) 50 @ 200 60 @ 100 20 @ 200 24 @ 125
- Size (Length x Width x Height) 195'x390'x120' 200'x476'x131' 200'x160'x101' 160'x240'x110'

ITEM CAPITAL COST ($M)
Option #9 Option #10 Option #11 Option #12 Hybrid
System Hybrid System
Hybrid System
Hybrid System
Cooling Towers (2 Off) 1.5 1.6 2 2.1 Cooling Tower Make-up (4 Pumps) and Recirculating Water Pumps (8 Pumps) - Incremental cost over once thru system
0.4 0.4 0.4 0.4
Piping for Cooling Tower and Pumphouse 0.6 0.6 0.7 0.7 Cold Water Basin and Recirculating Water Pump Sumps (10 Min. Retention)
0.4 0.4 0.6 0.6
Air-Cooled Steam Condensers (2 off) 55 74.5 25 30.7 Condensate Pumps 4 Per Condenser 0.15 0.15 0.15 0.15 Foundations for Air-Cooled Steam Condensers
0.8 0.9 0.3 0.4
Electrical Components 3.7 3.9 2 2.1 Deduction For Once thru System
TOTAL COST ADDITION ($M)
62.6 82.5 31.2 37.2
TOTAL DESIGN CAPAITY (MW) 970 970 710 710 DUCT-FIRED? YES YES NO NO FRESH WATER (FW)/SALT WATER (SW)?
SW SW SW SW
NOISE ABATEMENT? NO YES NO YES COOLING TOWER DATA :(EACH)
- Thermal Duty (MW) 75 75 75 75 - USgpm 25,000 25,000 25,000 25,000
- TempIn/Tempout/Wet Bulb (Deg F) 105/85/70 105/85/70 90/70/58 90/70/58 - Motors (Number @ HP) 2 @ 200 2 @ 200 3 @ 200 3 @ 200
- Size (Length x Width x Height) 85'x43'x40' 85'x43'x40' 127'x42'x39' 127'x42'x39' BASIN SIZE 85' x 48' 85' x 48' 127' x 53' 127' x 53' CONDENSER DATA : (EACH)
- Thermal Duty (MW) 410 410 280 280 - Motors (Number @ HP) 40 @ 200 50 @ 100 18 @ 200 20 @ 100
- Size (Length x Width x Height) 205'x328'x117' 202'x404'x125' 226'x113'x97' 200'x160x102'


9
ATTACHMENT 3
Memos of April 30, 2002 from Abt Associates, Inc. to Tetra Tech Inc. Regarding Natural Gas Price Forecasts and Long Term Revenue Projections
for the Morro Bay Power Plant
10
Environmental Research Area Date April 30, 2002 To Ron Rimelman, Tetra Tech From Antje Siems, Michael Fisher, Abt Associates Inc. Subject WA 2-63, Task 1: Assessment of Long-Term Revenue for Morro Bay Power Plant Abt Associates Inc. was tasked to assess the potential long-term revenues for the repowered Morro Bay Power Plant. The estimate was to be provided in terms of revenues per megawatt hour (MW) of capacity. This memorandum summarizes Abt Associates’ findings. The first part presents a brief summary of Duke Energy’s analysis of future revenues as documented in Duke Energy Morro Bay, LLC’s Comments on Draft Appendix A: Morro Bay Power Plant Cooling Options Report (February 15, 2002). The second part presents alternative revenue estimates based on electricity market model forecasts for new and existing California power plants. Projections are provided for a range of capacity utilization rates (i.e., baseload, intermediate load, and peaking plants). The third part presents a comparison of Duke Energy’s estimate and the alternative revenue projections. The final part presents uncertainties surrounding the analysis. 1. Summary of Duke Energy’s Analysis of Future Revenues Abt Associates Inc. reviewed Duke Energy Morro Bay, LLC’s Comments on Draft Appendix A: Morro bay Power Plant Cooling Options Report, dated February 15, 2002. This report does not contain an explicit estimate of likely future revenues for the Morro Bay Power Plant. However, the report contains an implicit revenue projection in the form of estimated annual revenue losses as a result of implementing alternative cooling options (page 47). Using the assumption of the revenue loss estimate, total annual revenues can be derived. Duke Energy uses the following assumptions:
1. The plant will operate 8,000 hours per year. 2. The future wholesale price of electricity is $34.26/MWh.1,2
1 The electricity price is a forecasted national average electricity generation price based on a 1999 U.S. DOE study using the POEMS model. Duke Energy’s report uses a value of $32.50/MWh but does not specify for which year this price was forecasted or if the value was adjusted for inflation. The analysis presented in this memorandum assumes that the price reflects the original 1997 dollars reported by POEMS. Abt Associates adjusted this price to $2001 using the Electric Power Producer Price Index.
2 Using a single price estimate for forecasts over several years assumes that the electricity price will increase at the rate of general inflation.
memorandum
11
Based on these assumptions and the proposed plant capacity of 1,200 MW, total annual revenue from the sale of electricity would be approximately $329 million (1,200 MW * 8,000 hours * $34.26/MWh). Annual revenue per MW of capacity would be $274,000 (8,000 hours * $34.26/MWh). 2. Alternative Revenue Projections In support of the Proposed Phase II Existing Facilities Rule, Abt Associates Inc. assisted the U.S. EPA in developing a base case of future operating conditions in the U.S. electric power market using ICF Consulting’s Integrated Planning Model (IPM®). To assess the revenue value provided by Duke Energy, Abt Associates Inc. used IPM revenue projections for new and existing California power plants from the national rulemaking effort. Revenue estimates for power plants depend on the assumed capacity utilization of the plant’s generating units. In general, generating units can be divided into three types, based on how often they operate: (1) baseload units, (2) intermediate load units, and (3) peaking units. Revenues per MW of capacity for these three generating unit types differ for two reasons, which partially offset each other:
• Generation Effect: The more a unit operates, the more electricity it can sell. Everything else being equal, a baseload unit will sell more electricity and realize higher revenue per MW of capacity than an intermediate load or a peaking unit.
• Price Effect: In deregulated wholesale electricity markets such as in California, electricity prices
vary over time depending on the level of demand for electricity. In general, prices at peak demand times are the highest. Baseload, intermediate load, and peaking units differ not only in how often they operate but also when they operate and the electricity prices received during those operating periods. By definition, baseload units operate almost continuously, while peaking units only operate at times of highest demand (and therefore highest prices). As a result, the average price per MWh sold will generally be higher for peaking units than for intermediate load and baseload units. However, because peaking units operate for fewer hours than intermediate load and baseload units, their average revenue per MW of capacity will generally be substantially less than for a baseload unit.
It is unclear what type of plant the repowered Morro Bay Power Plant will be. Duke Energy’s report assumes 8,000 hours of operation per year at full load, or a capacity utilization rate of 91 percent (8,000 hours / 8,760 hours), which would make it a baseload plant. However, based on conversations with Tetra Tech, we understand that the California Energy Commission believes that Morro Bay may be operated as an intermediate load or even a peaking plant because of the expected additions to capacity coming in California over the next few years. Abt Associates therefore evaluated revenues for several different plant types to provide a range of potential annual revenues per MW of capacity. Table 1 below presents several revenue projections from IPM.3 The table presents information for four years (2008, 2010, 2013, and 2020) and six modeled plant types in the Western Systems Coordinating Council (WSCC). The first type is existing oil/gas capacity, which is projected to repower to combined-cycle capacity. This type would best represent the Morro Bay Power Plant. The second type is projected new (greenfield) combined-cycle capacity. IPM models both repowered and new combined-cycle capacity as baseload capacity. To test the sensitivity of results to capacity utilization assumptions, the table also presents revenue projections for four existing California power plants with different utilization rates: 90% or baseload, 66% or intermediate load/baseload, 39% or intermediate load, and 12% or peaking. 3 Note that revenues projected by the IPM include both energy revenues from the sale of electricity to the grid and capacity revenues, which represent a premium over the electricity price to account for the cost of required reserve margins.

12
Table 1: IPM Projections for Different Types of WSCC and CA Capacity
Year of Forecast
Capacity (MW)
Generation (GWh)
Hours of Operation
Capacity Utilization
Revenue (million $2001)
Revenue per MW ($2001)
(1) Repowered WSCC Combined-Cycle Capacity - Baseload Plant
2008 7,015 55,557 7,920 90% 1,797 256,000
2010 7,015 55,557 7,920 90% 1,649 235,000
2013 7,015 55,557 7,920 90% 1,793 256,000
2020 7,015 55,557 7,920 90% 1,789 255,000
Average 7,015 55,557 7,920 90% 1,757 250,000
(2) New WSCC Combined-Cycle Capacity - Baseload Plant
2008 4,745 37,573 7,918 90% 1,282 270,000
2010 8,117 64,277 7,919 90% 1,933 238,000
2013 14,122 111,820 7,918 90% 3,355 238,000
2020 26,409 208,358 7,890 90% 6,322 239,000
Average 13,348 105,507 7,904 90% 3,223 241,000
(3a) Existing California Plant - Baseload Plant
2008 2,160 16,960 7,852 90% 549 254,000
2010 2,160 16,960 7,852 90% 504 233,000
2013 2,160 16,960 7,852 90% 549 254,000
2020 1,073 8,389 7,818 89% 271 253,000
Average 1,888 14,817 7,847 90% 468 248,000
(3b) Existing California Plant - Intermediate Load/Baseload Plant
2008 1,478 10,031 6,787 77% 332 225,000
2010 1,478 8,804 5,957 68% 266 180,000
2013 1,478 8,804 5,957 68% 301 204,000
2020 1,478 6,621 4,480 51% 249 168,000
Average 1,478 8,565 5,795 66% 287 194,000
(3c) Existing California Plant - Intermediate Load Plant
2008 1,500 6,561 4,374 50% 228 152,000
2010 1,500 6,561 4,374 50% 203 135,000

13
Table 1: IPM Projections for Different Types of WSCC and CA Capacity
Year of Forecast
Capacity (MW)
Generation (GWh)
Hours of Operation
Capacity Utilization
Revenue (million $2001)
Revenue per MW ($2001)
2013 1,500 6,381 4,254 49% 236 157,000
2020 1,500 958 639 7% 79 53,000
Average 1,500 5,115 3,410 39% 187 124,000
(3d) Existing California Plant - Peaking Plant
2008 680 717 1,054 12% 29 43,000
2010 680 717 1,054 12% 21 31,000
2013 680 717 1,054 12% 39 57,000
2020 680 717 1,054 12% 44 65,000
Average 680 717 1,054 12% 33 49,000
Note: Hours of Operation = (GWh of Generation * 1,000) / MW of Capacity. Capacity Utilization = (GWh of Generation * 1,000) / (MW of Capacity * 8,760).
The table shows that the projected revenues per MW of capacity vary significantly with a plant’s capacity utilization rate. The estimated average annual revenue per MW of capacity between 2008 and 2020 range from $49,000 for a peaking plant to $250,000 for a baseload plant. 3. Comparison of Duke Energy’s Revenue Estimate and Alternative Revenue Projections Abt Associates Inc.’s evaluation of projected annual revenues from IPM showed that Duke Energy’s revenue estimate ($274,000/MW) is slightly higher than the modeled revenue estimates for baseload plants ($241,000/MW to $250,000/MW). However, if the Morro Bay Power Plant will not be operated as a baseload plant, IPM results indicate that likely annual revenue will be much lower ($49,000/MW to $194,000/MW). Table 2, following page, summarizes this comparison.
Table 2: Comparison of Duke Energy’s Estimate and Alternative Revenue Projections
Type of Plant Average Capacity Utilization Average Annual Revenue ($2001/MW)
Duke Energy Estimate 91% $274,000
IPM Projections (by Plant Type)
Baseload 90% $246,000
Intermediate Load/Baseload 66% $194,000
Intermediate Load 39% $124,000
Peaking 12% $49,000

14
4. Uncertainties Abt Associates Inc. has had very limited involvement in the permitting process for the Morro Bay Power Plant and was therefore unable to conduct a thorough review of all materials submitted by Duke Energy or other interested parties. The assessment of Duke Energy’s revenue estimate is solely based on Duke Energy Morro Bay, LLC’s Comments on Draft Appendix A: Morro Bay Power Plant Cooling Options Report (February 15, 2002). Any information that may have been provided in other materials was not taken into account in this analysis. The IPM results used in this evaluation are from the analysis conducted for the national cooling water intake structure regulation of Phase II Existing Facilities. This analysis did not take into account future modifications to plants such as Morro Bay. Therefore, Morro Bay in its post-repowering configuration was not explicitly modeled by IPM. The repowered capacity, new capacity, and existing facilities used as a surrogate in this analysis may not match Morro Bay in all specifications. The results presented in the preceding sections should therefore be viewed as approximations rather than specific predictions of future outcomes.

15
Environmental Research Area Date April 30, 2002 To Ron Rimelman, Tetra Tech From Antje Siems, Michael Fisher, Abt Associates Inc. Subject WA 2-63, Task 2: Identify Estimates of Natural Gas Price Forecasts Abt Associates Inc. was tasked to identify natural gas price forecasts in support of the Morro Bay Power Plant permitting process. The future price of natural gas is important to the analysis of energy penalty costs for alternative cooling options. Duke Energy Morro Bay, LLC’s Comments on Draft Appendix A: Morro Bay Power Plant Cooling Options Report (February 15, 2002) presents two alternative gas price estimates, used by Tetra Tech and Duke Energy, respectively. According to this document, Tetra Tech’s analysis uses a wholesale fuel price of $3.50/MMBtu while Duke’s analysis uses an “expected mean fuel price” of $4.23/MMBtu.1 Abt Associates does not have access to Duke Energy’s January 7th report Updated Analysis of Alternative Cooling Systems, which presents Duke’s analysis of natural gas price forecasts. Abt Associates also has not reviewed the assumptions underlying Tetra Tech’s estimate. This memorandum therefore does not comment on either price forecast. Rather, this memorandum provides a range of potential future natural gas prices from three different sources:
• (1) the Department of Energy’s Annual Energy Outlook 2002 – With Projections to 2020 (December 2001, DOE/EIA-0383(2002));
• (2) the California Energy Commission’s 2002 - 2012 Electricity Outlook Report (February 2002,
P700-01-004F); and
• (3) the U.S. EPA’s Documentation of EPA Modeling Applications (V.2.1) Using the Integrated Planning Model (March 2002, EPA 430/R-02-004).
1. Department of Energy: Annual Energy Outlook 2002 The Annual Energy Outlook 2002 (AEO2002) presents forecasts of energy supply, demand, and prices through 2020 prepared by the Energy Information Administration (EIA). The projections are based on results from EIA’s National Energy Modeling System (NEMS), a computer-based model that produces annual projections of energy markets. The AEO2002 reflects data and information available as of July 31, 2001. NEMS divides the natural gas market into nine regions (New England, Middle Atlantic, East North Central, West
1 We assume the “expected mean fuel price” is a simple arithmetic average of projected future values.
memorandum

16
North Central, South Atlantic, East South Central, West South Central, Mountain, and Pacific) and five use sectors (residential, commercial, industrial, transportation, and electric generators). The AEO2002 natural gas price estimates presented in Table 1 at the end of this memo were generated for the reference case of the AEO2002 and represent data for the electric generators sector in the Pacific region.2 For more information on the AEO2002 and the data presented in Table 1, see http://www.eia.doe.gov/oiaf/aeo/index.html and http://www.eia.doe.gov/oiaf/aeo/supplement/index.html. 2. California Energy Commission: 2002 - 2012 Electricity Outlook Report The 2002 - 2012 Electricity Outlook Report assesses California’s electricity system over the next ten years, focusing on supply and demand forecasts, reliability, wholesale spot market and retail prices, demand responsiveness, renewable generation initiatives, and environmental issues. The analyses presented in the report are based on a set of assumptions, including the long-term price of natural gas. The WSCC natural gas market modeled in California Energy Commission’s (CEC) report is divided into 21 hubs. The CEC natural gas price estimates presented in Table 1 at the end of this memo are the annual average natural gas prices projected for the Southern California Gas/San Diego hub. 3. U.S. EPA: Documentation of EPA Modeling Applications (V.2.1) Using the Integrated Planning Model The Integrated Planning Model (IPM®) is an engineering-economic optimization model of the electric power industry, which forecasts least-cost dispatch decisions of electric generating capacity. The U.S. Environmental Protection Agency used IPM to conduct economic and energy analyses in support of the Proposed Phase II Existing Facilities Rule. Natural gas price projections in IPM are based on supply curves derived from the Gas System Analysis Model (GSAM). GSAM is a detailed gas supply model that was originally developed by ICF Consulting, Inc. for the U.S. Department of Energy. The IPM natural gas price estimates presented in Table 1 at the end of this memo present delivered natural gas price forecasts for 2005, 2010, 2015, and 2020.3 Details about GSAM and the assumptions used for the natural gas price projections are available in Appendix 8.1 of the Documentation of EPA Modeling Applications (V.2.1) Using the Integrated Planning Model at http://www.epa.gov/airmarkt/epa-ipm/index.html#documentation. 4. Summary Based on the natural gas price forecasts discussed in this memo and presented in Table 1 below, Abt Associates believes that the price of $3.50/MMBtu, as used in Tetra Tech’s analysis, provides a reasonable estimate of the long-term price of natural gas. The region-specific forecasts by the Department of Energy and the California Energy Commission average $3.56 and $3.63 per million Btu, respectively, while the national forecast from IPM is lower at $2.75 per million Btu.
2 The Pacific region consists of the following five states: Alaska, California, Hawaii, Oregon, and Washington.
3 The prices presented in Table 3 are national average prices. Regional prices were not readily available from the IPM documentation. Abt Associates Inc. adjusted these prices from 1999 to 2000 values using the GDP deflator.

17
Table 1: Comparison of Natural Gas Price Projections ($2000/MMBtu)
Year AEO2002 CEC1 IPM 2002 2.84 2.94 2003 3.13 3.00 2004 3.29 3.06 2005 3.35 3.16 2.82 2006 3.42 3.25 2007 3.43 3.33 2008 3.46 3.41 2009 3.48 3.48 2010 3.53 3.56 2.73 2011 3.59 3.63 2012 3.65 3.70 2013 3.71 3.77 2014 3.74 3.85 2015 3.77 3.93 2.72 2016 3.79 4.01 2017 3.80 4.09 2018 3.84 4.17 2019 3.86 4.25 2020 3.91 4.34 2.71
Average 2002 to 2020 3.56 3.63 2.75 2021 4.43
2022 4.52
2023 4.61
2024 4.70
2025 4.79
2026 4.89
2027 4.99
2028 5.09
2029 5.19
2030 5.29
2031 5.40
1 CEC prices for 2013 to 2031 are extensions of the CEC forecast through 2012, assuming an increase in real terms of 2 percent per year.

18
ATTACHMENT 4
Memo of September 14, 1998
Regarding the Derivation of the ‘Wholly Disproportionate’ Test As a Means of Determining Cost vs Benefits under CWA Regulations

MEMORANDUM Date: 9/14/98 To: Martha Segall From: Peter Sherman Re: Revised Draft, Derivation of “Wholly Disproportionate” Test Re CWA Section 316 Per your request, I have researched the derivation and significance of the phrase “wholly disproportionate” as used to assess the relationship of costs and benefits of CWA regulations. The attached table summarizes the relevant cases identified, including the relevant holding of the case, the specific language used, and a comment regarding relevance to 316(b) proceedings. The following points summarize key findings: � Generally, the phrase “wholly disproportionate” has been used as the cost/benefit standard with
regard to development of effluent limitations guidelines, specifically BPT. Under this test, EPA may not identify a technology as BPT if the costs of imposing the technology are “wholly disproportionate” to the potential effluent reduction benefits.
� The basis for the “wholly disproportionate” standard appears to be the statutory language in
section 304(b)(1)(B), which requires that EPA consider the relationship of the costs of a control technology to its benefits, and the legislative history of the CWA, which states, “The balancing test between total costs and effluent reduction benefits is intended to limit the application of technology only where the additional degree of effluent reduction is wholly out of proportion to the costs of achieving such marginal level of reduction for any class or category of sources.” (See discussion of Assoc. Of Pacific Fisheries v. EPA, and CMA v. EPA, below).
� The “wholly disproportionate” test appears to have been initially applied to section 316
determinations in In the Matter of Public Service Company of New Hampshire 10 ERC 1257 (6/10/77)(The Seabrook II Decision).
� The Seabrook II decision held that 1) a cost/benefit analysis is not required under section 316(b);
2) some consideration should be given to costs in determining the degree of minimization to be required; and 3) it is not reasonable to interpret section 316(b) as requiring the use of technology whose cost is wholly disproportionate to the environmental benefit to be gained.
� In Seabrook II, the only basis identified in the decision for considering costs under section 316(b)
is a reference to a single piece of legislative history, which essentially states that BTA should be interpreted as “best technology available commercially at an economically practicable cost.” The decision acknowledges that the language of section 316 does not mention costs as a factor that must be considered, whereas, the language in section 304 does explicitly require consideration of costs.
� The preamble to the final rule implementing Section 316(b) (41 Fed. Reg. 17387; 4/26/76) states
that neither the statute nor the legislative history requires a formal or informal cost-benefit assessment. However, it also notes that the legislative history suggests that “Best Technology

Available” should not impose “an impracticable and unbearable economic burden on the operation of any plant subject to section 316(b).”
� With regard to application of the “wholly disproportionate” test in 316(b) cases, the following
was identified:
-- Only one federal court (Seabrook V) has considered costs in the context of section 316(b), and that court did not apply the “wholly disproportionate” test but only stated that consideration of cost was an acceptable consideration when determining BTA.
-- In Seabrook II, EPA determined that the construction of an intake structure that cost in
excess of $100 million was not wholly disproportionate to the benefits obtained (no costs of benefits were identified). However, EPA found that the incremental environmental benefit of locating the intake structure 4,000 feet beyond its approved location -- at an additional cost of $20 million -- would impose costs that were wholly disproportionate (the Administrator found that such placement would result in marginal environmental gains and would be both expensive and time consuming). This result was affirmed in Seabrook IV.
-- In Brunswick I, the Regional Administrator examined the cost of installing natural draft
(hyperbolic) cooling towers to determine whether the costs of available BTA options were acceptable under the “wholly disproportionate” test. After finding errors in how the petitioner/appellant calculated costs, the Regional Administrator calculated the marginal increase in residential electricity rates and found the increase in residential rates to average 2.5 percent. The Regional Administrator then concluded that such costs where not “wholly disproportionate” when compared with the 96 percent reduction in environmental impacts estimated to result from retrofitting the plant with BTA. Note, Brunswick I was remanded on procedural grounds, and, ultimately, the case was settled.
-- In In re TVA John Sevier Steam Plant, EPA agreed with TVA that the costs of removing
a closed man-made, low head detention dam (that had formed a cooling water intake pool) were wholly disproportionate to the environmental benefits to be conferred.
-- In In re Florida Power Corp., the EPA Region IV Director concluded that although
closed cycle cooling towers would have reduced entrainment damage by over 85 percent, the costs of such retrofitting, which was $150 million more than FPC’s mitigation proposal, was “wholly disproportionate” to the environmental benefits to be derived. Note that this decision involved comparing the costs of closed cycle towers with FPC’s mitigation plan. The Region IV Director determined that BTA consisted of: four helper cooling towers (estimated cost of $80 million, reduction in flow during key months, and a mitigation project (hatchery).
-- New Jersey issued a CWA permit to Salem Nuclear Generating Station in 1994. Prior to
this, a consultant (Versar) had studied the impacts and options available to the plant and concluded that a closed-cycle cooling system would reduce entrainment and impingement by 95 percent. The study also concluded that the marginal cost increase associated with such a system would be $0.20 per month per ratepayer. The study concluded that such costs were not “wholly disproportionate,” and the draft permit

adopted these findings. The final permit, however, did not require closed-system cooling. Rather, it imposed some technological and mitigative measures. The final permit resulted in two lawsuits, which in turn resulted in a $10.5 million settlement.
Finally, as you requested, I also searched for decisions addressing Brunswick. No decisions were identified that discussed the “wholly disproportionate” cost test.

Table 1. Decisions Addressing “Wholly Disproportionate” Cost Test Case Relevant Holding Reference Comment Rybachek v. EPA, 904 F.2d 1276; 31 ERC 1585 (9th Cir. 1990)
Upholding Placer Mine effluent limitation guidelines.
It is ‘plain, that, as a general rule, EPA is required to consider the costs and benefits of a proposed technology in its inquiry to determine BPT.’ Association of Pacific Fisheries v. EPA, 615 F.2d 794, 805 (9th Cir. 1980) [17 ERC 1425]. The EPA has broad discretion in weighing these competing factors. Id. It may determine that a technology is not BPT on the basis of this cost-benefit analysis only when the costs are ‘wholly disproportionate’ to the potential effluent- reduction benefits. Id. Chemical Mfrs. Ass’n v. EPA, 870 F.2d 177, 205 [29 ERC 1273].
Phrase “wholly disproportionate” used in context of effluent limitation guideline (BPT). Section 316(b) does not contain analogous language (i.e., no mention of balancing costs and benefits).
B&P Exploration and Oil , Inc v. EPA, 66 F.3d 784; 41 ERC 1225 (6th Cir. 1995)
Upholding offshore oil and gas effluent limitation guidelines.
“Consequently, the technology chosen as BCT must pass a two-part ‘cost-reasonableness’ test. API v. EPA, 660 F.2d 954 (4th Cir. 1981). According to the Act, the Administrator shall include in the determination of BCT [a] consideration of the reasonableness of the relationship between the costs of attaining a reduction in effluents and the effluent reduction benefits derived, ...” “Finally, NRDC again misstates EPA’s burden in promulgating the Final Rule by claiming that EPA is required to select reinjection as its BAT technology unless the costs of achieving that technology are ‘wholly disproportionate’ to effluent reduction benefits.”
“Cost-reasonableness” test applies to effluent limitation guideline (BCT). Phrase “wholly disproportionate” used in context of effluent guideline (BPT).
CMA v. EPA, 870 F.2d 177; 29 ERC 1273 (5th Cir. 1989)
Upholding OCPSF effluent limitation guideline (portions remanded for further EPA action remain in effect). Rejecting use of “knee of the curve test” for BPT.
“The statute simply requires that EPA consider ‘the total cost of application of technology in relation to the effluent reduction benefits to be achieved from such application.’ The courts of appeal have consistently held that Congress intended Section 304(b) to give EPA broad discretion in considering the cost of pollution abatement in relation to its benefits and to preclude the EPA from giving the cost of compliance primary importance. ... Senator Muskie, the principal.... stated that: The balancing test ... is intended to limit the application of technology only where the additional degree of effluent reduction is wholly out of proportion to the costs of achieving such marginal level of reduction for any class or category of sources.” “While Congress did not consider costs to be irrelevant to BPT, it clearly intended it to be a less significant factor than in the promulgation of BCT limitations.... The relevant inquiry with respect to BPT, as indicated above, is whether the costs are ‘wholly disproportionate’ to the benefits.”
Phrase “wholly disproportionate” used in context of effluent limitation guideline (BPT).
NRDC v. EPA, 859 F. 2d 156; 28 ERC 1401 (D.C. Cir. 1988)
BPJ conditions remain effective where less stringent effluent limitation guidelines subsequently promulgated.
Footnote 96: “EPA observes that its regulation does provide for equitable considerations.... in two situations: first, ......, and second, where compliance with permit limits would result in costs wholly disproportionate to those considered in the subsequently promulgated effluent limitations guidelines. 40 C.F.R. §§122.44(1)(2)(I), (iv), 122.62(a)(15) (1987).
Text of opinion states that nothing in the opinion interprets or endorses the “totally disproportionate” standard. Note language probably refers to “wholly disproportionate” test.

Assoc. Of Pacific Fisheries v. EPA, 615 F. 2d 794; 17 ERC 1425 (9th Cir. 1980)
Upholding Canned and Preserved Seafood Processing effluent limitations guidelines (portion remanded for further EPA action).
“We think it plain that, as a general rule, the EPA is required to consider the costs and benefits of a proposed technology in its inquiry to determine BPT. The Agency has broad discretion in weighing these factors, however. [cite omitted]. When considering different levels of technology, it must be shown that increased costs are wholly disproportionate to potential effluent reduction before the Agency is permitted to rely on a cost-benefit comparison to select a lower level of technology as the BPT. This conclusion is consistent with the interpretation of section 304(b)(1)(B) given in the Conference Report on the bill which ultimately became the Act. The Report states: The balancing test between total costs and effluent reduction benefits is intended to limit the application of technology only where the additional degree of effluent reduction is wholly out of proportion to the costs of achieving such marginal level of reduction for any class or category of sources.”
Phrase “wholly disproportionate” used in context of effluent limitation guideline (BPT). Cost benefit comparison may not be used to justify a lower level of technology than BPT unless increased costs would be wholly disproportionate to the potential effluent reduction benefits.
Seacoast Anti-Pollution League v. Costle, 597 F.2d 306, 13 ERC 1001 (1st Cir. 1979) (Seabrook V)
Petition for review of EPA granting of thermal discharge permit dismissed. Petition denied.
“The Administrator decided that moving the intake further off-shore might further minimize the entrainment of some plankton, but only slightly, and that the costs would be ‘wholly disproportionate to any environmental benefit’.” “The legislative history [316(b)] clearly makes cost an acceptable consideration in determining whether the intake design ‘reflect[s] the best technology available’.”
Case addresses CWA section 316. Case references Administrator decision, which adopted “wholly disproportionate” language. Legislative history states in relevant part that BTA should be interpreted as “best technology available commercially at an economically practicable cost.”
In the Matter of Public Service Company of New Hampshire 1 E.A.D. 455 (8/4/78) (Seabrook IV)
Reaffirmance of grant of permit to Seabrook.
“I conclude that, based on this record, the costs of any further movement of the intake beyond the presently proposed far site location would be wholly disproportionate to any environmental benefit.”
Case addresses CWA section 316.

In the Matter of Public Service Company of New Hampshire 10 ERC 1257 (6/10/77) (Seabrook II)
Petition for review by Administrator of Regional Administrator’s revocation of his original approval of once-through cooling for proposed Seabrook nuclear power plant. Initial decision reversed, permit granted.
“I believe ... that the Agency’s position, that cost benefit analysis is not required under Section 316(b), is correct. Section 316(b) provides flatly that cooling water intakes shall ‘reflect the best technology available for minimizing adverse environmental impact’. Unlike Sections 301 and 304, Section 316(b) determines what the benefits to be achieved are and direct the Agency to require use of ‘best technology available’ to achieve them. There is nothing in Section 316(b) indicating that a cost benefit analysis should be done, whereas, with [BCT] and [BAT] Congress added express qualifiers to the law indicating a requirement for cost/benefit analysis. Indeed, except for one bit of legislative history[], there would be no indication that Congress intended costs to be considered under Section 316(b) at all. I find, therefore, that insofar as the RA’s decision may have implied the requirement of a cost/benefit analysis under Section 316(b), it was incorrect. However, the RA may have meant only that some consideration ought to be given to costs in determining the degree of minimization to be required. I agree that this is so ...... I do not believe that it is reasonable to interpret Section 316(b) as requiring the use of technology whose cost is wholly disproportionate to the environmental benefit to be gained.”
Case addresses CWA section 316. Holds that cost/benefit analysis is not required under section 316(b). However, states that some consideration must be given to costs in determining the degree of minimization required. Adopts “wholly disproportionate” test. Note: This decision appears to be the source of the “wholly disproportionate” language as applied to section 316. EPA General Counsel Opinion 63 states: “However, the Administrator has determined that this [316(b)] standard must be tempered by economic considerations. Thus, in his decision In the Matter of Public Service Co. Of New Hampshire (the Seabrook Decision), the Administrator stated: [citing last sentence of quote referenced to left]. The GCO added that “It must be stressed, however, that this test is a limited one, for the Administrator in the same decision rejected the notion that a full cost/benefit analysis is required under Section 316(b).” This is further confirmed in The Quick and the Dead: Fish Entrainment, Entrapment, and Application of Section 316(b) of the Clean Water Act, Vermont Law Review, Vol. 20, No. 2, Winter 1995. P.402.
Related Documents


