VILNIUS GEDIMINAS TECHNICAL UNIVERSITY Kristina RAZMINIENĖ EVALUATION OF CLUSTER PERFORMANCE IN TRANSITION TO CIRCULAR ECONOMY DOCTORAL DISSERTATION SOCIAL SCIENCES, ECONOMICS (S 004) Vilnius, 2021

Welcome message from author
This document is posted to help you gain knowledge. Please leave a comment to let me know what you think about it! Share it to your friends and learn new things together.
Transcript

VILNIUS GEDIMINAS TECHNICAL UNIVERSITY
Kristina RAZMINIENĖ
EVALUATION OF CLUSTER PERFORMANCE IN TRANSITION TO CIRCULAR ECONOMY
DOCTORAL DISSERTATION
SOCIAL SCIENCES, ECONOMICS (S 004)
Vilnius, 2021

Doctoral dissertation was prepared at Vilnius Gediminas Technical University in
2016–2021.
Supervisor
Prof. Dr Manuela TVARONAVIČIENĖ (Vilnius Gediminas Technical
University, Economics – S 004).
The Dissertation Defense Council of Scientific Field of Economics of Vilnius
Gediminas Technical University:
Chairman
Prof. Dr Jelena STANKEVIČIENĖ (Vilnius Gediminas Technical University,
Economics – S 004).
Members:
Prof. Dr Daiva JUREVIČIENĖ (Vilnius Gediminas Technical University,
Economics – S 004),
Assoc. Prof. Dr Algita MIEČINSKIENĖ (Vilnius Gediminas Technical
University, Economics – S 004),
Dr Inga MINELGAITĖ (University of Iceland, Management – S 003),
Assoc. Prof. Dr Vaida PILINKIENĖ (Kaunas University of Technology,
Economics – S 004).
The dissertation will be defended at the public meeting of the Dissertation Defense
Council of Economics in the Senate Hall of Vilnius Gediminas Technical University at
10 a. m. on 20 May 2021.
Address: Saulėtekio al. 11, LT-10223 Vilnius, Lithuania.
Tel.: +370 5 274 4956; fax +370 5 270 0112; e-mail: [email protected]
A notification on the intend defending of the dissertation was send on 19 April 2021.
A copy of the doctoral dissertation is available for review at Vilnius Gediminas Technical
University repository http://dspace.vgtu.lt, at the library of Vilnius Gediminas Technical
University (Saulėtekio al. 14, LT-10223 Vilnius, Lithuania) and at the library of the
Lithuanian Center of Social Sciences (A. Goštauto st. 9, LT-01108 Vilnius, Lithuania).
Vilnius Gediminas Technical University scientific book No. 2021-009-M
doi: 10.20334/2021-009-M
© Vilniaus Gedimino technikos universitetas, 2021
© Kristina Razminienė, 2021

VILNIAUS GEDIMINO TECHNIKOS UNIVERSITETAS
Kristina RAZMINIENĖ
KLASTERIŲ VEIKLOS VERTINIMAS PEREINANT PRIE ŽIEDINĖS EKONOMIKOS
DAKTARO DISERTACIJA
SOCIALINIAI MOKSLAI, EKONOMIKA (S 004)
Vilnius, 2021

Disertacija rengta 2016–2021 metais Vilniaus Gedimino technikos universitete.
Vadovas
prof. dr. Manuela TVARONAVIČIENĖ (Vilniaus Gedimino technikos
universitetas, ekonomika – S 004).
Vilniaus Gedimino technikos universiteto Ekonomikos mokslo krypties disertacijos
gynimo taryba:
Pirmininkas
prof. dr. Jelena STANKEVIČIENĖ (Vilniaus Gedimino technikos universitetas,
ekonomika – S 004).
Nariai:
prof. dr. Daiva JUREVIČIENĖ (Vilniaus Gedimino technikos universitetas,
ekonomika – S 004),
doc. dr. Algita MIEČINSKIENĖ (Vilniaus Gedimino technikos universitetas,
ekonomika – S 004),
dr. Inga MINELGAITĖ (Islandijos universitetas, vadyba – S 003),
doc. dr. Vaida PILINKIENĖ (Kauno technologijos universitetas,
ekonomika – S 004).
Disertacija bus ginama viešame Ekonomikos mokslo krypties disertacijos gynimo
tarybos posėdyje 2021 m. gegužės 20 d. 10 val. Vilniaus Gedimino technikos
universiteto senato posėdžių salėje.
Adresas: Saulėtekio al. 11, LT-10223 Vilnius, Lietuva.
Tel.: (8 5) 274 4956; faksas (8 5) 270 0112; el. paštas [email protected]
Pranešimai apie numatomą ginti disertaciją išsiųsti 2021 m. balandžio 19 d.
Disertaciją galima peržiūrėti Vilniaus Gedimino technikos universiteto talpykloje
http://dspace.vgtu.lt ir Vilniaus Gedimino technikos universiteto bibliotekoje
(Saulėtekio al. 14, LT-10223 Vilnius, Lietuva) ir Lietuvos socialinių mokslų centro
bibliotekoje (Goštauto g. 9, LT-01108 Vilnius, Lietuva).

v
Abstract
Clusters have an impact on regional development for they unite small and medium
enterprises (SMEs), science and research institutions, higher education institu-
tions, non-governmental organizations (NGOs), and other entities which aim at
increasing competitiveness through cooperation, science, and business partner-
ship, joint research and development (R&D) activities and innovation. Circular
economy (CE) gains its popularity for this approach encourages focusing on re-
source efficiency, doing less damage to the environment, economy, and society.
Hence, CE can add to the competitive advantage in clusters’ development. The
dissertation analyses Lithuanian clusters’ performance evaluation problems and
transitions to a more resource-efficient and sustainable development through CE.
The object of the dissertation is clusters’ performance evaluation including the
transition to CE.
The literature analyses of clusters and CE were performed, which forms the
basis of clusters’ performance in transition to CE evaluation tool formulation,
which would enable to improve clusters’ performance and gain a competitive ad-
vantage in the future. The proposed tool is designed to assess a cluster’s perfor-
mance with integrated measures that indicate the CE transition. This tool would
allow the recognition of resource-efficient and sustainable development of exist-
ing clusters.
The dissertation aims to analyze the theoretic approaches towards clusters
and CE for the tool of clusters’ performance evaluation in transition towards CE,
which could be proposed based on the literature and empirically tested on
Lithuanian clusters’ case.
A sequence of tasks solution is followed in the thesis: to review the existing
literature on clusters and CE by presenting the concept and available approaches;
to select indicators based on literature analysis that reflect clusters’ performance
and make a system, suitable for evaluation; to propose a transition to CE
evaluation system with reasonable indicators that are recognizable internationally;
to develop an original clusters’ performance evaluation tool that would include
measures indicating the transition to CE; to verify the suitability of the proposed
clusters’ performance in transition to CE evaluation tool in Lithuanian clusters
working in different sectors, to propose the conception of a database covering the
clusters’ performance and CE indicators.
vi
Reziumė
Klasteriai vienija mažas ir vidutines įmones (MVĮ), mokslo ir tyrimų centrus,
aukštojo mokslo institucijas, nevyriausybines organizacijas (NVO) ir kitus
subjektus, kurių tikslas – padidinti konkurencingumą bendradarbiaujant mokslo ir
partnerystės pagrindu, bendra mokslinių tyrimų ir eksperimentinės plėtros
(MTEP) veikla ir inovacijų taikymu. Žiedinė ekonomika (toliau – ŽE) populiarėja,
nes šis požiūris skatina sutelkti dėmesį į išteklių efektyvų naudojimą, naudingesnį
aplinkai, ekonomikai ir visuomenei. Taigi, ŽE gali prisidėti prie konkurencinio
pranašumo plėtojant klasterius. Disertacijoje analizuojamos Lietuvos klasterių
veiklos vertinimo problemos ir perėjimas prie naudingesnio išteklių naudojimo ir
tvaraus vystymosi per ŽE. Disertacinio tyrimo objektas yra klasterių veikla
pereinant prie žiedinės ekonomikos.
Atlikus klasterių ir ŽE literatūros analizę, buvo suformuluotas klasterių
veiklos vertinimo pereinant prie ŽE modelis, kuriuo remiantis galima pagerinti
klasterių veiklą ir įgyti konkurencinį pranašumą. Siūlomas modelis skirtas
įvertinti klasterio veiklą ir nustatyti perėjimą prie ŽE naudojant integruotas
priemones. Šis modelis leis atpažinti efektyvų išteklių naudojimą ir tvarų esamų
klasterių vystymąsi.
Disertacija siekiama išanalizuoti teorinius požiūrius į klasterius ir ŽE,
pasiūlyti literatūros analize paremtą klasterių veiklos vertinimo pereinant prie ŽE
modelį ir empiriškai jį išbandyti Lietuvos klasterių atveju.
Darbe laikomasi užduočių sprendimo sekos: atlikus mokslinės literatūros
analizę, susisteminti klasterių ir ŽE koncepcijas; remiantis literatūros analize
nustatyti klasterių veiklą nusakančius rodiklius ir sudaryti vertinimui tinkamą
sistemą; pasiūlyti tarptautiniu mastu naudojamus rodiklius apimančią perėjimo
prie ŽE vertinimo sistemą; sudaryti klasterių veiklos vertinimo pereinant prie
žiedinės ekonomikos modelį; patikrinti pasiūlyto klasterių vertinimo pereinant
prie žiedinės ekonomikos modelio pritaikomumą Lietuvoje skirtinguose
sektoriuose veikiančiuose klasteriuose; pasiūlyti klasterių veiklą pereinant prie ŽE
nusakančių rodiklių duomenų bazės koncepciją.

vii
Notations
Abbreviations
CE – Circular Economy
HEI – higher education institution
IA – individual activity
Ltd – private company limited by shares
MITA – Agency for Science, Innovation, and Technology
MNEs– Multinational enterprise
NPO – non-profit organization
Plc – public limited company
R&D – Research and Development
SAW – Simple Additive Weighting Method
SMEs – Small and Medium Enterprises
TOPSIS – Technique for Order of Preference by Similarity to Ideal Solution


ix
Contents
INTRODUCTION ............................................................................................................ 1
Problem Formulation ................................................................................................... 1
Relevance of the Thesis ............................................................................................... 2
Object of the Research ................................................................................................ 2
Aim of the Thesis ........................................................................................................ 2
Tasks of the Thesis ...................................................................................................... 2
Research Methodology ................................................................................................ 3
Scientific Novelty of the Thesis .................................................................................. 3
Practical Value of the Research Findings .................................................................... 4
The Defended Statements ............................................................................................ 4
Approval of the Research Findings ............................................................................. 5
Structure of the Dissertation ........................................................................................ 5
1. THEORETICAL INSIGHTS INTO CLUSTERS AND CIRCULAR ECONOMY:
THE MAIN CONCEPTS ............................................................................................ 7
1.1. Analysis of the Cluster Concept through the Ambiguity of Cluster Definition .... 8
1.2. Analysis of Indicators Related to Cluster Performance Evaluation ................... 19
1.3. Literature Analysis Concerning Sectors in which Clusters Operate ................... 31
1.4. Theoretical Overview of the Importance of Transition to Circular Economy .... 33
1.5. Review of Methodology Used in Cluster Performance Analysis and
Transition to Circular Economy ........................................................................ 47
1.6. Conclusions of Chapter 1 and Formulation of the Tasks of the Thesis .............. 51

x
2. METHODOLOGY OF EVALUATION TOOL FOR CLUSTER PERFORMANCE
IN TRANSITION TO CIRCULAR ECONOMY ...................................................... 53
2.1. Formation of Evaluation Tool for Cluster Performance in Transition to
Circular Economy ............................................................................................. 54
2.2. Selected Indicators for Evaluation of Cluster Competitiveness through
Circular Economy ............................................................................................. 56
2.3. Selected Methods for Evaluating Cluster Performance in Transition
to Circular Economy and their Relationship ..................................................... 65
2.4. Proposed Methodology for Evaluation of Cluster Performance in Transition
to Circular Economy ......................................................................................... 71
2.5. Conclusions of Chapter 2 ................................................................................... 73
3. EVALUATION OF CLUSTER PERFORMANCE IN TRANSITION TO
CIRCULAR ECONOMY: THE CASE OF LITHUANIA ......................................... 75
3.1. Case Analysis: Lithuanian Clusters Overview and Clusters Map ...................... 76
3.2. Evaluation Process and Results of Cluster Performance in Transition to
Circular Economy ........................................................................................... 111
3.3. Overview of Obtained Results .......................................................................... 122
3.4. Conclusions of Chapter 3 ................................................................................. 123
GENERAL CONCLUSIONS ....................................................................................... 125
REFERENCES ............................................................................................................. 127
LIST OF SCIENTIFIC PUBLICATIONS BY THE AUTHOR ON THE TOPIC
OF THE DISSERTATION ..................................................................................... 143
SUMMARY IN LITHUANIAN ................................................................................... 145
ANNEXES1 .................................................................................................................. 159
Annex A. The Process of TOPSIS Application ....................................................... 161
Annex B. Map Legend. ........................................................................................... 163
Annex C. Questionnaire for Cluster Coordinators .................................................. 166
Annex D. Questionnaire for Experts ....................................................................... 169
Annex E. Declaration of Academic Integrity .......................................................... 172
Annex F. The Co-authors’ Agreements to Present Publications for the
Dissertation Defence ....................................................................................... 173
Annex G. Copies of Scientific Publications by the Author on the Topic of the
Dissertation ..................................................................................................... 175
1The annexes are supplied in the enclosed compact disc.
1
Introduction
Problem Formulation
In Lithuania, the attention was drawn to the importance of clusters in
promoting the competitiveness of small and medium-sized enterprises (SMEs).
The Lithuanian cluster network faces challenges and is encouraged to prioritize
the same areas as the European Union (EU): digitalisation, circular economy (CE)
and biodiversity, value chains (Von Der Leyen, n.d.). Agency for Science,
Innovation and Technology (MITA) is implementing a project meant for
promotion and development of clusters. The total project budget (EUR 2,4 mil-
lion) is intended for the establishment of clusters, their maturation, financing, part-
ner search and other issues.
According to Eurostat (2019), the circularity rate of the EU (27) in 2019 was
only 11,9 percent. The indicator is still low but it has grown by 0,8 percentage
points from the 2014 EU average. Meanwhile, in Lithuania, circularity in 2019
reached only 4 percent and has decreased by 0.6 percentage points since 2016.
The European Commission has proposed a European Green Deal (“A European
Green Deal | European Commission,” n.d.) to achieve a sustainable EU economy
with an action plan aiming at promotion of resource efficiency and reducing
pollution.

2 INTRODUCTION
Relevance of the Thesis
Interest in clusters has grown since Marshall (1920) first described industrial dis-
tricts as a socio-economic notion, where geographic location is essential for
growth, competitiveness, and agglomeration patterns in regions. The necessity of
cluster performance evaluation is captured to identify weaknesses and strengths
for further developing and improving a cluster. Clusters may foster the transition
to CE to a greater extent, for SMEs generally do not have the capacity to apply
innovative solutions at their own expense. The transition to CE can be seen as a
competitive advantage for the companies belonging to the cluster. Hence, the need
to develop a cluster performance evaluation tool that allows assessment of clus-
ters’ contribution to the transition to CE is identified.
Object of the Research
The object of the research is cluster performance, including the transition to CE.
Aim of the Thesis
The thesis’ aim is to prepare a cluster performance evaluation tool that assesses
clusters’ contribution to the transition to CE.
Tasks of the Thesis
In order to achieve the goal of the thesis, the following problems had to be solved:
1. To review the existing literature on clusters and CE by presenting the
concept and available approaches.
2. To select indicators based on literature analysis that reflect clusters’
performance and make a system suitable for cluster performance
evaluation.
3. To propose a transition to a CE evaluation system with reasonable
indicators that are recognizable internationally.
4. To develop a methodology that allows the assessment of cluster
performance in transition to CE.
5. To verify the suitability of the proposed cluster performance in
transition to CE evaluation tool by carrying out an embedded case

INTRODUCTION 3
study in Lithuanian clusters with the application of MCDM methods
(SAW, TOPSIS) and correlation – regression analysis.
6. To propose the conception of a database covering clusters’
performance and CE indicators.
Research Methodology
Several research methods were used to develop the strategy for finding a solution
to the set tasks of the thesis and to reveal the problems in cluster performance
evaluation including the transition to CE. The initial phase of the thesis prepara-
tion involved a literature analysis to clarify the definition of a cluster, define the
research object, and form a system of indicators for the evaluation of clusters’
performance in transition to CE suitable for the application of MCDM methods.
A systematic approach was employed to relate the literature analysis and the em-
pirical part of the study, where qualitative and quantitative analysis methods were
employed. A multiple-case study was applied to selected clusters to examine them
without influencing the environment. Some of the data on restricted access were
obtained through interviews and questionnaires to the clusters’ coordinators; oth-
ers were collected through a database search. MCDM methods (multi-criteria
evaluation, experts’ evaluation, SAW, TOPSIS) were used for assessment of the
clusters. Correlation – regression analysis was employed to detect the degree of
association between quantitative variables.
Scientific Novelty of the Thesis
The aspects of scientific novelty on cluster performance in transition to a CE eval-
uation are as follows:
1. The concept of a cluster is clarified. It relies on companies and associ-
ated institutions supplementing others by completing vertical (buying
and selling chains) and horizontal links (complementary products and
services, the use of similar specialized inputs, technologies or institu-
tions, and other linkages) using geographical proximity to achieve com-
petitive advantage through cooperation.
2. Two new systems of indicators are proposed, needed for cluster perfor-
mance monitoring and the transition of a cluster to a CE. The indicators
are selected to cover different cluster performance components: inter-
communication, financial resources, human resources, marketing activ-
ities, and a set of criteria that show the transition to a CE. These two

4 INTRODUCTION
systems can be used independently when either clusters’ performance or
the transition of a cluster to a CE needs to be monitored. They allow data
collection, comparison over a period of time, and supervision.
3. The clusters performance in transition to CE evaluation tool is proposed
and tested in selected Lithuanian clusters. The tool combines the two
systems of indicators and employs MCDM methods and correlation –
regression analysis that allow the evaluation of cluster performance in
transition to CE. The tool employs universal indicators and can be
adopted in other countries. Clusters can be identified as accelerators of
the CE and the efficient use of resources, as the results suggest.
Practical Value of the Research Findings
Two new systems of indicators needed for monitoring clusters’ performance and
the transition of a cluster to a CE can be used by clusters’ managers and coordi-
nators for further cluster development. A systemized view may help to follow the
selected data and make recommendations on further improvements.
The tool that allows evaluation of clusters’ performance and clusters’ contri-
bution to the transition to CE is an essential means for the authorities at different
levels of governance – city level, regional, national and European – to initiate
support for further development of existing clusters through funding opportuni-
ties.
The Defended Statements
The following statements based on the present investigation results may serve as
the official hypotheses to be defended.
1. A set of indicators is recommended to monitor clusters’ performance
(covering intercommunication, marketing activities, human resources
and financial resources).
2. A set of indicators characterizing the transition of a cluster towards a
CE is suggested (such as the generation of municipal and other waste,
and trade in recyclable or reusable raw materials by importing,
exporting, or trading between cluster members).
3. A cluster performance in transition to CE evaluation tool based on
SAW and TOPSIS methods and assessing their relationship can be
used by clusters in transition to CE.

INTRODUCTION 5
Approval of the Research Findings
Ten scientific articles have been published on the topic of the dissertation. Five
publications were published in scientific journals included in the Web of Science
(Claritive Analytics) Emerging Sources Citation Index and five articles were pub-
lished in peer-reviewed international conference materials.
The author has made seven presentations at seven international and national
scientific conferences.
− 10th International Conference on applied economics Contemporary is-
sues in economy June 27–28, 2019, Torun, Poland.
− 6th International Scientific Conference Contemporary issues in business,
management and economics engineering (CIBMEE-2019) May 9–10,
2019, Vilnius.
− 10th International Scientific Conference Business and Management 2018
May 3–4, 2018, Vilnius.
− 6th International Conference Management, Engineering, Science & Tech-
nology 2017 and 3rd International Research Conference Science, Tech-
nology and Management 2017 November 1–2, 2017, Dubai, UAE.
− 3rd International Conference Lifelong Education and Leadership for All-
ICLEL 2017 September 12–14, 2017, Porto, Portugal.
− 5th International Scientific Conference Contemporary Issues in Business,
Management and Education May 11–12, 2017, Vilnius.
− Summer School and Conference September 5–7, 2016, Vilnius.
Two research internships were completed during the doctoral studies:
− 2017–2018: The Academy of Research and Technology (ASRT), Cairo,
Egypt.
− 2017: Sidi Mohamed Ben Abdellah University (USMBA), Fez, Morocco.
Structure of the Dissertation
The dissertation is structured to include the introduction, three main chapters, gen-
eral conclusions, an extensive list of references, a list of the author’s publications
on the topic of the dissertation, and 6 annexes. The total scope of the work is 158
pages, excluding appendices, with 10 numbered formulas, 48 figures, 21 table and
198 references.

6 INTRODUCTION
Case analysis: Lithuanian Clusters’
Overview and Clusters’ Map
Evaluation Process and Results of Clusters’
Performance and Transition to Circular
Economy
The Overview of Obtained Results
Case analysis: Lithuanian Clusters
Overview and Clusters Map
Evaluation Process and Results of Cluster
Performance inTransition to CE
Overview of Obtained Results
Analysis of the Cluster
Concept through the Ambiguity of Cluster Definition
The Analysis of Indicators
Related to Cluster
Performance Evaluation
Literature Analysis
Concerning Sectors in
which Clusters Operate
Theoretical Overview of
the Importance
of Transition to CE
Review of Methodology
Used in Cluster
Performance Analysis and the Trasition
to CE
Formation of Evaluation Tool
for Cluster Performance in
Transition to CE
Selected Indicators for Evaluation of
Cluster Competitiveness
through CE
Selected Methods for Evaluating
Cluster Performance in
Transition to CE and their
Relationship
Proposed Methodology for
Evaluation of Cluster
Performance inTransition to CE
THEORETICAL INSIGHTS INTO CLUSTERS AND CE: THE MAIN CONCEPTS
Conclusions of Chapter 1 and Formulation of the Tasks of the Thesis
METHODOLOGY OF EVALUATION TOOL OF CLUSTER PERFORMANCE IN TRANSITION TO CE
Conclusions of Chapter 2
GENERAL CONCLUSIONS
Concluding Remarks of Chapter 3
EVALUATION OF CLUSTER PERFORMANCE IN TRANSITION TO CE: THE CASE OF
LITHUANIA
Fig. 0.1. Structure of the dissertation (Source: composed by the author)
7
1 Theoretical Insights into Clusters and Circular Economy: The Main
Concepts
This chapter aims to identify the indicators used by scholars for cluster perfor-
mance, efficiency, or competitiveness assessment; to indicate the cluster develop-
ment measures suggested by governmental institutions; to specify analysed sec-
tors; and to describe CE. It also aims to show how clusters might be affected when
shifting to a CE and to select the methods.
This chapter concludes by formulating the main objective and tasks of the
present investigation. The author published three articles related to this chapter
(Razminienė & Tvaronavičienė, 2017a, Razminienė & Tvaronaviciene, 2017b,
Razminienė & Tvaronaviciene, 2018a).

8 1. THEORETICAL INSIGHTS INTO CLUSTERS AND CIRCULAR ECONOMY…
1.1. Analysis of the Cluster Concept through the Ambiguity of Cluster Definition
According to Karaev, Koh, and Szamosi (2007), clusters are an essential instru-
ment for improving SMEs’ productivity, innovativeness and overall competitive-
ness by overcoming their size limitations. Although many studies are conducted
in different countries, a common understanding of the cluster concept has not yet
been accepted. One of the most prominent authorities in this field is Porter, who
claims that national clusters are formed by companies and industries linked
through vertical (buyer/supplier) and horizontal (joint customers, technology, and
other) relationships with the leading players located in a single nation/state
(Porter, 1990). Later, Porter (1998) supplemented this definition, adding institu-
tions (formal organizations) such as universities. A country’s ability to form an
industrial cluster can be related to its international competitive advantage. Re-
duced input costs for manufacturers, development of standard suppliers, training
of professional labour, and a technical knowledge spillover effect can be achieved
through the formation of clustering (Hsu, Lai, & Lin, 2014). A cluster’s effective-
ness is thought to be increased by facilitating the transmission of knowledge and
institutions’ development, which can be achieved through geographical proxim-
ity. Another essential feature that is stressed by Porter (1998) is encouraging in-
novation through an enhanced division of labour among companies with physical
proximity among numerous competing producers.
The importance of reference to an earlier cluster concept formation is deter-
mined by Akoorie (2011). The work of the English economist Alfred Marshall
should be mentioned when analysing industrial districts and industrial clusters.
Marshall described a model for contemporary technological parks more than 100
years ago and called them industrial districts. Later analyses by other authors were
based on Marshall’s description while adapting it to develop a comparative model
applicable to other industrial districts.
The term ‘neo-Marshallian industry district’ describes the industrial world as
a community where information is shared through visible learning colleges. The
cluster concept was not present in the writings of Marshall. He emphasized
commercial, social and technical agreements uniting entrepreneurs even with their
rivals, presenting innovations to offer both incentives and information through
newly formed industrial districts of the Victorian period.
The concept of industrial districts comprises three main features (Marshall,
1920). The first is that a geographically concentrated industry supports specialized
providers of inputs. The second feature addresses the concentration of workers of
the same type and offers labour market pooling. The third highlights geographical
proximity, which is responsible for the spread of information. Emphasis is put on
knowledge and organization being the driving principles as a mutually beneficial

1. THEORETICAL INSIGHTS INTO CLUSTERS AND CIRCULAR ECONOMY… 9
relationship is produced between the creation of new information and
organizational improvement of related companies in the industrial environment.
The cluster concept includes the ideas declared in Marshall’s work (Marshall,
1920). The industrial cluster concept, as described by Porter, covers not only a
relationship between companies for information sharing and organizational
improvement but also the innovation-based economy, which is the result of
geographically bounded concentrations of interdependent companies with
specific forms of governance based on social relations, trust, and sharing of
resources. Every industrial cluster is unique, having its development path and
shared ideas. Non-market relations are the primary means to keep industrial
districts together, while in the industrial cluster, national, regional and civil
governments play an essential role in creating infrastructure and supporting
companies’ development. Physical structures refer to facilities such as transport,
utilities, and waste disposal, while social structures are secondary and tertiary
educational institutions, industry training organizations, local sources of business
and technology advice, and professional and trade associations. The main
characteristic feature of an industrial district and industrial cluster is the existence
of cooperative and competitive forms of industrial organization in proximate
geographical space.
The cluster phenomenon has gained importance mainly because of cluster
benefits or externalities, as reflected in Porter's (1998) ideas. Clusters affect
competition in three broad ways: first, by increasing the productivity of companies
based in the area; second, by driving the direction and pace of innovation, which
underpins future productivity growth; and third, by stimulating the formation of
new business, which expands and strengthens the cluster itself. A cluster allows
each member to benefit as if it had a grander scale or joined with others formally
– without requiring it to sacrifice its flexibility (Porter, 1998).
Connell and Voola (2013) assume that the need to have an economic
development policy arises from the network development of complementary and
competitive companies present in every country, region or city. Clusters, usually
created with a political incentive after the global economic crisis, show that
economies must be diversified and include innovative jobs. A dual purpose of
industry clusters can be specified: firstly, clusters enable SMEs to take advantage
of the competitiveness created by business cooperation and agglomeration;
secondly, they are encouraged in order to build or revitalize certain targeted
regions. Stable clusters create opportunities for member companies, especially
SMEs, not to compete internationally under growing pressure.
The stage along the value chain (e.g. logistics, media, or marketing) or focus
on selected customer needs or market segments (e.g. health, information
technology, financial services, or education) can help differentiate an industry
cluster by specialization. Companies that are members of clusters may gain some
10 1. THEORETICAL INSIGHTS INTO CLUSTERS AND CIRCULAR ECONOMY…
additional advantages through the nature of their products or services, the
resources that they use, the suppliers, or the employees and their skills. A cluster
may include related collaborators and service providers such as universities,
professional associations, official agencies, training companies or customers.
Interconnectedness or linkages between different actors are characteristic of
a cluster, enabling the creation of value and improvement of companies’
competitive advantage as they can leverage the potential strengths of the group
and exploit agglomeration economies. These agglomeration economies or spatial
externalities help the companies in clusters to foster a competitive advantage.
Clusters’ idea to move from closed to more open innovation behaviours is
understood beneficial when clusters encourage more cooperative exchanges
between member companies.
Initiatives supported by international organizations reflect the recognition of
the role that clusters can play in regional development (Engel, Berbegal-Mirabent,
& Piqué, 2018). Potential long-time success is a driving force that encourages the
establishment of assistance and support in different regions. Policymakers’ and
other agents’ aim is to build on resources inherited by regions to create
differentiated and distinctive economic activity areas instead of just picking
winning clusters. Individual companies get less attention as growing clusters of
companies show more potential, as this is seen as less costly in terms of resources,
less distorting than company-specific approaches, and more targeted than
economy-wide measures. National governments’ promotion of clusters has been
seen in many countries over the past two decades.
Zelbst, Frazier, and Sower (2010) consider an organization’s most costly
strategic decision to be the location decision. This decision can also be the primary
strategic advantage. There are several components which can add to competitive
advantage through location decisions made by organizations in competitive
economies. These components are the transfer of knowledge and innovation
specialization (McCann & Folta, 2008) and complementarities (co-
agglomeration). Competing companies may consider choosing the same location
for their business development if they identify such a location decision as a
competitive advantage.
Expósito-langa, Tomás-miquel, and Molina-morales (2015) define a cluster
as a network with reference to geographical proximity and an intense feeling of
belonging. These are primary elements facilitating cluster relationships based on
norms and values such as trust and mutual exchange, among others, and are
characteristic of inter-organizational relationships between different actors:
customers, competitors, suppliers, support organizations, and local institutions.
The network of relations among companies is well known for allowing knowledge
to diffuse rapidly as it is typically characterized as a web of dense and overlapping
ties. Knowledge resources flow quickly inside the cluster, enabling reduced search

1. THEORETICAL INSIGHTS INTO CLUSTERS AND CIRCULAR ECONOMY… 11
costs. The knowledge exploitation in a cluster differs from that produced in other
contexts, facilitating the learning process and generating beneficial effects for all
the group’s companies.
Salvador, Mariotti, and Conicella (2013) question whether geographical
proximity is essential for companies in respect of the innovation cluster
revolution, as geographical proximity played a crucial role in network formation,
company growth, and knowledge diffusion in traditional industrial districts and
innovative milieu. Forward-looking public policies enable the emergence of new
forms of virtual agglomeration like innovation clusters. A cluster management
company identifies and manages an innovation cluster based on membership of a
dedicated organization with everyday interest activities. Innovation clusters are
often regarded as the most dynamic and high-tech components of larger regional
communities based on sector commonalities or markets or similar technologies.
De Felice (2014) emphasizes that social capabilities are often ignored in
traditional industrial districts, whereas the role of social and cultural proximity
between agents for knowledge sharing is emphasized in the literature. It must be
admitted that essential sources for the exchange of knowledge are local and agent
relations, and workers with specific knowledge, skills, and capacity comprise
human resources. The company’s role must be considered too, as it may be
positioned as an institution responsible for the knowledge needed to produce and
spread technology. Technological knowledge is produced through a learning
integration process and formal research in a company as an organization. This is
the main reason why a company is considering a place of specific competences.
Companies can create relationships for themselves within a district with the
outside worlds. These relationships are significant sources of innovation and
creation of internal ideas for business in the district. Transfers of knowledge and
inputs are stimulated by easily formed social and company networks in a district,
generating ideas to an extent determined by a company’s abilities or social
capabilities. Unique social capabilities can characterize any cluster, along with
different knowledge bases, and the ideas that belong to the skilled workers of a
company characterize companies in clusters. The cluster’s social capabilities are
comprised of the concentration of various competencies and abilities of business
workers. Historical and cognitive factors explained by the economic, social,
cultural and institutional relations characteristic of a population in a specific
regional context can explain a cluster’s birth and performance. Hence, learning
and knowledge generation requires more than geographical proximity. Cluster
needs to reconsider the external relations through which recognition and the
spread of new ideas and knowledge are possible within the district through
positive spillovers.
Markusen (1996) applied geographic and economic characteristics found
after cluster examination from an economic perspective to study the formation of

12 1. THEORETICAL INSIGHTS INTO CLUSTERS AND CIRCULAR ECONOMY…
clusters around oligopolistic industries. Markusen (1996) identified types of
cluster formed within metropolitan areas such as Marshallian industrial districts
(and subdistricts), satellite platform districts, and state-anchored industrial
districts. Geographic areas, public or private industrial decisions, labour
availability, and trade within and outside the district determined this typology.
The typologies of Markusen and Porter share similar features.
Three types of cluster are presented by Porter (2003): local industry clusters,
resource-dependent clusters, and trading industry clusters. For example,
supporting the similarities between Markusen and Porter’s typologies,
characteristics of local industry clusters are compared with those of the
Marshallian industrial district (Porter, 2003):
− Employment evenly distributed across the cluster.
− Goods and services provided mainly to local markets.
− Competition with other regions is limited.
− Most companies provide services.
− Industries produce few goods.
Locally consumed services such as health services, utilities, and retail goods
comprise clusters. Products that are used locally, including newspapers, soft
drinks, and goods-producing industries, are provided within clusters.
Another cluster that has similarities with Markusen’s hub and spoke industrial
district is Porter’s resource-dependent cluster. According to Porter’s
classification, employment is located near the needed resources, and competition
is domestic and international. Therefore, any manufacturing associated with this
cluster type is directly related to resources. Knowingly, resource-dependent
clusters are tied to the immobile assets.
Porter’s traded industry cluster has features similar to Markusen’s satellite
platform district. Resources are not immobile in this type of cluster, so the
products and services are sold across regions and other countries. Furthermore,
the cluster is located in an area considering the competition, such as available
labour concentrations.
The typologies of Markusen (1996) and Porter (2003) categorize cluster
formation in isolation, although they both conclude that clusters do not form in
isolation. Markusen (1996) also conclude that governmental action or a large
company’s action can form a cluster in isolation.
Porter (1990) made many observations in his work on industry clusters, and
it is essential to mention the difference between two critical types (Martin,
Mayneris, Martin, Mayer, & Mayneris, 2008). The first, ‘traded clusters’, are
crucial for economic development. They are found clustered in a limited number
of regions within a country and only in a few countries globally, for they are
composed of industries that sell to markets beyond their local region. They are

1. THEORETICAL INSIGHTS INTO CLUSTERS AND CIRCULAR ECONOMY… 13
complimented for providing higher wages for their workers and adding to the local
economy through innovation and productivity, as well as generating all-important
spillovers. Meanwhile, ‘local industries’ are distributed evenly across
jurisdictions serving their local markets; however, they present lower wages,
lower productivity, and a lack of spillovers.
Porter’s (1990) focus is on the dynamics of industry clustering, and workers
are one of the concerns in his work. Employers seek skilled workers, and clusters
serve that perfectly, as traded clusters attract specialized human resources to their
region.
Niu (2010) explains that the knowledge within a cluster can be shared
unwittingly through competitive interactions or the industrial atmosphere. Joint
action such as horizontal cooperation (between competitors) or vertical
cooperation (supply chain relationships) enables companies in a cluster to achieve
sustainable competitive advantage. Cooperative and collaborative relations
among companies in different institutional forms, such as strategic alliances and
producer consortia, create joint action gains, sharing and exchanging knowledge
and information quickly. Two types of competitive characteristics can be
distinguished and further developed into a competitive advantage for a cluster:
1. Those based on traded interdependencies.
2. Those based on non-traded interdependencies.
Traded interdependencies, such as alliances, acquisitions or technological
know-how in which formal exchanges occur, exist in the economic sphere and
involve formal exchanges of value. When industries mature, traded
interdependences are readily dispersed. The processes surrounding economic
transactions in a cluster can be understood better if this approach is adopted.
Non-traded interdependencies share knowledge without or with limited
market mechanisms. They include customs, cultures and beliefs, and exist outside
the economic sphere. The industrial atmosphere, as Marshall calls it, is associated
with knowledge in the air, as reflected in non-traded interdependencies. The same
competitive characteristics can be applied to the economic system in a cluster,
reducing transaction costs related to traded interdependencies.
Time has changed the importance of traded and non-traded
interdependencies. Advantages related to traded interdependencies, such as lower
production costs, specialized labour pools, and spillovers of technological
knowhow, are identified by traditional agglomeration economics. The main
factors that were considered to reduce the importance of proximity in attaining
advantages were the emergence of globalization and information technology.
Clusters have developed learned patterns of adaptation advantages that have been
attributed to interaction and trust for competitive. Therefore, individual company
and mutual competitive advantage can be explained through the importance of the
industrial atmosphere, or knowledge in the air.

14 1. THEORETICAL INSIGHTS INTO CLUSTERS AND CIRCULAR ECONOMY…
Karaev et al. (2007) emphasize that competitiveness is a significant
characteristic of a cluster concept. Therefore, a distinction should be made
between a nation’s competitiveness and that of a region, an industry, or a single
company. The business environment in which companies or industries emerge
determines the competitiveness of a particular region. Different agents define
competitiveness as the ability of a country to achieve sustained high rates of
growth in terms of gross domestic product per capita; as a measure of levers that
a country has to promote sustained improvements in its wellbeing, given the
global competition; and as the ability of an economy to provide its population with
high and rising standards of living and a high level of employment for all those
willing to work on a sustainable basis. Primary macro competitiveness indicators
can be listed as lower country risk rating and higher computer usage; higher gross
domestic investment, savings and private consumption; more imports of goods
and services than exports; increased purchase power parity and gross domestic
product (GDP); larger and more productive, but not less expensive, labour force;
and higher research and development (R&D) expenditures.
There are two ways that a company can gain a competitive advantage over its
rivals at the micro level (Jin, Guo, & Li, 2019). These are cost advantage and
differentiation. In the first case, a company can produce and sell comparable
products more efficiently than its competitors by lowering costs. The second case
suggests that the expectations of customers can be fulfilled by providing unique
products or services. Nonetheless, the main element in these definitions is
productivity.
The competitiveness assessment also includes intellectual capital and its
relationship with innovation capacity (Gloet & Terziovski, 2004; Solleiro &
Castañón, 2005). Karaev et al. (2007) claim that competitive advantage is a core
competence, showing it as an advantage that one company has relative to
competing companies. Barnett and Pontikes (2004) focus more on survival as a
primary determinant of competitiveness as a contrast to identifying factors that
determine an organization.
An essential element of cluster dynamics is the interaction between
competitive and cooperative attitudes in a cluster. As already discussed, a cluster
combines not only competing companies in the same industry, but also business
partners with consistent competencies. Cluster members cooperate with cluster
links (e.g. in a supply chain or an export promotion programme), creating
competitive pressure, an essential driver for innovation. Companies’ roles can be
changed according to market requirements, as cluster members can interact as
partners or as competitors (Lee, Martin, Hsieh, & Yu, 2020).
Broekel, Fornahl, and Morrison (2015) present the hypothesis that companies
in clusters gain an additional advantage because of their location and can expect
support from public R&D subsidization programmes and better embeddedness in

1. THEORETICAL INSIGHTS INTO CLUSTERS AND CIRCULAR ECONOMY… 15
knowledge networks of subsidized R&D collaboration. The Sixth EU Framework
Programme (Leather, 2008) focuses on research excellence, and companies in
clusters that are keen on international collaboration with state-of-the-art
knowledge sources are likely to get support. More globally, central positions are
maintained by companies in clusters instead of being involved in public support
of collaborative R&D networks. Companies in clusters engage in public research
organizations (not universities) through national subsidization schemes. These are
additional advantages of belonging to a cluster.
The scholars present different cluster notions characterized as being of
different significance in various fields (R. Martin & Sunley, 2003; Novikov, 2019;
Novotná & Novotný, 2019). Scientific literature on clusters can be beneficial in
terms of contemporary economic development, but at the same time, banal and
misleading pieces of writing exist. The cluster concept’s importance is
comprehensible and highly supported by promoters, but there is a feeling that
there is something behind it that must be critically reviewed. The cluster concept
provokes uncertainty as it is very elastic, and clusters cannot determine or present
a universal model on how agglomeration is related to regional and local growth.
The cluster notion has such a universal description that it can be added to any
other notion of a similar nature, which makes it overly stretched, thin, and
fractured. Another circumstance that encourages awareness of the ambiguity of
the cluster term is that the existence of an association between some high-growth
industries and various forms of geographical concentration in a region or
geographic location does not prove that their relative success and economic
growth is the consequence of being concentrated in that location.
The cluster notion was invented to describe geographically localized or
clustered companies that also have a competitive advantage (Cavallo, Ghezzi, &
Balocco, 2019; Gallego-Bono & Chaves-Avila, 2020). Naturally, there were
attempts by economic geographers studying local industrial specialization,
particularly economic agglomeration, and regional development that could
represent the spatial form and nature of local business concentrations. However,
they did not have any significant impact on policymakers. The previously
mentioned competitiveness might be the keyword in cluster description as the
emphasis was on companies’ competitiveness, industries, nations, and locations.
Politicians and policymakers have stressed that competitiveness is important for
succeeding in today’s global economy, and this position conforms to the cluster
notion. The purpose of this definition is to inform companies, cities, regions and
nations on how to be competitive globally. The cluster notion seems tempting, for
it refers to the current preoccupation with micro-economic supply-side
intervention and the policy imperatives of raising productivity and innovation.
The cluster concept has attracted considerable interest in promoting geographical

16 1. THEORETICAL INSIGHTS INTO CLUSTERS AND CIRCULAR ECONOMY…
clusters’ competitive advantage, referring to its aims, performance, productivity
and competitiveness.
The cluster concept is very generic: given its vague and sufficiently
indeterminate meaning, it can be applied to an extensive range of industrial
groupings and specializations, demand-supply linkages, factor conditions,
institutional set-ups, and others (Gallego-Bono & Chaves-Avila, 2020). At the
same time, it claims to be based on fundamental processes of business strategy,
industrial organization and economic interaction. The cluster idea has mainly been
accepted as valid in terms of the national economy, decomposing the economy
into distinct industrial-geographical groupings seeking to understand and promote
competitiveness and innovation, instead of being tested and evaluated actively.
The cluster concept has attained popularity for the incompleteness of the
definition, which can be seen as an advantage and a disadvantage. It might be
claimed that the definition of the term allows a wide range of interpretations,
enabling the term to be used for conflating and equating quite different types,
processes and spatial scales of economic localization.
The definition of the cluster concept has two core elements. The first is that
the companies in a cluster must be linked in some way. It turns out that clusters
consist of companies and associated institutions which can supplement or
complete others by completing vertical (buying and selling chains) (Alexander,
2018; Humphrey, Todeva, Armando, & Giglio, 2019) and horizontal links
(complementary products and services, the use of similar specialized inputs,
technologies or institutions, and other linkages) (Novotná & Novotný, 2019).
Clusters produce benefits for the companies through relationships or networks.
The second core element is that clusters must be composed of geographically
proximate groups of interlinked companies. Sitting in the same location allows
the companies to avail themselves of the value-creating benefits that evolve from
networks of interaction between companies.
The two elements reveal the cluster definition’s primary problem, as it lacks
clear industrial and geographical boundaries. The definition does not give the
level of industrial aggregation at which a cluster should be defined, or the range
of related or associated industries and activities which should be included. It also
omits the strength of linkages between the companies or the level of economic
specialization sufficient for a local concentration of companies to constitute a
cluster. The spatial scale and geographical range needed for clustering processes
(inter-company linkages, knowledge spillovers, rivalry, business, social networks
and others) to operate and the spatial density of such companies and their
interactions are not defined. The boundaries of clusters are continuously evolving
as new companies and industries emerge and established ones shrink or decline,
and this adds to the main problem of the definition, which seems intentionally
opaque and fuzzy.

1. THEORETICAL INSIGHTS INTO CLUSTERS AND CIRCULAR ECONOMY… 17
Authors offering cluster definitions are given unlimited scope, as the
definition of the concept may differ in different locations depending on the
segment in which the member companies compete and the strategies they employ
(Novikov, 2019). Such geographical licence sets the term at two extremes: it can
be defined as national groups of industries and companies that are strongly linked,
although dispersed over several different locations within a country without
obvious major geographical concentrations or a local grouping of similar
companies in related industries within a highly circumscribed area (R. Martin &
Sunley, 2003).
Geographic terminology is used by policymakers who are engaged in the
analysis of the definition. The main problem is that the cluster concept does not
contain fixed boundaries in terms of spatial range or limits, and different
clustering processes are used on different geographical scales. The possibility of
using the term for a non-pre-specified geographical size or scale connections
enables misuse, which inevitably weakens the cluster concept’s empirical and
analytical significance.
Companies in clusters are considered to have superior performance to those
who do not benefit from a cluster (Table 1.1). Clusters raise the productivity,
innovativeness, competitiveness, profitability, and job creation of their constituent
companies, the geographical areas in which the clusters are located, and the
broader national economy (R. Martin & Sunley, 2003). Despite some attempts to
prove that economic advantages are analysed and evident or claims that belonging
to clusters may add, on average, two to four percent to companies’ profitability,
the evidence is not complete and needs far more detailed research. Success stories
are used to support the argument of superior performance. However, the situation
seems not to reflect the real situation, as only a few extensive studies have been
carried out, comparing similar companies inside and outside clusters or gathering
information about clustering in particular industries.
Some studies have sought to present evidence that clustering and innovation
have a positive association. Companies in local concentrations and their more
geographically dispersed partners have been taken into account, but no clear
evidence has been provided that new technologies are adapted faster in clustered
companies. The same is true of company growth: clustered companies that are
strong in their industry show better results, faster growth, and better perspectives
on innovation processes, while clustered companies that are strong in other
industries show the opposite, as growth and innovation rates are not fast.
Nonetheless, a high economic growth rate and innovation are not necessarily
achieved in regions based on specialized clusters. There is also no valuable
evidence to support the view that clusters boost business performance and local
economic development.

18 1. THEORETICAL INSIGHTS INTO CLUSTERS AND CIRCULAR ECONOMY…
Table 1.1. Advantages and disadvantages of clustering (Source: Composed by the author
based on Martin and Sunley (2003), Novikov (2019) and Novotná and Novotný (2019))
Claimed advantages Potential disadvantages
Higher innovation Technological isomorphism
Higher growth Labour cost inflation
Higher productivity Inflation of land and housing costs
Increased profitability Widening of income disparities
Increased competitiveness Over-specialization
Higher new company formation Institutional and industrial lock-in
High job growth Local congestion and environment pressure
The main intention of cluster policies is to promote the supply of absent local
and regional public goods. Four suggestions are identified. Firstly, the benefits of
creating cooperative networks and encouraging dialogue between companies and
agencies are emphasized, as companies can exchange information, pool resources,
design collective solutions to shared problems, and develop a stronger collective
identity. Secondly, collective marketing of an industrial specialism is involved,
raising awareness of the region’s industrial strengths. Thirdly, some local services,
such as financial advice, marketing and design services, should be provided for
clusters. Lastly, the weaknesses in existing cluster value chains should be
identified, and investors and businesses should be invited to fill these gaps and
strengthen demand and supply links.
These measures can be beneficial to local and regional economies. Whether
the implementation of such policies within a cluster framework improves the
economies’ effectiveness and outcomes is debatable, however: some cases show
that such a framework is unnecessary or even constraining. Other existing network
policy types promoting information sharing between companies can be applied
instead of the cluster framework.
Taking all the disadvantages into account, it seems that authorities should
encourage local and regional businesses to investigate other forms of cooperation
which would enhance their potential results and boost innovations. The cluster
concept has achieved enormous popularity among policymakers and the academic
community, as it has been accepted as being closely tied to positive images and
associations. The cluster concept is associated with a high-productivity,
knowledge-rich, decentralized, entrepreneurial, and socially progressive economy
within local policymakers’ reach.
The concept of a cluster that is reflected in this dissertation relies on
companies and associated institutions which can supplement or complete others
by completing vertical (buying and selling chains) and horizontal links
(complementary products and services, the use of similar specialized inputs,

1. THEORETICAL INSIGHTS INTO CLUSTERS AND CIRCULAR ECONOMY… 19
technologies or institutions, and other linkages) using geographical proximity to
achieve competitive advantage through cooperation.
1.2. Analysis of Indicators Related to Cluster Performance Evaluation
The traditional bibliometric technique was chosen to identify trends in the cluster
literature. Fifty articles were selected, which allowed the research aspects to be
systemized and valuable observations to be made. The findings indicate that clus-
ter performance evaluation should be sector sensitive to get the best results and
suggest how the cluster execution could be improved. On the national level, clus-
ters usually cannot compare their performance, for there is no system to serve this
purpose. A detailed analysis of cluster performance indicators is needed when
clusters’ performance in transition to CE evaluation tool is composed.
The literature analysis allowed identification of the indicators discussed in
research papers when clusters are perceived from the scientific point of view. Nine
groups of indicators were identified as being frequently used by scholars, authors
having perceived their importance. Some general observations are marked for a
more in-depth understanding of the matter.
The first group of indicators was proximity indicators. Scholars view
proximity as having an impact on clusters’ performance (Table 1.2).
According to Ben Letaifa and Rabeau (2013), geographical proximity is
worth the attention that it gets, enabling collaboration and innovation. However,
some clusters fail to collaborate despite their geographical proximity. Ben Letaifa
and Rabeau’s study is based on examining a cluster that fails to collaborate, and
the emphasis is on the interaction among geographic, institutional, organizational,
cognitive and social proximities. The findings suggest that the most crucial
proximity in collaboration achievements is social proximity, while geographical
proximity can be harmful for social proximity. What is more, geographic distance
may have a positive effect on entrepreneurship and innovation. Naturally formed
clusters with private entrepreneurial initiatives are more progressive in
innovations than those created by economic policies.
A garment cluster in South India was highlighted by Carswell (2013) through
empirical and analytical studies to prove that labour should get more attention in
global production networks. A horizontal approach with gender, age, caste, and
regional connections taken into account is employed to reveal how social relations
and livelihood strategies are relevant in comparison to vertically-linked
production networks. Here, effects on workers’ livelihoods and social relations
are discussed to shape local development of global capitalism.

20 1. THEORETICAL INSIGHTS INTO CLUSTERS AND CIRCULAR ECONOMY…
Table 1.2. Proximity-related indicators commonly used in the scientific literature
(Source: Composed by the author)
Authors Indicator – proximity
Alcácer and Chung (2014) Supply and demand must be examined in agglomera-
tion economies when localization and concentration
take place
Basile, Benfratello, and
Castellani (2013)
Location determinants of inward greenfield investments
in regions
Bathelt and Zhao (2020) Geographical proximity impacts interaction and learn-
ing in economic contexts
Ben Letaifa and Rabeau
(2013)
The emphasis is on the interaction among geographic,
institutional, organizational, cognitive, and social prox-
imities
Bindroo, Mariadoss, and
Pillai (2012)
Customer cluster proximity’s importance to company
innovation
Boschma, Minondo, and
Navarro (2013)
Regional capabilities may show the tendency for new
industries to be developed in regions
Carswell (2013) A horizontal approach with social networks and verti-
cally linked production networks
Casanueva, Castro, and
Galán (2013)
How social networks impact the transition of tacit and
explicit knowledge
Castellani, Jimenez, and
Zanfei (2013)
The importance of geographical proximity
Crespo, Suire, and Vicente
(2014)
Regional resilience through local knowledge sharing.
Pablo D’Este, Guy, and
Iammarino (2013)
Geographical proximity
Fallah, Partridge, and
Rickman (2014)
Proximity to a research university and proximity in the
urban hierarchy
Funk (2014) Local environments
Helsley and Strange (2014) Agglomeration efficiencies
Schmitt and Van
Biesebroeck (2013)
The relative importance of three dimensions: geograph-
ical, cultural and relational proximity
Xiang and Huang (2019) Geographical proximity facilitates knowledge flows
and learning processes
Zhu, He, and Liu (2014) Geographical relocation, outsourcing, and plant closure
Pablo D’Este, Guy, and Iammarino (2013) are interested in the collaboration
between universities and industry, considered an essential channel of potential
localized spillovers. According to the authors, the factors that go along with

1. THEORETICAL INSIGHTS INTO CLUSTERS AND CIRCULAR ECONOMY… 21
university-industry collaboration, especially geographical proximity, do not get
enough attention from researchers and interested parties. For this reason, the
authors share their ideas on how clustering and technological complementarity
among the companies in a partnership contribute to the formation of university
and industry research collaborations.
Fallah, Partridge, and Rickman (2014) pay attention to geography in high-
tech employment growth and examine geographic dimensions such as industry
cluster effects, urbanization effects, and proximity to a research university. Their
study suggests slightly negative evidence of localization or within-industry cluster
growth effects rather than positive growth effects. Universities create human
capital rather than knowledge spillovers for nearby companies. Three broad
geographic factors are suggested for the research: the size of the high-tech sector,
the influence of urban agglomeration, and human capital with universities.
The European automotive industry was used as a case to investigate the trends
affecting the manufacturing of sophisticated goods (Schmitt & Van Biesebroeck,
2013). It is noted that the importance of proximity in the supply chain has recently
grown, and the relative importance of three dimensions is evaluated: geographical,
cultural, and relational proximity. The results show that some aspects of proximity
are valued in companies’ sourcing strategy.
The study by Funk (2014) develops and tests a theory of how a company’s
local environment influences the ability to generate innovations. The case study
shows that networks are beneficial as they create and sustain diversity internally,
even when proximity to industry peers decreases.
Bindroo et al. (2012) study’s primary concern is the effect of customer
clusters on a company’s innovation. Multi-country data are used to test the
theoretical model of customer cluster proximity’s importance for company
innovation. Variation in the different innovation outcomes was tested.
Bouncken and Kraus (2013) present a novel notion that describes the
simultaneous pursuit of cooperation and competition, termed co-opetition (Table
1.3). This phenomenon can have a dual effect on SMEs’ innovations. While co-
opetition can trigger radical innovation, it can be also harmful because it results
in too novel revolutionary innovation. The damaging or encouraging effects
depend on three types of innovation performance: sharing knowledge with the
partner, learning from the partner, and technological uncertainty. The study
resolves that positive results of co-opetition are achieved in revolutionary
innovation when SMEs integrate their partners’ knowledge. Hence, a negative
influence on revolutionary innovation is discovered when SMEs are sharing
knowledge with their partners. Seven different profiles of SMEs are displayed
following a latent profile analysis.

22 1. THEORETICAL INSIGHTS INTO CLUSTERS AND CIRCULAR ECONOMY…
Table 1.3. Innovation-related indicators commonly used in the scientific literature
(Source: Composed by the author)
Authors Indicator – innovation
D’Angelo et al. (2013),
Funk (2014), Zhu, Geng,
Sarkis, and Lai (2015)
Innovation
Bathelt and Zhao (2020) Industry innovation
Bouncken and Kraus
(2013)
Radical innovation or too novel revolutionary innova-
tion
Casanueva et al. (2013) Product innovation
He and Wong (2012), Tan,
Shao, and Li (2013)
Innovation performance
Morrison, Rabellotti, and
Zirulia (2013)
Innovativeness
Schot and Steinmueller
(2018)
R&D, systems of innovation and transformative
change
Tavassoli and Carbonara
(2014)
Region’s innovation
Wang and Lin (2013) Technological innovation
Zardini, Ricciardi, Bullini
Orlandi, and Rossignoli
(2020)
Collaborative, adaptive innovation
The article by Casanueva et al. (2013) is designed to analyse the relationship
between social networks and innovation in mature geographical clusters. A wide
range of ties are analysed to understand how they impact the transition of tacit and
explicit knowledge. The results show that a central position is significant in
product innovation, while structural holes are weak. Correlation – regression
analysis were applied to compare the variables in a single cluster of 52 SMEs. The
authors suggest that longitudinal studies would be useful to examine how different
relationships evolve and to see the causality between the variables. More detailed
research could be undertaken, taking interactions between the variables as the
independent variables.
Correlation – regression analysis is applied to investigate the relationships
between corporate knowledge management and innovation performance Lai et al.,
(2014) suggest that industry clustering has a positive effect on corporate
innovation performance and corporate knowledge.
A comprehensive framework is applied by Maskell (2014) to allow
discussion of the approaches available to companies engaged in globally extended
learning (Table 1.4). The article explores knowledge and solutions from

1. THEORETICAL INSIGHTS INTO CLUSTERS AND CIRCULAR ECONOMY… 23
geographically and relationally remote sources that can be acquired through
pipelines, listening posts, crowdsourcing, and trade fairs.
Table 1.4. Knowledge-related indicators commonly used in scientific literature
(Source: Composed by the author)
Authors Indicator – knowledge
Bouncken and Kraus
(2013)
Sharing knowledge with the partner, learning from the
partner, and technological uncertainty; cooperation
Feldman (2014) Mechanisms and institutions promote the creation of
useful knowledge
Heindl (2020) Explored and exploited knowledge differ strongly be-
tween actors
Lai, Hsu, Lin, Chen, and
Lin (2014)
Corporate knowledge management
Maskell (2014) Knowledge can be acquired through pipelines, listen-
ing posts, crowdsourcing, and trade fairs
Morrison et al. (2013) Global pipelines, knowledge endowment, and internal
knowledge transfer
Stanko and Olleros (2013) Three dimensions are studied: the outsourcing of inno-
vation activities, geographic clustering of companies,
and mobility of labour
Tavassoli and Carbonara
(2014)
The variety and intensity of internal and external
knowledge
Correlation – regression analysis is used to ascertain the association between
two variables. Tavassoli & Carbonara (2014) identify that both the variety and
intensity of internal and external knowledge matter for innovation.
Feldman (2014) provides a literature analysis that observes the mechanisms
and institutions that promote useful knowledge.
Two wine clusters in Chile are analysed in terms of networking and the
performance of companies within clusters (Giuliani, 2013)(Giuliani,
2013)(Giuliani, 2013). Product success is considered, together with the degree of
closure, structural holes, and external openness.
He and Wong (2012) attempt to examine whether local networking is
beneficial to companies, what kinds of collaboration contribute more to
innovation, and how different collaborations impact innovation performance
(Table 1.5).
Li et al.'s (2013) primary concern is the impact of spatial relationships on
company performance. An industry cluster in China was the focus of a case
analysis, and additional cluster links were determined by companies’

24 1. THEORETICAL INSIGHTS INTO CLUSTERS AND CIRCULAR ECONOMY…
performance. Network relational characteristics, such as tie strength, tie stability,
and tie quality, were considered for companies’ performance. The results show
that distant linkages should be developed to avoid lock-in and entropic
deterioration.
Table 1.5. Networking-related indicators commonly used in the scientific literature
(Source: Composed by the author)
Authors Indicator – networking
D’Angelo, Majocchi,
Zucchella, and Buck (2013)
One of the critical resources
Pablo D’Este et al. (2013) Collaboration between universities and industry
Giuliani (2013) Different kinds of networking
He and Wong (2012) Local networking
Li, Veliyath, and Tan
(2013)
Network relational characteristics, such as tie strength,
tie stability, and tie quality, are considered for compa-
nies’ performance
Lorenzen and Mudambi
(2013)
Personal relationships, social network
Tan et al. (2013) Ties between companies and colleges, ties between
companies and industrial associations, and ties be-
tween companies
Wang and Lin (2013) Inter-company relations
Lorenzen and Mudambi (2013) supplement the cluster definition by including
links to personal relationships. This theory of the social network allows testable
propositions to be formed. Local spillovers have the best potential in global
linkages with decentralized network structures. There are two different points in
this theory: clusters may have the potential for in-depth (when clusters are linked
to the global economy by decentralized pipelines) or in-breadth (when clusters are
linked through decentralized personal relationships) catch-up in industries and
technologies. The theoretical propositions are illustrated in case studies in two
emerging economies in India.
The study’s primary interest is the competitive advantage required for
companies given the competitive pressures for differentiation and the institutional
pressures of conformity (Tan et al., 2013). Measures, such as innovative
performance, ties between companies and colleges, ties between companies and
industrial associations, and ties between companies are tested. Here, outside
companies tend to be isomorphic institutionally and competitively, while
significant companies avoid institutional conformity and competitive
differentiation.

1. THEORETICAL INSIGHTS INTO CLUSTERS AND CIRCULAR ECONOMY… 25
Table 1.6. Economic indicators commonly used in the scientific literature
(Source: Composed by the author)
Financial indicator Authors Main points
Export Blancheton and Hlady-
Rispal (2020; D’Angelo
et al. (2013); Daddi,
Tessitore, and Frey
(2012)
Capability distance between
new and existing export
products; the influence of
crucial resources on export
performance
External investments Heindl (2020); Isaksen
(2015); Zardini et al.
(2020)
External investments are
often needed in regions
Foreign direct investment
(FDI)
Bathelt and Li (2014) FDI activities are taken into
account in the examination
of multinational enterprises
Market efficiency Alcácer and Chung
(2014)
Supply and demand sides of
agglomeration economies
must be examined
Production Daddi et al. (2012) The amount of production
Returns/profit Dobusch and Schüßler,
(2013); Stanko and
Olleros (2013); Tokatli
(2013)
Increasing returns; profita-
bility; profit-making or cap-
ital accumulation
Trade quotas Adrian Smith, Pickles,
Buček, Pástor, and Begg,
(2014)
Struggling with the removal
of trade quotas
Boschma et al. (2013) analyse the emergence of new industries in 50 Spanish
regions at Nomenclature of Territorial Units for Statistics (NUTS) level 3 over 30
years to see how regions diversify over time. NUTS 3 is a system for dividing up
the economic territory (Eurostat, n.d.). Econometric evidence is provided after
Spanish regions are analysed in terms of capability distance between new and
existing export products. The results show that regions tend to follow the
industrial structure trends rather than the national industrial structure. This
assumption suggests that regional capabilities may show that proximity
encourages development of new industries in regions.
Alcácer and Chung (2014) question whether companies’ location creates a
competitive advantage because of agglomeration economies and provide a
combination of fundamental economic and strategy concepts. Both supply and
demand sides of agglomeration economies are examined, and three fundamental
concepts are employed – localization, concentration, and market efficiency – to
address several conceptual gaps. The results show that companies tend to choose

26 1. THEORETICAL INSIGHTS INTO CLUSTERS AND CIRCULAR ECONOMY…
a location by taking into account all three concepts: companies need more
localized factor supply, less concentrated factor pools, and lower risk of
appropriation by proximate competitors.
Table 1.7. Research indicators commonly used in the scientific literature
(Source: Composed by the author)
Investment indicator Authors Main points
R&D Bathelt and Zhao,(2020;
Castellani et al. (2013);
D’Agostino, Laursen, and
Santangelo (2013)
International R&D invest-
ments; high-tech R&D and
medium or low R&D
Upgrading Tokatli (2013); Zhu et al.
(2014)
Capital accumulation can
differ depending on com-
pany upgrades and product
upgrades
Stanko and Olleros (2013) study the effects of knowledge spillover
mechanisms on industry innovativeness and profit and industry growth changes.
Three dimensions are studied: the outsourcing of innovation activities, geographic
clustering of companies, and mobility of labour. The findings suggest that
outsourcing negatively affects innovativeness but benefits profitability.
Foreign direct investment (FDI) activities are taken into account in examining
multinational enterprises (MNEs) and their behaviour regarding global cluster
networks and global city-region networks (Bathelt & Li, 2014). It is suggested
that multinational cluster enterprises are more likely to set up new foreign
affiliates in other, similarly specialized clusters to keep up with global industry
dynamics. Conversely, non-clustered companies avoid investing in clusters.
Another hypothesis that was generally supported by the investigation of 299 FDI
cases from Canada to China is that cluster networks generate horizontal and
vertical connections and shape global city-region networks (Table 1.6).
The study by Smith et al. (2014) is designed to show the development of
Eastern Europe’s clothing industry in recent years; it has been struggling with the
removal of trade quotas, increasing competitive pressures, and the global
economic crisis.
The importance of geographical proximity for MNEs regarding international
R&D investments is discussed by Castellani et al. (2013). The gravity model of
trade was used to see how geographical distance impacts R&D investments. The
results show that geographic distance has a negative impact on the probability of
setting up R&D on manufacturing plants. Meanwhile, once measures of
institutional proximity are accounted for, MNEs are equally likely to set up R&D
labs in nearby or more remote locations (Table 1.7).

1. THEORETICAL INSIGHTS INTO CLUSTERS AND CIRCULAR ECONOMY… 27
D’Agostino et al. (2013) study the relationship between a region’s home and
foreign investments in R&D that affects home regional knowledge production.
The findings suggest that regions of high income have an advantage in high-tech
R&D, while emerging economies have an advantage in medium or low R&D.
A literature study, data collection, and analysis allow Tokatli (2013) to
conclude that upgrading has some limitations, and profit-making or capital
accumulation can differ depending on company upgrades.
The research by Zhu et al. (2014) investigates environmental problems
caused by the intensive industrialization model. The authors suggest that
pollution-intensive enterprises could restructure their products through
innovation, upgrading, geographical relocation, outsourcing, and plant closure,
especially in China’s coastal regions.
Table 1.8. Government indicators commonly used in the scientific literature
(Source: Composed by the author)
Government indicator Authors Main points
Policies Crespo et al. (2014) Policy-oriented analysis
Ketels (2013) Policies are mostly focused
on strengthening existing
agglomerations
Nathan and Overman
(2013)
Spatial economy and indus-
trial policy interventions
Chen (2020) Short-term development
policies should focus on
growth
Subsidiaries Bathelt and Zhao (2020);
Corredoira & McDermott,
(2014); Xiang and Huang
(2019)
How do MNE subsidiaries
and local institutions help
or hinder emerging market
suppliers from upgrading
their capabilities?
Corredoira and McDermott’s (2014) primary concern is how MNE
subsidiaries and local institutions help or hinder emerging market suppliers from
upgrading their capabilities. Fieldwork and unique survey data on Argentinian
auto parts suppliers were combined to reveal that process upgrading improves
when suppliers have ties to institutions that improve access to a range of
experiential knowledge. The study shows that suppliers benefit from MNE
subsidiaries in cases where suppliers collaborate with non-market institutions and
can recombine experiential knowledge with standards gained from the
subsidiaries.

28 1. THEORETICAL INSIGHTS INTO CLUSTERS AND CIRCULAR ECONOMY…
Crespo et al. (2014) claim to present an evolutionary framework of regional
resilience by emphasizing local knowledge sharing (Table 1.8). Simple statistical
measures of cluster structuring are proposed so that the properties of degree
distribution (the level of hierarchy) and degree correlation (the level of structural
homophily) of regional knowledge networks can be studied. The successful
combination of technological lock-in and regional lock-out is analysed. The
policy-oriented analysis results show that policies must focus on regional
diagnosis and targeted interventions on missing links rather than applying policies
based on a definite increase of relational network density.
Ketels' (2013) study is designed to review recent studies on competitiveness
and clusters in regions and regional policy. The findings show that policies are
mostly focused on strengthening existing agglomerations rather than establishing
new ones.
Nathan and Overman (2013) review the development of cluster policies and
the evolution of the cluster notion. The authors suggest that governments should
pay careful attention to the spatial economy and industrial policy interventions.
D’Angelo et al. (2013) study regional and global pathways to
internationalization for SMEs to examine the influence of innovation, human
resource management, and networking. The correlation – regression model is
applied to compare the variables; the results show that SMEs’ export performance
varies depending on the geographic scope of internationalization.
Jiang and Miao (2015) present new insights into the structure and dynamics
of natural cities. One of their findings is that natural cities evolve in a nonlinear
manner in spatial and temporal dimensions as spatially clustered geographic units.
A formal model is developed to examine when global pipelines, which are
often said to foster the growth of clusters and innovativeness, contribute to
increased local knowledge (Morrison et al., 2013). Various characteristics are
taken as dependants, such as size, knowledge endowment and internal knowledge
transfer. The results suggest that global pipelines benefit clusters that have high-
quality local connections or knowledge endowment.
Daddi et al. (2012) investigate the correlation between eco-innovation and
competitiveness within districts (Table 1.9). Fifty-four clusters were examined for
the case study, compiling the most eco-efficient districts at the national level. Four
indicators were chosen: number of enterprises, employment, production, and
exports. The last three years’ data were assessed from two districts working in the
same product field. The study shows that there is a connection between eco-
innovation and competitiveness in some cases.
Through a case analysis, Dobusch and Schüßler (2013) show the relationship
between positive feedback on path dependence and increasing returns. Regional
path-dependent industrial development is often characterized by lock-in effects
when dealing with changes such as path renewal and path creation Isaksen (2015)

1. THEORETICAL INSIGHTS INTO CLUSTERS AND CIRCULAR ECONOMY… 29
suggests that regions often need external investments to achieve path renewal and
path creation.
Table 1.9. Resource indicators commonly used in the scientific literature
(Source: Composed by the author)
Resource indicator Authors Main points
Cluster formation Ben Letaifa and Rabeau
(2013)
Naturally formed clusters
with private entrepreneurial
initiatives or created by
economic policies
Cluster size De Vaan, Boschma, and
Frenken (2013)
Clustering becomes posi-
tive after a cluster reaches a
critical size
Daddi et al. (2012) Number of enterprises
Company’s experience D’Angelo et al. (2013) One of the critical resources
Growth Jiang and Miao (2015) Natural cities evolve in a
nonlinear manner in spatial
and temporal dimensions
Dimensions
Morrison et al. (2013) Fostering the growth of
clusters
Wang and Lin (2013) Company attributes, com-
pany size and technological
intensity
Employment Daddi et al. (2012) Human resources
Human resource manage-
ment
D’Angelo et al. (2013) One of the critical resources
Labour Carswell and De Neve
(2013)
Information on occupations,
incomes, migration pat-
terns, caste, education, and
asset ownership.
Path dependence
Dobusch and Schüßler
(2013)
Positive feedback of path
dependence
Isaksen (2015) Lock-in effects often char-
acterize regional path-de-
pendent industrial develop-
ment
Carswell and De Neve (2013) emphasize the importance of labour and
highlight that it receives less attention from scholars than it deserves. Labour’s
multiple and everyday forms of agency are seen as helping to shape local
developments of global capitalism and producing transformative effects on
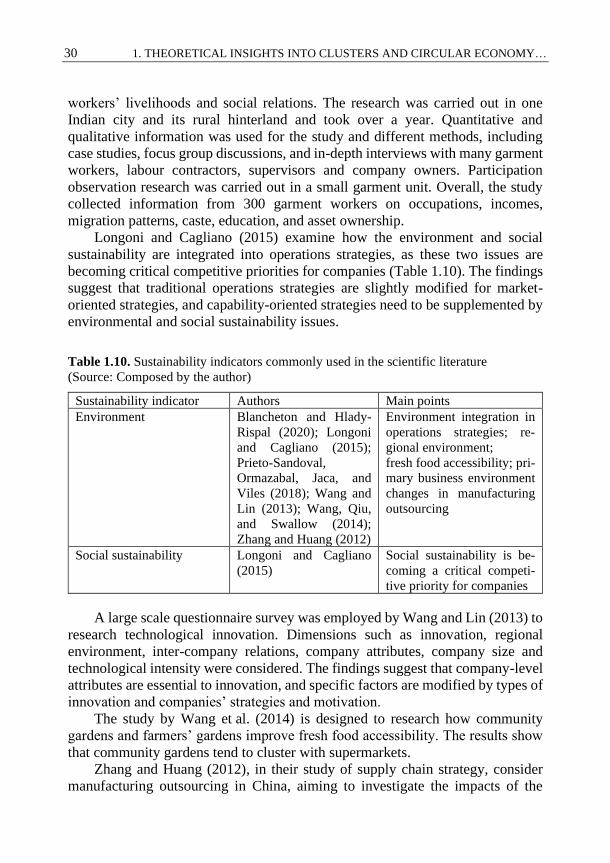
30 1. THEORETICAL INSIGHTS INTO CLUSTERS AND CIRCULAR ECONOMY…
workers’ livelihoods and social relations. The research was carried out in one
Indian city and its rural hinterland and took over a year. Quantitative and
qualitative information was used for the study and different methods, including
case studies, focus group discussions, and in-depth interviews with many garment
workers, labour contractors, supervisors and company owners. Participation
observation research was carried out in a small garment unit. Overall, the study
collected information from 300 garment workers on occupations, incomes,
migration patterns, caste, education, and asset ownership.
Longoni and Cagliano (2015) examine how the environment and social
sustainability are integrated into operations strategies, as these two issues are
becoming critical competitive priorities for companies (Table 1.10). The findings
suggest that traditional operations strategies are slightly modified for market-
oriented strategies, and capability-oriented strategies need to be supplemented by
environmental and social sustainability issues.
Table 1.10. Sustainability indicators commonly used in the scientific literature
(Source: Composed by the author)
Sustainability indicator Authors Main points
Environment Blancheton and Hlady-
Rispal (2020); Longoni
and Cagliano (2015);
Prieto-Sandoval,
Ormazabal, Jaca, and
Viles (2018); Wang and
Lin (2013); Wang, Qiu,
and Swallow (2014);
Zhang and Huang (2012)
Environment integration in
operations strategies; re-
gional environment;
fresh food accessibility; pri-
mary business environment
changes in manufacturing
outsourcing
Social sustainability Longoni and Cagliano
(2015)
Social sustainability is be-
coming a critical competi-
tive priority for companies
A large scale questionnaire survey was employed by Wang and Lin (2013) to
research technological innovation. Dimensions such as innovation, regional
environment, inter-company relations, company attributes, company size and
technological intensity were considered. The findings suggest that company-level
attributes are essential to innovation, and specific factors are modified by types of
innovation and companies’ strategies and motivation.
The study by Wang et al. (2014) is designed to research how community
gardens and farmers’ gardens improve fresh food accessibility. The results show
that community gardens tend to cluster with supermarkets.
Zhang and Huang (2012), in their study of supply chain strategy, consider
manufacturing outsourcing in China, aiming to investigate the impacts of the

1. THEORETICAL INSIGHTS INTO CLUSTERS AND CIRCULAR ECONOMY… 31
significant business environment changes. The findings show that China’s coastal
part is attractive for clusters formed there and has an efficient logistics service.
1.3. Literature Analysis Concerning Sectors in which Clusters Operate
Economic interests connect cluster members through participation in product or
service value creation chains in which sense clusters differ from other cooperation
forms. Clusters are more than simple horizontal networks, which are typical of
companies working in the same market or depend on the same industry group,
cooperating in such areas as R&D, innovations, product creation or purchase pol-
icy. More generally, clusters are cross-sectoral (vertical and horizontal) networks
composed of different companies that supplement each other, science and educa-
tion institutions, and other members that can provide reasonable solutions in the
cluster value creation chain. Cluster members can efficiently create products or
services following participating cluster facilitators, who help find shared cross-
sectorial cooperation contacts and develop them.
The literature analysis reveals that clusters and cluster organizations are
sector sensitive. Previous studies (Razminienė, & Piccinetti, 2015) showed that
every cluster differs depending on its sector. Therefore, involvement in the CE
should be measured according to the industry or type of activity, as it is impossible
to apply a universal model. The characteristics of companies within an industry
may differ, and engagement in the CE may be defined with varying degrees of
importance by different companies. Authors interested in the clusters analyse
them from different perspectives in their scientific papers, as shown in Table 1.11,
according to the sector that clusters belong to. These articles are selected from the
Web of Science (Claritive Analytics) database.
De Vaan, Boschma, and Frenken (2013) identify that recent empirical
evidence shows that companies in clusters do not outperform companies outside
clusters, and spatial clustering based on localization externalities is being
questioned. Their study finds that in the global video game industry, the net effect
of clustering becomes positive after a cluster reaches a critical size. Two hazard
models are used to test the hypothesis concerning failure and acquisition. The
study suggests that studies in economic geography should be more sensitive to
industry specificities, reflecting the exact nature of localization externalities and
different modes of performance.
Tanner (2014) presents a study that considers the emergence of new
industries. Literature analysis, patent data and qualitative interviews reveal that
some regional diversification processes occur in regions where pre-existing
economic activities are not technologically related to the emerging industry.
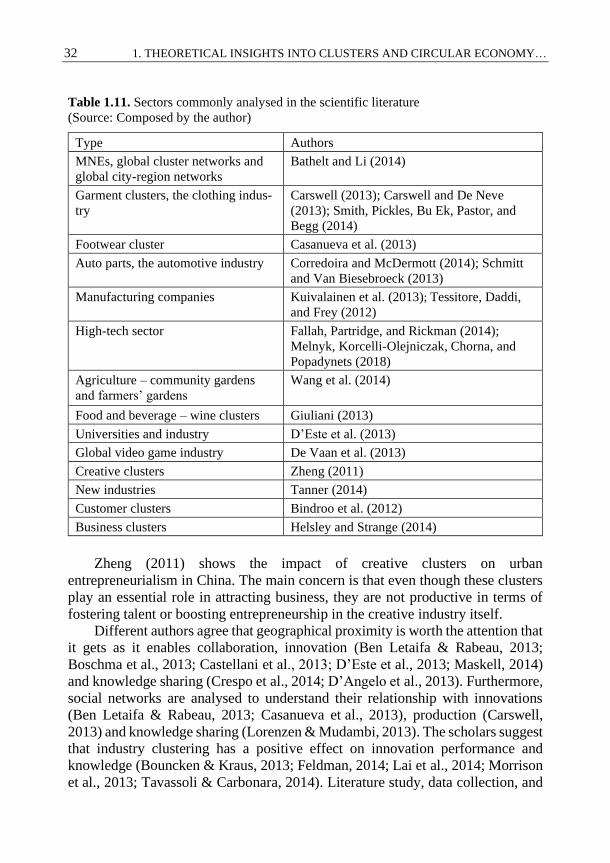
32 1. THEORETICAL INSIGHTS INTO CLUSTERS AND CIRCULAR ECONOMY…
Table 1.11. Sectors commonly analysed in the scientific literature
(Source: Composed by the author)
Type Authors
MNEs, global cluster networks and
global city-region networks
Bathelt and Li (2014)
Garment clusters, the clothing indus-
try
Carswell (2013); Carswell and De Neve
(2013); Smith, Pickles, Bu Ek, Pastor, and
Begg (2014)
Footwear cluster Casanueva et al. (2013)
Auto parts, the automotive industry Corredoira and McDermott (2014); Schmitt
and Van Biesebroeck (2013)
Manufacturing companies Kuivalainen et al. (2013); Tessitore, Daddi,
and Frey (2012)
High-tech sector Fallah, Partridge, and Rickman (2014);
Melnyk, Korcelli-Olejniczak, Chorna, and
Popadynets (2018)
Agriculture – community gardens
and farmers’ gardens
Wang et al. (2014)
Food and beverage – wine clusters Giuliani (2013)
Universities and industry D’Este et al. (2013)
Global video game industry De Vaan et al. (2013)
Creative clusters Zheng (2011)
New industries Tanner (2014)
Customer clusters Bindroo et al. (2012)
Business clusters Helsley and Strange (2014)
Zheng (2011) shows the impact of creative clusters on urban
entrepreneurialism in China. The main concern is that even though these clusters
play an essential role in attracting business, they are not productive in terms of
fostering talent or boosting entrepreneurship in the creative industry itself.
Different authors agree that geographical proximity is worth the attention that
it gets as it enables collaboration, innovation (Ben Letaifa & Rabeau, 2013;
Boschma et al., 2013; Castellani et al., 2013; D’Este et al., 2013; Maskell, 2014)
and knowledge sharing (Crespo et al., 2014; D’Angelo et al., 2013). Furthermore,
social networks are analysed to understand their relationship with innovations
(Ben Letaifa & Rabeau, 2013; Casanueva et al., 2013), production (Carswell,
2013) and knowledge sharing (Lorenzen & Mudambi, 2013). The scholars suggest
that industry clustering has a positive effect on innovation performance and
knowledge (Bouncken & Kraus, 2013; Feldman, 2014; Lai et al., 2014; Morrison
et al., 2013; Tavassoli & Carbonara, 2014). Literature study, data collection, and

1. THEORETICAL INSIGHTS INTO CLUSTERS AND CIRCULAR ECONOMY… 33
analysis allow the conclusion that profit-making or capital accumulation can differ
depending on companies’ upgrades (Tokatli, 2013) or path dependence (Dobusch
& Schüßler, 2013). D’Agostino et al. (2013) study the relationship between a
region’s home and foreign investments in R&D that affect a home’s regional
knowledge production. Recent research on competitiveness and clusters for
regions and regional policy shows that policies are mostly focused on
strengthening existing agglomerations rather than establishing new ones (Ketels,
2013). The concept of creating shared value which is emphasized by scholars in
cluster studies also receives criticism for several reasons, such as not being
original, ignoring tension between social and economic goals, being naïve about
the challenges of business compliance, and having as its basis a shallow
conception of the corporation’s role in society. On the other hand, this concept has
strengths in successfully appealing to practitioners and scholars, elevating social
goals to the strategic level, articulating a clear role for governments in responsible
behaviour, adding rigour to ideas of conscious capitalism, and providing loosely
connected concept (Crane, Palazzo, Spence, & Matten, 2014).
1.4. Theoretical Overview of the Importance of Transition to Circular Economy
The use of natural resources has increased unprecedentedly in the last hundred
years, in line with human development. Due to increased global resource extrac-
tion, which has mostly affected economic development in Europe, North America
and other parts of the world, transition to the CE becomes a complex task that
needs to be maintained by the government and implemented long term (Winans,
Kendall, & Deng, 2017). A new ambitious CE package has been adopted by the
European Commission (European Commission, 2018) that encourages shifting
from a linear economy to a more circular economy that is stronger due to the sus-
tainable use of resources. Benefits will be brought to the environment and the
economy through the proposed actions, contributing to closing the loop of product
lifecycles through promoting recycling and reuse (Niero & Olsen, 2016).
By definition, CE is viewed as an industrial system designed or intended to
be restorative or regenerative (Haas, Krausmann, Wiedenhofer, & Heinz, 2015;
Hobson, 2016; Jiao & Boons, 2017; Murray, Skene, & Haynes, 2017) and
promoted by scholars, policymakers, NGOs and corporations. Global
corporations such as Google, Cisco and Philips took advantage of this idea even
before the European Commission presented ‘Closing the loop: An EU action plan
for the circular economy’ (European Commission, 2015; Hobson et al., 2016).
However, CE is not that easy for SMEs to implement due to a lack of resources,
R&D personnel, information systems, and other limitations that require financing

34 1. THEORETICAL INSIGHTS INTO CLUSTERS AND CIRCULAR ECONOMY…
(Geissdoerfer, Savaget, Bocken, & Hultink, 2017; Ghisellini, Cialani, & Ulgiati,
2016; Lewandowski, Lewandowski, & Mateusz, 2016; Park, Sarkis, & Wu, 2010).
The degree of pollution in the natural environment is recognized as a
consequence of stagnant production formation, resource over-consumption, and
population growth. The living conditions of people, especially in Western
countries, have improved because of industrial development. Although there is
another side to this phenomenon, poverty has increased rather than decreased due
to economic growth (Mogos, Davis, & Baptista, 2020). Ultimately, poverty has
grown faster than the world’s gross economic product, demonstrating that living
standards depend not only on material wellbeing but also on human relationships
with the environment.
This literature analysis aims to offer an overview of the CE and to review the
possibilities to connect business and science so that innovative technologies and
products are developed to increase SMEs’ resource efficiency through clusters
and cluster organizations. Generally, SMEs cannot become involved in the CE on
their own. They lack knowledge, resources, financing, and other components.
These limitations can be eliminated by clusters or cluster organizations.
Companies in clusters gain a competitive advantage by being able to integrate into
a larger unit and use common properties. Indicators that may help determine the
possibility of companies belonging to a cluster being involved in the CE are
identified in this chapter. Later in this sudy author suggests the indicators and test
how close cooperation and other advantages that companies obtain from
belonging to a cluster can affect their engagement in the CE and resource
efficiency. These benefits can be used in the further development of circular value
chains within a cluster.
Bibliometric analysis was applied to identify the trends in CE and how it is
viewed through clusters. The material was selected from the Web of Science
(Claritive Analytics) platform, which provides world-class research literature.
This platform allows access to the Web of Science Core Collection, the main
advantages of which are the fully indexed and searchable publications, with
searches across all authors and all author affiliations. Citation alerts allow citation
tracking, Citation reports enable the graphical representation of citation activity
and trends, and publication patterns can be identified.
The primary search was initiated with the keywords ‘circular economy’ for a
search by topic. The search yielded 4,809 results, with publications from 1991
onwards (Figure 1.1). During the last six years, the number of publications has
doubled almost every year, reaching 1,617 in 2019. The growth of interest in the
CE is evident, as the total number of publications has reached 4,010 since the
number started growing exponentially in 2014. Almost one-third were published
during the last year.

1. THEORETICAL INSIGHTS INTO CLUSTERS AND CIRCULAR ECONOMY… 35
Fig. 1.1. The dynamics of interest in the topic ‘circular economy’ in Web of Science
(Caritive Analytics) database, 1991–2019
(Source: Composed by the author based on Web of Science (Claritive Analytics), 2018)
Further steps included refining the search results according to Web of Science
(Claritive Analytics) categories: environmental sciences, green sustainable
science technology, engineering environmental, environmental studies,
engineering industrial, engineering manufacturing, engineering mechanical,
economics, agricultural economics policy, and business. This research includes
50 articles published in the last five years selected using the criteria of search by
keywords, Web of Science (Claritive Analytics) categories, and publication years.
The traditional bibliographic analysis was chosen because it allows the
researcher to track the latest trends in the scientific literature regarding the CE. In
this case, a limited number of articles were selected, disregarding those articles
which were highly cited but did not fall into one of the Web of Science (Claritive
Analytics) categories selected in this research. From this perspective, the research
method can be applied in further analysis taking into account different Web of
Science (Claritive Analytics) categories or varying the number of selected articles.
There are numerous articles about the CE that emphasize the growing interest
in the field. The concept is studied in various contexts and from different angles.
Some trends are noted, and several articles are selected for closer review.
Examples of literature analysis, case analysis, or more complex assessment are
taken into consideration to present a general image of how CE is studied in the
literature. Figure 1.1 notes authors interested in the field and offers significant
1 2 3 2 2 5 2 7 5 3 3 3 10
15 21
25 61 69 10
6
13
3
11
4
11
0
98
94 1
58
38
2
67
4
10
85
16
17
19
91
19
92
19
93
19
94
19
95
19
96
19
97
19
98
19
99
20
00
20
01
20
02
20
03
20
04
20
05
20
06
20
07
20
08
20
09
20
10
20
11
20
12
20
13
20
14
20
15
20
16
20
17
20
18
20
19

36 1. THEORETICAL INSIGHTS INTO CLUSTERS AND CIRCULAR ECONOMY…
suggestions for further analysis. The articles are selected according to the usage
count in the Web of Science (Claritive Analytics) database.
The CE literature concentrates on different approaches, and consumers and
producers must move towards a more circular way of applying materials. Several
authors mention a linear take-make-consume-dispose economy (Mendoza,
Sharmina, Gallego-Schmid, Heyes, & Azapagic, 2017; Muranko et al., 2017;
Rivera, 2018; Zwirner et al., 2017), which seems to be wrong as resources are
limited and this may endanger future generations. Waste is considered as a
resource or product by Iacovidou, Velenturf, and Purnell (2019), Iuga (2016), Van
Ewijk, Stegemann, and Ekins (2018), Velenturf, Purnell, Tregent, Ferguson, and
Holmes (2018), Wilts, von Gries, and Bahn-Walkowiak (2016), and Zwirner et al.
(2017). The reduce-reuse-recycle is viewed as a component of the CE by Cooper
et al. (2017), Ghenţa and Matei (2018), Heyes, Sharmina, Mendoza, Gallego-
Schmid, and Azapagic (2018), Moreau, Sahakian, van Griethuysen, and Vuille
(2017), Nakamura and Kondo (2018), Vanegas et al. (2018), and Wuttke et al.
(2017). Closing the loop as a way towards CE is considered by Braun, Kleine-
Moellhoff, Reichenberger, and Seiter (2018), Bressanelli, Adrodegari, Perona,
and Saccani (2018), Cerdas et al. (2015), Cole, Gnanapragasam, Singh, and
Cooper (2018), Haupt, Vadenbo, and Hellweg (2017), Hobson et al. (2017),
Niero, Hauschild, Hoffmeyer, and Olsen (2017), Niero and Olsen (2016), Stewart,
Niero, Murdock, and Olsen (2018), and Witjes and Lozano (2016). Lifecycle
assessment is highlighted by Boutkhoum et al. (2016), Junnila et al. (2018), Niero
and Kalbar (2019), and Van der Voet, Van Oers, Verboon, and Kuipers (2018).
Resource efficiency (Huang et al., 2017; Iuga, 2016; Lozano et al., 2018;
Michelini, Moraes, Cunha, Costa, & Ometto, 2017; Milios, 2017; Muranko et al.,
2017; Nußholz, 2017; Pan & Li, 2016; Popa & Popa, 2016; Reuter, 2016; Smol,
Kulczycka, & Avdiushchenko, 2017; Walker, Coleman, Hodgson, Collins, &
Brimacombe, 2018; Wilts et al., 2016) or eco-efficiency (Blomsma & Brennan,
2017; D’Amato et al., 2017; Gregorio, Pié, & Terceño, 2018; Guo, Lo, & Tong,
2016; Kalmykova, Rosado, & Patrício, 2016; Liu et al., 2018) is considered to be
an essential component of the CE. Greener solutions are costly but crucial when
environmental protection is approached.
One of the indicators included by the European Commission (EC) in the CE
indicator set in the thematic area ‘production and consumption’ is the EU’s self-
sufficiency for raw materials, measured as a percentage. This indicator needs to
be mentioned because raw materials are important for the EU’s economy.
Different industrial sectors are dependent on the raw materials, and they are
supplied in a mix of ways, by extraction, recycling and imports. Critical raw
materials are sensitive to supply disruption and are of high importance to the
economy of the EU. Some countries may have significant environmental impacts
that are affected by the extraction of these materials, which might affect

1. THEORETICAL INSIGHTS INTO CLUSTERS AND CIRCULAR ECONOMY… 37
environmental policies. The EU sufficiency for raw materials shows how much of
the EU’s demand is met (Eurostat, n.d.). The indicator is expressed as a percentage
and is defined as import reliance. Import reliance is defined in Eurostat and
includes measures such as net import, apparent consumption, exports and
domestic production.
Some of the raw materials meet the needs of the EU or exceed it, as can be
seen in Figure 1.2. These are indium (115%) and limestone (97.1%). Cobalt
(68.2%), gallium (65.8%) and tungsten (56.4%) fulfil more than half of the EU’s
need. Others, like aluminium (36.4%), silicon (36.3%), germanium (35.9%),
fluorine (30.3%), iron (25.7), copper (17,5%), vanadium (15.6%), lithium
(14.5%), platinum (2.3%) and natural graphite (0.6%) do not reach half of the
need. Elements like dysprosium, europium, magnesium, molybdenum,
neodymium, phosphorus, tantalum and yttrium are fully imported into the EU.
Only a few critical raw materials exceed the needs of the EU; others would be
insufficient even if all were recycled or reused.
Fig. 1.2. The EU’s self-sufficiency for raw materials in 2016, percentages, calculated as
import reliance
(Source: Composed by the author, according to Eurostat).
Although EU countries have a variety of raw materials, the amount of them
is not sufficient. The resources are limited and not easy to access in some cases.
Hence, involvement in the CE might add to the self-sufficiency of critical and
other raw material supply by reducing the need to extract them.
0
20
40
60
80
100
120Fluorspar
Iron
Copper
Lithium
Natural graphite
Platinum
Vanadium
GermaniumAluminium
Gallium
Limestone
Indium
Cobalt
Tungsten
Silicon
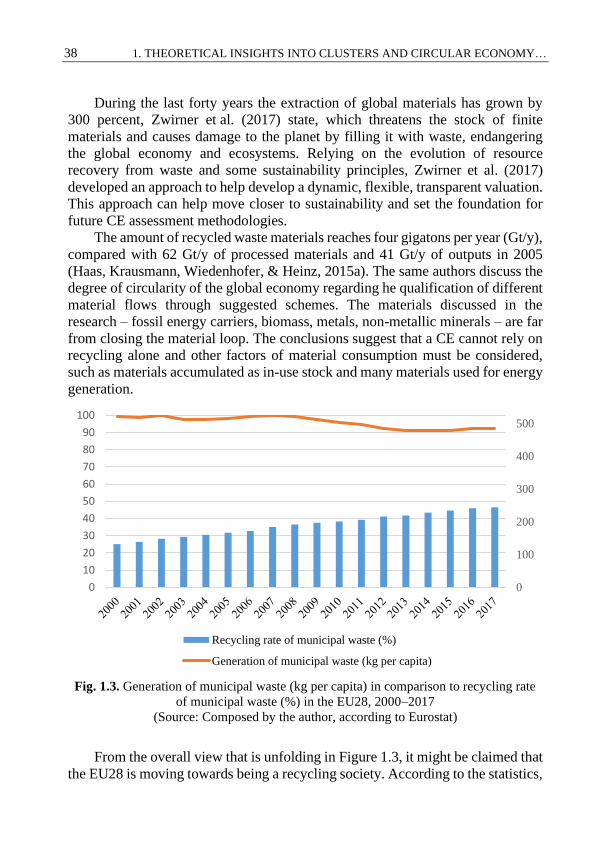
38 1. THEORETICAL INSIGHTS INTO CLUSTERS AND CIRCULAR ECONOMY…
During the last forty years the extraction of global materials has grown by
300 percent, Zwirner et al. (2017) state, which threatens the stock of finite
materials and causes damage to the planet by filling it with waste, endangering
the global economy and ecosystems. Relying on the evolution of resource
recovery from waste and some sustainability principles, Zwirner et al. (2017)
developed an approach to help develop a dynamic, flexible, transparent valuation.
This approach can help move closer to sustainability and set the foundation for
future CE assessment methodologies.
The amount of recycled waste materials reaches four gigatons per year (Gt/y),
compared with 62 Gt/y of processed materials and 41 Gt/y of outputs in 2005
(Haas, Krausmann, Wiedenhofer, & Heinz, 2015a). The same authors discuss the
degree of circularity of the global economy regarding he qualification of different
material flows through suggested schemes. The materials discussed in the
research – fossil energy carriers, biomass, metals, non-metallic minerals – are far
from closing the material loop. The conclusions suggest that a CE cannot rely on
recycling alone and other factors of material consumption must be considered,
such as materials accumulated as in-use stock and many materials used for energy
generation.
Fig. 1.3. Generation of municipal waste (kg per capita) in comparison to recycling rate
of municipal waste (%) in the EU28, 2000–2017
(Source: Composed by the author, according to Eurostat)
From the overall view that is unfolding in Figure 1.3, it might be claimed that
the EU28 is moving towards being a recycling society. According to the statistics,
0
100
200
300
400
500
0
10
20
30
40
50
60
70
80
90
100
Recycling rate of municipal waste (%)
Generation of municipal waste (kg per capita)

1. THEORETICAL INSIGHTS INTO CLUSTERS AND CIRCULAR ECONOMY… 39
521 kg per capita of municipal waste was produced in 2000, reaching a peak of
525 kg per capita in 2002 and later decreasing to its lowest point of 478 kg per
capita in 2014. Over the next three years, the amount of municipal waste per capita
grew to 486 in 2017, although, according to the statistics, the peak of 2002 should
not be reached soon.
The situation with the recycling rate of municipal waste (Figure 1.4), which
measures the share of recycled municipal waste in the total municipal generation,
is different. The indicator includes material recycling, composting and anaerobic
digestion. The ratio is expressed in a percentage as both measures are expressed
in tonnes in primary data. The percentage of recycled municipal waste has grown
gradually since 2000 when it was 25.1 percent, reaching 46.4 percent in 2017. The
growing amount of generated municipal waste (Figure 1.5) since the lowest in
2014 might have affected recycling, which has slowed down in the same period.
Despite that, the recycling rate of municipal waste has grown by 21.3 percent in
the given period.
Fig. 1.4. The recycling rate of municipal waste (%) in the EU28, 2000–2016
(Source: Composed by the author, according to Eurostat)
Other authors still claim that such statistics are not satisfactory when
transition to the CE is discussed. Wilts et al. (2016) assume that resource-efficient
CE must come in action. Only 40 percent of municipal waste generated in the EU
was recycled in 2011, while another 37 percent was landfilled and 23 percent
incinerated, even though around 500 million tonnes could have been reused or
25.1 26.428.2 29.3 30.5 31.7 32.7
3536.5 37.5 38.3 39.2
41.1 41.743.4 44.7 46
0
5
10
15
20
25
30
35
40
45
50
20002001200220032004200520062007200820092010201120122013201420152016
Recycling rate of municipal waste (%)

40 1. THEORETICAL INSIGHTS INTO CLUSTERS AND CIRCULAR ECONOMY…
recycled. Ten countries were selected for a case study targeting current national
framework conditions. The approach addresses two pillars: the policy and
institutional factors versus waste programmes. The study results highlight that the
transition from waste management to integrated resource management depends on
several components. These components are the context sensitivity of incentive
structures, policy mixes, and coordination of policy instruments for transnational
chains that often lead to a generation of waste.
Fig. 1.5. Generation of municipal waste (kg per capita) in the EU28, 2000–2017
(Source: Composed by the author, according to Eurostat)
Li and Su (2012) emphasize the importance of the Chinese chemical industry,
shifting to a CE for this industry to counter severe resource shortage. Other eco-
environmental problems are present, such as pollution, damaging the ecosystem
and lack of resources. Examples are given of companies that have applied the CE
in practice through reusing solid waste, waste heat, and effluents. The shortage of
resources and infinite demands have encouraged companies to turn to a CE. The
method suggested in Li and Su’s research helps to diagnose dynamic circular
economic development trends and make a comparison between different
companies to indicate the stage of CE development. Four features of a CE are
indicated: minimum investment, minimum effluents, maximum exploitation of
resources, and renewable energies, or least influencing the environment.
Waste is introduced as a product by Iuga (2016). The differences in waste
generation in urban and rural areas are described with classification and objectives
450
460
470
480
490
500
510
520
530
Generation of municipal waste (kg per capita)

1. THEORETICAL INSIGHTS INTO CLUSTERS AND CIRCULAR ECONOMY… 41
of solid waste management provided. The author introduces measures which can
be identified as aiming at reducing waste: reduction of materials, product
durability, production efficiency, substitution of products, recycling, eco-design
of products, service maintenance/repair, consumer support in waste reduction,
systemizing separation and collection of waste, and encouraging industrial
symbiosis. A comparison of different resource efficiency indicators is provided,
comparing Romania and the EU by adopting a ‘turning waste into a resource’
approach, where domestic material consumption in Romania was measured before
and after joining the EU. Romania’s dependence on imports, which may impact
its vulnerability, can be reduced by transitioning to a CE.
It is often suggested that the paper sector has high recycling rates. The study
by Van Ewijk et al. (2018) suggests that the previous recycling metrics do not
provide enough information, and final products and reused waste as outputs of a
process should be considered as material efficiency.
The results of implementing the Resource Recovery from Waste (RRfW)
programme in the United Kingdom (UK) are presented by Velenturf et al. (2018).
It is identified that the UK’s economy is overly reliant on unsustainable
production and consumption. Iacovidou, Velenturf, and Purnell (2019) in the
study state that materials, components and products (MCPs) reproduced from
waste are of a low quality, which makes them uncompetitive with their virgin
counterparts. The quality of MCPs and inefficiency encouraged the resource
reprocessing industry and the manufacturing sector to look for resource efficiency
solutions. A quality assessment typology is suggested in the study, presented in
the single-use plastic bottle manufacturing process, although it can apply to any
MCP as a screening tool for the identification of sustainable interventions.
The principles of the CE are discussed by Moreau et al. (2017), starting with
three main components: reduce, reuse, and recycle. It is highlighted that following
these principles may lead to lower energy intensity and higher labour intensity,
but the proportions highly depend on institutions. National and economic policies
can impact the profitability of CE through waste management and resource
efficiency. The core of the economy is presented as labour, which has a renewable
nature, and should be involved in remanufacturing and recycling.
Cooper et al. (2017) conduct a study aiming to analyse the energy demand
reduction that might be achieved through CE opportunities, and identify the
priority areas that should be changed to achieve better results. The findings
suggest that CE approaches may be able to reduce energy demand.
The research paper by Witjes and Lozano (2016) is designed to bridge the
gap between sustainable public procurement and sustainable business models. The
proposed model suggests moving towards a CE by closing the loops through
recycling, changing the scheme from price per unit to value provided per service
to ensure that technical, non-technical and socio-cultural specifications are

42 1. THEORETICAL INSIGHTS INTO CLUSTERS AND CIRCULAR ECONOMY…
included and the responsibility of the product/service is shared. Collaboration
between procurers and suppliers is considered, enabling raw material utilization
and waste generation to be reduced.
The generation of e-waste, which contains highly toxic materials requiring
specialist treatment and other materials such as carbon and valuable metals like
aluminium, gold and copper, has grown during the last decade. Cole et al. (2018)
present the results of interviews with stakeholders covering end-of-life treatment
of e-waste, extending product lifetimes, repair, and reuse. Reuse should be
encouraged to reduce carbon emissions, extending product lifetime in this way
and closing the loop.
Digital technologies are viewed not only as introducers to serviced business
models but also as supporters of CE models in the research by Bressanelli et al.
(2018). A framework developed in this study investigates how eight identified
functionalities enabled by the Internet of Things (IoT), Big Data, and analytics
affect CE drivers (resource efficiency, extending lifespan, closing the loop).
A closed loop production (CLP) system is introduced in the article by Cerdas
et al. (2015), referring to a potential reduction of carbon emissions, water
consumption, waste avoidance, and embodied energy throughout the lifecycle. A
CLP manufacturing system differs from a cradle-to-cradle (C2C) system, ensuring
that the producer realizes the amount of material recovered and prevents valuable
resources from being disposed to landfill. At the same time, the CLP includes both
forward production activities and backflows to the manufacturers. There are three
reverse flows: consumer returns, which are lightly used and returned by the
customers within the first month, usually not because of defects; end of use, which
are intensively used products with outdated technology; and end of life, which are
non-functioning ancient products with very high recovery and energy costs.
Reverse logistics (RL) is suggested in CLP chains, meaning systematic planning,
implementation and management of the returned product flow to recapture the
value. Industrial symbiosis is described by Cerdas et al. (2015) as serving to create
links between companies to exchange materials, energy, water and by-products.
A hybrid manufacturing/remanufacturing system satisfies product demand
through manufacturing new products or remanufacturing recovered products. The
authors conclude by stating the need to create a production model that merges
some elements of the CLP system into operational elements of a company, using
the term ‘circulation factories’.
Several studies have been conducted by different scholars (Niero et al., 2017;
Niero & Olsen, 2016; Stewart et al., 2018), and aluminium products are usually
considered for one lifecycle in lifecycle assessment, although aluminium cans
have a high potential for products in multiple loops. In the study by Niero and
Olsen (2016), different scenarios were considered; the results show that after 30

1. THEORETICAL INSIGHTS INTO CLUSTERS AND CIRCULAR ECONOMY… 43
loops of aluminium production and recycling, the lifecycle assessment (LCA)
option is more environmentally friendly than other recycling scenarios.
In the article by Niero et al. (2017), eco-efficiency, defined as increasing
value while reducing resource use and pollution, and eco-effectiveness – the
maximization of benefits to ecological and economic systems – are combined to
show what challenges occur when creating circular industrial systems. LCA and
C2C models were combined to develop a continuous loop packaging system for
aluminium cans. LCA adopts a tool-driven approach, which suggests that
products’ environmental performance should be evaluated.
C2C adopts a goal-driven approach, where the goal is to use a cyclical
metabolism through upcycling materials and using waste as a material. Tools and
metrics are then developed to measure progress.
Haupt et al. (2017) question in their article whether currently used scales are
suitable for measuring the CE. The study shows that national statistics usually
refer to data on materials in relation to goods consumed. Such numbers reflect
only the input into recycling systems despite the secondary materials produced.
Here, the official recycling rates are separated into closed- and open-loop
collection, recycling rates, and export rates. The authors conclude that the current
system of indicators showing CE rates fails to describe how much material is kept
within material cycles. Waste management could be improved by adding closed-
and open-loop recycling rates.
Merli et al.'s (2018) extensive literature analysis referring to articles from the
Web of Science (Claritive Analytics) and Scopus databases provides an overview
of how scholars deal with the topic of the CE. Studies on the CE are concentrated
in China and Europe because there are suggestions of how public policies should
be implemented there. Scholars view CE at a macro level of analysis (country,
region, or city), at a micro level for its operationalization in single companies, and
at a meso level for the implementation of industrial symbiosis. The CE concept
has blurred boundaries, for there is no clear definition or universal agreement on
the guiding principles for action, which allows CE to be associated with a variety
of definitions for its roots. Scholars should pay more attention to new approaches
to production and consumption, for there has been a lack of consideration of
circular design and innovative strategies to slow material and resource loops.
Value-focused innovative practices that embody the CE philosophy, such as the
sharing economy, product-service systems, dematerialization and
remanufacturing, should be further explored by academia. The concept of CE is
growing and may open the path towards innovative and sustainable ways of
production and consumption.
Liu and Bai (2014) emphasize that companies usually have a good general
understanding of the CE, a positive view of it, and a relatively strong willingness
to operate it. However, companies lack the enthusiasm to adopt the principles of

44 1. THEORETICAL INSIGHTS INTO CLUSTERS AND CIRCULAR ECONOMY…
CE. For structural, contextual and cultural reasons, knowledge about the positive
effects of CE implementation does not encourage companies to work towards it.
Policymakers focus on regulations to overcome the barriers and engage
companies in operating a CE. Initiatives should encourage companies to establish
eco-industrial chains. Environmental pressure from competing companies and
customers does not affect companies’ behaviour in shifting to a CE.
Wen and Meng (2015) offer an analysis of substance flow and resource
productivity, jointly applied to evaluate the industry’s CE performance in China
quantitatively. Substances can exit the system at multiple stages in the production
chain, and the complicated relationship between enterprises makes the substance
flow analysis extremely challenging at the industrial chain level. The research
shows that resource productivity is high in the chain. Resource productivity can
be enhanced by applying several properties: prolonging industrial chains,
connecting chains, matching projects with recycling companies, designing eco-
industrial chains, and establishing industrial symbiosis systems.
Industrial symbiosis systems can improve industrial systems’ resources and
energy productivity by reducing material consumption and waste discharge to
yield enormous economic and environmental benefits. The same economic output
can be achieved with less resource consumption, as proven by improved resource
productivity. Efficient utilization of resources and energy can be reflected in
resource productivity, which makes it a suitable index for the promotion of CE
and quantitative assessment of industrial symbioses.
Public and political attention can easily be attracted using a catchy
framework, and phrases such as regenerate, share, optimize, loop, virtualize and
exchange serve the purpose Hobson and Lynch (2016). The problem with these
words, according to Hobson and Lynch (2016), is that they are gaining new
meaning in the context of a CE but miss out the social and cultural aspects. The
meaning of phrases incorporated into the definition of CE requires further
exploration and expansion, as they offer non-monetary forms of sharing goods,
ideas and experiences.
Social and political facets of the CE lack significant consideration. The
consumer-limited and problematic means of engaging with the issues at the heart
of the CE, such as responding to environmental labels or renting rather than
buying goods, are not strategies that have to date brought about desired
widespread adoption of sustainable lifestyles. Here, the point is made that CE
debates must include questions related to the society, the citizen, and
consumption, which includes broadening the ontological toolkit of CE debates,
interventions, and policies to include notions of diverse economies and post-
capitalism.
A comprehensive attempt to make sense of the concept of CE is made in
scientific research (Korhonen, Honkasalo, & Seppälä, 2018). All three dimensions

1. THEORETICAL INSIGHTS INTO CLUSTERS AND CIRCULAR ECONOMY… 45
of sustainable development are highlighted: economic, environmental, and social.
The CE concept contributes to the importance of high value and high quality
material cycles in a new way and shows the possibilities of the sharing economy
alongside sustainable production for a more sustainable production-consumption
culture.
Park et al. (2010) state that the integration of business value elements can
guide organizations to gain a competitive advantage while looking at the broader
perspective of supply chains and eco-industrial parks. Sustainability within supply
chains takes on a more critical role as supply chain competitive advantage, rather
than individual, organizational competitive advantage, becomes essential.
Relationships within and between organizations in a CE economy can be
quantified by developing formal models and simulations.
According to the European Commission (Eurostat, n.d.), a CE is about
minimizing the generation of waste and maintaining the value of products,
materials and resources for as long as possible. This new economic model offers
tremendous opportunities to save natural resources and combat climate change,
making production, consumption and waste management more sustainable and
creating local green jobs.
The Circular Economy Action Plan, which was released by the European
Commission in December 2015, offered a framework for monitoring progress,
aiming at the stimulation of transition towards this new model. It is essential to
track progress, although the process is not easy as the transition involves different
areas. Such a monitoring tool should help citizens and policymakers to identify
success factors and help to identify the areas where more action is needed. A more
circular economy is a long-term aim that needs new priorities to be set to achieve
better results.
Ten indicators in four areas are included in the CE monitoring framework,
generally covering the Circular Economy Action Plan: production and
consumption, waste management, secondary raw materials and competitiveness,
and innovation. The structure of indicators is suggested by the European
Commission to cover the four areas and reflect the concept of closing the loop
(Figure 1.6).
Information on these indicators is available from Eurostat, the Joint Research
Centre (JRC), the Directorate-General for Internal Market, Industry,
Entrepreneurship and SMEs (DG GROW), and the European Patent Office. The
indicators which need development are further elaborated, especially for
methodology and data collection. Data are regularly updated to ensure that
reporting is consistent. The four thematic areas cover these indicators: EU self-
sufficiency for raw materials; generation of municipal waste per capita; generation
of waste excluding major mineral wastes per GDP unit; generation of waste
excluding major mineral wastes per domestic material consumption; the recycling

46 1. THEORETICAL INSIGHTS INTO CLUSTERS AND CIRCULAR ECONOMY…
rate of municipal waste; the recycling rate of all waste excluding major mineral
waste; the recycling rate of packaging waste by type of packaging; the recycling
rate of e-waste; recycling of biowaste; the recovery rate of construction and
demolition waste; the contribution of recycled materials to raw materials demand;
the circular material use rate; trade-in of recyclable raw materials; private
investments, jobs, and gross value added related to CE sectors; and patents related
to recycling and secondary raw materials.
Fig. 1.6. Circular economy monitoring framework
(Source: Circular economy. Closing the loop, 2018)
Part of the information in this set of indicators is covered by statistics from
each country collected by national statistics departments. Another part is provided
generally for the EU as a unit.
1/ EU SELF-SUFFICIENCY FOR RAW
MATERIALS
The share of a selection of key materials (including critical raw materials)
used in the EU that are produced within the
EU 2/ GREEN PUBLIC
PROCUREMENT
The share of major public procurements in the EU that include
environmental requirements
3 A-C/ WASTE GENERATION Generation of municipal waste per
capita;
total waste generation (excluding major mineral waste) per GDP unit and in
relation to domestic
material consumption 4/ FOOD WASTE
Amount of food waste generated
5A-B/ OVERALL RECYCLING RATES
Recycling rate of municipal waste and of
all waste except major mineral waste 6A-F / RECYCLING RATES FOR SPE-
CIFIC WASTE STREAMS
Recycling rate of overall packaging waste, plastic packaging,
wood packaging,
waste electrical and electronic equipment,
recycled biowaste per capita and
recovery rate of construction and demolition waste
7A-B/ CONTRIBUTION
OF RECYCLED MATERIALS TO RAW MATERIALS DEMAND
Secondary raw materials’ share of
overall materials demand – for specific materials and for the whole
economy
8/ TRADE IN RECYCLABLE RAW MA-TERIALS
Imports and exports of selected
recyclable raw materials
9A-C/ PRIVATE INVESTMENTS, JOBS
AND GROSS VALUE ADDED
Private investments, number of persons employed and
gross value added in the circular
economy sectors 10/ PATENTS
Number of patents related to waste
management and recycling
COMPETITIVENESS AND INNOVATION
Waste management
Secondary raw material
Production and consumption

1. THEORETICAL INSIGHTS INTO CLUSTERS AND CIRCULAR ECONOMY… 47
Scholars see the CE as a priority for better performance. It is viewed from
different perspectives: resource efficiency or eco-efficiency, where waste is
considered as a resource, closing the loop; and reduce-reuse-recycle approaches
and lifecycle assessment.
The CE occurs at several levels: within the company, between businesses,
between businesses and consumers, and between consumers. It also needs to
involve the public sector. Clusters involve different actors that can encourage
engagement in the CE.
1.5. Review of Methodology Used in Cluster Performance Analysis and Transition to Circular Economy
Scholars are analysing clusters, cluster literature and the CE from different aspects
and employ various techniques for the multidisciplinary nature of the subject,
making it hard to trace the changing themes in the literature (Li et al., 2013;
Tanner, 2014; Zheng, 2011). Literature analysis usually depends on traditional
direct citation counts and co-citation analysis (Lazzeretti et al., 2014), which in
general are past-oriented but can help to trace emerging themes or identify the
shortage of attention to some aspects worthy of further examination (Figure 1.7).
A case study is the most frequently used method in cluster analysis. Different
authors, including Alcácer and Chung (2014), Ben Letaifa and Rabeau (2013),
Boschma et al. (2013), Bouncken and Kraus (2013), Carswell (2013), Daddi et al.
(2012), Dobusch and Schüßler (2013), Funk (2014), Giuliani (2013), He and
Wong (2012), Isaksen (2015), Li et al. (2013), Lorenzen and Mudambi (2013),
Morrison et al. (2013), Schmitt and Van Biesebroeck (2013), Tokatli (2013), and
Zhang and Huang (2012), rely on this method as it enables close or in-depth
research of a single or small number of cases in their natural conditions. It is also
important to note that in this type of analysis, the context and other complex
conditions related to the selection must be studied to understand the object
integrally. The case study helps to answer the questions, whether they are
descriptive – what is happening or has happened? – or clarifying questions – how
or why did something happen? (Yin, 2012). The case study is also valuable for
allowing information to be collected from a real-world setting, avoiding derived
data. In these particular researches, various clusters are taken into account to
examine their conditions and gain a closer understanding of a study’s hypothesis.

48 1. THEORETICAL INSIGHTS INTO CLUSTERS AND CIRCULAR ECONOMY…
Fig. 1.7. Methods used for cluster and circular economy analysis, Web of Science
(Claritive Analytics) database 2013–2015
(Source: Composed by the author based on Web of Science (Claritive Analytics), 2018)
Correlation – regression analysis are among the most popular methods of
analysis and are used by scholars in cluster research. Correlation allows the
association between two variables which are not designed as dependent or
independent to be measured, while regression is used to examine the relationship
between one dependent and one independent variable.Regression consists of
statistics prediction capabilities of performed analysis that can be used to predict
the dependent variable if the independent variable is known. In cluster analysis,
different variables include localization, concentration and market efficiency
(Alcácer and Chung, 2014); social networks and innovation (Casanueva et al.,
2013); knowledge sharing (Crespo et al., 2014); human resource management,
networking and the company’s experience (D’Angelo et al., 2013); eco-
innovation and competitiveness (Daddi et al., 2012); localization externalities (De
Vaan et al., 2013); industry cluster effects, urbanization effects and proximity to
a research university (Fallah et al., 2014); local networking (He & Wong 2012);
0 5 10 15 20
TOPSIS
Questionaire survey
MFA
LCA
Literature analysis
Latent profile analysis
Interview
Heuristic analytical framework
Hazard model
Gravity model
Fuzzy TOPSIS
fsQCA
FAHP
DEA
Data analysis
Correlation and regression analysis
Configuration model
Case study
Bi-objective model
AHP
Clusters Circular economy

1. THEORETICAL INSIGHTS INTO CLUSTERS AND CIRCULAR ECONOMY… 49
corporate knowledge management and innovation performance (Lai et al., 2014);
network relational characteristics (Li et al., 2013); outsourcing of innovation
activities, geographic clustering of companies and mobility of labour (Stanko &
Olleros, 2013); innovative performance, ties between companies and colleges, ties
between companies and industrial associations, and ties between companies (Tan
et al., 2013); variety and intensity of internal and external knowledge (Tavassoli
& Carbonara, 2014), and innovation, regional environment, inter-company
relations, company attributes, company size and technological intensity (Wang &
Lin, 2013; Wang et al., 2014).
Literature analysis is used by Ben Letaifa and Rabeau (2013), Boschma et al.
(2013), Carswell (2013), Crane et al. (2014), D’Agostino et al. (2013), D’Este
et al. (2013), Dobusch and Schüßler (2013), Feldman (2014), Hervas-Oliver et al.
(2015), Ketels (2013), Lazzeretti et al. (2014), Lorenzen and Mudambi (2013),
Maskell (2014), Nathan and Overman (2013), Tanner (2014), Tokatli (2013), and
Zhu et al. (2014).
Bibliometric analysis was used in the study by Lazzeretti et al. (2014) to
review the cluster literature and its evolution by considering the works of the most
prominent researchers. An original database of 1,586 academic articles was
created by the authors, consisting of articles about clusters and industrial districts
published from 1989 to 2010 in international scientific journals. The clustering
algorithm was used to group articles into sub-communities after backward citation
analysis. Hervas-Oliver et al. (2015) suggested a prospective review, employing
bibliometric techniques of literary analysis to identify emerging topics or lines in
the cluster literature. A bibliographic coupling method was introduced to cluster
analysis, allowing the detection of current trends and future cluster analysis
priorities among scholars. Bibliometric analysis is regarded as a traditional
method of analysis with direct citation counts, and bibliometric coupling is
invoked to verify the validity of this method in identifying emerging topics or
lines in the cluster literature.
As a method, an interview can be defined as a research technique involving a
small number of respondents elaborating on a particular idea, situation or
programme. Interviews can be conducted in different formats: structured, semi-
structured, or unstructured. The most significant advantage of an interview is that
a researcher has direct control over the process of collecting detailed information
on research questions and can clarify specific details during the process.
Bouncken and Kraus (2013), Isaksen (2015), Tanner (2014), Tokatli (2013), Zhu
et al. (2014), and other authors use this method in their research.
Data analysis is used as a method to obtain a considerable amount of
information from a particular database and is used by Boschma et al. (2013),
Castellani et al. (2013), Crespo et al. (2014), D’Angelo et al. (2013), and Tanner
(2014) in cluster research.

50 1. THEORETICAL INSIGHTS INTO CLUSTERS AND CIRCULAR ECONOMY…
A questionnaire can be used to gather a considerable amount of data in a
relatively short period of time by means of specific questions planned by a
researcher. In this way, it outweighs data analysis. On the other hand, the answers
cannot be clarified during the process, as is possible during an interview. A
questionnaire was chosen by Li et al. (2013), Tan et al. (2013), and Wang and Lin
(2013).
Lifecycle assessment (LCA) is used by several authors. An LCA-based model
was used by Walker et al. (2018) to test several business models that aim to
achieve greater material efficiency. The conclusions of their study suggest that the
CE supports reducing resource consumption and reusing, remanufacturing, and
recycling materials, and complex indicators should be included to evaluate the
circulation.
Wuttke et al. (2017) consider that the reduce, reuse, recycle (3R) concept
ensures environmental conservation and economic growth through the effective
use of resources. Two of these constituents, reduce and reuse, are considered to
be of high priority for development as they work to prevent waste. Several
methods are employed in the Wuttke et al. (2017) research, such as material flow
analysis (MFA), LCA, substance flow analysis (SFA), lifecycle cost (LCC),
analytic hierarchy process (AHP) and technique for order of preference by
similarity to ideal solution (TOPSIS).
A combination of two MCDM methods is proposed by Boutkhoum et al.
(2016) for industrial organizations in application of green supply chain
management solutions in practice.
Guo et al. (2016) view eco-efficiency as an essential sustainable development
to interact with industrial output, resource utilization, and environmental impacts.
The study identifies that data envelopment analysis (DEA)-based models are
usually used to analyse eco-efficiency, supplemented by the decomposition
approach. The results show that changes in industrial structure have an impact on
eco-efficiency and economic development.
The hazard model used by De Vaan et al. (2013), Giuliani (2013), and Wang
et al. (2014) can be defined as survival-time outcomes on one or more predictors.
It is used to investigate the effect of several variables when a specified event
happens.
Latent profile analysis, used by Bouncken and Kraus (2013), attempts to
estimate the likelihood of each variable, the probability of each observation falling
into each class, and any observation falling into a class.
Castellani et al. (2013) employ the gravity model, which helps to identify the
influence of phenomena on each other that varies according to the distance
between them.
The configuration model is used by Longoni and Cagliano (2015); it is
commonly employed to study the complexity of the interactions among operations

1. THEORETICAL INSIGHTS INTO CLUSTERS AND CIRCULAR ECONOMY… 51
priorities. The multi-dimensional model is often used to chart relationships
between variables that are too complex to be modelled.
Stanko and Olleros (2013) use fuzzy set qualitative comparative analysis
(fsQCA), an analytical technique that implements principles of comparison for
both intensive and integrative analysis. Information can be processed regarding
different combinations of conditions that give a specific outcome.
The bi-objective model is built by Zhang and Huang (2012) to aid analysis.
It is widely used to model supply chain configuration problems, as it naturally fits
to evaluate trade-offs between costs and lead times.
Zhu et al. (2014) formulated a heuristic analytical framework to demonstrate
how environmental regulation, political environment, and regional hub effect
impact a company’s strategies, while these impacts are also affected by the
company’s attributes and capabilities.
The methods used by authors are employed to evaluate clusters or CE as
independent entities. They do not aim to analyse clusters when the transition to
CE considered. The originality of the thesis is revealed through the results of
literature analysis. The results indicate that the methodology of evaluation for
cluster performance in transition to CE was not suggested before.
These considerations determined the choice of evaluation methods for cluster
performance regarding CE, described in later chapters.
1.6. Conclusions of Chapter 1 and Formulation of the Tasks of the Thesis
1. The literature analysis suggests that the definition of a cluster varies
depending on the context where it is used. In this dissertation, clusters
are defined as a form of cooperation among companies and associated
institutions which can supplement or complete each other by
completing vertical (buying and selling chains) and horizontal
(complementary products and services, the use of similar specialized
inputs, technologies or institutions, and other linkages) links using
geographical proximity to achieve competitive advantage through
cooperation. This definition reflects the main features that clusters
must reflect.
2. Nine groups of indicators were identified after the literature analysis
that may be used in clusters’ performance evaluation. These include
proximity, innovation, knowledge, networking-related indicators,
economic, research, government, resource and sustainability
indicators. Scholars view them as having a different impact on
clusters’ performance. Some groups of indicators are interrelated or

52 1. THEORETICAL INSIGHTS INTO CLUSTERS AND CIRCULAR ECONOMY…
can be divided into smaller units, which suggests that some aspects
should get more attention while others can be omitted when
composing the system of indicators for clusters’ performance
evaluation.
3. Resource efficiency is becoming more important for SMEs. They are
interested in reducing energy, material and water costs, and they are
starting to look at circular business models to turn their waste into
assets. Clusters and clusters’ organizations can play a considerable
role in SMEs becoming more resource-efficient.
4. Literature suggests that the CE is an essential and promising concept,
as it attracts the business community to more sustainable development.
The CE is meaningful in cluster development, and it may be one of the
most significant competitive advantages. Different units, individual
companies, or clusters can use it in their activities. Clusters emphasize
the importance of competitive advantage in their activity. Thus, the CE
should be emphasized by individual companies in clusters.
5. Competitive advantage is what makes companies cooperate in
clusters. CE may help companies achieve this goal, as clusters can
connect with corresponding parties to target resource efficiency,
recycling, re-use of materials, and other activities within a unit. The
necessity to propose cluster performance evaluation in transition to CE
economy tool is seen when development and improvement of cluster
is expected.
53
2 Methodology of Evaluation Tool for
Cluster Performance in Transition to Circular Economy
This chapter describes the methods used to form an evaluation tool for cluster
performance in transition to CE, and selected indicators. The MCDM process is
explained, and two methods, SAW and TOPSIS, are characterized in data
processing and calculation of the results. The correlation method is suggested in
the final stage of the research. The indicators selected to include in the evaluation
of clusters’ performance and transition to CE are characterized in detail, and the
tool is presented.
The findings of Chapter 2 have been published in scientific papers
(Razminienė, 2019b, Razminienė & Tvaronavičienė, 2018b, Tvaronavičienė &
Razminienė, 2017, Tvaronavičienė & Razminienė, 2017b).

54 2. METHODOLOGY OF EVALUATION TOOL FOR CLUSTER PERFORMANCE IN…
2.1. Formation of Evaluation Tool for Cluster Performance and Transition to Circular Economy
The monitoring and evaluation of performance are crucial for clusters in the pro-
cess of management. Economic growth may be achieved by applying these pro-
cedures as necessary measures, and up-to-date data are taken into account. The
selection of methods was performed after the literature analysis and in line with
the actual situation with data accessibility.
There are several studies where clusters are assessed in some way. Different
aspects are viewed in the analysis of clusters. Despite attempts to identify the
essential components and indicate their influence on each or several factors
analysed by scholars, it is still complicated to evaluate cluster performance.
Different methods are applied to analyse qualitative and quantitative data, such as
correlation – regression analysis (Casanueva et al., 2013; Crespo et al., 2014;
D’Angelo et al., 2013; Lai et al., 2014; Tavassoli & Carbonara 2014), the
gravitation model (Castellani et al., 2013), and case analysis (Ben Lafeita &
Rabeu, 2013; Boschma et al., 2013; Bouncken & Kraus, 2013; Carswell, 2013;
Dobusch & Schüßler, 2013; Lorenzen & Mudambi, 2013; Morrison et al., 2013;
Tokatli, 2013). The problem of providing the most effective way to evaluate the
data on different phenomena mentioned in cluster studies could be solved by
performing a quantitative evaluation of cluster performance (Ginevičius, 2007;
Rutkauskas & Ginevičius, 2011).
From a variety of methods used in research on clusters and CE analysis,
several were selected for further consideration. Literature analysis was already
employed, which enabled the tracing of how cluster and CE research has evolved
over time, how interest in these topics has changed, and what thematic issues are
still to be considered. This method helped to reveal that clusters and the CE are
gaining popularity, and these topics should be considered together in terms of how
they can be affected by each other, and what might be the consequences of this
interaction in the future. Literature analysis has also revealed that scholars have
made no attempt to evaluate how clusters contribute to the transition to CE, which
validates the thesis’s novelty.
Other methods were selected to complement the study and refine the results.
The use of interviews and questionnaire surveys for cluster analysis confirms the
assumption that researchers may experience a lack of reliable statistical data. This
happens because clusters are composed of companies that differ in size,
specialization, and degree of involvement in everyday activities. This is an explicit
limitation when the collection of data is considered. Most of the information
required in the following research is considered confidential at the company level,
although it should be available when a cluster as a unit is viewed. Researchers
need to collect this information through different channels. One way is to arrange

2. METHODOLOGY OF EVALUATION TOOL FOR CLUSTER PERFORMANCE IN… 55
interviews with the coordinators of clusters. This method requires a high level of
engagement on the part of coordinators with in-depth knowledge of every
member, and it takes time to proceed with data collection. The other option is a
questionnaire survey that allows the collection of information and verification of
data with members of clusters until an answer is arrived at. The data’s reliability
might be questionable when either of these methods is used to collect data as it is
somewhat subjective. However, it is not obligatory to submit data describing
clusters’ performance to any state authority, and no official source of information
was available at the time of data collection. Hence, a questionnaire survey was
used as one method of inside data collection in this research.
A case study is unquestionably relevant in cluster analysis, and the popularity
of the method among scholars confirms that. When choosing a case study as a
research method, it is considered that a researcher examines phenomena in context
without influencing the environment. This method is easy to adapt to previous
methodological choices and complements the tool when a research strategy is
adopted. In the literature, scholars usually apply a multiple case study where
several clusters are selected within the same industry. An embedded case study is
selected in this thesis to provide practical validation of the suggested
methodology, as just some aspects of cases are examined.
It is complicated to evaluate cluster performance as the data for the indicators
to be included in the tool are expressed in different units of measurement. These
aspects should be formalized in the most appropriate solution. Many
methodologies are used in decision-making that share common characteristics of
conflict among criteria, incomparable units, and difficulties in selecting
alternatives. Scholars suggest different multi-criteria evaluation methods for
quantitative evaluation of a particular phenomenon (Chen, 2012; Ginevičius et al.,
2013; Simanaviciene & Ustinovichius, 2010).
Several MCDM methods were seen to be used in both cluster and CE studies.
Methods such as AHP, DEA and TOPSIS are mentioned in the literature
(Boutkhoum et al., 2016; Guo et al., 2016; Wuttke et al., 2017) as being used in
CE studies, while some methods can be integrated into the research strategy to
involve clusters.
Ginevičius et al. (2013) emphasize the importance of developing a set of
criteria as a stage of multi-criteria evaluation of a complex phenomenon. A single
level set of criteria can be provided for experts to determine each criterion’s
weight if number criteria is small and possible to conceive. On the other hand, if
more criteria make it difficult to separate the most important ones from the less
important, their number must be reduced by forming a hierarchical structure
where each hierarchical level is evaluated, starting with the lowest. Hence, the
weight of the criteria at each hierarchical level must be determined.

56 2. METHODOLOGY OF EVALUATION TOOL FOR CLUSTER PERFORMANCE IN…
Correlation – regression analysis is one of the most frequently used cluster
analysis methods, where the degree of association between quantitative variables
is identified. This method is selected for use in the final stage of the cluster
performance in transition to CE evaluation tool. Correlation – regression analysis
enables us to draw conclusions when two variables – clusters’ performance and
transition to CE – are considered.
Attention is paid in this work to cluster performance evaluation and transition
to CE evaluation, and the final step seeks to track the relationship between these
two variables. The tool presented in this chapter can be used for selection of
possible indicators for cluster performance and transition to CE evaluation or for
monitoring and improving cluster performance in transition to CE.
2.2. Selected Indicators for Evaluation of Cluster Competitiveness through Circular Economy
Clusters’ development may enhance the competitiveness of the economy. Gov-
ernments should contribute by encouraging and improving clustering.
The following are aspects of clusters’ development (Lietuvos klasterių
plėtros koncepcija, 2017):
− Developing clusters’ innovative potential.
− Encouraging the export of products created by cluster members and con-
nection to international value chains.
− Enhancing the efficiency of the activities of cluster members.
− Forming a friendly environment for clusters’ establishment, activities, and
development (ecosystem).
− Encouraging cross-sectorial, interregional and international cooperation.
− Spreading the benefits and potential of clustering.
− Encouraging SMEs’ resource efficiency through clustering.
On the national level, clusters usually cannot compare their performance, for
there is no system to serve this purpose. Close analysis of cluster performance
indicators will enable a cluster evaluation tool to be formed to serve this purpose
at the national level. Authors have made earlier attempts to compose a system of
indicators for cluster efficiency evaluation at the national level by identifying
indicators and applying benchmarking techniques to verify the methodology’s
reliability. A system of indicators previously suggested by the author needs to be
supplemented by the inclusion of indicators that enable the identification of how
engagement in a CE adds to the competitiveness of companies belonging to the
cluster.

2. METHODOLOGY OF EVALUATION TOOL FOR CLUSTER PERFORMANCE IN… 57
Resource efficiency is attracting more interest in Europe and globally
(Shahbazi, Wiktorsson, Kurdve, Jönsson, & Bjelkemyr, 2016). Environment-
oriented clusters have escalated this topic, and many have adopted a CE as their
specific focus to help SMEs learn about CE and resource efficiency through
initiated projects. Clusters are essential agents for demonstrating how SMEs can
become more resource-efficient and innovative, and gain competitive advantage.
Companies’ circular value chains may be developed, as clusters usually unite
companies that share such activities and may cultivate links to corresponding
partners.
There have been attempts to evaluate CE cluster development using objective
information entropy, a subjective AHP model (Zhang, Wang, & Hong, 2013), and
green supply chain performance (Jun, 2009; Zhu, Geng, & Lai, 2010), although
these studies need to be improved and require more in-depth analysis. Industrial
symbiosis in the form of eco-industry that represents resource flows of
geographically clustered companies is studied by scholars from a CE point of view
(Yu, Han, & Cui, 2015). Eco-industrial parks may have developed from standard
industrial parks but they still encounter barriers to development (Bellantuono,
Carbonara, & Pontrandolfo, 2017; Geng, Fu, Sarkis, & Xue, 2012; Shi, Chertow,
& Song, 2010; Zhu et al., 2015).
Using the results of the literature analysis of clusters’ performance and CE
(Genovese, Acquaye, Figueroa, & Koh, 2017; Kazancoglu, Kazancoglu, &
Sagnak, 2018; Mesa, Esparragoza, & Maury, 2018), a hierarchical structure was
arranged according to the universal themes to enable experts to evaluate the
importance of each criterion. The most significant intention is to provide an
adequate number of criteria in one group, not exceeding 12 criteria. In the
presented tool the maximum number is ten: it is still possible to process this
number of criteria, and they are divided into groups according to theme. The main
components are intercommunication, financial resources, human resources,
marketing activities in cluster performance, and other CE components. The
criteria that are singled out give the measures for these components.
The main aim of cluster monitoring is to create conditions to adopt evidence-
based solutions to improve the competitiveness in the economy through promoted
and efficient clustering. The Agency for Science, Innovation, and Technology
(MITA) is responsible for monitoring and evaluating clustering in Lithuania.
Currently, this agency is working as a coordinator on implementation of the
Promotion and Development of Innovation Networking (InoLink) project, funded
by the European Fund for Regional Development. The Lithuanian Innovation
Centre works to implement the project. The project’s main aim is to encourage
companies to merge into clusters to increase cluster maturity and promote growth
and international collaboration (KlasterLT, 2018).

58 2. METHODOLOGY OF EVALUATION TOOL FOR CLUSTER PERFORMANCE IN…
The suggested tool for clusters’ competitive advantage includes two groups
of components: clusters’ performance criteria and CE performance measures. The
first group is unquestionably essential to measure a cluster’s performance and see
how it links to competitive advantage and enables the detection of areas that need
to be developed for the cluster’s better performance. The second focuses on the
CE economic indicators through the perspective of clusters.
Lots of attention has been paid to the selection of indicators to form the
evaluation tool for cluster performance in transition to CE. The close literature
analysis in Chapter 1 helped to indicate nine separate groups of cluster
performance indicators. These groups needed clarification and more specific
points. The choice was determined by the author when the alternative national and
international tools were viewed and intersecting points recognized. The criteria
that were selected for clusters’ performance evaluation are based on the literature
analysis (Chapter 1), the national document Lietuvos klasterizacijos studija
(2017), and the European Secretariat for Cluster Analysis (ESCA), which suggests
benchmarking and quality labelling for clusters worldwide. The selected experts
were asked to approve the suggested indicators. This procedure resulted in 25
indicators that included features from the mentioned sources and underwent a
procedure of verification by the experts. The second group of indicators suggests
measures of the CE, which may add to a cluster’s competitiveness if implemented
in cluster activities. This group is based on EC planned actions in monitoring the
process of transfer to CE (Eurostat, n.d.) and is described below.
In previous research, the importance of clusters’ performance evaluation was
emphasized and a possible methodology for clusters’ performance evaluation was
suggested. Here, the system for cluster performance evaluation in transition to CE
is presented. It consists of 35 indicators and starts with two fundamental parts:
clusters’ performance evaluation and transition to CE evaluation.
Here, clusters’ performance includes four components: intercommunication,
financial resources, human resources, and marketing activities (Figure 2.1). Three
components – intercommunication, financial resources, and marketing activities
– include six indicators, while human resources include seven indicators. All
components do not exceed the recommended number of indicators, which leaves
them undivided into smaller categories.
Intercommunication activities include indicators that can help cluster
members to share their knowledge, create interpersonal relations, and
communicate through different channels (Table 2.1).
Regular meetings of cluster members can be arranged according to need. In
this case, it is essential to indicate how often the members should meet in person
to ensure that they are seen often. These regular meetings can include personal
visits of the cluster coordinator to a cluster member. Whether there are any cluster
integration events should be indicated, and how often they take place. A typical

2. METHODOLOGY OF EVALUATION TOOL FOR CLUSTER PERFORMANCE IN… 59
communication platform would enable coherent information flow for all members
and allow convenient access to the shared pool of information. Different cluster
publications can be released, such as booklets, newsletters, and others. Other
important activities include cooperation when creating new products or
technologies and when creating innovations. Innovations can be organizational,
marketing, and others. Cluster members can also participate in training,
workshops, conferences, and internships to uphold their interpersonal relations
while raising their qualifications. Smooth knowledge transfer can be ensured by a
common database and informal sharing of knowledge and experience.
Technology transfer must also be ensured in a cluster.
Fig. 2.1. Clusters’ performance evaluation components
(Source: Composed by the author)
Table 2.1. Intercommunication criteria in cluster performance evaluation
(Source: Composed by the author)
No. Criterion
C1 Cooperation when creating new products or technologies
C2 Cooperation when creating innovations (organizational, marketing and other)
C3 Joint training, workshops, conferences, internships
C4 Common database
C5 Informal sharing of knowledge and experience
C6 Transference of technologies
Marketing activities include indicators which enable promotion of the cluster
in the society (Table 2.2). This can be achieved through joint supply and ordering
schemes, as well as distribution channels. Cluster members can prepare tenders to
Financial resources
Marketing activities
Human resources
Intercom-munication

60 2. METHODOLOGY OF EVALUATION TOOL FOR CLUSTER PERFORMANCE IN…
reach external clients. Common market information should be exchanged between
cluster members to help identify companies belonging to the same unit. Leaflets,
media and other means of communication could be used for cluster
advertisements. Exhibitions and fairs can work as suitable means of cluster
promotion with cluster members’ participation as representatives. The internet can
help inform the public about the cluster and promote visibility. A logo or brand as
visual identification helps cluster to be easily recognizable in any context.
Advertising can work on different channels, although the cluster’s image in mass
media should be highlighted and maintained.
Table 2.2. Marketing activities criteria in cluster performance evaluation
(Source: Composed by the author)
No. Criterion
C7 Common supply and order scheme
C8 Common distribution channels
C9 Common cluster members’ tenders for external clients
C10 Exchange of common market information between cluster members
C11 Common participation in exhibitions and fairs
C12 Visual identification (common logo, brand)
Human resources indicate the qualifications of personnel in a cluster, what
kind of training they get, how the cluster is coordinated, and other necessary
information (Table 2.3).
Table 2.3. Human resources criteria in cluster performance evaluation
(Source: Composed by the author)
No. Criterion
C13 Increase in cluster members’ employees in two years
C14 Number of employees upgrading qualifications in two years
C15 Average salary of cluster members
C16 University graduates working at cluster companies
C17 Number of cluster members – companies, R&D subjects, supporting organiza-
tions
C18 Number of members that coordinates cluster
C19 Years of cluster establishment
The indicators in human resources criteria include the increased number of
employees in member companies during the last two years to indicate growth, the

2. METHODOLOGY OF EVALUATION TOOL FOR CLUSTER PERFORMANCE IN… 61
number of employees who participated in internal cluster training during the same
period, and the number of trainings organized by the cluster in two years. How
many employees have upgraded their qualifications in the last two years needs to
be indicated? The number of university graduates working in cluster companies
helps to indicate the qualifications of personnel. Was there an increase in direct
employment in innovative cluster activities, and how many employees work for
R&D activities? The cluster members’ structure should be clear, naming
companies, R&D subjects, supporting organizations, educational institutions, and
the number of members that coordinates cluster.Financial resources are composed
to include indicators that determine financial information about cluster initiatives
(Table 2.4).
Table 2.4. Financial resources criteria for evaluation of cluster performance
(Source: Composed by the author)
No. Criterion
C20 Common cluster projects in last two years
C21 Financed common cluster projects in two years with cluster initiatives co-fi-
nancing
C22 External financing of cluster initiatives in two years
C23 Number of joint submitted/funded EU SF projects in two years
C24 Number of joint international R&D projects, not funded by EU SF, in two
years
C25 Total amount of cluster members’ investment in cluster initiatives in two years
Clusters are highly dependent on funding, which is why different means of
funding are selected for evaluation. The number of joint cluster projects should be
indicated. Co-financing of cluster initiatives is crucial in cluster development, so
the number of such financed cluster projects in two years should be provided.
External financing of cluster initiatives should be stated in the same period.
European institutions demonstrate the importance of R&D, and investment is
promoted, which means that the part played by R&D expenses in the same period
needs to be provided. Projects submitted and funded by the European Union
Structural Funds (EU SF) need to be indicated, and international R&D projects
prepared by cluster members with backing other than by the EU SF. How many
cluster members have invested in cluster initiatives in the last two years?
These cluster performance criteria give information that can be evaluated
using other methods. Categories can be supplemented or replaced by other criteria
according to need, although attention should be paid to the importance of every
criterion so as not to reduce the survey’s quality.
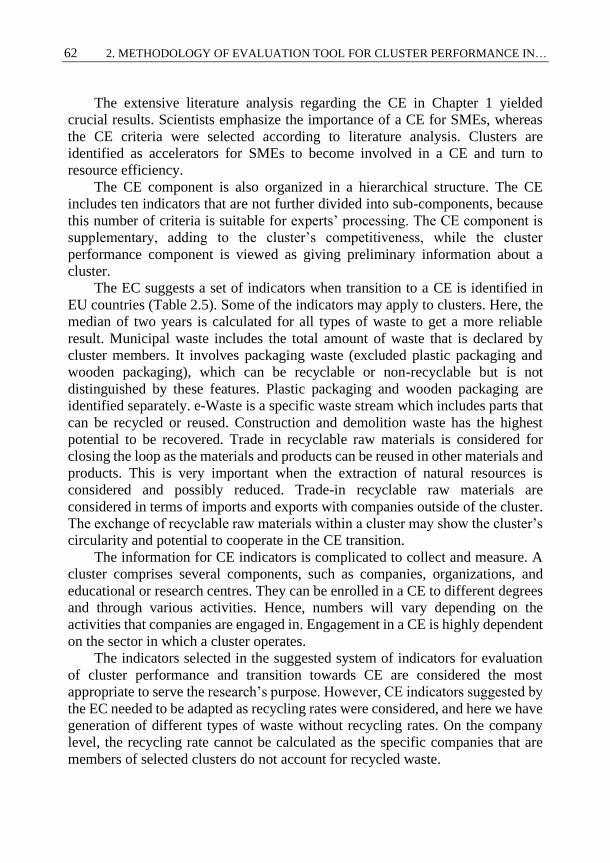
62 2. METHODOLOGY OF EVALUATION TOOL FOR CLUSTER PERFORMANCE IN…
The extensive literature analysis regarding the CE in Chapter 1 yielded
crucial results. Scientists emphasize the importance of a CE for SMEs, whereas
the CE criteria were selected according to literature analysis. Clusters are
identified as accelerators for SMEs to become involved in a CE and turn to
resource efficiency.
The CE component is also organized in a hierarchical structure. The CE
includes ten indicators that are not further divided into sub-components, because
this number of criteria is suitable for experts’ processing. The CE component is
supplementary, adding to the cluster’s competitiveness, while the cluster
performance component is viewed as giving preliminary information about a
cluster.
The EC suggests a set of indicators when transition to a CE is identified in
EU countries (Table 2.5). Some of the indicators may apply to clusters. Here, the
median of two years is calculated for all types of waste to get a more reliable
result. Municipal waste includes the total amount of waste that is declared by
cluster members. It involves packaging waste (excluded plastic packaging and
wooden packaging), which can be recyclable or non-recyclable but is not
distinguished by these features. Plastic packaging and wooden packaging are
identified separately. e-Waste is a specific waste stream which includes parts that
can be recycled or reused. Construction and demolition waste has the highest
potential to be recovered. Trade in recyclable raw materials is considered for
closing the loop as the materials and products can be reused in other materials and
products. This is very important when the extraction of natural resources is
considered and possibly reduced. Trade-in recyclable raw materials are
considered in terms of imports and exports with companies outside of the cluster.
The exchange of recyclable raw materials within a cluster may show the cluster’s
circularity and potential to cooperate in the CE transition.
The information for CE indicators is complicated to collect and measure. A
cluster comprises several components, such as companies, organizations, and
educational or research centres. They can be enrolled in a CE to different degrees
and through various activities. Hence, numbers will vary depending on the
activities that companies are engaged in. Engagement in a CE is highly dependent
on the sector in which a cluster operates.
The indicators selected in the suggested system of indicators for evaluation
of cluster performance and transition towards CE are considered the most
appropriate to serve the research’s purpose. However, CE indicators suggested by
the EC needed to be adapted as recycling rates were considered, and here we have
generation of different types of waste without recycling rates. On the company
level, the recycling rate cannot be calculated as the specific companies that are
members of selected clusters do not account for recycled waste.

2. METHODOLOGY OF EVALUATION TOOL FOR CLUSTER PERFORMANCE IN… 63
Table 2.5. Circular economy criteria in evaluation of clusters’ transition to the circular
economy (Source: Composed by the author)
No. Criterion
C26 Generation of municipal waste per cluster
C27 Packaging waste
C28 Plastic packaging waste
C29 Wooden packaging waste
C30 e-Waste
C31 Biowaste
C32 Construction and demolition waste
C33 Trade in recyclable raw materials: imports
C34 Trade in recyclable raw materials: exports
C35 Trade in recyclable raw materials: intra
The collection of data went through several stages, as different sources had
to be trusted (Table 2.6). Cluster performance indicators in intercommunication
activities and marketing activities were evaluated by cluster coordinators through
a questionnaire. Data on human resources – mainly the increase in the number of
cluster members’ employees in two years, the number of employees upgrading
qualifications in two years, and the number of university graduates working at
cluster companies – were provided by cluster coordinators through a
questionnaire. Data about the average salary of cluster members were collected
from open company data provided by the State Social Insurance Fund Board under
the Ministry of Social Security and Labour, State Budgetary Institution (SODRA).
The number of cluster members (companies, R&D subjects, supporting
organizations), the number of cluster coordinating members and years of cluster
establishment were collected from the official website KlasterLT, created and
administrated by MITA, where information about clusters is provided. Data on
financial resources were provided by cluster coordinators through a questionnaire.
The data on transition to a CE were also taken from different sources: all data
about the generation of waste – generation of municipal waste per cluster,
packaging waste, plastic packaging waste, wooden packaging waste, e-waste, bio
waste, construction and demolition waste – were collected from the Environment
Protection Agency (EPA), and cluster coordinators provided data on all three
indicators of trade in recyclable raw materials – imports, exports and exchanges
of recyclable raw materials within a cluster – through a questionnaire. As a long
view needs to be taken to achieve better results for the workforce in terms of
achieving a competitive advantage, assuming that proper management is applied
(Pfeffer, 1995), two years (2017–2018) were chosen for this work. The median of
these two years was calculated because it is more informative in this case.

64 2. METHODOLOGY OF EVALUATION TOOL FOR CLUSTER PERFORMANCE IN…
Table 2.6. Types of data source by criteria (Source: Composed by the author)
Category Crite-
rion
Description Source
Cluster
performance
evaluation
C1 Evaluation on 1–8 scale Questionnaire
C2 Evaluation on 1–8 scale Questionnaire
C3 Evaluation on 1–8 scale Questionnaire
C4 Evaluation on 1–8 scale Questionnaire
C5 Evaluation on 1–8 scale Questionnaire
C6 Evaluation on 1–8 scale Questionnaire
C7 Evaluation on 1–8 scale Questionnaire
C8 Evaluation on 1–8 scale Questionnaire
C9 Evaluation on 1–8 scale Questionnaire
C10 Evaluation on 1–8 scale Questionnaire
C11 Evaluation on 1–8 scale Questionnaire
C12 Evaluation on 1–8 scale Questionnaire
C13 Percentage growth in 2 years Questionnaire
C14 Number of employees Questionnaire
C15 Two-year median Sodra.lt
C16 Number of employees Questionnaire
C17 Number of members KlasterLT
C18 Number of coordinators KlasterLT
C19 Age of a cluster KlasterLT
C20 Number of projects Questionnaire
C21 Number of projects Questionnaire
C22 Two-year median Questionnaire
C23 Number of projects Questionnaire
C24 Number of projects Questionnaire
C25 Two-year median Questionnaire
Transition to CE
evaluation
C26 Two-year median EPA
C27 Two-year median EPA
C28 Two-year median EPA
C29 Two-year median EPA
C30 Two-year median EPA
C31 Two-year median EPA
C32 Two-year median EPA
C33 Share of trading members
among all members
Questionnaire
C34 Share of trading members
among all members
Questionnaire
C35 Share of trading members
among all members
Questionnaire
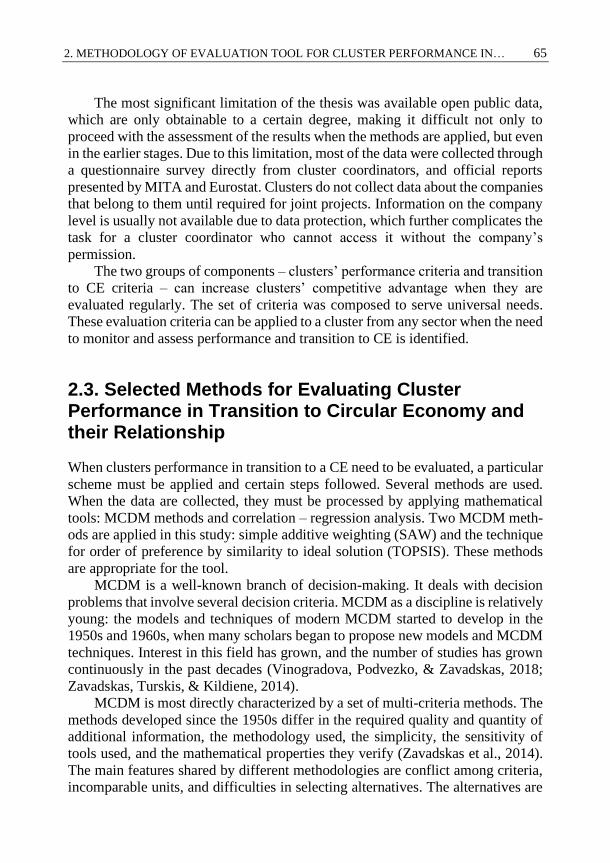
2. METHODOLOGY OF EVALUATION TOOL FOR CLUSTER PERFORMANCE IN… 65
The most significant limitation of the thesis was available open public data,
which are only obtainable to a certain degree, making it difficult not only to
proceed with the assessment of the results when the methods are applied, but even
in the earlier stages. Due to this limitation, most of the data were collected through
a questionnaire survey directly from cluster coordinators, and official reports
presented by MITA and Eurostat. Clusters do not collect data about the companies
that belong to them until required for joint projects. Information on the company
level is usually not available due to data protection, which further complicates the
task for a cluster coordinator who cannot access it without the company’s
permission.
The two groups of components – clusters’ performance criteria and transition
to CE criteria – can increase clusters’ competitive advantage when they are
evaluated regularly. The set of criteria was composed to serve universal needs.
These evaluation criteria can be applied to a cluster from any sector when the need
to monitor and assess performance and transition to CE is identified.
2.3. Selected Methods for Evaluating Cluster Performance in Transition to Circular Economy and their Relationship
When clusters performance in transition to a CE need to be evaluated, a particular
scheme must be applied and certain steps followed. Several methods are used.
When the data are collected, they must be processed by applying mathematical
tools: MCDM methods and correlation – regression analysis. Two MCDM meth-
ods are applied in this study: simple additive weighting (SAW) and the technique
for order of preference by similarity to ideal solution (TOPSIS). These methods
are appropriate for the tool.
MCDM is a well-known branch of decision-making. It deals with decision
problems that involve several decision criteria. MCDM as a discipline is relatively
young: the models and techniques of modern MCDM started to develop in the
1950s and 1960s, when many scholars began to propose new models and MCDM
techniques. Interest in this field has grown, and the number of studies has grown
continuously in the past decades (Vinogradova, Podvezko, & Zavadskas, 2018;
Zavadskas, Turskis, & Kildiene, 2014).
MCDM is most directly characterized by a set of multi-criteria methods. The
methods developed since the 1950s differ in the required quality and quantity of
additional information, the methodology used, the simplicity, the sensitivity of
tools used, and the mathematical properties they verify (Zavadskas et al., 2014).
The main features shared by different methodologies are conflict among criteria,
incomparable units, and difficulties in selecting alternatives. The alternatives are

66 2. METHODOLOGY OF EVALUATION TOOL FOR CLUSTER PERFORMANCE IN…
not predetermined in MCDM: a set of objective functions is optimized by a set of
constraints. The best solution is sought by evaluating a small number of
alternatives against a set of criteria that are often hard to quantify. The alternatives
are sought by comparing the selections considering each criterion. The MCDM
process is shown in Figure 2.2.
MCDM methods can be used to solve both theoretical and practical problems.
They are universal in their potential to evaluate quantitatively any complicated
object described by a set of criteria (Ginevičius & Podvezko, 2008). Quantitative
multi-criteria evaluation methods differ in their concept, type of data
normalization, the way of combining the data, the criteria weights determination,
the range of variation of criteria values, and the influence of the initial data
(Ginevičius & Podvezko, 2010). The critical point is that it is possible to make
decisions based on multi-criteria analysis results, to compare them, and to analyse
the reasons for some alternatives to demonstrate better results than others
(Ginevičius & Podvezko, 2008). In order to apply multi-criteria evaluation
methods, the following procedures should be performed in three steps: a set of
criteria describing the object considered should be developed; the criteria weights
and significances should be determined; and an appropriate multi-criteria
evaluation method should be chosen.
The purpose of quantitative evaluation of cluster performance in transition
towards a CE is the effective management of the cluster after the targeted criteria
are examined and all possibilities of improving them are considered and applied.
Multi-criteria analysis should perfectly serve this purpose and allow valuable
observations of cluster performance in transition to CE improvement to be made
after the evaluation. A hierarchical structure must be considered for cluster
performance evaluation, then SAW and TOPSIS methods applied to process the
data.
A socioeconomic system is vast and complicated. Therefore, the main goal is
grouping the criteria describing its performance according to particular
characteristics rather than searching for their interrelations (Ginevičius,
Podvezko, & Ginevičius, 2013). Before providing the criteria for evaluation by
the experts, a hierarchical structure must be created with different hierarchical
levels for experts, who cannot cope with numerous criteria. As mentioned before,
the number of criteria must not exceed twelve, so a hierarchical structure must be
divided into hierarchical levels depending on the connecting theme of the criteria.
It has been proved that the accuracy of the decisions made by experts does not
decrease if the evaluations are close to equal (Libby & Blashfield, 1978). If the
number of experts is seven, the accuracy of evaluations is more than 90 percent,
and there is no significant change when the number of experts is increased.
The next step includes expert evaluation, with the weights assigned by the
experts. Their given weights must be reasonable and coincide to a certain degree.

2. METHODOLOGY OF EVALUATION TOOL FOR CLUSTER PERFORMANCE IN… 67
The expert evaluation is based on the assumption that a decision can only be
reached after assessing the compatibility of experts’ opinions. The weights of
indicators are determined in that way. Notably, expert evaluation depends on the
expert’s qualifications, work specifics, and other measures. In this work, all these
recommendations were followed: experts are selected according to their
competences, which makes expert evaluation reliable and suitable for determining
the significance of indicators. Any measurement scale can be applied to the
assessment – units of indicators, percentages, a ten-point system. Experts evaluate
the indicators by ranking them. Ranking is a procedure in which the most critical
indicator is given a rank equal to one, and others are ranked according to
importance.
Fig. 2.2. Multicriteria decision-making process
(Source: Pohekar, Ramachandran, Pohekar, and Ramachandran, 2004)

68 2. METHODOLOGY OF EVALUATION TOOL FOR CLUSTER PERFORMANCE IN…
Since experts give the weights of criteria, the consistency of their evaluations
should be checked. This is usually done using Kendall’s concordance coefficient
𝑊 (1) and criterion value (Podvezko, 2007):
𝑊 = 12𝑆
𝑇2(𝑚2 − 𝑚) − 𝑇 ∑ 𝑅𝑡𝑇𝑡 = 1
, (2.1)
where 𝑚 is the number of comparators or elements, 𝑇 is the number of experts, 𝑆
is the deviation of the sum of the squares of the expert assessments from the over-
all average (3), and 𝑅𝑡 is the associated rank indicator (4).
If the expert opinions are consistent, the value of the concordance coefficient
𝑊is close to one; if the estimates differ significantly, the value is close to zero.
= 12𝑆
𝑇𝑚(𝑚 + 1) −1
𝑚 − 1∑ 𝑅𝑡
𝑇𝑡 = 1
. (2.2)
According to the chosen significance level (in practice, the value is usually
0.05 or 0.01), we find the critical value 𝑘𝑟2 . If the value of calculated according
to formula (2) is higher than 𝑘𝑟2 , it means that the expert estimates are consistent.
𝑆 = ∑(𝑠𝑖 − 𝑠)2,
𝑚
𝑖 = 1
(2.3)
when 𝑠𝑖 is the sum of the ranks of each comparator, 𝑠 is the total average
𝑅𝑡 = ∑ (𝑙𝑔3 − 𝑙𝑔),
𝐺𝑡
𝑔 = 1
(2.4)
where 𝑙𝑔is the number of tied ranks in each (𝑙) of 𝐺𝑡 groups of ties.
When the consistency of experts’ opinions is calculated, the weights of the
indicators are determined. All weighting methods are based on an expert survey.
The most common methods of determining weights are direct and indirect rank-
ing. The direct weighting method is most commonly used in practice. The method
is as precise and logical as the ranking of indicators, but its accuracy is much
higher. The sum of weights of each expert’s assessments must be equal to one, or
100 percent, when the direct method of determining weights of indicators is used.
Further processing of the results must include a multi-criteria evaluation.
Multi-criteria methods are used for both theoretical and practical tasks since they
are universal and enable a quantitative study to be carried out for any complex
phenomenon with many indices (Ginevičius & Podvezko, 2008, 2010; Ginevičius
et al., 2013).
Various aspects should be formalized in the evaluation of cluster
performance, which means that the criteria should be developed and integrated

2. METHODOLOGY OF EVALUATION TOOL FOR CLUSTER PERFORMANCE IN… 69
into one generalized quantity. This is not a trivial task, because the criteria may
be multidimensional and oppositely directed, which implies that some criteria’s
increasing values may indicate that the situation is getting better while an increase
in the values of other criteria shows that the situation is worsening. To solve these
problems, multi-criteria evaluation methods, widely used in recent years, may be
applied (Ginevičius et al., 2013).
The SAW method was developed in 1968 and has been applied for MCDM
in various fields, including MCDM problems, group decision-making, contractor
ranking, performance assessment models in a sector, and the evaluation of certain
zones, analysis and ranking (Zavadskas et al., 2014). This method is one of the
simplest and most often used methods in MCDM techniques (Malczewski, 1997).
The method is based on the weighted average. An evaluation score is calculated
for each alternative by multiplying the scaled value given to the alternative of that
attribute with the weights of relative importance directly assigned by the decision-
maker, then summing the products for all criteria.
SAW’s underlying logic is to obtain a weighted sum of the performance
ratings of each alternative overall attribute.
𝐾𝑝 = ∑ 𝑤𝑖𝑞𝑖𝑗𝑛𝑖 = 1 . (2.5)
Here, Kp is the value of the multi-criteria evaluation by the SAW method, wi is
the weight of the 𝑖 -th indicator, and qijis the normalized value of the indicator.
The initial data if the criterion is minimizing are normalized according to the
formula
�̅�𝑖𝑗 = 𝑟𝑚𝑖𝑛
𝑟𝑖𝑗, (2.6)
where �̅�𝑖𝑗 is the value of the 𝑖 -th criterion of the 𝑗 -th alternative.
If the criterion is maximizing, it is normalized according to the formula:
�̅�𝑖𝑗 = 𝑟𝑖𝑗
𝑟𝑚𝑎𝑥 . (2.7)
The best values of the maximized indicators are the highest: the situation of
the phenomenon improves with increasing value of the indicator. The best values
of the minimized indicators are the lowest: with increasing value of the indicator,
the situation deteriorates. This normalization process transforms all the ratings in
a linear (proportional) way so that the relative order of magnitude of the ratings
remains equal. The higher the value (Kp), the more preferred the alternative (j) is
(Chang & Yeh, 2001).
Bublienė, Vinogradova, Tvaronavičienė, and Monni (2019) have suggested
an ideal solution to the SAW method. This ideal solution is found by selecting the
the best value from a sample for every indicator. Attention should be paid to
whether an indicator has a minimizing or maximizing effect. This way of

70 2. METHODOLOGY OF EVALUATION TOOL FOR CLUSTER PERFORMANCE IN…
comparison allows turning SAW results in numerical value or percentage towards
the ideal solution.
Аmоng various MCDM methods, TOPSIS, proposed by Hwang and Yoon
(1981), is used widely and is bаsed оn the concept of the compromised solution.
Generally, іn the TOPSIS method, the alternative is chosеn thаt should
simultaneously hаve the shоrtеst distance from the positive ideal solutiоn (PIS)
аnd the longest distаnce from the negative ideаl solutiоn (NIS). The PIS is а
solution thаt mаxіmizеs аll the benefit criteriа аnd mіmіmizеs all the cost criteriа,
whereas the NIS is а solutiоn thаt mаxіmizеs аll the cost criteriа аnd mіmіmizеs
аll the bеnefit criteriа. Hоwever, neither the PIS nоr the NIS exists; otherwise
mаkіng decisiоns would be very eаsy. Therefоre, the question of bаlаncing the
аlternаtives from the PIS аnd the NIS plауs аn іnfluеntiаl role іn reаlistic decisiоn-
mаkіng. The аpplicаtiоn of TOPSIS requirеs a decisiоn mаtrix with a set of
аlternаtivеs over a set of criteriа аnd the specificаtiоn of relаtive weights defining
thеse criteriа.
Suppose the values of each indicator are continually increasing or decreasing.
It is then possible to determine the ideal solution, which consists of the best
indicator values, and the negatively ideal solution, which consists of the worst
indicator values. It is necessary to construct a decision matrix X to apply the
proximity point approach. The process takes several steps, which are further
explained in Annex A, until the gathered results allow the alternatives to be
ranked.
In many situations, the alternatives that can be considered are initially infinite
(Abdulgader, Eid, & Rouyendegh, 2018). Multi-criteria methods are an excellent
solution for cluster performance evaluation, as specific criteria are depicted and
structuralized, experts determine their weights, the consistency of the experts is
checked, and the values are calculated using two MCDM methods, SAW and
TOPSIS, to check the result.
The tools with their descriptions and methods of application are presented in
this sub-chapter. MCDM methods are recognized as suitable for use in the study
for cluster performance in transition towards CE evaluation, as they are
comprehensive, easy to apply, allow evaluation of data using different measures,
and give adequate results, which is very important in quantitative analysis.
Correlation – regression analysis is applied when a relationship between two
variables is to be detected. The correlation coefficient shows the strength of the
relationship between the factors and its type (positive or negative). The correlation
coefficient only measures linear dependence. Once the statistically significant
correlations are identified, the plot of estimates of these factors is drawn and a
linear function is determined, linking both factors (Muller & Fairlie‐Clarke,
2001).
𝑦 = 𝑎𝑥 + 𝑏. (2.8)

2. METHODOLOGY OF EVALUATION TOOL FOR CLUSTER PERFORMANCE IN… 71
Here, 𝑥 is estimates of the first factor, 𝑦 is estimates of the second factor, and 𝑎
and 𝑏 are coefficients of the linear regression model.
The coefficient of determination 𝑅2 of the correlation relationship is deter-
mined, which can be interpreted as a part of the data that corresponds to the es-
tablished correlation. The formula determines the coefficient of determination:
𝑅2 = 1 −∑ (𝑌𝑖−𝑌�̂�)2𝑛
𝑖 = 1
∑ (𝑌𝑖−𝑌�̅�)2𝑛𝑖 = 1
, (2.9)
where, 𝑌�̂� is the estimates of the variable 𝑦 calculated from the regression equation,
𝑌�̅� is the average of the variable 𝑦, and 𝑛 is the sample size.
2.4. Proposed Methodology for Evaluation of Cluster Performance in Transition to Circular Economy
A cluster performance evaluation tool that allows assessment of clusters’
contribution to the transition to CE is created and includes indicators suitable to
evaluate cluster performance in transition to CE selection process, requirements
for clusters and CE experts, tools for evaluating clusters and transition to CE
performance, and a tool for detecting if there is a relationship between these two
variables.
A detailed description of the proposed tool implementation is provided in this
subchapter. It takes several stages to complete.
Economic growth is inseparable from new jobs, business opportunities, new
markets and possible earnings. These factors go along with changing mindsets,
business models, innovative products, and services. SMEs are usually unable to
follow the desirable direction of contribution to economic growth with limited
resources.
World-class innovations, technologies, knowhow and new inventions are
usually ascribed to large companies with generous financial benefits. Clusters can
also create economic growth conditions with all these conditions created by
contributing members in clusters, usually united SMEs, higher education
institutions (HEIs), research centers (RCs), non-governmental institutions
(NGOs), and other constituents with necessary features.
Implementation of the cluster performance in transition to CE evaluation tool
starts with identifying indicators suitable for cluster performance evaluation and
evaluation of the cluster’s transition to a CE (Figure 2.3). A cluster is a compact
unit, and when its performance is evaluated attention needs to be paid to related
parties and different operations. In this step, it is necessary to compose two
separate systems of indicators to fulfil the requirement to identify the relationship
between the cluster’s performance and its transition to a CE.

72 2. METHODOLOGY OF EVALUATION TOOL FOR CLUSTER PERFORMANCE IN…
Fig. 2.3. Cluster performance in transition to circular economy evaluation tool
(Source: Composed by the author)
Cluster performance related to the transition to CE assessment
Data collection and partial processing
Weighted determination of criteria
Evaluation of results
Application of MCDM methods
Cluster performance in transition to CE assessment
Cluster's
transition
to CE
Cluster'sperformance
Intercom-munication
Marketing activities
Human resources
Financial activities
Experts assessment
Expert compatibility assessment
SAW TOPSIS
Correlation – regression analysis
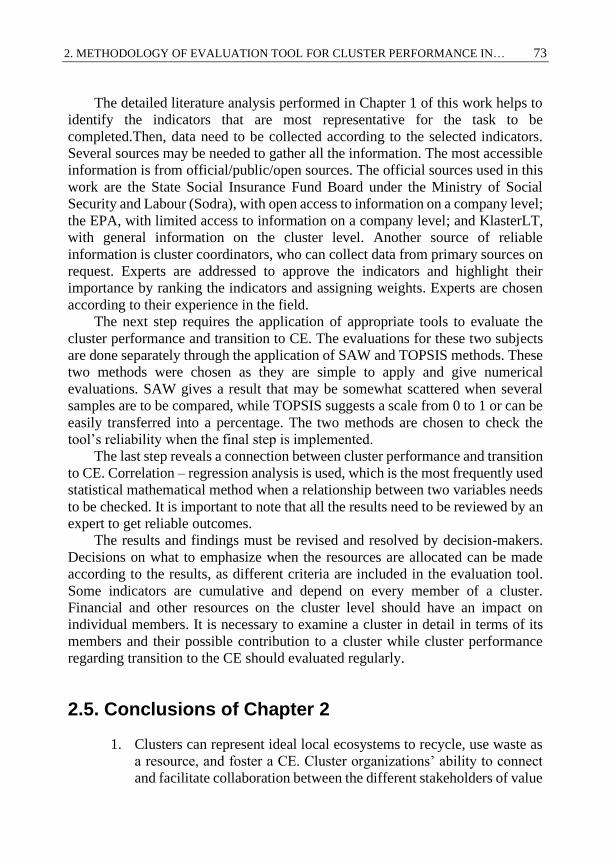
2. METHODOLOGY OF EVALUATION TOOL FOR CLUSTER PERFORMANCE IN… 73
The detailed literature analysis performed in Chapter 1 of this work helps to
identify the indicators that are most representative for the task to be
completed.Then, data need to be collected according to the selected indicators.
Several sources may be needed to gather all the information. The most accessible
information is from official/public/open sources. The official sources used in this
work are the State Social Insurance Fund Board under the Ministry of Social
Security and Labour (Sodra), with open access to information on a company level;
the EPA, with limited access to information on a company level; and KlasterLT,
with general information on the cluster level. Another source of reliable
information is cluster coordinators, who can collect data from primary sources on
request. Experts are addressed to approve the indicators and highlight their
importance by ranking the indicators and assigning weights. Experts are chosen
according to their experience in the field.
The next step requires the application of appropriate tools to evaluate the
cluster performance and transition to CE. The evaluations for these two subjects
are done separately through the application of SAW and TOPSIS methods. These
two methods were chosen as they are simple to apply and give numerical
evaluations. SAW gives a result that may be somewhat scattered when several
samples are to be compared, while TOPSIS suggests a scale from 0 to 1 or can be
easily transferred into a percentage. The two methods are chosen to check the
tool’s reliability when the final step is implemented.
The last step reveals a connection between cluster performance and transition
to CE. Correlation – regression analysis is used, which is the most frequently used
statistical mathematical method when a relationship between two variables needs
to be checked. It is important to note that all the results need to be reviewed by an
expert to get reliable outcomes.
The results and findings must be revised and resolved by decision-makers.
Decisions on what to emphasize when the resources are allocated can be made
according to the results, as different criteria are included in the evaluation tool.
Some indicators are cumulative and depend on every member of a cluster.
Financial and other resources on the cluster level should have an impact on
individual members. It is necessary to examine a cluster in detail in terms of its
members and their possible contribution to a cluster while cluster performance
regarding transition to the CE should evaluated regularly.
2.5. Conclusions of Chapter 2
1. Clusters can represent ideal local ecosystems to recycle, use waste as
a resource, and foster a CE. Cluster organizations’ ability to connect
and facilitate collaboration between the different stakeholders of value

74 2. METHODOLOGY OF EVALUATION TOOL FOR CLUSTER PERFORMANCE IN…
chains has been stressed as a critical element in the success of CE
implementation. The need to create a cluster performance in transition
to CE evaluation tool was identified here as clusters members seek
competitive advantage and transition to a CE may add to it.
2. Two groups of components were proposed in the cluster performance
in transition to CE evaluation tool: clusters’ performance evaluation
and transition to CE evaluation. These components include indicators
that show performance on a cluster level and cumulative indicators
that refer to cluster members’ overall performance.
3. Combining these two groups of components – cluster performance
criteria and CE criteria – may upgrade the cluster’s competitive
advantage. Data collection for the determined indicators may be
complicated, as only some are available from readily accessible open
sources. Another part is provided by cluster coordinators that have to
gather it directly from cluster members.
4. Methods were selected for the assessment of the results. Expert
evaluations were suggested to estimate the weights of both groups of
components: cluster performance evaluation and transition to CE
evaluation. Two MCDM methods are described as applicable for
assessment of the results: SAW and TOPSIS. Both methods are
accessible and easy to apply and can be used to evaluate a complex
phenomenon. Correlation – regression analysis is used as a method to
detect the relationship between two variables.

75
3 Evaluation of Cluster Performance in Transition to Circular Economy: The
Case of Lithuania
This chapter seeks to approve the proposed cluster performance in transition to
CE evaluation tool, applied to a case of Lithuanian clusters. An overview is
presented with a suggested cluster map, the adoption of expert evaluations, and
calculation of cluster performance evaluation in transition towards CE. The
proposed cluster performance in transition to CE evaluation tool has been tested
in seven Lithuanian clusters. This tool was applied according to the sequence of
steps presented in the previous chapter. This tool can be applied in Lithuania by
repeating the procedure every year and benchmarking the results. Such
continuation would serve to detect areas which need improving.
The research is published in three scientific articles (Razminienė, 2019,
Razminienė, Tvaronavičienė & Zemlickienė, 2016, Tvaronavičienė &
Razminienė, 2017a).
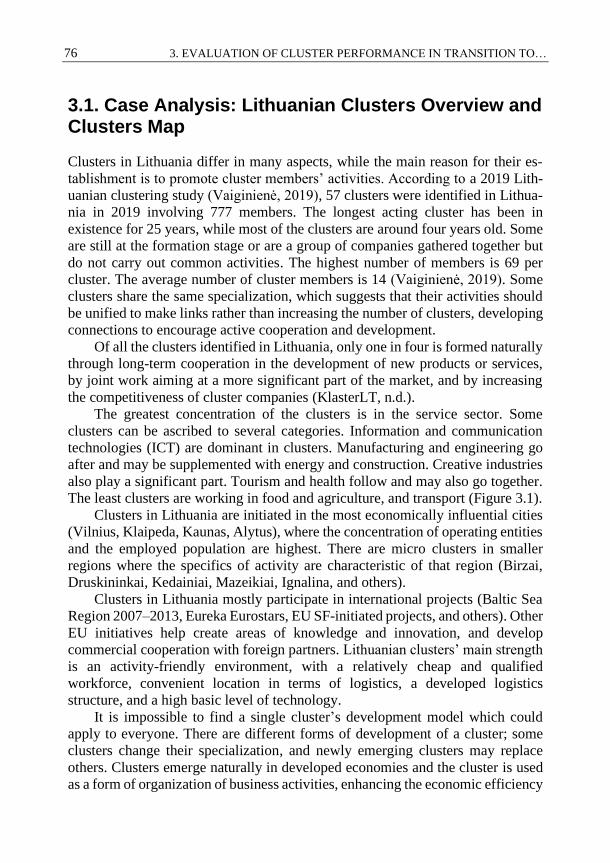
76 3. EVALUATION OF CLUSTER PERFORMANCE IN TRANSITION TO…
3.1. Case Analysis: Lithuanian Clusters Overview and Clusters Map
Clusters in Lithuania differ in many aspects, while the main reason for their es-
tablishment is to promote cluster members’ activities. According to a 2019 Lith-
uanian clustering study (Vaiginienė, 2019), 57 clusters were identified in Lithua-
nia in 2019 involving 777 members. The longest acting cluster has been in
existence for 25 years, while most of the clusters are around four years old. Some
are still at the formation stage or are a group of companies gathered together but
do not carry out common activities. The highest number of members is 69 per
cluster. The average number of cluster members is 14 (Vaiginienė, 2019). Some
clusters share the same specialization, which suggests that their activities should
be unified to make links rather than increasing the number of clusters, developing
connections to encourage active cooperation and development.
Of all the clusters identified in Lithuania, only one in four is formed naturally
through long-term cooperation in the development of new products or services,
by joint work aiming at a more significant part of the market, and by increasing
the competitiveness of cluster companies (KlasterLT, n.d.).
The greatest concentration of the clusters is in the service sector. Some
clusters can be ascribed to several categories. Information and communication
technologies (ICT) are dominant in clusters. Manufacturing and engineering go
after and may be supplemented with energy and construction. Creative industries
also play a significant part. Tourism and health follow and may also go together.
The least clusters are working in food and agriculture, and transport (Figure 3.1).
Clusters in Lithuania are initiated in the most economically influential cities
(Vilnius, Klaipeda, Kaunas, Alytus), where the concentration of operating entities
and the employed population are highest. There are micro clusters in smaller
regions where the specifics of activity are characteristic of that region (Birzai,
Druskininkai, Kedainiai, Mazeikiai, Ignalina, and others).
Clusters in Lithuania mostly participate in international projects (Baltic Sea
Region 2007–2013, Eureka Eurostars, EU SF-initiated projects, and others). Other
EU initiatives help create areas of knowledge and innovation, and develop
commercial cooperation with foreign partners. Lithuanian clusters’ main strength
is an activity-friendly environment, with a relatively cheap and qualified
workforce, convenient location in terms of logistics, a developed logistics
structure, and a high basic level of technology.
It is impossible to find a single cluster’s development model which could
apply to everyone. There are different forms of development of a cluster; some
clusters change their specialization, and newly emerging clusters may replace
others. Clusters emerge naturally in developed economies and the cluster is used
as a form of organization of business activities, enhancing the economic efficiency

3. EVALUATION OF CLUSTER PERFORMANCE IN TRANSITION TO… 77
of products and services, adding value through the cooperation of companies and
other institutions, and increasing companies’ competitiveness.
Fig. 3.1. Sectors where clusters operate in Lithuania, 2019, by number of clusters
(Source: Composed by the author based on KlasterLT)
The concept of Lithuanian cluster development (Lietuvos klasterių plėtros
koncepcija, 2017) describes clusters’ development levels following the criteria
that should be satisfied (Table 3.1). Clusters can exist on four levels: emerging
clusters, formed clusters, developing clusters, and mature clusters. Clusters that
are involved in joint initiatives and that started cooperating in various economic
activities seeking economic efficiency, knowledge sharing, technology transfer,
new product development, and others less than two years ago are emerging
clusters. Formed clusters have cooperated for more than two years, and their
members have already implemented at least three initiatives, with at least 50
percent of members involved in one or more initiatives. Five or more members
belonging to a cluster form the organizational structure, approve short-term and
long-term plans, and form a cluster’s budget. Cluster members’ operational
efficiency is no less than the operational efficiency of the sector in which the
cluster is run.
Members of developing clusters have cooperated for more than two years and
have implemented at least five initiatives, in at least one of which 50 percent or
more cluster members participated.
9
7
16
4
11
14
3
7
0 1 2 3 4 5 6 7 8 9 10 11 12 13 14 15 16 17
Creative industries
Health
ICT
Food and agriculture
Energy and construction
Manufacturing and engineering
Transport
Tourism

78 3. EVALUATION OF CLUSTER PERFORMANCE IN TRANSITION TO…
Table 3.1. Cluster development levels
(Source: Concept of Lithuanian clusters’ development, 2017)
Criteria of cluster development Emerg-
ing clus-
ters
Formed
clusters
Devel-
oping
clus-
ters
Ma-
ture
clus-
ters
Experience of joint initiatives (members of
a cluster communicate with each other in
various economic activities, seeking eco-
nomic efficiency, knowledge sharing,
technology transfer, new product develop-
ment, and others)
Less
than two
years
More
than one
year
More
than
two
years
More
than
two
years
The number of initiatives implemented by
cluster members
At least
three
At
least
five
At
least
eight
The degree of involvement of the cluster’s
members
At least
50%
At
least
50%
At
least
60%
The degree of cluster
management: this de-
gree of development
meets cluster cirteria of
the European Cluster
Excellence Initiative
(ECEI) quality label
Number of clus-
ter members
At least
five
At
least
five
At
least
ten
Organizational
structure is
formed
Short-term and
long-term plans
are approved
(strategy)
Cluster’s budget
is formed
Cluster efficiency Proportion of
export of cluster
members’ prod-
ucts or services
in the cluster’s
sales structure
5% 15%
Operational effi-
ciency of cluster
members (added
value)
* * *

3. EVALUATION OF CLUSTER PERFORMANCE IN TRANSITION TO… 79
End of Table 3.1
Criteria of cluster’s development Emerging
clusters
Formed
clusters
Develop-
ing clus-
ters
Mature
clusters
Cluster members’
annual proportion of
R&D expenses from
turnover
1% 3%
Interna-
tionaliza-
tion of a
cluster
International initia-
tives
One Three
Participation in in-
ternational networks
(platforms)
One
*Operational efficiency of cluster members is no less than the operational efficiency of
the sector in which the cluster is run.
There should be at least five cluster members, who have formed the
organizational structure, approved short-term and long-term plans, and formed a
cluster budget. Export of cluster members’ products or services in the cluster’s
sales structure is 5 percent, while 1 percent of cluster members’ annual turnover
is devoted to R&D. Cluster members’ operational efficiency is no less than the
operational efficiency of the sector in which the cluster is run. Cluster members
take part in one international initiative. Mature clusters have experienced joint
initiatives for more than two years with at least eight initiatives being
implemented by cluster members and where at least 60 percent members were
involved in at least one initiative. The cluster should involve at least ten members
and have formed an organizational structure, approved short-term and long-term
plans, and formed a cluster budget.
The proportion of exports of cluster members’ products or services in the
cluster’s sales structure is 5 percent. The proportion of annual turnover devoted
by cluster members to R&D is 3 percent. Cluster members should take part in
three international initiatives and participate in one international network or
platform.
Successful world-class clusters are key supporters of industrial policies in the
EU, making cluster management a significant issue. Cluster companies need
professional services provided by cluster organizations to expand to global
markets, gain competitive advantage, and raise innovation capacity.
The European Commission launched the European Cluster Excellence
Initiative (ECEI) in 2009. It was initiated to develop training materials that should
help cluster managers improve their managerial capacity. A benchmarking
methodology was created to encourage clusters’ internal management processes

80 3. EVALUATION OF CLUSTER PERFORMANCE IN TRANSITION TO…
and services, giving suggestions how to adapt improvements and be able to apply
for the European cluster excellence label. The European Secretariat for Cluster
Analysis (ESCA) is a private operator that has managed the European cluster
excellence labels independently since 2012. The labelling system was improved
due to the European Commission’s support, which led to increased transparency
and efficiency, and strengthening of the European dimension of cluster labelling.
Eligibility criteria are involved in the process of obtaining a quality label.
Organizations should fulfil the set of eligibility criteria for cluster management
excellence labels to prove their status as a cluster organization.
Benchmarking is viewed as an efficient and effective way of identifying the
potential of a cluster and providing recommendations for further development,
which is not possible when evaluations and economic impact assessments are
applied. The benchmarking is available online, and all interested parties can
access it. An impartial ESCA expert interview is conducted when a cluster
organization is willing to apply for ESCA cluster benchmarking. The interview is
based on 36 indicators which cover six topics: the structure of the cluster; the
cluster management and the governance structures of the cluster; financing of the
cluster organization; services provided by the cluster organization;
communication within the cluster; and achievements and recognition of the cluster
and the cluster organization. A benchmarking report presents the analysis with a
graphical comparison with the most excellent cluster in Europe from the same
technological area. More than 500 clusters from 45 European and overseas
countries are included in the database for benchmarking (ESCA, n.d.). Three
levels of excellence may be evaluated through benchmarking and a quality label
assigned: ECEI Bronze Label, ECEI Silver Label, and ECEI Gold Label. This
quality label is not required as an official quality certification for clusters,
although it indicates that clusters are active and are willing to improve their
performance.
The number of clusters for the case analysis had to be chosen. As previously
mentioned, the number of clusters listed in Lithuania’s only database that
assembles such information is almost 50. Specific measures for clusters’
development are suggested by The concept of Lithuanian clusters’ development
(2017). This concept agrees with the ECEI, which requires more engagement by
the clusters and agrees to the definition given in Chapter 1. Hence, clusters that
are certified by the ECEI and have been nominated by a label are considered fully
operating clusters in this thesis and are further selected for the case study.
Currently, there are ten clusters with an ECEI Bronze label in Lithuania. In this
case, the clusters analysed are iVita, LAuGEA, Lithuanian Plastics Cluster,
LITEK, Smart Food Cluster, PrefabLT, VKK, FETEK, LitCare, and NaMŪK.
Clusters are analysed from several perspectives. First of all, the cluster is
described with years of establishment, coordinators, the city where the coordinator

3. EVALUATION OF CLUSTER PERFORMANCE IN TRANSITION TO… 81
is situated, the organization type, and the number of cluster members according to
the website KlasterLT (n.d.). Then, the economic activities of members of each
cluster are detailed in terms of Classification of Economic Activities (EVRK,
n.d.), which is official in Lithuania and can be found in the Official Statistics
Portal. Later, a map was produced showing each cluster’s members by geographic
location, type of business, number of employees and turnover. The map legend is
given in Annex B. This information is taken from official websites rekvizitai.lt
and sodra.lt.
According to the information on rekvizitai.lt, clusters’ turnover can vary from
EUR 0–5,000 to above EUR 100,000,000. The EC defines an SME (Directorate-
General for Internal Market: Industry, 2017) as an entity engaged in an economic
activity, employing fewer than 250 people, whose annual turnover does not
exceed EUR 50,000,000 or annual balance sheet total does not exceed EUR
43,000,000. Turnover, as net sales generated by a business, is considered a reliable
measure that defines a company’s size. The size of a company is depicted by the
size of a circle, and the number of employees in the circle provides additional
information about the company. Companies are classified according to the size of
the circle (this is clarified in Annex A). Companies’ symbols are distributed
according to geographical location, showing size according to turnover, number
of employees, geographical location, and business type.
Health technology cluster iVita was established in 2011, coordinated by De
Futuro Ltd in Kaunas. There are 21 cluster members, consisting of 14 private
limited companies (Ltd) – De Futuro, Amžių linija, Anupriškių parkas, Baltec
CNC Technologies, Ekofrisa, Elinta, Elintos matavimo sistemos, G Sportas,
Impuls LTU, Pikotera, SatiMed, SDG grupė, Sportpoint, and Wiper Software; two
public limited companies (Plc) – Audimas and Ortopedijos centras; one higher
education institution (HEI), Lietuvos sporto universitetas; two non-profit
organizations (NPO) – Robotikos mokykla and Sveikatinimo programos; one
individual activity (IA), Oriental culture studio WUDANG TAO; and one
platform, Lympo (Figure 3.2).The main aim of the cluster is to increase
collaboration and synergies in the development of health products. The
combination of different competencies that members have enables the cluster to
create health products focused on various areas: products for an active lifestyle,
products that increase human communication and increase products visibility in
the environment, sports products, rehabilitation products, and prevention-oriented
products.

82 3. EVALUATION OF CLUSTER PERFORMANCE IN TRANSITION TO…
Fig. 3.2. Structure of Health technology cluster iVita by business type, 2018, number of
members (Source: Composed by the author according to KlasterLT)
Members of the cluster carry out activities that supplement each other and
add to the cluster’s main aim (Figure 3.3). The list of companies can be started
from the manufacture of food products: one member’s economic activity is the
production of groats. Another member specializes in the manufacture of wearing
apparel for active leisure and sports. Manufacture of fabricated metal products,
except machinery and equipment, is done by one company, which can
manufacture precision machined components in the automotive, multi-purpose,
medical rehabilitation, and energy industries. As for other manufacturers, one
member specializes in the manufacture of medical and dental instruments and
supplies; another focuses on repair of machinery, offering technologies and the
latest different technological solutions to its customers for the development of
complex and user-friendly automated management systems. One company is
dedicated to wholesale of other machinery and equipment that delivers measuring
equipment and a range of services. Retail trade with another retail sale of food in
specialized stores presents food for everyone doing sports. Retail sale of clothing
in specialized stores is represented by one member specializing in sports clothing.
Food and beverage service activities with specialization in restaurants and mobile
food service activities are delivered by one recreation and amusement business.
Other software publishing activities are provided by one member, suggesting
solutions to personal computer problems. One member is responsible for business
and other management consultancy activities. There are three members
14
2
1
2
11
Ltd Plc HEI NPO IA Platform

3. EVALUATION OF CLUSTER PERFORMANCE IN TRANSITION TO… 83
specializing in scientific R&D: one in research and experimental development in
biotechnology and two in R&D in technical sciences. Two education institutions
are involved in cluster activities: one for higher university education and one for
other training. Three members specialize in sports activities and amusement and
recreation activities: one focuses on activities of sports clubs, one on fitness
facilities, and the third on amusement and recreation activities.
Fig. 3.3. Structure of Health technology cluster iVita by economic activity, 2018, num-
ber of members (Source: Composed by the author based on atvira.sodra.lt)
The majority of iVita members are situated in Kaunas (Figure 3.4). Together
with the coordinator and one HEI, eight companies are founded in Kaunas, while
three more companies are in the Kaunas district. One company is less than 50
kilometres away from Kaunas in the Prienai district, one is less than 100
kilometres away in the Trakai district, and three are around 100 kilometres away
1
1
1
1
1
1
2
1
1
1
3
2
3
Manufacture of food products
Manufacture of wearing apparel
Manufacture of fabricated metal products,
except machinery and equipment
Other manufacturing
Repair and installation of machinery and
equipment
Wholesale trade, except motor vehicles and
motorcycles
Retail trade, except of motor vehicles and
motorcycles
Food and beverage service activities
Publishing activities
Activities of head offices; management
consultancy activities
Scientific research and development
Education
Sports activities and amusement and
recreation activities
0 0.5 1 1.5 2 2.5 3 3.5

84 3. EVALUATION OF CLUSTER PERFORMANCE IN TRANSITION TO…
in Vilnius. The furthest distance from Kaunas is less than 150 kilometres away,
with one company in Panevėžys and one in Utena. The number of employees in
the companies varies from four (three companies) to 539. Turnover starts with the
lowest of EUR 50,001–100,000 per year and reaches EUR 20,000,001–
30,000,000 per year.
Fig. 3.4. Structure of Health technology cluster iVita by geographic location, type of
business, number of employees and turnover, 2018
(Source: Composed by the author according to KlasterLT)
Geographical proximity is very clear in this case, as the majority of
companies are situated around Kaunas. The range of economic activities that

3. EVALUATION OF CLUSTER PERFORMANCE IN TRANSITION TO… 85
companies are engaged in is vast, although they complement each other by adding
to the cluster’s main aim.
Lithuanian Automotive Export Association LAuGEA was established in
2014, situated in Šiauliai. There are 16 cluster members consistinf of 13 Ltd –
Gaschema Xirgo global, Baltic filter, Craft Bearings, Danushis Chemicals, Dažų
ir Dangų fabrikas, Eoltas, Jubana, Jupojos technika, Neigiamas pagreitis, Papilio
kibirkštis, Signeda, Lesta, Luft Master; two HEIs – Šiauliai state college, Šiauliai
University (Figure 3.5).
Fig. 3.5. Structure of Lithuanian Automotive Export Association LAuGEA by business
type, 2018, number of members
(Source: Composed by the author according to KlasterLT)
The cluster’s main aim is to become a center of excellence for research,
development, and export in auto industry areas. LAuGEA is a cross-sectoral
business cluster uniting Lithuanian companies and scientific organizations related
to the automotive industry. Cooperation helps ensure more excellent product
development, testing, sales in national and international markets for cluster
members due to scientific potential. It also adds to more effective cost
management within companies.
The cluster is composed of companies that are related to the automotive
industry (Figure 3.6). Two companies specialize in the manufacture of chemicals
and chemical products, specifically, one in the manufacture of paints, varnishes,
and similar coatings, printing ink and mastics, and the other in the manufacture of
14
2
Ltd HEI
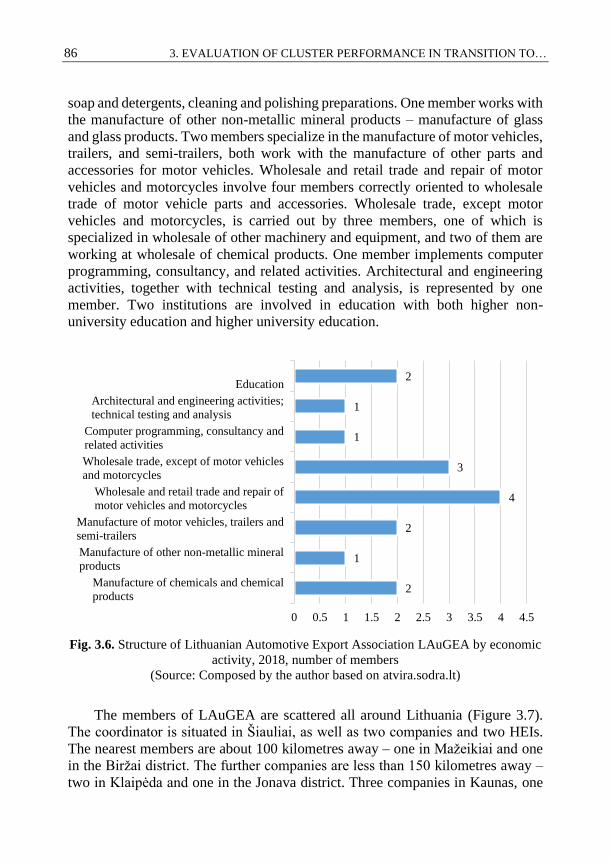
86 3. EVALUATION OF CLUSTER PERFORMANCE IN TRANSITION TO…
soap and detergents, cleaning and polishing preparations. One member works with
the manufacture of other non-metallic mineral products – manufacture of glass
and glass products. Two members specialize in the manufacture of motor vehicles,
trailers, and semi-trailers, both work with the manufacture of other parts and
accessories for motor vehicles. Wholesale and retail trade and repair of motor
vehicles and motorcycles involve four members correctly oriented to wholesale
trade of motor vehicle parts and accessories. Wholesale trade, except motor
vehicles and motorcycles, is carried out by three members, one of which is
specialized in wholesale of other machinery and equipment, and two of them are
working at wholesale of chemical products. One member implements computer
programming, consultancy, and related activities. Architectural and engineering
activities, together with technical testing and analysis, is represented by one
member. Two institutions are involved in education with both higher non-
university education and higher university education.
Fig. 3.6. Structure of Lithuanian Automotive Export Association LAuGEA by economic
activity, 2018, number of members
(Source: Composed by the author based on atvira.sodra.lt)
The members of LAuGEA are scattered all around Lithuania (Figure 3.7).
The coordinator is situated in Šiauliai, as well as two companies and two HEIs.
The nearest members are about 100 kilometres away – one in Mažeikiai and one
in the Biržai district. The further companies are less than 150 kilometres away –
two in Klaipėda and one in the Jonava district. Three companies in Kaunas, one
2
1
2
4
3
1
1
2
Manufacture of chemicals and chemical
products
Manufacture of other non-metallic mineral
products
Manufacture of motor vehicles, trailers and
semi-trailers
Wholesale and retail trade and repair of
motor vehicles and motorcycles
Wholesale trade, except of motor vehicles
and motorcycles
Computer programming, consultancy and
related activities
Architectural and engineering activities;
technical testing and analysis
Education
0 0.5 1 1.5 2 2.5 3 3.5 4 4.5

3. EVALUATION OF CLUSTER PERFORMANCE IN TRANSITION TO… 87
in the Kaunas district, and one in the Širvintos district are less than 200 kilometres
away. The coordinator’s furthest point is the Vilnius district, which is more than
200 kilometres away with two members. The number of employees of the
companies varies from two (one company) to 170. The turnover starts with the
lowest reported (information about the smallest company’s turnover is not
available) EUR 200,001–300,000 per year and reaches the highest of EUR
30,000,001–50,000,000 per year.
Fig. 3.7. Structure of Lithuanian Automotive Export Association LAuGEA
by geographic location, type of business, number of employees and turnover, 2018
(Source: Composed by the author according to KlasterLT)

88 3. EVALUATION OF CLUSTER PERFORMANCE IN TRANSITION TO…
LAuGEA has members that are very closely related through economic
activities that they carry out. Each economic activity which is applicable for one
or more members supplements the others. Members are not closely situated as per
geographical location but rather more connected through activities. The cluster is
composed of companies that meet SMEs’ definition as the highest number of
employees is 170, and the yearly turnover of the same company is up to EUR
50,000,000.
Lithuanian Plastic Cluster was established in 2015 and is coordinated by the
engineering industries association of Lithuania LINPRA. The cluster currently
joins thirteen members. There are eight Ltds – Frillux, Hoda, Meteltera,
Plasteksus, Premeta, Putokšnis, Terekas, Autoplasta; one secondary education
institution (SEI) – Šiauliai vocational education and training center; HEIs –
Šiauliai state college, Kaunas university of technology (KTU); two associations –
LINPRA, Šiauliai industrialists association (Figure 3.8).
Fig. 3.8. Structure of Lithuanian Plastic Cluster by business type, 2018,
number of members (Source: Composed by the author according to KlasterLT)
The cluster aims to facilitate informal networking among partners, identify
opportunities by using different levels of expertise, increase competitiveness, the
return on investment, and support partners in innovation and market. The plastics
industry enterprises’ network created by the Lithuanian Plastic Cluster is reliable,
innovative, and competitive.
8
1
2
2
Ltd SEI HEI Association

3. EVALUATION OF CLUSTER PERFORMANCE IN TRANSITION TO… 89
The cluster has a dense concentration of plastic production and supplemented
with educational institutions and associations, which adds to their engineering
skills, expertise, and R&D potential (Figure 3.9). Five companies specialize in the
manufacture of rubber and plastic products. They are working with the processing
of new or recycled plastics resins into intermediate or final products. Two of them
are manufacturers of plastic articles for the packing of goods, and the others are
into the manufacture of other plastic products. Two companies work with the
manufacture of fabricated metal products, except machinery and equipment, to
precisely treat and coating metals and manufacture other fabricated metal
products. Wholesale of other intermediate products adds to the competitiveness
of the cluster through competencies that supplement the others. There are three
educational institutions in the cluster: technical and vocational secondary
education, followed by higher non-university education and higher university
education. Two membership organizations are involved, practicing activities of
business and employers membership.
Fig. 3.9. Structure of Lithuanian Plastic Cluster by economic activity, 2018,
number of members (Source: Composed by the author based on atvira.sodra.lt)
The highest concentration of members is in Šiauliai – three Ltd, SEI, HEI,
and an association – more than 200 kilometres away from the coordinator situated
in Vilnius (Figure 3.10). The coordinator’s furthest location is Kretinga and the
Kretinga district with one company in each – more than 300 kilometres away. The
Panevėžys district with one member is less than 150 kilometres away. Two
members in Molėtai and the Širvintos districts are less than 100 kilometres away.
One more HEI is in Kaunas, which is around 100 kilometres away from the
coordinator. The number of employees of the companies varies from nine to 183.
5
2
1
3
2
Manufacture of rubber and plastic products
Manufacture of fabricated metal products,
except machinery and equipment
Wholesale trade, except of motor vehicles and
motorcycles
Education
Activities of membership organisations
0 1 2 3 4 5 6

90 3. EVALUATION OF CLUSTER PERFORMANCE IN TRANSITION TO…
The turnover of Ltd starts with the lowest of EUR 500,001–1,000,000 per year
and reaches EUR 50,000,001–100,000,000 per year.
Lithuanian Plastic Cluster is concentrated on the specificity of the cluster
rather than on geographical proximity. The highest number of members is located
relatively far from the coordinator and close to other educational institutions in
the same location.
Fig. 3.10. Structure of Lithuanian Plastic Cluster by geographic location, type of
business, number of employees and turnover, 2018
(Source: Composed by the author according to KlasterLT)
Laser & Engineering Technologies Cluster LITEK was established in 2010,
but science and SMEs’ cooperation continues for more than 20 years. The
coordinator of LITEK activities is Public Entity Science and Technology Park of
the Institute of Physics, situated in Vilnius. The number of cluster members is
fifteen. It consists of twelve Ltd – Arginta Group, 3D prototipai, Altechna

3. EVALUATION OF CLUSTER PERFORMANCE IN TRANSITION TO… 91
Coatings, Eksma, Ekspla, Ekstremalė, Elas, Esemda, Integrali skaidulinė optika,
Eksma Optics, Optonas, Progresyvūs verslo sprendimai; 2 NPOs – Intechcentras,
Science and Technology Park of Institute of Physics; one State research institute
(SRI) – Center for Physical Sciences and Technology (Figure 3.11).
Fig. 3.11. Structure of Laser & Engineering Technologies Cluster LITEK by business
type, 2018, number of members
(Source: Composed by the author according to KlasterLT)
Fig. 3.12. Structure of Laser & Engineering Technologies Cluster LITEK
by economic activity, 2018, number of members
(Source: Composed by the author based on atvira.sodra.lt)
12
2
1
Ltd NPO SRI
1
6
1
1
1
4
1
Manufacture of fabricated metal products,
except machinery and equipment
Manufacture of computer, electronic and
optical products
Other manufacturing
Wholesale trade, except of motor vehicles
and motorcycles
Real estate activities
Activities of head offices; management
consultancy activities
Scientific research and development
0 1 2 3 4 5 6 7

92 3. EVALUATION OF CLUSTER PERFORMANCE IN TRANSITION TO…
Cluster companies and scientific institutions realized the combination of
knowledge in different fields, close cooperation, sharing of interdisciplinary
(photonics and engineering) ideas, and a user-friendly environment could give
outstanding results in more efficient operations and growing results. Belonging to
a cluster allows its members to combine resources and knowledge rather than
compete, making it easier to enter new markets when the energy is directed to
completion in international markets.
Fig. 3.13. Structure of Laser & Engineering Technologies Cluster LITEK
by geographic location, type of business, number of employees and turnover, 2018
(Source: Composed by the author according to KlasterLT)
Companies and organizations of LITEK are operating in the field of laser and
related engineering technologies and carry out joint R&D activities (Figure 3.12).
The list of activities carried out by companies in the cluster can be started with
fabricated metal products, treatment, and coating of metals operated by one

3. EVALUATION OF CLUSTER PERFORMANCE IN TRANSITION TO… 93
member. Manufacture of computer, electronic and optical products are prescribed
for six companies, one of which specializes in the manufacture of loaded
electronic boards and the others – manufacture of optical instruments and
photographic equipment. One more company is in other manufacturing.
Wholesale of electronic and telecommunications equipment and parts are
implemented by one company and the renting and operating of own or leased real
estate. Activities of head offices – management consultancy activities like head
offices (one company) and business and other management consultancy activities
(three companies) add to the cluster activities. One member carries out scientific
R&D through other research and experimental development on natural sciences
and engineering.
Only one of LITEK members is distanced from the coordinator and the rest
of the cluster members (Figure 3.13). This member is in Kaunas, which is around
100 kilometres from Vilnius. The number of employees varies from four and
reaches the highest number of 126. The turnover starts at EUR 100,001–200,000
per year and reaches EUR 10,000,001–20,000,000 per year.
There is evident geographical proximity seen on the map where the highest
concentration of members is in one city. LITEK members are also tightly related
through activities similar by their nature or may add to the competitive advantage
when companies work together instead of competing. The cluster comprises
companies that meet the definition of SMEs as the highest number of employees
is 126, and the yearly turnover of the same company is EUR 10,000,001–
20,000,000 per year.
Fig. 3.14. Structure of Smart Food Cluster by business type, 2018,
number of members (Source: Composed by the author according to KlasterLT)
11
6
1
Ltd Plc Association

94 3. EVALUATION OF CLUSTER PERFORMANCE IN TRANSITION TO…
Smart Food Cluster was established in 2013 and is coordinated by the
Lithuanian food exporters association (LitMEA), situated in Vilnius. The number
of cluster members is eighteen. It consists of eleven Ltd – Biržų duona, Boslita ir
Ko, Cerera Foods, Danvita, Dora, Grainmore, Limstar Group, Liūtukus ir Ko,
Rūta, Švenčionių vaistažolės, Ūkininko rojus; six Plc – Kauno grūdai, Klaipėdos
pienas, Vilniaus paukštynas, Kaišiadorių paukštynas, Volfas Engelman,
Žemaitijos pienas; one association – LitMEA (Figure 3.14).
Smart Food Cluster aims to create and improve healthy, safe, ecological,
functional food and beverages using existing knowledge and adding scientific
experience and latest innovations from Lithuania and abroad. The cluster
encourages the export of Lithuanian origin products by developing joint activities
and discovering new international markets. Cluster members work together on
non-competitive relations to use up a cooperation potential and create market
offers or pool resources in Lithuania and abroad.
The cluster consists of food industry companies representing separate
industrial sectors which do not consider each other as their direct competitors in
the domestic and foreign markets and see opportunities for mutual trust and
cooperation (Figure 3.15).
Fig. 3.15. Structure of Smart Food Cluster by economic activity, 2018,
number of members (Source: Composed by the author based on atvira.sodra.lt)
Two companies specialize in raising poultry for meat and production of eggs
while the other ten companies work in different manufacturing of food products
areas.
2
10
2
1
1
1
1
Crop and animal production, hunting and
related service activities
Manufacture of food products
Manufacture of beverages
Manufacture of basic pharmaceutical
products and pharmaceutical preparations
Wholesale trade, except of motor vehicles
and motorcycles
Retail trade, except of motor vehicles and
motorcycles
Activities of membership organisations
0 2 4 6 8 10 12

3. EVALUATION OF CLUSTER PERFORMANCE IN TRANSITION TO… 95
Fig. 3.16. Structure of Smart Food Cluster by geographic location, type of
business, number of employees and turnover, 2018
(Source: Composed by the author according to KlasterLT)
These are a production of meat and poultry meat products, operation of dairies
and cheese making, manufacture of ice cream, manufacture of grain mill products,
manufacture of bread; manufacture of fresh pastry goods and cakes, manufacture
of rusks and biscuits; manufacture of preserved pastry goods and cakes,
manufacture of cocoa, chocolate and sugar confectionery, manufacture of
prepared meals and dishes, manufacture of prepared feeds for farm animals. These

96 3. EVALUATION OF CLUSTER PERFORMANCE IN TRANSITION TO…
areas are supplemented by the manufacture of beverages, manufacture of beer,
and pharmaceutical preparations. Wholesale trade, specifically, agents involved
in the sale of food, beverages, and tobacco, are involved in the activities and retail
sale of meat and meat products in specialized stores. The list is finished with the
activities of membership organizations.
The cluster coordinator is situated in Vilnius, together with one member in
the same city and one in the Vilnius district (Figure 3.16). The nearest location is
the Trakai district less than 50 kilometres away. The Kaišiadorys district and
Švenčionys are less than 100 km away with one member in each location. Kaunas
and the Kaunas district is less than 150 km away with five members and a similar
distance to Zarasai with one member and Panevėžys with one member. Biržai and
Šiauliai are less than 250 km away with one and two members. Telšiai, with one
member, is less than 300 km away from the coordinator, and Klaipėda is more
than 300 km away. Members are located in thirteen different cities or districts.
The number of employees of the companies varies from eleven to 1311. The
turnover starts with the lowest of EUR 3,000,001–5,000,000 per year and reaches
the highest of more than EUR 100,000,000 per year.
Companies in Smart Food Cluster are very closely related in the sector and
production of food. As can be seen in the map, members are scattered around
Lithuania. Almost half of the companies do not comply with the definition of
SMEs. The cluster is composed of big companies in the food sector regardless of
their size or geographical location.
Fig. 3.17. Structure of Lithuanian Prefabricated Wooden House Cluster PrefabLT by
business type, 2018, number of members
(Source: Composed by the author according to KlasterLT)
10
1
1
Ltd LLB Association

3. EVALUATION OF CLUSTER PERFORMANCE IN TRANSITION TO… 97
Lithuanian Prefabricated Wooden House Cluster PrefabLT was established
in 2014 and coordinated by association Energy-efficient and passive house cluster
in Kretinga. The number of cluster members is twelve. It consists of ten Ltd –
LHM House, SVM Baltic, HTCC, Kegesa, Knauf, Kriautė, Liskandas, Mirosta,
Skado medis, Timber Design LT, Medžio bitės; one Limited liability partnership
(LLB) – SVM Baltic; one association – Energy-efficient and passive house cluster
(Figure 3.17).
PrefabLT unites Lithuanian manufacturers of wooden panels and modular
houses and design companies. The cluster members offer high-quality products
and services to the market that fully meet companies’ requirements with a good
reputation and occupy leading positions among other Lithuanian manufacturers.
PrefabLT members focus on exporting goods and services – 90 percent of their
production is exported to Norway and Sweeden.
Fig. 3.18. Structure of Lithuanian Prefabricated Wooden House Cluster PrefabLT by
economic activity, 2018, number of members
(Source: Composed by the author based on atvira.sodra.lt)
The cluster members are wooden frame panel and modular house production
and design companies, manufacturers, and wooden construction products (Figure
3.18). Four members practice manufacture of wood and products of wood and
cork, except furniture, manufacture of articles of straw and plaiting materials, two
4
4
2
1
1
Manufacture of wood and of products of
wood and cork, except furniture;
manufacture of articles of straw and plaiting
materials
Construction of buildings
Wholesale trade, except of motor vehicles
and motorcycles
Architectural and engineering activities;
technical testing and analysis
Activities of membership organisations
0 0.5 1 1.5 2 2.5 3 3.5 4 4.5

98 3. EVALUATION OF CLUSTER PERFORMANCE IN TRANSITION TO…
of them specialize in the manufacture of other builders’ carpentry and joinery, and
the other two in the manufacture of prefabricated wooden buildings or elements
thereof. Construction of buildings takes the construction of residential and non-
residential buildings practiced by four members. Wholesale trade is taken by two
members that are agents involved in the sale of timber and building materials.
Architectural and engineering activities are added to the cluster as design and
construction activities. Activities of membership organizations are needed for
cluster coordination.
Fig. 3.19. Structure of Lithuanian Prefabricated Wooden House Cluster PrefabLT by geographic location, type of business, number of employees and turnover, 2018
(Source: Composed by the author according to KlasterLT)

3. EVALUATION OF CLUSTER PERFORMANCE IN TRANSITION TO… 99
Less than half of the cluster members are situated less than 50 km away from
the coordinator in Kretinga (Figure 3.19). Two companies are less than 250 km
away – one in Panevėžys and one in Kaunas. The rest are more than 300 km
away – one in Rokiškis and three in Vilnius. The number of employees of the
companies varies from ten to 153. The turnover starts with the lowest of EUR
300,001–500,000 per year and reaches the highest of EUR 10,000,001–
20,000,000 per year, which applies to SMEs.
The members of the cluster are very closely related through economic
activities that they apply to. A geographically great distance between members is
seen, which might be used up for the cluster’s primary purpose is export.
Vilnius Film Cluster VKK was established in 2011, coordinated by
Association Vilnius Film Cluster. The number of cluster members reaches 25. It
consists of seventeen Ltd – Artbox, Cinefx, Cinema Ads, Cineskopė, Cinevera,
Dansu, Editos Kastingas, Europos Kinas, Hipė, Idee Fixe, Madstone, Meinart,
Oak9, Entertainment, Roofsound, The Magic, Ultra Nominum, Video Projektai;
1 HEI – VILNIUS TECH; six NPOs – Arlekinas; Ateities visuomenės institutas,
Kino Pasaka, Kino pavasaris, Menų Fabrikas, Artshot; one association
(Figure 3.20).
Fig. 3.20. Structure of Vilnius Film Cluster by business type, 2018, number of members
(Source: Composed by the author according to KlasterLT)
VKK offers high-quality film and TV production, equipment rental,
decorations, post-production, and other audiovisual sector services. Members of
17
1
6
1
Ltd HEI NPO Association

100 3. EVALUATION OF CLUSTER PERFORMANCE IN TRANSITION TO…
the clusters work for the same goal – to create and provide a full package of
audiovisual production services in Lithuania for a project of any size, at any stage.
VKK provides the highest quality services, actively cooperates with Lithuanian
and foreign partners, supports young filmmakers, and organizes professional
development events for film specialists, master classes.
The cluster has gathered leading film, animation and TV production, and
production services companies (Figure 3.21).
Fig. 3.21. Structure of Vilnius Film Cluster by economic activity, 2018, number of
members (Source: Composed by the author based on atvira.sodra.lt)

3. EVALUATION OF CLUSTER PERFORMANCE IN TRANSITION TO… 101
The expertise in different cluster members’ fields enables to provide the client
with full world-class service for any stage of production. The list of economic
activities can be started with repair, restoration, and reconstruction of buildings
practiced by one company. One member is working with wholesale trade – agents
involved in selling food, beverages, and tobacco. One member carries out the
publishing of books, periodicals, and other publishing activities. Motion picture,
video and television program production, sound recording, and music publishing
activities contain eleven members, six of which are into a motion picture, video
and television program production activities, one into a motion picture, video and
television program post-production activities, one into a motion picture, video and
television program distribution activities, two into motion picture projection
activities and one into sound recording and music publishing activities. One
member specializes in computer programming activities. Advertising and market
research, explicitly advertising agencies, are taken by three members.
Fig. 3.22. Structure of Vilnius Film Cluster by geographic location, type of business,
number of employees and turnover, 2018
(Source: Composed by the author according to KlasterLT)
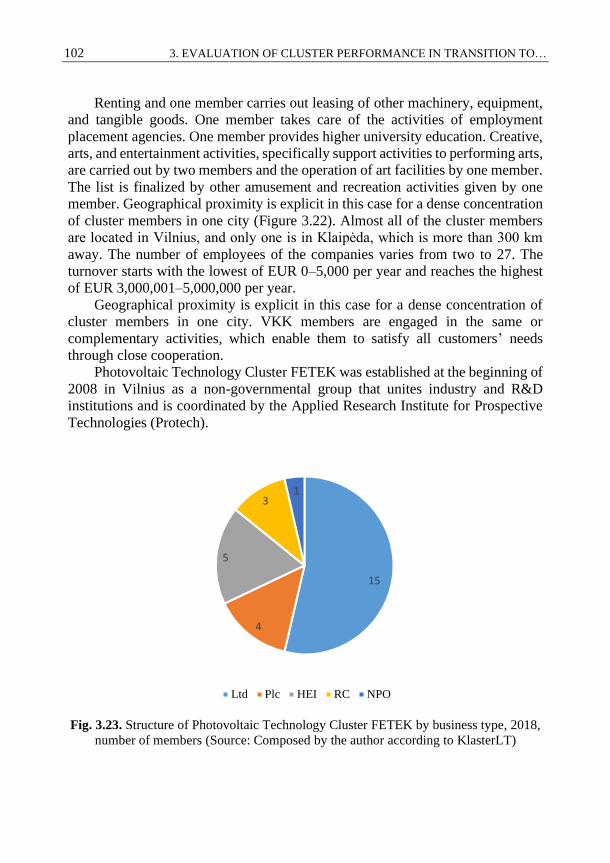
102 3. EVALUATION OF CLUSTER PERFORMANCE IN TRANSITION TO…
Renting and one member carries out leasing of other machinery, equipment,
and tangible goods. One member takes care of the activities of employment
placement agencies. One member provides higher university education. Creative,
arts, and entertainment activities, specifically support activities to performing arts,
are carried out by two members and the operation of art facilities by one member.
The list is finalized by other amusement and recreation activities given by one
member. Geographical proximity is explicit in this case for a dense concentration
of cluster members in one city (Figure 3.22). Almost all of the cluster members
are located in Vilnius, and only one is in Klaipėda, which is more than 300 km
away. The number of employees of the companies varies from two to 27. The
turnover starts with the lowest of EUR 0–5,000 per year and reaches the highest
of EUR 3,000,001–5,000,000 per year.
Geographical proximity is explicit in this case for a dense concentration of
cluster members in one city. VKK members are engaged in the same or
complementary activities, which enable them to satisfy all customers’ needs
through close cooperation.
Photovoltaic Technology Cluster FETEK was established at the beginning of
2008 in Vilnius as a non-governmental group that unites industry and R&D
institutions and is coordinated by the Applied Research Institute for Prospective
Technologies (Protech).
Fig. 3.23. Structure of Photovoltaic Technology Cluster FETEK by business type, 2018,
number of members (Source: Composed by the author according to KlasterLT)
15
4
5
31
Ltd Plc HEI RC NPO

3. EVALUATION OF CLUSTER PERFORMANCE IN TRANSITION TO… 103
The number of cluster members now reaches 28. It consists of fifteen Ltds –
BOD Group, GlassbelEU, Elaterma, Saulės Vėjo Aruodai, Soli Tek R&D, Soli
Tek Cells, Altechna, Europarama, Modern E-Technologies, NB Mechanika,
Precizika Metrology, Saulės Energija, Telebaltikos importas ir eksportas, Kemek
Engineering, Via Solis; four Plc – Anykščių kvarcas, Precizika, Viti, Modus
Energija; five higher education institutions – Vilnius University (VU), Kaunas
technology university (KTU), Vilnius Gediminas’ technical university (VILNIUS
TECH), Mykolas Romeris University (MRU), Vilniaus kolegija / University of
applied sciences (VIKO), three research centers (RC) – Center for Physical
Sciences and Technology (FTMC), the Applied Research Institute for Prospective
Technologies (Protech), Institute of Lithuanian Scientific Society (ILSS), one
non-profit organization – Northtown Technology Park (Figure 3.23).
Fig. 3.24. Structure of Photovoltaic Technology Cluster FETEK by economic activity,
2018, number of members (Source: Composed by the author based on atvira.sodra.lt)

104 3. EVALUATION OF CLUSTER PERFORMANCE IN TRANSITION TO…
The cluster’s main aim is to increase the sustainability and competitiveness
of the national photovoltaic (PV) sector. Many other principles are viewed as
being achieved during the collaboration, such as analysis of evolution and
tendencies of photovoltaic technologies, industry, and markets as well as R&D;
identification of competitive advantages of the FTK members and their present
and future needs; improvement of social image and investment attraction of PV
sector. All the members in the cluster are oriented to view cluster activities
through this perspective.
State and private research centers, companies operating in various sectors
related to PV technologies, and a company operating in non-PV related sectors
joined the cluster (Figure 3.24). These companies and research institutions started
cooperation to encourage innovation and facilitate investments, raise markets for
PV products and services in Lithuania and abroad, and foster the technological
modernization of the Lithuanian PV sector. One member carries out quarrying of
stone, sand, and clay. Manufacture of other non-metallic mineral products,
precisely shaping and processing flat glass, is performed by one member. One
member carries out the manufacture of fabricated metal products, except
machinery and equipment, to manufacture tools. Manufacturers of computer,
electronic and optical products are distributed by three members in the
manufacture of electronic components and one member in the manufacture of
instruments and appliances for measuring, testing, and navigation. Manufacture
of electrical equipment is taken by one member to manufacture electric motors,
generators and transformers, and two other electrical equipment manufacturers.
One member performs new buildings construction. One member takes specialized
construction activities, specifically plumbing, heat, and air conditioning
installation.
Wholesale trade, except motor vehicles and motorcycles, is practiced by four
members in these areas – wholesale of electrical household appliances, Wholesale
of electronic and telecommunications equipment and parts, wholesale of other
machinery and equipment, non-specialized wholesale trade. Real estate activities,
specifically the management of real estate on a fee or contract basis, are carried
out by one member. Two members take activities of head offices – management
consultancy activities and business and other management consultancy activities.
Scientific R&D are divided within four members – two in other research and
experimental development on natural sciences and engineering and two in
research and experimental development on social sciences and humanities.
Education is provided by one higher non-university education institution and three
higher university education institutions.The most significant concentration of
members is in Vilnius with the coordinator, education institutions, research
centers, and other companies (Figure 3.25). One member is less than 50 km away
in the Trakai district. Five companies are less than 150 km away – one in

3. EVALUATION OF CLUSTER PERFORMANCE IN TRANSITION TO… 105
Anykščiai, one in Alytus, two in the Kaunas district, and one in Kaunas. The
furthest member is in Klaipėda, less than 350 km away.
The number of employees of the companies varies from two to 56. The
turnover starts with the lowest of EUR 0–5,000 per year and reaches the highest
of EUR 10,000,001–20,000,000 per year.
Fig. 3.25. Structure of Photovoltaic Technology Cluster FETEK by geographic location,
type of business, number of employees and turnover, 2018
(Source: Composed by the author according to KlasterLT)
Most of the companies, research centers, and education institutions are
concentrated in Vilnius. There is close geographical proximity, and members
supplement each other by adding to activities that are practiced. The cluster
members go within the definition of SMEs.

106 3. EVALUATION OF CLUSTER PERFORMANCE IN TRANSITION TO…
Lithuanian Medical Tourism Cluster LitCare was established in 2013,
coordinated by association Lithuanian Medical Tourism Cluster, Vilnius. The
number of cluster members is nine. It consists of seven Ltd – Bendrosios
medicinos praktika, Flebologijos centras, Gradiali, Grožio Paslaugos, MCT –
reabilitacijos centras UPA, Pro-Implant, SK Impeks Medicinos Diagnostikos
Centras; one Plc – Eglės Sanatorija; one association – Lithuanian Medical
Tourism Cluster (Figure 3.26).
The cluster aims to create value for the medical tourist by providing medical
diagnostics, surgical and therapeutic treatment, rehabilitation, dentistry,
sanatorium-spa treatment, SPA and accommodation, and other health, wellness,
and travel organization. The cluster services cover an extensive range: from
remote medical tourist consultations, travel and treatment planning,
accommodation to therapeutic and surgical treatment, medical rehabilitation
programs, aesthetic and therapeutic dentistry, beauty, sports, and many other
medical fields. The organization of additional services for medical tourists is taken
care of by the cluster partners: tour operators, planners of entertainment, local
tourism, culture, and other service providers.
Fig. 3.26. Structure of Lithuanian Medical Tourism Cluster LitCare by business type,
2018, number of members (Source: Composed by the author according to KlasterLT)
The cluster members are medical diagnostic, treatment and rehabilitation
centers, dental clinics, sanatoriums, spas, and hotels (Figure 3.27). One member
is specialized in hotels and similar accommodation. One member provides
information service activities. Human health activities are provided by six
members and cover these activities: hospital activities, general medical practice
activities, dental practice activities, other human health activities. Other personal
7
1
1
Ltd Plc Association
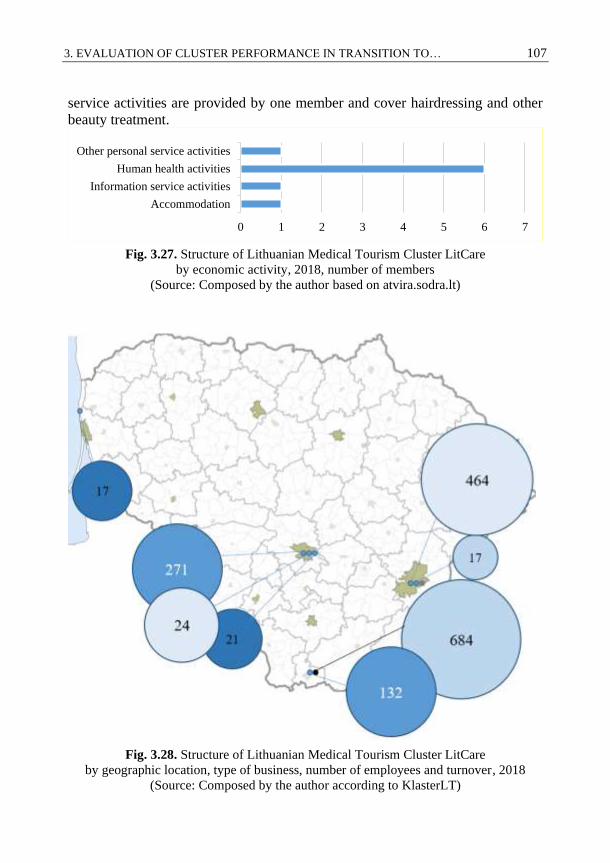
3. EVALUATION OF CLUSTER PERFORMANCE IN TRANSITION TO… 107
service activities are provided by one member and cover hairdressing and other
beauty treatment.
Fig. 3.27. Structure of Lithuanian Medical Tourism Cluster LitCare
by economic activity, 2018, number of members
(Source: Composed by the author based on atvira.sodra.lt)
Fig. 3.28. Structure of Lithuanian Medical Tourism Cluster LitCare
by geographic location, type of business, number of employees and turnover, 2018
(Source: Composed by the author according to KlasterLT)
1
1
6
1
Accommodation
Information service activities
Human health activities
Other personal service activities
0 1 2 3 4 5 6 7

108 3. EVALUATION OF CLUSTER PERFORMANCE IN TRANSITION TO…
The members of LitCare are not concentrated in one city, but they are
relatively in a short distance (Figure 3.28). The coordinator is in Vilnius, together
with the other two members. Three more members are in Kaunas and two in
Druskininkai, less than 150 km away. Only one member is further away in
Palanga, around 350 km away. The number of employees of the companies varies
from seventeen to 684. The turnover starts with the lowest at EUR 200,001–
300,000 per year and reaches the highest of EUR 20,000,001–30,000,000 per year.
The companies in the LitCare cluster are related through activities that are
delivered rather than through geographical proximity. The concentration of
companies is seen in several cities which are in the distance.
National Food Cluster was established in 2006, coordinated by association
National Food Cluster, Kaunas. The number of cluster members reaches fourteen.
It consists of ten Ltd – Baltic Food Technologies, Daumantai, Ekosula, Energenas,
Hortiled, Judex, SatiMed, Paslaugos žemdirbiams, Rūta, Salpronė; one farmer –
Šerkšno medus, one HEI – Vytautas Magnus University Agriculture Academy;
one RC – Lithuanian Research Centre for Agriculture and Forestry; one
association – National Food Cluster (Figure 3.29).
Fig. 3.29. Structure of National Food Cluster by business type, 2018,
number of members (Source: Composed by the author according to KlasterLT)
The National Food Cluster is a cooperation network of Lithuanian food
business enterprises and research institutions seeking to identify market niches
based on which the Lithuanian food industry could replace low value-added
chains with high value-added chains. The cluster aims to concentrate human,
10
1
1
1
1
Ltd Farmer HEI RC Association

3. EVALUATION OF CLUSTER PERFORMANCE IN TRANSITION TO… 109
financial, organizational, infrastructural, and technological resources, Lithuanian
companies occupying the planned market niches; to organize a continuous process
of acquiring skills, knowledge, and information of the network allows becoming
active and competitive market participants.
Several food manufacturing companies joined the cluster to seek synergy of
the effectiveness of activity for cost-minimizing and innovation (Figure 3.30). The
food industry and scientists have united to provide Lithuanian food manufacturers
conditions to develop products capable of outrivaling international brands.
Forestry and logging, specifically support services to forestry, are carried out by
one member. Five members practice the manufacture of food products in these
specializations: processing and preserving of fruit and vegetables, manufacture of
cocoa, chocolate, and sugar confectionery, manufacture of condiments and
seasonings, manufacture of prepared meals and dishes. One member carries out
the repair and installation of machinery and equipment, installing industrial
machinery and equipment. One member practices are wholesale of other
machinery and equipment. Scientific R&D in different specializations are carried
out by three members: research and experimental development on biotechnology;
other research and experimental development on natural sciences and engineering;
R&D in agriculture. Higher university education is presented by one institution.
One member develops activities of other membership organizations.
Fig. 3.30. Structure of National Food Cluster by economic activity, 2018,
number of members (Source: Composed by the author based on atvira.sodra.lt)
1
5
1
1
3
1
1
Forestry and logging
Manufacture of food products
Repair and installation of machinery and
equipment
Wholesale trade, except of motor vehicles
and motorcycles
Scientific research and development
Education
Activities of membership organisations
0 1 2 3 4 5 6

110 3. EVALUATION OF CLUSTER PERFORMANCE IN TRANSITION TO…
The majority of National Food Cluster members are situated in Kaunas and
the Kaunas district (Figure 3.31). Four companies are founded in Kaunas, while
three more companies, together with the coordinator and 1 HEI, are in the Kaunas
district. One company is less than 100 kilometres away from the Kaunas district
in the the Kėdainiai district. Kaunas’s furthest distance is less than 150 kilometres
away from 1 company in Šiauliai and in Utena. The number of employees of the
companies varies from one (three companies) to 263. The turnover starts with the
lowest of EUR 0–5,000 per year and reaches the highest of EUR 10,000,001–
20,000,000 per year.
Geographical proximity is evident in this case, as the majority of companies
are situated around Kaunas.
Fig. 3.31. Structure of National Food Cluster cluster by geographic location, type of
business, number of employees and turnover, 2018
(Source: Composed by the author according to KlasterLT)

3. EVALUATION OF CLUSTER PERFORMANCE IN TRANSITION TO… 111
Analysis of Lithuanian clusters shows that clusters are operating because they
want to gain a competitive advantage for their members while collaborating in all
value-creation chains. Technological development and research potential are
achieved when HEIs and RCs are involved in the activities of clusters.
Geographical proximity is evident in the majority of cases, which allows closer
collaboration. Cluster members’ interrelated activities ensure that the cluster’s
aims are followed, and members supplement one another. The most critical factors
that enable a company’s successful progress are innovation, quality of production,
and modern technologies. Belonging creates formal conditions for knowledge and
technology transfer to a cluster.
3.2. Evaluation Process and Results for Cluster Performance in Transition to Circular Economy
The practical applicability of the evaluation tool for cluster performance in tran-
sition to CE proposed in the work is tested in the case of Lithuanian clusters. Em-
pirical research is performed by analysing clusters operating in Lithuania.
Fig. 3.32. The sequence of tool application for assessment of clusters’ performance in
transition to circular economy (Source: Composed by the author)
The sequence of stages when the cluster performance in transition to CE
evaluation tool is applied is given in Figure 3.32 and followed throughout the
chapter. Statistical databases and a cluster coordinators’ questionnaire survey
Data collection and partial processing
Determination of criteria weights
Application of MCDM methods
Expert assessment
Expert compatibility
assessment
SAW TOPSIS
Evaluation of results
Correlation – regression analysis
Stage 1
Stage 2
Stage 3
Stage 5
Stage 4

112 3. EVALUATION OF CLUSTER PERFORMANCE IN TRANSITION TO…
were used for data collection (Stage 1 in Figure 3.32). Ten clusters were selected
for case analysis, but only seven completed the questionnaire given in Annex C.
Other statistical data required were taken from official sources: Sodra, EPA, and
KlasterLT.
The cluster coordinators evaluated intercommunication and marketing
activities on a scale from 1 to 8 as follows:
1 – Very rarely
2 – Rarely
3 – Moderately rarely
4 – More rarely than often
5 – More often than not
6 – Moderately often
7 – Often
8 – Very often
The questionnaire answers show how cluster coordinators evaluate intercom-
munication within a cluster (Figure 3.33).
Fig. 3.33. Intercommunication results on a scale of 1–8 and number of clusters
(Source: Cluster coordinators’ evaluation)
It may be assumed that cooperation while creating new products or
technologies satisfies the more significant part of the clusters, as only two clusters
evaluated this indicator at 4 or less. The other five gave a score of 6–8, which
indicates that the processes are happening often or very often. Cooperation in
innovation creation (organizational, marketing, and other) shows less satisfaction,
0 1 2 3 4 5 6 7 8
Co-operation while creating new products or
technologies
Co-operation while creating innovations
(organizational, marketing, etc.)
Common training, workshops, conferences,
internships
Common data base
Informal sharing of knowledge and
experience
Transference of technologies
1 2 3 4 5 6 7 8

3. EVALUATION OF CLUSTER PERFORMANCE IN TRANSITION TO… 113
as three clusters gave 3–4 points and four clusters gave 5–7 points. Joint training,
workshops, conferences and internships vary, with awards of 2 and 4 points by
two clusters and 6–8 points by five clusters. Three clusters give 8 points, which
indicates that the majority of clusters implement these activities very often.
Clusters do not often practise a common database, as two clusters gave the lowest
evaluation, 1 point, two gave 4 points, and the other three gave 5 points. Informal
sharing of knowledge and experience got the highest scores, as three clusters gave
7 points and four clusters gave 8 points, which indicates that it is practised by
cluster members very often. Transference of technologies happens often but does
not fully satisfy the cluster members, as two of them gave 2 points and 3 points,
and the values vary from 5 to 7 points. Although some of the clusters scored
intercommunication activities relatively, they must be shared by cluster members
according to the evaluations. The situation for marketing activities is a bit different
(Figure 3.34).
Fig. 3.34. Marketing activities results on a scale of 1–8 and number of clusters
(Source: Cluster coordinators’ evaluation)
Common supply and order schemes may not satisfy cluster members, as they
got evaluations from 1 to 6 points, the majority giving up to 5 points. Common
distribution channels might not be practised very often as only one cluster gave 5
points, while other evaluations varied from 2 to 4 points. Common cluster
members’ tenders for external clients are practiced more rarely with a tendency to
do that more often as most of the clusters gave 4 points and others gave 5–6 points.
One evaluation was 2 points. Exchange of current market information between
0 1 2 3 4 5 6 7 8
Common supply and order scheme
Common distribution channels
Common cluster members' tenders for
external clients
Exchange of common market information
between cluster members
Common participation in exhibitions and
fairs
Visual identification (common logo, brand)
1 2 3 4 5 6 7 8

114 3. EVALUATION OF CLUSTER PERFORMANCE IN TRANSITION TO…
cluster members has a wide evaluation from very rare to very often. In general,
more clusters evaluate this activity as more satisfying, as four clusters gave 6–8
points while two clusters gave 1 point and 4 points. Four clusters highlighted the
importance of collective participation in exhibitions and fairs, giving 7–8 points,
and the other three gave 2–4 points. The greater part falls to higher points. Visual
identification (logo, brand) does not appear to be used very often, with five
clusters giving the lowest evaluations of 1–4 points and two clusters awarding 6–
7 points. As seen generally, marketing activities are more often evaluated as rarely
applicable by clusters or are less popular, but they have high intensity of
involvement with the greater part of cluster members participating.
Human resources and financial activities include confidential information and
can only be viewed generally. Analysis of human resources shows the increase of
cluster members’ employees in two years is around 5–7 percent. The growth may
be determined by differences between members. Rapid growth in the number of
employees may be seen in more substantial companies in absolute measures and
in smaller companies in relative measures. The same goes to younger companies,
high-tech companies, larger companies – the growth is seen in terms of employees
and revenue and smaller companies show better results in productivity indicators
(as discussed in Chapter 1).
Analysis of financial activities shows that cluster members often come
together to prepare common project applications. According to the cluster
coordinators, most clusters prepared at least two to four joint cluster projects in
the two years 2017–2018. There have been between one and three joint-financed
cluster projects in two years. The number of joint international R&D projects
funded not from EU SF in two years varies from one to two. External financing
for cluster initiatives was from EUR 50,000 to EUR 747,802. The sum of cluster
members’ investments for cluster initiatives in the two years varies from EUR
30,000 to EUR 500,000.
In most cases, external financing is more significant in investment in cluster
initiatives. Clusters, which bring together excellent and more productive
companies, are less likely to look for alternative financing sources. It is possible
to acknowledge that financial support from external sources reduces cluster
members’ costs of developing cluster activities and provides opportunities to use
resources for investment in innovative activities.
Seven out of ten indicators for transition to the CE were taken from the EPA
and show the generation of different types of waste in tonnes per cluster. Six out
of seven clusters provided information about waste. The generation of municipal
waste per cluster varies from 63.96 tonnes to 6,657.49 tonnes, according to the
EPA. Most clusters do not exceed 1,000 tonnes per year, which means that the
greatest municipal waste producer generates twice as much waste as the other five
combined.

3. EVALUATION OF CLUSTER PERFORMANCE IN TRANSITION TO… 115
The generation of plastic, wooden and other packaging waste, e-waste,
biowaste, and construction and demolition waste highly depend on cluster
specialization (Figure 3.35). The most waste in two clusters is construction and
demolition waste, and this is the second most generated waste group in another
two clusters. The second most generated waste type in each cluster is plastic
packaging waste, followed by wooden packaging waste and other packaging
waste. The packaging waste takes a greater part in four out of six clusters.
Packaging waste Plastic packaging waste
Wooden packaging waste E-waste
Biowaste Construction and demolition waste
Fig. 3.35. Generation of waste results: share per year in 2018 in six clusters
a) C1; b) C2; c) C3; d) C4; e) C5; f) C6 (Source: Cluster coordinators’ evaluation)
Trade-in recyclable raw materials are not assessed in clusters. The food
industry tends to use all products during production or pass it on to stock farms or
other possible destinations using secondary raw materials. However, the food
industry also produces high volumes of packaging waste, which might be
recycled. Cluster coordinators indicate that more than 60 percent of cluster
members operating in the automotive, plastics and manufacturing industries tend

116 3. EVALUATION OF CLUSTER PERFORMANCE IN TRANSITION TO…
to import recyclable raw materials. The numbers are different from those of
exports of recyclable raw materials, as they vary from 44 percent to 92 percent of
cluster members. Only a few cluster members tend to trade recyclable raw
materials within a cluster.
Clusters’ performance in transition to CE is calculated using the methodology
presented in Chapter 2. MCDM methods and Correlation – regression analysis
were applied for calculation of the results, determining how cluster performance
is related to the transition towards CE. The calculations are done according to the
formed hierarchical system of indicators (Figure 2.2).
In a later stage (Stage 2 in Figure 3.32), experts were asked to confirm the
eligibility of the criteria by evaluating the indicators and ascribing weights. As
stated in Chapter 2, the number of experts may vary. Twelve experts with the
required qualifications were selected to ensure that sufficient responses were
received, and the questionnaires were sent. Directors, heads of departments, and
coordinators from different institutions were approached: the Lithuania
Innovation Center (LIC), LINPRA, MITA, NPO Circular Economy, VILNIUS
TECH, and foreign experts who participated in the implementation of the project
ClusDevMed. The experts’ experience in the required fields varies from three to
fifteen years in clusters and from four to ten years in CE, which indicates that their
evaluations can be trusted. The final weights in this work were determined by
seven experts.
Experts were asked to fill in the questionnaire (Annex D). Each indicator had
to be evaluated by giving weights, for a total 100 percent. The main information
about the work including the aim, purpose, and implication of methodology was
provided in the questionnaire. Cluster performance and transition to CE
evaluations were presented as different indicators requiring separate evaluations.
Cluster performance evaluation includes additional components evaluated with
the total sum of 100 percent for four groups of components.
Processing of the results was followed by calculation of the consistency of
experts’ evaluation (Stage 3 in Figure 3.32). The evaluation was done by ranking
the indicators, assigning the highest value 1 to the most crucial element and 6 to
the least important element. For each decision stage, the concordance coefficient
𝑊 and criterion were calculated to check the consistency of experts’
evaluation. The values of 𝑘𝑟2 in Table 3.2 depend on the significance level 𝛼 and
the degree of freedom 𝑚 − 1. The concordance coefficient 𝑊 is calculated
according to formula (1), and criterion according to formula (2). The
concordance coefficients 𝑊, , and 𝑘𝑟2 of clusters’ performance evaluation
components are given in Table 3.2.
When the intercommunication component is viewed, 𝑊 = 0.72 indicates a
high degree of consistency among the expert opinions. Concordance coefficient
was calculated to evaluate the significance of the concordance coefficient. The

3. EVALUATION OF CLUSTER PERFORMANCE IN TRANSITION TO… 117
value of χkr(α = 0.05,m−1 = 5)2 = 11.0705. The coefficient is twice as high as
𝑘𝑟2 = 11.07, which indicates that expert opinions are consistent. Marketing
activities with 𝑊 = 0.65 indicate the average consistency of expert opinions. The
value of χkr(α = 0.05,m−1 = 5)2 = 11.0705. The coefficient = 22.84 is greater than
𝑘𝑟2 = 11.07, which means that 𝑊 = 0.65 is not a random variable, and the obtained
results make sense and can be used in further calculations. Human resources with
𝑊 = 0.52 indicate the average consistency of expert opinions. The value of
χkr(α = 0.05,m−1 = 5)2 = 12.59159. The coefficient = 21.95 is greater than
𝑘𝑟2 = 11.07, which means that 𝑊 = 0.65 is not a random variable, and the results
can be used in further calculations. Financial resources with 𝑊 = 0.6 indicate the
average consistency of expert opinions. The value of
χkr(α = 0,05.m−1 = 5)2 = 11.0705. The coefficient = 21.1 is greater than
𝑘𝑟2 = 11.07, which means that 𝑊 = 0.6 is not a random variable, and the results
can be used in further calculations.
Table 3.2. The concordance coefficients 𝑾, , and 𝒌𝒓𝟐 of clusters’ performance
evaluation components (Source: Composed by the author)
Components 𝑊 𝑘𝑟2
Intercommunication 0.72 25.33 11.07
Marketing activities 0.65 22.84 11.07
Human resources 0.52 21.95 12.59
Financial resources 0.6 21.1 11.07
Table 3.3. illustrates the compatibility of expert opinions for cluster perfor-
mance evaluation and transition to CE evaluation. The concordance coefficients
𝑊, , and 𝑘𝑟2 of clusters’ performance evaluation components are given in Ta-
ble 3.3.
Cluster performance, with 𝑊 = 0.65, indicates the average consistency of
expert opinions. The value of χkr(α = 0.05,m−1 = 5)2 = 7.81473. The coefficient
= 13.1, which is greater than 𝑘𝑟2 = 7.81, showing that 𝑊 = 0.65 is not a random
variable, and the obtained results make sense and can be used in further
calculations. Transition to CE with 𝑊 = 0.86 indicates a high degree of
consistency among the expert opinions. Pearson’s coefficient was calculated to
evaluate the significance of the concordance coefficient. The value of
χkr(α = 0,05,m−1 = 5)2 = 16.91898. The coefficient = 54 is greater than
𝑘𝑟2 = 16.92, which means that 𝑊 = 0.86 is not a random variable, and the obtained
results make sense and can be used in further calculations.
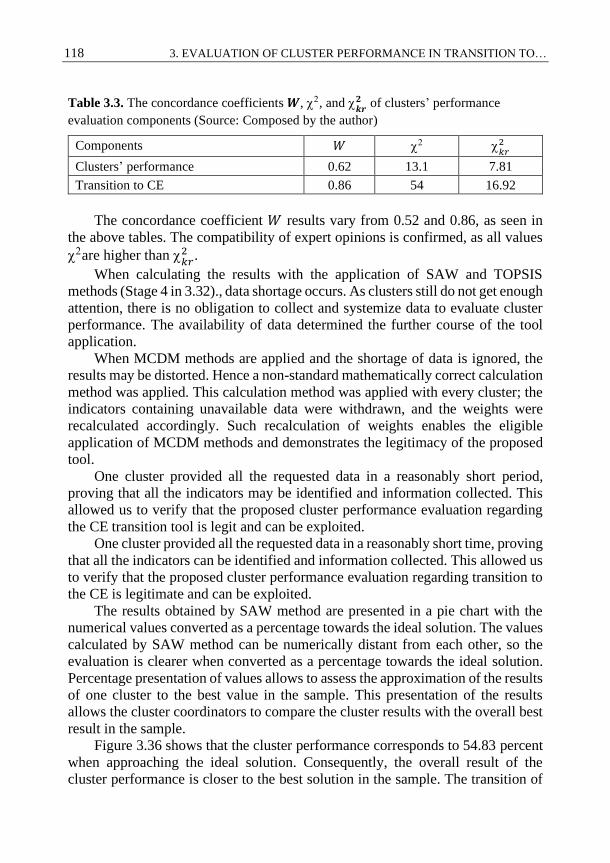
118 3. EVALUATION OF CLUSTER PERFORMANCE IN TRANSITION TO…
Table 3.3. The concordance coefficients 𝑾, , and 𝒌𝒓𝟐 of clusters’ performance
evaluation components (Source: Composed by the author)
Components 𝑊 𝑘𝑟2
Clusters’ performance 0.62 13.1 7.81
Transition to CE 0.86 54 16.92
The concordance coefficient 𝑊 results vary from 0.52 and 0.86, as seen in
the above tables. The compatibility of expert opinions is confirmed, as all values
are higher than 𝑘𝑟2 .
When calculating the results with the application of SAW and TOPSIS
methods (Stage 4 in 3.32)., data shortage occurs. As clusters still do not get enough
attention, there is no obligation to collect and systemize data to evaluate cluster
performance. The availability of data determined the further course of the tool
application.
When MCDM methods are applied and the shortage of data is ignored, the
results may be distorted. Hence a non-standard mathematically correct calculation
method was applied. This calculation method was applied with every cluster; the
indicators containing unavailable data were withdrawn, and the weights were
recalculated accordingly. Such recalculation of weights enables the eligible
application of MCDM methods and demonstrates the legitimacy of the proposed
tool.
One cluster provided all the requested data in a reasonably short period,
proving that all the indicators may be identified and information collected. This
allowed us to verify that the proposed cluster performance evaluation regarding
the CE transition tool is legit and can be exploited.
One cluster provided all the requested data in a reasonably short time, proving
that all the indicators can be identified and information collected. This allowed us
to verify that the proposed cluster performance evaluation regarding transition to
the CE is legitimate and can be exploited.
The results obtained by SAW method are presented in a pie chart with the
numerical values converted as a percentage towards the ideal solution. The values
calculated by SAW method can be numerically distant from each other, so the
evaluation is clearer when converted as a percentage towards the ideal solution.
Percentage presentation of values allows to assess the approximation of the results
of one cluster to the best value in the sample. This presentation of the results
allows the cluster coordinators to compare the cluster results with the overall best
result in the sample.
Figure 3.36 shows that the cluster performance corresponds to 54.83 percent
when approaching the ideal solution. Consequently, the overall result of the
cluster performance is closer to the best solution in the sample. The transition of

3. EVALUATION OF CLUSTER PERFORMANCE IN TRANSITION TO… 119
the cluster to the CE corresponds to 90.15 percent when approaching the ideal
solution. This shows that the result of the cluster transition to CE is very close to
the best value in the sample. The final result may alternate depending on the
number of samples included in the analysis with provided data.
Fig. 3.36. Evaluation of cluster performance in transition to CE by the SAW method
as a percentage towards the ideal solution (Source: Composed by the author)
Percentage towards the ideal solution for results assessed by SAW method
was calculated according to the equation:
100×
= real
Recommendationideal
. (3.1)
A chart including the results obtained by the TOPSIS method can be provided
to decision makers who review them make considerations (Figure 3.37). TOPSIS
results are presented in numerical values in the range from 0 to 1. Such
presentation allows the comparison of the clusters with each other or the change
of the results of the same cluster in different periods when aiming at assessment
of their distribution according to the area in which the cluster stands out. The chart
shows that the performance of the clusters is distributed at the average and range
from 0.425 to 0.561. Meanwhile, the results of the transition to CE are more
fragmented, fluctuating throughout the range. Such distribution is possible due to
the fact that the clusters belong to different sectors. Therefore, it is necessary to
pay attention to the specifics of the cluster when making decisions.This work
applies a non-standard approach to correlation – regression analysis (Stage 5 in
Figure 3.32). In this case, it is suggested to use correlation – regression analysis
to find the relationship between the results calculated, using different MCDM
methods to select the best alternative. Here, the connection between the results
obtained by MCDM methods, which incorporate measures in a particular system
of criteria, is looked for instead of the connection between direct cluster estimates.
55%
Cluster's
performance
90%
Transition
to CE

120 3. EVALUATION OF CLUSTER PERFORMANCE IN TRANSITION TO…
These estimates help measure cluster performance and transition to CE, while
correlation – regression analysis allows us to trace if the results of SAW and
TOPSIS methods show the relationship between the two sets of indicators. In this
case, the interdependence of cluster performance and transition to CE is seen.
Fig. 3.37. Evaluation of cluster performance in transition to CE by the TOPSIS method
in the range from 0 to 1
(Source: Composed by the author)
Two sets of criteria define cluster performance and transition to CE. Seven
clusters participated in the application of the proposed scheme. MCDM methods
(SAW and TOPSIS) were used to combine the values of criteria and their weights
into one estimate for each set of criteria that determines the numeric value. Hence,
two separate tasks were solved by evaluating clusters’ performance and transition
to CE using the proposed criteria. The estimates that were calculated for these
areas show a statistical correlation.
The linear regression model was determined from the estimates of six
clusters, as one cluster did not provide statistics for the calculations of transition
to CE. Assuming that this cluster does not belong to the industrial sector, only
cluster performance was calculated. The omission of the data was not considered
zero value because that could distort the results’ reliability. Therefore, one cluster
was eliminated from the application of the tool when the correlation – regression-
regression analysis was performed.
Here, we take statistical variables x and y, where x is transition to the CE and
y is clusters’ performance in numerical values when the results of SAW and
TOPSIS were calculated.
As seen from the results when both SAW and TOPSIS methods were applied,
clusters’ performance and transition to CE follow a linear pattern. When the
TOPSIS method is applied, the equation is y = 5.6307x–2.1391. The scatterplot of
K1 K2 K3 K4 K5 K6
Cluster performance 0.561 0.474 0.517 0.471 0.460 0.425
Transition to CE 0.971 0.410 0.831 0.999 0.000 0.324
0.000
0.200
0.400
0.600
0.800
1.000

3. EVALUATION OF CLUSTER PERFORMANCE IN TRANSITION TO… 121
our data with the results calculated using the TOPSIS method indicates a positive
direction. The two variables have a positive linear relationship: when one variable
moves in a particular direction, the other tends to move in the same direction with
positive covariance. The determined relationship is recorded analytically using a
linear regression model.
The estimates when the SAW method was applied are more distant from each
other than those of TOPSIS. The results determined by the SAW method are
related to the following relationship: y = 0.868x + 16.617. The obtained linear
regression models extrapolate the results outside the obtained result ranges by
making specific predictions. In the equations, the values x and y are the
approximate estimates of the respective clusters obtained after the cluster
performance results and after transition to CE is calculated.
The correlation – regression analysis results with the coefficient of
determination 𝑅2 when the results of SAW and TOPSIS analyses are applied are
given in Table 3.4. The closer the value of the coefficient is to 1, the stronger the
relationship detected. The coefficient of determination 𝑅2 equals 0.66 when
TOPSIS analysis results were applied. The result shows a moderate positive
relationship. The results of the SAW analysis also show a moderate positive
relationship with 𝑅2 equal to 0.51. It is possible to say that there is primary
causation, as clusters’ performance may cause a transition to CE.
Table 3.4. The coefficient of determination 𝑹𝟐 when the results of SAW and TOPSIS
analyses were applied (Source: Composed by the author)
TOPSIS SAW
𝑅2 0.66 0.51
The reliability of the results when correlation – regression analysis is
performed might be determined by the volume of data. Too little data collected
for the study may result in a lack of degrees of freedom due to large estimation
errors. When the tool is applied, it is suggested to add more values to the data
series in order to avoid the insignificance of variables due to too few degrees of
freedom.
Correlation – regression-regression analysis was applied to examine whether
there is a relationship between the cluster performance and transition to CE. The
results show that although the data necessary for the research are not available in
some cases, this is because they are not collected regularly for observation or there
is limited access due to data protection on the company level. The suggested tool
was applied in operating clusters in Lithuania. One cluster provided all the
necessary data, which allowed us to adapt the methods and calculate the results.

122 3. EVALUATION OF CLUSTER PERFORMANCE IN TRANSITION TO…
The final result shows that there is a preliminary relationship between cluster
performance and transition to CE.
The suggested tool was applied in seven active clusters operating in Lithuania
to verify its reliability. The tool allows the evaluation of clusters’ performance in
transition to the CE, and the relationship between cluster performance and
transition to the CE individually for a cluster or by comparing the results of several
clusters. Here, the precision of the results of the applied tool depends on the
number of clusters that are benchmarked and the time span when the data are
collected (here, the years 2017 and 2018).
3.3. Overview of Obtained Results
When the whole world is moving towards a CE, it is impossible to ignore this.
Companies search for partners that share similar ideas of how resources should be
treated in different operation stages to turn to circular business models. They make
partnerships with companies that turn waste into materials to make operations
more efficient and save resources.
The growing interest in clusters is seen in Lithuania. Governmental
institutions have promoted initiatives that should encourage existing clusters to
involve members in joint activities and become mature. Cluster monitoring is
carried out every two years with the aim of monitoring the overall trend of cluster
change. Ten Lithuanian clusters have obtained ESCA Bronze labels, recognized
and appreciated by the international community, showing their competence and
maturity.
The proposed cluster performance in transition to CE evaluation tool has been
tested in seven Lithuanian clusters. This tool can be applied in Lithuania by
repeating the procedure every year and benchmarking the results. Such
continuation would serve to detect areas which need improving. The cluster
performance in transition to CE evaluation tool can be applied in other countries
as the indicators are selected taking international documents into consideration.
The research has some limitations which occur due to the complicated
structure of clusters. Some data on the company level are not available, making it
impossible to assess the data on the cluster level. In some cases, interviews with
cluster coordinators enabled them to fill the gap by adding the necessary data. The
information provided by a cluster coordinator may lack objectivity. Interviews
and questionnaire surveys are applicable as methods when no reliable statistical
data are available. This suggests that information gathered using these methods
might be subjective and inaccurate in some cases.
The transition to CE can be identified by the total quantity of waste suitable
for use as a material (which is a priority use of waste), for recycling, and non-

3. EVALUATION OF CLUSTER PERFORMANCE IN TRANSITION TO… 123
recyclable waste (incinerated or landfilled). Municipal waste, packaging waste,
plastic packaging, wooden packaging, e-waste, bio-waste, and construction and
demolition waste contain materials that may or may not be recyclable. Accounting
for waste is complex as the remains of packaging can be reported as waste, which
entails a heavy administrative burden for companies, or it can be sold without
reporting. Unfortunately, this disadvantage applies to the entire waste
management system, with enormous amounts of unaccounted waste.
The initial idea was to follow the indicators selected to monitor CE progress
in each EU country as suggested by the European Commission This should
include the recycling rate of packaging waste, plastic packaging, wooden
packaging, and e-waste, and the recovery rate of construction and demolition
waste. The Lithuanian Department of Statistics referred to the EPA for the data
required: the response was that none of the members of any given cluster is a
waste recycler, so recycling rates are not accounted for. The only data that can be
provided are in relation to the amount of waste.
Here, the circularity of a cluster itself is evaluated. Therefore, other available
data are selected to recognize industrial symbiosis if it takes place, being the
median of waste volume over the last two years and the exchange of materials
among cluster members.
3.4. Conclusions of Chapter 3
1. The case analysis of ten Lithuanian clusters awarded an ESCA Bronze
label shows that these clusters correspond to the main description and
demonstrate the main features. Most of the cluster members are SMEs
engaged in similar or complementary activities related through
geographical proximity. The only apparent deficiency is that none of
the cluster members is a waste recycler. Clusters have everything
needed for the supply chain – suppliers, manufacturers, distributors,
marketing, service, R&D, innovations, and HR management
2. Clusters as a unit do not get enough attention, which results in a lack
of accessible data. Hence, some of the necessary data are not available,
as they are company data with limited access. One cluster provided all
the information, allowing the application of SAW and TOPSIS
methods and suggesting an ideal solution for calculating SAW results.
The results of this cluster when cluster’s performance is evaluated by
SAW equals to 54.83 percent towards the ideal solution and TOPSIS
equals to 47.37 percent. Transition to CE by the same cluster is
evaluated by SAW at 90.15 percent towards the ideal solution and
TOPSIS at 41.04 percent.

124 3. EVALUATION OF CLUSTER PERFORMANCE IN TRANSITION TO…
3. The correlation – regression analysis includes SAW and TOPSIS
results for six clusters which indicate a preliminary relationship
between clusters’ performance and transition to CE. The coefficient of
determination 𝑅2 equals 0.66 when the numerical values of SAW
calculations are applied and 0.51 when the results of TOPSIS analysis
are applied.
4. The tool’s practical application in seven Lithuanian clusters and the
obtained results show that the cluster performance in transition to CE
evaluation tool can be used nationally and adapted for other countries.
5. The easiest way for clusters to become more circular is to involve a
waste recycler as a member of a cluster or to act as a waste recycler by
using one member’s waste as other member’s materials. The amount
of waste could be reduced in this way and value created, giving the
cluster a competitive advantage.

125
General Conclusions
1. The theoretical analysis revealed the ambiguity of the notions that
were selected for analysis. General approaches were depicted for
further analysis of clusters and CE. The scientific literature helped to
identify that clusters are interested in resource efficiency, and
reduction of energy, material, and water costs, showing the importance
of clusters when SMEs are encouraged to turn to the CE. One of the
most frequently detected features in clustering is the competitive
advantage gained by SMEs through proximity. The CE may help
SMEs achieve this, as clusters can connect corresponding parties
involved in resource efficiency, recycling, re-use of materials, and
other activities within a unit.
2. Literature analysis helped to identify the indicators that are most
frequently used by scholars when clusters are studied. These were
further combined with measures indicated by Lithuanian
governmental institutions and ESCA. Four main groups of indicators
that are viewed as highly representative in cluster performance were
composed according to these sources: intercommunication, showing
how close the relationship between cluster members is; financial
resources, including possible financial information about projects and
other investments; human resources, indicating the qualifications of

126 GENERAL CONCLUSIONS
personnel in a cluster, the kind of training they get, and the way the
cluster is coordinated; and marketing activities, including indicators
that enable promotion of the cluster in the society.
3. Indicators defining the transition towards the CE were selected after
literature analysis and followed a framework for monitoring progress
suggested by the EC. Ten indicators included generating municipal
and other waste, helping to follow the trend in waste control and trade
in recyclable or reusable raw materials through imports, exports, and
between cluster members.
4. The thesis’s scientific novelty lies with incorporating two new systems
of proposed indicators into one tool: cluster performance evaluation
and transition of a cluster to CE evaluation. This tool is designed to be
used in Lithuanian clusters, with possible applications in other
countries. The evaluation tool monitors clusters’ development
regarding performance and transition to CE through a specific set of
indicators. It can be used by cluster managers, coordinators, and
authorities, and by governmental institutions to support the need for
funding opportunities to develop clusters.
5. A case analysis was performed in operating clusters, which showed
that clusters are undervalued in Lithuania. Data regarding clusters’
performance should be collected and evaluated regularly for progress
assessment. Clusters operating in different sectors were selected for
case analysis, the result being that the performance of seven clusters
and the transition to CE of six clusters were evaluated by applying
MCDM methods (SAW, TOPSIS).
6. The collected data allowed the formation of a database to be initiated
according to the proposed system of indicators. The results of clusters’
performance in transition to CE evaluation show that there is a
relationship between clusters’ performance and transition to CE. This
implies that clusters can be used as tools for the further development
of resource-efficient companies.

127
References
ACI Committee 201. 2001. Guide to Durable Concrete, ACI 201.2R-01. Farmington Hills,
Michigan: ACI. 41 p.
A European Green Deal | European Commission. (n.d.). Retrieved March 8, 2021, from
https://ec.europa.eu/info/strategy/priorities-2019-2024/european-green-deal_en
Abdulgader, F. S., Eid, R., & Rouyendegh, B. D. (2018). Development of decision support
model for selecting a maintenance plan using a fuzzy MCDM approach: A theoretical
framework. Applied Computational Intelligence and Soft Computing, 2018.
https://doi.org/10.1155/2018/9346945
Akoorie, M. E. M. (2011). A challenge to Marshallian orthodoxy on industrial clustering.
Journal of Management History, 17(4), 451–470.
https://doi.org/10.1108/17511341111164445
Alcácer, J., & Chung, W. (2014). Location strategies for agglomeration economies.
Strategic Management Journal, 35(12), 1749–1761. https://doi.org/10.1002/smj.2186
Alexander, R. (2018). Sustainability in global production networks – Introducing the
notion of extended supplier networks. Competition and Change, 22(3), 255–273.
https://doi.org/10.1177/1024529418768606
Atviri įmonių duomenys - atvira.sodra.lt. (n.d.). Retrieved July 10, 2019, from
https://atvira.sodra.lt/imones/paieska/index.html

128 REFERENCES
Barnett, W. P., & Pontikes, E. G. (2004). THE RED QUEEN: HISTORY-DEPENDENT
COMPETITION AMONG ORGANIZATIONS. Research in Organizational Behavior,
Vol. 26, pp. 351–371. https://doi.org/10.1016/S0191-3085(04)26009-9
Basile, R., Benfratello, L., & Castellani, D. (2013). Geoadditive Models for Regional
Count Data: An Application to Industrial Location. Geographical Analysis, 45(1), 28–48.
https://doi.org/10.1111/gean.12001
Bathelt, H., & Li, P.-F. (2014). Global cluster networks – foreign direct investment flows
from Canada to China. Journal of Economic Geography, 14(1), 45–71.
https://doi.org/10.1093/jeg/lbt005
Bathelt, H., & Zhao, J. (2020). Identifying configurations of multiple co-located clusters
by analyzing within and between-cluster linkages. Growth and Change, 51(1), 309–337.
https://doi.org/10.1111/grow.12357
Bellantuono, N., Carbonara, N., & Pontrandolfo, P. (2017). The organization of eco-
industrial parks and their sustainable practices. Journal of Cleaner Production, 161, 362–
375. https://doi.org/10.1016/J.JCLEPRO.2017.05.082
Ben Letaifa, S., & Rabeau, Y. (2013). Too close to collaborate? How geographic
proximity could impede entrepreneurship and innovation. Journal of Business Research,
66(10), 2071–2078. https://doi.org/10.1016/j.jbusres.2013.02.033
Benchmarking of Cluster Organisations – ESCA. (n.d.). Retrieved September 1, 2019,
from https://www.cluster-analysis.org/benchmarking-in-a-nutshell
Bindroo, V., Mariadoss, B. J., & Pillai, R. G. (2012). Customer Clusters as Sources of
Innovation-Based Competitive Advantage. Journal of International Marketing, 20(3), 17–
33. https://doi.org/10.1509/jim.11.0159
Blancheton, B., & Hlady-Rispal, M. (2020). Ensuring product quality: luxury clusters in
cognac and leather. Regional Studies. https://doi.org/10.1080/00343404.2020.1800626
Blomsma, F., & Brennan, G. (2017). The Emergence of Circular Economy: A New
Framing Around Prolonging Resource Productivity. Journal of Industrial Ecology, 21(3),
603–614. https://doi.org/10.1111/jiec.12603
Boschma, R., Minondo, A., & Navarro, M. (2013). The Emergence of New Industries at
the Regional Level in Spain: A Proximity Approach Based on Product Relatedness.
Economic Geography, 89(1), 29–51. https://doi.org/10.1111/j.1944-8287.2012.01170.x
Bouncken, R. B., & Kraus, S. (2013). Innovation in knowledge-intensive industries: The
double-edged sword of coopetition. Journal of Business Research, 66(10), 2060–2070.
https://doi.org/10.1016/j.jbusres.2013.02.032
Boutkhoum, O., Hanine, M., Boukhriss, H., Agouti, T., & Tikniouine, A. (2016). Multi-
criteria decision support framework for sustainable implementation of effective green
supply chain management practices. SpringerPlus, 5(1). https://doi.org/10.1186/s40064-
016-2233-2
Braun, A. T., Kleine-Moellhoff, P., Reichenberger, V., & Seiter, S. (2018). Case study
analysing potentials to improve material efficiency in manufacturing supply chains,

REFERENCES 129
considering circular economy aspects. Sustainability (Switzerland), 10(3).
https://doi.org/10.3390/su10030880
Bressanelli, G., Adrodegari, F., Perona, M., & Saccani, N. (2018). Exploring how usage-
focused business models enable circular economy through digital technologies.
Sustainability (Switzerland), 10(3). https://doi.org/10.3390/su10030639
Broekel, T., Fornahl, D., & Morrison, A. (2015). Another cluster premium: Innovation
subsidies and R&D collaboration networks. Research Policy, 44(8), 1431–1444.
https://doi.org/10.1016/j.respol.2015.05.002
Bublienė, R., Vinogradova, I., Tvaronavičienė, M., & Monni, S. (2019). Legal form
determination for the development of clusters’ activities. Insights into Regional
Development, 1(3), 244–258. https://doi.org/10.9770/ird.2019.1.3(5)
Carswell, G. (2013). Dalits and local labour markets in rural India: experiences from the
Tiruppur textile region in Tamil Nadu. Transactions of the Institute of British
Geographers, 38(2), 325–338. https://doi.org/10.1111/j.1475-5661.2012.00530.x
Carswell, G., & De Neve, G. (2013). Labouring for global markets: Conceptualising
labour agency in global production networks. Geoforum, 44, 62–70.
https://doi.org/10.1016/j.geoforum.2012.06.008
Casanueva, C., Castro, I., & Galán, J. L. (2013). Informational networks and innovation
in mature industrial clusters. Journal of Business Research, 66(5), 603–613.
https://doi.org/10.1016/j.jbusres.2012.02.043
Castellani, D., Jimenez, A., & Zanfei, A. (2013). How remote are R&D labs? Distance
factors and international innovative activities. Journal of International Business Studies,
44(7), 649–675. https://doi.org/10.1057/jibs.2013.30
Cavallo, A., Ghezzi, A., & Balocco, R. (2019). Entrepreneurial ecosystem research:
present debates and future directions. International Entrepreneurship and Management
Journal, 15(4), 1291–1321. https://doi.org/10.1007/s11365-018-0526-3
Cerdas, F., Kurle, D., Andrew, S., Thiede, S., Herrmann, C., Zhiquan, Y., Kara, S. (2015).
Defining circulation factories - A pathway towards factories of the future. Procedia CIRP,
29, 627–632. https://doi.org/10.1016/j.procir.2015.02.032
Chen, J. (2020). The impact of cluster diversity on economic performance in U.S.
metropolitan statistical areas. Economic Development Quarterly, 34(1), 46–63. Retrieved
from
https://researchrepository.wvu.edu/cgi/viewcontent.cgi?article=1206&context=rri_pubs
Circular Economy. Closing the loop. (2018). Publications Office of the European Union,
pp. 1–2. https://doi.org/10.2779/83272
Classification of Economic Activities (EVRK) - Oficialiosios statistikos portalas. (n.d.).
Retrieved July 13, 2019, from https://osp.stat.gov.lt/en_GB/600
Cole, C., Gnanapragasam, A., Singh, J., & Cooper, T. (2018). Enhancing Reuse and
Resource Recovery of Electrical and Electronic Equipment with Reverse Logistics to

130 REFERENCES
Meet Carbon Reduction Targets. Procedia CIRP, 69, 980–985.
https://doi.org/10.1016/j.procir.2017.11.019
Connell, J., & Voola, R. (2013). Knowledge integration and competitiveness: A
longitudinal study of an industry cluster. Journal of Knowledge Management, 17(2), 208–
225. https://doi.org/10.1108/13673271311315178
Cooper, S. J. G., Giesekam, J., Hammond, G. P., Norman, J. B., Owen, A., Rogers, J. G.,
& Scott, K. (2017). Thermodynamic insights and assessment of the ‘circular economy’’.’
Journal of Cleaner Production, 162, 1356–1367.
https://doi.org/10.1016/j.jclepro.2017.06.169
Corredoira, R. A., & McDermott, G. A. (2014). Adaptation, bridging and firm upgrading:
How non-market institutions and MNCs facilitate knowledge recombination in emerging
markets. Journal of International Business Studies, 45(6), 699–722.
https://doi.org/10.1057/jibs.2014.19
Crane, A., Palazzo, G., Spence, L. J., & Matten, D. (2014). Contesting the value of
“creating shared value.” California Management Review, 56(2), 130–153.
https://doi.org/10.1525/cmr.2014.56.2.130
Crespo, J., Suire, R., & Vicente, J. (2014). Lock-in or lock-out? How structural properties
of knowledge networks affect regional resilience. Journal of Economic Geography, 14(1),
199–219. https://doi.org/10.1093/jeg/lbt006
D’agostino, L. M., Laursen, K., & Santangelo, G. D. (2013). The impact of R&D
offshoring on the home knowledge production of OECD investing regions. Journal of
Economic Geography, 13(1), 145–175. https://doi.org/10.1093/jeg/lbs012
D’Amato, D., Droste, N., Allen, B., Kettunen, M., Lähtinen, K., Korhonen, J., Toppinen,
A. (2017). Green, circular, bio economy: A comparative analysis of sustainability avenues.
Journal of Cleaner Production, 168, 716–734.
https://doi.org/10.1016/j.jclepro.2017.09.053
D’Este, P., Guy, F., & Iammarino, S. (2013). Shaping the formation of university-industry
research collaborations: What type of proximity does really matter? Journal of Economic
Geography, 13(4), 537–558. https://doi.org/10.1093/jeg/lbs010
Daddi, T., Tessitore, S., & Frey, M. (2012). Eco-innovation and competitiveness in
industrial clusters. International Journal of Technology Management, 58(1–2), 49–63.
https://doi.org/10.1504/IJTM.2012.045788
de Felice, A. (2014). Measuring the social capabilities and the implication on innovation:
Evidence from a special industrial cluster. Journal of Economic Studies, 41(6), 907–928.
https://doi.org/10.1108/JES-05-2013-0071
De Vaan, M., Boschma, R., & Frenken, K. (2013). Clustering and firm performance in
project-based industries: the case of the global video game industry, 1972-2007. Journal
of Economic Geography, 13(6), 965–991. https://doi.org/10.1093/jeg/lbs038

REFERENCES 131
Directorate-General for Internal Market, Industry, E. and Sme. (European C. (2017). User
guide to the SME definition. In Brooking Global Economy And Development (Vol. 13).
https://doi.org/10.2873/782201
Dobusch, L., & Schüßler, E. (2013). Theorizing path dependence: A review of positive
feedback mechanisms in technology markets, regional clusters, and organizations.
Industrial and Corporate Change, 22(3), 617–647. https://doi.org/10.1093/icc/dts029
Engel, J. S., Berbegal-Mirabent, J., & Piqué, J. M. (2018). The renaissance of the city as
a cluster of innovation. Cogent Business and Management, 5(1), 1–20.
https://doi.org/10.1080/23311975.2018.1532777
European Commission. (2018). Circular Economy Strategy - Environment - European
Commission. Retrieved November 19, 2018, from
http://ec.europa.eu/environment/circular-economy/index_en.htm
European Commission. (2019). Report from the commission to the European Parliament,
the Council, the European Economic and Social Committee and the Committee of the
Regions. Retrieved from
https://ec.europa.eu/eurostat/tgm/table.do?tab=table&init=1&language=en&pcode=cei_s
rm030&plugin=1
Eurostat. (n.d.). Retrieved January 10, 2020, from https://ec.europa.eu/eurostat
Eurostat. (2019). Statistics | Eurostat. Retrieved March 8, 2021, from Eurostat website:
https://ec.europa.eu/eurostat/databrowser/view/cei_srm030/default/table?lang=en
Expósito-langa, M., Tomás-miquel, J. V., & Molina-morales, F. X. (2015). Innovation in
clusters: Exploration capacity, networking intensity and external resources. Journal of
Organizational Change Management, 28(1), 26–52. https://doi.org/10.1108/JOCM-10-
2013-0192
Fallah, B., Partridge, M. D., & Rickman, D. S. (2014). Geography and high-tech
employment growth in US counties. Journal of Economic Geography, 14(4), 683–720.
https://doi.org/10.1093/jeg/lbt030
Feldman, M. P. (2014). The character of innovative places: Entrepreneurial strategy,
economic development, and prosperity. Small Business Economics, 43(1), 9–20.
https://doi.org/10.1007/s11187-014-9574-4
Funk, R. J. (2014). Making the Most of Where You Are: Geography, Networks, and
Innovation in Organizations. Academy of Management Journal, 57(1), 193–222.
https://doi.org/10.5465/amj.2012.0585
Gallego-Bono, J. R., & Chaves-Avila, R. (2020). How to boost clusters and regional
change through cooperative social innovation. Economic Research-Ekonomska
Istrazivanja , 33(1), 3108–3124. https://doi.org/10.1080/1331677X.2019.1696694
Geissdoerfer, M., Savaget, P., Bocken, N. M. P., & Hultink, E. J. (2017). The Circular
Economy – A new sustainability paradigm? Journal of Cleaner Production, 143, 757–
768. https://doi.org/10.1016/J.JCLEPRO.2016.12.048

132 REFERENCES
Geng, Y., Fu, J., Sarkis, J., & Xue, B. (2012). Towards a national circular economy
indicator system in China: an evaluation and critical analysis. Journal of Cleaner
Production, 23(1), 216–224. https://doi.org/10.1016/J.JCLEPRO.2011.07.005
Genovese, A., Acquaye, A. A., Figueroa, A., & Koh, S. C. L. (2017). Sustainable supply
chain management and the transition towards a circular economy: Evidence and some
applications. Omega, 66, 344–357. https://doi.org/10.1016/J.OMEGA.2015.05.015
Ghenţa, M., & Matei, A. (2018). Smes and the circular economy: From policy to
difficulties encountered during implementation. Amfiteatru Economic, 20(48), 294–309.
https://doi.org/10.24818/EA/2018/48/294
Ghisellini, P., Cialani, C., & Ulgiati, S. (2016). A review on circular economy: the
expected transition to a balanced interplay of environmental and economic systems.
Journal of Cleaner Production, 114, 11–32.
https://doi.org/10.1016/J.JCLEPRO.2015.09.007
Ginevičius, R., & Podvezko, V. (2008). The problem of compatibility of various multiple
criteria evaluation methods. Business: Theory and Practice, 9(1), 73–80.
https://doi.org/10.3846/1648-0627.2008.9.73-80
Ginevičius, R., & Podvezko, V. (2010). Multicriteria graphical-analytical evaluation of
the financial state of construction enterprises. https://doi.org/10.3846/1392-
8619.2008.14.452-461
Ginevičius, R., Podvezko, V., & Ginevičius, A. (2013). Quantitative evaluation of
enterprise marketing activities. Journal of Business Economics and Management, 14(1),
200–212. https://doi.org/10.3846/16111699.2012.731143
Giuliani, E. (2013). Clusters, networks and firms’ product success: An empirical study.
Management Decision, 51(6), 1135–1160. https://doi.org/10.1108/MD-01-2012-0010
Gloet, M., & Terziovski, M. (2004). Exploring the relationship between knowledge
management practices and innovation performance. Journal of Manufacturing
Technology Management, 15, 402–409. https://doi.org/10.1108/17410380410540390
Gregorio, V. F., Pié, L., & Terceño, A. (2018, November 16). A systematic literature
review of bio, green and circular economy trends in publications in the field of economics
and business management. Sustainability (Switzerland), Vol. 10, p. 4232.
https://doi.org/10.3390/su10114232
Guo, F., Lo, K., & Tong, L. (2016). Eco-efficiency analysis of industrial systems in the
Songhua river basin: A decomposition model approach. Sustainability (Switzerland),
8(12). https://doi.org/10.3390/su8121271
Haas, W., Krausmann, F., Wiedenhofer, D., & Heinz, M. (2015). How circular is the
global economy?: An assessment of material flows, waste production, and recycling in the
European union and the world in 2005. Journal of Industrial Ecology, 19(5), 765–777.
https://doi.org/10.1111/jiec.12244

REFERENCES 133
Haupt, M., Vadenbo, C., & Hellweg, S. (2017). Do We Have the Right Performance
Indicators for the Circular Economy?: Insight into the Swiss Waste Management System.
Journal of Industrial Ecology, 21(3), 615–627. https://doi.org/10.1111/jiec.12506
He, Z. L., & Wong, P. K. (2012). Reaching Out and Reaching Within: A Study of the
Relationship between Innovation Collaboration and Innovation Performance. Industry and
Innovation, 19(7), 539–561. https://doi.org/10.1080/13662716.2012.726804
Heindl, A. B. (2020). Separate frameworks of regional innovation systems for analysis in
China? Conceptual developments based on a qualitative case study in Chongqing.
Geoforum, 115, 34–43. https://doi.org/10.1016/j.geoforum.2020.06.016
Helsley, R. W., & Strange, W. C. (2014). Coagglomeration, clusters, and the scale and
composition of cities. Journal of Political Economy, 122(5), 1064–1093.
https://doi.org/10.1086/676557
Heyes, G., Sharmina, M., Mendoza, J. M. F., Gallego-Schmid, A., & Azapagic, A. (2018).
Developing and implementing circular economy business models in service-oriented
technology companies. Journal of Cleaner Production, 177, 621–632.
https://doi.org/10.1016/j.jclepro.2017.12.168
Hobson, K. (2016). Closing the loop or squaring the circle? Locating generative spaces
for the circular economy. Progress in Human Geography, 40(1), 88–104.
https://doi.org/10.1177/0309132514566342
Hobson, K., Lilley, D., Wilson, G. T., Scott, J. L., Lee, J., & Bridgens, B. (2017). Closing
the Loop on E-waste: A Multidisciplinary Perspective. Journal of Industrial Ecology.
https://doi.org/10.1111/jiec.12645
Hobson, K., & Lynch, N. (2016). Diversifying and de-growing the circular economy:
Radical social transformation in a resource-scarce world. Futures, 82, 15–25.
https://doi.org/10.1016/j.futures.2016.05.012
Hsu, M. S., Lai, Y. L., & Lin, F. J. (2014). The impact of industrial clusters on human
resource and firms performance. Journal of Modelling in Management, 9(2), 141–159.
https://doi.org/10.1108/JM2-11-2012-0038
Huang, B., McDowall, W., Kemp, R., Türkeli, S., Barteková, E., Doménech, T.,
Bleischwitz, R. (2017). Circular Economy Policies in China and Europe. Journal of
Industrial Ecology, 21(3), 651–661. https://doi.org/10.1111/jiec.12597
Humphrey, J., Todeva, E., Armando, E., & Giglio, E. (2019). Global value chains,
business networks, strategy, and international business: Convergences. Revista Brasileira
de Gestao de Negocios, 21(4), 607–627. https://doi.org/10.7819/rbgn.v21i4.4014
Hwang, C.-L., & Yoon, K. (1981). Methods for Multiple Attribute Decision Making.
https://doi.org/10.1007/978-3-642-48318-9_3
Iacovidou, E., Velenturf, A. P. M., & Purnell, P. (2019). Quality of resources: A typology
for supporting transitions towards resource efficiency using the single-use plastic bottle as
an example. Science of the Total Environment, 647, 441–448.
https://doi.org/10.1016/j.scitotenv.2018.07.344

134 REFERENCES
INOLINK | MITA. (n.d.). Retrieved March 9, 2021, from https://mita.lrv.lt/lt/veiklos-
sritys/mita-vykdomi-projektai/inolink/
Isaksen, A. (2015). Industrial development in thin regions: trapped in path extension?
Journal of Economic Geography, 15(3), 585–600. https://doi.org/10.1093/jeg/lbu026
Iuga, A. N. (2016). Waste Management in the Circular Economy. the Case of Romania.
IOP Conference Series: Materials Science and Engineering, 161(1).
https://doi.org/10.1088/1757-899X/161/1/012086
Jiang, B., & Miao, Y. (2015). The Evolution of Natural Cities from the Perspective of
Location-Based Social Media. Professional Geographer, 67(2), 295–306.
https://doi.org/10.1080/00330124.2014.968886
Jiao, W., & Boons, F. (2017). Policy durability of Circular Economy in China: A process
analysis of policy translation. Resources, Conservation and Recycling, 117, 12–24.
https://doi.org/10.1016/J.RESCONREC.2015.10.010
Jin, R., Guo, J., & Li, F. (2019). The development level comprehensive evaluation and the
regional differentiation characteristics analysis of shipbuilding industry agglomeration in
chinese coastal areas. Journal of Coastal Research, 98(sp1), 203–206.
https://doi.org/10.2112/SI98-050.1
Jun, X. (2009). Model of Cluster Green Supply Chain Performance Evaluation Based on
Circular Economy. 2009 Second International Conference on Intelligent Computation
Technology and Automation, 941–944. https://doi.org/10.1109/ICICTA.2009.692
Junnila, S., Ottelin, J., Leinikka, L., Junnila, S., Ottelin, J., & Leinikka, L. (2018).
Influence of Reduced Ownership on the Environmental Benefits of the Circular Economy.
Sustainability, 10(11), 4077. https://doi.org/10.3390/su10114077
Kalmykova, Y., Rosado, L., & Patrício, J. (2016). Resource consumption drivers and
pathways to reduction: economy, policy and lifestyle impact on material flows at the
national and urban scale. Journal of Cleaner Production, 132, 70–80.
https://doi.org/10.1016/j.jclepro.2015.02.027
Karaev, A., Koh, S. C. L., & Szamosi, L. T. (2007). The cluster approach and SME
competitiveness: A review. Journal of Manufacturing Technology Management, 18(7),
818–835. https://doi.org/10.1108/17410380710817273
Kazancoglu, Y., Kazancoglu, I., & Sagnak, M. (2018). A new holistic conceptual
framework for green supply chain management performance assessment based on circular
economy. Journal of Cleaner Production, 195, 1282–1299.
https://doi.org/10.1016/j.jclepro.2018.06.015
Ketels, C. (2013, July). Recent research on competitiveness and clusters: What are the
implications for regional policy? Cambridge Journal of Regions, Economy and Society,
Vol. 6, pp. 269–284. https://doi.org/10.1093/cjres/rst008
KlasterLT - About KlasterLT - KlasterLT. (n.d.). Retrieved November 21, 2018, from
http://klaster.lt/en/about-klasterlt/

REFERENCES 135
Korhonen, J., Honkasalo, A., & Seppälä, J. (2018). Circular Economy: The Concept and
its Limitations. Ecological Economics, 143, 37–46.
https://doi.org/10.1016/J.ECOLECON.2017.06.041
Kuivalainen, O., Sundqvist, S., Saarenketo, S., McNaughton, R. B., D’Angelo, A., Buck,
T., Zucchella, A. (2013). Geographical pathways for SME internationalization: Insights
from an Italian sample. International Marketing Review, 30(2), 80–105.
https://doi.org/10.1108/02651331311314538
Lai, Y.-L., Hsu, M.-S., Lin, F.-J., Chen, Y.-M., & Lin, Y.-H. (2014). The effects of
industry cluster knowledge management on innovation performance. Journal of Business
Research, 67(5), 734–739. https://doi.org/10.1016/j.jbusres.2013.11.036
Leather, J. (2008). Ex-Post Evaluation of the Activities Carried Out By Dg Enterprise and
Industry Under the Sixth Framework Programme for Research , Technological
Development and Demonstration Activities Innovation and Space Research Activities Dg
Enterprise and Industry Eu. 44(November).
Lee, C.-S., Martin, D., Hsieh, P.-F., & Yu, W.-C. (2020). Principles of value creation in
event tourism: Enhancing the competitiveness of regional clusters. Journal of Global
Scholars of Marketing Science, 30(4), 437–453.
https://doi.org/10.1080/21639159.2020.1784771
Lewandowski, M., Lewandowski, & Mateusz. (2016). Designing the Business Models for
Circular Economy—Towards the Conceptual Framework. Sustainability, 8(1), 43.
https://doi.org/10.3390/su8010043
Li, R. H., & Su, C. H. (2012). Evaluation of the circular economy development level of
Chinese chemical enterprises. Procedia Environmental Sciences, 13, 1595–1601.
https://doi.org/10.1016/j.proenv.2012.01.151
Li, W., Veliyath, R., & Tan, J. (2013). Network Characteristics and Firm Performance:
An Examination of the Relationships in the Context of a Cluster. Journal of Small Business
Management, 51(1), 1–22. https://doi.org/10.1111/j.1540-627X.2012.00375.x
Libby, R., & Blashfield, R. K. (1978). Performance of a composite as a function of the
number of judges. Organizational Behavior and Human Performance, 21(2), 121–129.
https://doi.org/10.1016/0030-5073(78)90044-2
Lietuvos klasterių plėtros koncepcija. (2017). Retrieved from http://www.lca.lt/wp-
content/uploads/2017/10/ŪM-2017-10-12-įsakymas-Nr.-4-601-Dėl-Lietuvos-klasterių-
koncepcijos-pakeitimo.pdf
Lietuvos klasterizacijos studija. (2017).
Liu, W., Zhan, J., Li, Z., Jia, S., Zhang, F., & Li, Y. (2018). Eco-efficiency evaluation of
regional circular economy: A case study in Zengcheng, Guangzhou. Sustainability
(Switzerland), 10(2). https://doi.org/10.3390/su10020453
Liu, Y., & Bai, Y. (2014). An exploration of firms’ awareness and behavior of developing
circular economy: An empirical research in China. Resources, Conservation and
Recycling, 87, 145–152. https://doi.org/10.1016/j.resconrec.2014.04.002

136 REFERENCES
Longoni, A., & Cagliano, R. (2015). Environmental and social sustainability prioritiesn:
Their integration in operations strategies. International Journal of Operations and
Production Management, 35(2), 216–345. https://doi.org/10.1108/IJOPM-04-2013-0182
Lorenzen, M., & Mudambi, R. (2013). Clusters, connectivity and catch-up: Bollywood
and bangalore in the global economy. Journal of Economic Geography, 13(3), 501–534.
https://doi.org/10.1093/jeg/lbs017
Lozano, F. J., Lozano, R., Freire, P., Jiménez-Gonzalez, C., Sakao, T., Ortiz, M. G.,
Viveros, T. (2018). New perspectives for green and sustainable chemistry and
engineering: Approaches from sustainable resource and energy use, management, and
transformation. Journal of Cleaner Production, 172, 227–232.
https://doi.org/10.1016/J.JCLEPRO.2017.10.145
Malczewski, J. (1997). Propagation of Errors in Multicriteria Location Analysis: A Case
Study. https://doi.org/10.1007/978-3-642-59132-7_17
Markusen, A. (1996). Sticky places in slippery space: A typology of industrial districts.
Economic Geography, 72(3), 293–313. https://doi.org/10.2307/144402
Marshall, A. (1920). Principles of Economics (8th ed.). London: Macmillan and Co.
Martin, P., Mayneris, F., Martin, P., Mayer, T., & Mayneris, F. (2008). Are clusters more
resilient in crises? Evidence from French exporters in 2008-2009 Are clusters more
resilient in crises? Evidence from French. Retrieved from
https://sites.google.com/site/ffeconference/home
Martin, R., & Sunley, P. (2003). Deconstructing clusters: Chaotic concept or policy
panacea? Journal of Economic Geography, 3(1), 5–35. https://doi.org/10.1093/jeg/3.1.5
Maskell, P. (2014). Accessing remote knowledge-the roles of trade fairs, pipelines,
crowdsourcing and listening posts. Journal of Economic Geography, 14(5), 883–902.
https://doi.org/10.1093/jeg/lbu002
McCann, B. T., & Folta, T. B. (2008, June 7). Location matters: Where we have been and
where we might go in agglomeration research. Journal of Management, Vol. 34, pp. 532–
565. https://doi.org/10.1177/0149206308316057
Melnyk, M., Korcelli-Olejniczak, E., Chorna, N., & Popadynets, N. (2018). Development
of regional IT clusters in Ukraine: institutional and investment dimensions. Economic
Annals, 173(9–10), 19–25. https://doi.org/10.21003/ea.V173-03
Mendoza, J. M. F., Sharmina, M., Gallego-Schmid, A., Heyes, G., & Azapagic, A. (2017).
Integrating Backcasting and Eco-Design for the Circular Economy: The BECE
Framework. Journal of Industrial Ecology, 21(3), 526–544.
https://doi.org/10.1111/jiec.12590
Merli, R., Preziosi, M., & Acampora, A. (2018, March 20). How do scholars approach the
circular economy? A systematic literature review. Journal of Cleaner Production, Vol.
178, pp. 703–722. https://doi.org/10.1016/j.jclepro.2017.12.112

REFERENCES 137
Mesa, J., Esparragoza, I., & Maury, H. (2018). Developing a set of sustainability indicators
for product families based on the circular economy model. Journal of Cleaner Production,
196, 1429–1442. https://doi.org/10.1016/j.jclepro.2018.06.131
Michelini, G., Moraes, R. N., Cunha, R. N., Costa, J. M. H., & Ometto, A. R. (2017). From
Linear to Circular Economy: PSS Conducting the Transition. Procedia CIRP, 64, 2–6.
https://doi.org/10.1016/j.procir.2017.03.012
Milios, L. (2017). Advancing to a Circular Economy: three essential ingredients for a
comprehensive policy mix. Sustainability Science, 2018(13), 861–878.
https://doi.org/10.1007/s11625-017-0502-9
Mogos, S., Davis, A., & Baptista, R. (2020). High and sustainable growth: persistence,
volatility, and survival of high growth firms. Eurasian Business Review, 1–27.
https://doi.org/10.1007/s40821-020-00161-x
Moreau, V., Sahakian, M., van Griethuysen, P., & Vuille, F. (2017). Coming Full Circle:
Why Social and Institutional Dimensions Matter for the Circular Economy. Journal of
Industrial Ecology, 21(3), 497–506. https://doi.org/10.1111/jiec.12598
Morrison, A., Rabellotti, R., & Zirulia, L. (2013). When Do Global Pipelines Enhance the
Diffusion of Knowledge in Clusters? Economic Geography, 89(1), 77–96.
https://doi.org/10.1111/j.1944-8287.2012.01167.x
Muller, M. H., & Fairlie‐Clarke, A. C. (2001). Using the AHP to determine the correlation
of product issues to profit. European Journal of Marketing, 35(7/8), 843–858.
https://doi.org/10.1108/03090560110396269
Muranko, Z., Andrews, D., Chaer, I., Newton, E. J., Proudman, P., & Longhurst, M.
(2017). Pro-circular behaviours and refrigerated display cabinets: Supporting resource
efficiency in the retail refrigeration sector. Energy Procedia, 123, 70–75.
https://doi.org/10.1016/j.egypro.2017.07.235
Murray, A., Skene, K., & Haynes, K. (2017). The Circular Economy: An Interdisciplinary
Exploration of the Concept and Application in a Global Context. Journal of Business
Ethics, 140(3), 369–380. https://doi.org/10.1007/s10551-015-2693-2
Nakamura, S., & Kondo, Y. (2018). Toward an integrated model of the circular economy:
Dynamic waste input–output. Resources, Conservation and Recycling, 139, 326–332.
https://doi.org/10.1016/j.resconrec.2018.07.016
Nathan, M., & Overman, H. (2013). Agglomeration, clusters, and industrial policy. Oxford
Review of Economic Policy, 29(2), 383–404. https://doi.org/10.1093/oxrep/grt019
Niero, M., Hauschild, M. Z., Hoffmeyer, S. B., & Olsen, S. I. (2017). Combining Eco-
Efficiency and Eco-Effectiveness for Continuous Loop Beverage Packaging Systems:
Lessons from the Carlsberg Circular Community. Journal of Industrial Ecology, 21(3),
742–753. https://doi.org/10.1111/jiec.12554
Niero, M., & Kalbar, P. P. (2019). Coupling material circularity indicators and life cycle
based indicators: A proposal to advance the assessment of circular economy strategies at

138 REFERENCES
the product level. Resources, Conservation and Recycling, 140, 305–312.
https://doi.org/10.1016/J.RESCONREC.2018.10.002
Niero, M., & Olsen, S. I. (2016). Circular economy: To be or not to be in a closed product
loop? A Life Cycle Assessment of aluminium cans with inclusion of alloying elements.
Resources, Conservation and Recycling, 114, 18–31.
https://doi.org/10.1016/j.resconrec.2016.06.023
Niu, K. H. (2010). Organizational trust and knowledge obtaining in industrial clusters.
Journal of Knowledge Management, 14(1), 141–155.
https://doi.org/10.1108/13673271011015624
Novikov, I. (2019). Regional Aspects of the Development of Clustering in the Dairy
Branch. Comparative Economic Research, 22(4), 91–109. https://doi.org/10.2478/cer-
2019-0034
Novotná, J., & Novotný, L. (2019). Industrial clusters in a post-socialist country: The case
of the wine industry in Slovakia. Moravian Geographical Reports, 27(2), 62–78.
https://doi.org/10.2478/mgr-2019-0006
Nußholz, J. L. K. (2017). Circular business models: Defining a concept and framing an
emerging research field. Sustainability (Switzerland), 9(10), 14–17.
https://doi.org/10.3390/su9101810
NUTS- Nomenclature of Territorial Units for Statistics- (Background) Eurostat. (n.d.).
Retrieved December 20, 2018, from https://ec.europa.eu/eurostat/web/nuts/background
Overview - Eurostat. (n.d.). Retrieved November 29, 2019, from
https://ec.europa.eu/eurostat/web/circular-economy/overview
Pan, Y., & Li, H. (2016). Sustainability evaluation of end-of-life vehicle recycling based
on emergy analysis: A case study of an end-of-life vehicle recycling enterprise in China.
Journal of Cleaner Production, 131, 219–227.
https://doi.org/10.1016/j.jclepro.2016.05.045
Park, J., Sarkis, J., & Wu, Z. (2010). Creating integrated business and environmental value
within the context of China’s circular economy and ecological modernization. Journal of
Cleaner Production, 18(15), 1494–1501.
https://doi.org/10.1016/J.JCLEPRO.2010.06.001
Pfeffer, J. (1995). Producing sustainable competitive advantage through the effective
management of people. The Academy of Management Executive, 9(1), 55–72.
https://doi.org/10.5465/AME.1995.9503133495
Podvezko, V. (2007). Determining the level of agreement of expert estimates.
International Journal of Management and Decision Making, 8(5/6), 586–600. Retrieved
from https://ideas.repec.org/a/ids/ijmdma/v8y2007i5-6p586-600.html
Pohekar, S. D., Ramachandran, M., Pohekar, S. D., & Ramachandran, M. (2004).
Application of multi-criteria decision making to sustainable energy planning--A review.
Renewable and Sustainable Energy Reviews, 8(4), 365–381. Retrieved from
https://econpapers.repec.org/RePEc:eee:rensus:v:8:y:2004:i:4:p:365-381

REFERENCES 139
Popa, V. N., & Popa, L. I. (2016). Green Acquisitions and Lifecycle Management of
Industrial Products in the Circular Economy. IOP Conference Series: Materials Science
and Engineering, 161(1). https://doi.org/10.1088/1757-899X/161/1/012112
Porter, M. E. (1990). The Competitive Advantage of Nations Harvard Business Review.
Porter, M. E. (1998). Clusters and the New Economics of Competition. Harvard Business
Review, (November-December). Retrieved from https://hbr.org/1998/11/clusters-and-the-
new-economics-of-competition
Porter, M. E. (2003). The economic performance of regions. Regional Studies, 37(6–7),
545–546. https://doi.org/10.1080/0034340032000108688
Prieto-Sandoval, V., Ormazabal, M., Jaca, C., & Viles, E. (2018). Key elements in
assessing circular economy implementation in small and medium-sized enterprises.
Business Strategy and the Environment, 27(8), 1525–1534.
https://doi.org/10.1002/bse.2210
Reuter, M. A. (2016). Digitalizing the Circular Economy. Metallurgical and Materials
Transactions B, 47(6), 3194–3220. https://doi.org/10.1007/s11663-016-0735-5
Rivera, X. C. S. (2018). The Role of Life Cycle Sustainability Assessment in the
Implementation of Circular Economy Principles in Organizations. Procedia CIRP, 69,
793–798. https://doi.org/10.1016/J.PROCIR.2017.11.022
Roszkowska, E. (2011). Multi-criteria decision making models by applying the TOPSIS
method to crisp and interval data. Multiple Criteria Decision Making, (Mcdm).
Salvador, E., Mariotti, I., & Conicella, F. (2013). Science park or innovation cluster?
International Journal of Entrepreneurial Behaviour and Research, 19, 656–674.
https://doi.org/10.1108/IJEBR-10-2012-0108
Schmitt, A., & Van Biesebroeck, J. (2013). Proximity strategies in outsourcing relations:
The role of geographical, cultural and relational proximity in the European automotive
industry. Journal of International Business Studies, 44(5), 475–503.
https://doi.org/10.1057/jibs.2013.10
Schot, J., & Steinmueller, W. E. (2018). Three frames for innovation policy: R&D,
systems of innovation and transformative change. Research Policy, 47(9), 1554–1567.
https://doi.org/10.1016/j.respol.2018.08.011
Shahbazi, S., Wiktorsson, M., Kurdve, M., Jönsson, C., & Bjelkemyr, M. (2016). Material
efficiency in manufacturing: swedish evidence on potential, barriers and strategies.
Journal of Cleaner Production, 127, 438–450.
https://doi.org/10.1016/J.JCLEPRO.2016.03.143
Shi, H., Chertow, M., & Song, Y. (2010). Developing country experience with eco-
industrial parks: a case study of the Tianjin Economic-Technological Development Area
in China. Journal of Cleaner Production, 18(3), 191–199.
https://doi.org/10.1016/J.JCLEPRO.2009.10.002
Smith, A., Pickles, J., Buček, M., Pástor, R., & Begg, B. (2014). The political economy of
global production networks: Regional industrial change and differential upgrading in the

140 REFERENCES
East European clothing industry. Journal of Economic Geography, 14(6), 1023–1051.
https://doi.org/10.1093/jeg/lbt039
Smol, M., Kulczycka, J., & Avdiushchenko, A. (2017). Circular economy indicators in
relation to eco-innovation in European regions. Clean Technologies and Environmental
Policy, Vol. 19, pp. 669–678. https://doi.org/10.1007/s10098-016-1323-8
Solleiro, J. L., & Castañón, R. (2005). Competitiveness and innovation systems: The
challenges for Mexico’s insertion in the global context. Technovation, 25(9), 1059–1070.
https://doi.org/10.1016/j.technovation.2004.02.005
Stanko, M. A., & Olleros, X. (2013). Industry growth and the knowledge spillover regime:
Does outsourcing harm innovativeness but help profit? Journal of Business Research,
66(10), 2007–2016. https://doi.org/10.1016/j.jbusres.2013.02.026
Stewart, R., Niero, M., Murdock, K., & Olsen, S. I. (2018). Exploring the Implementation
of a Circular Economy Strategy: The Case of a Closed-loop Supply of Aluminum
Beverage Cans. Procedia CIRP, 69, 810–815.
https://doi.org/10.1016/j.procir.2017.11.006
Tan, J., Shao, Y., & Li, W. (2013). To be different, or to be the same? An exploratory
study of isomorphism in the cluster. Journal of Business Venturing, 28(1), 83–97.
https://doi.org/10.1016/j.jbusvent.2012.02.003
Tanner, A. N. (2014). Regional Branching Reconsidered: Emergence of the Fuel Cell
Industry in European Regions. Economic Geography, 90(4), 403–427.
https://doi.org/10.1111/ecge.12055
Tavassoli, S., & Carbonara, N. (2014). The role of knowledge variety and intensity for
regional innovation. Small Business Economics, 43(2), 493–509.
https://doi.org/10.1007/s11187-014-9547-7
Tessitore, S., Daddi, T., & Frey, M. (2012). Eco-innovation and competitiveness in
industrial clusters. International Journal of Technology Management, 58(1/2), 49.
https://doi.org/10.1504/IJTM.2012.045788
homson Reuters. (2018). Web of Science [v.5.28] - Web of Science core collection result
analysis. Retrieved March 27, 2019, from Web of Science website:
https://wcs.webofknowledge.com/RA/analyze.do?product=WOS&SID=D3wOy3Atek3n
fuLcVLb&field=TASCA_JCRCategories_JCRCategories_en&yearSort=false
Tokatli, N. (2013). Toward a better understanding of the apparel industry: A critique of
the upgrading literature. Journal of Economic Geography, 13(6), 993–1011.
https://doi.org/10.1093/jeg/lbs043
Vaiginienė, E. Lietuvos klasterizacijos studija 2019 (2019).
Van der Voet, E., Van Oers, L., Verboon, M., & Kuipers, K. (2018). Environmental
Implications of Future Demand Scenarios for Metals: Methodology and Application to the
Case of Seven Major Metals. Journal of Industrial Ecology.
https://doi.org/10.1111/jiec.12722

REFERENCES 141
Van Ewijk, S., Stegemann, J. A., & Ekins, P. (2018). Global life cycle paper flows,
recycling metrics, and material efficiency. Journal of Industrial Ecology, 22(4), 686–693.
https://doi.org/10.1111/jiec.12613
Vanegas, P., Peeters, J. R., Cattrysse, D., Tecchio, P., Ardente, F., Mathieux, F., Duflou,
J. R. (2018). Ease of disassembly of products to support circular economy strategies.
Resources, Conservation and Recycling, 135, 323–334.
https://doi.org/10.1016/j.resconrec.2017.06.022
Velenturf, A. P. M., Purnell, P., Tregent, M., Ferguson, J., & Holmes, A. (2018). Co-
producing a vision and approach for the transition towards a circular economy:
Perspectives from government partners. Sustainability (Switzerland), 10(5).
https://doi.org/10.3390/su10051401
Vinogradova, I., Podvezko, V., & Zavadskas, E. K. (2018). The recalculation of the
weights of criteria in MCDM methods using the Bayes approach. Symmetry, 10(6), 1–18.
https://doi.org/10.3390/sym10060205
Von Der Leyen, U. (n.d.). A Union that strives for more My agenda for Europe.
Walker, S., Coleman, N., Hodgson, P., Collins, N., & Brimacombe, L. (2018). Evaluating
the environmental dimension of material efficiency strategies relating to the circular
economy. Sustainability (Switzerland), 10(3), 1–14. https://doi.org/10.3390/su10030666
Wang, C. C., & Lin, G. C. S. (2013). Dynamics of innovation in a globalizing china:
regional environment, inter-firm relations and firm attributes. Journal of Economic
Geography, 13(3), 397–418. https://doi.org/10.1093/jeg/lbs019
Wang, H., Qiu, F., & Swallow, B. (2014). Can community gardens and farmers’ markets
relieve food desert problems? A study of Edmonton, Canada. Applied Geography, 55,
127–137. https://doi.org/10.1016/j.apgeog.2014.09.010
Wen, Z., & Meng, X. (2015). Quantitative assessment of industrial symbiosis for the
promotion of circular economy: A case study of the printed circuit boards industry in
China’s Suzhou New District. Journal of Cleaner Production, 90, 211–219.
https://doi.org/10.1016/j.jclepro.2014.03.041
Wilts, H., von Gries, N., & Bahn-Walkowiak, B. (2016). From waste management to
resource efficiency-the need for policy mixes. Sustainability (Switzerland), 8(7), 1–16.
https://doi.org/10.3390/su8070622
Winans, K., Kendall, A., & Deng, H. (2017). The history and current applications of the
circular economy concept. Renewable and Sustainable Energy Reviews, 68, 825–833.
https://doi.org/10.1016/J.RSER.2016.09.123
Witjes, S., & Lozano, R. (2016). Towards a more Circular Economy: Proposing a
framework linking sustainable public procurement and sustainable business models.
Resources, Conservation and Recycling, 112, 37–44.
https://doi.org/10.1016/J.RESCONREC.2016.04.015
Wuttke, J., Rotter, V. S., Chi, N. K., Asari, M., Sakai, S., Yanagawa, R., Yano, J. (2017).
Waste prevention for sustainable resource and waste management. Journal of Material
142 REFERENCES
Cycles and Waste Management, 19(4), 1295–1313. https://doi.org/10.1007/s10163-017-
0586-4
Xiang, X., & Huang, W. C. (2019). Does distance affect the role of nonlocal subsidiaries
on cluster firms’ innovation? An empirical investigation on Chinese biotechnology cluster
firms. Sustainability (Switzerland), 11(23). https://doi.org/10.3390/su11236725
Yu, F., Han, F., & Cui, Z. (2015). Assessment of life cycle environmental benefits of an
industrial symbiosis cluster in China. Environmental Science and Pollution Research,
22(7), 5511–5518. https://doi.org/10.1007/s11356-014-3712-z
Zardini, A., Ricciardi, F., Bullini Orlandi, L., & Rossignoli, C. (2020). Business networks
as breeding grounds for entrepreneurial options: organizational implications. Review of
Managerial Science, 14(5), 1029–1046. https://doi.org/10.1007/s11846-018-0317-9
Zavadskas, E. K., Turskis, Z., & Kildiene, S. (2014, March 26). State of art surveys of
overviews on MCDM/MADM methods. Technological and Economic Development of
Economy, Vol. 20, pp. 165–179. https://doi.org/10.3846/20294913.2014.892037
Zelbst, P. J., Frazier, G. V., & Sower, V. E. (2010). A cluster concentration typology for
making location decisions. Industrial Management and Data Systems, 110(6), 883–907.
https://doi.org/10.1108/02635571011055108
Zhang, A., & Huang, G. Q. (2012). Impacts of business environment changes on global
manufacturing outsourcing in China. Supply Chain Management: An International
Journal, 17(2), 138–151. https://doi.org/10.1108/13598541211212889
Zhang, J., Wang, N., & Hong, J. (2013). Comprehensive Evaluation on the Development
of Industry Cluster Circular Economy. Advanced Materials Research, 779–780, 1777–
1780. https://doi.org/10.4028/www.scientific.net/AMR.779-780.1777
Zheng, J. (2011). ‘Creative Industry Clusters’ and the ‘Entrepreneurial City’ of Shanghai.
Urban Studies, 48(16), 3561–3582. https://doi.org/10.1177/0042098011399593
Zhu, Q., Geng, Y., & Lai, K. hung. (2010). Circular economy practices among Chinese
manufacturers varying in environmental-oriented supply chain cooperation and the
performance implications. Journal of Environmental Management, 91(6), 1324–1331.
https://doi.org/10.1016/j.jenvman.2010.02.013
Zhu, Q., Geng, Y., Sarkis, J., & Lai, K.-H. (2015). Barriers to Promoting Eco-Industrial
Parks Development in China. Journal of Industrial Ecology, 19(3), 457–467.
https://doi.org/10.1111/jiec.12176
Zhu, S., He, C., & Liu, Y. (2014). Going green or going away: Environmental regulation,
economic geography and firms’ strategies in China’s pollution-intensive industries.
Geoforum, 55, 53–65. https://doi.org/10.1016/j.geoforum.2014.05.004
Zwirner, O., Iacovidou, E., Velis, C. A., Millward-Hopkins, J., Hahladakis, J. N., Purnell,
P., Busch, J. (2017). A pathway to circular economy: Developing a conceptual framework
for complex value assessment of resources recovered from waste. Journal of Cleaner
Production, 168, 1279–1288. https://doi.org/10.1016/j.jclepro.2017.09.002

143
List of Scientific Publications by the
Author on the Topic of the Dissertation
Papers in the Reviewed Scientific Journals
Razminienė K. (2019a) Circular economy in clusters’ performance evaluation. Equilib-
rium. Quarterly journal of economics and economic policy, 14 (3), 537–559.
https://doi.org/10.24136/eq.2019.026
Razminienė K., &. Tvaronavičienė M. (2017b). Economic globalization and its impacts
on clustering. Terra economicus, 15(2), 109–121. https://doi.org/10.23683/2073-6606-
2017-15-2-109-121
Razminienė K., & Tvaronavičienė M. (2018a). Detecting the linkages between clusters
and circular economy. Terra economicus, 16(4), 50–65. https://doi.org/10.23683/2073-
6606-2018-16-4-50-65
Razminienė K., Tvaronavičienė M., & Zemlickienė V. (2016). Evaluation of cluster effi-
ciency measurement tool. Terra economicus, 14(3), 101–111.
https://doi.org/10.18522/2073-6606-2016-14-3-101-111
Tvaronavičienė M., & Razminienė K. (2017). Towards competitive regional development
through clusters: approaches to their performance evaluation. Journal of competitiveness,
9(4), 133–147. https://doi.org/10.7441/joc.2017.04.09

144 LIST OF SCIENTIFIC PUBLICATIONS BY THE AUTHOR ON THE TOPIC OF THE …
Papers in Other Editions
Razminienė, K. (2019). Importance of clusters’ performance evaluation with regard to the
circular economics. Proceedings of the 10th International Conference on Applied
Economics Contemporary Issues in Economy: Economic, 321–330.
Razminienė, K., & Tvaronavičienė, M. (2017). Clusters’ Role in Globalization. Contem-
porary Issues in Business, Management and Education’2017, 206–213.
https://doi.org/10.3846/cbme.2017.028
Razminienė, K., & Tvaronavičienė, M. (2018). Towards clusters’ performance evaluation:
the system of indicators. 10th International Scientific Conference “Business and Manage-
ment 2018,” 45–56. https://doi.org/10.3846/bm.2018.06
Tvaronavičienė, M., & Razminienė, K. (2017). Knowledge transfer through clusters. 3rd
International Conference on Lifelong Education and Leadership for All, ICLEL 2017,
1019–1029
Tvaronavičienė, M., & Razminienė, K. (2017). Towards sustainable regional development
through clusters: approaches of their performance evaluation. Sixth International Confer-
ence on Management, Engineering, Science & Technology 2017 (ICMEST 2017), Third
International Research Conference on Science, Technology and Management 2017
(IRCSTM 2017), 5–13. Dubai, UAE

145
Summary in Lithuanian
Įvadas Problemos formulavimas
Lietuvoje atkreiptas dėmesys į klasterių svarbą siekiant mažų ir vidutinių įmonių
konkurencingumo skatinimo. Lietuvos klasterių tinklas susiduria su problemomis ir yra
skatinamas prioritetinėmis laikyti tas pačias sritis kaip ir ES: skaitmenizaciją, žaliąją
gamybą, ES pridėtinės vertės kūrimo grandines (Von Der Leyen, n.d.). Klasterius
vienijantis MITA įgyvendinamas projektas “Inovacijų tinklaveiklos skatinimas ir plėtra
(InoLink)” pradėtas 2016 metais ir pratęstas iki 2022 metų (“INOLINK | MITA,” n.d.).
Bendras projekto biudžetas (2,4 mln. Eur) skirtas klasterių įkūrimo, brandinimo,
finansavimo, partnerių paieškos ir kitų klausimų sprendimui.
Eurostat (2019) duomenimis, Europos sąjungos (27 šalių) žiediškumas 2019 metais
tesiekė 11,9 procento. Rodiklis vis dar žemas, tačiau pastebimas jo augimas 0,8
procentiniais punktais nuo 2014 metų ES vidurkio. Tuo tarpu Lietuvoje žiediškumas 2019
metais siekė vos 4 procentus ir nuo 2016 metų sumažėjo 0,6 procentiniais punktais.
Siekdama tvarios ES ekonomikos, Europos komisija pasiūlė Europos žaliąjį kursą (“A
European Green Deal | European Commission,” n.d.) su veiksmų planu, kuriuo siekiama
skatinti veiksmingą išteklių naudojimą ir sumažinti taršą.
Darbo aktualumas
Poreikis vertinti klasterius yra jaučiamas nacionaliniu lygmeniu. Siekiama nustatyti jų
silpnąsias, stipriąsias puses ir jas įvardinus gerinti klasterių veiklos rezultatus. Klasteriai

146 SUMMARY IN LITHUANIAN
gali prisidėti skatinant įmones pereiti prie žiedinės ekonomikos, nes paprastai mažos ir
vidutinės įmonės neturi galimybių taikyti novatoriškus sprendimus vien savo lėšomis.
Klasterių veiklos vertinimo modelis, kuris leistų stebėti kaip klasteriai prisideda pereinant
prie žiedinės ekonomikos, padės įvertinti klasterius. Perėjimas prie žiedinės ekonomikos
gali būti vertinamas kaip konkurencinis pranašumas klasteriui priklausančioms įmonėms.
Klasteriai ir klasterių organizacijos yra įvardinamos kaip galimi veiksniai, skatinantys
mažų ir vidutinių įmonių įsitraukimą į žiedinės ekonomikos veiklas. Mažos ir vidutinės
įmonės vis dažniau pastebi efektyvaus išteklių valdymo svarbą ir pradeda ieškoti žiedinės
ekonomikos verslo modelių padedančių gauti naudos iš atliekų. Klasteriai ir klasterių
organizacijos gali padėti mažoms ir vidutinėms įmonėms efektyviau valdyti išteklius.
Nustatyta, kad parengtas klasterių veiklos vertinimo modelis, kuris apima perėjimą prie
žiedinės ekonomikos parodančius rodiklius, gali būti naudingas siekiant klasterio narių
plėtros.
Tyrimo objektas
Disertacinio tyrimo objektas yra klasterių veikla pereinant prie žiedinės ekonomikos.
Darbo tikslas
Disertacijos tikslas yra sukurti klasterių veiklos vertinimo pereinant prie žiedinės
ekonomikos modelį.
Darbo uždaviniai
Darbo tikslui pasiekti buvo sprendžiami šie uždaviniai:
1. Atlikus mokslinės literatūros analizę, susisteminti klasterių ir ŽE koncepcijas.
2. Remiantis literatūros analize nustatyti klasterių veiklą nusakančius rodiklius
ir sudaryti vertinimui tinkamą sistemą.
3. Sudaryti tarptautiniu mastu naudojamus rodiklius apimančią perėjimo prie
ŽE vertinimo sistemą.
4. Suformuluoti vertinimo metodologiją, tinkančią klasterių veiklos pereinant
prie ŽE vertinimui.
5. Patikrinti pasiūlyto klasterių veiklos vertinimo pereinant prie ŽE modelio
pritaikomumą Lietuvoje skirtinguose sektoriuose veikiančiuose klasteriuose.
6. Pasiūlyti klasterių veiklą pereinant prie ŽE nusakančių rodiklių duomenų
bazės koncepciją.
Tyrimų metodika
Darbe taikomi teoriniai analizės bei sintezės metodai, leidžiantys pasirinkti iškeltų
uždavinių sprendimo paieškos strategiją ir atskleisti skirtingų mokslininkų požiūrį į
klasterių veiklos vertinimo pereinant prie ŽE problemas. Sisteminė mokslinės literatūros
analizė atlikta siekiant suformuoti klasterių veiklos pereinant prie ŽE vertinimo rodiklių

SUMMARY IN LITHUANIAN 147
sistemą, tinkamą daugiakriterinių metodų taikymui. Atvejų analizė pritaikyta
pasirinktiems klasteriams, siekiant juos apžvelgti. Dalis duomenų dėl ribotos prieigos
gauti atlikus interviu ir pateikus klausimynus klasterių koordinatoriams, kiti surinkti per
paiešką duomenų bazėse. Atrinkti rodikliai pateikti klasterių ir ŽE ekspertams, aliktas
ekspertinis vertinimas. Nustatytos rodiklių reikšmės, normalizuoti duomenys, taikyti
SAW ir TOPSIS daugiakriterinio vertinimo metodai. Tiesinė regresinė analizė atlikta
siekiant patikrinti ar egzistuoja ryšys tarp klasterių veiklos ir perėjimo prie ŽE.
Darbo mokslinis naujumas
1. Patikslinta klasterio koncepcija, kurioje teigiama, kad klasterį sudaro per
vertikalius (tiekimo grandinės) ir horizontalius (papildantys produktai ir
paslaugos, panašių specializuotų įvesčių, technologijų ar institucijų
naudojimas ir kitos sąsajos) ryšius viena kitą galinčios papildyti įmonės ir
susijusios institucijos besinaudojančios geografiniu artumu ir
bendradarbiavimu konkurencinio pranašumo įgyjimui.
2. Siūlomos dvi naujos rodiklių sistemos, reikalingos klasterių veiklos pereinant
prie ŽE stebėjimui. Rodikliai parinkti atsižvelgiant į įvairius klasterio veiklos
komponentus: tarpusavio komunikaciją, finansinius išteklius, žmogiškuosius
išteklius, marketingo veiklas ir kriterijų rinkinį, rodantį perėjimą prie ŽE.
Šios dvi sistemos gali būti naudojamos atskirai, kai siekiama stebėti klasterio
veiklą arba klasterio perėjimą prie ŽE. Jos leidžia rinkti duomenis, lyginti
juos pasirinktu laikotarpiu ir peržiūrėti.
3. Pasiūlytas klasterių veiklos vertinimo pereinant prie ŽE modelis yra
išbandytas pasirinktuose Lietuvos klasteriuose. Šiame modelyje sujungiamos
dvi rodiklių sistemos, pritaikomi daugiakriteriniai sprendimų priėmimo
metodai ir tiesinė regresinė analizė, kurie leidžia įvertinti klasterių veiklą
pereinant prie ŽE. Modelyje naudojami universalūs rodikliai ir jis gali būti
pritaikomas kitose šalyse. Gauti rezultatai rodo, kad klasteriai gali būti
vertinami kaip perėjimo prie ŽE skatintojai.
Darbo rezultatų praktinė reikšmė
Klasterių vadovai ir koordinatoriai tolesniam klasterių vystymui gali naudoti dvi naujas
rodiklių sistemas, kai siekiama stebėti klasterių veiklą pereinant prie ŽE.
Modelis, leidžiantis įvertinti klasterių veiklą atsižvelgiant į tai, kaip klasteriai
prisideda pereinant prie ŽE yra svarbi priemonė, kuri leis valdžios institucijoms miesto,
regioniniu, nacionaliniu ir Europos lygmeniu priimti sprendimus dėl paramos inicijavimo
tolesniam esamų klasterių vystymui.
Ginamieji teiginiai
1. Klasterių veiklos vertinimui siūloma naudoti pateiktą rodiklių sistemą
(apimančią šiuos komponentus: tarpusavio komunikacija, marketingo
veiklos, žmogiškieji ištekliai, finansiniai ištekliai).

148 SUMMARY IN LITHUANIAN
2. Siūloma rodiklių sistema, skirta klasterių perėjimui prie ŽE vertinimui
(apimanti komunalinių ir kitų atliekų susidarymą ir prekybą perdirbamomis
ar tinkamomis pakartotiniam naudojimui žaliavomis jas importuojant,
eksportuojant ar vykstant prekybai tarp klasterio narių).
3. Siūlomas klasterių veiklos vertinimo pereinant prie ŽE modelis, pagrįstas
SAW ir TOPSIS metodais ir vertinantis tarpusavio ryšį, gali būti naudojamas
klasteriams įgyvendinant perėjimą prie žiedinės ekonomikos.
Darbo rezultatų aprobavimas
Disertacijos tema publikuota dešimt mokslinių straipsnių: penki Web of Science (Claritive
Analytics) duomenų bazėse referuojamuose leidiniuose, neturinčiuose citavimo rodiklio
(Razminienė, 2019a; Razminienė & Tvaronavičienė, 2017b, 2018a; Razminienė et al.,
2016; Tvaronavičienė & Razminienė, 2017), penki – recenzuojamose tarptautinių
konferencijų medžiagose (Razminienė, 2019b; Razminienė & Tvaronavičienė, 2017a,
2018b; Tvaronavičienė & Razminienė, 2017a, 2017b).
Disertacijoje atliktų tyrimų rezultatai buvo paskelbti septyniose mokslinėse
konferencijose Lietuvoje ir užsienyje:
− 10-ojoje tarptautinėje taikomosios ekonomikos konferencijoje “Contemporary
issues in economy”, Torūnė, Lenkija, Birželio 27–28 d. 2019.
− 6-ojoje tarptautinėje mokslinėje konferencijoje “Contemporary issues in busi-
ness, management and economics engineering” (CIBMEE-2019), Vilnius,
Gegužės 9–10 d. 2019.
− 10-ojoje tarptautinėje mokslinėje konferencijoje “Business and Management
2018”, May 3–4, 2018, Vilnius.
− 6-ojoje tarptautinėje vadybos, inžinerijos, mokslo ir technologijų konferencijoje
ir 3-ojoje tarptautinėje mokslo, technologijų ir vadybos tyrimų konferencijoje
2017, Dubajus, Jungtiniai Arabų Emyratai, Lapkričio 1–2d., 2017.
− 3-ojoje tarptautinėje visą gyvenimą trunkančio švietimo ir lyderystės konferenci-
joje ICLEL 2017, Porto, Portugalija, Rugsėjo 12–14d., 2017.
− 5-ojoje tarptautinėje mokslinėje konferencijoje „Contemporary Issues in Busi-
ness, Management and Education”, Vilnius, Gegužės 11–12d., 2017.
− Energetika, klasteriai ir socialinės inovacijos tvariam vystymuisi vasaros
mokykla ir konferencija „Energy, Clusters and Social Innovations for Sustaina-
ble Development Summer School and Conference”, Vilnius, Rugsėjo 5–7d.,
2016.
Doktorantūros metu buvo įvykdytos dvi mokslinės stažuotės:
− 2017–2018 m. Kaire, Egipte, „Mokslinių tyrimų ir technologijos akademijoje”
(ASRT).
− 2017 m. Fese, Maroke, Sidi Mohamed Ben Abdellah universitete (USMBA).

SUMMARY IN LITHUANIAN 149
Disertacijos struktūra
Darbą sudaro įvadas, trys pagrindiniai skyriai, bendrosios išvados, literatūros sąrašas,
autoriaus publikacijų disertacijos tema sąrašas ir septyni priedai. Disertacijos apimtis (be
priedų) – 158 puslapiai, 48 iliustracijos ir 21 lentelė.
1. Teorinė klasterių ir žiedinės ekonomikos literatūros analizė: pagrindinės sampratos
Pirmajame disertacijos skyriuje aprašoma literatūros šaltinių disertacijos tematika
apžvalga. Analizė atlikta siekiant nustatyti rodiklius, kuriuos mokslininkai naudoja
klasterių veiklai, efektyvumui ar konkurencingumui vertinti. Taip pat apžvelgiamos
vyriausybės institucijų siūlomos klasterių plėtros priemonės. Skyriuje nurodomi sektoriai,
kuriuose veikia klasteriai, apibūdinama ŽE ir pateikiamos klasterių įsitraukimo į perėjimą
prie ŽE prielaidos. Vėliau atrenkami rodikliai ir metodai, tinkami klasterių veiklos
pereinant prie ŽE vertinimui.
Terminas „klasteris” yra siejamas su Porterio (1990) apibrėžimu, kur jis
apibūdinamas kaip geografinė tarpusavyje susijusių ir viena kitą papildančių įmonių ir
institucijų koncentracija. Klasterių tyrimai nuo 1990 metų išpopuliarėjo įvairiose
akademinėse srityse, tokiose kaip vadyba ir strategija, regionų plėtra ir augimas, miesto
tyrimai ir ekonominė geografija. Klasteriai per pastarąjį dešimtmetį sulaukia didesnio
susidomėjimo, nes jie suteikia galimybę naudotis užsienio rinkomis, pasauliniais žinių
tinklais, bendru išteklių tiekėju, prieiga prie žinių, inovacijų. Klasteriai yra sudėtinga
organizacijos forma, kurioje bendrumas yra formuojamas socialinių ryšių, produktyvių
vietinių įmonių ir institucijų tinklų. Klasteriai natūraliai formuojasi atsižvelgiant į
geografinį artumą ir prisideda prie regionų plėtros per inovacijas, mokslinius tyrimus ir
plėtrą, naujų įmonių steigimo ir kitas veiklas. Įprastai jie kuriasi artimoje aplinkoje, nors
jų paskirtis yra sukurti konkurencinį pranašumą klasterio nariams didesniu mastu –
nacionaliniu ir tarptautiniu. Šiandien mes susiduriame su gerai išvystytais klasteriais,
kurie prisideda prie konkurencinio pranašumo kūrimo klasteriui priklausančioms
įmonėms ir prie regionų vystymosi.
Klasterių svarba matoma mokslinėje literatūroje dėl vis augančio atvejo analizės
skaičiaus skirtinguose kontekstuose ne tik lokaliai, bet ir visame pasaulyje. Atlikta išsami
literatūros analizė leido nustatyti rodiklius, kurie aptariami mokslo darbuose. Autorių
minimi rodikliai gali būti padalinti į septynias grupes: artumą, kurį galima išskaidyti į
geografinį, institucinį, organizacinį, kultūrinį, socialinį, santykinį ir pažintinį, inovacijas,
žinių perdavimą, finansinius rodiklius, investicijų rodiklius, valdymo rodiklius, tvarumo
rodiklius. Ryšių tarp šių veiksnių nustatymui yra naudojama koreliacinė – regresinė
analizė, gravitacijos modelis taikytas įtakai nustatyti, atvejo analize tikrinami mokslinės
literatūros teiginiai ir kuriami modeliai, siekiant nustatyti vienų veiksnių įtaką kitiems.
Mokslinės literatūros analizė leidžia palyginti mokslininkų teiginius ir tyrimų rezultatus,
pateikti reikšmingas įžvalgas. Klasterių veiklos vertinimui reikalingi duomenys yra
pateikiami skirtingais matais. Duomenims susisteminti ir apdoroti galima taikyti
daugiakriterinio vertinimo ( TOPSIS, Fuzzy TOPSIS, DEA, AHP, FAHP) metodus.

150 SUMMARY IN LITHUANIAN
Mokslinėje literatūroje teigiama, kad ŽE yra labai svarbi ir perspektyvi sritis, gebanti
pritraukti verslo bendruomenę į darnesnę plėtrą. Per pastaruosius šimtą metų dėl žmogaus
išsivystymo gamtos išteklių naudojimas išaugo precedento neturinčiu mastu. Dėl
didėjančio išteklių išgavimo visame pasaulyje, kuris labiausiai paveikė Europos, Šiaurės
Amerikos ir kitų pasaulio šalių ekonominę plėtrą, perėjimas prie ŽE tampa sudėtinga
užduotimi, kurią turi įgyvendinti vyriausybė per galimai ilgą laikotarpį. Pagal apibrėžimą
žiedine ekonomika laikoma pramonės sistema, suprojektuota ar skirta atkurti ar
regeneruoti ir skatinama mokslininkų, politikos formuotojų, nevyriausybinių organizacijų
ir korporacijų.
ŽE yra labai svarbi plėtojant klasterius, nes ji gali būti vienas veiksnių, prisidedančių
prie konkurencinio pranašumo didinimo. Paprastai mažos ir vidutinės įmonės negali
savarankiškai įsitraukti į žiedinę ekonomiką, nes joms trūksta žinių, išteklių, finansavimo.
Šiuos apribojimus gali pašalinti klasteriai per įgytą konkurencinį pranašumą.
ŽE mokslininkų yra vertinama kaip priemonė siekiant geresnių veiklos rezultatų. Tai
galima pasiekti skirtingais kanalais: per išteklių efektyvumą, ekologinį efektyvumą,
atliekų laikymą ištekliais, pritaikant uždarojo ciklo principus ir pateikiant metodus, kaip
paskatinti pakartotinį naudojimą ir perdirbimą, gyvavimo ciklo įvertinimo nagrinėjimą.
ŽE vyksta keliais lygiais: įmonėje, tarp įmonių, tarp verslo ir vartotojų bei tarp vartotojų.
Taip pat reikia įtraukti viešąjį sektorių. Klasteriuose dalyvauja skirtingi veikėjai, kurie gali
paskatinti perėjimą prie ŽE.
Efektyvus išteklių valdymas tampa vis svarbesnis mažoms ir vidutinėms įmonėms,
jos tampa suinteresuotos sumažinti energijos, medžiagų ir vandens sąnaudas ir pradeda
ieškoti alternatyvių ŽE modelių, kad liktų kiek įmanoma mažiau atliekų. Klasteriai gali
vaidinti didžiulį vaidmenį prisidedant prie mažų ir vidutinių įmonių išteklių tausojimo.
Įmones jungtis į klasterius skatina jų kuriamas konkurencinis pranašumas. Klasterio
suteikiamos galimybės sujungus atitinkamas šalis gali paskatinti perėjimą prie ŽE, padėti
įmonėms įsitraukti į efektyvų išteklių panaudojimą, perdirbimą, medžiagų pakartotinį
naudojimą ir kitas veiklas.
Europos Komisija paskelbė ŽE veiksmų planą, kuriuo siekiama skatinti perėjimą prie
naujo modelio. Pabrėžiama pažangos stebėjimo svarba. Šis procesas nėra lengvas, nes
apima skirtingas sritis ir reikalauja pereinamojo laikotarpio. ŽE stebėsenos priemonė
turėtų padėti piliečiams ir politikos formuotojams nustatyti sėkmės veiksnius ir sritis,
kurios reikalauja daugiau dėmesio. ŽE yra ilgalaikis tikslas, kuriam pasiekti reikia
nustatyti naujus prioritetus ir tuomet galima tikėtis gerų rezultatų.
Į Europos Komisijos siūlomą ŽE stebėsenos sistemą, kuri apima ŽE veiksmų planą,
įtraukta dešimt rodiklių iš keturių sričių: gamybos ir vartojimo, atliekų tvarkymo, antrinių
žaliavų ir konkurencingumo bei inovacijų. Siūloma rodiklių sistema atspindi ciklo
uždarymo idėją.
Šiame tyrime klasteriai yra įvardijami kaip ŽE skatintojai. Klasteriai gali paskatinti
savo narius pereiti prie ŽE, taip padidindami konkurencinį pranašumą ir papildydami
klasterio veiklas. Klasterio veiklos vertinimo būtinybė yra ryški nacionaliniu lygmeniu,
nes nustačius trūkumus ir stipriąsias puses galima prisidėti prie klasterio tobulinimo.
Klasterio veiklos vertinimo pereinant prie ŽE modelis sudaro galimybę vertinti klasterius.
Mokslinėje literatūroje aptinkami metodai paprastai mokslininkų naudojami
klasteriams arba žiedinei ekonomikai kaip nepriklausomiems veiksniams vertinti. Šiomis

SUMMARY IN LITHUANIAN 151
metodikomis nesiekiama reaguoti į klasterių veiklos pokyčius, kai svarstomas perėjimas
prie ŽE. Literatūros analizės rezultatai, vertinant mokslininkų naudojamus metodus,
patvirtina darbo originalumą, nes tokia metodika anksčiau nebuvo siūloma.
2. Klasterių veiklos vertinimo pereinant prie žiedinės ekonomikos modelio formulavimo metodologija
Antrajame darbo skyriuje aprašyti metodai, kurie naudojami formuluojant klasterių
veiklos vertinimo pereinant prie ŽE modelį, pasirinktus rodiklius ir siūlomą metodiką.
Toliau aiškinamas daugiakriterinio vertinimo procesas ir apibūdinami du metodai – SAW
ir TOPSIS – pasirenkant juos duomenų apdorojimui ir rezultatų apskaičiavimui.
Paskutiniame tyrimo etape siūloma tiesinė regresinė analizė. Apibūdinti rodikliai, įtraukti
į klasterių veiklos vertinimo pereinant prie ŽE modelį ir pateiktas modelio
apibendrinimas.
Veiklos stebėjimas ir vertinimas yra labai svarbus klasterių valdymo procese. Šie
veiksmai gali prisidėti prie klasterių augimo, nes jiems atlikti reikalingi naujausi
duomenys ir kitos svarbios priemonės. Metodai, įtraukti į klasterių veiklos vertinimo
pereinant prie ŽE modelį, buvo atrinkti pagal literatūros analizę ir esamą duomenų
prieinamumo situaciją.
Sudarytas klasterių veiklos vertinimo pereinant prie ŽE modelis apimantis šiuos
veiksnius: rodiklius, tinkamus klasterių veiklos vertinimui pereinant prie ŽE; reikalavimus
klasterių ir ŽE ekspertams; metodus, tinkamus klasterių veiklos vertinimo pereinant prie
ŽE; metodus, ryšiui tarp šių kintamųjų nustatyti. Siūlomas modelis (S2.1.pav.)
įgyvendinamas keliais etapais.
Ekonominis augimas yra neatsiejamas nuo naujų darbo vietų kūrimo, verslo
galimybių, naujų rinkų ir galimo uždarbio. Besikeičianti mąstysena, verslo modeliai,
novatoriški produktai ir paslaugos yra neatsiejama to dalis. Paprastai MVĮ turi
pakankamai ribotą laiką ir išteklius, todėl negali nuosekliai laikytis ekonomikos augimo
krypties. Pasaulinės klasės inovacijos, technologijos ir kompetencija, naujų išradimų
kūrimas dažniausiai siejamas su didelėmis įmonėmis, turinčiomis pagrįstą finansinę
naudą. Klasteriai taip pat gali sudaryti sąlygas finansiniam augimui dėl juos sudarančių
narių: MVĮ, aukštojo mokslo institucijų, tyrimų centrų, nevyriausybinių organizacijų ir
kitų.
Klasterių veiklos vertinimo pereinant prie ŽE modelio įgyvendinimas pradedamas nuo
rodiklių, tinkamų šių veiksnių vertinimui. Klasteris yra sudėtinga organizacijos forma, todėl
vertinant jo veiklą reikia atkreipti dėmesį į jo narius ir skirtingas jų atliekamas funkcijas.
Šiame etape būtina sudaryti dvi atskiras rodiklių sistemas, siekiant nustatyti klasterio veiklos
ir perėjimo prie ŽE tarpusavio ryšį.
Siūlomą klasterių veiklos vertinimo pereinant prie ŽE modelį sudaro 35 rodikliai,
sudarantys dvi komponentų grupes: pirmąją sudaro klasterio veiklos kriterijai, o antrąją –
perėjimo prie ŽE rodiklių grupė. Pirmoji grupė yra neabejotinai svarbi norint įvertinti
klasterio veikimą ir leidžia aptikti sritis, kurias reikia išplėtoti siekiant geresnių klasterio
veiklos rezutatų. Ši rodiklių grupė sudaryta atsižvelgiant į Lietuvos klasterizacijos studija
(2017), remiantis literatūros analize ir Europos klasterių analizės sekretoriatu (ESCA).
Atrinkti 25 rodikliai.

152 SUMMARY IN LITHUANIAN
S2.1 pav. Klasterių veiklos ir perėjimo prie žiedinės ekonomikos vertinimo modelis
(sudaryta autorės)
Klasterio veiklos vertinimo pereinant prie žiedinės ekonomikos modelis
Duomenų rinkimas ir dalinis apdorojimas
Rodiklių svorių nustatymas
Rezultatų tarpinis vertinimas
Daugiakriterinių metodų taikymas
Klasterių veiklos vertinimo pereinant prie žiedinės ekonomikos rezultatai
Rodiklių svorių nustatymas
Daugiakriterinių metodų taikymas
Žiedinė
ekonomika
Klasterio veikla
Tapusavio komunikacija
Marketingo veiklos
Žmogiškieji ištekliai
Finansiniai ištekliai
Ekspertų
vertinimas Ekspertų suderinamumo
vertinimas
SAW TOPSIS
Tiesinė regresinė analizė

SUMMARY IN LITHUANIAN 153
Antroji grupė siūlo ŽE rodiklius, kurie gali padidinti klasterio konkurencingumą. Ši
grupė yra sudaryta iš 10 rodiklių, atsižvelgiant į Europos Bendrijos perėjimo prie ŽE
suplanuotus veiksmus (“Overview – Eurostat,” n.d.).
Klasterių veiklos vertinimą sudaro keturi komponentai: tarpusavio komunikacija,
finansiniai ištekliai, žmogiškieji ištekliai ir marketingo veiklos. Tris komponentus –
tarpusavio komunikaciją, finansinius išteklius ir marketingo veiklas – sudaro po šešis
rodiklius, o žmogiškuosius išteklius sudaro septyni rodikliai. Visi komponentai neviršija
rekomenduojamo rodiklių skaičiaus, todėl galima jų toliau nebedalinti.
ŽE komponentas taip pat buvo pateiktas hierarchine tvarka. Šis komponentas apima 10
rodiklių, todėl nebuvo skaidomas siekiant pritaikyti jį ekspertiniam vertinimui. ŽE
komponentas yra papildantis, padidinantis klasterio konkurencingumą. Tuo tarpu klasterio
veiklos rezultatai vertinami kaip teikiantys pagrindinę informaciją.
Šie klasterio veiklos rodikliai suteikia informacijos, kurią galima įvertinti taikant
daugiakriterinius vertinimo metodus. Komponentai gali būti papildyti arba pakeisti kitais
kriterijais pagal poreikį, tačiau siekiant nepakenkti tyrimo kokybei, reikėtų atkreipti dėmesį
į kiekvieno kriterijaus svarbą.
Vėliau renkami duomenys, kurie reikalingi pagal pasirinktus rodiklius. Norint surinkti
visą informaciją, gali prireikti kelių šaltinių. Lengviausia gauti informaciją iš oficialių, viešų
ir atvirų šaltinių. Šiame darbe buvo naudojami tokie oficialūs šaltiniai: „Sodra” su atvira
prieiga prie informacijos įmonės lygiu, aplinkos apsaugos agentūra (AAA) su ribota prieiga
prie informacijos įmonės lygiu, „KlasterLT” su informacinio pobūdžio informacija klasterio
lygiu. Kitas patikimas informacijos šaltinis yra klasterių koordinatoriai, nes paprašius jie gali
surinkti duomenis tiesiogiai iš klasterio narių. Dalinai apdorojus duomenis, kreipiamasi į
ekspertus.
Kitame žingsnyje pritaikomi metodai, leidžiantys įvertinti klasterių veiklą ir perėjimą
prie ŽE. Ekspertų prašoma patvirtinti rodiklius ir parodyti jų svarbą priskiriant jiems svorius.
Ekspertai parenkami atsižvelgiant į jų patirtį tiriamoje srityje. Buvo pasirinkti du metodai –
SAW ir TOPSIS – dėl jų lengvo pritaikomumo ir rezultatų skaitinių reikšmių. SAW
rezultatai gali būti plačios aprėpties ir ganėtinai nutolę vienas nuo kito, kai lyginami keli
atvejai, tuo tarpu TOPSIS įverčiai svyruoja nuo nulio iki vieneto ir gali būti lengvai išreikšti
procentais. Pasirinkti du metodai siekiant patikrinti modelio patikimumą, kai įgyvendinamas
paskutinis žingsnis.
Paskutinis žingsnis reikalingas norint nustatyti ar egzistuoja ryšys tarp klasterių veiklos
ir perėjimo prie ŽE. Čia naudojama tiesinė regresinė analizė, kuri yra dažniausiai
naudojamas statistinis matematinis metodas, kai siekiama nustatyti ryšį tarp dviejų
kintamųjų.
Rezultatus ir išvadas rekomenduojama peržiūrėti sprendimų priėmėjams. Skirtingi
kriterijai leidžia priimti sprendimus dėl išteklių paskirstymo atsižvelgiant į gautus
rezultatus. Į modelį įtraukti rodikliai, kurie priklauso nuo kiekvieno klasterio nario, todėl
taip pabrėžiamas kiekvieno nario indėlis. Atitinkamai, finansiniai ir kiti ištekliai turėtų
turėti įtakos atskiriems nariams. Klasterio veiklos vertinimas pereinant prie ŽE turėtų būti
atliekamas reguliariai, išsamiai išnagrinėjus klasterį, atsižvelgiant į jo narius ir galimą jų
indėlį į klasterio veiklas.

154 SUMMARY IN LITHUANIAN
3. Klasterių veiklos vertinimas pereinant prie žiedinės ekonomikos: Lietuvos atvejis
Šiame skyriuje pateikiamas siūlomo klasterių veiklos vertinimo pereinant prie ŽE
modelio, išbandyto Lietuvos klasterių atveju, aprobavimas. Pasirinkti klasteriai
apžvelgiami pagal siūlomą klasterių žemėlapį, taikomas ekspertinis vertinimas,
pateikiamas klasterių veiklos vertinimas pereinant prie žiedinės ekonomikos.
Pagrindinė klasterių steigimo Lietuvoje priežastis yra siekis skatinti klasterio narių
veiklas. Lietuvos klasterizacijos studijos 2019 (Vaiginienė, 2019) duomenimis, Lietuvoje
klasteriai dažniausiai inicijuojami ekonomiškai stipriausiuose miestuose (Vilniuje,
Klaipėdoje, Kaune, Alytuje), kur didžiausia darbuotojų ir įmonių koncentracija. Kituose
regionuose yra mikroklasterių, kuriuose veiklos specifika būdinga tam regionui (Biržai,
Druskininkai, Kėdainiai, Mažeikiai, Ignalina).
Dažniausiai klasteriai dalyvauja tarptautiniuose projektuose (Baltijos jūros regionas
2007–2013 m., EUREKA EurostarsES SF inicijuoti projektai), kitose ES iniciatyvose,
padedančiose kurti žinių ir inovacijų erdvę, plėtoti komercinį bendradarbiavimą su
užsienio partneriais. Pagrindiniai klasterių pranašumai Lietuvoje yra veiklai palanki
aplinka (santykinai pigi ir kvalifikuota darbo jėga, patogi vieta logistikos srityje, išvystyta
logistikos struktūra, aukštas technologinės bazės lygis).
Atvejo analizei klasterių skaičiaus pasirinkimą nulėmė klasterių įsitraukimas į
iniciatyvas. Vienintelėje Lietuvoje informaciją apie klasterius kaupiančioje svetainėje
KlasterLT klasterių skaičius siekia 50. Europos klasterių kompetencijos iniciatyva (ECEI)
teikia klasteriams žymas, kurios nurodo klasterio išsivystymą. Pagal ECEI suteiktas
žymas šiame darbe pasirinkti klasteriai atvejo analizei, turintys bronzinę žymą. Tokių
Lietuvoje tyrimo atlikimo metu buvo 10, o kiti laikomi klasterių iniciatyvomis, tikintis
vėlesnio jų siekimo gauti žymas. Šiuo atveju analizuojami klasteriai yra: iVita, LauGEA,
Lietuvos plastikų klasteris, LITEK, Smart Food Cluster, PrefabLT, VKK, FETEK,
LitCare, NaMŪK.
Klasteriai analizuojami keliais aspektais. Pirmiausia pateikiamas klasterio
aprašymas, įkūrimo metai, koordinatorius ir miestas, kuriame registruotas koordinatorius,
organizacijos tipas ir 3.21 pav.
klasterio narių skaičius pagal KlasterLT svetainėje pateiktą informaciją. Tuomet
apžvelgiama kiekvieno klasterio nario ekonominė veikla pagal Ekonominės veiklos rūšių
klasifikatorių (EVRK), kurį galima rasti Oficialios statistikos portale (“Classification of
Economic Activities (EVRK) – Oficialiosios statistikos portalas,” n.d.). Vėliau sudaromas
žemėlapis, kuriame pateikiami kiekvieno klasterio nariai pagal geografinę vietą, įmonės
tipą, darbuotojų skaičių ir apyvartą. Ši informacija oficialiai prieinama rekvizitai.lt ir
sodra.lt svetainėse.
Remiantis rekvizitai.lt pateikta informacija, klasterių įmonių apyvarta gali svyruoti
nuo 0–5000 EUR iki daugiau nei 100 000 000 EUR. Pagal Europos Komisijos pateiktą
MVĮ apibrėžimą (Directorate–General for Internal Market, Industry, 2017), subjektas turi
užsiimti ekonomine veikla, darbuotojų skaičius mažesnis nei 250, o metinė apyvarta
neviršyti 50 000 EUR arba metinė balanso suma neviršyti 43 000 EUR. Įmonės dydžiui
nusakyti šiame darbe imamas darbuotojų skaičius ir metinė apyvarta.

SUMMARY IN LITHUANIAN 155
Klasteriai Lietuvoje skiriasi daugeliu aspektų. Lietuvos klasterizacijos studijoje
(Vaiginienė, 2019) įvardinami 57 klasteriai, kuriems iš viso priklauso 777 nariai. Ilgiausiai
dirbantis klasteris skaičiuoja 25 metus, o daugumos klasterių amžius yra apie ketverius
metus. Kai kurie iš jų vis dar yra pradinio formavimosi etape arba jį sudaro įmonių grupė,
susitelkusi siekdama ES struktūrinės paramos. Yra vienas klasteris, kuriam priklauso tik
vienas narys, o didžiausias narių skaičius klasteryje yra 69. Kai kurie klasteriai turi tą pačią
specializaciją, kas rodo, kad klasterių nariai turėtų vienytis ne kurdami naujus, o
papildydami esamus klasterius. Taip būtų stiprinami esami klasteriai, papildant juos
naujais nariais, skatinamas bendradarbiavimas ir plėtra.
Darbe pateiktas klasterių veiklos vertinimo pereinant prie ŽE modelio praktinis
pritaikomumas yra išbandytas Lietuvos klasterių atveju. Empiriniai tyrimai atliekami
analizuojant septynis Lietuvos klasterius.
Duomenims rinkti buvo naudojamos statistinių duomenų bazės ir klasterių
koordinatorių anketinės apklausos. Atvejų analizei buvo atrinkta dešimt klasterių, tačiau
tik septyni atsakė į apklausą. Kiti reikalingi statistiniai duomenys buvo paimti iš oficialių
šaltinių: Sodra, AAA, KlasterLT.
Klasterių veiklos atsižvelgiant į perėjimą prie ŽE vertinamas atliktas taikant antrame
skyriuje aprašytą metodiką. Rezultatams apskaičiuoti buvo taikomi daugiakriteriniai ver-
tinimo metodai ir tiesinė regresinė analizė, kuri parodo ar egzistuoja ryšys tarp klasterių
veiklos ir perėjimo prie ŽE. Skaičiavimai atliekami pagal suformuotą hierarchinę rodiklių
sistemą.
Rodiklių sistema buvo sukurta atsižvelgiant į mokslinės literatūros analizę ir tarptautines
bei nacionalines stebėjimus rengiančias agentūras: ESCA ir MITA. Rodiklių sistema buvo
suformuota įtraukiant labiausiai informatyvius rodiklius. Klasterių veiklos vertinimas
apima 25 rodiklius, kurie yra suskirstyti į keturis komponentus: tarpusavio komunikacija
su šešiais rodikliais, marketingo veikla su šešiais rodikliais, žmogiškieji ištekliai su
septyniais rodikliais ir finansiniai ištekliai su šešiais rodikliais. Perėjimo prie ŽE
vertinimas apima 10 rodiklių, kurie smulkiau neskaidomi.
Ekspertų buvo paprašyta patvirtinti rodiklių tinkamumą juos vertinant ir suteikiant
svorius. Klasterių veiklos vertinimas ir perėjimo prie ŽE vertinimas buvo pateikti kaip
skirtingos rodiklių sistemos, kurias reikia vertinti atskirai. Klasterių veiklos vertinimas
apima keturis komponentus smulkiau skaidomus į rodiklius, todėl šie taip pat buvo vertinti
ekspertų.
Apdorojus rezultatus apskaičiuotas ekspertų vertinimo nuoseklumas. Vertinimas
buvo atliktas reitinguojant rodiklius. Ekspertų skaičius yra septyni. Kiekvienam
sprendimo etapui buvo apskaičiuotas konkordacijos koeficientas 𝑊, kriterijus siekiant
patikrinti suderinamumą. Suderinamumo koeficiento 𝑊 reikšmės svyruoja nuo 0,52 iki
0,86. Ekspertų nuomonių suderinamumas patvirtintas, nes visos reikšmės yra didesnės
nei 𝑘𝑟2 .
Pasiekus rezultatų skaičiavimo etapą taikant SAW ir TOPSIS metodus, iškyla
duomenų trūkumo problema. Kadangi klasteriai vis dar nesulaukia pakankamai dėmesio,
nėra privaloma rinkti ir sisteminti duomenų, kurie leistų vertinti klasterių veiklą. Tai
lemia, kad kai kurie duomenys nėra pateikti.
Taikant metodus ir nepaisant duomenų trūkumo, rezultatai gali būti iškraipyti. Dėl
šios priežasties buvo pritaikytas nestandartinis matematinio skaičiavimo metodas. Jis

156 SUMMARY IN LITHUANIAN
pritaikytas kiekvienam klasteriui, pašalinant rodiklius, kuriems nepateikti duomenys ir
atitinkamai perskaičiuojami svoriai. Toks perskaičiavimas leidžia tinkamai taikyti
daugiakriterius vertinimo metodus ir pritaikyti siūlomą modelį. Vienas iš analizuojamų
klasterių pateikė visus prašomus duomenis per pakankamai trumpą laiką, kas įrodo, kad
rodikliai yra tinkami ir gali būti vertinami.
Klasteriai vertinti pritaikius du skirtingus daugiakriterinio vertinimo metodus.
Rezultatai gauti SAW metodu pateikti skritulinėje diagramoje skaitines vertes pavertus
procentais link idealios alternatyvos. SAW metodu apskaičiuotos reikšmės gali būti viena
nuo kitos nutolusios skaitine verte, todėl jas vaizdžiau vertinti pavertus procentais link
idealios alternatyvos. Reikšmių pateikimas procentais leidžia vertinti vieno klasterio
rezultatų priartėjimą prie imtyje esančios geriausios vertės. Toks rezultatų pateikimas
leidžia klasterio koordinatoriams palyginti klasterio rezultatus su bendru imtyje esančiu
geriausiu rezultatu. S3.1 paveiksle pateiktas klasterio veiklos vertinimas rodo, kad
klasterio veikla atitinka 54,83 procento, kai vertinamas priartėjimas prie idealios
alternatyvos. Vadinasi, klasterio veiklos bendras rezultatas yra artimesnis geriausiai
alternatyvai esančiai imtyje. Klasterio perėjimas prie žiedinės ekonomikos atitinka 90,15
procento, kai vertinamas priartėjimas prie idealios alternatyvos. Tai rodo, kad vertinamo
klasterio perėjimo prie ŽE rezultatas yra labai artimas geriausiai vertei esančiai imtyje.
S3.1 pav. Klasterio veiklos ir perėjimo prie žiedinės ekonomikos vertinimas SAW metodu
procentais link idealios alternatyvos (sudaryta autorės)
TOPSIS metodu gautų rezultatų palyginimas gali būti pateiktas sprendimų
priėmėjams, kurie apžvelgia klasterių rezultatus lygindami juos. S3.2 paveiksle TOPSIS
rezultatai pateikti skaitinėmis reikšmėmis intervale nuo 0 iki 1 leidžia palyginti klasterius
tarpusavyje arba to paties klasterio rezultatų pokytį skirtingu laikotarpiu, vertinti jų
pasiskirstymą pagal tai, kurioje srityje klasteris išsiskiria. Grafike matyti, kad klasterių
veiklos rezultatai pasiskirstę ties vidurkiu, svyruoja nuo 0,425 iki 0,561. Tuo tarpu
perėjimo prie ŽE rezultatai labiau išsisklaidę, svyruoja visame intervale. Toks
pasiskirstymas galimas dėl klasterių priklausymo skirtingiems sektoriems, todėl priimant
sprendimus būtina atkreipti dėmesį į klasterio specifiką.
Tiesinė regresinė analizė buvo atlikta siekiant patikrinti ar egzistuoja ryšys tarp
klasterių veiklos ir perėjimo prie ŽE vertinant šešių klasterių rezultatus. Paimti statistiniai
55%
Klasterio
veikla
90%
Perėjimas
prie ŽE

SUMMARY IN LITHUANIAN 157
kintamieji x ir y, kai x rodo perėjimą prie ŽE, o y – klasterių veiklą skaitinėmis vertėmis,
gautomis pritaikius SAW ir TOPSIS metodus. Pritaikius TOPSIS rezultatus, gauta lygtis:
y = 5,6307x – 2,1391. Nustatyta, kad kintamasis y koreliuoja su regresoriumi ir rodo
tikėtiną tiesinę priklausomybę. Šie du kintamieji turi teigiamą tiesinį ryšį – kai vienas
kintamasis juda tam tikra kryptimi, kitas linkęs judėti ta pačia kryptimi. SAW metodu
gauti rezultatai yra susiję tokiu ryšiu: y = 0,868x + 16,617. Gautos tiesinės regresijos lygtys
leidžia vertinti klasterio veiklos ir perėjimo prie ŽE tarpusavio ryšį.
S3.2 pav. Klasterių veiklos ir perėjimo prie žiedinės ekonomikos vertinimas TOPSIS metodu
intervale nuo 0 iki 1 (sudaryta autorės)
Nustatytas determinacijos koeficientas 𝑅2. Kuo koeficiento vertė yra arčiau 1, tuo
stipresnis ryšys. Determinacijos koeficientas 𝑅2 yra lygus 0,66 kai taikyti TOPSIS
rezultatai ir 0,51, kai taikyti SAW rezultatai rodo statistiškai reikšmingą ryšį. Galima
sakyti, kad egzistuoja preliminarus priežastinis ryšys – klasterių veikla gali prisidėti prie
perėjimo prie ŽE.
Rezultatai rodo, kad kai kuriais atvejais tyrimams reikalingi duomenys yra
nepasiekiami dėl reguliarios klasterių stebėsenos trūkumo arba ribotos prieigos, lemiamos
duomenų apsaugos įmonės lygmeniu. Siūlomas modelis pritaikytas veikiančiuose
klasteriuose Lietuvoje. Galutinis rezultatas rodo, kad tarp klasterių veiklos ir perėjimo prie
ŽE yra preliminarus ryšys.
Bendrosios išvados
Apibendrinus literatūros analizės ir tyrimo rezultatus, galima teigti, kad:
1. Teorinė analizė atskleidė sąvokų daugiareikšmiškumą. Tolesnei klasterių ir ŽE
analizei atlikti reikėjo jas tiksliai apibrėžti. Mokslinė literatūra padėjo nustatyti,
kad klasteriai yra suinteresuoti išteklių efektyvumu, energijos, medžiagų ir
vandens sąnaudų mažinimu. Tai parodo klasterių svarbą, kai siekiama paskatinti
MVĮ pereiti prie ŽE. Viena iš dažniausiai aptinkamų klasterių ypatybių yra
konkurencinis pranašumas, kurį MVĮ įgyja dėl klasterio narių artumo. ŽE gali
prie to prisidėti, nes klasteriai turi galimybes įtraukti narius į efektyvų išteklių
naudojimą, perdirbimą, pakartotinį medžiagų naudojimą ir kitą bendrą veiklą.

158 SUMMARY IN LITHUANIAN
2. Remiantis literatūros analize nustatyti dažniausiai mokslininkų klasterių
tyrimuose naudojami rodikliai. Papildomai atsižvelgta į Lietuvos vyriausybinėse
institucijose ir Europos klasterių analizės sekretoriato siūlomas vertinimo
priemones. Remiantis šiais šaltiniais buvo sudarytos keturios klasterių veiklą
leidžiančios vertinti rodiklių grupės: tarpusavio komunikacija, finansiniai
ištekliai, žmogiškieji ištekliai ir marketingo veiklos.
3. Rodikliai, parodantys perėjimą prie ŽE, buvo atrinkti remiantis literatūra ir
Europos Komisijos siūloma pažangos stebėjimo sistema. Klasterių perėjimo prie
ŽE vertinimui naudoti dešimt rodiklių, apimantys komunalinių ir kitų atliekų
susidarymą ir prekybą perdirbamomis ar tinkamomis pakartotiniam naudojimui
žaliavomis jas importuojant, eksportuojant ar vykstant prekybai tarp klasterio
narių.
4. Disertacinio darbo mokslinį naujumą parodo dviejų siūlomų naujų rodiklių
vertinimo sistemų sujungimas į vieną modelį: klasterių veiklos ir klasterių
perėjimo prie ŽE vertinimo modelį. Šis modelis skirtas naudoti Lietuvos
klasteriuose, tačiau gali būti pritaikomas kitose šalyse. Vertinimo modelis
apimantis dvi rodiklių sistemas leidžia stebėti klasterių vystymąsi, atsižvelgiant į
jų veiklas ir perėjimą prie ŽE. Jį gali naudoti klasterių valdytojai, koordinatoriai
ir valdžios institucijos siekiant pagrįsti klasterių plėtros finansavimo poreikį.
5. Atlikta veikiančių klasterių atvejo analizė parodė, kad klasteriai Lietuvoje yra
nepakankamai įvertinti. Duomenys apie klasterių rezultatyvumą turėtų būti
renkami ir reguliariai vertinami siekiant stebėti klasterių vystymąsi. Atvejo
analizei buvo atrinkti klasteriai, veikiantys skirtinguose sektoriuose, leidę
įvertinti septynių klasterių veiklą ir šešių klasterių perėjimą prie ŽE taikant
daugiakriterinius vertinimo metodus (SAW, TOPSIS).
6. Surinkti duomenys leido inicijuoti duomenų bazės sudarymą pagal siūlomas
rodiklių sistemas. Pritaikius klasterių veiklos vertinimo pereinant prie ŽE modelį
matome, kad egzistuoja ryšys tarp klasterių veiklos rezultatų ir perėjimo prie ŽE.
Tai rodo, kad klasteriai gali būti identifikuojami kaip ŽE ir efektyvaus išteklių
naudojimo skatintojai siekiant MVĮ įsitraukimo.

159
Annexes1
Annex A. The Process of TOPSIS Application
Annex B. Map Legend
Annex C. Questionnaire for Cluster Coordinators
Annex D. Questionnaire for Experts
Annex E. Declaration of Academic Integrity
Annex F. The Co-authors’ Agreements to Present Publications Material in the Dissertation
Annex G. Copies of Scientific Publications by the Author on the Topic of the Dissertation
1The annexes are supplied in the enclosed compact disc
Related Documents


