EVALUATION OF BEARING CAPACITY OF PILES FROM CONE PENETRATION TEST DATA by Hani H. Titi, Ph.D., P.E. Murad Y. Abu-Farsakh, Ph.D., P.E. Louisiana Transportation Research Center 4101 Gourrier Avenue Baton Rouge, LA 70808 LTRC Project No. 98-3GT State Project No. 736-99-0533 conducted for Louisiana Department of Transportation and Development Louisiana Transportation Research Center The contents of this report reflect the views of the authors who are responsible for the facts and the accuracy of the data presented herein. The contents do not necessarily reflect the views or policies of the Louisiana Department of Transportation and Development or the Louisiana Transportation Research Center. This report does not constitute a standard, specification, or regulation. November 1999

Welcome message from author
This document is posted to help you gain knowledge. Please leave a comment to let me know what you think about it! Share it to your friends and learn new things together.
Transcript
EVALUATION OF BEARING CAPACITY OF PILES FROM CONEPENETRATION TEST DATA
byHani H. Titi, Ph.D., P.E.
Murad Y. Abu-Farsakh, Ph.D., P.E.
Louisiana Transportation Research Center4101 Gourrier Avenue
Baton Rouge, LA 70808
LTRC Project No. 98-3GTState Project No. 736-99-0533
conducted for
Louisiana Department of Transportation and DevelopmentLouisiana Transportation Research Center
The contents of this report reflect the views of the authors who are responsible for the facts and theaccuracy of the data presented herein. The contents do not necessarily reflect the views or policiesof the Louisiana Department of Transportation and Development or the Louisiana TransportationResearch Center. This report does not constitute a standard, specification, or regulation.
November 1999


iii
ABSTRACT
This study presents an evaluation of the performance of eight cone penetration test (CPT) methods
in predicting the ultimate load carrying capacity of square precast prestressed concrete (PPC)
piles driven into Louisiana soils. A search in the DOTD files was conducted to identify pile load
test reports with cone penetration soundings adjacent to test piles. Sixty piles were identified,
collected, and analyzed. The measured ultimate load carrying capacity for each pile was
interpreted from the pile load test using Butler-Hoy method, which is the primary method used by
DOTD. The following methods were used to predict the load carrying capacity of the collected
piles using the CPT data: Schmertmann, Bustamante and Gianeselli (LCPC/LCP), de Ruiter and
Beringen, Tumay and Fakhroo, Price and Wardle, Philipponnat, Aoki and De Alencar, and the
penpile method. The ultimate load carrying capacity for each pile was also predicted using the
static "-method, which is used by DOTD for pile design and analysis.
Prediction of pile capacity was performed on sixty piles, however, the statistical analyses and
evaluation of the prediction methods were conducted based on the results of thirty five friction
piles plunged (failed) during the pile load tests. End-bearing piles and piles that did not fail during
the load tests were excluded from the statistical analyses.
An evaluation scheme was executed to evaluate the CPT methods based on their ability to predict
the measured ultimate pile capacity. Four different criteria were selected to evaluate the ratio of
the predicted to measured pile capacities. These criteria are: the best-fit line, the arithmetic mean
and standard deviation, the cumulative probability, and the Log Normal distribution. Each criterion
was used to rank the prediction methods based on its performance. The final rank of each method
was obtained by averaging the ranks of the method from the four criteria. Based on this evaluation,
the de Ruiter and Beringen and Bustamante and Gianeselli (LCPC/LCP) methods showed the best
performance in predicting the load carrying capacity of square precast prestressed concrete (PPC)
piles driven into Louisiana soils. The worst prediction method was the penpile, which is very
conservative (underpredicted pile capacities).

iv

v
ACKNOWLEDGMENTS
The financial support of this research was provided by the Louisiana Department of Transportation
and Development/Louisiana Transportation Research Center under State project No. 736-990533
and LTRC Research Project No. 98-3GT and by the Federal Highway Administration.
The authors acknowledge the valuable comments and suggestions of the DOTD project review
committee members: Mark Morvant, manager of geophysical systems research at LTRC; Doug
Hood, materials section; Steve Bokun, materials section; Doc Zhang, geotechnical and pavement
section; Ed Tavera, formerly of the geotechnical and pavement section; Jim Tadie, construction
section; Brian Buckel, construction section; and Bill Gywn, Eustis Engineering.
The authors would like to acknowledge the guidance and support of the project consultant, Dr.
Mehmet Tumay, associate dean for research, LTRC/LSU. The assistance of J. B. Esnard and Ed
Tavera, of the DOTD pavement and geotechnical design section, in getting pile load reports from
department files is appreciated. Will Hill, research associate III at LTRC directed the upgrading of
the data acquisition system for the LECOPS and REVEGITS. William Tierney, research specialist
at LTRC, conducted the field cone penetration tests during the calibration of the new data
acquisition system. For one and a half years of dedicated and hard work, the following LSU
students are acknowledged: Elizabeth Hood, Anand Iyer, Mohan Pasappulatti, Nanjappa
Natarajan, and Fernando Vilas.
The effort of Dr. Khalid Farrag and Fernando Vilas in developing the new interface for the
computer program Louisiana Pile Design by Cone penetration Test (LPD-CPT) is gratefully
acknowledged.

vi

vii
IMPLEMENTATION STATEMENT
The results of this study demonstrated the capability of CPT methods in predicting the ultimate
load carrying capacity of square PPC piles driven into Louisiana soils. de Ruiter and Beringen and
Bustamante and Gianeselli (LCPC/LCP) methods showed the best performance in predicting the
ultimate measured load carrying capacity of square PPC piles. It is strongly recommended that
DOTD implement these two methods in design and analysis of square PPC piles. The
Schmertmann method also showed good results and is recommended for implementation, since it is
one of the most widely used CPT methods.
Cost-benefit analysis showed that the implementation would result in cost reduction in pile
projects and timesaving without compromising the safety and performance of the pile supported
structures. In fact, implementation of the CPT technology in pile design will reduce the level of
uncertainties associated with traditional design methods.
In order to facilitate the implementation process, a computer program, Louisiana Pile Design by
Cone Penetration Test (LPD-CPT), was developed for the design/analysis of square PPC driven
piles from CPT data. The program, which is based on the MS-Windows platform, is easy to use
and provides the profile of the pile load carrying capacity with depth.
Based on the results of the analyses, it is recommended that DOTD implement the cone penetration
technology in different geotechnical applications within its practice. Regarding design and analysis
of driven piles, the following steps are recommended:
1. Foster the confidence of DOTD design engineers in the CPT technology by adding the CPT
to the list of the primary variables in subsurface exploration and use it in soil identification
and classification and in site stratigraphy. Different soil classification methods can be used
such as Zhang and Tumay, Robertson and Campanella, and Olsen and Mitchell.
2. Compare the test results from the traditional subsurface exploration methods and the results
interpreted from the CPT methods. With time and experience, reduce the dependency level
on the traditional subsurface exploration methods and increase dependency level on the
CPT technology.
3. Use the CPT pile design methods in conjunction with the pile load tests and the static "-
viii
method to predict the load carrying capacity of the square PPC piles. The following CPT
methods are recommended: de Ruiter and Beringen method, Bustamante and Gianeselli
(LCPC/LCP) method, and Schmertmann method. If a pile load test is conducted for the site,
compare the results of the CPT methods with the measured ultimate pile load capacity. If
the measured and predicted capacities are different, then make a correction to the predicted
capacity in the amount of the difference between the measured and predicted capacity.
Apply this correction to the other for the design of piles at this site.
4. Increase the role of the CPT design method and decrease the dependency on the static "-
method.

ix
TABLE OF CONTENTS
ABSTRACT . . . . . . . . . . . . . . . . . . . . . . . . . . . . . . . . . . . . . . . . . . . . . . . . . . . . . . . . . . . . . . . . . iii
ACKNOWLEDGMENTS . . . . . . . . . . . . . . . . . . . . . . . . . . . . . . . . . . . . . . . . . . . . . . . . . . . . . . . . v
IMPLEMENTATION STATEMENT . . . . . . . . . . . . . . . . . . . . . . . . . . . . . . . . . . . . . . . . . . . . . vii
LIST OF FIGURES . . . . . . . . . . . . . . . . . . . . . . . . . . . . . . . . . . . . . . . . . . . . . . . . . . . . . . . . . xi
LIST OF TABLES . . . . . . . . . . . . . . . . . . . . . . . . . . . . . . . . . . . . . . . . . . . . . . . . . . . . . . . . . . . . xv
INTRODUCTION . . . . . . . . . . . . . . . . . . . . . . . . . . . . . . . . . . . . . . . . . . . . . . . . . . . . . . . . . . . . . . 1
OBJECTIVE . . . . . . . . . . . . . . . . . . . . . . . . . . . . . . . . . . . . . . . . . . . . . . . . . . . . . . . . . . . . . . . . 5
SCOPE . . . . . . . . . . . . . . . . . . . . . . . . . . . . . . . . . . . . . . . . . . . . . . . . . . . . . . . . . . . . . . . . . . . . . . 7
BACKGROUND . . . . . . . . . . . . . . . . . . . . . . . . . . . . . . . . . . . . . . . . . . . . . . . . . . . . . . . . . . . . . . 9
PILE FOUNDATIONS . . . . . . . . . . . . . . . . . . . . . . . . . . . . . . . . . . . . . . . . . . . . . . . . . . . . 9
CONE PENETRATION TEST . . . . . . . . . . . . . . . . . . . . . . . . . . . . . . . . . . . . . . . . . . . . . 10
PREDICTION OF PILE CAPACITY BY CPT . . . . . . . . . . . . . . . . . . . . . . . . . . . . . . . . . 12
Schmertmann Method . . . . . . . . . . . . . . . . . . . . . . . . . . . . . . . . . . . . . . . . . . . . . . 12
de Ruiter and Beringen Method . . . . . . . . . . . . . . . . . . . . . . . . . . . . . . . . . . . . . . 14
Bustamante and Gianeselli Method (LCPC/LCP Method) . . . . . . . . . . . . . . . . . . 16
Tumay and Fakhroo Method (Cone-m Method) . . . . . . . . . . . . . . . . . . . . . . . . . . 23
Aoki and De Alencar Method . . . . . . . . . . . . . . . . . . . . . . . . . . . . . . . . . . . . . . . . 23
Price and Wardle Method . . . . . . . . . . . . . . . . . . . . . . . . . . . . . . . . . . . . . . . . . . . 25
Philipponnat Method . . . . . . . . . . . . . . . . . . . . . . . . . . . . . . . . . . . . . . . . . . . . . . . 25
Penpile Method . . . . . . . . . . . . . . . . . . . . . . . . . . . . . . . . . . . . . . . . . . . . . . . . . . 27
DOTD STATIC METHOD ("-METHOD) . . . . . . . . . . . . . . . . . . . . . . . . . . . . . . . . . . . 27
SOIL CLASSIFICATION BY CPT . . . . . . . . . . . . . . . . . . . . . . . . . . . . . . . . . . . . . . . . 32
METHODOLOGY . . . . . . . . . . . . . . . . . . . . . . . . . . . . . . . . . . . . . . . . . . . . . . . . . . . . . . . . . . . . 37

x
COLLECTION AND EVALUATION OF PILE LOAD TEST REPORTS . . . . . . . . . . . . 37
COMPILATION AND ANALYSIS OF PILE LOAD TEST REPORTS . . . . . . . . . . . . . . 39
Site Data . . . . . . . . . . . . . . . . . . . . . . . . . . . . . . . . . . . . . . . . . . . . . . . . . . . . . . . . 39
Soil Data . . . . . . . . . . . . . . . . . . . . . . . . . . . . . . . . . . . . . . . . . . . . . . . . . . . . . . . . 39
Foundation Data . . . . . . . . . . . . . . . . . . . . . . . . . . . . . . . . . . . . . . . . . . . . . . . . . . 40
CPT Data . . . . . . . . . . . . . . . . . . . . . . . . . . . . . . . . . . . . . . . . . . . . . . . . . . . . . . . 40
ANALYSIS OF ULTIMATE CAPACITY OF PILES FROM LOAD TEST . . . . . . . . . . . 40
INTERPRETATION OF SOIL PROFILE FROM CPT . . . . . . . . . . . . . . . . . . . . . . . . . . 42
ANALYSIS OF PILES USING THE CPT METHODS . . . . . . . . . . . . . . . . . . . . . . . . . . 42
ANALYSIS OF PILE CAPACITY USING STATIC METHODS . . . . . . . . . . . . . . . . . . 42
ANALYSIS OF RESULTS . . . . . . . . . . . . . . . . . . . . . . . . . . . . . . . . . . . . . . . . . . . . . . . . . . . . . . 43
CHARACTERIZATION OF THE INVESTIGATED PILES . . . . . . . . . . . . . . . . . . . . . . 43
PREDICTED VERSUS MEASURED PILE CAPACITY . . . . . . . . . . . . . . . . . . . . . . . . . 44
STATISTICAL ANALYSES . . . . . . . . . . . . . . . . . . . . . . . . . . . . . . . . . . . . . . . . . . . . . . 75
EVALUATION OF THE CPT METHODS . . . . . . . . . . . . . . . . . . . . . . . . . . . . . . . . . . . 83
COST AND BENEFIT ANALYSIS . . . . . . . . . . . . . . . . . . . . . . . . . . . . . . . . . . . . . . . . . 87
CPT versus Traditional Subsurface Exploration Methods . . . . . . . . . . . . . . . . . . 87
Pile Length Savings in Projects with Pile Load Test . . . . . . . . . . . . . . . . . . . . . . 88
CONCLUSIONS . . . . . . . . . . . . . . . . . . . . . . . . . . . . . . . . . . . . . . . . . . . . . . . . . . . . . . . . . . . . . . 89
RECOMMENDATIONS . . . . . . . . . . . . . . . . . . . . . . . . . . . . . . . . . . . . . . . . . . . . . . . . . . . . . . . 91
REFERENCES . . . . . . . . . . . . . . . . . . . . . . . . . . . . . . . . . . . . . . . . . . . . . . . . . . . . . . . . . . . . . . . 93
APPENDIX . . . . . . . . . . . . . . . . . . . . . . . . . . . . . . . . . . . . . . . . . . . . . . . . . . . . . . . . . . . . . . . . . 95
xi
LIST OF FIGURES
Figure 1: CPT systems managed by LTRC . . . . . . . . . . . . . . . . . . . . . . . . . . . . . . . . . . . . . . . . . . . 2
Figure 2: The electric cone penetrometer . . . . . . . . . . . . . . . . . . . . . . . . . . . . . . . . . . . . . . . . . . . 11
Figure 3: Calculation of the average cone tip resistance in Schmertmann method . . . . . . . . . . . . 13
Figure 4: Penetration design curves for pile side friction in clay in Schmertmann method . . . . . . 15
Figure 5: Penetration design curves for pile side friction in sand in Schmertmann method . . . . . 15
Figure 6: Calculation of the equivalent average tip resistance for LCPC method . . . . . . . . . . . . . 18
Figure 7: Maximum friction curves for LCPC method . . . . . . . . . . . . . . . . . . . . . . . . . . . . . . . . . 22
Figure 8: Bearing capacity factor Nc for foundation in clay . . . . . . . . . . . . . . . . . . . . . . . . . . . . . 29
Figure 9: Limiting adhesion for piles in soft clays . . . . . . . . . . . . . . . . . . . . . . . . . . . . . . . . . . . . 29
Figure 10: Relationship between "-coefficient and angle of internal friction for cohesionless soils
. . . . . . . . . . . . . . . . . . . . . . . . . . . . . . . . . . . . . . . . . . . . . . . . . . . . . . . . . . . . . . . . . . . . . 30
Figure 11: Estimating the bearing capacity factor NqN . . . . . . . . . . . . . . . . . . . . . . . . . . . . . . . . . . 30
Figure 12: Relationship between the maximum unit tip bearing capacity and friction angle for
cohesionless soils . . . . . . . . . . . . . . . . . . . . . . . . . . . . . . . . . . . . . . . . . . . . . . . . . . . . . . . 31
Figure 13: Soil classification chart for standard electric friction cone . . . . . . . . . . . . . . . . . . . . . 33
Figure 14: Simplified classification chart by Robertson and Campanella for standard electric
friction cone . . . . . . . . . . . . . . . . . . . . . . . . . . . . . . . . . . . . . . . . . . . . . . . . . . . . . . . . . . . 34
Figure 15: Soil classification using the probabilistic region estimation method . . . . . . . . . . . . . . 35
Figure 16: Louisiana state map with approximate locations of the analyzed piles . . . . . . . . . . . . 38
Figure 17: Load-settlement curve for 30 in square PPC pile (TP1) at Tickfaw River Bridge . . . 41
Figure 18: Comparison of measured and ultimate pile capacity predicted by Schmertmann method
. . . . . . . . . . . . . . . . . . . . . . . . . . . . . . . . . . . . . . . . . . . . . . . . . . . . . . . . . . . . . . . . . . . . . 57
Figure 19: Comparison of measured and ultimate pile capacity predicted by de Ruiter and
Beringen method . . . . . . . . . . . . . . . . . . . . . . . . . . . . . . . . . . . . . . . . . . . . . . . . . . . . . . . . 58
Figure 20: Comparison of measured and ultimate pile capacity predicted by LCPC method . . . . 59
Figure 21: Comparison of measured and ultimate pile capacity predicted by Tumay and Fakhroo
method . . . . . . . . . . . . . . . . . . . . . . . . . . . . . . . . . . . . . . . . . . . . . . . . . . . . . . . . . . . . . . . 60
Figure 22: Comparison of measured and ultimate pile capacity predicted by Philipponnat method
. . . . . . . . . . . . . . . . . . . . . . . . . . . . . . . . . . . . . . . . . . . . . . . . . . . . . . . . . . . . . . . . . . . . . 61
Figure 23 Comparison of measured and ultimate pile capacity predicted by Aoki and De Alencar
method . . . . . . . . . . . . . . . . . . . . . . . . . . . . . . . . . . . . . . . . . . . . . . . . . . . . . . . . . . . . . . . 62
Figure 24: Comparison of measured and ultimate pile capacity predicted by Price and Wardle
method . . . . . . . . . . . . . . . . . . . . . . . . . . . . . . . . . . . . . . . . . . . . . . . . . . . . . . . . . . . . . . . 63
xii
Figure 25: Comparison of measured and ultimate pile capacity predicted by the penpile method
. . . . . . . . . . . . . . . . . . . . . . . . . . . . . . . . . . . . . . . . . . . . . . . . . . . . . . . . . . . . . . . . . . . . . 64
Figure 26: Comparison of measured and ultimate pile capacity predicted by "-method . . . . . . . 65
Figure 27: Predicted versus measured ultimate pile capacity - Schmertmann method . . . . . . . . . 66
Figure 28: Predicted versus measured ultimate pile capacity - de Ruiter and Beringen method . 67
Figure 29: Predicted versus measured ultimate pile capacity - LCPC method . . . . . . . . . . . . . . 68
Figure 30: Predicted versus measured ultimate pile capacity - Tumay and Fakhroo method . . . . 69
Figure 31: Predicted versus measured ultimate pile capacity - Philipponnat method . . . . . . . . . . 70
Figure 32: Predicted versus measured ultimate pile capacity - Aoki and De Alencar method . . 71
Figure 33: Predicted versus measured ultimate pile capacity - Price and Wardle method . . . . . . 72
Figure 34: Predicted versus measured ultimate pile capacity - penpile method . . . . . . . . . . . . . 73
Figure 35: Predicted versus measured ultimate pile capacity - "-method . . . . . . . . . . . . . . . . . . 74
Figure 36: Probability distribution of Qp/Qm for all methods . . . . . . . . . . . . . . . . . . . . . . . . . . . . 77
Figure 37: Cumulative probability plot for Qp/Qm using Schmertmann method . . . . . . . . . . . . . . 78
Figure 38: Cumulative probability plot for Qp/Qm using de Ruiter and Beringen method . . . . . . 78
Figure 39: Cumulative probability plot for Qp/Qm using LCPC method . . . . . . . . . . . . . . . . . . . . 79
Figure 40: Cumulative probability plot for Qp/Qm using Tumay and Fakhroo method . . . . . . . . . 79
Figure 41: Cumulative probability plot for Qp/Qm using Philipponnat method . . . . . . . . . . . . . . . 80
Figure 42: Cumulative probability plot for Qp/Qm using Aoki and De Alencar method . . . . . . . . 80
Figure 43: Cumulative probability plot for Qp/Qm using Price and Wardle method . . . . . . . . . . 81
Figure 44: Cumulative probability plot for Qp/Qm using the penpile method . . . . . . . . . . . . . . . 81
Figure 45: Cumulative probability plot for Qp/Qm using the " method . . . . . . . . . . . . . . . . . . . 82
Figure 46: Comparison of the different prediction methods in terms of prediction accuracy . . . . 85
Figure 47: The main menu of the Computer Program Louisiana Pile Design by Cone Penetration
Test (LPD-CPT) developed in the current study. . . . . . . . . . . . . . . . . . . . . . . . . . . . . . . . 97
Figure 48: The data file menu of program LPD-CPT that allows the user to view, open, and then
plot a CPT dat . . . . . . . . . . . . . . . . . . . . . . . . . . . . . . . . . . . . . . . . . . . . . . . . . . . . . . . . . . 97
Figure 49: CPT data file viewed using the View Data File menu . . . . . . . . . . . . . . . . . . . . . . . . . 98
Figure 50: Plot of the CPT data file obtained using the Plot Cone Data menu . . . . . . . . . . . . . . . 98
Figure 51: Probabilistic Soil classification obtained from CPT data . . . . . . . . . . . . . . . . . . . . . 99
Figure 52: Pile Design Menu of the program LPD-CPT . . . . . . . . . . . . . . . . . . . . . . . . . . . . . . . . 99
Figure 53: Variation of ultimate load carrying capacity of the pile with depth using three different
design methods . . . . . . . . . . . . . . . . . . . . . . . . . . . . . . . . . . . . . . . . . . . . . . . . . . . . . . . . . . . . . . 100
Figure 54: Variation of the ultimate load carrying capacity of the pile using Schmertmann method
. . . . . . . . . . . . . . . . . . . . . . . . . . . . . . . . . . . . . . . . . . . . . . . . . . . . . . . . . . . . . . . . . . . . 100
xiii
LIST OF TABLES
Table 1: LCPC bearing capacity factor (kb ) . . . . . . . . . . . . . . . . . . . . . . . . . . . . . . . . . . . . . . . . . 17
Table 2: Pile categories for LCPC method . . . . . . . . . . . . . . . . . . . . . . . . . . . . . . . . . . . . . . . . . . 19
Table 3: Input parameters for clay and silt for LCPC method . . . . . . . . . . . . . . . . . . . . . . . . . . . . 20
Table 4: Input parameters for sand and gravel for LCPC method . . . . . . . . . . . . . . . . . . . . . . . . . 21
Table 5: Empirical factors Fb and Fs . . . . . . . . . . . . . . . . . . . . . . . . . . . . . . . . . . . . . . . . . . . . . . 24
Table 6: The empirical factor "s values for different soil types . . . . . . . . . . . . . . . . . . . . . . . . . . 24
Table 7: Bearing capacity factor (kb) . . . . . . . . . . . . . . . . . . . . . . . . . . . . . . . . . . . . . . . . . . . . . . 26
Table 8: Empirical factor Fs . . . . . . . . . . . . . . . . . . . . . . . . . . . . . . . . . . . . . . . . . . . . . . . . . . . . . 26
Table 9: Friction limit factors for concrete piles . . . . . . . . . . . . . . . . . . . . . . . . . . . . . . . . . . . . . 28
Table 10: Properties of square PPC piles used in DOTD projects . . . . . . . . . . . . . . . . . . . . . . . . 39
Table 11:Number of PPC piles investigated based on pile type, soil type, and load test . . . . . . . 43
Table 12: Results of the analyses conducted on square precast prestressed concrete pile driven
into Louisiana soils . . . . . . . . . . . . . . . . . . . . . . . . . . . . . . . . . . . . . . . . . . . . . . . . . . . . . . 45
Table 13: Evaluation of the performance of the different predictive methods considered in the
study . . . . . . . . . . . . . . . . . . . . . . . . . . . . . . . . . . . . . . . . . . . . . . . . . . . . . . . . . . . . . . . . . . . . . . 86

xiv

xv

xvi

1
INTRODUCTION
Among the different in situ tests, cone penetration test (CPT) is considered the most frequently
used method for characterization of geomedia. The CPT is basically advancing a cylindrical rod
with a cone tip into the soil and measuring the tip resistance and sleeve friction due to this
intrusion. The resistance parameters are used to classify soil strata and to estimate strength and
deformation characteristics of soils. Different devices added to cone penetrometers made it
possible to apply this test for a wide range of geotechnical applications.
The CPT is a simple, quick, and economical test that provides reliable in situ continuous
soundings of subsurface soil. Due to the soft nature of soil deposits in Louisiana, the CPT is
considered a perfect tool for site characterization. Three CPT systems operate for the Louisiana
Department of Transportation and Development (DOTD). These systems are Louisiana Electric
Cone Penetration System (LECOPS), Research Vehicle for Geotechnical Insitu Testing and
Support (REVEGITS), and Continuous Intrusion Miniature Cone Penetration Test system
(CIMCPT). The CIMCPT system and REVEGITS are managed by the Louisiana Transportation
Research Center (LTRC). Figure 1 depicts a photograph of the CIMCPT system and REVEGITS.
Deep foundations are usually used when the conditions of the upper soil layers are weak and
unable to support the superstructural loads. Piles carry these superstructural loads deep in the
ground. Therefore, the safety and stability of pile supported structures depend on the behavior of
piles. Most soil deposits in southern Louisiana are soft in nature. In addition, the high percentage
of wetlands, marshes, swamps, bayous, rivers, and lakes makes it necessary to consider deep
foundations in the design of transportation infrastructure. Therefore, pile foundations are used by
DOTD to support highway bridges and other transportation structures. The square precast
prestressed concrete piles (PPC) are the most common piles currently used in DOTD projects.
Piles are expensive structural members, and pile projects are always costly. For example, DOTD
spent about $19 million for driven piles in Louisiana in 1995 (DOTD Weighted Averages, 1996).
Current DOTD practice of pile design is based on the static analysis ("-method) and some times in
conjunction with the dynamic analysis using the Pile Driving AnalyzerTM . Soil properties are
needed as input parameters for the static analysis. Therefore, it is necessary to conduct field and
laboratory tests, which include soil boring, standard penetration test, unconfined compression test,
soil classification, etc. Running these field and laboratory tests is

2
(a) Louisiana cone penetration test systems: the CIMCPT on the right and REGEVITS on the left
(b) The hydraulic push system of the REVEGITS
Figure 1 CPT systems managed by LTRC
3
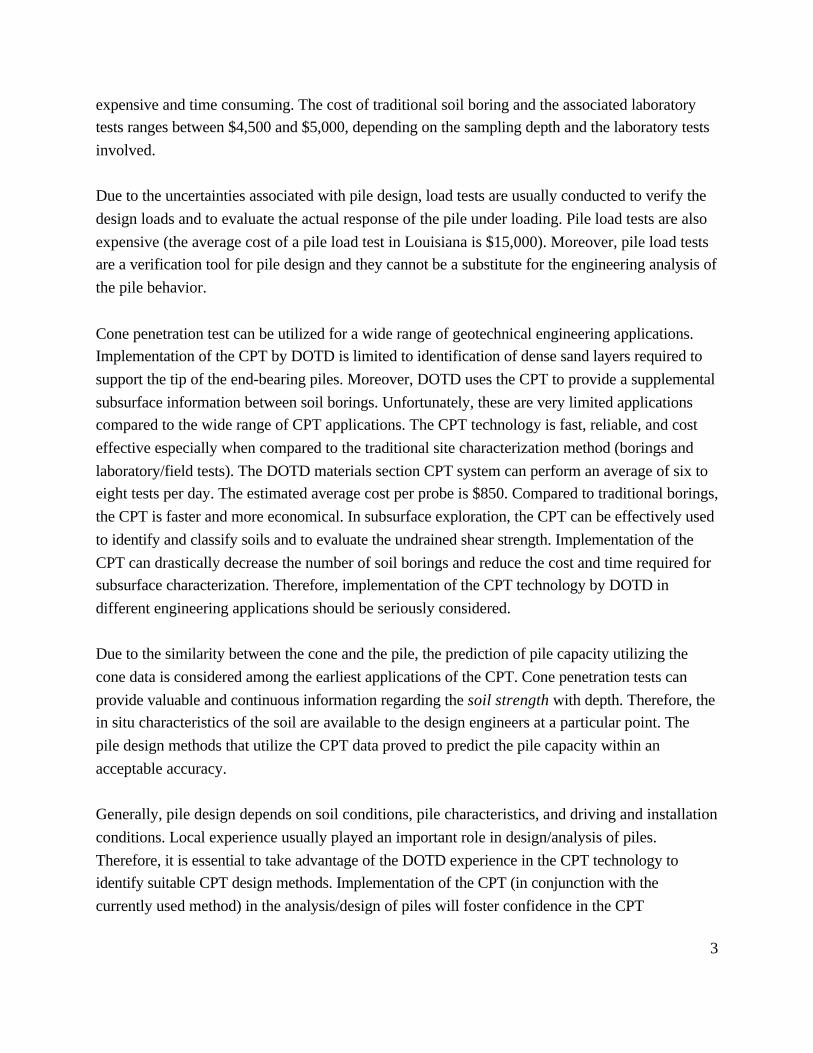
expensive and time consuming. The cost of traditional soil boring and the associated laboratory
tests ranges between $4,500 and $5,000, depending on the sampling depth and the laboratory tests
involved.
Due to the uncertainties associated with pile design, load tests are usually conducted to verify the
design loads and to evaluate the actual response of the pile under loading. Pile load tests are also
expensive (the average cost of a pile load test in Louisiana is $15,000). Moreover, pile load tests
are a verification tool for pile design and they cannot be a substitute for the engineering analysis of
the pile behavior.
Cone penetration test can be utilized for a wide range of geotechnical engineering applications.
Implementation of the CPT by DOTD is limited to identification of dense sand layers required to
support the tip of the end-bearing piles. Moreover, DOTD uses the CPT to provide a supplemental
subsurface information between soil borings. Unfortunately, these are very limited applications
compared to the wide range of CPT applications. The CPT technology is fast, reliable, and cost
effective especially when compared to the traditional site characterization method (borings and
laboratory/field tests). The DOTD materials section CPT system can perform an average of six to
eight tests per day. The estimated average cost per probe is $850. Compared to traditional borings,
the CPT is faster and more economical. In subsurface exploration, the CPT can be effectively used
to identify and classify soils and to evaluate the undrained shear strength. Implementation of the
CPT can drastically decrease the number of soil borings and reduce the cost and time required for
subsurface characterization. Therefore, implementation of the CPT technology by DOTD in
different engineering applications should be seriously considered.
Due to the similarity between the cone and the pile, the prediction of pile capacity utilizing the
cone data is considered among the earliest applications of the CPT. Cone penetration tests can
provide valuable and continuous information regarding the soil strength with depth. Therefore, the
in situ characteristics of the soil are available to the design engineers at a particular point. The
pile design methods that utilize the CPT data proved to predict the pile capacity within an
acceptable accuracy.
Generally, pile design depends on soil conditions, pile characteristics, and driving and installation
conditions. Local experience usually played an important role in design/analysis of piles.
Therefore, it is essential to take advantage of the DOTD experience in the CPT technology to
identify suitable CPT design methods. Implementation of the CPT (in conjunction with the
currently used method) in the analysis/design of piles will foster confidence in the CPT
4
technology. With time and experience, the role of the CPT can be increased while the role of
traditional subsurface exploration is reduced.
This report presents the research effort undertaken at LTRC to identify the most appropriate CPT
methods for predicting the axial load carrying capacity of piles driven into Louisiana soils. To
achieve this goal, state projects that have both pile load tests and CPT soundings were identified
and collected from DOTD files. Pile load test reports were selected based on selection criteria,
compiled onto sheets, and analyzed. The ultimate axial load carrying capacity for each pile was
determined using the Butler-Hoy method, which is the primary load test interpretation method used
by DOTD [1]. The CPT soundings close to the test pile location were identified and used to
predict the ultimate pile capacity. Eight methods for predicting the ultimate pile capacity by CPT
were selected. These methods are: Schmertmann, de Ruiter and Beringen, Bustamante and
Gianeselli (LCPC/LCP), Tumay and Fakhroo, Aoki and De Alencar, Price and Wardle,
Philipponnat, and the penpile method [2], [3], [4], [5], [6], [7], [8], [9]. The ultimate pile load
carrying capacities predicted by the CPT methods were compared with the ultimate capacities
obtained from pile load tests using Butler-Hoy method [1]. Statistical analyses were conducted to
identify the most appropriate CPT method for predicting the ultimate capacity of the investigated
piles.
In order to facilitate the implementation of the CPT capacity prediction methods, a Visual Basic
MS-Windows program was developed and called Louisiana Pile Design by CPT(LPD-CPT). The
program performs the analyses on the CPT soundings using the selected CPT method and provides
the design engineers with pile ultimate capacity profile with depth.
In the current research, the existing data acquisition systems on the DOTD CPT systems are
approaching obsolescence due primarily to the MS-DOS based applications required to operate
the systems. Therefore, the data acquisition systems and software were updated to take advantage
of the new available technologies and to provide DOTD personnel with better performance
systems.

5
OBJECTIVE
The goal of this research is to identify the most appropriate methods for estimating the ultimate
axial load carrying capacity of piles from the cone penetration test data.
To achieve the objective of this research, the following tasks were executed:
i. Identification of the state projects that have both pile load test and cone penetration
soundings close to the pile location. A total of 60 pile load test reports were collected
from DOTD files based on this criterion.
ii. Comprehensive literature review to investigate and evaluate methods of estimating the
load carrying capacity of piles using cone penetration test data.
iii. Identification of the most reliable CPT methods based on their ability to predict the load
carrying capacity of square PPC piles driven into Louisiana soils.
iv. Implementation of these methods into MS-Windows based program, LPD-CPT, to facilitate
their use by DOTD design engineers.

6
7
SCOPE
This research effort was focused on the applicability of eight CPT methods to predict the ultimate
axial compression load carrying capacity of piles from CPT data. These methods are described in
detail in the Background section of this report. The predicted capacity was compared to the
reference pile load capacity obtained from the pile load test using Butler-Hoy method [1].
The CPT methods were used to investigate the load carrying capacity of square precast
prestressed concrete (PPC) piles of different sizes driven into Louisiana soils. Other pile types
such as timber piles and steel pipes were not covered in the current analyses. Moreover, the
analyses were conducted only on piles that were loaded to failure during the load test.
The CPT data used in this report are those acquired by the 10 and 15 cm2 friction cone
penetrometers. In these tests the total cone tip resistance (qc) and sleeve friction (fs) were recorded
and no pore water pressures were measured. However, the selected CPT methods used in this
investigation were developed based on the total cone tip resistance (qc) and sleeve friction (fs).

8

9
Q Q Q q A fAu t s t t s= + = + (1)
BACKGROUND
PILE FOUNDATIONS
Piles are relatively long and generally slender structural foundation members that transmit
superstructure loads to deep soil layers. In geotechnical engineering, piles usually serve as
foundations when soil conditions are not suitable for the use of shallow foundations.
Moreover, piles have other applications in deep excavations and in slope stability. As presented
in the literature, piles are classified according to:
a. the nature of load support (friction and end-bearing piles),
b. the displacement properties (full-displacement, partial-displacement, and
non-displacement piles), and
c. the composition of piles (timber, concrete, steel, and composite piles).
The behavior of the pile depends on many different factors, including pile characteristics, soil
conditions and properties, installation method, and loading conditions. The performance of piles
affects the serviceability of the structure they support.
The prediction of pile load carrying capacity can be achieved using different methods such as pile
load test, dynamic analysis, static analysis based on soil properties from laboratory tests, and
static analysis utilizing the results of in situ tests such as cone penetration test.
In the design and analysis of piles, it is important to identify piles based on the nature of support
provided by the surrounding soil, i.e. to classify piles as end-bearing piles and friction piles.
While end-bearing piles transfer most of their loads to an end-bearing stratum, friction piles resist
a significant portion of their loads via the skin friction developed along the surface of the piles.
The behavior of friction piles mainly depends on the interaction between the surrounding soil and
the pile shaft.
The ultimate axial load carrying capacity of the pile (Qu) composed of the end-bearing capacity of
the pile (Qt) and the shaft friction capacity (Qs). The general equation described in the literature is
given by:
10
F Sdu=
. .(2)
where qt is the unit tip bearing capacity, At is the area of the pile tip, f is the unit skin friction, and
As is the area of the pile shaft. In sands, the end-bearing capacity (Qt) dominates, while in soft
clays the shaft friction capacity (Qs) dominates. The design load carrying capacity (Qd) of the pile
can be calculated by:
where Qu is the ultimate load carrying capacity and F.S. is the factor of safety.
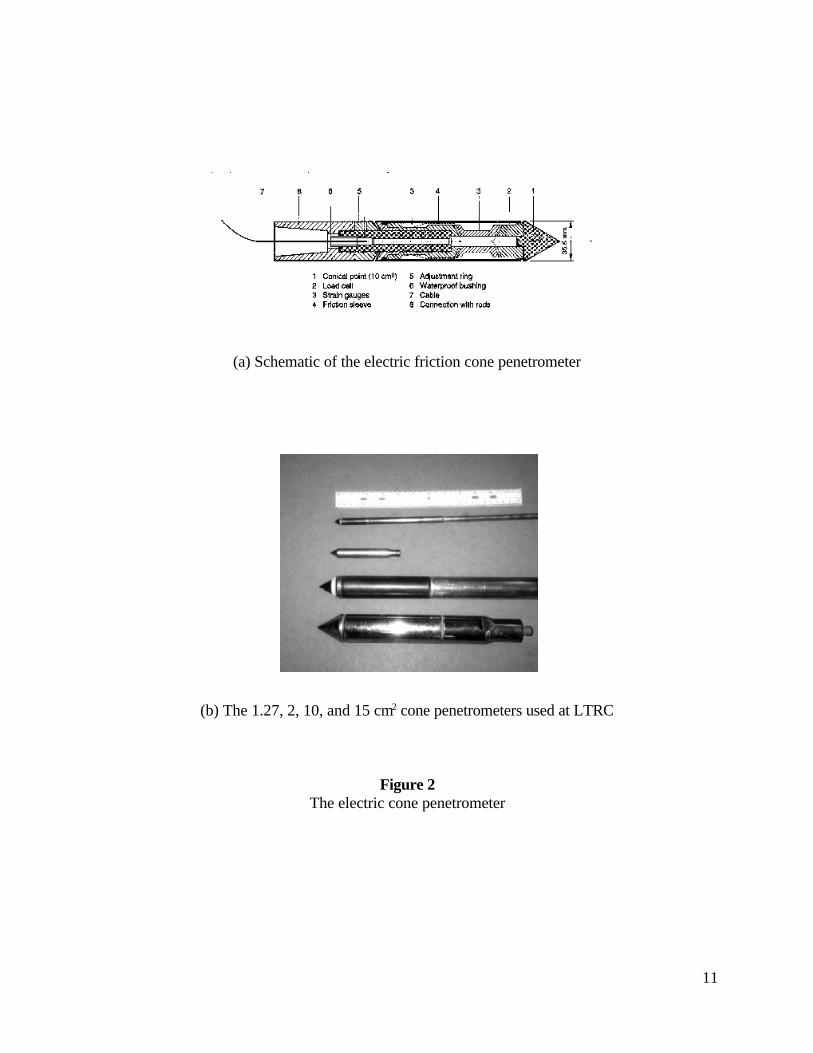
CONE PENETRATION TEST
The cone penetration test has been recognized as one of the most widely used in situ tests. In the
United States, cone penetration testing has gained rapid popularity in the past twenty years. The
cone penetration test consists of advancing a cylindrical rod with a conical tip into the soil and
measuring the forces required to push this rod. The friction cone penetrometer measures two forces
during penetration. These forces are: the total tip resistance (qc), which is the soil resistance to
advance the cone tip and the sleeve friction (fs), which is the sleeve friction developed between
the soil and the sleeve of the cone penetrometer. The friction ratio (Rf) is defined as the ratio
between the sleeve friction and tip resistance and is expressed in percent. A schematic of the
electric cone penetrometer is depicted in figure 2. The resistance parameters are used to classify
soil strata and to estimate strength and deformation characteristics of soils.
The cone penetration test data has been used to predict the ultimate axial pile load carrying
capacity. Several methods are available in the literature to predict the axial pile capacity utilizing
the CPT data. These methods can be classified into two well-known approaches:
(1) Direct approach in which
• The unit tip bearing capacity of the pile (qt) is evaluated from the cone tip
resistance (qc) profile.
• The unit skin friction of the pile (f) is evaluated from either the sleeve friction (fs)
profile or the cone tip resistance (qc) profile.
(2) Indirect approach: in which the CPT data (qc and fs) are first used to evaluate the soil strength
parameters such as the undrained shear strength (Su) and the angle of internal friction (N). These
11
(a) Schematic of the electric friction cone penetrometer
(b) The 1.27, 2, 10, and 15 cm2 cone penetrometers used at LTRC
Figure 2The electric cone penetrometer
12
qq q
tc c= +1 2
2(3)
f fc s= α (4)
parameters are then used to evaluate the unit tip bearing capacity of the pile (qt) and the unit skin
friction of the pile (f) using formulas derived based on semi-empirical/theoretical methods.
In the current research, only the direct methods of predicting the pile capacity from cone
penetration test data are investigated.
PREDICTION OF PILE CAPACITY BY CPT
In this report, the direct methods are described in detail. These methods are Schmertmann, de
Ruiter and Beringen, Bustamante and Gianeselli (LCPC/LPC), Tumay and Fakhroo (cone-m), Aoki
and De Alencar, Price and Wardle, Philipponnat, and the penpile method [2], [3], [4], [5], [6], [7],
[8], [9]. The direct CPT methods evaluate the unit tip bearing capacity of the pile (qt) from the
measured cone tip resistance (qc) by averaging the cone tip resistance over an assumed influence
zone. The unit shaft resistance (f) is either evaluated from the measured sleeve friction (fs) in some
methods or from the measured cone tip resistance (qc) in others.
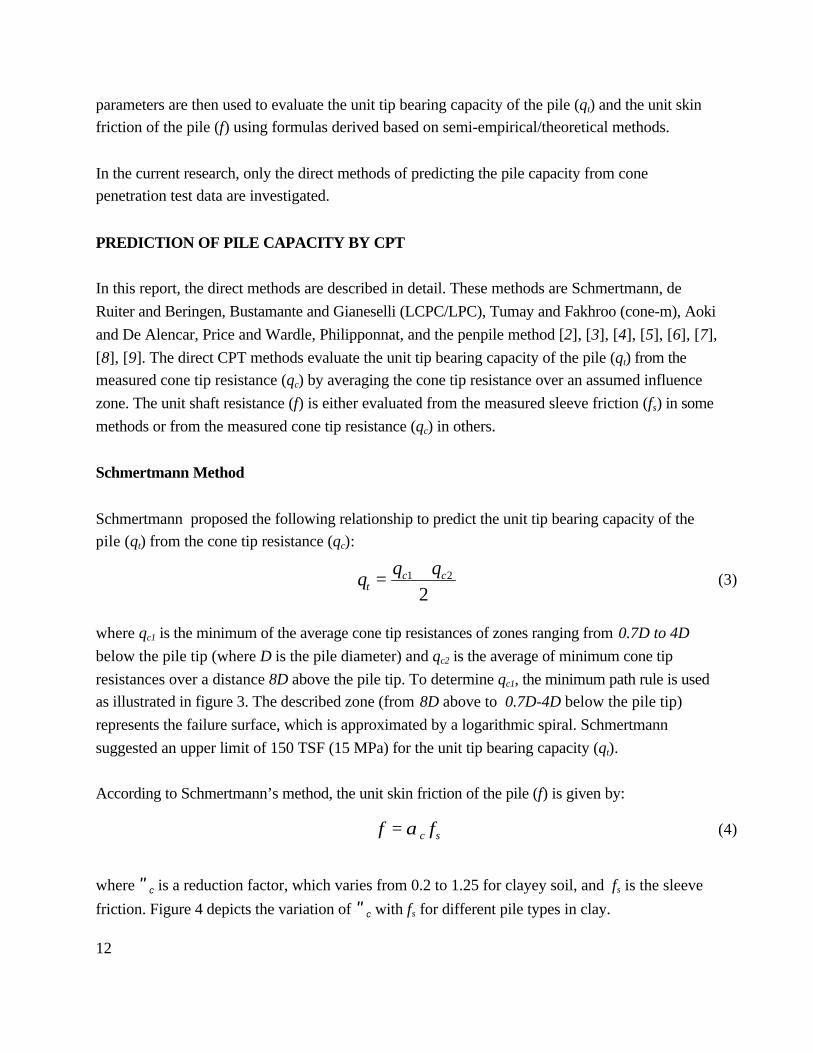
Schmertmann Method
Schmertmann proposed the following relationship to predict the unit tip bearing capacity of the
pile (qt) from the cone tip resistance (qc):
where qc1 is the minimum of the average cone tip resistances of zones ranging from 0.7D to 4D
below the pile tip (where D is the pile diameter) and qc2 is the average of minimum cone tip
resistances over a distance 8D above the pile tip. To determine qc1, the minimum path rule is used
as illustrated in figure 3. The described zone (from 8D above to 0.7D-4D below the pile tip)
represents the failure surface, which is approximated by a logarithmic spiral. Schmertmann
suggested an upper limit of 150 TSF (15 MPa) for the unit tip bearing capacity (qt).
According to Schmertmann’s method, the unit skin friction of the pile (f) is given by:
where "c is a reduction factor, which varies from 0.2 to 1.25 for clayey soil, and fs is the sleeve
friction. Figure 4 depicts the variation of "c with fs for different pile types in clay.
e
D
ac
bb
Envelope of minimum qc values
yD
?
'x'
8D
qc1 = Average qc over adistance of yD below the piletip (path a-b-c). Sum qc values in both the downward(path a-b) and upward(path b-c) directions. Useactual qc values along path a-band the minimum path rulealong path b-c. Compute qc1 for y values from 0.7 and 4.0and use the minimum qc1 values obtained.
qc2 = Average qc over adistance of 8D above the piletip (path c-e). Usethe minimum path rule as for path b-c in the qc1 computations. Ignore any minor 'x' peakdepressions if in sand,but include in minimum path if in clay.
Cone resistance qc
Dep
th
qt = qc1 + qc2
2
Calculation of the average cone tip resistance in Schmertmann method [2]Figure 3
13
14
QyD
f A f As s s s s sy D
L
y
D
= +
==∑∑α
8 80
8
(5)
q N S tip
S tipq tip
N
t c u
uc
k
=
=
( )
( )( ) (6)
f S sideu= β ( ) (7)
For piles in sand, the friction capacity (Qs) is obtained by:
where "s is the correction factor for sand, which can be obtained from figure 5, y is the depth at
which side resistance is calculated, and L is the pile length.
Schmertmann suggested a limit of 1.2 TSF (120 kPa) on f.
de Ruiter and Beringen Method
This method is proposed by de Ruiter and Beringen and is based on the experience gained in the
North Sea [3]. This method is also known as the European method and uses different procedures
for clay and sand.
In clay, the undrained shear strength (Su) for each soil layer is first evaluated from the cone tip
resistance (qc). Then, the unit tip bearing capacity and the unit skin friction are computed by
applying suitable multiplying factors. The unit tip bearing capacity is given by:
where Nc is the bearing capacity factor and Nc=9 is considered by this method. Nk is the cone
factor that ranges from 15 to 20, depending on the local experience. qc(tip) is the average of cone
tip resistances around the pile tip computed similar to Schmertmann method.
The unit skin friction is given by:
where $ is the adhesion factor, $=1 for normally consolidated (NC) clay, and $ =0.5 for

Penetration design curves for pile side friction in clay in Schmertmann method [2]
0 10 20 30 40
Pile depth to width ratio, D/B
0.0
0.5
1.0
1.5
2.0
αs
square concrete piles
Penetrometer design curve for side pile friction in sand in Schmertmann method [2]
0.00 0.25 0.50 0.75 1.00 1.25 1.50 1.75 2.00
Penetrometer sleeve friction - fs (kg/cm2)
0.0
0.2
0.4
0.6
0.8
1.0
1.2
1.4P
enet
rom
eter
to p
ile fr
ictio
n ra
tio -
αc
Concrete & Timber Piles
Steel Piles
Figure 4
Figure 5
15

16
S sideq side
Nuc
k
( )( )= (8)
q k q tipt b eq= ( ) (10)
f
fq side
q side
s
c
c
=
min
( )
( )
.
300
40012
(compression)
(tension)
TSF (120kPa)
(9)
overconsolidated (OC) clay. Su(side), the undrained shear strength for each soil layer along the
pile shaft, is determined by:
where qc(side) is the average cone tip resistance along the soil layer.
In the current study, the cone factor Nk=20 and the adhesion factor $ =0.5 were adopted in the
analysis, since these values gave better predicted ultimate pile capacity for the investigated piles.
In sand, the unit tip bearing capacity of the pile (qt) is calculated similar to Schmertmann method.
The unit skin friction (f) for each soil layer along the pile shaft is given by:
de Ruiter and Beringen imposed limits on qt and f in which qt# 150 TSF (15 MPa) and f# 1.2 TSF
(120 kPa).
Bustamante and Gianeselli Method (LCPC/LCP Method)
Bustamante and Gianeselli proposed this method for the French Highway Department based on the
analysis of 197 pile load tests with a variety of pile types and soil conditions [4]. It is also known
as the French method and the LCPC/LCP method. In this method, both the unit tip bearing capacity
(qt) and the unit skin friction (f) of the pile are obtained from the cone tip resistance (qc). The
sleeve friction (fs) is not used. The unit tip bearing capacity of the pile (qt) is predicted from the
following equation:

17
where kb is an empirical bearing capacity factor that varies from 0.15 to 0.60 depending on the soil
type and pile installation procedure (table 1) and qeq(tip) is the equivalent average cone tip
resistance around the pile tip, which is obtained as follows:
1. calculate the average tip resistance (qca) at the tip of the pile by averaging qc values over a
zone ranging from 1.5D below the pile tip to 1.5D above the pile tip (D is the pile
diameter),
2. eliminate qc values in the zone that are higher than 1.3qca and those are lower than 0.7qca as
shown in figure 6, and
3. calculate the equivalent average cone tip resistance (qeq(tip)) by averaging the remaining
cone tip resistance (qc) values over the same zone (bordered by thick lines in figure 6).
The pile unit skin friction (f) in each soil layer is estimated from the equivalent cone tip resistance
(qeq(side)) of the soil layer, soil type, pile type, and installation procedure. The following
procedure explains how to determine the unit skin friction (f):
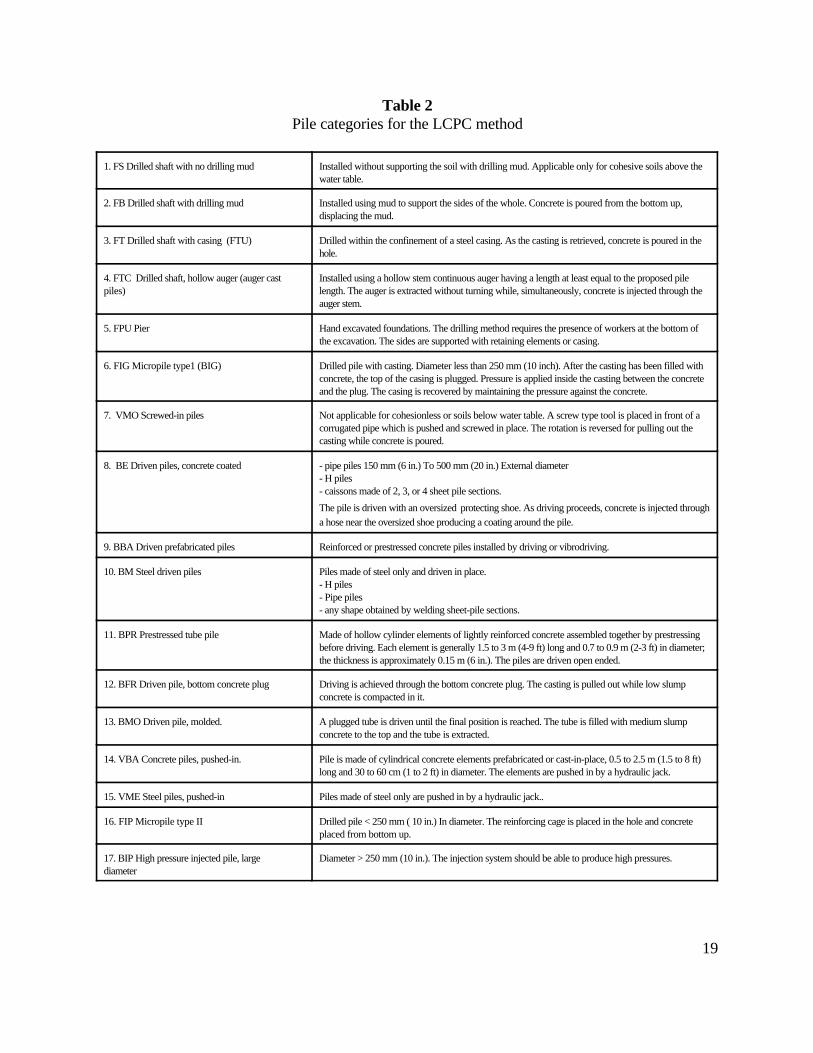
A. based on the pile type, select the pile category from table 2 (for example, pile category is 9
for square PPC piles),
B. for each soil layer, select the appropriate curve number (tables 3 and 4) based on soil type,
equivalent cone tip resistance along the soil layer (qeq(side)), and pile category, use table 3
for clay and silt and table 4 for sand and gravel,
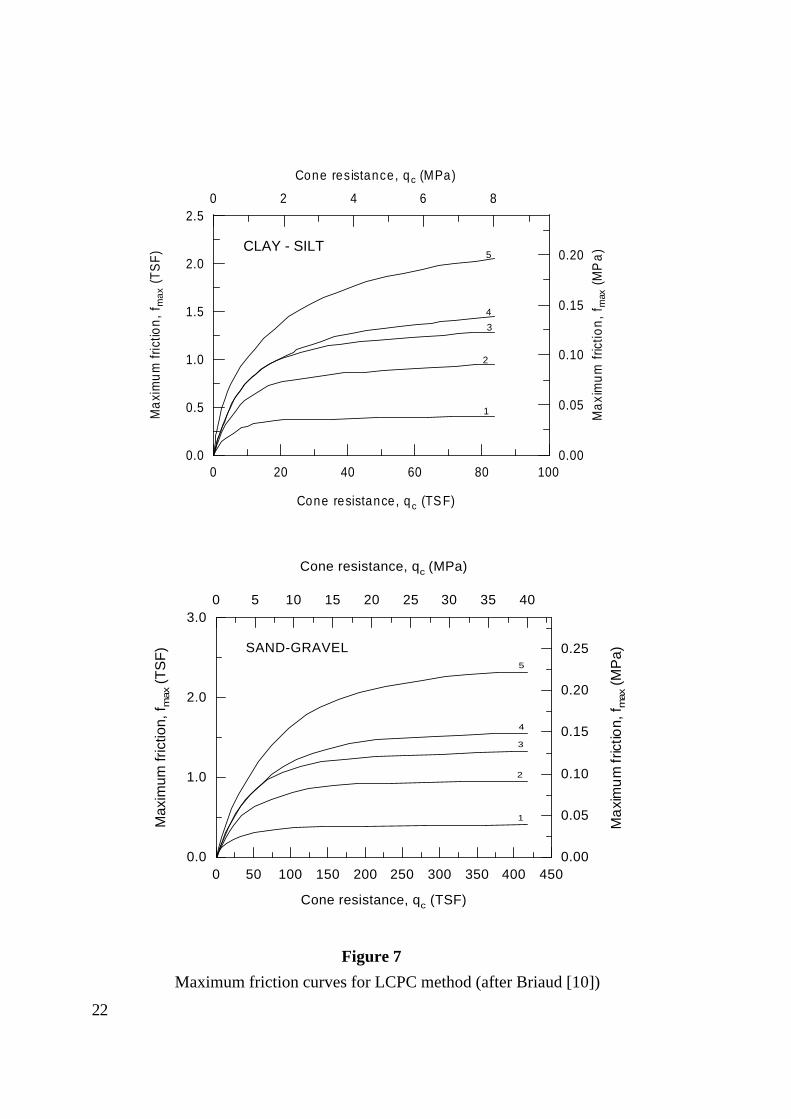
C. from figure 7, use the selected curve number and the equivalent cone tip resistance
(qeq(side)) to obtain the maximum unit skin friction (f), use figure 7a for clay and silt and
figure 7b for sand and gravel.
Table 1
LCPC bearing capacity factor (kb )
Soil Type Bored Piles Driven Piles
Clay-Silt 0.375 0.60
Sand-Gravel 0.15 0.375
Chalk 0.20 0.40

Pile
a=1.5 D
0.7q'ca
q'ca1.3q'ca
qc
Dep
th
aa
qeq
D
Calculation of the equivalent average tip resistance for LCPC method (after Bustamante and Gianeselli [4])
Figure 6
18
19
Table 2Pile categories for the LCPC method
1. FS Drilled shaft with no drilling mud Installed without supporting the soil with drilling mud. Applicable only for cohesive soils above thewater table.
2. FB Drilled shaft with drilling mud Installed using mud to support the sides of the whole. Concrete is poured from the bottom up,displacing the mud.
3. FT Drilled shaft with casing (FTU) Drilled within the confinement of a steel casing. As the casting is retrieved, concrete is poured in thehole.
4. FTC Drilled shaft, hollow auger (auger castpiles)
Installed using a hollow stem continuous auger having a length at least equal to the proposed pilelength. The auger is extracted without turning while, simultaneously, concrete is injected through theauger stem.
5. FPU Pier Hand excavated foundations. The drilling method requires the presence of workers at the bottom ofthe excavation. The sides are supported with retaining elements or casing.
6. FIG Micropile type1 (BIG) Drilled pile with casting. Diameter less than 250 mm (10 inch). After the casting has been filled withconcrete, the top of the casing is plugged. Pressure is applied inside the casting between the concreteand the plug. The casing is recovered by maintaining the pressure against the concrete.
7. VMO Screwed-in piles Not applicable for cohesionless or soils below water table. A screw type tool is placed in front of acorrugated pipe which is pushed and screwed in place. The rotation is reversed for pulling out thecasting while concrete is poured.
8. BE Driven piles, concrete coated - pipe piles 150 mm (6 in.) To 500 mm (20 in.) External diameter- H piles- caissons made of 2, 3, or 4 sheet pile sections.
The pile is driven with an oversized protecting shoe. As driving proceeds, concrete is injected through
a hose near the oversized shoe producing a coating around the pile.
9. BBA Driven prefabricated piles Reinforced or prestressed concrete piles installed by driving or vibrodriving.
10. BM Steel driven piles Piles made of steel only and driven in place.- H piles- Pipe piles- any shape obtained by welding sheet-pile sections.
11. BPR Prestressed tube pile Made of hollow cylinder elements of lightly reinforced concrete assembled together by prestressingbefore driving. Each element is generally 1.5 to 3 m (4-9 ft) long and 0.7 to 0.9 m (2-3 ft) in diameter;the thickness is approximately 0.15 m (6 in.). The piles are driven open ended.
12. BFR Driven pile, bottom concrete plug Driving is achieved through the bottom concrete plug. The casting is pulled out while low slumpconcrete is compacted in it.
13. BMO Driven pile, molded. A plugged tube is driven until the final position is reached. The tube is filled with medium slumpconcrete to the top and the tube is extracted.
14. VBA Concrete piles, pushed-in. Pile is made of cylindrical concrete elements prefabricated or cast-in-place, 0.5 to 2.5 m (1.5 to 8 ft)long and 30 to 60 cm (1 to 2 ft) in diameter. The elements are pushed in by a hydraulic jack.
15. VME Steel piles, pushed-in Piles made of steel only are pushed in by a hydraulic jack..
16. FIP Micropile type II Drilled pile < 250 mm ( 10 in.) In diameter. The reinforcing cage is placed in the hole and concreteplaced from bottom up.
17. BIP High pressure injected pile, large diameter
Diameter > 250 mm (10 in.). The injection system should be able to produce high pressures.

20
Table 3Input parameters for clay and silt for LCPC method
CURVE # qc
(ksf)PILE TYPE
(see Table 2)COMMENTS ON INSERTION PROCEDURE
1 < 14.6
> 14.6
1-17
1,2 - very probable values when using tools without teeth or withoversized blades and where a remoulded layer of materialcan be deposited along the sides of the drilled hole. Usethese values also for deep holes below the water table wherethe hole must be cleaned several times. Use these values alsofor cases when the relaxation of the sides of the hole isallowed due to incidents slowing or stopping the pouring ofconcrete. For all the previous conditions, experience shows,however, that qs can be between curves 1 and 2; use anintermediate value of qs is such value is warranted by a loadtest.
2 > 25.1
> 25.1
> 25.1
> 25.1
> 25.1
4, 5, 8, 9, 10,11, 13, 14, 15
7
6
1, 2
3
- for all steel piles , experience shows that, in plastic soils, qs is often as low as curve 1; therefore, use curve 1 when no previous load test is available. For all driven concrete piles use curve 3 in low plasticity soils with sand or sand andgravel layers or containing boulders and when qc>52.2 ksf.
- use these values for soils where qc<52.2 ksf and the rate ofpenetration is slow; otherwise use curve 1. Also for slowpenetration, when qc>93.9 ksf, use curve 3.
- use curve 3 based on previous load test.
- use these values when careful method of drilling with anauger equipped with teeth and immediate concrete pouring isused. In the case of constant supervision with cleaning andgrooving of the borehole walls followed by immediateconcrete pouring, for soils of qc>93.9 ksf, curve 3 can beused.
- for dry holes. It is recommended to vibrate the concreteafter taking out the casing. In the case of work below thewater table, where pumping is required and frequentmovement of the casing is necessary, use curve 1 unless loadtest results are available.
3 > 25.1< 41.8
12 - usual conditions of execution as described in DTU 13.2
5 > 14.8 16, 17 - in the case of injection done selectively and repetitively atlow flow rate it will be possible to use curve 5, if it isjustified by previous load test.

21
Table 4Input parameters for sand and gravel for LCPC method
CURVE # qc
(ksf)PILE TYPE (seeTable 2 )
COMMENTS ON INSERTION PROCEDURE
1 < 73.1 2, 3, 4, 6, 7, 8, 9, 10,11, 12, 13, 14, 15
2 > 73.1
>104.4
>104.4
6, 7, 9, 10, 11, 12,13, 14, 15
2, 3
4
- for fine sands. Since steel piles can lead to very smallvalues of qs in such soils, use curve 1 unless higher valuescan be based on load test results. For concrete piles, usecurve 2 for fine sands of qc>156.6 ksf.
- only for fine sands and bored piles which are less than 30m (100 ft) long. For piles longer than 30 m (100 ft) in finesand, qs may vary between curves 1 and 2. Where no loadtest data is available, use curve 1.
- reserved for sands exhibiting some cohesion.
3 > 156.6
> 156.6
6, 7, 9, 10, 11, 13,14, 15, 17
2, 3
- for coarse gravelly sand or gravel only. For concretepiles, use curve 4 if it can be justified by a load test.
- for coarse gravelly sand or gravel and bored piles lessthan 30 m (100 ft) long.
- for gravel where qc>83.5 ksf, use curve 4
4 > 156.6 8, 12 - for coarse gravelly sand and gravel only.
5 > 104.4 16, 17 - use of values higher than curve 5 is acceptable if basedon load test.
CLAY - SILT
0 20 40 60 80 100
Cone resistance, qc (TS F)
0.0
0.5
1.0
1.5
2.0
2.5
Ma
xim
um
fric
tion
, f m
ax (
TS
F)
1
2
3
4
5
0 50 100 150 200 250 300 350 400 450
Cone resistance, qc (TSF)
0.0
1.0
2.0
3.0
Max
imum
fric
tion,
f max
(TS
F) SAND-GRAVEL
0.00
0.05
0.10
0.15
0.20
0.25
Ma
xim
um
fric
tion,
f max
(MP
a)0 5 10 15 20 25 30 35 40
Cone resistance, qc (MPa)
1
2
3
4
5
Maximum friction curves for LCPC method (after Briaud [10])
Figure 7
22
0.00
0.05
0.10
0.15
0.20
Ma
xim
um
fric
tion
, f m
ax (
MP
a)
0 2 4 6 8
Cone resistance, qc (MPa)
23
qq q q
tc c a= + +1 2
4 2(11)
m e fsa= + −0 5 9 5 9. . (13)
qq tip
Ftca
b
= ( )(14)
f mfsa= (12)
Tumay and Fakhroo Method (Cone-m Method)
Tumay and Fakhroo proposed this method to predict the ultimate pile capacity of piles in clayey
soils [5]. The unit tip bearing capacity (qt) is estimated using a procedure similar to
Schmertmann’s method as follows:
where qc1 is the average of qc values 4D below the pile tip, qc2 is the average of the minimum qc
values 4D below the pile tip, and qa is the average of the minimum of qc values 8D above the pile
tip. Tumay and Fakhroo suggested an upper limit of 150 TSF (15 MPa) for the unit pile tip bearing
capacity (qt).
The unit skin friction (f) is given by the following expression:
Tumay and Fakhroo suggested that f#0.72 TSF (72 kPa). The adhesion factor (m) is expressed as:
where fsa=Ft/L is the average local friction in TSF, and Ft is the total cone penetration friction
determined for pile penetration length (L).
Aoki and De Alencar Method
Aoki and De Alencar Velloso proposed the following method to estimate the ultimate load
carrying capacity of the pile from CPT data [6]. The unit tip bearing capacity (qt) is obtained from:
where qca(tip) is the average cone tip resistance around the pile tip, and Fb is an empirical factor
that depends on the pile type. The unit skin friction of the pile (f) is predicted by:
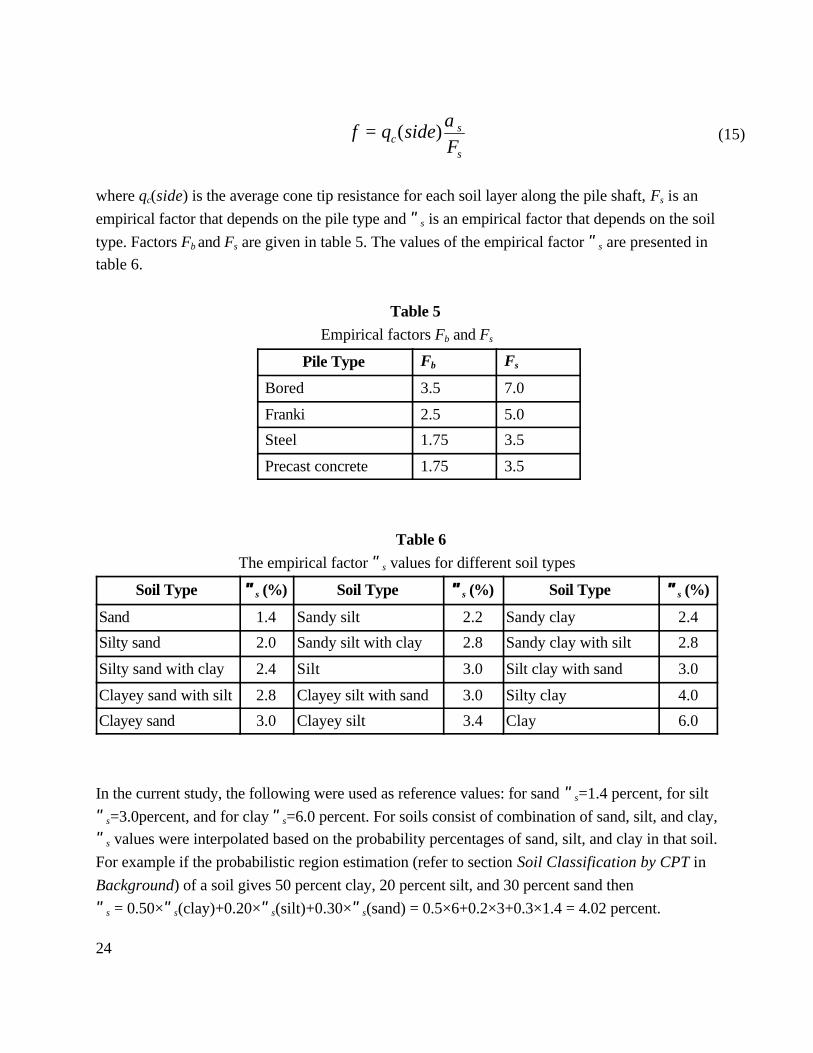
24
f q sideFc
s
s
= ( )α
(15)
where qc(side) is the average cone tip resistance for each soil layer along the pile shaft, Fs is an
empirical factor that depends on the pile type and "s is an empirical factor that depends on the soil
type. Factors Fb and Fs are given in table 5. The values of the empirical factor "s are presented in
table 6.
Table 5
Empirical factors Fb and Fs
Pile Type Fb Fs
Bored 3.5 7.0
Franki 2.5 5.0
Steel 1.75 3.5
Precast concrete 1.75 3.5
Table 6
The empirical factor "s values for different soil types
Soil Type ""s (%) Soil Type ""s (%) Soil Type ""s (%)
Sand 1.4 Sandy silt 2.2 Sandy clay 2.4
Silty sand 2.0 Sandy silt with clay 2.8 Sandy clay with silt 2.8
Silty sand with clay 2.4 Silt 3.0 Silt clay with sand 3.0
Clayey sand with silt 2.8 Clayey silt with sand 3.0 Silty clay 4.0
Clayey sand 3.0 Clayey silt 3.4 Clay 6.0
In the current study, the following were used as reference values: for sand "s=1.4 percent, for silt
"s=3.0percent, and for clay "s=6.0 percent. For soils consist of combination of sand, silt, and clay,
"s values were interpolated based on the probability percentages of sand, silt, and clay in that soil.
For example if the probabilistic region estimation (refer to section Soil Classification by CPT in
Background) of a soil gives 50 percent clay, 20 percent silt, and 30 percent sand then
"s = 0.50×"s(clay)+0.20×"s(silt)+0.30×"s(sand) = 0.5×6+0.2×3+0.3×1.4 = 4.02 percent.

25
q k qt b c= (16)
f k fs s= (17)
q k qt b ca= (18)
qq q
caca A cb B=
+( ) ( )
2(19)
Upper limits were imposed on qt and f as follows: qt#150 TSF (15 MPa) and f#1.2 TSF (120
kPa).
Price and Wardle Method
Price and Wardle proposed the following relationship to evaluate the unit tip bearing capacity (qt)
of the pile from the cone tip resistance [7]:
where kb is a factor depends on the pile type (kb = 0.35 for driven piles and 0.3 for jacked piles).
The unit skin friction (f) is obtained from:
where ks is a factor depends on the pile type (ks=0.53 for driven piles, 0.62 for jacked piles, and
0.49 for bored piles). Price and Wardle proposed the values for these factors based on analysis
conducted on pile load tests in stiff clay (London clay).
Upper limits were imposed on qt and f as follows: qt#150 TSF (15 MPa) and f#0.12 TSF (120
kPa).
Philipponnat Method
Philipponnat proposed the following expression to estimate the unit tip bearing capacity of the pile
(qt) from the cone tip resistance (qc) [8]:
where kb is a factor that depends on the soil type as shown in table 7. The cone tip resistance (qca)
is averaged as follows:
where qca(A) is the average cone tip resistance within 3B (B is the pile width) above the pile tip and

26
fF
qs
scs= α
(20)
qcb(B) is the average cone tip resistance within 3B below the pile tip. Philipponnat recommended
the removal of the extreme peaks (spikes) when the tip resistance profiles is irregular and imposed
a condition in which qca(A) # qcb(B).
The unit skin friction of the pile (f) is determined by:
where qcs is the average cone tip resistance for each soil layer along the pile shaft, Fs is a factor
depends on the soil type as presented in table 8. The factor "s depends on the pile type where "s
equals to 1.25 for precast concrete driven piles. Philipponnat suggested an upper limit for the skin
friction (flim), for precast concrete driven piles flim# 1.2 PA (PA is the atmospheric pressure).
Table 7
Bearing capacity factor (kb)
Soil Type kb
Gravel 0.35
Sand 0.40
Silt 0.45
Clay 0.50
Table 8
Empirical factor Fs
Soil Type Fs
Clay and calcareous clay 50
Silt, sandy clay, and clayey sand 60
Loose sand 100
Medium dense sand 150
Dense sand and gravel 200

27
q CNt c v= + σ ' (23)
qtc
c
=
0 25
0125
.
.
for pile tip in clay
for pile tip in sand(21)
ff
fs
s
=+15 01. .
(22)
Penpile Method
The penpile method was proposed by Clisby et al. for the Mississippi Department of
Transportation [9]. The unit tip bearing capacity of the pile (qt) is determined from the following
relationship:
where qc is the average of three cone tip resistances close to the pile tip.
The unit skin friction of the pile shaft (f) is obtained from the following relationship:
where f is expressed in psi (lb/in2) and fs is the sleeve friction of the cone expressed in psi.
DOTD STATIC METHOD (""-METHOD)
DOTD uses "-method for the design and analysis of pile foundations. Static analysis is primarily
governed by the laboratory test results conducted on the soil samples close to the pile location and
by the standard penetration test (SPT) in cohesionless soils. The following soil characteristics and
parameters are required to perform static analysis using "-method: (a) soil profile and thickness
of each soil layer, (b) the shear strength parameters: cohesion (C) and angle of internal friction
(N), and (c) unit weight. The angle of internal friction N is obtained from the standard penetration
test results or from laboratory tests.
For cohesive soil, the unit tip bearing capacity of the pile is evaluated from the following
relationship:
where C is the cohesion of the soil layer, Nc is the bearing capacity factor, and FvN is the effective
vertical stress. Figure 8 presents the variation of Nc with the ratio R (R=D/B, depth/pile
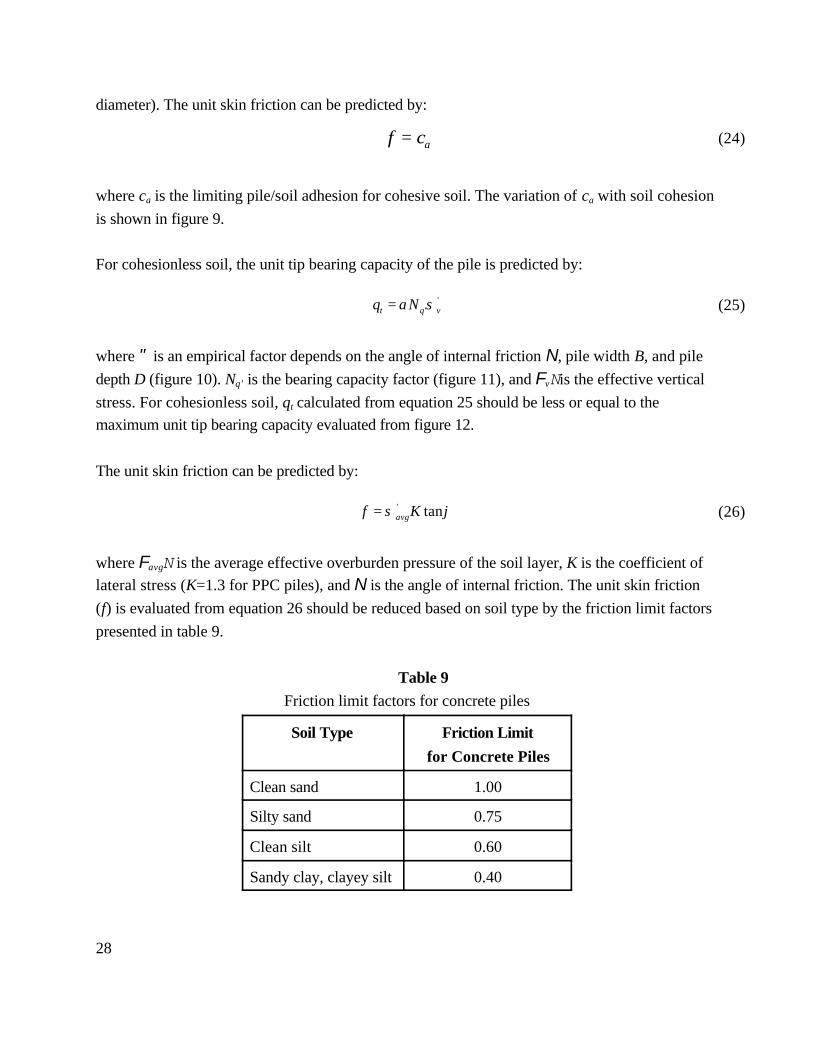
28
f ca= (24)
q Nt q v= α σ'' (25)
f Kavg= σ ϕ' tan (26)
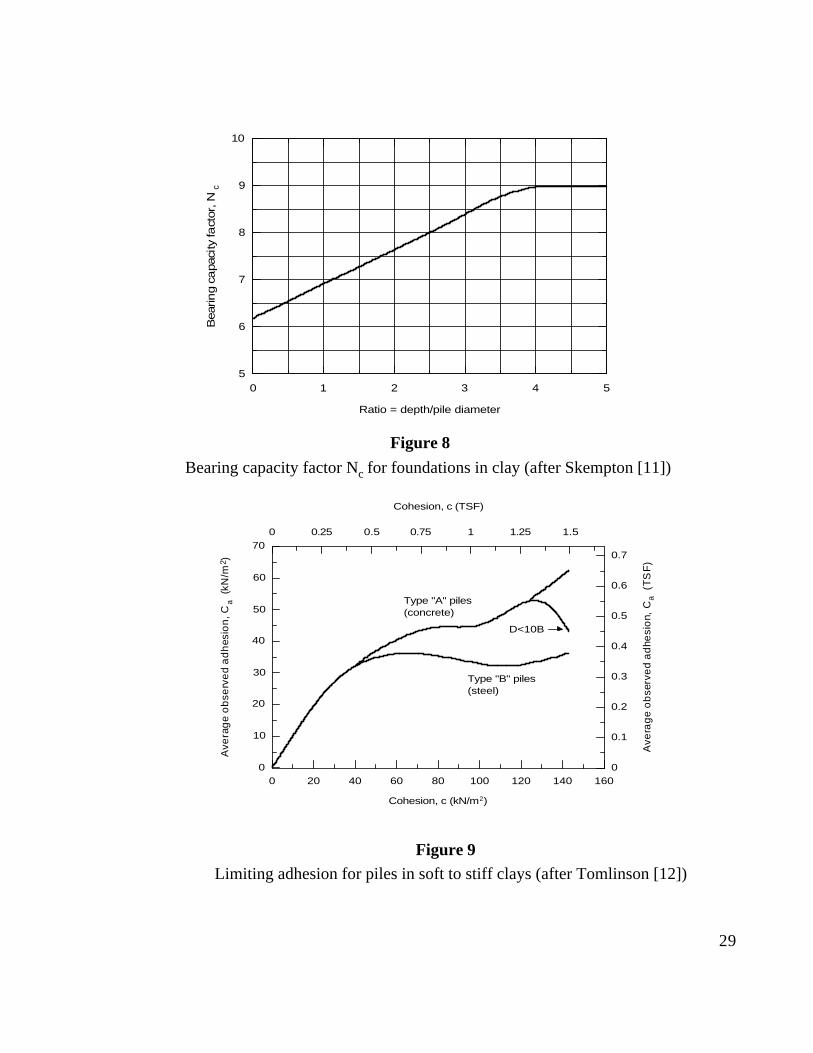
diameter). The unit skin friction can be predicted by:
where ca is the limiting pile/soil adhesion for cohesive soil. The variation of ca with soil cohesion
is shown in figure 9.
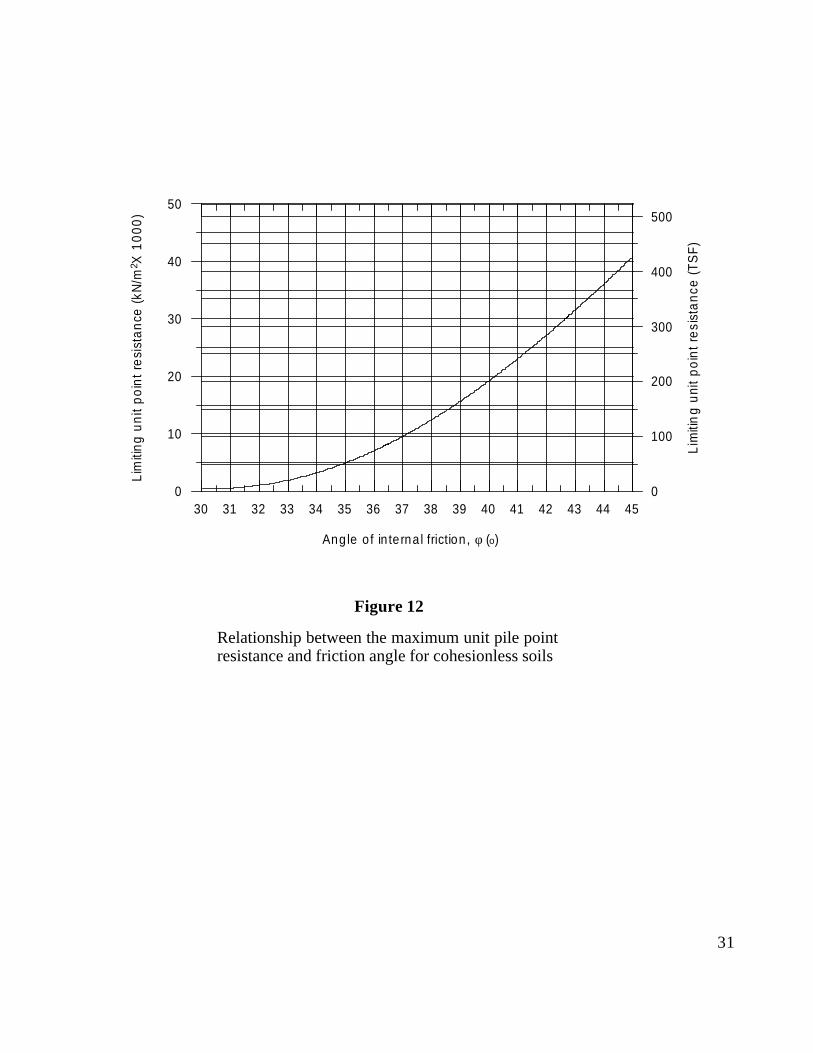
For cohesionless soil, the unit tip bearing capacity of the pile is predicted by:
where " is an empirical factor depends on the angle of internal friction N, pile width B, and pile
depth D (figure 10). Nq’ is the bearing capacity factor (figure 11), and FvN is the effective vertical
stress. For cohesionless soil, qt calculated from equation 25 should be less or equal to the
maximum unit tip bearing capacity evaluated from figure 12.
The unit skin friction can be predicted by:
where FavgN is the average effective overburden pressure of the soil layer, K is the coefficient of
lateral stress (K=1.3 for PPC piles), and N is the angle of internal friction. The unit skin friction
(f) is evaluated from equation 26 should be reduced based on soil type by the friction limit factors
presented in table 9.
Table 9
Friction limit factors for concrete piles
Soil Type Friction Limit
for Concrete Piles
Clean sand 1.00
Silty sand 0.75
Clean silt 0.60
Sandy clay, clayey silt 0.40
0 1 2 3 4 5
Ratio = depth/pile diameter
5
6
7
8
9
10
Bea
ring
capa
city
fact
or, N
c
Bearing capacity factor Nc for foundations in clay (after Skempton [11])
0 20 40 60 80 100 120 140 160
Cohesion, c (kN/m2)
0
10
20
30
40
50
60
70
Ave
rag
e o
bse
rve
d a
dh
esio
n, C
a (
kN/m
2 )
0 0.25 0.5 0.75 1 1.25 1.5
Cohesion, c (TSF)
0
0.1
0.2
0.3
0.4
0.5
0.6
0.7
Ave
rag
e o
bse
rve
d a
dhe
sio
n, C
a (
TS
F)
Type "A" piles(concrete)
Type "B" piles(steel)
D<10B
Limiting adhesion for piles in soft to stiff clays (after Tomlinson [12])
Figure 8
Figure 9
29

15 20 25 30 35 40 45
Angle of internal friction, φ (o )
0.1
0.2
0.3
0.4
0.5
0.6
0.7
0.8
0.9
α
D/B=20
D/B=30
D/B=40
15 20 25 30 35 40 45
Angle of internal friction, φ (o)
1
10
100
1000
Bea
ring
capa
city
fact
or, N
q'
Relationship between α-coefficient and angle of internal friction for cohesionless soils (after Bowles [13])
Estimating the bearing capacity factor Nq' (after Bowles [13])
Figure 10
Figure 11
30
30 31 32 33 34 35 36 37 38 39 40 41 42 43 44 45
Angle o f in terna l friction , φ (o)
0
10
20
30
40
50
Lim
itin
g u
nit
po
int
resi
sta
nce
(kN
/m2 X
10
00
)
0
100
200
300
400
500
Lim
itin
g u
nit
po
int
resi
sta
nce
(T
SF
)
Figure 12
Relationship between the maximum unit pile point resistance and friction angle for cohesionless soils
31
32
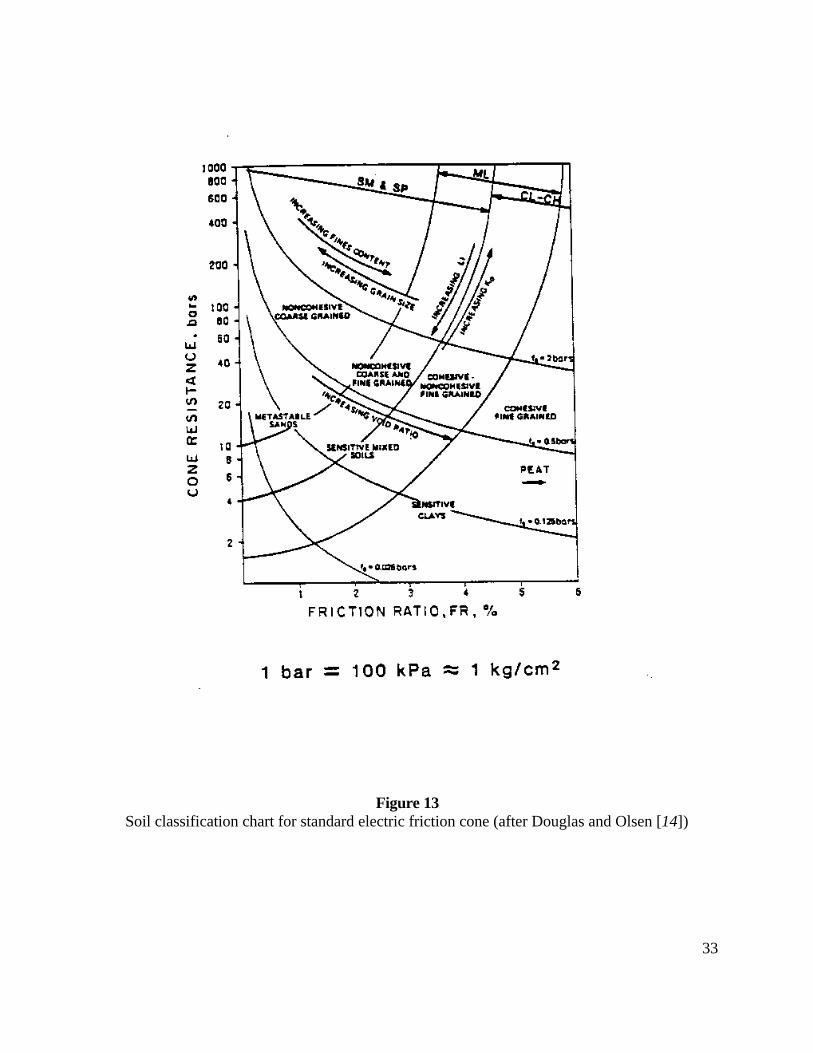
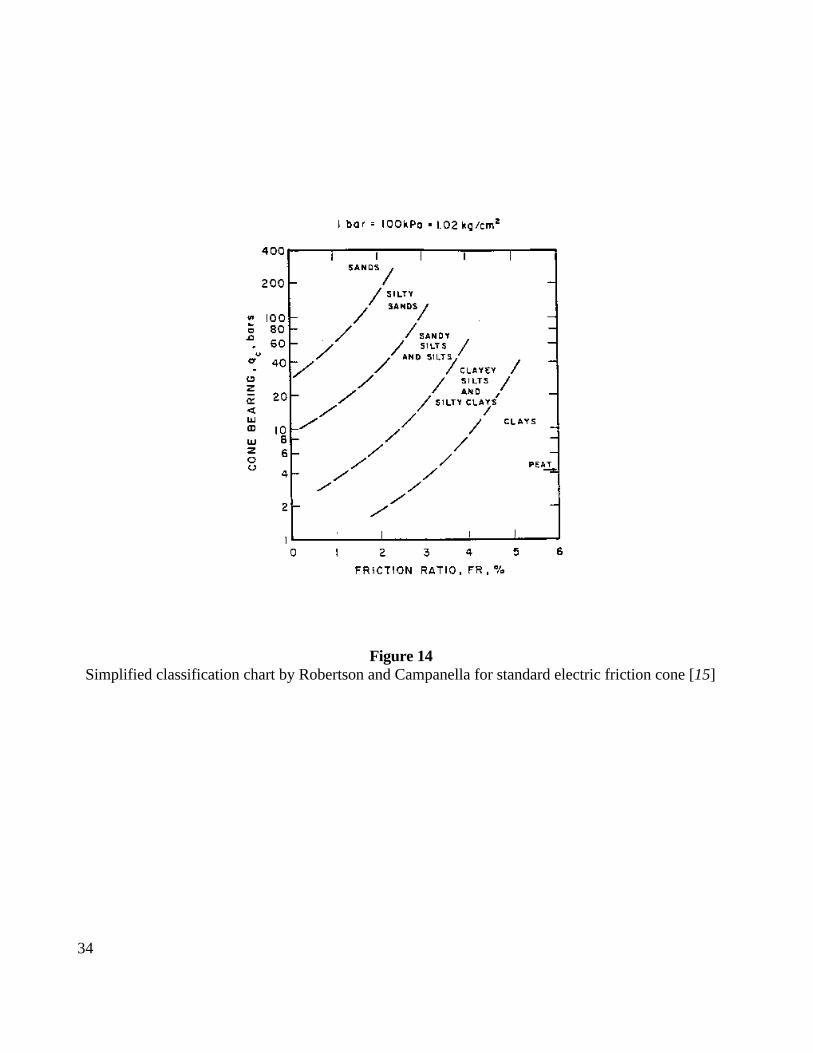
SOIL CLASSIFICATION BY CPT
Cone penetration test is a popular tool for in situ site characterization. Soil classification and
identification of soil stratigraphy can be achieved by analyzing the CPT data. Clayey soils usually
show low cone tip resistance, high sleeve friction and therefore high friction ratio, while sandy
soils show high cone tip resistance, low sleeve friction, and low friction ratio. Soil classification
methods by CPT employ the CPT to identify soil from classification charts. Soil classification
charts by Douglas and Olsen and Robertson and Campanella are shown in figures 13 and 14,
respectively [14], [15]. Zhang and Tumay proposed the probabilistic region estimation method
for soil classification [16]. This method is similar to the classical soil classification methods
where it is based on soil composition. The method identifies three soil types: clayey, silty, and
sandy soils. The probabilistic region estimation determines the probability of each soil constituent
(clay, silt, and sand) at certain depth. Typical soil profile obtained by the probabilistic region
estimation is shown in figure 15.
33
Figure 13Soil classification chart for standard electric friction cone (after Douglas and Olsen [14])
34
Figure 14Simplified classification chart by Robertson and Campanella for standard electric friction cone [15]

Figure 15Soil classif ication using the probabilistic region method by Zhang and Tumay [16]
Sandy
Silty
0 150 300 450
160
140
120
100
80
60
40
20
0
Dep
th (
ft)
0 150 300 450
Tip res istanceqc (TSF)
0 2.5 5 7.5 10
160
140
120
100
80
60
40
20
0
0 5 10 15
160
140
120
100
80
60
40
20
0
0 20 40 60 80 100
160
140
120
100
80
60
40
20
00 2.5 5 7.5 10
Sleeve f riction fs (TSF)
0 5 10 15
Fric tion ratioR f (%)
0 20 40 60 80100
Probability of so il type (%)
Pile TipLocation
Clayey
35

36

37
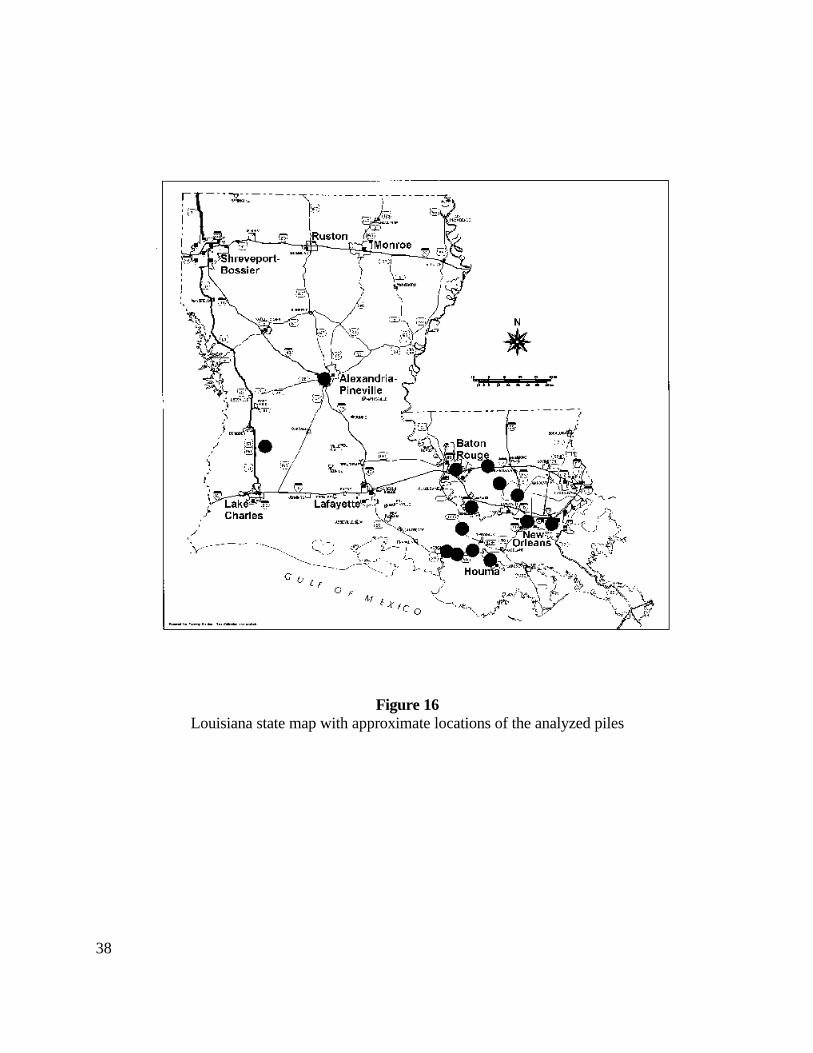
METHODOLOGY
The primary objective of this study is to evaluate the ability of CPT methods to reliably predict the
ultimate load carrying capacity of square PPC piles driven into Louisiana soils. To achieve this
goal, 60 pile load tests and the CPT tests conducted close to the piles were identified and
collected from DOTD files. Figure 16 depicts a map of the state of Louisiana with approximate
locations of the test piles that were considered in this study. The collected pile load test data, soil
properties, and CPT profiles were compiled and analyzed. This section describes the methodology
of collecting, compiling, and analyzing the pile load test reports and the corresponding CPT
profiles.
COLLECTION AND EVALUATION OF PILE LOAD TEST REPORTS
The practice of DOTD is to carry out pile load tests based on cost/benefit analysis for each
project. The purpose of a pile load test is mainly to validate and verify the pile capacity predicted
through design/analysis procedures. If, as a result of load testing, a pile fails to provide the
required support for design loads, more piles are added to increase the capacity and/or the piles
are driven deeper to hard soil layers.
Pile load test reports conducted in Louisiana state projects are available in the general files
section at DOTD headquarters in Baton Rouge. These files are kept on microfilms as an integral
part of the whole state project. In this study, pile load test reports were obtained from the
pavement and geotechnical design section at DOTD.
Pile load test reports obtained from the DOTD were carefully reviewed in order to evaluate their
suitability for inclusion in the current research. Special attention was directed to the availability of
proper documentation on the pile data (installation and testing), CPT soundings, site location, and
subsurface exploration and soil testing. If a pile load test report was found satisfactory, then the
report was considered for inclusion in the study.
Pile load test reports provide information and data regarding the site, subsurface exploration, soil
identification, testing, and deep foundation load test. Even though other pile types were good
candidates for inclusion in the current research, only precast prestressed concrete piles were
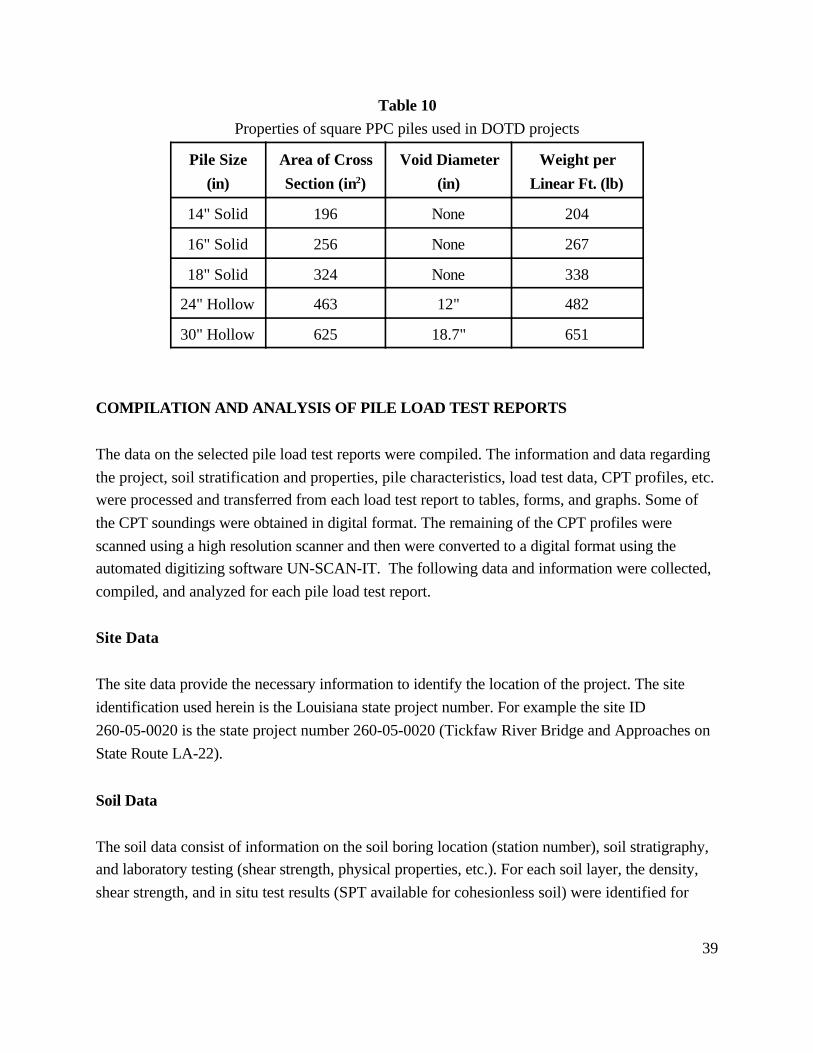
considered. These piles are the most commonly used in DOTD projects. The characteristics of the
square precast prestressed concrete piles used by DOTD are presented in table 10.
38
Figure 16Louisiana state map with approximate locations of the analyzed piles
39
Table 10
Properties of square PPC piles used in DOTD projects
Pile Size
(in)
Area of Cross
Section (in2)
Void Diameter
(in)
Weight per
Linear Ft. (lb)
14" Solid 196 None 204
16" Solid 256 None 267
18" Solid 324 None 338
24" Hollow 463 12" 482
30" Hollow 625 18.7" 651
COMPILATION AND ANALYSIS OF PILE LOAD TEST REPORTS
The data on the selected pile load test reports were compiled. The information and data regarding
the project, soil stratification and properties, pile characteristics, load test data, CPT profiles, etc.
were processed and transferred from each load test report to tables, forms, and graphs. Some of
the CPT soundings were obtained in digital format. The remaining of the CPT profiles were
scanned using a high resolution scanner and then were converted to a digital format using the
automated digitizing software UN-SCAN-IT. The following data and information were collected,
compiled, and analyzed for each pile load test report.
Site Data
The site data provide the necessary information to identify the location of the project. The site
identification used herein is the Louisiana state project number. For example the site ID
260-05-0020 is the state project number 260-05-0020 (Tickfaw River Bridge and Approaches on
State Route LA-22).
Soil Data
The soil data consist of information on the soil boring location (station number), soil stratigraphy,
and laboratory testing (shear strength, physical properties, etc.). For each soil layer, the density,
shear strength, and in situ test results (SPT available for cohesionless soil) were identified for
40
input into the DOTD program PILE-SPT and the static analysis program PILELOAD. From soil
stratification, the predominant soil type was qualitatively identified (cohesive or cohesionless).
The importance of this identification will be addressed in the analysis section.
Foundation Data
Foundation data consist of pile characteristics (pile ID, material type, cross-section, total length,
embedded length), installation data (location of the pile, date of driving, driving record, hammer
type, etc.), and pile load test (date of loading, applied load with time, pile head movement, pile
failure under testing, etc.).
CPT Data
The cone penetration soundings information includes test location (station number), date, cone tip
resistance and sleeve friction profiles with depth. In most of the cases, the collected CPT
soundings were not available as a digital data, therefore the CPT soundings were scanned and
digitized using the UN-SCAN-IT program.
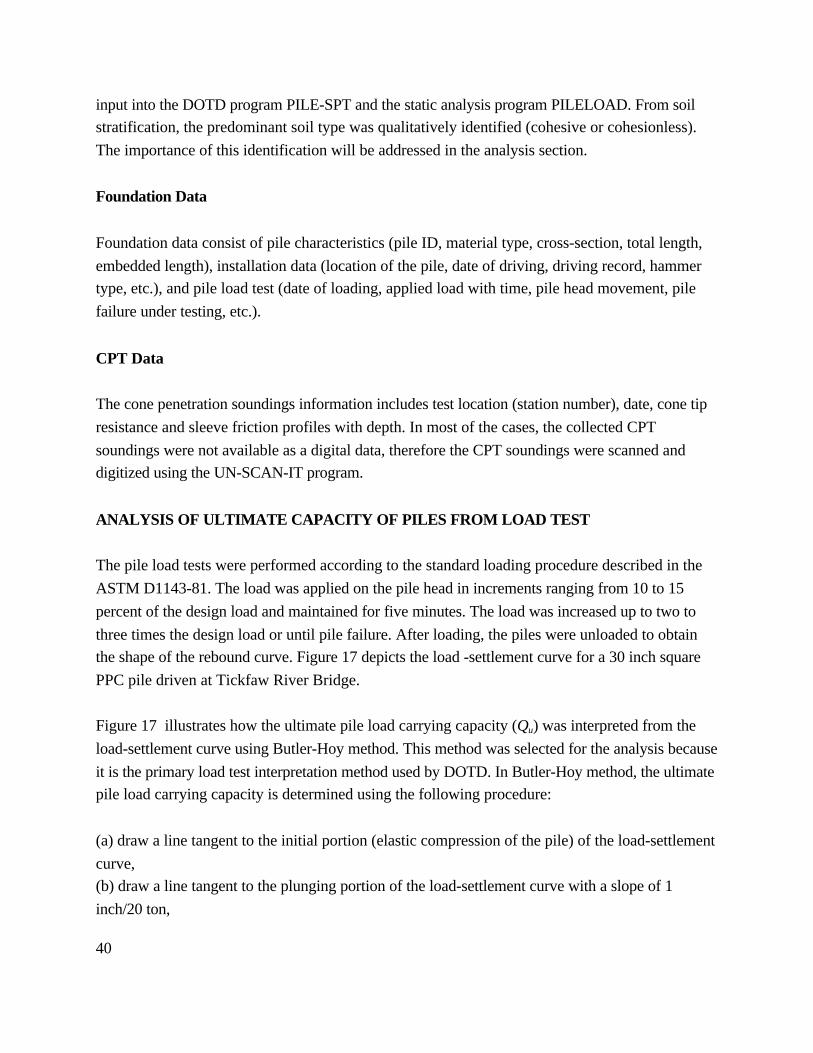
ANALYSIS OF ULTIMATE CAPACITY OF PILES FROM LOAD TEST
The pile load tests were performed according to the standard loading procedure described in the
ASTM D1143-81. The load was applied on the pile head in increments ranging from 10 to 15
percent of the design load and maintained for five minutes. The load was increased up to two to
three times the design load or until pile failure. After loading, the piles were unloaded to obtain
the shape of the rebound curve. Figure 17 depicts the load -settlement curve for a 30 inch square
PPC pile driven at Tickfaw River Bridge.
Figure 17 illustrates how the ultimate pile load carrying capacity (Qu) was interpreted from the
load-settlement curve using Butler-Hoy method. This method was selected for the analysis because
it is the primary load test interpretation method used by DOTD. In Butler-Hoy method, the ultimate
pile load carrying capacity is determined using the following procedure:
(a) draw a line tangent to the initial portion (elastic compression of the pile) of the load-settlement
curve,
(b) draw a line tangent to the plunging portion of the load-settlement curve with a slope of 1
inch/20 ton,
Figure 17Load-settlement curve for 30 in square PPC pile (TP1) at Tickfaw River bridge
8
6
4
2
0
Set
tlem
ent
(in.)
0 100 200 300 400 500 600
Load (ton)
Qu (Butle r-Hoy) = 460 tons
1 inch
20 ton
41

42
(c) locate the intersection of the two lines, which represents the ultimate capacity of the pile (as
shown in figure 17).
INTERPRETATION OF SOIL PROFILE FROM CPT
In this report, the probabilistic region estimation method was used for soil classification and
identification of site stratigraphy [16]. This method was selected since it provides a profile of the
probability of soil constituents with depth, while other methods show a sudden jump from soil
layer to another. Moreover, this method is simple and provides output that can be easily
understood. Figure 15 shows the soil profile next to pile TP1 at Tickfaw River Bridge as
determined by the probabilistic region estimation method.
ANALYSIS OF PILES USING THE CPT METHODS
The eight CPT methods used to estimate the ultimate load carrying capacity of the selected piles
were discussed in the Background section. Prediction of the pile capacity using these methods is
difficult to perform manually. A computer code was written in FORTRAN in which these methods
were implemented. The program performs the analysis on the CPT sounding and then uses the eight
CPT methods to predict the pile capacity.
The core of the FORTRAN program was then converted to a Visual Basic code in order to
develop MS-Windows based application. The program called Louisiana Pile Design by CPT
(LPD-CPT). Appendix A presents an illustration of using the program LPD-CPT to predict the pile
capacity by different CPT methods.
ANALYSIS OF PILE CAPACITY USING STATIC METHODS
The DOTD static analysis method ("-method) was applied to evaluate the load carrying capacity
of the investigated piles. This is to provide a platform to compare the CPT methods with the
method used by DOTD.

43
ANALYSIS OF RESULTS
This section presents an evaluation of the ability of the investigated CPT methods to predict the
ultimate load carrying capacity of square PPC piles driven into Louisiana soils. The performance
of the different methods was evaluated based on criteria that include statistical analyses and
evaluation of the predicted/measured pile capacity. Each method was given a rank based on its
performance according to the selected criterion. The final rank of each method was obtained by
adding the ranks of the all criteria. The analyses were conducted only on friction PPC piles that
failed (plunged or showed large settlement) under load testing.
CHARACTERIZATION OF THE INVESTIGATED PILES
Sixty square precast prestressed concrete piles were considered in the current study. However, the
analyses were conducted on 35 friction piles that were failed during the pile load test. A summary
of the characteristics of the investigated pile is presented in table 11. The piles are categorized
based on the predominant soil type, load resistance mechanism, and failure under loading.
Table 11
Number of PPC piles investigated based on pile type, soil type, and load test
Square
PPC Pile
Size
Pile Type Predominant Soil Type Pile Failed Under
Loading
Friction End-bearing Cohesive Cohesionless Both Yes No
14" 26 1 21 3 3 20 7
16" 5 1 5 0 1 4 2
18" 2 0 1 0 1 2 0
24" 6 1 5 2 0 2 5
30" 9 9 5 0 13 12 6
Total 48 12 37 5 18 40 20

44
PREDICTED VERSUS MEASURED PILE CAPACITY
Among the sixty piles considered in this study, only thirty-five piles were used in the analyses.
These piles were identified as friction piles loaded to failure. For each pile load test, the in situ
CPT sounding adjacent to the pile was used to predict the ultimate axial load capacity of that pile
using the CPT prediction methods. These methods are the Schmertmann, de Ruiter and Beringen,
Bustamante and Gianeselli, Tumay and Fakhroo, Aoki and De Alencar, Price and Wardle,
Philipponnat, and penpile method [2], [3], [4], [5], [6], [7], [8], [9]. The ultimate load capacity for
each pile was also predicted from the soil properties (soil boring close to the pile) using the static
"-method. The ultimate load carrying capacity predicted by these methods (Qp) is compared to the
measured pile capacity (Qm) obtained from the pile load test using Butler-Hoy interpretation
method [1]. Table 12 summarizes the results of the analyses conducted on the investigated piles.
Among the data presented in table 12 are: the pile size, type, length, location of the load test, the
measured ultimate load carrying capacity, and the predicted ultimate load carrying capacity.
The predicted ultimate load carrying capacity (Qp) consists of pile tip capacity (Qt) and pile shaft
resistance (Qs). The pile capacities Qt, Qs, and Qp predicted by the CPT methods and "-method are
compared with Qm in figures 18-26. The results of 35 friction piles and five end-bearing piles are
shown in these figures. Inspection of these figures shows that the ratio Qt/Qp for the first 35 piles is
relatively small, which is consistent with the previous classification of these piles as friction piles
(pile capacity is derived mainly from the shaft resistance). On the other hand, the ratio Qt/Qp for
piles number 36 to 40 is relatively large and hence these piles are considered as end bearing piles
(pile capacity is derived mainly from the pile tip capacity).
Figures 27-35 show the predicted (Qp) versus the measured (Qm) ultimate load carrying capacity
for the friction and end-bearing piles. For each prediction method, regression analysis was
conducted to obtain the best fit line for the predicted/measured pile capacities. The relationship
Qfit/Qm and the corresponding coefficient of determination (R2) were determined for each CPT
prediction method and for the static "-method.
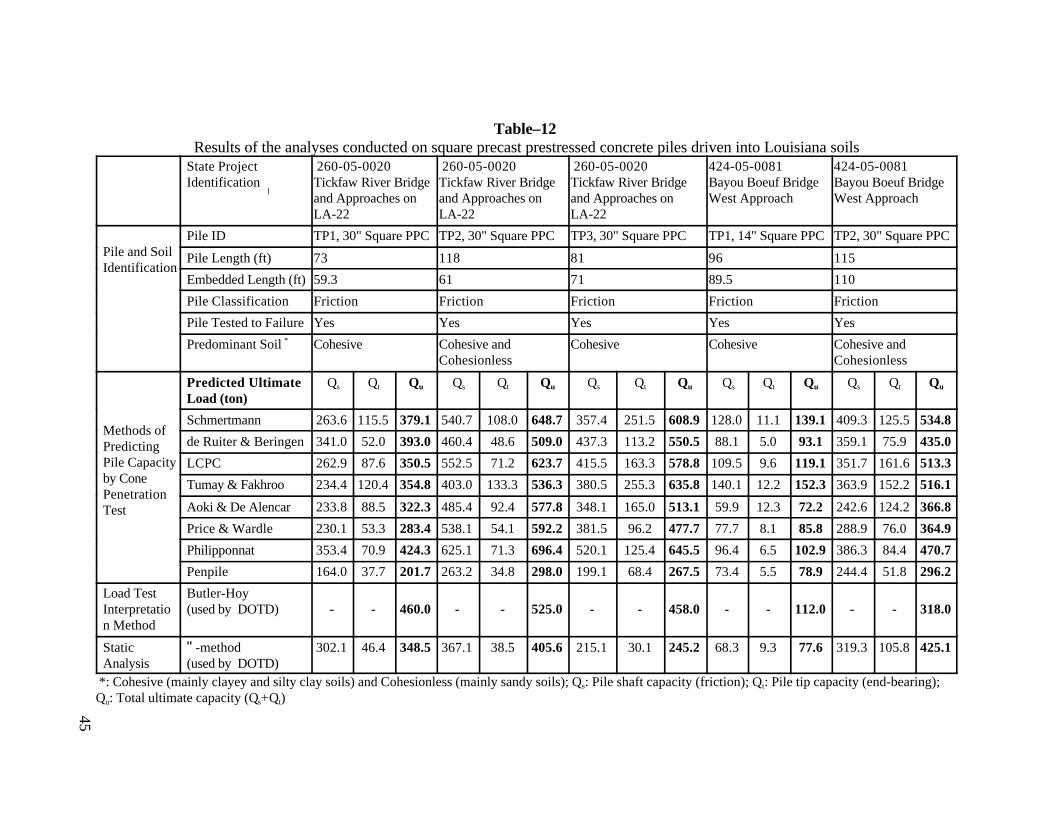
Table–12 Results of the analyses conducted on square precast prestressed concrete piles driven into Louisiana soils
State ProjectIdentification -
260-05-0020 Tickfaw River Bridge and Approaches onLA-22
260-05-0020 Tickfaw River Bridge and Approaches onLA-22
260-05-0020 Tickfaw River Bridge and Approaches onLA-22
424-05-0081Bayou Boeuf BridgeWest Approach
424-05-0081Bayou Boeuf BridgeWest Approach
Pile and SoilIdentification
Pile ID TP1, 30" Square PPC TP2, 30" Square PPC TP3, 30" Square PPC TP1, 14" Square PPC TP2, 30" Square PPC
Pile Length (ft) 73 118 81 96 115
Embedded Length (ft) 59.3 61 71 89.5 110
Pile Classification Friction Friction Friction Friction Friction
Pile Tested to Failure Yes Yes Yes Yes Yes
Predominant Soil * Cohesive Cohesive andCohesionless
Cohesive Cohesive Cohesive andCohesionless
Methods ofPredictingPile Capacityby ConePenetrationTest
Predicted Ultimate Load (ton)
Qs Qt Qu Qs Qt Qu Qs Qt Qu Qs Qt Qu Qs Qt Qu
Schmertmann 263.6 115.5 379.1 540.7 108.0 648.7 357.4 251.5 608.9 128.0 11.1 139.1 409.3 125.5 534.8
de Ruiter & Beringen 341.0 52.0 393.0 460.4 48.6 509.0 437.3 113.2 550.5 88.1 5.0 93.1 359.1 75.9 435.0
LCPC 262.9 87.6 350.5 552.5 71.2 623.7 415.5 163.3 578.8 109.5 9.6 119.1 351.7 161.6 513.3
Tumay & Fakhroo 234.4 120.4 354.8 403.0 133.3 536.3 380.5 255.3 635.8 140.1 12.2 152.3 363.9 152.2 516.1
Aoki & De Alencar 233.8 88.5 322.3 485.4 92.4 577.8 348.1 165.0 513.1 59.9 12.3 72.2 242.6 124.2 366.8
Price & Wardle 230.1 53.3 283.4 538.1 54.1 592.2 381.5 96.2 477.7 77.7 8.1 85.8 288.9 76.0 364.9
Philipponnat 353.4 70.9 424.3 625.1 71.3 696.4 520.1 125.4 645.5 96.4 6.5 102.9 386.3 84.4 470.7
Penpile 164.0 37.7 201.7 263.2 34.8 298.0 199.1 68.4 267.5 73.4 5.5 78.9 244.4 51.8 296.2
Load TestInterpretation Method
Butler-Hoy (used by DOTD) - - 460.0 - - 525.0 - - 458.0 - - 112.0 - - 318.0
StaticAnalysis
"-method (used by DOTD)
302.1 46.4 348.5 367.1 38.5 405.6 215.1 30.1 245.2 68.3 9.3 77.6 319.3 105.8 425.1
*: Cohesive (mainly clayey and silty clay soils) and Cohesionless (mainly sandy soils); Qs: Pile shaft capacity (friction); Qt: Pile tip capacity (end-bearing);Qu: Total ultimate capacity (Qs+Qt)
45
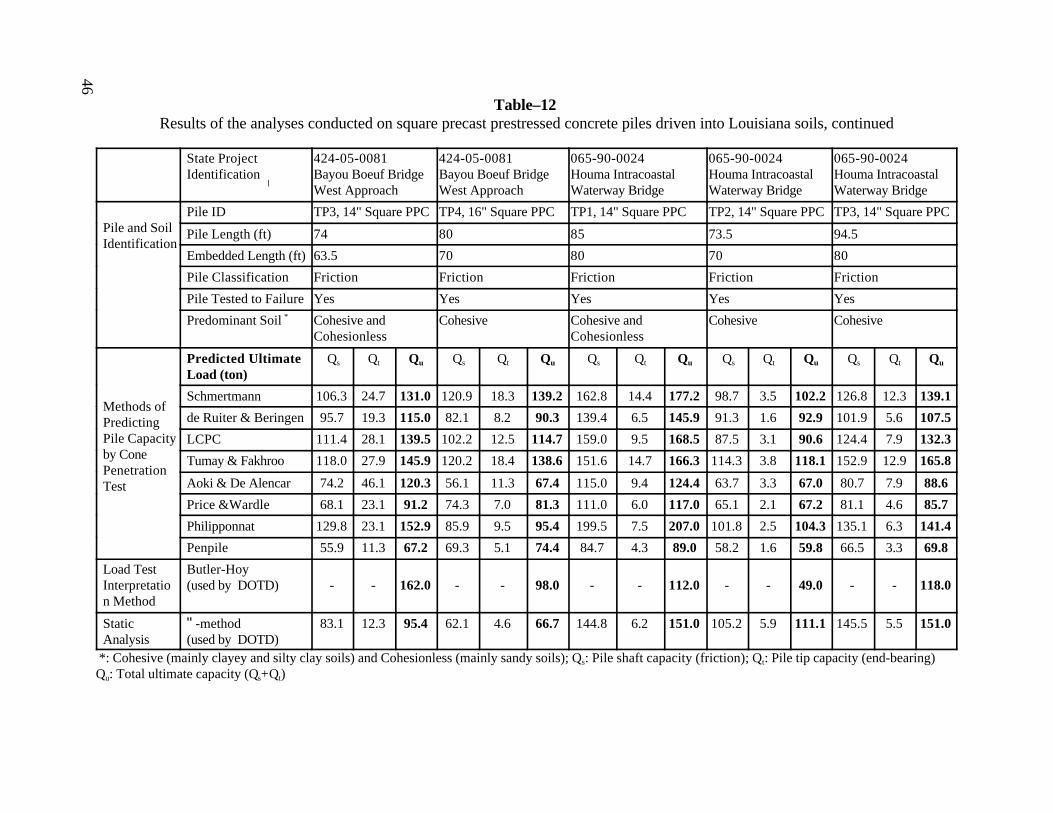
Table–12 Results of the analyses conducted on square precast prestressed concrete piles driven into Louisiana soils, continued
State ProjectIdentification -
424-05-0081Bayou Boeuf BridgeWest Approach
424-05-0081Bayou Boeuf BridgeWest Approach
065-90-0024Houma IntracoastalWaterway Bridge
065-90-0024Houma IntracoastalWaterway Bridge
065-90-0024Houma IntracoastalWaterway Bridge
Pile and SoilIdentification
Pile ID TP3, 14" Square PPC TP4, 16" Square PPC TP1, 14" Square PPC TP2, 14" Square PPC TP3, 14" Square PPC
Pile Length (ft) 74 80 85 73.5 94.5
Embedded Length (ft) 63.5 70 80 70 80
Pile Classification Friction Friction Friction Friction Friction
Pile Tested to Failure Yes Yes Yes Yes Yes
Predominant Soil * Cohesive and Cohesionless
Cohesive Cohesive andCohesionless
Cohesive Cohesive
Methods ofPredictingPile Capacityby ConePenetrationTest
Predicted Ultimate Load (ton)
Qs Qt Qu Qs Qt Qu Qs Qt Qu Qs Qt Qu Qs Qt Qu
Schmertmann 106.3 24.7 131.0 120.9 18.3 139.2 162.8 14.4 177.2 98.7 3.5 102.2 126.8 12.3 139.1
de Ruiter & Beringen 95.7 19.3 115.0 82.1 8.2 90.3 139.4 6.5 145.9 91.3 1.6 92.9 101.9 5.6 107.5
LCPC 111.4 28.1 139.5 102.2 12.5 114.7 159.0 9.5 168.5 87.5 3.1 90.6 124.4 7.9 132.3
Tumay & Fakhroo 118.0 27.9 145.9 120.2 18.4 138.6 151.6 14.7 166.3 114.3 3.8 118.1 152.9 12.9 165.8
Aoki & De Alencar 74.2 46.1 120.3 56.1 11.3 67.4 115.0 9.4 124.4 63.7 3.3 67.0 80.7 7.9 88.6
Price &Wardle 68.1 23.1 91.2 74.3 7.0 81.3 111.0 6.0 117.0 65.1 2.1 67.2 81.1 4.6 85.7
Philipponnat 129.8 23.1 152.9 85.9 9.5 95.4 199.5 7.5 207.0 101.8 2.5 104.3 135.1 6.3 141.4
Penpile 55.9 11.3 67.2 69.3 5.1 74.4 84.7 4.3 89.0 58.2 1.6 59.8 66.5 3.3 69.8
Load TestInterpretation Method
Butler-Hoy (used by DOTD) - - 162.0 - - 98.0 - - 112.0 - - 49.0 - - 118.0
StaticAnalysis
"-method (used by DOTD)
83.1 12.3 95.4 62.1 4.6 66.7 144.8 6.2 151.0 105.2 5.9 111.1 145.5 5.5 151.0
*: Cohesive (mainly clayey and silty clay soils) and Cohesionless (mainly sandy soils); Qs: Pile shaft capacity (friction); Qt: Pile tip capacity (end-bearing)Qu: Total ultimate capacity (Qs+Qt)
46
Table–12 Results of the analyses conducted on square precast prestressed concrete piles driven into Louisiana soils, continued
State ProjectIdentification -
855-04-0046Houma Intra CoastalWaterway Bridge
855-04-0046Houma Intra CoastalWaterway Bridge
855-04-0046Houma Intra CoastalWaterway Bridge
450-33-56Baton Rouge
424-05-0078Bayou Boeuf BridgeMain Span
Pile and SoilIdentification
Pile ID TP4, 14" Square PPC TP5, 16" Square PPC TP6, 16" Square PPC TP2A, 14" SquarePPC
TP1, 14" Square PPC
Pile Length (ft) 92 72 110 NA 80
Embedded Length (ft) 81 71.5 98 45 70
Pile Classification Friction Friction Friction Friction Friction
Pile Tested to Failure Yes Yes No No Yes
Predominant Soil * Cohesive Cohesive Cohesive Cohesive Cohesive
Methods ofPredictingPile Capacityby ConePenetrationTest
Predicted Ultimate Load (ton)
Qs Qt Qu Qs Qt Qu Qs Qt Qu Qs Qt Qu Qs Qt Qu
Schmertmann 112.3 12.0 124.3 107.2 11.3 118.5 126.8 20.7 147.5 87.1 24.5 111.6 87.1 23.8 110.9
de Ruiter & Beringen 106.6 5.4 112.0 62.8 5.1 67.9 118.1 9.3 127.4 96.0 11.0 107.0 93.8 14.3 108.1
LCPC 127.5 7.6 135.1 90.4 7.7 98.1 140.6 13.4 154.0 71.4 15.9 87.3 93.6 23.2 116.8
Tumay & Fakhroo 158.9 12.3 171.2 136.3 12.3 148.6 200.8 24.0 224.8 74.4 26.2 100.6 122.9 25.9 148.8
Aoki & De Alencar 74.3 7.4 81.7 43.0 8.3 51.3 81.0 14.9 95.9 65.8 16.8 82.6 61.9 23.9 85.8
Price & Wardle 71.7 4.5 76.2 62.4 4.3 66.7 70.5 8.8 79.3 75.9 9.9 85.8 51.1 14.3 65.4
Philipponnat 134.3 6.1 140.4 65.0 6.1 71.1 122.4 11.5 133.9 99.5 13.4 112.9 114.6 18.5 133.1
Penpile 61.1 3.2 64.3 60.6 3.1 63.7 71.0 5.6 76.6 57.4 6.6 64.0 49.6 8.2 57.8
Load TestInterpretation Method
Butler-Hoy (used by DOTD) - - 116.0 - - 106.0 - - 168.0 - - 146.0 - - 161.0
StaticAnalysis
"-method (used by DOTD)
130.9 5.5 136.4 114.9 7.6 122.5 169.8 9.6 179.4 108.0 25.1 133.1 136.3 3.8 140.1
*: Cohesive (mainly clayey and silty clay soils) and Cohesionless (mainly sandy soils); Qs: Pile shaft capacity (friction); Qt: Pile tip capacity (end-bearing)Qu: Total ultimate capacity (Qs+Qt)
47

Table–12 Results of the analyses conducted on square precast prestressed concrete piles driven into Louisiana soils, continued
State ProjectIdentification -
424-05-0078Bayou Boeuf BridgeMain Span
424-05-0078Bayou Boeuf BridgeMain Span
424-05-0087Bayou Ramos Bridge
424-05-0087Bayou Ramos Bridge
424-05-0087Bayou Ramos Bridge
Pile and SoilIdentification
Pile ID TP2, 14" Square PPC TP5, 14" Square PPC TP1, 16" Square PPC TP2, 30" Square PPC TP3, 30" Square PPC
Pile Length (ft) 80 85 85 115 115
Embedded Length (ft) 70 80 78 88 104
Pile Classification Friction Friction Friction Friction Friction
Pile Tested to Failure Yes Yes Yes Yes Yes
Predominant Soil * Cohesive Cohesive Cohesive Cohesive andCohesionless
Cohesive andCohesionless
Methods ofPredictingPile Capacityby ConePenetrationTest
Predicted Ultimate Load (ton)
Qs Qt Qu Qs Qt Qu Qs Qt Qu Qs Qt Qu Qs Qt Qu
Schmertmann 88.2 22.2 110.4 60.2 0.9 61.1 118.3 67.3 185.6 409.3 169.6 578.9 410.6 200.8 611.4
de Ruiter & Beringen 96.6 14.0 110.6 65.4 0.4 65.8 110.1 51.2 161.3 382.8 132.4 515.2 719.9 839.6 609.8
LCPC 93.8 23.8 117.6 90.1 0.7 90.8 133.0 41.9 174.9 396.8 179.5 576.3 447.3 183.4 630.7
Tumay & Fakhroo 122.0 38.5 160.5 163.3 1.2 164.5 153.5 83.3 236.8 356.5 169.7 526.2 375.6 212.9 588.5
Aoki & De Alencar 63.0 29.0 92.0 44.7 1.8 46.5 72.6 54.5 127.1 286.8 174.7 461.5 310.2 183.1 493.3
Price & Wardle 52.0 14.7 66.7 30.3 0.5 30.8 69.3 32.6 101.9 277.6 108.1 385.7 281.6 111.7 393.3
Philipponnat 119.9 19.1 139.0 70.9 0.7 71.6 125.6 39.5 165.1 531.0 132.2 663.2 648.2 136.1 784.3
Penpile 50.3 10.6 60.9 33.0 0.3 33.3 66.6 15.6 82.2 210.6 58.3 268.9 231.4 62.1 293.5
Load TestInterpretation Method
Butler-Hoy (used by DOTD) - - 108.0 - - 117.0 - - 132.0 - - 488.0 - - 466.0
StaticAnalysis
"-method (used by DOTD)
130.4 9.3 139.7 132.2 9.3 141.5 114.3 2.9 117.2 301.6 42.6 344.2 380.9 42.6 423.5
*: Cohesive (mainly clayey and silty clay soils) and Cohesionless (mainly sandy soils); Qs: Pile shaft capacity (friction); Qt: Pile tip capacity (end-bearing)Qu: Total ultimate capacity (Qs+Qt)
48

Table–12 Results of the analyses conducted on square precast prestressed concrete piles driven into Louisiana soils, continued
State ProjectIdentification -
424-05-0087Bayou Ramos Bridge
424-05-0087Bayou Ramos Bridge
424-05-0087Bayou Ramos Bridge
424-05-0087Bayou Ramos Bridge
424-06-0005Bayou Boeuf BridgeEast Approach
Pile and SoilIdentification
Pile ID TP4, 30" Square PPC TP5, 30" Square PPC TP6, 30" Square PPC TP7, 16" Square PPC TP1, 14" Square PPC
Pile Length (ft) 115 115 119 85 70
Embedded Length (ft) 99.3 113 112 77 68
Pile Classification End-bearing End-bearing End-bearing Friction Friction
Pile Tested to Failure Yes Yes No Yes Yes
Predominant Soil * Cohesive andCohesionless
Cohesive andCohesionless
Cohesive andCohesionless
Cohesive Cohesive
Methods ofPredictingPile Capacityby ConePenetrationTest
Predicted Ultimate Load (ton)
Qs Qt Qu Qs Qt Qu Qs Qt Qu Qs Qt Qu Qs Qt Qu
Schmertmann 394.0 289.9 683.9 384.7 460.1 844.8 384.4 287.4 671.8 127.5 14.0 141.5 84.9 16.2 101.1
de Ruiter & Beringen 407.3 263.4 643.7 554.5 330.8 885.3 359.8 207.2 567.0 103.4 6.3 109.7 69.5 7.3 76.8
LCPC 459.5 215.7 675.2 587.0 439.1 1026.1
394.6 317.4 712.0 123.8 9.9 133.7 87.7 10.5 98.2
Tumay & Fakhroo 419.0 373.7 792.7 380.5 642.0 1022.5
431.8 524.9 956.7 140.8 14.1 154.9 117.6 16.5 134.1
Aoki & De Alencar 306.6 384.7 691.3 380.3 598.6 978.9 270.5 457.4 727.9 68.1 12.2 80.3 47.6 9.9 57.5
Price & Wardle 279.4 203.9 483.3 259.5 384.0 643.5 244.6 282.3 526.9 77.9 8.0 85.9 48.8 6.1 54.9
Philipponnat 605.8 246.0 851.8 574.7 450.5 1025.2
435.0 335.1 770.1 118.0 7.9 125.9 72.0 8.2 80.2
Penpile 213.0 76.0 289.0 228.5 158.0 386.5 205.6 121.0 326.6 72.7 4.7 77.4 47.8 4.4 52.2
Load TestInterpretation Method
Butler-Hoy (used by DOTD) - - 552 - - 538.0 - - 447.0 - - 108.0 - - 97.0
StaticAnalysis
"-method (used by DOTD)
354.8 42.6 397.4 331.9 32.3 364.2 318.9 42.6 361.5 100.0 7.0 107.0 93.9 4.7 98.6
*: Cohesive (mainly clayey and silty clay soils) and Cohesionless (mainly sandy soils); Qs: Pile shaft capacity (friction); Qt: Pile tip capacity (end-bearing)Qu: Total ultimate capacity (Qs+Qt)
49
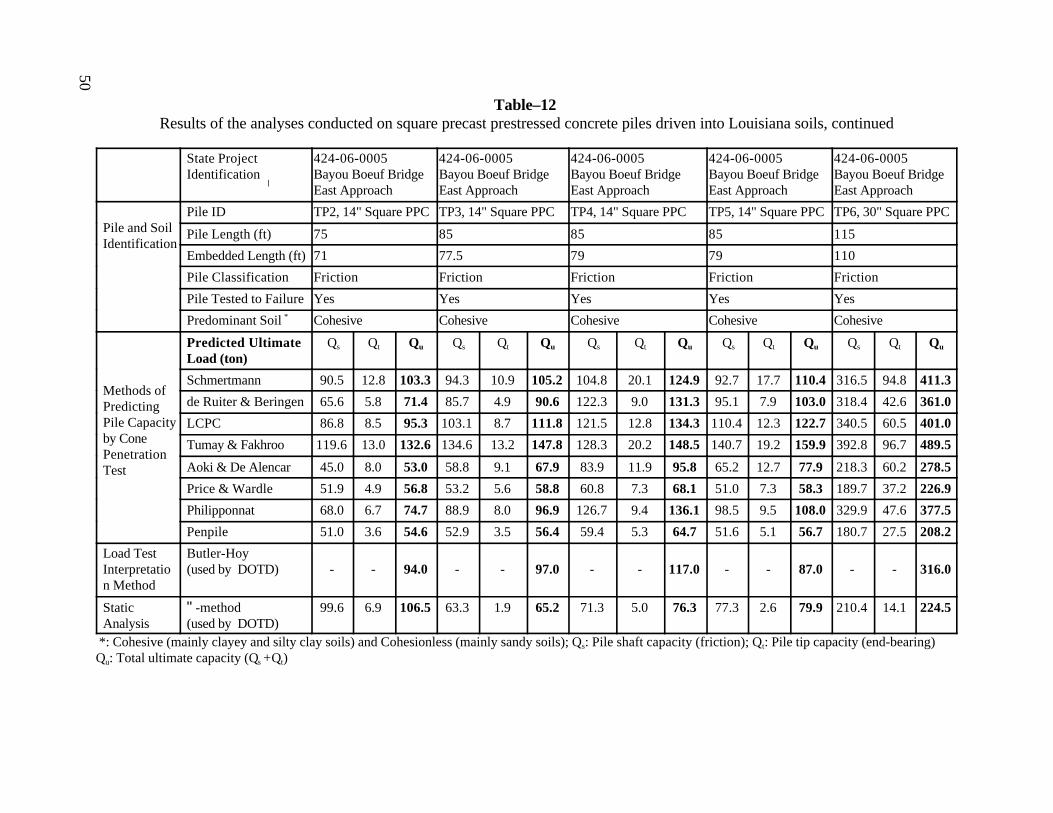
Table–12 Results of the analyses conducted on square precast prestressed concrete piles driven into Louisiana soils, continued
State ProjectIdentification -
424-06-0005Bayou Boeuf BridgeEast Approach
424-06-0005Bayou Boeuf BridgeEast Approach
424-06-0005Bayou Boeuf BridgeEast Approach
424-06-0005Bayou Boeuf BridgeEast Approach
424-06-0005Bayou Boeuf BridgeEast Approach
Pile and SoilIdentification
Pile ID TP2, 14" Square PPC TP3, 14" Square PPC TP4, 14" Square PPC TP5, 14" Square PPC TP6, 30" Square PPC
Pile Length (ft) 75 85 85 85 115
Embedded Length (ft) 71 77.5 79 79 110
Pile Classification Friction Friction Friction Friction Friction
Pile Tested to Failure Yes Yes Yes Yes Yes
Predominant Soil * Cohesive Cohesive Cohesive Cohesive Cohesive
Methods ofPredictingPile Capacityby ConePenetrationTest
Predicted Ultimate Load (ton)
Qs Qt Qu Qs Qt Qu Qs Qt Qu Qs Qt Qu Qs Qt Qu
Schmertmann 90.5 12.8 103.3 94.3 10.9 105.2 104.8 20.1 124.9 92.7 17.7 110.4 316.5 94.8 411.3
de Ruiter & Beringen 65.6 5.8 71.4 85.7 4.9 90.6 122.3 9.0 131.3 95.1 7.9 103.0 318.4 42.6 361.0
LCPC 86.8 8.5 95.3 103.1 8.7 111.8 121.5 12.8 134.3 110.4 12.3 122.7 340.5 60.5 401.0
Tumay & Fakhroo 119.6 13.0 132.6 134.6 13.2 147.8 128.3 20.2 148.5 140.7 19.2 159.9 392.8 96.7 489.5
Aoki & De Alencar 45.0 8.0 53.0 58.8 9.1 67.9 83.9 11.9 95.8 65.2 12.7 77.9 218.3 60.2 278.5
Price & Wardle 51.9 4.9 56.8 53.2 5.6 58.8 60.8 7.3 68.1 51.0 7.3 58.3 189.7 37.2 226.9
Philipponnat 68.0 6.7 74.7 88.9 8.0 96.9 126.7 9.4 136.1 98.5 9.5 108.0 329.9 47.6 377.5
Penpile 51.0 3.6 54.6 52.9 3.5 56.4 59.4 5.3 64.7 51.6 5.1 56.7 180.7 27.5 208.2
Load TestInterpretation Method
Butler-Hoy (used by DOTD) - - 94.0 - - 97.0 - - 117.0 - - 87.0 - - 316.0
StaticAnalysis
"-method (used by DOTD)
99.6 6.9 106.5 63.3 1.9 65.2 71.3 5.0 76.3 77.3 2.6 79.9 210.4 14.1 224.5
*: Cohesive (mainly clayey and silty clay soils) and Cohesionless (mainly sandy soils); Qs: Pile shaft capacity (friction); Qt: Pile tip capacity (end-bearing)Qu: Total ultimate capacity (Qs +Qt)
50

Table–12 Results of the analyses conducted on square precast prestressed concrete piles driven into Louisiana soils, continued
State ProjectIdentification -
262-06-09Tickfaw River Bridge # 1
262-06-09Tickfaw RiverBridge # 1
424-07-09Gibson-ChacahoulaState Route LA 3052
424-07-09Gibson-ChacahoulaState Route LA 3052
424-07-09Gibson-ChacahoulaState Route LA 3052
Pile and SoilIdentification
Pile ID TP1, 24" Square PPC TP2, 24" Square PPC TP1, 30" Square PPC TP3, 30" Square PPC TP4, 30" Square PPC
Pile Length (ft) 85 105 120 125 125
Embedded Length (ft) 84.9 105 116 122 124
Pile Classification Friction Friction End-bearing End-bearing End-bearing
Pile Tested to Failure No No Yes No Yes
Predominant Soil * Cohesionless Cohesionless Cohesive andCohesionless
Cohesive andCohesionless
Cohesive andCohesionless
Methods ofPredictingPile Capacityby ConePenetrationTest
Predicted Ultimate Load (ton)
Qs Qt Qu Qs Qt Qu Qs Qt Qu Qs Qt Qu Qs Qt Qu
Schmertmann 271.2 121.7 392.9 402.4 340.8 743.2 341.7 503.0 844.7 337.0 661.2 998.2 336.4 331.4 667.8
de Ruiter & Beringen 323.8 99.4 423.2 431.0 308.1 739.1 330.8 366.3 697.1 543.5 476.1 1019.6
358.3 208.8 567.1
LCPC 332.2 93.0 425.2 412.3 156.3 568.6 376.7 434.7 811.4 383.5 566.4 949.9 391.9 213.9 605.8
Tumay & Fakhroo 229.5 121.7 351.2 288.4 346.9 635.3 474.3 487.5 961.8 448.3 661.9 1110.2
479.6 465.4 945.0
Aoki & De Alencar 294.3 124.9 419.2 394.5 219.8 614.3 242.0 442.5 684.5 370.7 612.3 983.0 234.8 288.5 523.3
Price & Wardle 166.8 83.1 249.9 263.3 132.8 396.1 199.0 302.5 501.5 198.0 404.2 602.2 194.5 160.0 354.5
Philipponnat 519.4 98.6 618.0 687.3 150.1 837.4 405.0 356.4 761.4 576.4 477.2 1053.6
416.0 199.7 615.7
Penpile 143.9 34.0 177.9 211.1 56.4 267.5 184.0 142.5 326.5 189.1 179.1 368.2 180.3 90.3 270.6
Load TestInterpretation Method
Butler-Hoy (used by DOTD) - - 230.0 - - 258.0 - - 620.0 - - 670.0 - - 610.0
StaticAnalysis
"-method (used by DOTD)
416.8 27.3 444.1 557.3 84.9 642.2 392.4 42.6 435.0 352.6 627.4 980.0 366.5 627.4 993.9
*: Cohesive (mainly clayey and silty clay soils) and Cohesionless (mainly sandy soils); Qs: Pile shaft capacity (friction); Qt: Pile tip capacity (end-bearing)Qu: Total ultimate capacity (Qs.+Qt)
51

Table–12 Results of the analyses conducted on square precast prestressed concrete piles driven into Louisiana soils, continued
State ProjectIdentification -
424-07-08Gibson to RacelandHighway
424-07-08Gibson to RacelandHighway
424-07-08Gibson to RacelandHighway
450-36-02Luling Bridge (NorthApproach)- US 61
858-01-0008Rosepine-BeauregardParish Line Bridges
Pile and SoilIdentification
Pile ID TP1, 30" Square PPC TP2, 24" Square PPC TP3, 30" Square PPC TP8, 30" Square PPC TP1, 14" Square PPC
Pile Length (ft) 137 129 137 120 80
Embedded Length (ft) 132.7 115 127.4 112 80
Pile Classification End-bearing End-bearing End-bearing End-bearing Friction
Pile Tested to Failure No No No Yes No
Predominant Soil * Cohesive andCohesionless
Cohesive andCohesionless
Cohesive andCohesionless
Cohesive andCohesionless
Cohesionless
Methods ofPredictingPile Capacityby ConePenetrationTest
Predicted Ultimate Load (ton)
Qs Qt Qu Qs Qt Qu Qs Qt Qu Qs Qt Qu Qs Qt Qu
Schmertmann 448.2 429.5 877.7 255.8 135.0 390.8 511.9 409.0 920.9 397.9 324.1 722.0 193.4 91.7 285.1
de Ruiter & Beringen 459.6 313.8 773.4 158.3 78.7 237.0 452.7 342.6 795.3 513.3 232.3 745.6 202.1 80.6 282.7
LCPC 483.5 312.8 796.3 214.0 97.0 311.0 480.8 373.3 854.1 493.3 502.4 995.7 187.8 47.1 234.9
Tumay & Fakhroo 510.8 542.2 1053.0
342.2 155.2 497.4 523.5 481.4 1004.9
501.6 559.8 1061.4
135.8 97.9 233.7
Aoki & De Alencar 312.9 392.6 705.5 108.1 112.2 220.3 381.3 493.3 874.6 338.6 640.0 978.6 162.8 62.4 225.2
Price & Wardle 289.9 254.9 544.8 144.6 64.7 209.3 359.1 350.1 709.2 310.8 326.2 637.0 125.6 38.3 163.9
Philipponnat 574.3 301.3 875.6 175.3 83.1 258.4 592.7 341.9 934.6 658.5 398.3 1056.8
282.7 44.6 327.3
Penpile 238.8 111.8 350.6 140.5 40.3 180.8 259.0 140.1 399.1 228.8 182.1 410.9 96.4 16.0 112.4
Load TestInterpretation Method
Butler-Hoy (used by DOTD) - - 688.0 - - 340.0 - - 658.0 - - 460.0 - - 119.0
StaticAnalysis
"-method (used by DOTD)
350.1 132.7 482.8 161.6 20.6 182.2 320.1 42.6 362.7 408.0 627.4 1035.4
246.4 9.3 255.7
*: Cohesive (mainly clayey and silty clay soils) and Cohesionless (mainly sandy soils); Qs: Pile shaft capacity (friction); Qt: Pile tip capacity (end-bearing)Qu: Total ultimate capacity (Qs.+Qt)
52
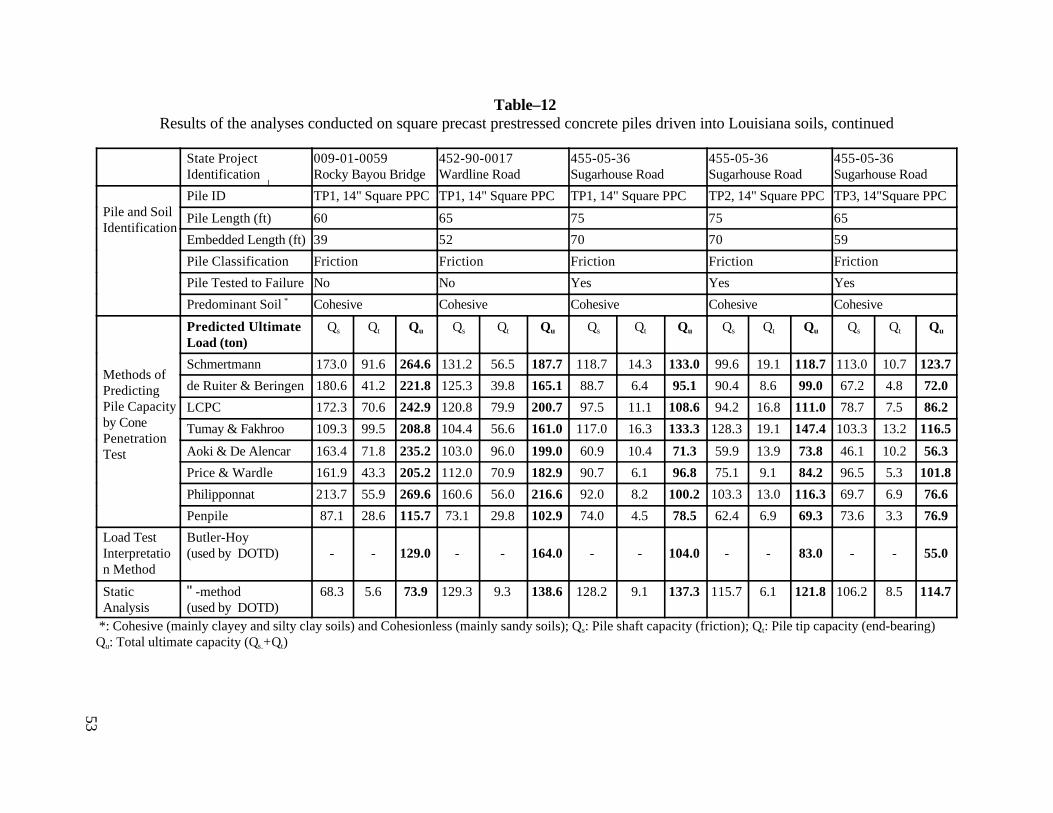
Table–12 Results of the analyses conducted on square precast prestressed concrete piles driven into Louisiana soils, continued
State ProjectIdentification -
009-01-0059Rocky Bayou Bridge
452-90-0017Wardline Road
455-05-36Sugarhouse Road
455-05-36Sugarhouse Road
455-05-36Sugarhouse Road
Pile and SoilIdentification
Pile ID TP1, 14" Square PPC TP1, 14" Square PPC TP1, 14" Square PPC TP2, 14" Square PPC TP3, 14"Square PPC
Pile Length (ft) 60 65 75 75 65
Embedded Length (ft) 39 52 70 70 59
Pile Classification Friction Friction Friction Friction Friction
Pile Tested to Failure No No Yes Yes Yes
Predominant Soil * Cohesive Cohesive Cohesive Cohesive Cohesive
Methods ofPredictingPile Capacityby ConePenetrationTest
Predicted Ultimate Load (ton)
Qs Qt Qu Qs Qt Qu Qs Qt Qu Qs Qt Qu Qs Qt Qu
Schmertmann 173.0 91.6 264.6 131.2 56.5 187.7 118.7 14.3 133.0 99.6 19.1 118.7 113.0 10.7 123.7
de Ruiter & Beringen 180.6 41.2 221.8 125.3 39.8 165.1 88.7 6.4 95.1 90.4 8.6 99.0 67.2 4.8 72.0
LCPC 172.3 70.6 242.9 120.8 79.9 200.7 97.5 11.1 108.6 94.2 16.8 111.0 78.7 7.5 86.2
Tumay & Fakhroo 109.3 99.5 208.8 104.4 56.6 161.0 117.0 16.3 133.3 128.3 19.1 147.4 103.3 13.2 116.5
Aoki & De Alencar 163.4 71.8 235.2 103.0 96.0 199.0 60.9 10.4 71.3 59.9 13.9 73.8 46.1 10.2 56.3
Price & Wardle 161.9 43.3 205.2 112.0 70.9 182.9 90.7 6.1 96.8 75.1 9.1 84.2 96.5 5.3 101.8
Philipponnat 213.7 55.9 269.6 160.6 56.0 216.6 92.0 8.2 100.2 103.3 13.0 116.3 69.7 6.9 76.6
Penpile 87.1 28.6 115.7 73.1 29.8 102.9 74.0 4.5 78.5 62.4 6.9 69.3 73.6 3.3 76.9
Load TestInterpretation Method
Butler-Hoy (used by DOTD) - - 129.0 - - 164.0 - - 104.0 - - 83.0 - - 55.0
StaticAnalysis
"-method (used by DOTD)
68.3 5.6 73.9 129.3 9.3 138.6 128.2 9.1 137.3 115.7 6.1 121.8 106.2 8.5 114.7
*: Cohesive (mainly clayey and silty clay soils) and Cohesionless (mainly sandy soils); Qs: Pile shaft capacity (friction); Qt: Pile tip capacity (end-bearing)Qu: Total ultimate capacity (Qs.+Qt)
53
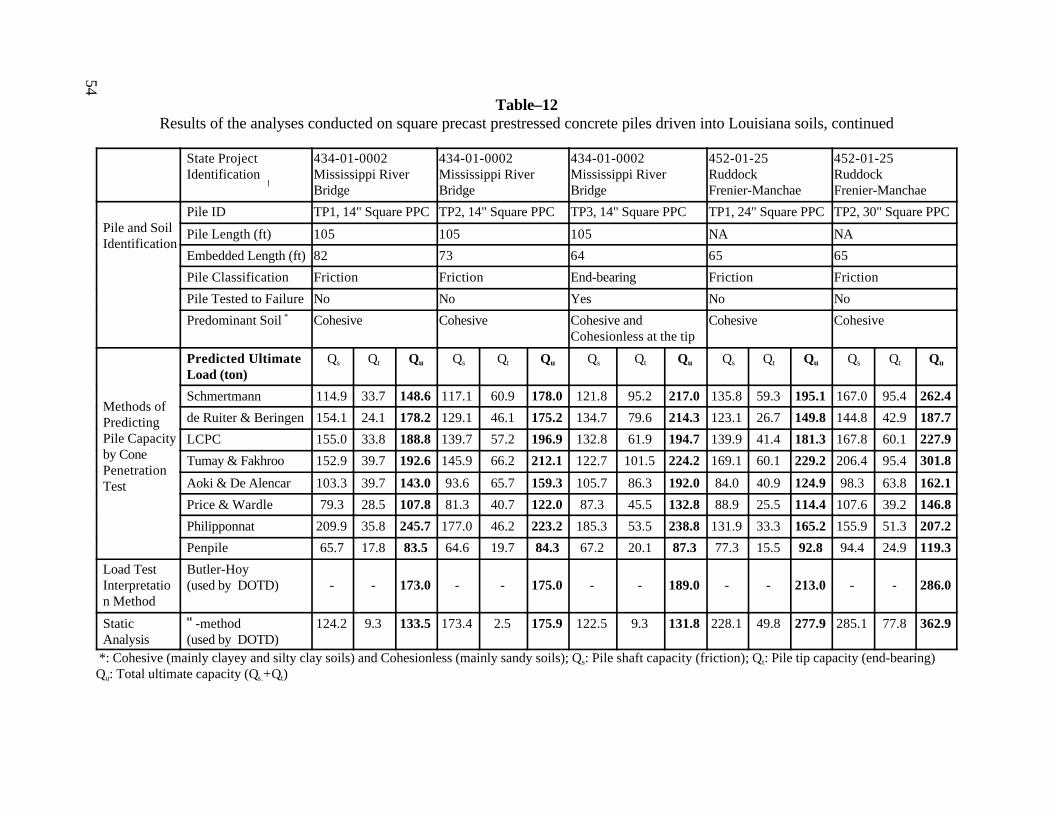
Table–12 Results of the analyses conducted on square precast prestressed concrete piles driven into Louisiana soils, continued
State ProjectIdentification -
434-01-0002Mississippi RiverBridge
434-01-0002Mississippi RiverBridge
434-01-0002Mississippi RiverBridge
452-01-25RuddockFrenier-Manchae
452-01-25RuddockFrenier-Manchae
Pile and SoilIdentification
Pile ID TP1, 14" Square PPC TP2, 14" Square PPC TP3, 14" Square PPC TP1, 24" Square PPC TP2, 30" Square PPC
Pile Length (ft) 105 105 105 NA NA
Embedded Length (ft) 82 73 64 65 65
Pile Classification Friction Friction End-bearing Friction Friction
Pile Tested to Failure No No Yes No No
Predominant Soil * Cohesive Cohesive Cohesive andCohesionless at the tip
Cohesive Cohesive
Methods ofPredictingPile Capacityby ConePenetrationTest
Predicted Ultimate Load (ton)
Qs Qt Qu Qs Qt Qu Qs Qt Qu Qs Qt Qu Qs Qt Qu
Schmertmann 114.9 33.7 148.6 117.1 60.9 178.0 121.8 95.2 217.0 135.8 59.3 195.1 167.0 95.4 262.4
de Ruiter & Beringen 154.1 24.1 178.2 129.1 46.1 175.2 134.7 79.6 214.3 123.1 26.7 149.8 144.8 42.9 187.7
LCPC 155.0 33.8 188.8 139.7 57.2 196.9 132.8 61.9 194.7 139.9 41.4 181.3 167.8 60.1 227.9
Tumay & Fakhroo 152.9 39.7 192.6 145.9 66.2 212.1 122.7 101.5 224.2 169.1 60.1 229.2 206.4 95.4 301.8
Aoki & De Alencar 103.3 39.7 143.0 93.6 65.7 159.3 105.7 86.3 192.0 84.0 40.9 124.9 98.3 63.8 162.1
Price & Wardle 79.3 28.5 107.8 81.3 40.7 122.0 87.3 45.5 132.8 88.9 25.5 114.4 107.6 39.2 146.8
Philipponnat 209.9 35.8 245.7 177.0 46.2 223.2 185.3 53.5 238.8 131.9 33.3 165.2 155.9 51.3 207.2
Penpile 65.7 17.8 83.5 64.6 19.7 84.3 67.2 20.1 87.3 77.3 15.5 92.8 94.4 24.9 119.3
Load TestInterpretation Method
Butler-Hoy (used by DOTD) - - 173.0 - - 175.0 - - 189.0 - - 213.0 - - 286.0
StaticAnalysis
"-method (used by DOTD)
124.2 9.3 133.5 173.4 2.5 175.9 122.5 9.3 131.8 228.1 49.8 277.9 285.1 77.8 362.9
*: Cohesive (mainly clayey and silty clay soils) and Cohesionless (mainly sandy soils); Qs: Pile shaft capacity (friction); Qt: Pile tip capacity (end-bearing)Qu: Total ultimate capacity (Qs.+Qt)
54

Table–12 Results of the analyses conducted on square precast prestressed concrete piles driven into Louisiana soils, continued
State ProjectIdentification -
452-01-25RuddockFrenier-Manchae
452-01-25RuddockFrenier-Manchae
005-01-0056Southern PacificRailroad Overpass
005-01-0056Southern PacificRailroad Overpass
005-01-0056Southern PacificRailroad Overpass
Pile and SoilIdentification
Pile ID TP3, 24" Square PPC TP4, 30" Square PPC TP1, 24" Square PPC TP2, 14" Square PPC TP3, 24" Square PPC
Pile Length (ft) NA NA 90 74 92
Embedded Length (ft) 90 80 85 64 87
Pile Classification Friction Friction Friction Friction Friction
Pile Tested to Failure No No Yes Yes Yes
Predominant Soil * Cohesive Cohesive Cohesive Cohesive Cohesive
Methods ofPredictingPile Capacityby ConePenetrationTest
Predicted Ultimate Load (ton)
Qs Qt Qu Qs Qt Qu Qs Qt Qu Qs Qt Qu Qs Qt Qu
Schmertmann 201.5 69.9 271.4 204.3 77.4 281.7 216.0 38.2 254.2 95.2 19.3 114.5 254.8 39.8 294.6
de Ruiter & Beringen 231.7 41.6 273.3 224.4 45.8 270.2 145.1 17.2 162.3 87.3 13.4 100.7 214.7 17.9 232.6
LCPC 214.8 78.1 292.9 225.6 49.7 275.3 183.7 27.7 211.4 101.1 26.1 127.2 241.4 36.6 278.0
Tumay & Fakhroo 242.3 148.5 390.8 255.6 106.7 362.3 222.8 44.6 267.4 108.6 25.9 134.5 223.6 41.1 264.7
Aoki & De Alencar 158.6 100.1 258.7 152.9 76.0 228.9 99.5 38.4 137.9 55.6 29.2 84.8 141.1 33.9 175.0
Price & Wardle 137.1 48.4 185.5 124.1 39.1 163.2 134.4 20.5 154.9 60.8 13.3 74.1 166.6 21.0 187.6
Philipponnat 244.5 64.5 309.0 238.4 44.8 283.2 150.4 28.0 178.4 108.9 17.4 126.3 250.5 23.7 274.2
Penpile 117.8 30.9 148.7 113.9 21.7 135.6 124.7 13.2 137.9 54.3 8.5 62.8 146.0 16.8 162.8
Load TestInterpretation Method
Butler-Hoy (used by DOTD) - - 297.0 - - 495.0 - - 204.0 - - 129.0 - - 309.0
StaticAnalysis
"-method (used by DOTD)
365.3 653.8 1019.1
370.9 17.7 388.6 223.4 12.4 235.8 106.5 154.6 261.1 272.8 39.4 312.2
*: Cohesive (mainly clayey and silty clay soils) and Cohesionless (mainly sandy soils); Qs: Pile shaft capacity (friction); Qt: Pile tip capacity (end-bearing)Qu: Total ultimate capacity (Qs.+Qt)
55

Table–12 Results of the analyses conducted on square precast prestressed concrete piles driven into Louisiana soils, continued
State ProjectIdentification -
283-03-52New Orleans I
283-09-52New Orleans II
23-01-12Alexandria
23-01-12Alexandria
855-14-13Houma
Pile and SoilIdentification
Pile ID TP1, 18" Square PPC TP6, 16" Square PPC TP1, 14" Square PPC TP3, 14" Square PPC TP1, 18" Square PPC
Pile Length (ft) NA NA NA NA NA
Embedded Length (ft) 125 125 31 45 105
Pile Classification Friction End-bearing Friction Friction Friction
Pile Tested to Failure Yes No Yes No Yes
Predominant Soil * Cohesive andcohesionless
Cohesive andcohesionless
Cohesionless Cohesionless Cohesive
Methods ofPredictingPile Capacityby ConePenetrationTest
Predicted Ultimate Load (ton)
Qs Qt Qu Qs Qt Qu Qs Qt Qs Qt Qu Qs Qt Qu Qs
Schmertmann 221.1 37.9 259.0 149.7 44.0 193.7 123.2 17.4 140.6 145.2 21.7 166.9 163.8 20.3 184.1
de Ruiter & Beringen 208.9 24.5 233.4 114.3 28.2 142.5 92.0 12.8 104.8 116.7 12.8 129.5 148.0 9.1 157.1
LCPC 217.2 22.4 239.6 119.8 34.9 154.7 95.8 10.6 106.4 117.1 12.6 129.7 171.5 13.9 185.4
Tumay & Fakhroo 260.4 59.2 319.6 198.3 55.8 254.1 85.6 17.8 103.3 105.5 25.4 130.9 205.1 23.3 228.4
Aoki & De Alencar 137.8 40.0 177.8 75.6 45.5 121.1 92.6 41.1 133.7 109.7 17.5 127.2 103.7 16.1 119.8
Price & Wardle 130.0 22.0 152.0 87.5 30.4 117.9 100.2 17.5 117.7 114.0 10.1 124.1 93.6 10.3 103.9
Philipponnat 256.4 27.6 284.0 139.2 37.6 176.8 143.8 7.4 151.2 175.5 12.3 187.8 166.6 13.5 180.1
Penpile 121.2 10.0 131.2 83.8 14.4 98.2 53.7 4.4 58.1 66.5 5.5 72.0 90.6 6.0 96.6
Load TestInterpretation Method
Butler-Hoy (used by DOTD) - - 319.0 - - 179.0 - - 81.0 - - 119.0 - - 211.0
StaticAnalysis
"-method (used by DOTD)
307.7 167.7 475.4 208.6 14.8 223.4 59.3 10.8 70.1 88.8 7.0 95.8 210.1 16.3 226.4
*: Cohesive (mainly clayey and silty clay soils) and Cohesionless (mainly sandy soils); Qs: Pile shaft capacity (friction); Qt: Pile tip capacity (end-bearing)Qu: Total ultimate capacity (Qs.+Qt)
56

Comparison of measured and ultimate pile capacity predicted by Schmertmann method
1 2 3 4 5 6 7 8 9 10 11 12 13 14 15 16 17 18 19 20 21 22 23 24 25 26 27 28 29 30 31 32 33 34 35 36 37 38 39 40
P ile nu mber
0
100
200
300
400
500
600
700
800
900C
ap
aci
ty (
To
ns)
End bearing capacity
Friction capacityButler-Hoy capacity
Figure 18
57

Comparison of measured and ultimate pile capacity predicted by de Ruiter and Beringen method
1 2 3 4 5 6 7 8 9 10 11 12 13 14 15 16 17 18 19 20 21 22 23 24 25 26 27 28 29 30 31 32 33 34 35 36 37 38 39 40
Pile number
0
100
200
300
400
500
600
700
800
900
Ca
pa
city
(T
on
s)End bearing capacityFriction capacity
Butler-Hoy capacity
Figure 19
58

Comparison of measured and ultimate pile capacity predicted by LCPC method
1 2 3 4 5 6 7 8 9 10 11 12 13 14 15 16 17 18 19 20 21 22 23 24 25 26 27 28 29 30 31 32 33 34 35 36 37 38 39 40
Pile number
0
100
200
300
400
500
600
700
800
900
1000
1100C
ap
aci
ty (
To
ns)
End bearing capacityFriction capacity
Butler-Hoy capacity
Figure 20
59

Comparison of measured and ultimate pile capacity predicted by Tumay and Fakhroo method
1 2 3 4 5 6 7 8 9 10 11 12 13 14 15 16 17 18 19 20 21 22 23 24 25 26 27 28 29 30 31 32 33 34 35 36 37 38 39 40
P ile number
0
100
200
300
400
500
600
700
800
900
1000
1100C
ap
aci
ty (
To
ns)
End bearing capacity
Friction capacityButler-Hoy capacity
Figure 21
60

Comparison of measured and ultimate pile capacity predicted by Philipponnat method
1 2 3 4 5 6 7 8 9 10 11 12 13 14 15 16 17 18 19 20 21 22 23 24 25 26 27 28 29 30 31 32 33 34 35 36 37 38 39 40
P ile number
0
100
200
300
400
500
600
700
800
900
1000
1100
Ca
pa
city
(T
on
s)End bearing capacityFriction capacity
Butler-Hoy capacity
Figure 22
61

Comparison of measured and ultimate pile capacity predicted by Aoki and De Alencar method
1 2 3 4 5 6 7 8 9 10 11 12 13 14 15 16 17 18 19 20 21 22 23 24 25 26 27 28 29 30 31 32 33 34 35 36 37 38 39 40
Pile number
0
100
200
300
400
500
600
700
800
900
1000C
ap
aci
ty (
To
ns)
End bearing capacity
Friction capacity
Butler-Hoy capacity
Figure 23
62
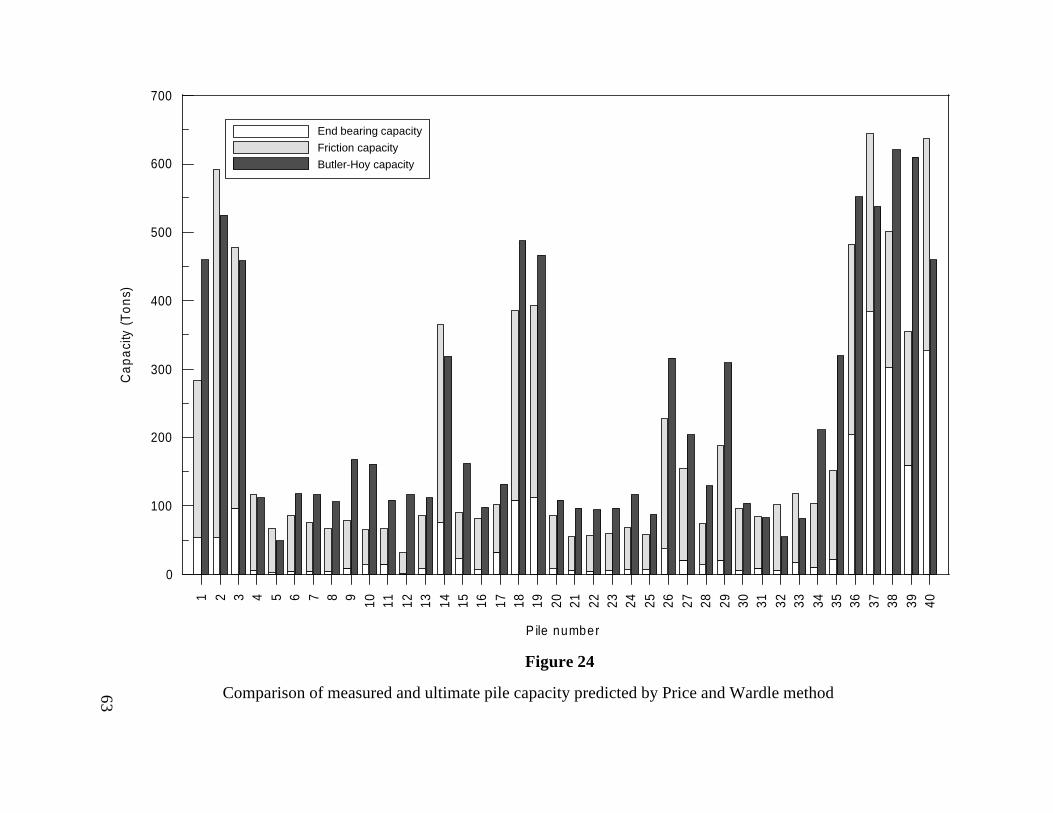
Comparison of measured and ultimate pile capacity predicted by Price and Wardle method
1 2 3 4 5 6 7 8 9 10 11 12 13 14 15 16 17 18 19 20 21 22 23 24 25 26 27 28 29 30 31 32 33 34 35 36 37 38 39 40
P ile number
0
100
200
300
400
500
600
700
Ca
pa
city
(T
on
s)End bearing capacity
Friction capacity
Butler-Hoy capacity
Figure 24
63
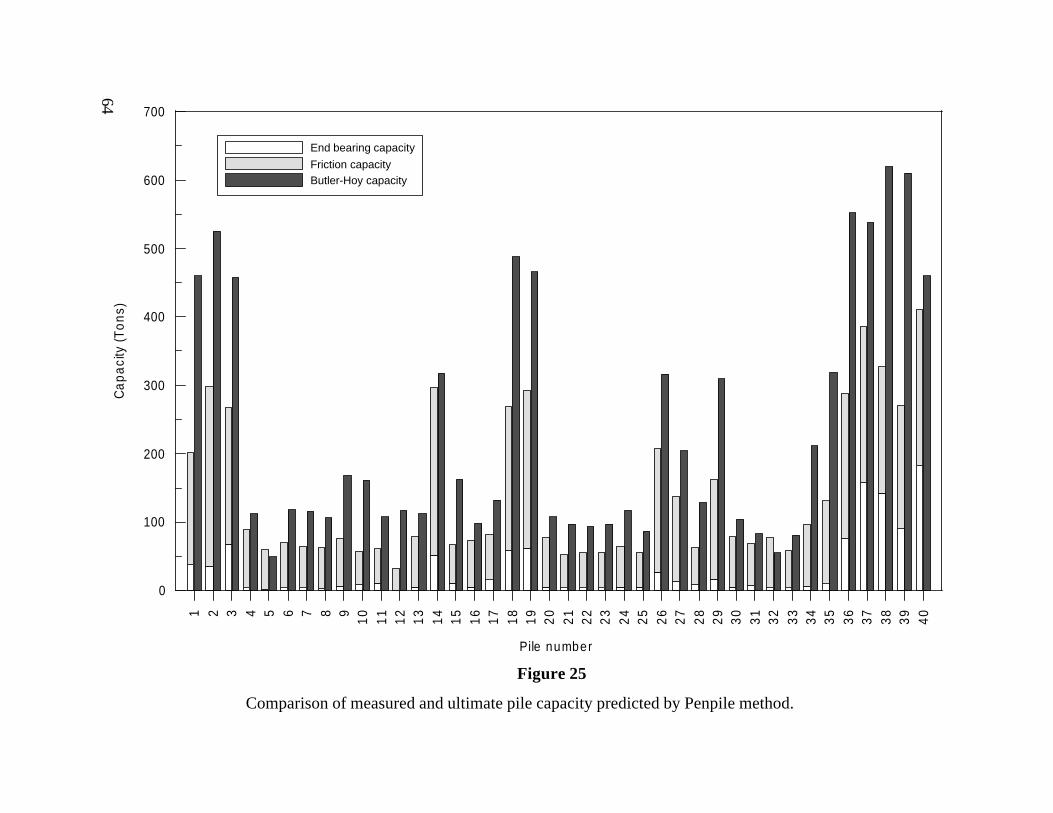
Comparison of measured and ultimate pile capacity predicted by Penpile method.
1 2 3 4 5 6 7 8 91
01
11
21
31
41
51
61
71
81
92
02
12
22
32
42
52
62
72
82
93
03
13
23
33
43
53
63
73
83
94
0
Pile number
0
100
200
300
400
500
600
700C
ap
aci
ty (
To
ns)
End bearing capacity
Friction capacityButler-Hoy capacity
Figure 25
64
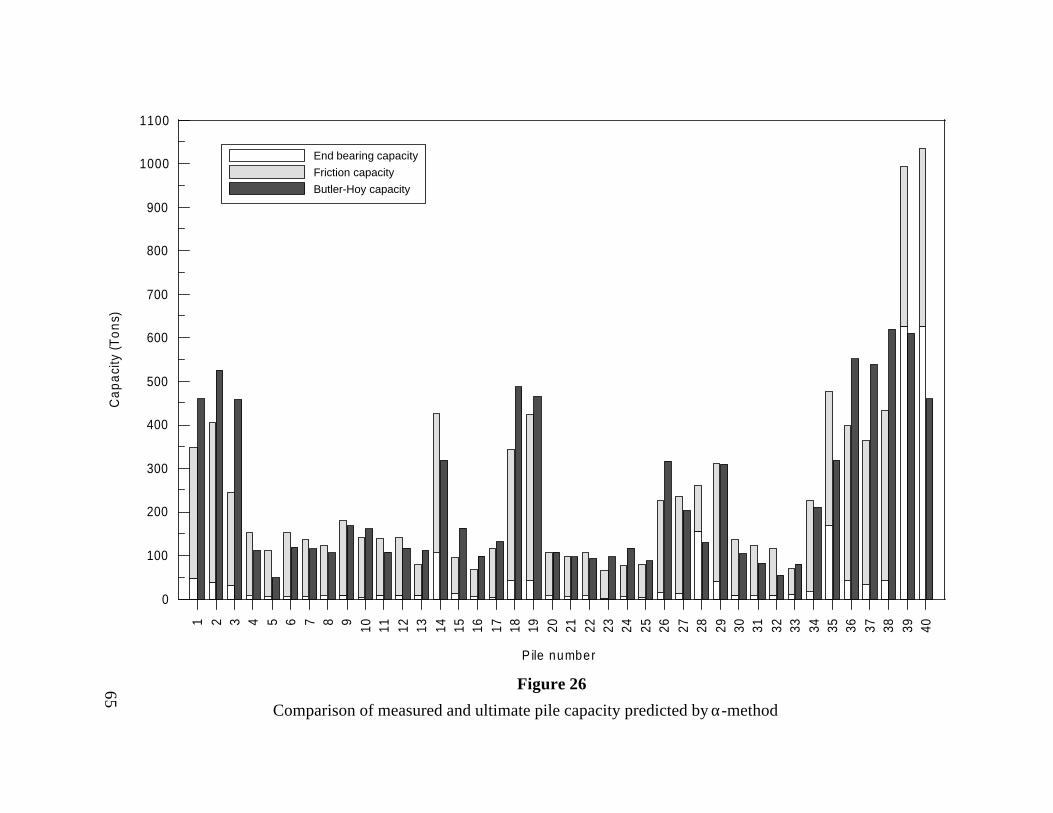
Comparison of measured and ultimate pile capacity predicted by α-method
1 2 3 4 5 6 7 8 9 10 11 12 13 14 15 16 17 18 19 20 21 22 23 24 25 26 27 28 29 30 31 32 33 34 35 36 37 38 39 40
P ile number
0
100
200
300
400
500
600
700
800
900
1000
1100C
ap
aci
ty (
To
ns)
End bearing capacity
Friction capacity
Butler-Hoy capacity
Figure 2665

0 200 400 600 800 1000
Measured pile capacity, Qm (tons)
0
200
400
600
800
1000
Pre
dict
ed p
ile c
apa
city
, QP (
ton
s)
QFit = 1.16 * Qm
R2 = 0.96
0 200 400 600 800 1000
Measured pile capacity, Qm (tons)
0
200
400
600
800
1000
Pre
dict
ed
pile
cap
aci
ty,
QP (
tons
) QFit = 1.24 * Qm
R2 = 0.96
Friction
End Bearing
Perfect
fit
Perfe
ct fit
Predicted (Schmertmann method) versus measured ultimate capacity
(a) Friction piles
(b) All piles
Figure 27
66

0 200 400 600 800 1000
Measured pile capacity, Qm (tons)
0
200
400
600
800
1000
Pre
dict
ed p
ile c
apa
city
, QP (
ton
s)
QFit = 1.02 * Qm
R2 = 0.96
0 200 400 600 800 1000
Measured pile capacity, Qm (tons)
0
200
400
600
800
1000
Pre
dict
ed
pile
cap
aci
ty,
QP (
tons
) QFit = 1.12 * Qm
R2 = 0.95
Friction
End Bearing
Perfect
fit
Perfe
ct fit
Predicted (de Ruiter and Beringen method) versus measured ultimate capacity
(a) Friction piles
(b) All piles
Figure 28
67

0 200 400 600 800 1000
Measured pile capacity, Qm (tons)
0
200
400
600
800
1000
Pre
dict
ed p
ile c
apa
city
, QP (
ton
s)
QFit = 0.97 * Qm
R2 = 0.95
0 200 400 600 800 1000
Measured pile capacity, Qm (tons)
0
200
400
600
800
1000
Pre
dict
ed
pile
cap
aci
ty,
QP (
tons
) QFit = 1.11 * Qm
R2 = 0.93
Friction
End Bearing
Perfect
fit
Perfe
ct fit
Predicted (LCPC method) versus measured ultimate capacity
(a) Friction piles
(b) All piles
Figure 29
68

0 200 400 600 800 1000
Measured pile capacity, Qm (tons)
0
200
400
600
800
1000
Pre
dict
ed p
ile c
apa
city
, QP (
ton
s)
QFit = 1.18 * Qm
R2 = 0.96
0 200 400 600 800 1000
Measured pile capacity, Qm (tons)
0
200
400
600
800
1000
Pre
dict
ed
pile
cap
aci
ty,
QP (
tons
) QFit = 1.41 * Qm
R2 = 0.93
Friction
End Bearing
Perfect
fit
Perfe
ct fit
Predicted (Tumay and Fakhroo method) versus measured ultimate capacity
(a) Friction piles
(b) All piles
Figure 30
69
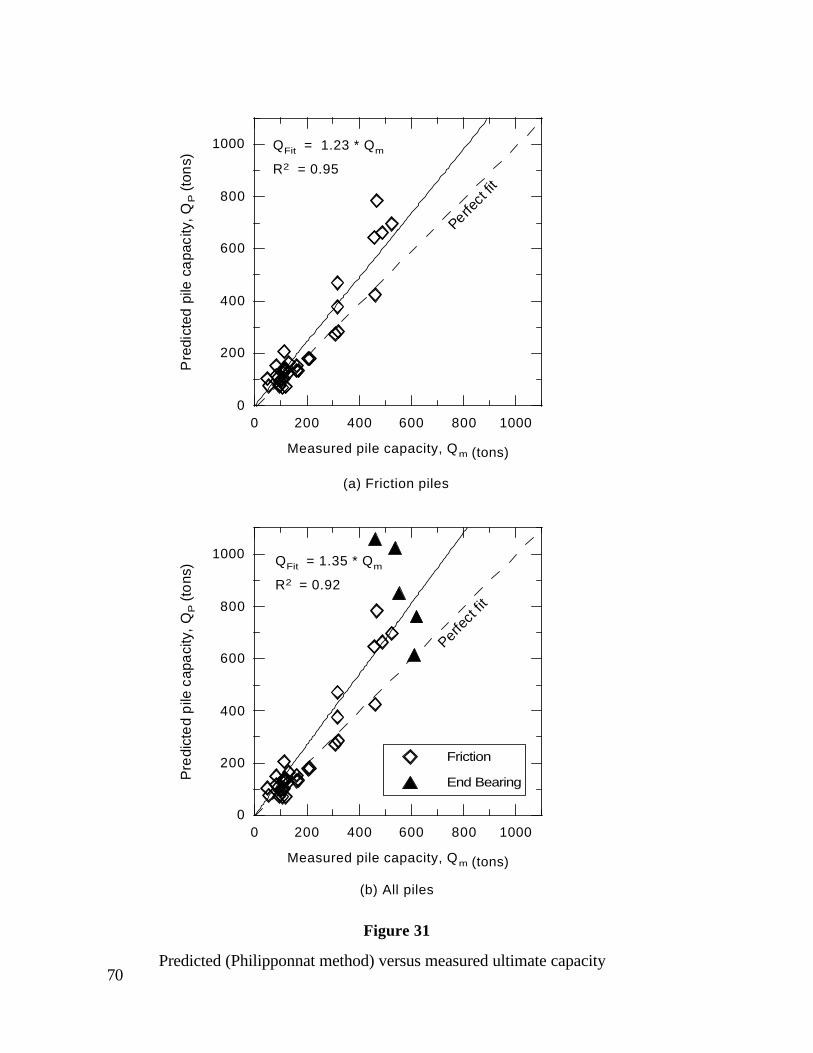
0 200 400 600 800 1000
Measured pile capacity, Qm (tons)
0
200
400
600
800
1000
Pre
dict
ed p
ile c
apa
city
, QP (
ton
s)
QFit = 1.23 * Qm
R2 = 0.95
0 200 400 600 800 1000
Measured pile capacity, Qm (tons)
0
200
400
600
800
1000
Pre
dict
ed
pile
cap
aci
ty,
QP (
tons
) QFit = 1.35 * Qm
R2 = 0.92
Friction
End Bearing
Perfect
fit
Perfe
ct fit
Predicted (Philipponnat method) versus measured ultimate capacity
(a) Friction piles
(b) All piles
Figure 31
70
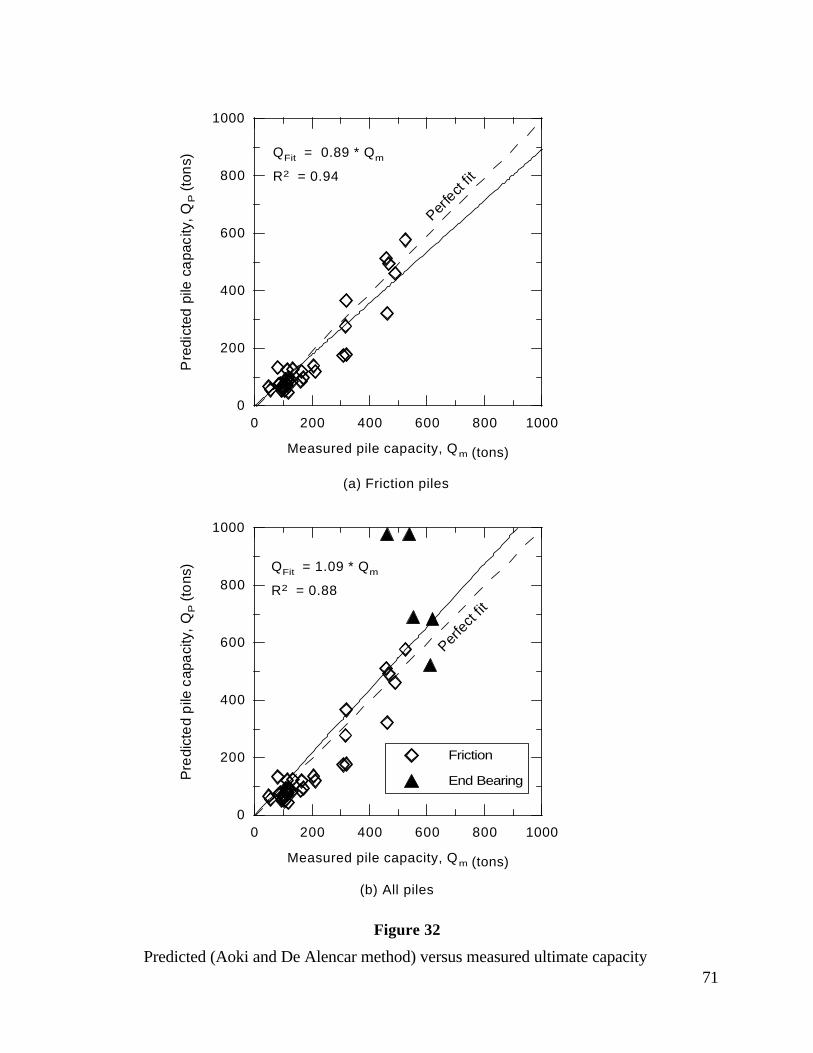
0 200 400 600 800 1000
Measured pile capacity, Qm (tons)
0
200
400
600
800
1000
Pre
dict
ed p
ile c
apa
city
, QP (
ton
s)
QFit = 0.89 * Qm
R2 = 0.94
0 200 400 600 800 1000
Measured pile capacity, Qm (tons)
0
200
400
600
800
1000
Pre
dict
ed
pile
cap
aci
ty,
QP (
tons
) QFit = 1.09 * Qm
R2 = 0.88
Friction
End Bearing
Perfe
ct fit
Perfe
ct fit
Predicted (Aoki and De Alencar method) versus measured ultimate capacity
(a) Friction piles
(b) All piles
Figure 32
71

0 200 400 600 800 1000
Measured pile capacity, Qm (tons)
0
200
400
600
800
1000
Pre
dict
ed p
ile c
apa
city
, QP (
ton
s)
QFit = 0.82 * Qm
R2 = 0.92
0 200 400 600 800 1000
Measured pile capacity, Qm (tons)
0
200
400
600
800
1000
Pre
dict
ed
pile
cap
aci
ty,
QP (
tons
) QFit = 0.86 * Qm
R2 = 0.92
Friction
End Bearing
Perfe
ct fit
Perfe
ct fit
Predicted (Price and Wardle method) versus measured ultimate capacity.
(a) Friction piles
(b) All piles
Figure 33
72

0 200 400 600 800 1000
Measured pile capacity, Qm (tons)
0
200
400
600
800
1000
Pre
dict
ed p
ile c
apa
city
, QP (
ton
s)
QFit = 0.57 * Qm
R2 = 0.95
0 200 400 600 800 1000
Measured pile capacity, Qm (tons)
0
200
400
600
800
1000
Pre
dict
ed
pile
cap
aci
ty,
QP (
tons
)
QFit = 0.58 * Qm
R2 = 0.95
Friction
End Bearing
Perfe
ct fit
Perfe
ct fit
Predicted (Penpile method) versus measured ultimate capacity
(a) Friction piles
(b) All piles
Figure 34
73
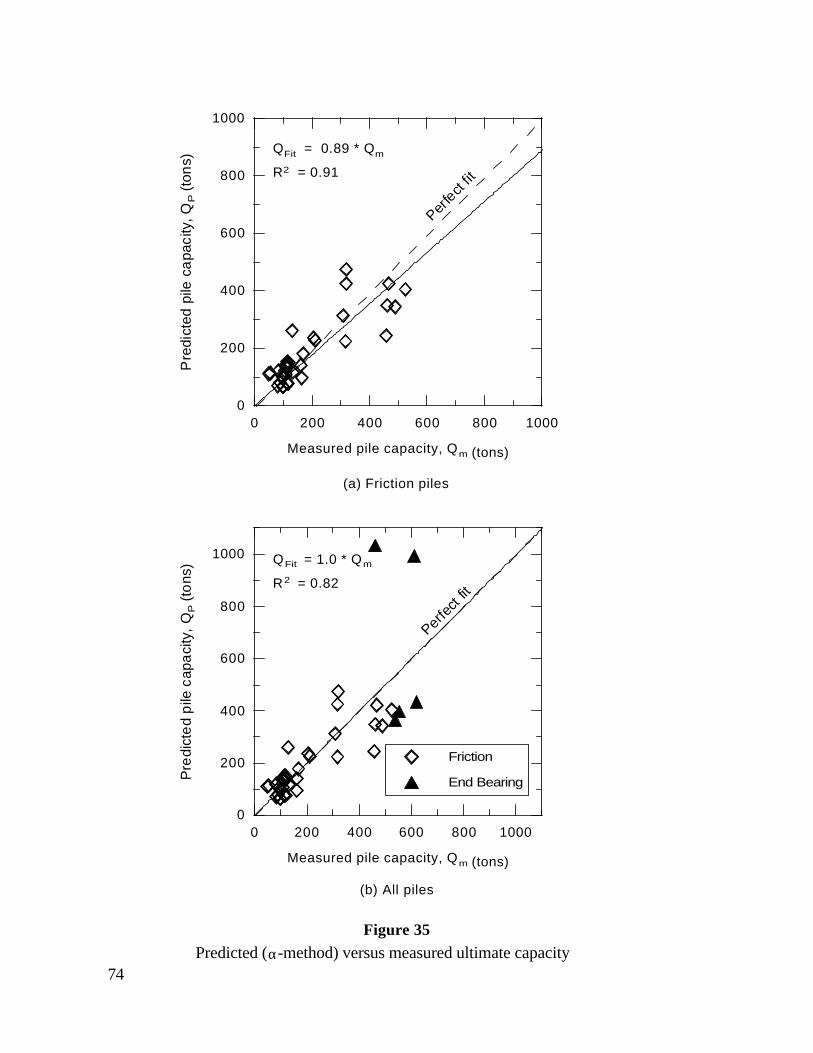
0 200 400 600 800 1000
Measured pile capacity, Qm (tons)
0
200
400
600
800
1000
Pre
dict
ed p
ile c
apa
city
, QP (
ton
s)
QFit = 0.89 * Qm
R2 = 0.91
0 200 400 600 800 1000
Measured pile capacity, Qm (tons)
0
200
400
600
800
1000
Pre
dict
ed
pile
cap
aci
ty,
QP (
tons
) QFit = 1.0 * Qm
R2 = 0.82
Friction
End Bearing
Perfe
ct fit
Perfe
ct fit
Predicted (α-method) versus measured ultimate capacity
(a) Friction piles
(b) All piles
Figure 35
74

75
µln lnQ
Q n
Q
Qp
m
p
mi
n
=
=∑1
1
(27)
σ µln lnlnQ
Q n
Q
Qp
m
p
m ii
n
=
−
−
=∑1
1 1
2
(28)
STATISTICAL ANALYSES
Briaud and Tucker and Long et al. used statistical analyses to evaluate the performance of different
methods to predict the ultimate load carrying capacity of piles [17], [18]. Statistical analyses
provide the measures to rank the different methods based on their prediction accuracy. However,
statistical analyses should not be the only criterion used to evaluate these methods. Comparisons of
predicted and measured capacity (figures 27-35) should always be considered together with
statistical evaluation [17].
Similar statistical analyses were conducted in this study to help in evaluating the performance of
the CPT methods. The ratio of predicted to measured ultimate pile capacity (Qp/Qm) was the main
variable considered in the analyses. This ratio (Qp/Qm) ranges from 0 to 4 with an optimum value
of one. The CPT method underpredicts the measured capacity when Qp/Qm<1 and it overpredicts
the measured capacity when Qp/Qm>1. The mean (:) and standard deviation (F) of Qp/Qm are
indicators of the accuracy and precision of the prediction method. An accurate and precise method
gives :(Qp/Qm)=1 and F(Qp/Qm)=0, respectively, which means that for each pile, the predicted
pile capacity equals to the measured one. This case is ideal, however, in reality the method is
better when :(Qp/Qm) is closer to one and F(Qp/Qm) is closer to 0.
Since 0#(Qp/Qm)<4 with an optimum value of 1, Briaud and Tucker used the Log Normal
distribution to evaluate the performance of pile capacity prediction methods. The Log Normal
distribution is acceptable to represent the ratio of Qp/Qm, however, it is not symmetric around the
mean, which means that the Log Normal distribution doesn’t give an equal weight of
underprediction and overprediction [17]. In order to use the Log Normal distribution, the mean
(:ln) and standard deviation (Fln) are evaluated for the natural logarithm of Qp/Qm as follows:
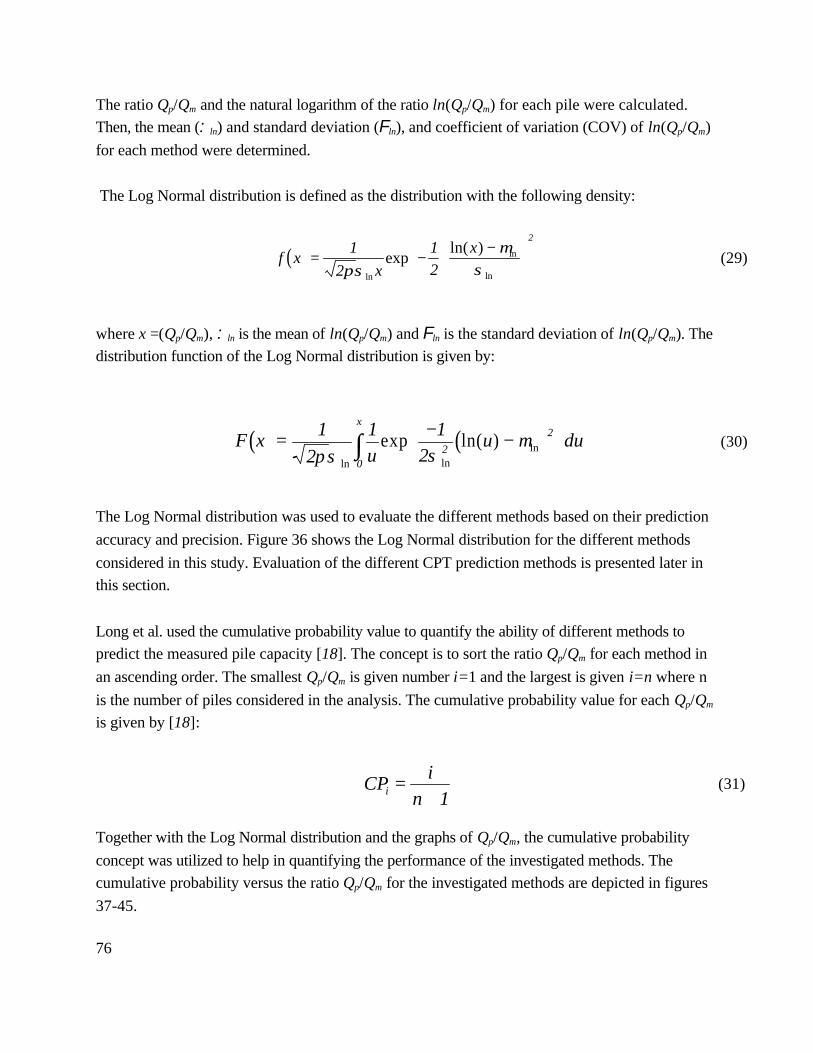
76
( )f xx
x= −
−
1
2
1
2
2
πσµ
σln
ln
ln
expln( )
(29)
( ) ( )F xu
u dux
= − −
∫
1
2
1 120
2
2
πσ σµ
ln lnlnexp ln( ) (30)
CPi
ni =+ 1
(31)
The ratio Qp/Qm and the natural logarithm of the ratio ln(Qp/Qm) for each pile were calculated.
Then, the mean (:ln) and standard deviation (Fln), and coefficient of variation (COV) of ln(Qp/Qm)
for each method were determined.
The Log Normal distribution is defined as the distribution with the following density:
where x =(Qp/Qm), :ln is the mean of ln(Qp/Qm) and Fln is the standard deviation of ln(Qp/Qm). The
distribution function of the Log Normal distribution is given by:
The Log Normal distribution was used to evaluate the different methods based on their prediction
accuracy and precision. Figure 36 shows the Log Normal distribution for the different methods
considered in this study. Evaluation of the different CPT prediction methods is presented later in
this section.
Long et al. used the cumulative probability value to quantify the ability of different methods to
predict the measured pile capacity [18]. The concept is to sort the ratio Qp/Qm for each method in
an ascending order. The smallest Qp/Qm is given number i=1 and the largest is given i=n where n
is the number of piles considered in the analysis. The cumulative probability value for each Qp/Qm
is given by [18]:
Together with the Log Normal distribution and the graphs of Qp/Qm, the cumulative probability
concept was utilized to help in quantifying the performance of the investigated methods. The
cumulative probability versus the ratio Qp/Qm for the investigated methods are depicted in figures
37-45.
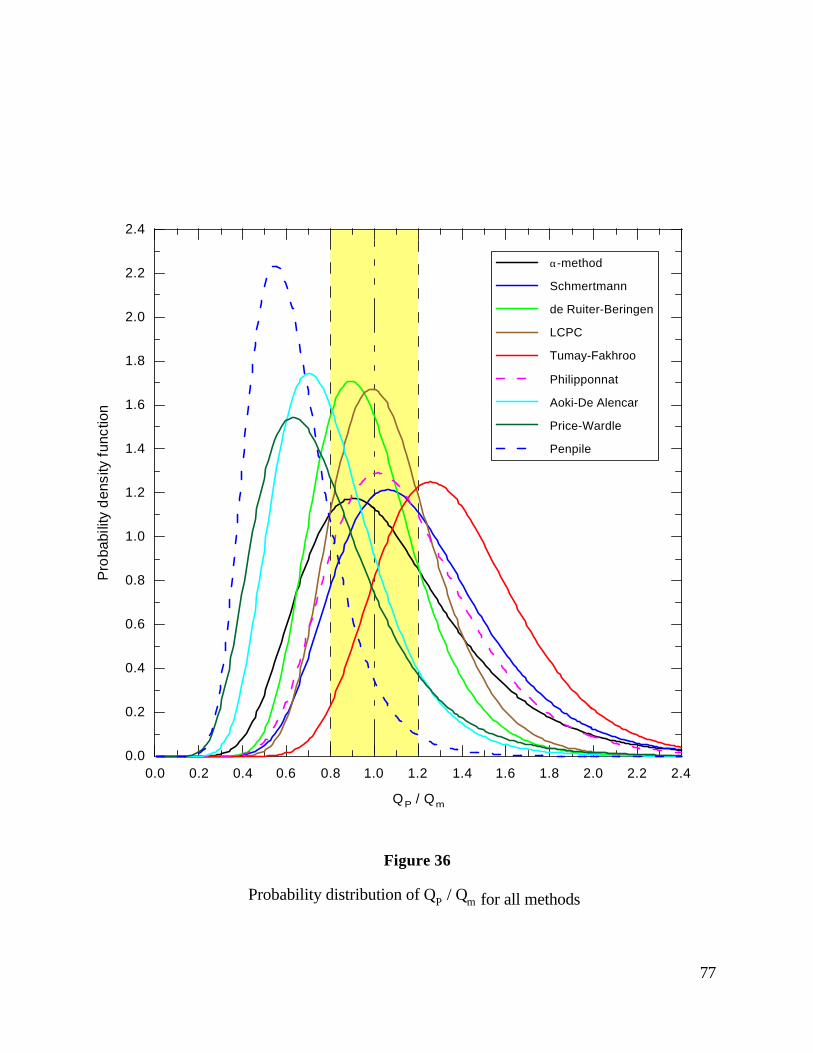
0.0 0.2 0.4 0.6 0.8 1.0 1.2 1.4 1.6 1.8 2.0 2.2 2.4
QP / Qm
0.0
0.2
0.4
0.6
0.8
1.0
1.2
1.4
1.6
1.8
2.0
2.2
2.4
Pro
babi
lity
den
sity
fun
ctio
n
Probability distribution of QP / Qm for all methods
α-method
Schmertmann
de Ruiter-Beringen
LCPC
Tumay-Fakhroo
Philipponnat
Aoki-De Alencar
Price-Wardle
Penpile
Figure 36
77
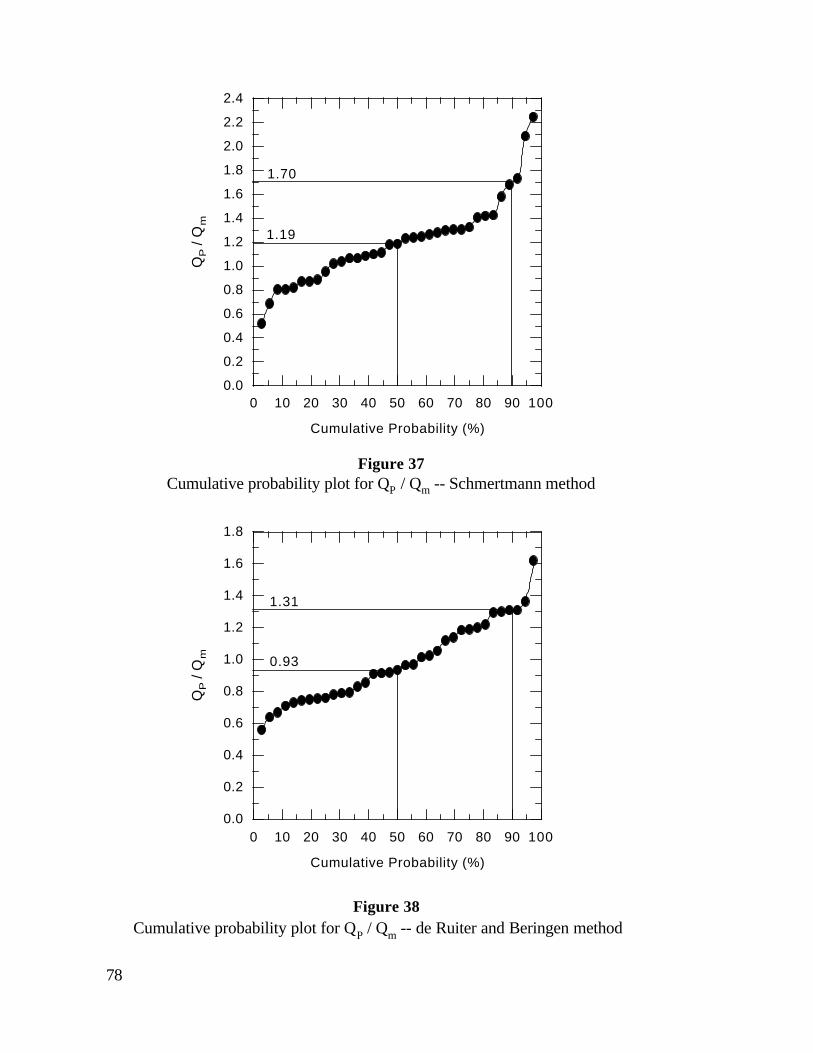
0 10 20 30 40 50 60 70 80 90 100
Cumulative Probability (%)
0.0
0.2
0.4
0.6
0.8
1.0
1.2
1.4
1.6
1.8
2.0
2.2
2.4
QP /
Qm
Cumulative probability plot for QP / Qm -- Schmertmann method
1.19
1.70
0 10 20 30 40 50 60 70 80 90 100
Cumulative Probability (%)
0.0
0.2
0.4
0.6
0.8
1.0
1.2
1.4
1.6
1.8
QP /
Qm
Cumulative probability plot for QP / Qm -- de Ruiter and Beringen method
0.93
1.31
Figure 37
Figure 38
78

0 10 20 30 40 50 60 70 80 90 100
Cumulative Probability (%)
0.0
0.2
0.4
0.6
0.8
1.0
1.2
1.4
1.6
1.8
2.0
QP /
Qm
Cumulative probability plot for QP / Qm -- LCPC method
1.03
1.42
0 10 20 30 40 50 60 70 80 90 100
Cumulative Probability (%)
0.0
0.2
0.4
0.6
0.8
1.0
1.2
1.4
1.6
1.8
2.0
2.2
2.4
QP /
Qm
Cumulative probability plot for QP / Qm -- Tumay and Fakhroo method
1.39
1.80
Figure 39
Figure 40
79
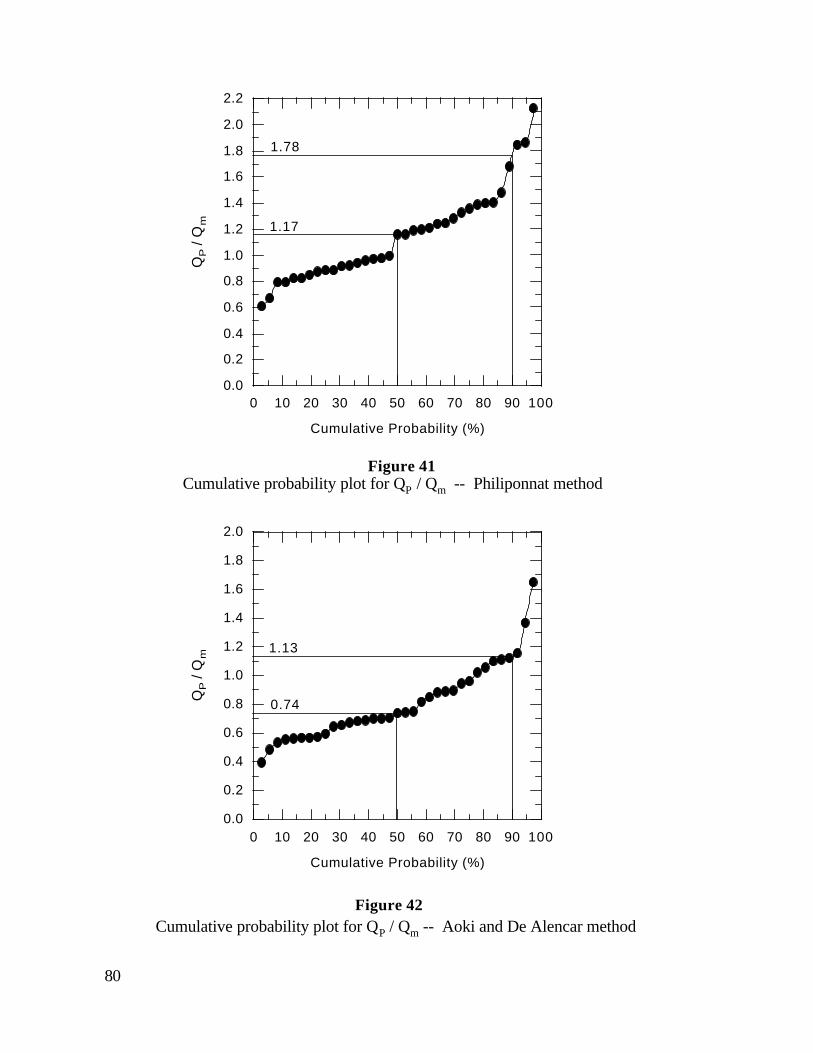
0 10 20 30 40 50 60 70 80 90 100
Cumulative Probability (%)
0.0
0.2
0.4
0.6
0.8
1.0
1.2
1.4
1.6
1.8
2.0
2.2
QP /
Qm
Cumulative probability plot for QP / Qm -- Philiponnat method
1.17
1.78
0 10 20 30 40 50 60 70 80 90 100
Cumulative Probability (%)
0.0
0.2
0.4
0.6
0.8
1.0
1.2
1.4
1.6
1.8
2.0
QP /
Qm
Cumulative probability plot for QP / Qm -- Aoki and De Alencar method
0.74
1.13
Figure 41
Figure 42
80

0 10 20 30 40 50 60 70 80 90 100
Cumulative Probability (%)
0.0
0.2
0.4
0.6
0.8
1.0
1.2
1.4
1.6
1.8
2.0
QP /
Qm
Cumulative probability plot for QP / Qm -- Price and Wardle method
0.72
1.21
0 10 20 30 40 50 60 70 80 90 100
Cumulative Probability (%)
0.0
0.2
0.4
0.6
0.8
1.0
1.2
1.4
1.6
1.8
QP /
Qm
Cumulative probability plot for QP / Qm -- Penpile method
0.59
0.87
Figure 43
Figure 44
81

0 10 20 30 40 50 60 70 80 90 100
Cumulative Probability (%)
0.0
0.2
0.4
0.6
0.8
1.0
1.2
1.4
1.6
1.8
2.0
2.2
2.4
QP /
Qm
Cumulative probability plot for QP / Qm -- α-method
1.02
1.62
Figure 45
82

83
EVALUATION OF THE CPT METHODS
Evaluating the performance of different pile capacity prediction methods is not an easy task and
should not be done based on one criterion (e.g., statistical analyses). An attempt to evaluate the
performance of the CPT methods based only on statistical analyses can give misleading
conclusions and one must always consider the comparison plot of predicted versus measured
ultimate capacity together with statistical analyses [17]. In this study, an evaluation scheme using
four different criteria was considered in order to rank the performance of different CPT methods
for predicting the ultimate axial capacity of piles. These criteria are: (1) the equation of the best fit
line of predicted versus measured capacity (Qp/Qm) with the corresponding coefficient of
determinations (R2); (2) the arithmetic mean and standard deviation for Qp/Qm; (3) Qp/Qm at 50 and
90 percent cumulative probability (P50 and P90); and (4) the 20 percent accuracy level obtained
from the Log Normal distribution of Qp/Qm. A rank index (RI) was introduced in this study to
quantify the overall performance of all methods. The rank index is the sum of the ranks from the
different criteria, RI= R1+R2+R3+R4. The lower the rank index RI, the better the performance of
the method. The performance of the prediction methods based on the four different criteria is
discussed below.
Inspection of figures 27-35 (Qp/Qm plots) shows that de Ruiter and Beringen method has best fit
equation Qfit = 1.02Qm with R2=0.96. This method tends to overpredict the measured pile capacity
by an average of 2 percent. Therefore, de Ruiter and Beringen method ranks number one according
to this criterion and is given R1=1 (R1 is the rank based on this criterion). The LCPC method with
Qfit = 0.97Qm (R2=0.95) tends to underpredict the measured capacity by 3 percent and therefore
ranks number 2 (R1=2). According to this criterion, Schmertmann, Philipponnat, Tumay and
Fakhroo methods tend to overpredict the measured ultimate pile capacity, while Aoki and De
Alencar, Price and Wardle, penpile, and "-method tend to underpredict the measured ultimate pile
capacity. The penpile method showed the worse performance with Qfit = 0.57Qm (R2=0.95) and
therefore was given R1=9.
In the second criterion, the arithmetic mean (:) and standard deviation (F) of the ratio Qp/Qm
values for each method were calculated. The best method is the one that gives a mean value closer
to one with a lower standard deviation, which is the measure of scatter in the data around the
mean. According to this criterion, de Ruiter and Beringen method with :(Qp/Qm)=0.982 and
F(Qp/Qm)=0.25 ranks number one (R2=1) followed by the LCPC method (R2=2). Schmertmann,
Philipponnat, Tumay and Fakhroo and "-method have :(Qp/Qm)>1, which means that these
methods on average are overpredicting the measured pile capacity. On the other hand, Aoki and

84
De Alencar, Price and Wardle, and the penpile method have :(Qp/Qm)<1, which means that these
methods on average are underpredicting the measured pile capacity.
The cumulative probability curves (figures 37 to 45) were used to determine the 50 percent and 90
percent cumulative probability values (P50 and P90). The pile capacity prediction method with P50
value closer to one and with lower P50 - P90 range is considered the best. Based on this criterion,
the LCPC method with P50=1.03 and P90=1.42 ranks number one (R3=1) followed by de Ruiter and
Beringen with R3=2. The penpile method has worst P50 and P90 values and therefore ranks number
nine.
The Log Normal distribution provided the fourth criterion needed to rank the different methods
based on their prediction performance. Using the Log Normal probability function, the probability
of predicting the ultimate load carrying capacity at different accuracy levels was determined and
plotted in figure 46. At a specified accuracy level, the higher the probability is the better the
performance of the method. The 20 percent accuracy level means that the predicted pile capacity
(Qp) is within the range from 0.8 to 1.2 Qm. The probability corresponding to 20 percent accuracy
level is the likelihood that the predicted pile capacity will be within 0.8Qm#Qp#1.2Qm. Based on
the 20 percent accuracy level, Bustamante and Gianeselli (LCPC/LCP) method showed the highest
probability value of 57.4 percent and therefore ranks number one (R4=1). de Ruiter and Beringen
ranks number two (R4=2). The penpile method has the lowest probability value at this accuracy
level and therefore ranks number nine (R4=9).
In order to evaluate the overall performance of the different prediction methods, all criteria were
considered in a form of an index. The Rank Index (RI) is the algebraic sum of the ranks obtained
using the four criteria. Considering de Ruiter and Beringen method, the RI equals to six as
evaluated from RI=R1+R2+R3+R4. The Rank Index values for all other methods are presented in
table 13. Inspection of table 13 demonstrates that de Ruiter and Beringen method ranks number one
along with Bustamante and Gianeselli (LCPC/LCP) method. These two methods showed the best
performance according to the evaluation criteria and therefore considered the best methods. The
static "-method ranks number three. The penpile method showed the worst performance among all
methods as it ranks number nine.

0 10 20 30 40 50 60
Accuracy level for overprediction and underprediction (%)
0
20
40
60
80
100
Pro
babi
lity
of p
red
icin
g th
e m
eas
ure
d p
ile c
apac
ity (
%)
Comparison of the different prediction methods in terms of prediction accuarcy
Predicted to measured pile capacity, Qp/Q m
Pro
babi
lity
den
sity
fun
ctio
n
α - method
Schmertmann
de Ruiter & Beringen
LCPC
Tumay & Fakhroo
Philipponnat
Akoi & De Alenkar
Price & Wardle
Penpile
0.8 1.0 1.2
overprediction within 20%
underprediction within 20%
Log Normal distribution
Figure 46
85

Table 13Evaluation of the performance of the different prediction methods considered in this study
Pile CapacityPrediction Method
Best fit calculations Arithmetic calculationsQp/Qm
CumulativeProbabilitycalculations
Log Normaldistributioncalculations
Rank of themethods based ontheir performance
Qfit/Qm R2 RankR1
Mean StandardDeviation
RankR2
Qp/Qm
atP50
Qp/Qm
atP90
RankR3
20% Accuracy
level
RankR4
Rank IndexRI
Rank
de-Ruiter& Beringen 1.02 0.96 1 0.982 0.250 1 0.93 1.31 2 57.4 2 6 1
LCPC 0.97 0.95 2 1.072 0.260 2 1.03 1.42 1 59.5 1 6 1
"-method 0.89 0.91 4 1.089 0.414 3 1.02 1.62 3 43.1 5 15 3
Philipponnat 1.23 0.95 8 1.152 0.352 4 1.17 1.78 4 47.7 3 19 4
Schmertmann 1.16 0.96 5 1.207 0.361 6 1.19 1.7 5 44.2 4 20 5
Aoki & De Alencar 0.89 0.94 3 0.810 0.267 5 0.74 1.13 6 37.6 6 20 5
Price & Wardle 0.82 0.92 7 0.782 0.320 7 0.72 1.21 7 30.7 8 29 7
Tumay & Fakhroo 1.18 0.96 6 1.374 0.343 9 1.39 1.8 8 31.4 7 30 8
Penpile 0.57 0.95 9 0.633 0.218 8 0.59 0.87 9 16.8 9 35 9
Rank Index, RI=R1+R2+R3+R4R2: Coefficient of determinationP50: Cumulative probability at 50%P90: Cumulative probability at 90%
86

87
COST AND BENEFIT ANALYSIS
DOTD maintained a traditional practice in pile design and analysis, which is basically a static
analysis using "-method. Properties of cohesive soils are obtained from laboratory tests on
undisturbed samples from boreholes, while strength characteristics of cohesionless soils are
evaluated from Standard Penetration Test (SPT). Conducting field and laboratory tests is
expensive and time consuming. The average cost of a traditional soil boring and the corresponding
laboratory and field tests, as reported by the DOTD Materials Section, is $50/ft when conducted
by DOT and $60/ft when carried out by a consultant.
Due to the uncertainties associated with pile design, load tests are usually conducted to verify the
design loads and to evaluate the actual response of the pile under loading. DOTD practice is to
conduct pile load tests based on cost/benefit evaluation. In small bridge projects, it is often cost
effective to increase the factor of safety (increase pile length) compared to conducting pile load
tests. Pile load tests are also expensive. The cost of driving and loading a test pile in Louisiana
ranges from $13,000 to $25,000.
Implementation of the CPT technology by DOTD has been limited to identification of dense sand
layers required to support the tip of the end-bearing piles. The CPT technology is fast, reliable,
and cost effective especially when compared to the traditional site characterization methods
(borings and laboratory/field tests). The average cost of CPT soundings is $14/ft when the system
is operated by DOTD Materials Section and $28/ft when the CPT is conducted by a consultant.
Compared to the traditional borings, the CPT is faster and more economical.
In order to demonstrate the cost effectiveness of using the CPT in design and analysis of piles, the
following are used to compare the cost of using CPT to the cost of using traditional methods:
1. Comparison of cost between the CPT and traditional exploration methods
2. Comparison of savings in pile length in projects with pile load tests
CPT versus Traditional Subsurface Exploration Methods
This case compares the direct cost of conducting a CPT test versus a traditional soil boring with
no pile load test being carried out at the project. This scenario usually happens in small-bridge
projects where conducting pile load tests is not cost effective due to the small number of piles.
Traditionally, one or two soil borings are usually taken for this kind of projects. In small-bridge
88
projects, the CPT is assumed to replace the soil borings on one to one basis (i.e. one CPT replaces
one soil boring). In this case, the average cost of conducting CPT is $14/ft, which is far less than
$50/ft, the average cost of a traditional soil boring and the corresponding laboratory and field
tests. The cost of a 100 ft CPT test is $1,400 while the cost of a 100 ft traditional soil boring and
the corresponding tests is $5,000. Replacing the traditional soil boring by the CPT will result in a
total saving of $3,600 or 72 percent for small-bridge projects.
The cost ratio of CPT and soil borings is 1 to 3.6 (i.e. the cost of CPT and soil borings are equal
when 3.6 CPT tests replace one traditional soil boring). When the CPT is assumed to replace soil
borings on two to one basis, then the cost of CPT will increase and the cost ratio of CPT and soil
boring will be 1 to 1.8. This scenario shows that the CPT direct cost is still 44 percent less than
the cost of traditional soil borings. There will also be savings in the pile length since more CPT
tests will result in more accurate pile design, which will reduce the cost of piling.
Pile Length Savings in Projects with Pile Load Test
The use CPT in design and analysis of piles will evidently lead to reduction in pile lengths without
compromising the safety and the performance of the supported structure. First, the CPT can be used
to quickly identify the weakest location at a project. This spot will be selected as the location of
the pile load test, which will provide the design engineer with lowest possible load carrying
capacity of the pile. The pile load test can also be used to modify the pile design using CPT
methods the same way it is being used by DOTD to modify the design using the static method, i.e.
applying the shift. It will also reduce the number of pile load tests conducted at a project, as an
example about one third of the pile load tests considered in the analysis herein did not fail under
load testing. Using the CPT, the weakest spot can be identified and selected for one pile load test
for design verification.
Second, the CPT methods are proven herein to be more accurate in predicting the pile load
carrying capacity of PPC driven pile in Louisiana soils compared to the currently used static
method. An accurate design leads to less uncertainty and therefore less factor of safety. Finally, the
CPT will reduce the number of soil borings, which will result in monetary and timesaving.
89
CONCLUSIONS
This study presented an evaluation of the performance of eight CPT methods in predicting the
ultimate load carrying capacity of square precast prestressed concrete piles driven into Louisiana
soils. Sixty pile load test reports, which have CPT soundings adjacent to the test pile, were
collected from DOTD files. Prediction of pile capacity was performed on sixty piles; however, the
statistical analyses and evaluation of the prediction methods were based on the results of thirty-
five friction piles plunged (failed) during the pile load tests. End-bearing piles and piles that did
not fail during the load tests were excluded from the statistical analyses.
The pile load test data were analyzed to obtain the measured ultimate load carrying capacity for
each pile. Butler-Hoy method, the primary method used by DOTD, was used to determine the
measured ultimate load carrying capacity for each test pile. The following CPT methods were used
to predict the load carrying capacity of the collected piles using the CPT data: Schmertmann,
Bustamante and Gianeselli (LCPC/LCP), de Ruiter and Beringen, Tumay and Fakhroo, Price and
Wardle, Philipponnat, Aoki and De Alencar, and the penpile method. The ultimate load carrying
capacity for each test pile was also predicted using the static "-method, which is used by DOTD
engineers for pile design and analysis.
An evaluation scheme was executed to evaluate the CPT methods based on their ability to predict
the measured ultimate pile capacity. Four different criteria were selected for the evaluation
scheme: the line of best fit between the measured and predicted capacities, the arithmetic mean and
standard deviation of the ratio of predicted to measured capacity (Qp/Qm), the cumulative
probability of measured and predicted capacities, and the Log Normal distribution of the ratio of
predicted to measured capacity. Each criterion was used to rank the prediction methods based on
its performance. The final rank for each method was obtained by averaging the ranks of the method
from the four criteria.
Based on the results of this study, de Ruiter and Beringen and Bustamante and Gianeselli
(LCPC/LCP) methods showed the best capability in predicting the measured load carrying
capacity of square PPC piles driven into Louisiana soils. These two CPT methods showed a better
performance than the currently used "-method. Cost/benefit analysis showed that using the CPT
methods for design/analysis of square PPC piles would cut the cost of initial design as well as the
cost of piling.

90
The CPT methods that showed the best performance were implemented into a Visual Basic
computer program to facilitate their use by DOTD design engineers. These methods are de Ruiter
and Beringen, and LCPC/LCP. Schmertmann method was also implemented in the program since it
is one of widely used CPT methods.
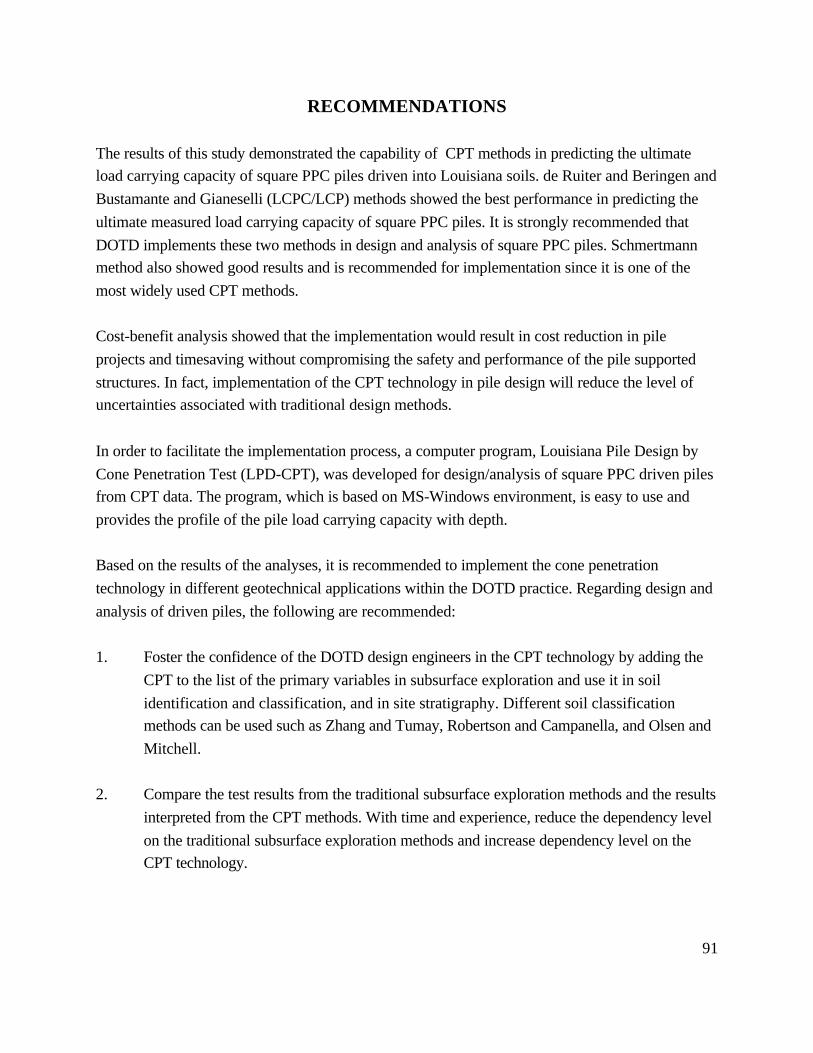
91
RECOMMENDATIONS
The results of this study demonstrated the capability of CPT methods in predicting the ultimate
load carrying capacity of square PPC piles driven into Louisiana soils. de Ruiter and Beringen and
Bustamante and Gianeselli (LCPC/LCP) methods showed the best performance in predicting the
ultimate measured load carrying capacity of square PPC piles. It is strongly recommended that
DOTD implements these two methods in design and analysis of square PPC piles. Schmertmann
method also showed good results and is recommended for implementation since it is one of the
most widely used CPT methods.
Cost-benefit analysis showed that the implementation would result in cost reduction in pile
projects and timesaving without compromising the safety and performance of the pile supported
structures. In fact, implementation of the CPT technology in pile design will reduce the level of
uncertainties associated with traditional design methods.
In order to facilitate the implementation process, a computer program, Louisiana Pile Design by
Cone Penetration Test (LPD-CPT), was developed for design/analysis of square PPC driven piles
from CPT data. The program, which is based on MS-Windows environment, is easy to use and
provides the profile of the pile load carrying capacity with depth.
Based on the results of the analyses, it is recommended to implement the cone penetration
technology in different geotechnical applications within the DOTD practice. Regarding design and
analysis of driven piles, the following are recommended:
1. Foster the confidence of the DOTD design engineers in the CPT technology by adding the
CPT to the list of the primary variables in subsurface exploration and use it in soil
identification and classification, and in site stratigraphy. Different soil classification
methods can be used such as Zhang and Tumay, Robertson and Campanella, and Olsen and
Mitchell.
2. Compare the test results from the traditional subsurface exploration methods and the results
interpreted from the CPT methods. With time and experience, reduce the dependency level
on the traditional subsurface exploration methods and increase dependency level on the
CPT technology.

92
3. Use the CPT pile design methods in conjunction with the pile load tests and the static "-
method to predict the load carrying capacity of the square PPC piles. The following CPT
methods are recommended: de Ruiter and Beringen method, Bustamante and Gianeselli
(LCPC/LCP) method, and Schmertmann method. If a pile load test is conducted for the site,
compare the results of the CPT methods with the measured ultimate pile load capacity. If
the measured and predicted capacities are different, then make a correction to the predicted
capacity in the amount of the difference between the measured and predicted capacity.
Apply this correction to the other for the design of piles at this site.
4. Increase the role of the CPT design method and decrease the dependency on the static "-
method.
93
REFERENCES
1. Butler, H.D., and H.E. Hoy. The Texas Quick-Load Method for Foundation Load
Testing-User's Manual. Report No. FHWA-IP-77-8, 1977.
2. Schmertmann, J.H. Guidelines for Cone Penetration Test, Performance and Design. U.S.
Department of Transportation, Report No. FHWA-TS-78-209, Washington, D.C., 1978, p.
145.
3. de Ruiter, J., and F.L. Beringen. Pile Foundations for Large North Sea Structures. Marine
Geotechnology, Vol. 3, No. 3, 1979, pp. 267-314.
4. Bustamante, M., and L. Gianeeselli. Pile Bearing Capacity Predictions by Means of Static
Penetrometer CPT. Proceedings of the 2nd European Symposium on Penetration Testing,
ESOPT-II, Amsterdam, Vol. 2, 1982, pp. 493-500.
5. Tumay, M.T., and Fakhroo, M. Friction Pile Capacity Prediction in Cohesive Soils Using
Electric Quasi-Static Penetration Tests. Interim Research Report No. 1, Louisiana
Department of Transportation and Development, Research and Development Section,
Baton Rouge, LA, 1982, 275 p.
6. Aoki, N. and de Alencar, D. An Approximate Method to Estimate the Bearing Capacity of
Piles, Proceedings, the 5th Pan-American Conference of Soil Mechanics and Foundation
Engineering, Buenos Aires, Vol. 1, 1975, pp. 367-376.
7. Price, G. and Wardle, I.F. A Comparison Between Cone Penetration Test Results and the
Performance of Small Diameter Instrumented Piles in Stiff Clay, Proceedings, the 2nd
European Symposium on Penetration Testing, Amsterdam, 1982, Vol. 2, pp. 775-780.
8. Philipponnat, G. Methode Pratique de Calcul d’un Pieu Isole a l’aide du Penetrometre
Statique. Revue Francaise de Geotechnique, 1980, 10, pp. 55-64.
9. Clisby, M.B., Scholtes, R.M., Corey, M.W., Cole, H.A., Teng, P., and Webb, J.D. An
Evaluation of Pile Bearing Capacities, Volume I, Final Report, Mississippi State Highway
Department, 1978.
10. Briaud, J-L, Tucker, L.M., Anderson, J.S., Perdomo, D. and Coyle, H.M. Development of
An improved Design Procedure for Single Piles in Clays and Sands, Report No. MSHD-
RD-86-050-1, Mississippi State Highway Department, Jackson, MS, 1986, p. 192.
11. Skempton, A.W., The Bearing Capacity of Clays, Proceedings Building Research
Congress, 1951, Vol. 1, pp. 180-189.
12. Tomlinson, M.J. Foundation Analysis and Design, Pitman, London, 1975.
13. Bowles, J.E. Foundation Analysis and Design, McGraw-Hill, Inc., New York, 1982, p.
816.

94
14. Douglas, J.B. and Olsen, R.S. Soil Classification Using Electric Cone Penetrometer,
Symposium on Cone Penetration Testing and Experience, Geotechnical Engineering
Division, ASCE, St. Louis, 1981, pp. 209-227.
15. Robertson, P.K. and Campanella, R.G. Guidelines for Use and Interpretation of the
Electric Cone Penetration Test, Hogentogler & Company, Inc., Gaithersburg, MD, Second
Edition, 1984, p. 175.
16. Zhang, Z., and Tumay, M.T. Statistical to Fuzzy Approach Toward CPT Soil
Classification, Journal of Geotechnical and Geoenvironmental Engineering, ASCE, Vol.
125, No. 3, 1999, pp. 179-186.
17. Briaud, J-L and, Tucker, L.M. Measured and Predicted Axial Response of 98 Piles,
Journal of Geotechnical Engineering, ASCE, Vol. 114, No. 8, 1988, pp. 984-1001.
18. Long, J.H. and Wysockey, M.H. Accuracy of Methods for Predicting Axial Capacity of
Deep Foundations, ASCE Geotechnical Special Publication GSP 88, OTRC ‘99
Conference, Analysis, Design, Construction, and Testing of Deep Foundations, Austin, TX,
pp. 180-195.
19. Lunne, T., Robertson, P.K., and Powell, J.J. M. Cone Penetration Testing in Geotechnical
Practice, Blackie Academic and Professional, 1997, London.
20. Tumay, M.T. Implementation of Louisiana Electric Cone Penetrometer System (LECOPS)
for Design of Transportation Facilities, Executive Summary, Report No.
FHWA/LA-94/280 A&B. LTRC, 1994, Baton Rouge, LA.
21. Meyerhof, G.G. Bearing Capacity and Settlement of Pile Foundations. The Eleventh
Terzaghi Lecture, Journal of Geotechnical Engineering Division, ASCE, Vol. 102, No.
GT3, 1976, pp. 195-228.
22. Eslami, A., and Fellenius, B.H. Pile Capacity by Direct CPT and CPTU Methods Applied
to 102 Case Histories. Canadian Geotechnical Journal, Vol. 34, 1997, pp. 886-904.

95
APPENDIX
Louisiana Pile Design by CPT
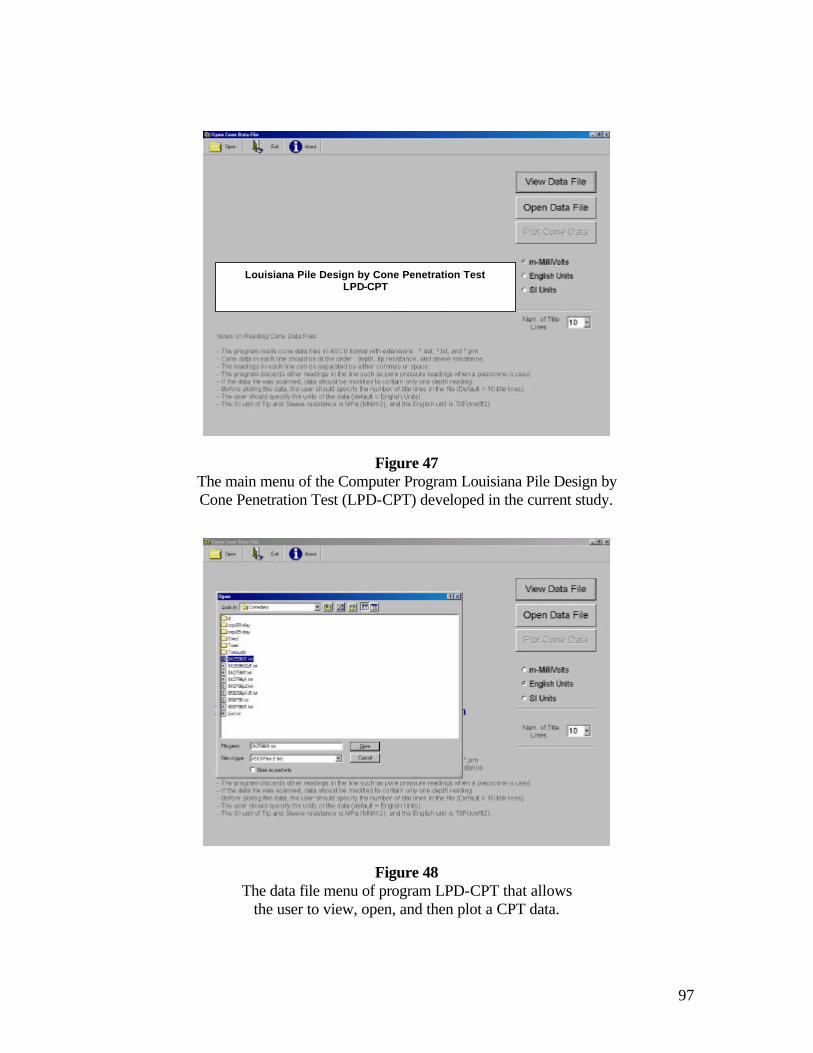
97
Figure 47
The main menu of the Computer Program Louisiana Pile Design by Cone Penetration Test (LPD-CPT) developed in the current study.
Figure 48
The data file menu of program LPD-CPT that allows the user to view, open, and then plot a CPT data.
Louisiana Pile Design by Cone Penetration Test LPD-CPT
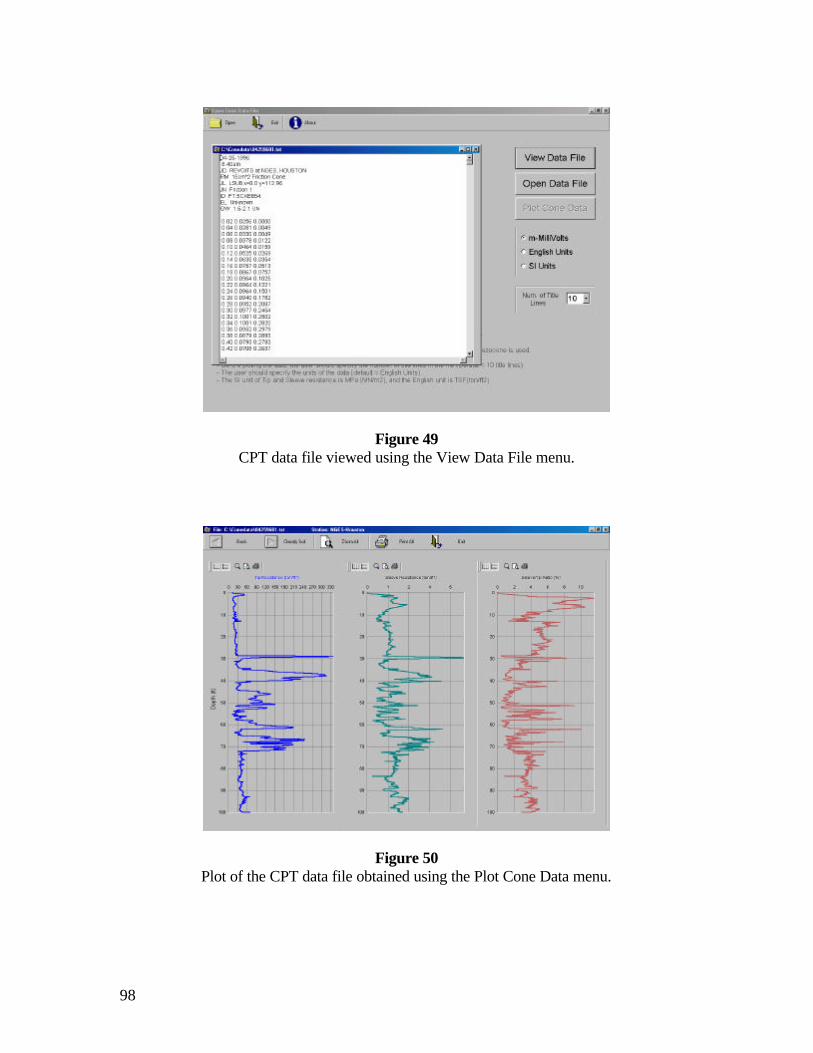
98
Figure 49
CPT data file viewed using the View Data File menu.
Figure 50
Plot of the CPT data file obtained using the Plot Cone Data menu.

99
Figure 51 Probabilistic Soil classification obtained from CPT data.
Figure 52
Pile Design Menu of the program LPD-CPT.

100
Figure 53
Variation of ultimate load carrying capacity of the pile with depth using three different design methods.
Figure 54
Variation of the ultimate load carrying capacity of the pile using Schmertmann method.
Related Documents


![[PPT]Bearing Capacity from SPT and PLT - WordPress.com · Web viewBearing capacity of Piles in group By: Alka Shah Assistant professor Civil Department Nirma University Plie Group](https://static.cupdf.com/doc/110x72/5ae6e4787f8b9a3d3b8dca7b/pptbearing-capacity-from-spt-and-plt-viewbearing-capacity-of-piles-in-group.jpg)