EVALUATION OF AN E-BIKE PILOT PROJECT AT THREE KAISER PERMANENTE EMPLOYMENT CAMPUSES Nick Kobel TREC at Portland State University (former) John MacArthur TREC at Portland State University

Welcome message from author
This document is posted to help you gain knowledge. Please leave a comment to let me know what you think about it! Share it to your friends and learn new things together.
Transcript

EVALUATION OF AN E-BIKE PILOT PROJECT AT THREE
KAISER PERMANENTE EMPLOYMENT CAMPUSES
Nick KobelTREC at Portland State University (former)
John MacArthurTREC at Portland State University

WHAT IS AN E-BIKE?

What is an electric bike?
Battery
Motor (Hub or Chain drive)
Power controls
20 mph750-1000 W

Different types of the e-bikes
Throttle Pedelec
Powered bicycle (PB) versus Power-assisted bicycle (PAB)


Market for E-bikes
Source: MacArthur & Kobel (2014).
E-bike laws

WHY DO E-BIKES MATTER?

Commute Mode Share, Multnomah Co.
5%
2012
BikeWalkTransitOtherCarpoolDrive AloneWork at home
25%
2030
City of Portland Climate Action Plan, 2015

Shifting the four types of cyclists
60% Interested but Concerned
33% No Way, No How
7% Enthused &Confident
Geller, 2006 & Dill and McNeil, 2012
<1% Strong & Fearless

E-bikes help overcome barriers• Older adults• Physical limitations• Topography• Longer commutes• Sweat• Carrying capacity
KAISER PERMANENTE E-BIKE PILOT PROJECT

Our research question
Will e-bikes…•Get more people to bike?•Get people to bike more often?

Kaiser Permanente E-bike Pilot Project• 30 Currie iZip E3 Compact
• Top Speed: 18 mph• Range: 15-22 miles• Weight: 42 lbs.• Folding
• Kaiser employees at 3 campuses (1st/last mile commuting)
• Three surveys• 6 cohorts, 10 weeks• 151 people• 4 cohorts (106 people)• Spring 2014 ~ Fall 2015
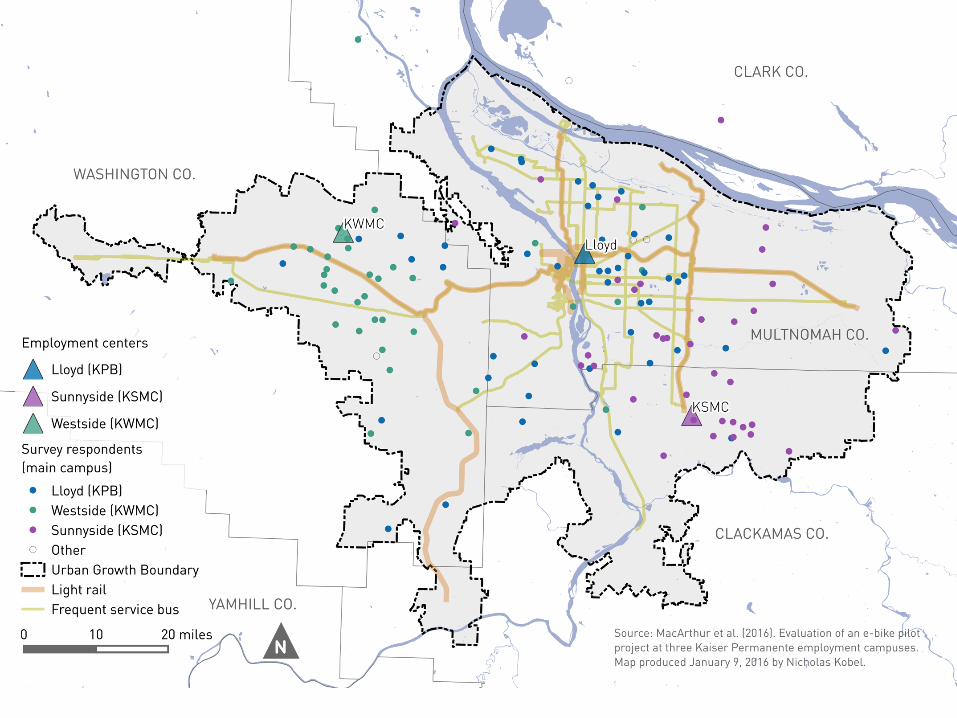

Summary statistics for GIS analysisS
patia
l met
rics
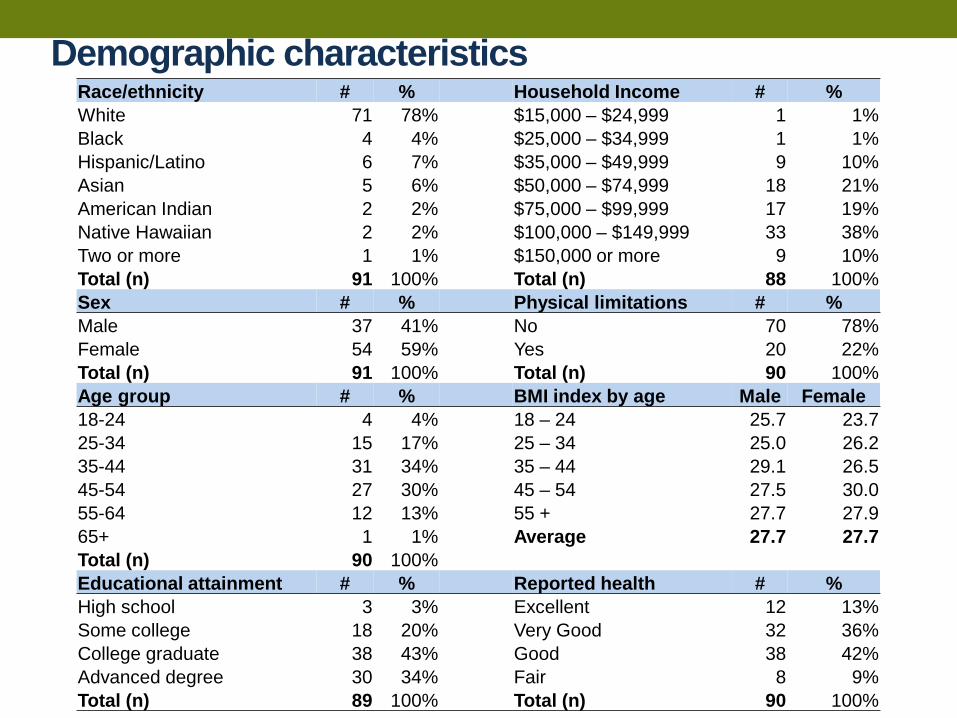
Demographic characteristicsRace/ethnicity # % Household Income # %White 71 78% $15,000 – $24,999 1 1%Black 4 4% $25,000 – $34,999 1 1%Hispanic/Latino 6 7% $35,000 – $49,999 9 10%Asian 5 6% $50,000 – $74,999 18 21%American Indian 2 2% $75,000 – $99,999 17 19%Native Hawaiian 2 2% $100,000 – $149,999 33 38%Two or more 1 1% $150,000 or more 9 10%Total (n) 91 100% Total (n) 88 100%Sex # % Physical limitations # %Male 37 41% No 70 78%Female 54 59% Yes 20 22%Total (n) 91 100% Total (n) 90 100%Age group # % BMI index by age Male Female18-24 4 4% 18 – 24 25.7 23.725-34 15 17% 25 – 34 25.0 26.235-44 31 34% 35 – 44 29.1 26.545-54 27 30% 45 – 54 27.5 30.055-64 12 13% 55 + 27.7 27.965+ 1 1% Average 27.7 27.7Total (n) 90 100%Educational attainment # % Reported health # %High school 3 3% Excellent 12 13%Some college 18 20% Very Good 32 36%College graduate 38 43% Good 38 42%Advanced degree 30 34% Fair 8 9%Total (n) 89 100% Total (n) 90 100%

Mode choice by trip purpose (BEFORE study)
33%
5%
6%
3%
3%
24%
9%
13%
18%
10%
2%
5%
4%
3%
12%
29%
40%
48%
62%
67%
9%
39%
29%
11%
7%
2%
2%
1%
1%
0% 10% 20% 30% 40% 50% 60% 70% 80% 90% 100%
Exercise orrecreation (n=82)
Entertainment & socializing (n=85)
Visit familyor friends (n=83)
Personalerrands (n=87)
Commute (n=91)
Walk Bike Public transit Drive alone Carpool/passenger Other

Commute mode by location
75%
11%
4% 4%7%
0%
41%
4% 4%
22%
30%
0%
81%
6%3% 3% 3% 3%
0%
10%
20%
30%
40%
50%
60%
70%
80%
90%
Drive alone Carpool Walk Bike Publictransit
Other
Westside
Lloyd
Sunnyside

Standard bicycle E-bike(A) (B) (C) (D) (E)
Sample size (n) 37 20 90 61 60 Weather conditions 49% 40% 50% 66% 67%Trip logistics or carrying capacity 8% 5% 39% 39% 45%My destination is too far 54% 15% 27% 16% 25%The bike is uncomfortable or causes pain 0% 0% 0% 8% 17%Preparation logistics, time constraints or too busy 46% 65% 13% 15% 15%I am concerned for my safety 5% 5% 11% 16% 13%I do not have access to a bicycle OR there was an issue with my e-bike 14% 30% 11% 2% 13%There is no place to securely store my bicycle 0% 0% 2% 5% 12%I don't like to arrive sweaty/no showers at work 5% 0% 32% 13% 10%I am unable to bike for health concerns or am physically unable 19% 15% 6% 3% 8%Transit connections are not easy or convenient 0% 0% 0% 8% 5%"Laziness" (self-reported) 5% 0% 2% 0% 2%Hills 5% 0% 29% 2% 0%Other 3% 5% 0% 0% 5%(A): Pre-use: Why did you stop biking for transportation to work?(B): Pre-use: Why did you stop biking for recreation?(C): Pre-use: What are the main factors keeping you from biking more often?(D): Mid-use: If you would like to use the e-bike to commute to work more often, what prevents you from doing so?(E): Post-use: If you weren't able to use the e-bike as often as you would have liked, what prevented you from doing so?NOTE: Categories combined where appropriate.
Barriers to participation in cycling cited by respondents

"I ride a bike…"Total Portland
regional average †
"never" "occasionally" "regularly"# % # % # % # %
Before 9 100% 59 100% 23 100% 91 100% -No way, no how 2 22% 5 8% 0 0% 7 8% 31%Interested but concerned 6 67% 28 47% 15 65% 49 54% 56%Enthused and confident 1 11% 25 42% 6 26% 32 35% 9%Strong and fearless 0 0% 1 2% 2 9% 3 3% 4%
After 9 100% 59 100% 23 100% 91 100% -No way, no how 0 0% 4 7% 0 0% 4 4% 31%Interested but concerned 3 33% 27 46% 9 39% 39 43% 56%Enthused and confident 6 67% 23 39% 12 52% 41 45% 9%Strong and fearless 0 0% 5 8% 2 9% 7 8% 4%
Total 9 100% 59 100% 23 100% 91 100% -Became less confident 0 0% 10 17% 3 13% 13 14% -
No change 2 22% 36 61% 12 52% 50 55% -Became more confident 7 78% 13 22% 8 35% 28 31% -
† Cyclist typology results from Dill & McNeil, 2012.
Change in confidence (cyclist typology)

E-bike trip frequency by commute distance
6%0% 0%
22%
14% 14%
39%
29%
14%
33%
57%
71%
0%
10%
20%
30%
40%
50%
60%
70%
80%
≤ 5 mi(n=49)
> 5 mi, < 10 mi(n=21)
≥ 10 mi(n=14)
5+ day/week3-4 days/week1-2 days/weekLess than once per week
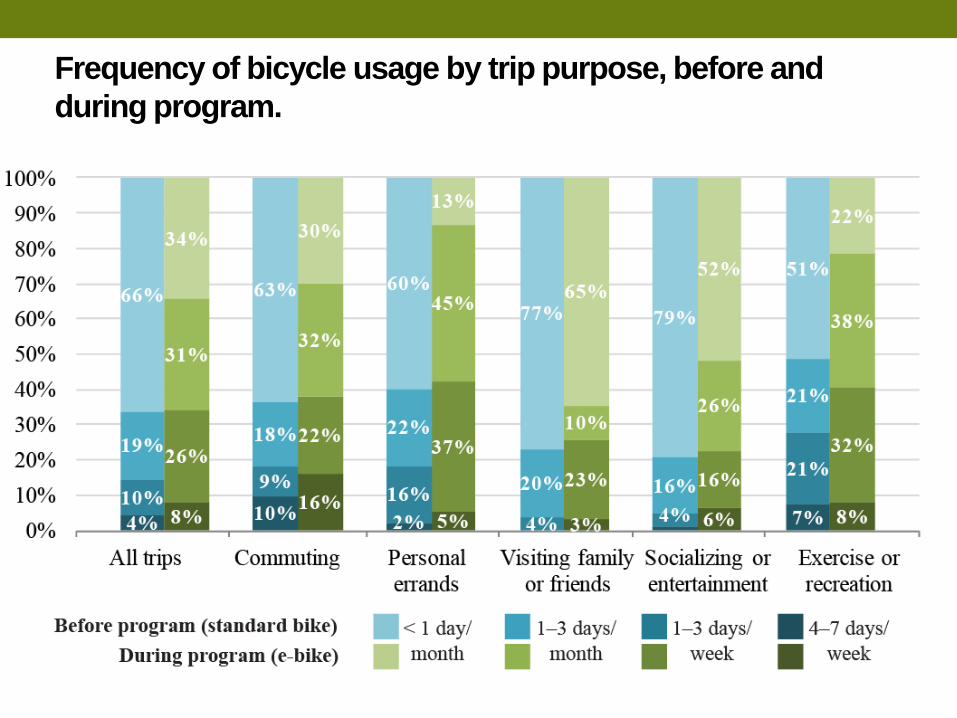
Frequency of bicycle usage by trip purpose, before and during program.

After using an e-bike, how likely are you to bike for the following trip types?
49%
42%
25%
66%
36%
38%
43%
58%
27%
18%
12%
15%
16%
7%
46%
0% 10% 20% 30% 40% 50% 60% 70% 80% 90% 100%
Commuting
Personal errands
Socializing
Exercise & recreation
Family & friends
More likely Neither more nor less likely Less likely

Conclusions• E-bikes reduce barriers to participation in cycling
• E-bikes may make people more comfortable on bicycles
• E-bikes encourage more trips by bicycle

Contact InformationNick Kobel• [email protected]• 503-823-9906
John MacArthur• [email protected]• 503-725-2866• trec.pdx.edu
For more information & reports: ebike.research.pdx.edu
Related Documents