Evaluation of a Submerged Remote Sensing SRS Technique Charles Trees NATO Undersea Research Centre Viale San Bartolomeo 400, 19126 La Spezia, Italy phone: (+39) 0187 527 332 fax: (+39) 0187 527 354 email: [email protected] Award Number: N0001407WX21355 LONG-TERM GOALS To test and validate the Submerged Remote Sensing (SRS) technique [1,2] on a large Case I optical database that has been collected by the Center for Hydro-Optics and Remote Sensing, San Diego State University since 1990. OBJECTIVES The purpose of this work is to determine the optical properties of the atmosphere and water column using the SRS technique by knowing only the absolute downwelling irradiance at two wavelengths at a known depth, for a given date, time and position. It is straight forward to calculate the total path transmittance (a single value representing the combined water and atmospheric attenuation) by knowing the extra-terrestrial solar spectral irradiance, date, time, latitude and longitude. The difficulty is determining the two component parts of attenuation separately. The SRS approach was to make measurements at two wavelengths and then use them in a set of equations, to solve for the separate attenuations. This required models describing the attenuation coefficients of sea water and the atmosphere and how they changed with wavelength for a variety of turbidities. Using the knowledge about the optical characteristics of the atmosphere [3,4] and seawater [5,6,7,8] it is possible to compute the transmission of light through the atmosphere, the air-water interface and through the water to a given depth under a set of environmental conditions. The pair of irradiances values is then used to perform the inverse computation to calculate the diffuse attenuation coefficient of the water ,K(λ), and the optical depth of the atmosphere for the two wavelengths. It has been shown that there exists an apparent spectral relationship between K(λ) and the various water types found in the open ocean [5,6,7,8] . The SRS was originally validated (Petzold and Austin, 1987) using a limited number of optical stations (54, n = 221) and fast scanning Multispectral Environmental Radiometers (MERs, Biospherical Instruments, Inc.). The purpose of this study is the evaluation of the SRS performance using a more extensive and diverse optical database. APPROACH The method presented here was to retrieve the characteristics of the atmosphere from optical measurements made at an arbitrary depth (z) in the open ocean. This technique can be organized in three phases: estimation of K at the reference wavelength, estimation of K at any other wavelengths (spectral K model) and estimation of the atmosphere characteristics (transmittance), using K and E d at two wavelength. 1

Welcome message from author
This document is posted to help you gain knowledge. Please leave a comment to let me know what you think about it! Share it to your friends and learn new things together.
Transcript

Evaluation of a Submerged Remote Sensing SRS Technique
Charles Trees NATO Undersea Research Centre
Viale San Bartolomeo 400, 19126 La Spezia, Italy phone: (+39) 0187 527 332 fax: (+39) 0187 527 354 email: [email protected]
Award Number: N0001407WX21355
LONG-TERM GOALS
To test and validate the Submerged Remote Sensing (SRS) technique[1,2] on a large Case I optical database that has been collected by the Center for Hydro-Optics and Remote Sensing, San Diego State University since 1990.
OBJECTIVES
The purpose of this work is to determine the optical properties of the atmosphere and water column using the SRS technique by knowing only the absolute downwelling irradiance at two wavelengths at a known depth, for a given date, time and position. It is straight forward to calculate the total path transmittance (a single value representing the combined water and atmospheric attenuation) by knowing the extra-terrestrial solar spectral irradiance, date, time, latitude and longitude. The difficulty is determining the two component parts of attenuation separately.
The SRS approach was to make measurements at two wavelengths and then use them in a set of equations, to solve for the separate attenuations. This required models describing the attenuation coefficients of sea water and the atmosphere and how they changed with wavelength for a variety of turbidities. Using the knowledge about the optical characteristics of the atmosphere[3,4] and seawater[5,6,7,8] it is possible to compute the transmission of light through the atmosphere, the air-water interface and through the water to a given depth under a set of environmental conditions. The pair of irradiances values is then used to perform the inverse computation to calculate the diffuse attenuation coefficient of the water ,K(λ), and the optical depth of the atmosphere for the two wavelengths. It has been shown that there exists an apparent spectral relationship between K(λ) and the various water types found in the open ocean[5,6,7,8]. The SRS was originally validated (Petzold and Austin, 1987) using a limited number of optical stations (54, n = 221) and fast scanning Multispectral Environmental Radiometers (MERs, Biospherical Instruments, Inc.). The purpose of this study is the evaluation of the SRS performance using a more extensive and diverse optical database.
APPROACH
The method presented here was to retrieve the characteristics of the atmosphere from optical measurements made at an arbitrary depth (z) in the open ocean. This technique can be organized in three phases: estimation of K at the reference wavelength, estimation of K at any other wavelengths (spectral K model) and estimation of the atmosphere characteristics (transmittance), using K and Ed at two wavelength.
1
Report Documentation Page Form ApprovedOMB No. 0704-0188
Public reporting burden for the collection of information is estimated to average 1 hour per response, including the time for reviewing instructions, searching existing data sources, gathering andmaintaining the data needed, and completing and reviewing the collection of information. Send comments regarding this burden estimate or any other aspect of this collection of information,including suggestions for reducing this burden, to Washington Headquarters Services, Directorate for Information Operations and Reports, 1215 Jefferson Davis Highway, Suite 1204, ArlingtonVA 22202-4302. Respondents should be aware that notwithstanding any other provision of law, no person shall be subject to a penalty for failing to comply with a collection of information if itdoes not display a currently valid OMB control number.
1. REPORT DATE 2008 2. REPORT TYPE
3. DATES COVERED 00-00-2008 to 00-00-2008
4. TITLE AND SUBTITLE Evaluation of a Submerged Remote Sensing SRS Technique
5a. CONTRACT NUMBER
5b. GRANT NUMBER
5c. PROGRAM ELEMENT NUMBER
6. AUTHOR(S) 5d. PROJECT NUMBER
5e. TASK NUMBER
5f. WORK UNIT NUMBER
7. PERFORMING ORGANIZATION NAME(S) AND ADDRESS(ES) NATO Undersea Research Centre,Viale San Bartolomeo 400,19126 LaSpezia, Italy,
8. PERFORMING ORGANIZATIONREPORT NUMBER
9. SPONSORING/MONITORING AGENCY NAME(S) AND ADDRESS(ES) 10. SPONSOR/MONITOR’S ACRONYM(S)
11. SPONSOR/MONITOR’S REPORT NUMBER(S)
12. DISTRIBUTION/AVAILABILITY STATEMENT Approved for public release; distribution unlimited
13. SUPPLEMENTARY NOTES
14. ABSTRACT
15. SUBJECT TERMS
16. SECURITY CLASSIFICATION OF: 17. LIMITATION OF ABSTRACT Same as
Report (SAR)
18. NUMBEROF PAGES
12
19a. NAME OFRESPONSIBLE PERSON
a. REPORT unclassified
b. ABSTRACT unclassified
c. THIS PAGE unclassified
Standard Form 298 (Rev. 8-98) Prescribed by ANSI Std Z39-18

K(490) Estimation --- Algorithms were developed for deriving the diffuse attenuation coefficient (K) at 490 and 520 nm from the ratio of upwelling radiances Lu(λ) at 443 and 550 nm[5]. This KLu relationship was formulated during the CZCS era, because (1) satellite ocean color sensor measured upwelling radiance (Lu), (2) the downwelling irradiance (Ed) is noisier and less reliable (enhanced backscatter by wave focusing and defocusing) than Lu measurements and (3) upwelling KLu tend to be less affected by the radiance distribution (i.e. solar zenith angle) and more associated with the water column inherent optical properties. For the SRS technique the relationship between K(490) and the radiance ratio was used:
−1.491⎡ L u ( 443 ) ⎤
K ( 490 ) = 0.0883 + 0.022 , (1)⎢ ⎥⎣ L u ( 550 ) ⎦
where Lu (λ) is the subsurface upwelling radiance and 0.022 (m-1) is the attenuation coefficient for clear seawater at 490 nm. This model was developed from a number of sources and cruises covering a variety of water type (n = 88) and demonstrated that K(490), within the first optical depth (1/K), can be predicted from the radiance ratio (443/550) with an accuracy comparable to that of in situ measurements (Figure 1).
Figure 1: K(490) to radiance ratio [(Lu(443/Lu (550)]algorithm.
K(λ) Estimation --- A model was developed earlier[6,7,8] relating the spectral dependence of K(λ) to the value of K at a reference wavelength (λ ref). The attenuation spectra were computed from downwelling spectral irradiance (Eq. 2) obtained from a variety of investigators working in widely separated ocean regions and using different measuring techniques and instrumentation.
1 ⎛ E (λ, z ) ⎞K (λ) = − ln⎜⎜ d 2
⎟⎟ (2). z2 − z1 ⎝ Ed (λ, z1 ) ⎠
2

Values retrieved were examined and the value of K(490) was used as a classification index for the water type and varied from very clear water, 0.025 m-1, to turbid water, 0.245 m-1. Attenuation properties were calculated over the spectral region from 365 nm to 700 nm (68 wavelengths in total) at different depths (from 1 to 100 meters) and were plotted against the corresponding values of the classification index. These scatter diagrams provide a linear relationship that can be used to evaluate K as shown in Eq. 3:
K(λ 1) = M(λ 1)[K(λ ref) – Kw(λ ref)] + Kw(λ 1), (3)
where M (λ) is the slope, λ ref is the reference wavelength and Kw is the diffuse attenuation coefficient of pure sea water. Knowing Kw(λ ref) and Kw(λ 1), the slope M(λ 1) [as tabulated in Table 4 on page 174 of reference (6)] and the classification index [K(λ ref], the value of K at any wavelength can be estimated.
Estimation of the Atmospheric Properties --- This section will demonstrate how to estimate the atmospheric properties knowing K(490) and the downwelling irradiance (Ed) at two wavelengths, for fixed depth (Z). To understand this forward calculation there is a need to define some parameters: � Atmospheric and surface transmittance; � Diffuse transmittance through the water column; � Irradiance at depth Z. Knowing the time, date, location (latitude and longitude), sun zenith angle ( θ S ) and extra-terrestrial solar spectral irradiance, E0 (λ) the atmospheric transmittance ( Tatm (λ) ) can be evaluated using the following relationship[4]:
Tatm ( λ ) = exp {− [0.48 τ RAY ( λ ) + τ oz ( λ ) + 0.5 ⋅ (1− g ) τ a ( λ ) ]/ cos( θ S )} , (4)
where τ RAY (λ) , τ oz (λ) and τ a (λ) are the optical depths for one air mass due to Rayleigh scattering (air molecules), ozone absorption, and aerosols respectively. The asymmetry factor for aerosol particles is g and is approximately equal to 2/3. Using the assumption that the portion of the atmospheric attenuation caused by the aerosols is constant at all wavelengths, Eq. (4) becomes:
T ( λ ) = exp{− [τ ( λ ) + τ ( λ ) ]/ cos( θ )} . (5)atm b a S
The transmittance through the surface of the water, the surface transmittance TS , is calculated using the Fresnel reflectance equations and the index of refraction of seawater:
4n1n2TS = 1− Fresnel Reflectance ≅ ≅ 0.98 . (6)(n1 + n2 ) 2
The diffuse transmittance through the water column (TW), from the surface to the depth Z is:
TW (λ) = exp[− K (λ)z], (7)
where K (λ) is the mean diffuse attenuation coefficient of the water from the surface to depth, Z. The irradiance at depth Z is:
3

EZ (λ) = E0 (λ) ⋅TS ⋅TW (λ) ⋅Tatm (λ) ⋅cos(θ s ) (8)
and the ratio of EZ (λ) at two wavelengths λ1 and λ2 is:
ED (λ2 ) E0 (λ2 )= exp{− [τ (λ ) −τ (λ ) +τ (λ ) −τ (λ )] / cos(θ )}⋅ exp{− [K (λ ) − K (λ ) ⋅ z]}. (9)
b 2 b 1 a 2 a 1 s 2 1E (λ ) E (λ )D 1 0 1
The inversion of the above equation makes possible to evaluate the optical depths that can be used to solve equation (5) from which is also possible to evaluate the amount of irradiance that arrives at the surface of the ocean, by using the following relationship:
E (λ) = cos(θ ) ⋅ E (λ) ⋅ T (λ) . (10)S S 0 ATM
WORK COMPLETED
SRS Validation Assessment --- The first goal was to check the implementation of the SRS using MATLAB algorithms to establish absolutely certainty that the SRS ran properly, generating correct estimates of integrated Kd. To verify implementation, a subset of the original 221 data sets was used in which all the input parameters were known (n = 12). After this validation, then the much larger U.S. Joint Global Ocean Flux Study (JGOFS) database from several different radiometers were used to measure above and in-water optical properties were analyzed. These vertical profiles of irradiance and above water surface irradiance were collected by C. Trees (CHORS) and used to determine the integrated diffuse attenuation coefficients at selected depths (20 m intervals). They were then compared to estimates of integrated K, using only irradiance at two wavelengths at the 20 m intervals with the SRS model.
Visibility Laboratory Data --- Petzold and Austin[1] developed the SRS technique using 54 stations from the following field campaigns: � R/V Captain Hook (coastal waters off southern California, Mar-Apr 85) � USNS DeSteiguer (N. Pacific-Bering Sea, Jun 85) � USNS Lynch (GIN and Barents Seas, Aug 86) � AUTEC (Tongue of the Ocean off Andros Island, Bahamas, Mar-Jul 86)
Three types of in situ radiometers were used: � Multispectral Environmental Radiometer-MER (Ed, Eu and Lu at several wavelengths); � Deck cell (Es, 5 wavelengths); � Illuminometer (above-water sensor that measures the irradiance at the surface; used when the
deck cell was not available).
These instruments were deployed making optical measurements which allowed the direct determination of the mean diffuse attenuation coefficient of the water [ K (λ) ] and the atmospheric transmittance [ Tatm (λ) ]. To evaluate these parameters the 54 available stations were processed for six depths (20, 40, 60, 80, 100 and 120 meters); this resulted in a total of 221 set of samples.
4

North Atlantic Bloom Experiment Cruises, NABE --- U.S. participation in the North Atlantic Bloom Experiment consisted of three cruises to several study sites along 20° W and north of 40° N in the northeastern Atlantic. During the Spring of 1989, these process-oriented cruises monitored the annually occurring phytoplankton bloom to track the fluxes of the biogeochemical system. The estimation of K(490) was performed for one cruise (AT119-Leg5, May-Jun 89) where downwelling irradiance data were processed for eleven depths (20, 30, 40, 50, 60, 70, 80, 90, 100, 110 and 120 meters) at 30 stations (Table 1).
Equatorial Pacific Survey Cruises, EqPac --- The EqPac program was conducted in 1992 and four cruises took place; with a fifth benthic cruise and sediment trap legs adding to the overall study. These cruises consisted of two repeat meridional survey cruises (12°N - 12°S) at 140° W. The estimation of K(490) was performed for one of these cruises (TT007, Jan-Mar 92) and again this data were processed for eleven depths (20, 30, 40, 50, 60, 70, 80, 90, 100, 110 and 120 meters) at 15 stations (Table 1).
Arabian Sea Cruises --- The Arabian Sea process cruises focused on an area extending from the southeast coast of Oman toward India (15 °N 69 °E) and southward into the central northwestern Indian Ocean (10 °N 65 °E). Station locations were selected with the primary goal of investigating regions of seasonal upwelling associated with the Southwest Monsoon and determining the spatial extent of the influence of this upwelling. Research cruises were scheduled in July, August and September 1995 to coincide with the Southwest Monsoon; December, January and February to coincide with the Northeast Monsoon; and March-April to study the region during an intermonsoon period. Merged hydrographic data products have been compiled from three process cruises summarized in Table 1. The data used in this study are from the standard station locations for TTN045, TTN-053, and TTN-054. To evaluate K(490) the downwelling irradiance was processed for eleven depths (20, 30, 40, 50, 60, 70, 80, 90, 100, 110 and 120 meters) at 80 stations (Table 1)
Cruise ID Stations Time Location AT119 30 25 Apr to 10 May 89 46°N 18°W - 60°N21°W TT007 15 30 Jan to 13 Mar 92 12°N-12°S at 140°W
TTN-045 31 14 Mar to 8 Apr 95 22°N 57°E - 9°N 69°E TTN-053 29 29 Oct to 25 Nov 95 25°N 56°E - 10°N 68°E TTN-054 20 5 Dec to 24 Dec 95 20°N 58°E - 9°N 68°E
Total 110 --------------------------- -----------------------------
Table 1: Cruises, number of stations, dates and geographic locations for SRS analyses.
RESULTS
The first step performed was the duplication of the SRS methodology using the available references and the data points. After validation then the algorithms we were ready to be tested on other types of water using the available dataset from JGOFS.
5

Performance Evaluation with VisLab Subset --- The performance of the SRS model was tested against the VisLab data, but unfortunately all the input values used in the original development (221) were not available. Only 12 sets of data, found in a draft copy of the SIO Tech Memo 87-18, were used for this evaluation. We present the results of this comparison in Figures 2 and 3, showing the NURC estimate (+) and the value derived by Petzold and Austin (open square box). There are small differences at which time we do not know why, but in general the comparison is very good. As can be seen in the figures there were no trends between the two estimates as a function of measured K(490), depth or solar zenith angle.
(a) (b)
Figure 2: (a) K490 values from SRS computations (performed by Visibility Laboratory and NURC) versus K490 measured values. (b) K490 error (estimated – measured) versus K490.
(a) (b)
Figure 3: (a) K490 difference error from SRS computations (performed by Visibility Laboratory and NURC) versus depth [meters]. (b) K490 error (estimated – measured) versus solar zenith angle.
6

Table 2 shows a comparison of just one example (R/V Captain Hook, Station 14, 80 m depth) from the subset of VisLab data which includes additional ancillary data, such as cloud cover, depth, solar zenith angle and incident irradiance. The measured diffuse attenuation coefficients were not available in the draft report for the 410.6 and 439.9 nm wavelengths, although they did calculated K values from their SRS model. As such, we also extended our SRS estimates to include these wavelengths to provide a few more comparisons between the two SRS model implementations. Even under 100% overcast conditions as documented in Table 2, the SRSNURC technique estimates integrated K(490) at 80 m to within 0.0022m-1.
SRS Implementation on JGOFS Data --- The following results show the estimation of K(490), using two known downwelling irradiances and one reference wavelength, for depth from 20 to 120 meters. As previously noted in reference [1], it’s important to note that the accuracy of these estimation is
SAMPLE #5 Name Date Atm. Depth
[m] Zen [deg] Measured Irradiance
Capt Hook 14 4/4/1985 100% Overcast
80 29.6 E(486.5 nm) = 0.1292 E(547.9 nm) = 0.02377
λ [nm] Measured SRSVIS SRSNurc SRSVIS /Mea SRSNURC /Mea Diffuse attenuation coefficient at MER wavelengths, K
410.6 NaN 0.103 0.1029 NaN NaN 439.9 NaN 0.090 0.0893 NaN NaN 486.5 0.074 0.070 0.0718 0.944 0.9703 518.7 0.080 0.084 0.0853 1.051 1.0663 547.9 0.091 0.091 0.0915 0.997 1.0055
Table 2: This table shows an example of results for one of the 12 available data points (cruise name, date, depth, zenith angle, measured irradiance) and gives the results from the direct measurements
(Measured) and from SRS computations performed by the Visibility Laboratory (SRSVIS) and by NURC (SRSNurc).
related to the choice of the reference wavelengths and that this choice depends on the type of water. The following scatter-plots show the results for the data set described in section 3.2, 3.3 and 3.4. As showed in the following figures and quantified in Table 3, estimated K values are not as accurate as those retrieved with the VisLab data.
7

(a)
(b)
Figure 4: (a) K490 values from SRS computations versus K490 measured values for the Arabian (blue asterisks), Atlantis II – NABE (red squares) and EqPac (black diamond) data. (b) Error
(K_estimated – K_measured) values versus depth [meters].
Figure 5: K490 error (K_estimated – K_measured) versus K(490) and solar zenith angle (in a range that starts from 30 degrees to 90 degree).
8
Cruise 11 and λλ ∑points MeaSRS KK − MeaSRS /KK 2
MeaSRS KKRmse −=
Cap.Hook -Desteiguer
439.9 nm 547.9 nm
12 Vm=-4.16e-4 Std=0.00428
Vm=0.9969 Std=0.04905
0.004125
Arabian 442 nm 781 Vm=-3.77e-4 Vm=0.9918 0.00710 Sea 555 nm Std=0.00709 Std=0.1366
NABE 440 nm 300 Vm=0.007330 Vm=1.0638 0.009111 548 nm Std=0.00542 Std=0.04071
EqPac 440 nm 520 Vm=-4.79e-4 Vm=1.02123 0.0029325 548 nm Std=0.002895 Std=0.107704
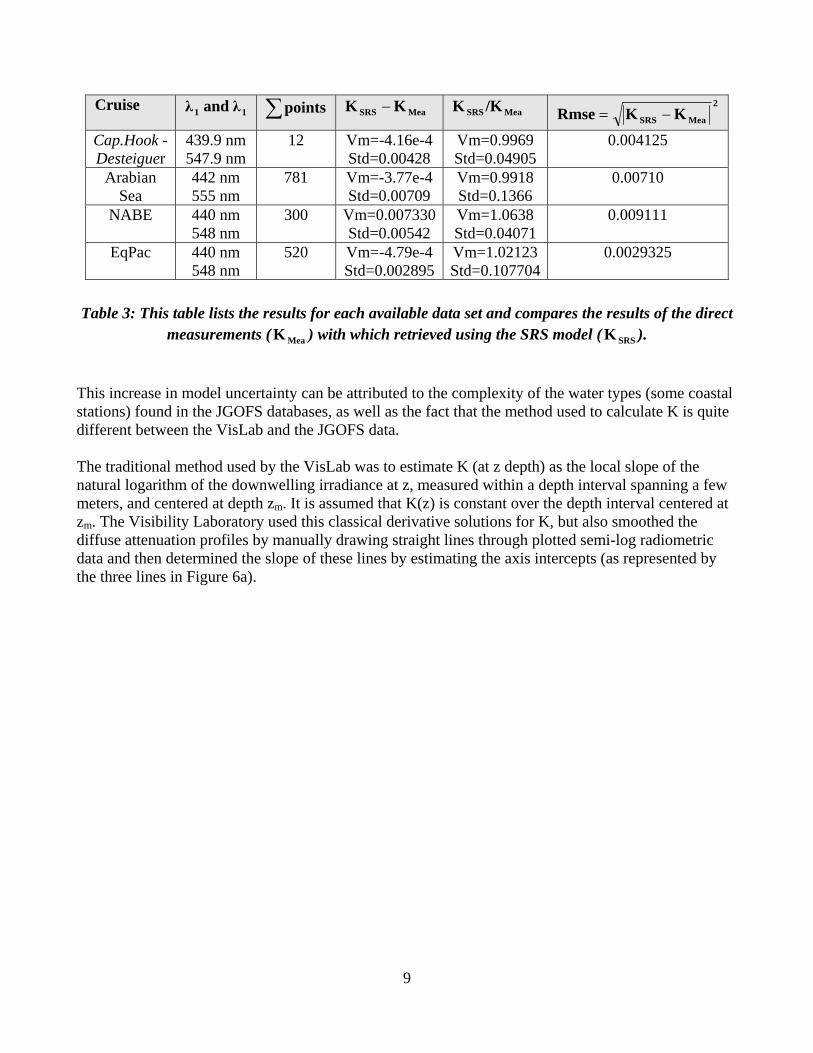
Table 3: This table lists the results for each available data set and compares the results of the direct measurements ( K Mea ) with which retrieved using the SRS model ( K SRS ).
This increase in model uncertainty can be attributed to the complexity of the water types (some coastal stations) found in the JGOFS databases, as well as the fact that the method used to calculate K is quite different between the VisLab and the JGOFS data.
The traditional method used by the VisLab was to estimate K (at z depth) as the local slope of the natural logarithm of the downwelling irradiance at z, measured within a depth interval spanning a few meters, and centered at depth zm. It is assumed that K(z) is constant over the depth interval centered at zm. The Visibility Laboratory used this classical derivative solutions for K, but also smoothed the diffuse attenuation profiles by manually drawing straight lines through plotted semi-log radiometric data and then determined the slope of these lines by estimating the axis intercepts (as represented by the three lines in Figure 6a).
9

(b)(a)
Figure 6: Comparison between K versus depth profile. (a) represents a typical profile from the Visibility Laboratory data, while (b) represents a profile from JOFS data.
The computer generated K profile (least squares regression fit) was then smoothed based on the slopes measured. This allowed for correction of the ship shadow, if present, and the increased noise near the surface caused by the enhanced backscattered generated by waves. The smoothed K profiles were then digitized using a drawing tablet. This computer technique to calculate K required a large depth interval of some ~20 m and hence caused the slopes in sharply defined layers, areas of high attenuation gradients, to be poorly represented.
For the data used in the JGOFS analyses to confirm the applicability of the SRS approach, an alternate method of determining K-profiles was used[9]. The K-profile is represented analytically by Hermititan cubic polynomials with unknown coefficients, consisting of a K(zn) and its derivative dK(zn)/dz, at each of several discrete depths dividing the profile into finite depth elements. The measured set of equations corresponding to each measured value E(z) in the profile and depth z in the profile, are assembled into matrix form and the unknown set of coefficients K(zn) and dK(zn)/dz are determined using classical least-squares minimization. Compared to results of the derivative solution used at the Vis Lab, the integral method yields significantly more detailed representation of very sharp layers in bio-optical profiles (when compared to concurrent beam attenuation and chlorophyll fluorescence profiles). These sharp gradients in the JGOFS K profiles may introduce additional uncertainties when retrieving integrated K values.
IMPACT/APPLICATIONS
This report presents work performed to study, analyze, test and validate the SRS technique proposed by Petzold and Austin in 1987. The results are shown in the form of tables and plots with means and
10

standard deviations. Comparison between NURC and VisLab showed very good agreement. The little differences found were probably due to different linear interpolation methodologies and approximations that have been performed to retrieve some coefficients (unfortunately, the original interpolation was not reported by the VisLab). We conclude that MATLAB algorithms developed at NURC work properly and that they are ready to be applied to different data sets. The results retrieved using new data sets (different types of water) are accurate (RMSE mean of the three data sets is 0.00637) comparable to what was retrieved in the past. The SRS technique provides a unique way to calculate water clarity from fixed depth observing platforms, such as AUV, moorings, submarines, US Navy SEAL delivery vehicles, etc. The SRS was validated in Case I waters and now needs to be evaluated and validated in Case II coastal waters.
RELATED PROJECTS
High quality IOP and AOP data will be collected during NATO Undersea Research Centre cruises (Ligurian Sea Calibration/Validation) in Oct 08 and Mar 09 in the Ligurian Sea and the Gulf of Lyons that could be used to evaluate and test the SRS technique in coastal Case II waters. In addition, Slocum gliders will also be deployed before and during the cruises to survey these areas. One of gliders has a 4 channel irradiance sensor, which will collect additional data for SRS evaluation.
REFERENCES
[1] T. J. Petzold. 1983. Determination of the optical properties of the atmosphere above the ocean’s surface from spectral measurements of the natural light made below the surface, VisLab Tech Memo EN-001-83t, SIO, UCSD.
[2] T.J. Petzold and R.W. Austin. 1987. Remote sensing of atmospheric optical thickness and seawater attenuation when submerged: Wavelength selection and anticipated errors. Visibility Laboratory Tech. Memo, SIO Ref 87-18. SIO, UCSD, 178 pp.
[3] H. Neckel and D. Labs. 1981. Improved data of solar spectral irradiance from 0.33 to 1.15 �. Solar Physics 74:231-249.
[4] D. Tanre, M. Herman, P.Y. Deschamps and A. de Leffe. 1979. Atmospheric modeling for space measurements of ground reflectances, including bidirectional properties. Appl. Opt. 18:3,587-3,594.
[5] R.W. Austin and T.J. Petzold. 1981. The determination of the diffuse attenuation coefficient of sea water using the Coastal Zone color Scanner. In Oceanography from space (J.F.R. Gower, ed), Plenum Publishing Corp, pp. 239-256.
[6] R.W. Austin and T.J. Petzold. 1984. Spectral dependence of the diffuse attenuation coefficient of light in ocean waters. Ocean Optics VII, (R.W. Spinrad, ed.), Vol 489, SPIE, pp. 168-178.
[7] R.W. Austin and T.J. Petzold. 1986. Spectral dependence of the diffuse attenuation coefficient of light in ocean waters. Optical Engineering 25:471-479.
[8] R.W. Austin and T.J. Petzold. 1990. Spectral dependence of the diffuse attenuation coefficient of light in ocean waters: A re-examination using new data. Ocean Optics X, (R.W. Spinrad, ed.), Vol 1302, SPIE, pp. 79-83.
11

[9] Mueller, J.L., 1995: Integral method for analyzing irradiance and radiance attenuation profiles. Ch. 3 In: Siegel, D.A., et al. 1995: Results of the SeaWiFS Data Analysis Round Robin, July 1994 (DARR-94). NASA Tech. Memo. 104566, Vol. 26, S.B. Hooker and E.R. Firestone, Eds., NASA Goddard Space Flight Center, Greenbelt, Maryland, pp 44-48.
PUBLICATIONS
Trees, C. C., G. Pennucci, R. Austin, and T. Petzold. 2008 Evaluation of a submerged remote sensing (SRS) technique. Ocean Optics XIX, 6-10 Oct 2008, Barga, Italy.
12
Related Documents