8th International River Engineering Conference Shahid Chamran University , 26-28 Jan. 2010 , Ahwaz Evaluation of a Numerical Modeling for Flow over an OGEE Spillway Fatema Zandi Goharrizi 1 , Mehdi Azhdary Moghadam 2 1 Msc student of water engineering, [email protected] 2 Assistant Professor, University of Sistan and Baluchestan, [email protected] ABSTRACT The main objectives of the present research were to simulate flow over an ogee spillway by a commercial numerical model and investigate the ability of the model to predict several characteristics of flow. At ten different flow head, discharge and pressure were obtained by physical model, that constructed with Plexiglas and placed in a test flume. k- Standard is used for turbulent modeling in finite volume method and volume of fluid is used to predict free surface of flow. Numerical results have a good agreement with physical model results and also with data interpolated from U.S. Army Corps of Engineering and U.S. Bureau of Reclamation design monographs. This compatibility has shown in nondimensional curves. The numerical modeling has shown efficiency in studies due to saving time and money and ability of monitoring all necessary data in several conditions. Keywords: Ogee spillway, numerical model, finite volume method, volume of fluid, CFX

Welcome message from author
This document is posted to help you gain knowledge. Please leave a comment to let me know what you think about it! Share it to your friends and learn new things together.
Transcript
8th International River Engineering Conference
Shahid Chamran University , 26-28 Jan. 2010 , Ahwaz�
Evaluation of a Numerical Modeling for Flow over an OGEE
Spillway
Fatema Zandi Goharrizi1, Mehdi Azhdary Moghadam2
1 Msc student of water engineering, [email protected] 2 Assistant Professor, University of Sistan and Baluchestan, [email protected]
ABSTRACT
The main objectives of the present research were to simulate flow
over an ogee spillway by a commercial numerical model and
investigate the ability of the model to predict several characteristics of
flow. At ten different flow head, discharge and pressure were obtained
by physical model, that constructed with Plexiglas and placed in a test
flume. k-� Standard is used for turbulent modeling in finite volume
method and volume of fluid is used to predict free surface of flow.
Numerical results have a good agreement with physical model results
and also with data interpolated from U.S. Army Corps of Engineering
and U.S. Bureau of Reclamation design monographs. This
compatibility has shown in nondimensional curves. The numerical
modeling has shown efficiency in studies due to saving time and money
and ability of monitoring all necessary data in several conditions.
Keywords: Ogee spillway, numerical model, finite volume method, volume
of fluid, CFX
�
Introduction
One of the most popular hydraulic structures in studies is the ogee-crested spillway,
because of its fine hydraulic characteristics. Engineers widely use it in situations and know if
properly designed. It has ability to pass flows efficiently and safely, with relatively good flow
measuring capabilities. Engineer’s need to understand flow characteristics changing due to
variety of hydraulic and geometry design modifications such as hydraulics head, make them
to use modeling, both physical and numerical. These days computational fluid dynamics
(CFD) is used extensively by engineers to model and analyse complex issues related to
hydraulic design, planning studies for future generation stations, civil maintenance, supply
efficiency, and dam safety. However it is necessary to evaluate artificial models with
experimental models due to the rapidly changing advances in computational modeling for
solving the governing equations of fluid flow.
The choice of a physical model, computational model, or interpolating/extrapolating the
needed information from the U.S. Army Corps of Engineers (USACE) or the U.S. Bureau of
Reclamation (USBR) design/performance curves is up to engineer and his knowledge of
capabilities and limitations of state-of-the-art computational modeling or if the effects of
extrapolating. This study was completed at to compare the discharge and crest pressures
from flow over an uncontrolled ogee-crested spillway using a physical model, computational
model, and design curves from the USBR and USACE.
A standard ogee-crested spillway design was used for comparison the numerical model
with USBR and USACE data. These nondimensional data could be interpolated from
USACE (1990) and USBR (Design 1977) published reports and here we cached them from
the research done by Savage and Johnson (2001). The crest geometry is shown in Fig. 1. The
physical model data was obtained from the Plexiglas model used by Savage and Johnson
(2001). Commercial available computational fluid dynamics (CFD) software package,
ANSYS CFX (in brief: CFX) was used as numerical model.
Background
Variety of researches has been done in this field of modeling to help hydraulic designers to
obtain pressure, velocity and free surface level data for ogee spillway. In the hydraulic design
head the flow over crest acts as an aerated napped flowing over sharp-crested weir. At the
lower heads, the discharge is less than sharp-crested design discharge because of crest
resistance. At heads higher than design head, the discharge is greater than an aerated sharp-
crested weir because the negative crest pressure suctions more flow.
Although designing a crest allows small negative pressures at the design head because it
increases the efficiency of the spillway, there is also a prohibition for large negative pressures
on the crest. Because large negative pressures lead to cavitation damage, destabilization of
the structure, and possible safety failure. Large negative pressures can also be caused by
discontinuities in the crest shape and surface roughness.
Considerable works on understanding overflow spillways are available that depend on the
relative height and upstream face slope of the spillway (Maynord 1985) (Savage and Johnson
2001). Bazin (Chow 1959), in 1888, completed a comprehensive laboratory investigation and
was the first to study the ogee shape. After Bazin, a big area of the existing information was
developed from extensive data cached from physical models done by the USBR and the
USACE. For more information respect these references: USACE (1990), Design (1977), and
Chow (1959), Savage and Johnson (2001).
�
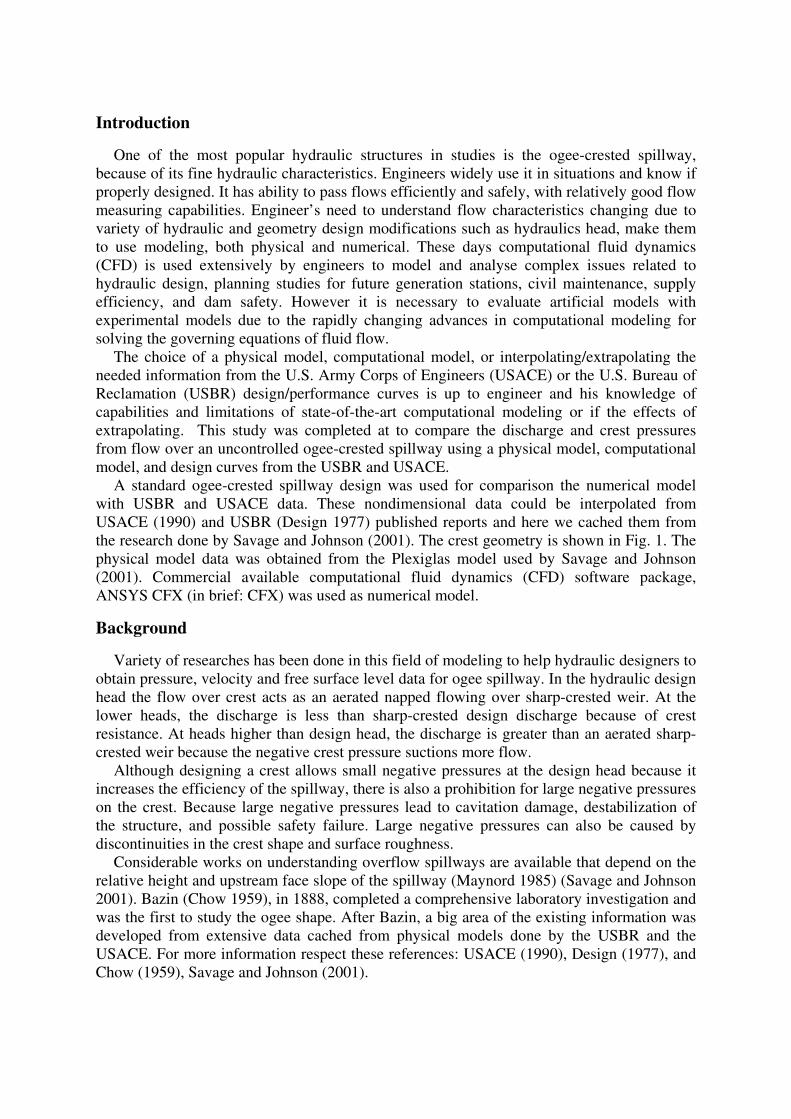
Fig.1. Ogee Dimensions and Flow Parameters
In the recent years several attempts provided for CFD solutions and mathematical
methods. In some of them there is a good agreement with experimental data for a limited
numbers of their solutions. One of them did it by potential flow theory and mapping into the
complex potential plane. This attempt led to conclude that viscosity has a negligible influence
on the location of the free surface. Also another one obtained that the minimum pressure
point for a given head is up to the boundary condition configuration. And a good one showed
excellent agreement for water surfaces and discharge coefficients for a limited number of
flows. However, pressure data were only recorded at five locations downstream from a
nonstandard crest at one flow and showed some variability.
Some recent researches are due to, Savage and Johnson (2001), Savage and Johnson
(2001) studied a two-dimensional simulation of flow over an ogee spillway using a
commercial CFD code Flow-3D. They found a good agreement with experiments for both
pressures and discharge. Dargahi (2006) used Fluent to investigate flow field over an
overflow spillway and compare it with 3D flows simulations, he used commercial code to
simulate water surface, discharge coefficient and wall shear stresses. Chanel and Doering
(2007) presented in their research a comparison of discharge rating curves obtained through
numerical modeling with the CFD software Flow-3D to data acquired from physical model
studies on three Manitoba Hydro generating stations with significantly different spillway
height, P, to design head, Hd ,ratios. The objective of this study is investigate the problem and
solve the RANS equations by CFX.
The Ogee Crest Spillway Information
As you see in the Fig. 1 the ogee crested spillway is one of the standard one with tree
curves upstream of the crest axis. Downstream section from the crest axis to the tangent
section has been standardized to the equation shown in Fig. 1. The coefficients and
exponents may change, depending on the dam geometry and design flow rate. Tangent
section is located at X/Hd =1.4 and a typical flip buckets placed at the end of the obstacle.
P/Hd = 2.70, where P is the dam height and Hd is the design head over the dam.
The discharge equation is:
�
23
0 23
2eLHgCQ = (1)
The variable Q represent the total discharge; L = lateral crest length or width; He = total
head upstream from the crest; g = gravitational constant; and C0 = discharge coefficient. The
discharge coefficient C0 is not constant, which is influenced by a variety of factors including
the depth of approach, relation of the actual crest shape to the ideal napped shape, upstream
face slope, downstream apron interference, and downstream submergence (Design 1977).
Note that there are ranges and design curves for each of conditions to describe the effect of
the parameters.
Experimental Model
The physical model data was obtained from the experiment that Savage and Johnson
(2001) have done, as mentioned before. The spillway model with a design head, Hd of 301
mm in 1.83 m width and 0.80 m height, was constructed of Plexiglas placed in flume (in an
area with Plexiglas sides) approximately 1.83 m wide by 12 m long by 1.22 m deep. The
model was tested and fabricated in UWRL. Plexiglas was chosen because it could be
fabricated with smooth curves and easily instrumented with pressure taps (Savage and
Johnson 2001). The Plexiglas also has another advantage that flow could be observed. The
P/Hd ratio was 2.7.
The flume bottom was flat and equipped with baffles and wave suppressors to provide a
uniform approach flow. The main pressure taps were placed at the center of the sectional
model (0.92 m from sidewall) to ensure that sidewall effects did not influence the pressure
data. However, several pressure taps were located laterally across the model crest axis and
were observed during testing. They showed just that the tap that was located approximately
305 mm away from the sidewall of the flume was influenced by sidewall effects. The
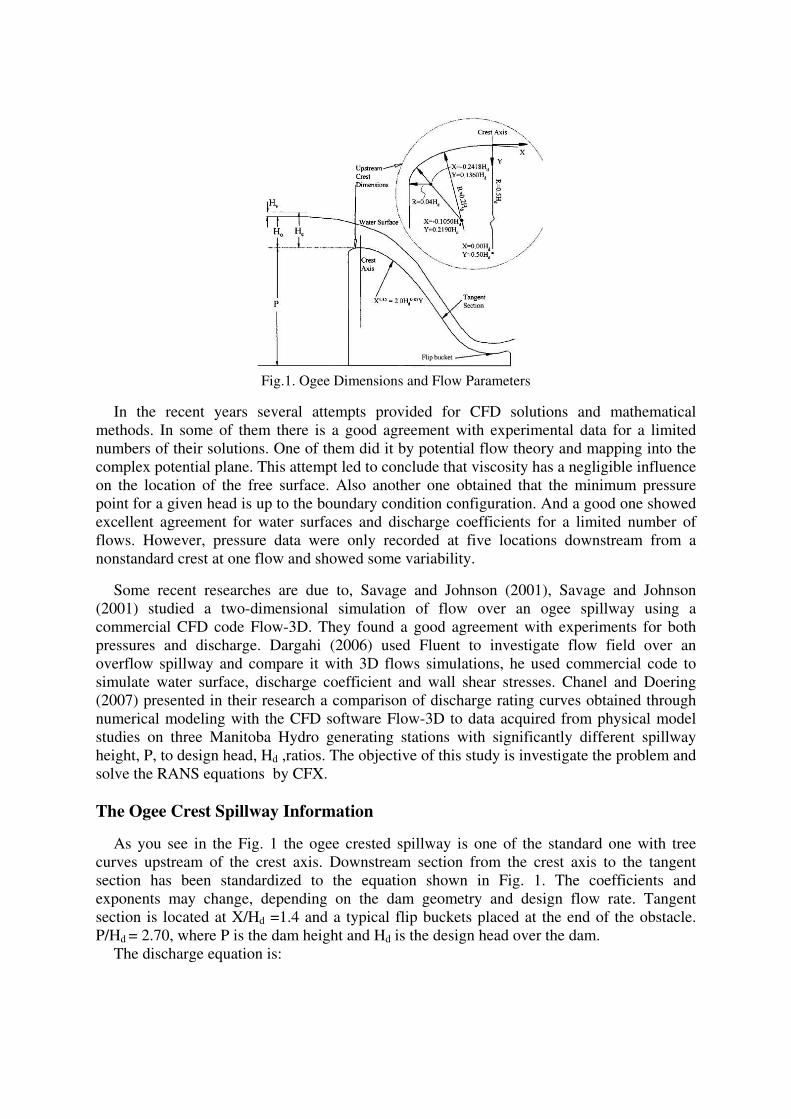
pressure taps along the spillway was shown in Fig. 2. The flowmeters and tanks were used to
control the flow rate. A piezometer board with glass tubes vented to the atmosphere was
applied for measuring pressures on the spillway that leveled and connected to the pressure
taps. An average pressure was recorded.
FIG. 2. Grid Dimensioning for Ogee Crest
The flow was set by a control valve in the model. Ten different flow rates are used to
calculate a discharge rating curve for crest. The heads were ranging from He /Hd = 0.07 to
1.20, where He is the effective head upstream above the crest.
�
By allowing the free discharge from flip bucket to the flume the tailwater was kept below
critical depth and had no influence on the pressure taps on the spillway. At a distance of 2.04
m upstream from the model crest, the headwater elevation was measured.
Numerical Model
Computational Fluid Dynamics (CFD) is a computer-based tool for simulating the
behavior of systems involving fluid flow, heat transfer, and other related physical processes.
It works by solving the equations of fluid flow (in a special form) over a region of interest,
with specified (known) conditions on the boundary of that region. ANSYS CFX is a general
purpose Computational Fluid Dynamics (CFD) software suite that combines an advanced
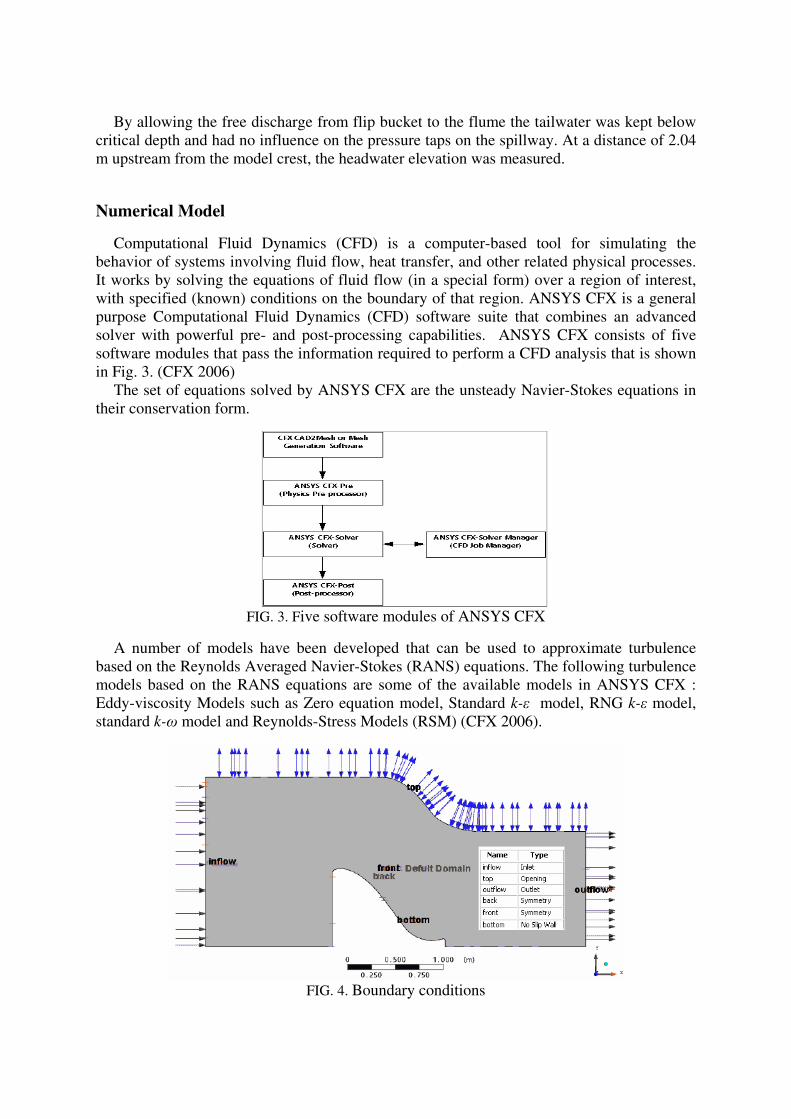
solver with powerful pre- and post-processing capabilities. ANSYS CFX consists of five
software modules that pass the information required to perform a CFD analysis that is shown
in Fig. 3. (CFX 2006)
The set of equations solved by ANSYS CFX are the unsteady Navier-Stokes equations in
their conservation form.
FIG. 3. Five software modules of ANSYS CFX
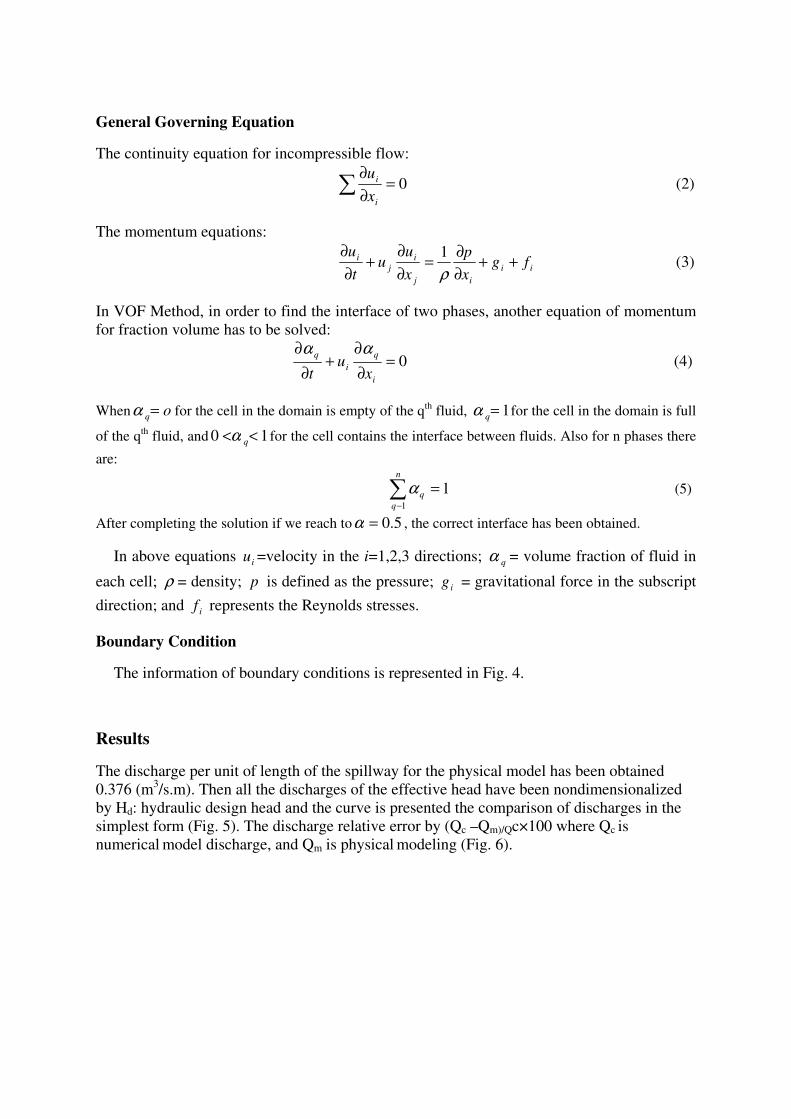
A number of models have been developed that can be used to approximate turbulence
based on the Reynolds Averaged Navier-Stokes (RANS) equations. The following turbulence
models based on the RANS equations are some of the available models in ANSYS CFX :
Eddy-viscosity Models such as Zero equation model, Standard k-� model, RNG k-� model,
standard k-� model and Reynolds-Stress Models (RSM) (CFX 2006).
FIG. 4. Boundary conditions
�
General Governing Equation
The continuity equation for incompressible flow:
0=∂
∂�
i
i
x
u (2)
The momentum equations:
ii
ij
i
j
i fgx
p
x
uu
t
u++
∂
∂=
∂
∂+
∂
∂
ρ
1 (3)
In VOF Method, in order to find the interface of two phases, another equation of momentum
for fraction volume has to be solved:
0=∂
∂+
∂
∂
i
q
i
q
xu
t
αα (4)
When oq=α for the cell in the domain is empty of the qth
fluid, 1=qα for the cell in the domain is full
of the qth
fluid, and 10 << qα for the cell contains the interface between fluids. Also for n phases there
are:
11
=�−
n
q
qα (5)
After completing the solution if we reach to 5.0=α , the correct interface has been obtained.
In above equations iu =velocity in the i=1,2,3 directions; qα = volume fraction of fluid in
each cell; ρ = density; p is defined as the pressure; ig = gravitational force in the subscript
direction; and if represents the Reynolds stresses.
Boundary Condition
The information of boundary conditions is represented in Fig. 4.
Results
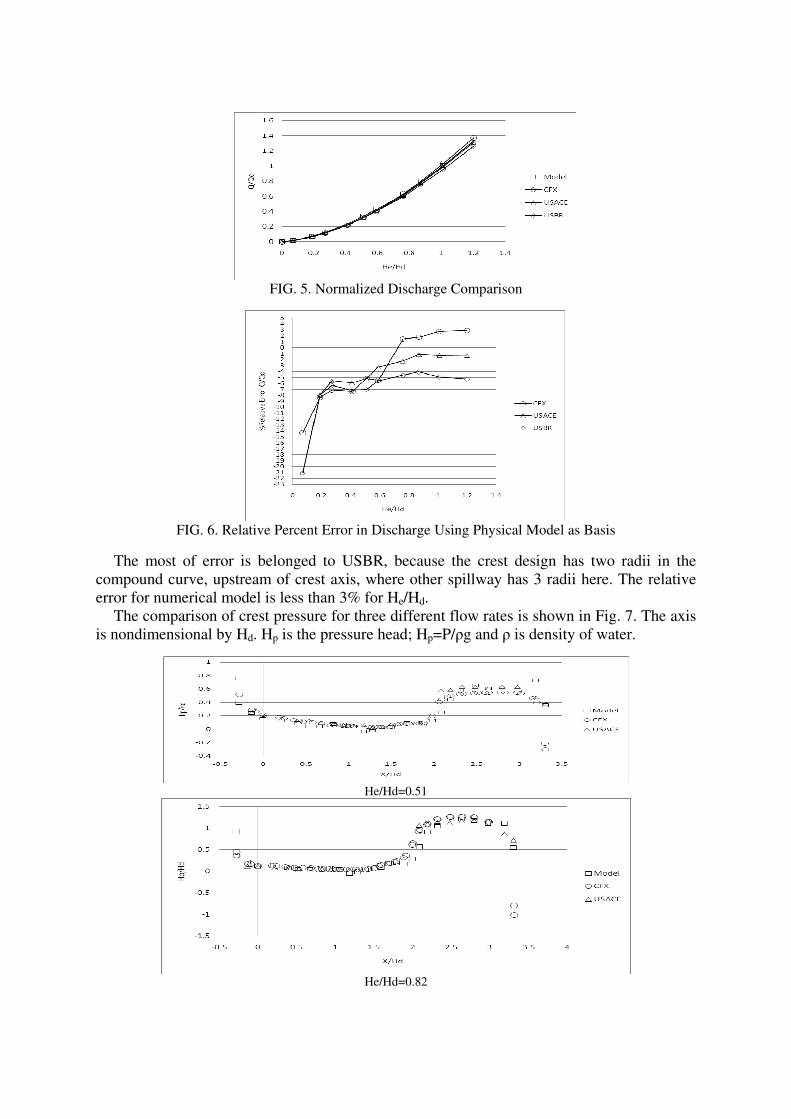
The discharge per unit of length of the spillway for the physical model has been obtained
0.376 (m3/s.m). Then all the discharges of the effective head have been nondimensionalized
by Hd: hydraulic design head and the curve is presented the comparison of discharges in the
simplest form (Fig. 5). The discharge relative error by (Qc –Qm)/Qc×100 where Qc is
numerical model discharge, and Qm is physical modeling (Fig. 6).
�
FIG. 5. Normalized Discharge Comparison
FIG. 6. Relative Percent Error in Discharge Using Physical Model as Basis
The most of error is belonged to USBR, because the crest design has two radii in the
compound curve, upstream of crest axis, where other spillway has 3 radii here. The relative
error for numerical model is less than 3% for He/Hd.
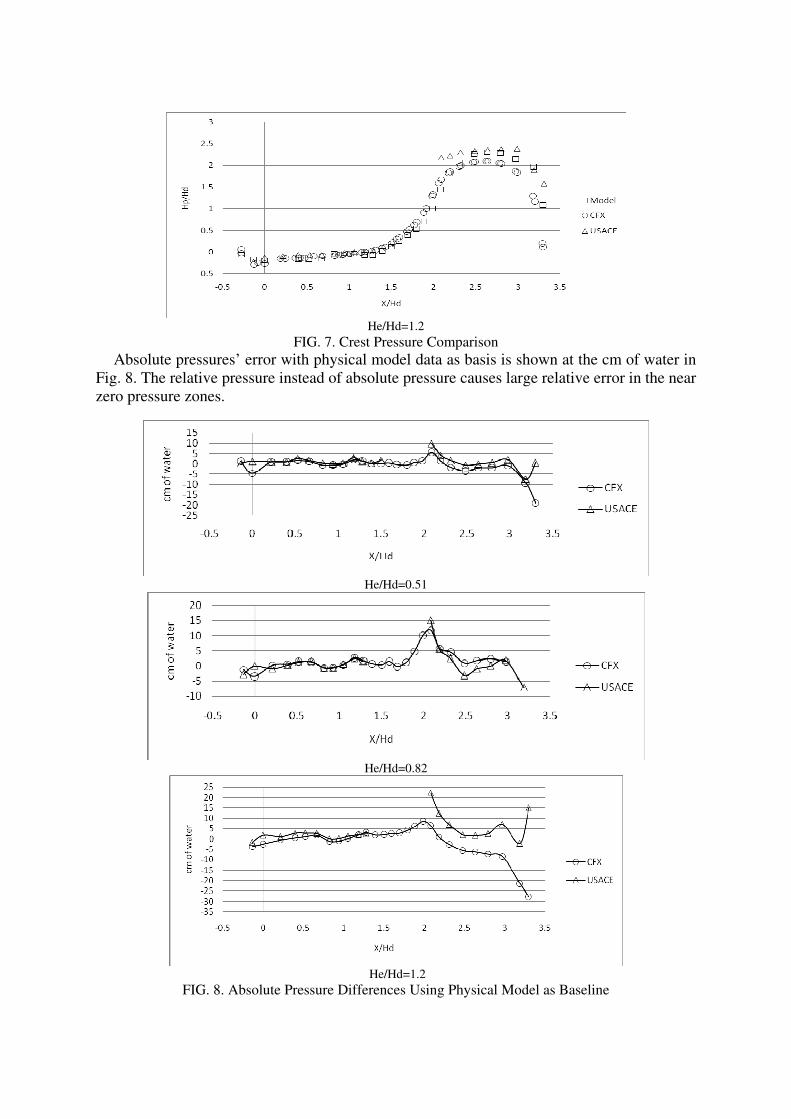
The comparison of crest pressure for three different flow rates is shown in Fig. 7. The axis
is nondimensional by Hd. Hp is the pressure head; Hp=P/�g and � is density of water.
He/Hd=0.51
He/Hd=0.82
�
He/Hd=1.2
FIG. 7. Crest Pressure Comparison
Absolute pressures’ error with physical model data as basis is shown at the cm of water in
Fig. 8. The relative pressure instead of absolute pressure causes large relative error in the near
zero pressure zones.
He/Hd=0.51
He/Hd=0.82
He/Hd=1.2
FIG. 8. Absolute Pressure Differences Using Physical Model as Baseline
�
Conclusion
In this research by using CFD model and ANSYS CFX software flow over an ogee
spillway were simulated. k-� Standard is used for turbulent modeling in finite volume method
and volume of fluid is used to predict free surface of flow. The results were compared with
physical at ten different flow head. Numerical results have a good agreement with physical
model results and also with data interpolated from U.S. Army Corps of Engineering and U.S.
Bureau of Reclamation design monographs. The numerical modeling has shown efficiency
in studies due to saving time and money and ability of monitoring all necessary data in
several conditions.
References
ANSYS CFX user manual; v 11.0. (2006) ANSYS, Inc. ANSYS Europe, Ltd.
Chanel, P. G. and Doering, J. c. (2007). An Evaluation of Computational Fluid Dynamics for
Spillway Modeling, 16th Australasian Fluid Mechanics Conference Crown Plaza, Gold
Coast, Australia.
Chow, V. T. (1959). Open-channel hydraulics, McGraw-Hill, New York.
Dargahi, B. (2006). Experimental Study and 3D Numerical Simulations for a Free-Overflow
Spillway, J. Hydr. Engrg., ASCE, 132(9).
Design of small dams. (1977). U.S. Bureau of Reclamation, U.S. Government Printing
Office, Washington, D.C.
Nichols, B. D., Hirt, C. W. (1981). ‘‘Volume of fluid (VOF) method for the dynamics of free
boundaries.’’ Los Alamos Scientific Lab., Los Alamos, N.M.
Savage, B. M. and Johnson, M. C. (2001). Flow Over Ogee Spillway: Physical and numerical
Model Case Study, J. Hydr. Engrg., ASCE, 127(8).
U.S. Army Corp of Engineers (USACE). (1990). ‘‘Hydraulic design of spillways.’’ EM
1110-2-1603, Dept. of the Army, Washington, D.C.
Versteeg, H. K., and Malalasekera, W. (1995). An introduction to computational fluid
dynamics, Longman Scientific and Technical, New York.
�
Related Documents


