EVALUATION OF A NEW METHODOLOGY TO ASSESS THE EFFECT OF RAP GRADATION AND CONTENT ON MIXTURE CRACKING PERFORMANCE By YU YAN A DISSERTATION PRESENTED TO THE GRADUATE SCHOOL OF THE UNIVERSITY OF FLORIDA IN PARTIAL FULFILLMENT OF THE REQUIREMENTS FOR THE DEGREE OF DOCTOR OF PHILOSOPHY UNIVERSITY OF FLORIDA 2016

Welcome message from author
This document is posted to help you gain knowledge. Please leave a comment to let me know what you think about it! Share it to your friends and learn new things together.
Transcript
EVALUATION OF A NEW METHODOLOGY TO ASSESS THE EFFECT OF RAP GRADATION AND CONTENT ON MIXTURE CRACKING PERFORMANCE
By
YU YAN
A DISSERTATION PRESENTED TO THE GRADUATE SCHOOL OF THE UNIVERSITY OF FLORIDA IN PARTIAL FULFILLMENT
OF THE REQUIREMENTS FOR THE DEGREE OF DOCTOR OF PHILOSOPHY
UNIVERSITY OF FLORIDA
2016

© 2016 Yu Yan

To my beloved parents and wife

4
ACKNOWLEDGMENTS
It is my privilege and honor to study and work at the University of Florida, the
Gator Nation. Dr. Reynaldo Roque, my supervisory committee chair, who has been
remarkably generous, resourceful, and patient to guide me through many tough
moments in work and life. Every piece of his advice and encouragement allowed me to
reach this important moment of my life.
I wanted to thank Dr. Mang Tia for sharing knowledge on his invention toward my
work with many innovative ideas. Moreover, the gratitude must be conveyed to
Dr. Bhavani Sankar, Dr. Gary Consolazio and Dr. Dennis Hiltunen for their support to
accomplish my doctoral study. My appreciations need to be expressed to colleagues
and friends with an elongated list: David Hernando, Cristian Cocconcelli, Dr. Jian Zou,
Marco Isola, Jeremy Magruder, Michael Bekoe, Bongsuk Park. Special thanks for Jim
Musseulman, Greg Sholar, David Webb, Michael Ciccarone, Cassady Allen and many
other engineers at the State Materials Office of Florida Department of Transportation in
helping and funding the project.
I also would like to express my sincere appreciation to Mr. George Lopp for his
constructive advice and assistance on laboratory testing. Many thank additionally to
whomever extended your considerations on helping me in every aspect.
I like to express the most gratefulness to my dear parents for their unconditioned
support. Finally, I would like to thank my wife, Jing Huang, for her patience, unlimited
support and enduring trust.
5
TABLE OF CONTENTS
page
ACKNOWLEDGMENTS .................................................................................................. 4
LIST OF TABLES ............................................................................................................ 8
LIST OF FIGURES ........................................................................................................ 10
LIST OF ABBREVIATIONS ........................................................................................... 16
ABSTRACT ................................................................................................................... 19
CHAPTER
1 INTRODUCTION .................................................................................................... 21
1.1 Background ....................................................................................................... 21
1.2 Problem Statement ........................................................................................... 23
1.3 Hypothesis ........................................................................................................ 24
1.4 Research Objectives ......................................................................................... 24
1.5 Scope ................................................................................................................ 25
2 LITERATURE REVIEW .......................................................................................... 27
2.1 Reclaimed Asphalt Pavement (RAP) Characteristics ....................................... 30
2.1.1 RAP Aggregate Properties ...................................................................... 31
2.1.2 RAP Binder Properties ............................................................................ 32
2.2 Volumetric Properties of RAP Mixtures ............................................................. 39
2.2.1 Gradation of RAP Mixtures ...................................................................... 39
2.2.2 Voids in Mineral Aggregate (VMA) .......................................................... 41
2.3 Performance of RAP Mixtures .......................................................................... 42
2.3.1 Surface Friction Properties ...................................................................... 43
2.3.2 Resistance to Rutting .............................................................................. 43
2.3.3 Resistance to Fatigue Cracking ............................................................... 45
2.3.4 Resistance to Low-Temperature Cracking .............................................. 49
2.3.5 Resistance to Moisture Damage ............................................................. 50
2.4 Closure ............................................................................................................. 51
3 EXPERIMENTAL PROGRAM ................................................................................. 53
3.1 Material ............................................................................................................. 53
3.1.1 Virgin Binder ............................................................................................ 54
3.1.2 RAP Sources ........................................................................................... 54
3.2 RAP Material Characterization .......................................................................... 55
3.2.1 RAP Specimen Preparation ..................................................................... 55
3.2.2 RAP Binder and Aggregate Recovery ..................................................... 56
6
3.3 Cracking Performance of RAP Binder Blends ................................................... 63
3.3.1 Conventional Binder Tests ...................................................................... 63
3.3.2 Binder Fracture Energy (BFE) Test ......................................................... 65
3.4 Superpave Mix Design for RAP Mixtures .......................................................... 66
3.4.1 FC-12.5: Reference and Low RAP Content Mixtures .............................. 67
3.4.2 FC-12.5: High RAP Content Mixtures ...................................................... 69
3.5 Cracking Performance of Asphalt Mixtures ....................................................... 71
3.5.1 Mixture Specimen Preparation ................................................................ 71
3.5.2 Mixture Aging Conditionings .................................................................... 75
3.5.3 Superpave Indirect Tensile (IDT) Testing ................................................ 77
3.6 Fracture Properties of Interstitial Components .................................................. 81
3.6.1 DBDT-IC Specimen Preparation ............................................................. 83
3.6.2 DBDT-IC Testing Protocol ....................................................................... 87
3.7 Closure ............................................................................................................. 88
4 BINDER TESTING RESULTS ................................................................................ 90
4.1 Superpave Binder Tests ................................................................................... 91
4.1.1 Brookfield Viscosity (BV) Test Results .................................................... 91
4.1.2 Dynamic Shear Rheometer (DSR): Rutting ............................................. 93
4.1.3 Dynamic Shear Rheometer (DSR): Fatigue Cracking ............................. 95
4.1.4 Bending Beam Rheometer (BBR): Low-temperature Cracking ............... 96
4.2 Multiple Stress Creep Recovery Test: Rutting and Polymer Modification ......... 99
4.3 Binder Fracture Energy (BFE) Test: Cracking ................................................ 102
4.3.1 Fracture Energy Density (FED) Results ................................................ 102
4.3.2 True Stress-True Strain Curve Results .................................................. 104
4.4 Closure ........................................................................................................... 107
5 MIXTURE TESTING RESULTS ............................................................................ 108
5.1 Mixtures Evaluation after STOA Conditioning ................................................. 109
5.1.1 Atlantic Coastal (ATL) RAP Mixtures ..................................................... 109
5.1.2 Whitehurst (WHI) RAP Mixtures ............................................................ 111
5.1.3 Comparison between ATL RAP and WHI RAP Mixtures ....................... 114
5.1.4 Closure .................................................................................................. 118
5.2 Mixture Evaluation after LTOA+CPPC Conditioning ....................................... 119
5.2.1 Atlantic Coastal (ATL) RAP Mixtures ..................................................... 119
5.2.2 Whitehurst (WHI) RAP Mixtures ............................................................ 122
5.2.3 Comparisons between ATL RAP and WHI RAP mixtures ..................... 125
5.2.3 Closure .................................................................................................. 128
5.3 Cracking Performance Evaluation................................................................... 128
6 DOG-BONE DIRECT TENSION-INTERSTITIAL COMPONENT TESTING RESULTS ............................................................................................................. 131
6.1 Interstitial Component FED Results ................................................................ 131
6.2 Comparisons between BFE, DBDT-IC and Superpave IDT Testing Results .. 134
7
6.3 Closure ........................................................................................................... 137
7 CONCLUSIONS ................................................................................................... 139
7.1 Summary and Findings ................................................................................... 139
7.2 Conclusions and Recmmendations................................................................. 140
APPENDIX
A RAP AGGREGATE AND BINDER RECOVERY ................................................... 142
B BATCHING WEIGHTS FOR DESIGNED MIXTURES .......................................... 144
C SUPERPAVE IDT SPECIMENS INFORMATION ................................................. 148
D MIX DESIGNS ...................................................................................................... 152
E BINDER TESTING RESULTS .............................................................................. 162
F SUPERPAVE IDT TESTING RESULTS ............................................................... 164
G DBDT-IC TEST SPECIMEN BATCHING SHEET ................................................. 166
H DBDT-IC TEST SPECIMEN DATA AND TESTING RESULTS ............................ 168
I DBDT-IC TEST STRESS-STRAIN RELATIONSHIPS .......................................... 169
LIST OF REFERENCES ............................................................................................. 172
BIOGRAPHICAL SKETCH .......................................................................................... 177
8
LIST OF TABLES
Table page 1-1 Binder selection guidelines for RAP mixtures ..................................................... 21
2-1 High, intermediate, and low temperature definition ............................................. 29
2-2 Binder selection guidelines for RAP mixture ....................................................... 30
3-1 FC-12.5 mix design matrix ................................................................................. ̀ 53
3-2 Virgin aggregate sources .................................................................................... 53
3-3 Plant provided RAPs batching gradations .......................................................... 56
3-4 “White Curve” of two RAPs: Reflux method ........................................................ 60
3-5 Recovered RAP binder properties ...................................................................... 60
3-6 “White Curve” for two RAPs: NCAT ignition oven method .................................. 61
3-7 Superpave volumetric parameters: FC-12.5 reference mixture .......................... 68
3-8 DASR-IC parameters: FC-12.5 reference mixture and RAP mixtures ................ 68
3-9 Aggregate usage for reference and 20% RAP blended mixtures ....................... 69
3-10 Aggregate usage for reference, 30% RAP blended mixtures ............................. 70
3-11 Asphalt content of randomly selected SGC specimens ...................................... 73
3-12 Interstitial components of a standard SGC specimen ......................................... 84
4-1 Verified mix design volumetric parameters and RAP binder replacement ratios ................................................................................................................... 91
4-2 Binder tests conditions and parameters ............................................................. 91
4-3 Typical FED values of different binders and corresponding characteristics of the true stress-true strain curves ...................................................................... 102
6-1 %Difference in FED for DBDT-IC specimens of all RAP mixtures .................... 102
A-1 Ignition oven test results: ATL RAP .................................................................. 142
A-2 Ignition oven test results: Whitehurst RAP ....................................................... 142
A-3 Solvent method results: ATL RAP .................................................................... 143
9
A-4 Solvent method results: Whitehurst RAP .......................................................... 143
B-1 Batching sheet: FC-12.5 reference mixture ...................................................... 144
B-2 Batching sheet: 20% ARL RAP mixture ............................................................ 144
B-3 Batching sheet: 30% ARL RAP mixture ............................................................ 145
B-4 Batching sheet: 40% ATL RAP mixture ............................................................ 145
B-5 Batching sheet: 20% WHI RAP mixture ............................................................ 146
B-6 Batching sheet: 30% WHI RAP mixture ............................................................ 146
B-7 Batching sheet: 40% WHI RAP mixture ............................................................ 147
C-1 ATL and WHI RAP mixtures with PG 76-22 PMA after STOA .......................... 148
C-2 ATL and WHI RAP mixtures with PG 76-22 ARB after STOA .......................... 149
C-3 ATL and WHI RAP mixtures with PG 76-22 PMA after LTOA+CPPC .............. 150
C-4 ATL and WHI RAP mixtures with PG 76-22 ARB after LTOA+CPPC ............... 151
D-1 Mixture design parameters ............................................................................... 152
E-1 BV and DSR tests results: PG 76-22 PMA (original) ........................................ 162
E-2 BV and DSR tests results: PG 76-22 ARB (original) ......................................... 162
E-3 DSR phase angle results .................................................................................. 162
E-4 MSCR test results: PG 76-22 PMA (RTFO-aged) ............................................ 162
E-5 MSCR test results: PG 76-22 ARB (RTFO-aged) ............................................. 163
E-6 BBR test results: PG 76-22 PMA (PAV-aged) .................................................. 163
E-7 BBR test results: PG 76-22 ARB (PAV-aged)................................................... 163
E-8 BFE test results ................................................................................................ 163
F-1 Superpave IDT results for RAP mixtures with PMA (STOA) ............................. 164
F-2 Superpave IDT results for RAP mixtures with ARB (STOA) ............................. 164
F-3 Superpave IDT results for RAP mixtures with PMA (LTOA+CPPC) ................. 165
F-4 Superpave IDT results for RAP mixtures with ARB (LTOA+CPPC) ................. 165
10
LIST OF FIGURES
Figure page 1-1 Experimental testing plan ................................................................................... 26
2-1 Schematic representation of procedure of coating study .................................... 34
2-2 Schematic representation of procedure of blending study .................................. 35
2-3 Black curve and white curve of WHI RAP ........................................................... 40
2-4 Some aged binder failed to be released from RAP particles .............................. 41
2-5 Example of estimated endurance limit ................................................................ 47
3-1 Virgin aggregate gradations................................................................................ 54
3-2 RAP aggregate components............................................................................... 55
3-3 RAP binder extraction and recovery ................................................................... 57
3-4 Asphalt binder extraction using reflex method .................................................... 58
3-5 Rotavapor evaporator used for asphalt binder recovery ..................................... 59
3-6 “White curve” for two RAPs: reflux method ......................................................... 59
3-7 “White Curve” for two RAPs: NCAT ignition oven method .................................. 61
3-8 MSCR testing device located at FDOT SMO laboratory ..................................... 64
3-9 Blended binder properties evaluation ................................................................. 65
3-10 BFE specimen configurations ............................................................................. 65
3-11 Reference and 20% RAP blended aggregate gradation ..................................... 69
3-12 30% RAP blended gradation .............................................................................. 70
3-13 40% RAP blended gradation .............................................................................. 70
3-14 Overall mixture testing plan ................................................................................ 71
3-15 Ignition oven test results of RAP mixtures .......................................................... 73
3-16 Laboratory equipment used for specimen preparation ....................................... 74
3-17 Specimens setup for LTOA conditioning ............................................................ 75
11
3-18 Tabletop triaxial chamber ................................................................................... 76
3-19 Superpave IDT tests ........................................................................................... 77
3-20 Determination of EE, FE, and DCSEf ................................................................. 80
3-21 DBDT specimen preparation .............................................................................. 82
3-22 DBDT-IC specimen ............................................................................................. 82
3-23 DASR and IC particles range for designed mixtures .......................................... 83
3-24 Illustration of the fine aggregate (passing #16 sieve) used for DBDT-IC specimens .......................................................................................................... 84
3-25 Experimental factors associated with the IC evaluation ...................................... 85
3-26 Batch sheet for a DBDT-IC specimen of the virgin mixture ................................ 85
3-27 DBDT-IC mold. ................................................................................................... 86
3-28 Specimen glued to loading heads and sat on an aluminum plate ....................... 87
4-1 Brookfield viscosity: PG 76-22 PMA ................................................................... 92
4-2 Brookfield viscosity: PG 76-22 ARB ................................................................... 93
4-3 G*/sinδ for PG 76-22 PMA and blended binders ................................................ 94
4-4 G*/sinδ for PG 76-22 ARB and blended binders................................................. 94
4-5 Phase angle for virgin and RAP blended binders ............................................... 95
4-6 Shear modulus (G*) for virgin and RAP blended binders ................................... 95
4-7 G*sinδ for PG 76-22 PMA and blended binders ................................................. 96
4-8 G*sinδ for PG 76-22 ARB and blended binders.................................................. 96
4-9 Stiffness for PG 76-22 PMA and blended binders .............................................. 97
4-10 Stiffness for PG 76-22 ARB and blended binders............................................... 98
4-11 Stress relaxation “m” for PG 76-22 PMA and blended binders ........................... 98
4-12 Stress relaxation “m” for PG 76-22 ARB and blended binders ........................... 98
4-13 Jnr, 3.2 for PG 76-22 PMA and blended binders .................................................. 100
4-14 Jnr, 3.2 for PG 76-22 ARB and blended binders .................................................. 100
12
4-15 Illustration of measured %recovery and minimum requirements ...................... 101
4-16 %Recovery and minimum requirements for blended binders ........................... 101
4-17 Binder FED for PG 76-22 PMA and blended binders ....................................... 103
4-18 Binder FED for PG 76-22 ARB and blended binders ........................................ 103
4-19 True stress-true strain curves for PG 76-22 PMA (P) and ATL RAP (AC) blended binders ................................................................................................ 105
4-20 True stress-true strain curves for PG 76-22 PMA (P) and WHI RAP (W) blended binders ................................................................................................ 105
4-21 True stress-true strain curves for PG 76-22 ARB (A) and ATL RAP (AC) blended binders ................................................................................................ 106
4-22 True stress-true strain curves for PG 76-22 ARB (A) and WHI RAP (W) blended binders ................................................................................................ 106
5-1 Strength of ATL-PMA and ATL-ARB mixtures after STOA ............................... 110
5-2 Failure strain of ATL-PMA and ATL-ARB mixtures after STOA ........................ 110
5-3 FED of ATL-PMA and ATL-ARB mixtures after STOA .................................... 110
5-4 Resilient modulus of ATL-PMA and ATL-ARB mixtures after STOA ................ 111
5-5 Creep compliance rate of ATL-PMA and ATL-ARB mixtures after STOA ......... 111
5-6 Strength of WHI-PMA and WHI-ARB mixtures after STOA .............................. 112
5-7 Failure strain of WHI-PMA and WHI-ARB mixtures after STOA ....................... 112
5-8 FED of WHI-PMA and WHI-ARB mixtures after STOA ..................................... 113
5-9 MR of WHI-PMA and WHI-ARB mixtures after STOA ....................................... 113
5-10 Creep compliance rate of WHI-PMA and WHI-ARB mixtures after STOA ........ 113
5-11 Strength of ATL and WHI RAP mixtures after STOA ........................................ 116
5-12 Failure strain of ATL and WHI RAP mixtures after STOA ................................. 116
5-13 FED of ATL and WHI RAP mixtures after STOA .............................................. 116
5-14 RAP “White curve” and reference mixture gradation ........................................ 117
5-15 Aggregate component of 40% WHI RAP mixture ............................................. 117
13
5-16 Resilient modulus of ATL and WHI RAP mixtures at STOA ............................. 118
5-17 Creep compliance rate of ATL and WHI RAP mixtures after STOA ................. 118
5-18 Strength of ATL RAP mixtures at two conditioning levels ................................. 121
5-19 Failure strain of ATL RAP mixtures at two conditioning levels .......................... 121
5-20 FED of ATL RAP mixtures at two conditioning levels ....................................... 121
5-21 Resilient modulus of ATL RAP mixtures at two conditioning levels .................. 122
5-22 Creep compliance rate of ATL RAP mixtures at two conditioning levels .......... 122
5-23 Strength of WHI RAP mixtures at two conditioning levels ................................ 124
5-24 Failure strain of WHI RAP at two conditioning levels ........................................ 124
5-25 FED of WHI RAP mixtures with two virgin binders at two conditioning levels ... 124
5-26 Resilient modulus of WHI RAP mixtures at two conditioning levels .................. 125
5-27 Creep compliance rate of WHI RAP mixtures at two conditioning levels .......... 125
5-28 Strength of ATL and WHI RAP mixtures after LTOA+CPPC ............................ 126
5-29 Failure strain of ATL and WHI RAP mixtures after LTOA+CPPC ..................... 126
5-30 FED of ATL and WHI RAP mixtures after LTOA+CPPC................................... 127
5-31 Resilient modulus of ATL and WHI RAP mixtures after LTOA+CPPC.............. 127
5-32 Creep compliance rate of ATL and WHI RAP mixtures after LTOA+CPPC ...... 128
5-33 Energy ratio of ATL and WHI RAP mixtures after LTOA+CPPC ...................... 129
6-1 DBDT-IC specimen ........................................................................................... 131
6-2 Illustration of stress-strain curves for virgin mixture .......................................... 132
6-3 Interstitial component tensile strength results ................................................... 133
6-4 Interstitial component failure strain results ....................................................... 134
6-5 Interstitial component FED results .................................................................... 134
6-6 Comparison of FED results for binder, interstitial component and mixture ....... 135
6-7 Normalized FED results obtained from the BFE, DBDT-IC and Superpave IDT tests ........................................................................................................... 137

14
D-1 % Asphalt binder vs. % air voids: 20% ATL RAP mixture ................................. 152
D-2 % Asphalt binder vs. % VMA: 20% ATL RAP mixture ...................................... 153
D-3 % Asphalt binder vs. % VFA: 20% ATL RAP mixture ....................................... 153
D-4 % Asphalt binder vs. % air voids: 30% ATL RAP mixture ................................. 154
D-5 % Asphalt binder vs. % VMA: 30% ATL RAP mixture ...................................... 154
D-6 % Asphalt binder vs. % VFA: 30% ATL RAP mixture ....................................... 155
D-7 % Asphalt binder vs. % air voids: 40% ATL RAP mixture ................................. 155
D-8 % Asphalt binder vs. % VMA: 40% ATL RAP mixture ...................................... 156
D-9 Asphalt binder vs. % VFA: 40% ATL RAP mixture ........................................... 156
D-10 % Asphalt binder vs. % air voids: 20% WHI RAP mixture ................................ 157
D-11 % Asphalt binder vs. % VMA: 20% WHI RAP mixture ...................................... 157
D-12 % Asphalt binder vs. % VFA: 20% WHI RAP mixture ....................................... 158
D-13 % Asphalt binder vs. % air voids: 30% WHI RAP mixture ................................ 158
D-14 % Asphalt binder vs. % VMA: 30% WHI RAP mixture ...................................... 159
D-15 % Asphalt binder vs. % VFA: 30% WHI RAP mixture ....................................... 159
D-16 % Asphalt binder vs. % air voids: 40% WHI RAP mixture ................................ 160
D-17 % Asphalt binder vs. % VMA: 40% WHI RAP mixture ...................................... 160
D-18 % Asphalt binder vs. % VMA: 40% WHI RAP mixture ...................................... 161
G-1 Batching sheet for 20% ATL RAP mixture ........................................................ 166
G-2 Batching sheet for 30% ATL RAP mixture ........................................................ 166
G-3 Batching sheet for 40% ATL RAP mixture ........................................................ 166
G-4 Batching sheet for 20% WHI RAP mixture ....................................................... 167
G-5 Batching sheet for 30% WHI RAP mixture ....................................................... 167
G-6 Batching sheet for 40% WHI RAP mixture ....................................................... 167
H-1 DBDT-IC data and testing results ..................................................................... 168
15
I-1 Stress-strain relationship for 20% ATL RAP mixtures ...................................... 169
I-2 Stress-strain relationship for 30% ATL RAP mixtures ...................................... 169
I-3 Stress-strain relationship for 40% ATL RAP mixtures ...................................... 170
I-4 Stress-strain relationship for 20% WHI RAP mixtures ...................................... 170
I-5 Stress-strain relationship for 30% WHI RAP mixtures ...................................... 171
I-6 Stress-strain relationship for 40% WHI RAP mixtures ...................................... 171
16
LIST OF ABBREVIATIONS
AASHTO American Association Of State Highway And Transportation Officials
AE Acoustic Emissions
APA Asphalt Pavement Analyzer
ARB Asphalt Rubber Binder
ATL Atlantic Coastal
BBR Bending Beam Rheometer
BFE Binder Fracture Energy
BV Brookfield Viscosity
CPPC Cyclic Pore Pressure Conditioning
DASR-IC Dominant Aggregate Size Range-Interstitial Component
DBDT-IC Dog-Bone Direct Tension-Interstitial Component
DCSE Dissipated Creep Strain Energy
DCSEf Dissipated Creep Strain Energy To Failure
DCSEmin Minimum Dissipated Creep Strain Energy
DC(T) Disk-Shaped Compact Tension
DF Disruption Factor
DSR Dynamic Shear Rheometer
EE Elastic Energy
ER Energy Ratio
EFT Effective Film Thickness
ETG Expert Task Group
FAR Fine Aggregate Ratio
FC Friction Course
17
FDOT Florida Department Of Transportation
FE Fracture Energy
FED Fracture Energy Density
FS Frequency Sweep
GA Granite
Gsb Bulk Specific Gravity
Gse Effective Specific Gravity
Gmm Maximum Specific Gravity
HMA-FM Hot-Mix Asphalt-Fracture Mechanic
IDT Indirect Tension Test
ITS Indirect Tensile Strength
ITLT Indirect Tension Test At Low Temperatures
JMF Job Mix Formulas
LTOA Long-Term Oven Aging
LS Limestone
LS Local Sand
MR Resilient Modulus
MSCR Multiple Stress Creep Recovery
MTS Material Testing System
NAPA National Asphalt Pavement Association
NCAT National Center Of Asphalt Technology
NCHRP National Cooperative Highway Research Program
PAV Pressurized Aging Vessel
PMA Polymer-Modified Asphalt
RAP Reclaimed Asphalt Pavement
18
RSCH Repeated Shear At Constant Height
RTFO Rolling Thin Film Oven
SBS Styrene-Butadiene-Styrene
SHRP Strategic Highway Research Program
SMA Stone Matrix Asphalt
SMO State Material Office
STOA Short-Term Oven Aging
SS Simple Shear
TCE Trichloroethylene
TI Toughness Index
TSR Tensile Strength Ratio
VFA Voids Filled With Asphalt
VMA Voids In Mineral Aggregate
WAM Warm Mix Asphalt
WHI Whitehurst
19
Abstract of Dissertation Presented to the Graduate School of the University of Florida in Partial Fulfillment of the Requirements for the Degree of Doctor of Philosophy
EVALUATION OF A NEW METHODOLOGY TO ASSESS THE EFFECT OF RAP GRADATION AND CONTENT ON MIXTURE CRACKING PERFORMANCE
By
Yu Yan
August 2016
Chair: Reynaldo Roque Major: Civil Engineering
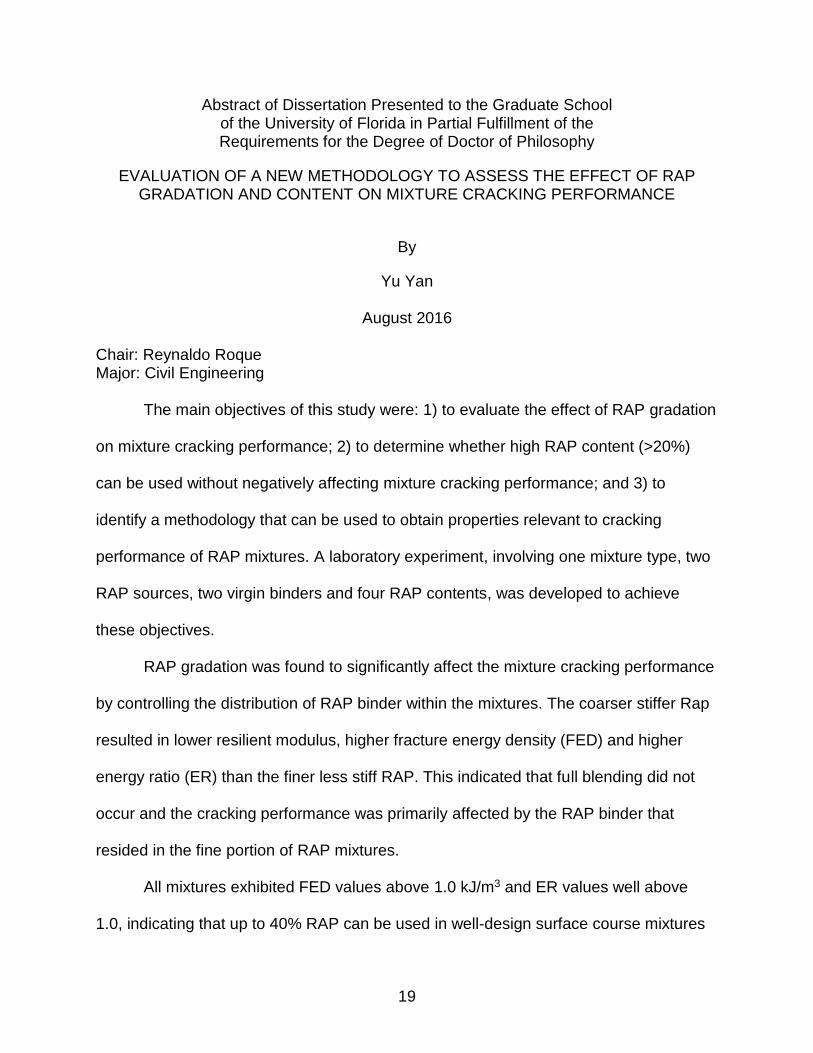
The main objectives of this study were: 1) to evaluate the effect of RAP gradation
on mixture cracking performance; 2) to determine whether high RAP content (>20%)
can be used without negatively affecting mixture cracking performance; and 3) to
identify a methodology that can be used to obtain properties relevant to cracking
performance of RAP mixtures. A laboratory experiment, involving one mixture type, two
RAP sources, two virgin binders and four RAP contents, was developed to achieve
these objectives.
RAP gradation was found to significantly affect the mixture cracking performance
by controlling the distribution of RAP binder within the mixtures. The coarser stiffer Rap
resulted in lower resilient modulus, higher fracture energy density (FED) and higher
energy ratio (ER) than the finer less stiff RAP. This indicated that full blending did not
occur and the cracking performance was primarily affected by the RAP binder that
resided in the fine portion of RAP mixtures.
All mixtures exhibited FED values above 1.0 kJ/m3 and ER values well above
1.0, indicating that up to 40% RAP can be used in well-design surface course mixtures

20
without negatively affecting the cracking performance. RAP reduced the mixture FED,
but it also, reduced the rate of damage which made reduction in the mixture FED
became the critical element in terms of detrimental cracking performance.
The IC FED correlated with mixture FED, better than binder FED, indicating the
dog bone direct tension-interstitial component (DBDT-IC) test can be used as an
effective tool to predict mixture fracture properties. This test was conducted directly on
the fine portion of a mixture that controls cracking performance. Also, the IC specimens
were produced by blending the RAP and virgin materials in the same way a RAP
mixture would normally being blended.
Current design method for RAP mixtures only considers the RAP content and
RAP binder properties, however, this study clearly revealed that the distribution of RAP
binder significantly affected the fracture properties and cracking performance of RAP
mixtures. Therefore, RAP gradation which controls the distribution of RAP binder in
mixtures, needs to be considered when designing RAP mixtures.

21
CHAPTER 1
INTRODUCTION
1.1 Background
As a result of the latest economic changes and the development of recycling
technologies, there is a trend towards increasing the use of reclaimed asphalt pavement
(RAP) in asphalt mixtures for both economic and environmental benefits. Because RAP
may contain heavily aged binders, the current standard, American Association of State
Highway and Transportation Officials (AASHTO) M323-13, provides a three-tiered
approach to select soft virgin binders for RAP mixtures, as shown in Table 1. In
particular, when high RAP content (more than 25% by weight of aggregate) is
introduced in asphalt mixtures, the blending chart approach is normally used to select
an appropriate virgin binder. However, even with a standard design procedure available,
there are still great concerns on the cracking performance of high RAP mixtures
(Mogawer et al. 2012, Willis et al. 2012), especially the surface course mixtures that
require modified binders for enhanced performance.
Table 1-1. Binder selection guidelines for RAP mixtures (AASHTO M323-13)
Recommended Virgin Asphalt Binder Grade RAP percentage
No change in binder selection <15
Select virgin binder one grade softer than normal (e.g., select a PG 58-28 if a PG 64-22 would normally be used)
15-25
Follow recommendations from blending charts >25
The blending chart approach assumes that virgin and RAP binder completely
blends in RAP mixtures, and based which to select a softer virgin binder to compensate
the stiffening effect introduced by aged RAP materials. However, today it is
22
well-recognized that maybe only part of RAP binder is available for blending (Huang et
al. 2005, Bennert and Dongre 2010, Al-Qadi et al. 2012). Inaccurate assumptions, either
“full blending” or “no blending” could cause problems in mixture performance which may
explain the conflicting observations on the cracking performance of high RAP mixtures
(Watson et al. 2008, Huang et al. 2011, Nash et al. 2011, Kim et al. 2009). Significant
amount of research efforts has been placed on quantifying the degree of blending
between virgin and RAP binders in asphalt mixtures (Huang et. 2005, Huang. Shu and
Vukosavljevic. 2011, Shirodkal et al. 2011), however, up to today there is no industry
approved method for accurate measurements (Al-Qadi et al. 2007, Bennert and Dongre
2010, Copeland 2011).
Therefore, instead of trying to quantify the degree of blending, it may be more
desirable and achievable to obtain properties from a blended material that represents
the blending mechanism better than the solvent-based binder approach. A research
group at the University of Wisconsin-Madison have used mortar tests to obtain the
rheological properties of RAP (Ma et al. 2010, Swiertz et al. 2011). More specifically, the
properties of a blend of a virgin binder of known properties and a RAP binder, can be
predicted from tests performed on mortar specimens. Three distinct advantages of
conducting tests on mortar specimens are: 1) avoid the solvent-based extraction and
recovery process which is not only time consuming but also potentially involves
handling hazard materials, 2) evaluate extremely stiff recycled binder which may be
practically impossible to recover and test and 3) obtain properties in a more
representative way compared to solvent-based binder approach.
23
Furthermore, regardless of the blending mechanism, the blending chart is not
intended for modified binders because the effect of dilution from incorporating RAP on
binder modifiers is unknown. Roque et al. (2009) found that conventional binder tests
fail to provide parameters that are consistently correlated with the relative cracking
performance of mixtures at intermediate temperatures. In particular, the binder fatigue
cracking parameter, G*sinδ, does not fully account for cracking performance
characteristics of polymer-modified binders (Yan et al. 2015). Nevertheless, fracture
properties of asphalt binder seem to be more consistently associated with the cracking
performance of asphalt mixtures (Anderson et al. 2007, Alejandro 2011). It has been
found that the binder fracture energy (BFE) test developed at the University of Florida
not only provides a reliable measurement of binder fracture energy density (FED) but
also differentiates response characteristics of asphalt binders due to the presence of
various modifiers (Niu et al. 2014, Yan et al. 2015). In addition, the newly developed
Dog-bone direction tension-interstitial component (DBDT-IC) test, which is conducted
on specimens that represents the interstitial components of asphalt mixtures, appears to
have excellent potential to develop a better methodology to evaluate how RAP content
and RAP aggregate gradation affect the fracture properties and cracking performance of
asphalt mixtures with modified binders.
1.2 Problem Statement
Tremendous amount of RAP is stockpiled, but asphalt industry hesitates to use
high RAP content because no guarantee on pavement cracking performance.
o Typically, a blending chart is used to select soft virgin binder to compensate the stiffening effect of RAP, however, this approach may not be reliable because virgin and RAP binder may not fully blend in mixtures.
24
o Surface course mixtures require modified binders for enhanced performance but the inclusion of RAP inevitably dilutes binder modifications. It is difficult to determine the maximum allowable RAP content that can be used in surface course mixtures without losing the advantages of using modified binders, or negatively affecting the pavement performance.
o If full blending does not occur, RAP aggregate gradation may significantly affect the mixture cracking performance. Due to a lack of understanding, the current design method only considers the amount of RAP and RAP binder properties, not the RAP aggregate gradation.
1.3 Hypothesis
The following hypotheses are made for this study:
o In addition to RAP binder content and properties, RAP aggregate gradation affects the cracking performance of RAP mixtures by controlling the distribution of RAP binder in the mixture.
o Fracture properties obtained from interstitial component (IC) of RAP mixtures provide a better criterion for cracking performance evaluation than properties of blended binders
1.4 Research Objectives
This study is aimed to identify a methodology that can be used to obtain
properties relevant to cracking performance of surface course RAP mixtures as well as
to establish correlations between RAP characteristics and mixture cracking performance
to provide guidelines on determination of the maximum allowable amount of RAP in
surface course mixtures.
More specific objectives of this study included:
Evaluate the effect of RAP gradation on fracture properties and cracking performance of resultant RAP mixtures.
Determine whether surface course mixtures with high (>20%) RAP content can provide satisfactory cracking performance.
Determine whether an IC test can be used to predict fracture properties of RAP mixtures better than binder tests.
25
1.5 Scope
One 12.5 mm Nominal Maximum Aggregate Size (NMAS) mixture typically used
for surface course layers was selected and modified to introduce various RAP contents.
Two RAP sources with different characteristics were utilized: Atlantic Coastal (ATL)
RAP and Whitehurst (WHI) RAP. Two modified asphalt binders, including a PG 76-22
PMA and a PG 76-22 ARB (minimum 7% asphalt rubber plus optional polymer content),
were adopted as both are currently allowed by the Florida Department of Transportation
(FDOT) for surface course mixtures. The overall research approach to accomplish the
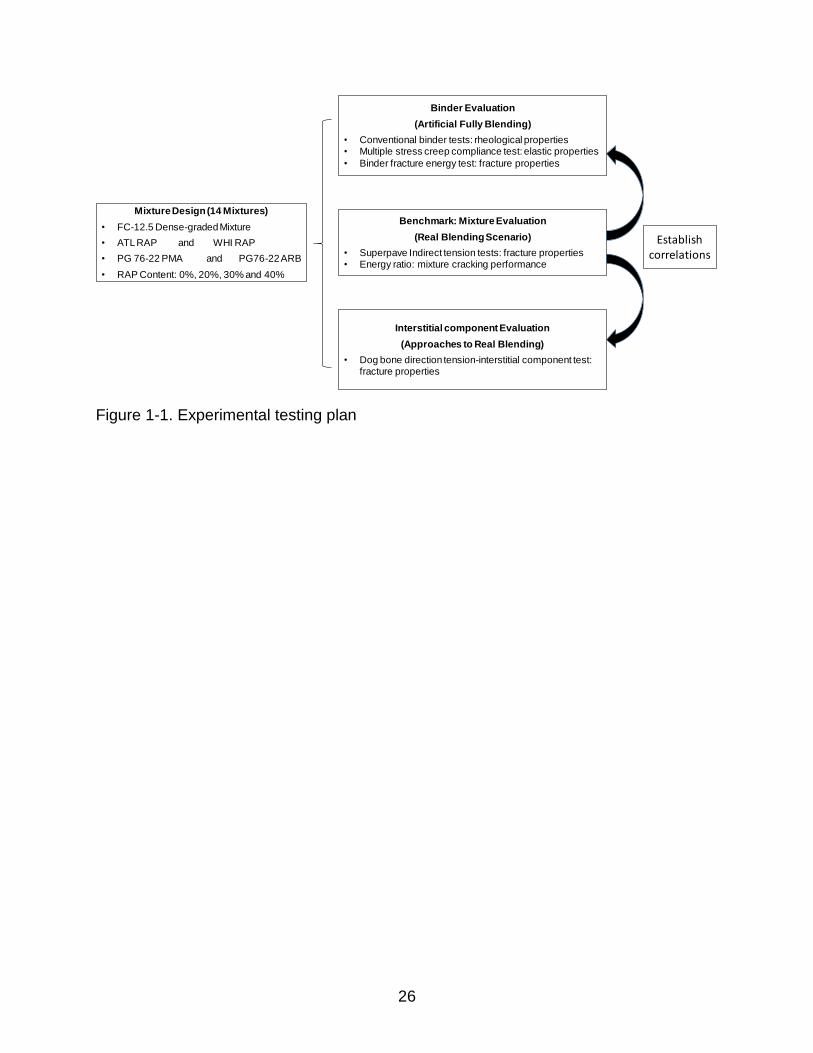
objectives of this study is shown in Figure 1-1.
The following tests and analysis were performed:
Fourteen RAP mixtures were designed with different combinations of RAP sources, contents (up to 40%) and virgin binder types.
Blends of virgin and recovered RAP binder were prepared. Superpave binder testing methodologies were conducted to obtain rheological properties of the blends. In addition, the multiple stress creep recovery (MSCR) and BFE tests were performed to obtain the elastic and fracture properties of the blended binders, respectively.
Mixtures were subjected to Short Term Oven Aging (STOA) and a combination of Long Term Oven Aging (LTOA) plus Cyclic Pore Pressure Conditioning (CPPC).
Superpave IDT tests performed at 10 °C to obtain key HMA fracture properties
for evaluation after conditioning procedures.
Energy Ratio (ER) approach was used for relative comparison of cracking performance of designed virgin and RAP mixtures subjected to LTOA plus CPPC conditioning.
DBDT-IC tests were conducted at 10 °C to obtain fracture properties of IC
specimens subjected to STOA conditioning.
The effect of RAP on fracture properties of binder, IC and mixture were compared to determine whether the DBDT-IC test can be used to predict fracture properties of RAP mixtures better than binder tests.
26
Figure 1-1. Experimental testing plan
Mixture Design (14 Mixtures)
• FC-12.5 Dense-graded Mixture
• ATL RAP and WHI RAP
• PG 76-22 PMA and PG76-22 ARB
• RAP Content: 0%, 20%, 30% and 40%
Binder Evaluation
(Artificial Fully Blending)
• Conventional binder tests: rheological properties • Multiple stress creep compliance test: elastic properties
• Binder fracture energy test: fracture properties
Benchmark: Mixture Evaluation
(Real Blending Scenario)
• Superpave Indirect tension tests: fracture properties• Energy ratio: mixture cracking performance
Interstitial component Evaluation
(Approaches to Real Blending)
• Dog bone direction tension-interstitial component test: fracture properties
Establish correlations
27
CHAPTER 2
LITERATURE REVIEW
RAP material is generated when damaged pavement is milled, crushed,
sometimes fractionated, and stockpiled for use as an additional component in asphalt
mixture. The high cost and limited availability of asphalt binder caused by the 1973 oil
embargo spurred the wide use of RAP in the United States. Other factors that may lead
to increased RAP use are the increasing need to rehabilitate and reconstruct aging
pavement infrastructure, environmental considerations, and depletion of natural
resources.
In 2007, the Federal Highway Administration (FHWA) created the RAP Expert
Task Group (ETG) to advance the use of recycled materials. In cooperation with the
AASHTO, the RAP ETG conducts a survey every 2 years. In general, the survey, which
garners good results from most states, seeks information such as how much RAP is
permitted in mixtures by State DOTs and how much RAP contractors actually use in
mixtures. Although RAP use varies considerably, the average RAP content was
estimated to be around 12% in 2007 (Jones, 2009). The most recent survey (Pappas,
2011) indicated little change in RAP use specified by state DOTs, while contractors did
report a significant increase in mixtures using 20-30% RAP with no change in mixtures
containing other percentages of RAP. A survey conducted by the National Asphalt
Pavement Association (NAPA) indicated that the amount of RAP used in HMA/warm
mix asphalt (WMA) increased from 56 million tons to 62.1 million tons between 2009
and 2010. Assuming 5% liquid asphalt in RAP, the 10% increase in RAP use represents
over 3 million tons of asphalt binder conserved (Hansen and Newcomb, 2011).
28
In the late 1980s, the Asphalt Institute developed a viscosity blending chart for
the selection of virgin asphalt binders and recycling agents for projects incorporating
RAP in HMA design. Many states used this approach to establish their own maximum
RAP percentage of RAP, ranging typically from 10-50%. In 1993, Superpave was
introduced as part of the Strategic Highway Research Program (SHRP). The original
Superpave design procedure did not include guidance on how to incorporate RAP into
the new mix design system. However, economic and environmental benefits have made
the incorporation of RAP content into Superpave mixtures desirable.
In 1997, a subgroup of the FHWA Asphalt Mixture ETG developed interim
guidelines for inclusion of RAP into Superpave mixture design procedures based on the
experience and performance of Marshall Mixes with RAP content (Bukowski, 1997). A
three-tiered approach for RAP usage was established. When RAP use is less than 15%,
the virgin asphalt binder grade can remain unchanged. Virgin asphalt binder should be
reduced by one grade (6˚ increment) on both the low and high-temperature grades
when the additional RAP is 15-25%. Superpave blending charts should be used to
determine the grade of virgin asphalt binder for RAP content greater than 25%. The
Superpave blending chart determines the temperature values required for the recycled
binder to have a specified viscosity (stiffness), as opposed to the conventional viscosity
blending chart, which determines recycled asphalt binder viscosity at a specified
temperature.
Kandhal and Foo (1997) confirmed the viability of the three-tier system, however,
they also found that the intermediate temperature sweep chart, G*/sinδ, overestimated
the maximum amount of RAP, as compared to field mixes using recycled HMA. The
29
researchers also recommended using a specific grade blending chart that only relied on
the G*/sinδ value of both the aged asphalt binder and the virgin asphalt binder at high
pavement service temperatures, rather than formulating six Superpave blending charts
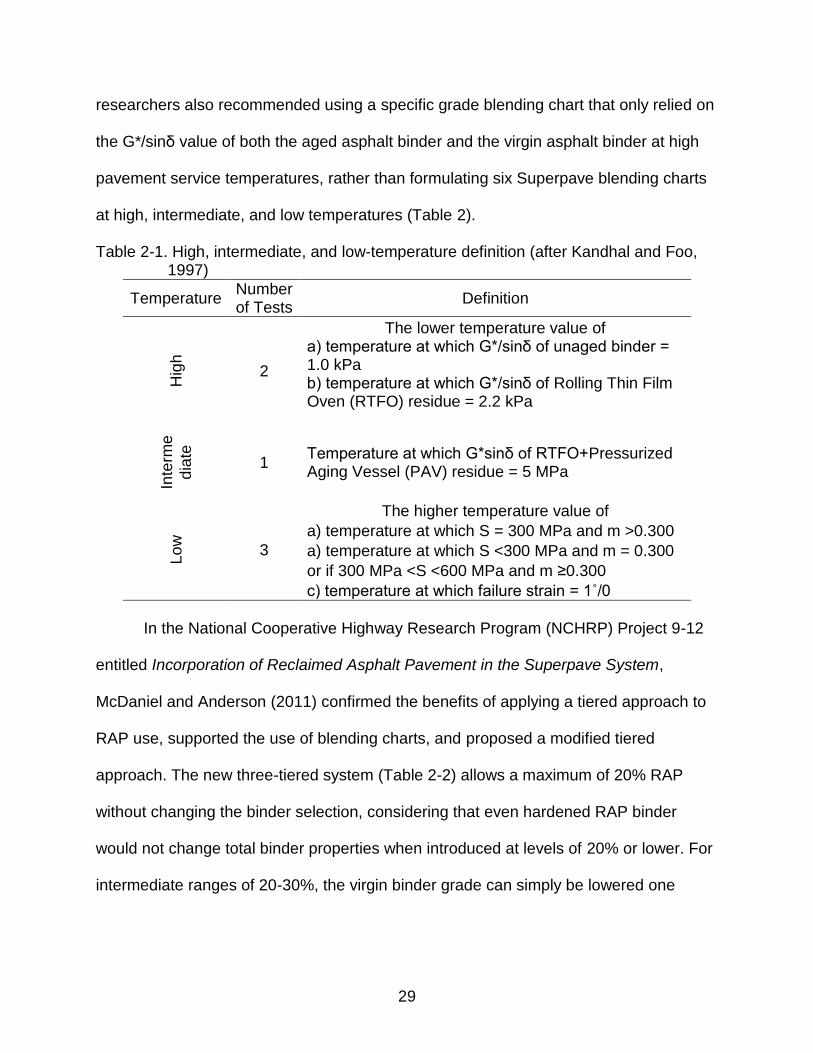
at high, intermediate, and low temperatures (Table 2).
Table 2-1. High, intermediate, and low-temperature definition (after Kandhal and Foo, 1997)
Temperature Number of Tests
Definition
Hig
h
2
The lower temperature value of a) temperature at which G*/sinδ of unaged binder = 1.0 kPa b) temperature at which G*/sinδ of Rolling Thin Film Oven (RTFO) residue = 2.2 kPa
Inte
rme
dia
te
1 Temperature at which G*sinδ of RTFO+Pressurized Aging Vessel (PAV) residue = 5 MPa
Lo
w
3
The higher temperature value of
a) temperature at which S = 300 MPa and m >0.300
a) temperature at which S <300 MPa and m = 0.300
or if 300 MPa <S <600 MPa and m ≥0.300
c) temperature at which failure strain = 1˚/0
In the National Cooperative Highway Research Program (NCHRP) Project 9-12
entitled Incorporation of Reclaimed Asphalt Pavement in the Superpave System,
McDaniel and Anderson (2011) confirmed the benefits of applying a tiered approach to
RAP use, supported the use of blending charts, and proposed a modified tiered
approach. The new three-tiered system (Table 2-2) allows a maximum of 20% RAP
without changing the binder selection, considering that even hardened RAP binder
would not change total binder properties when introduced at levels of 20% or lower. For
intermediate ranges of 20-30%, the virgin binder grade can simply be lowered one

30
grade. For mixes using more than 30% RAP, a blending chart is recommended in order
to adjust the binder grade accordingly.
There are five commonly used asphalt recycling methods, including hot in-place
recycling, cold mix recycling, cold in-place recycling, full depth reclamation, and hot mix
recycling (Santucci. L, 2007), the latter being the most common. In this method, RAP
content, virgin aggregate, asphalt binder, and/or recycling agents are blended in a
central mix plant to produce a recycled mix. Recycling agents are normally used to help
soften aged RAP binder and restore the physical and chemical properties of the old
binder. This research project focuses on the hot mix recycling approach.
Table 2-2. Binder selection guidelines for RAP mixture (after McDaniel and Anderson, 2001)
Recommended Virgin Asphalt Binder Grade
RAP percentage
Recovered RAP Grade
PG xx-22 or lower
PG xx-16
PG xx-10 or higher
No change in binder selection <20% <15% <10%
Select virgin binder one grade softer than normal (e.g., PG 58-28 if normally using PG 64-22)
20-30% 15-25% 10-15%
Follow recommendations from blending charts
>30% >25% >15%
2.1 Reclaimed Asphalt Pavement (RAP) Characteristics
Although high RAP content has been used for intermediate and base layers, use
as the major load-carrying surface layer of asphalt pavements is relatively low (Jones,
2009, Pappas, 2011 and Hansen and Newcomb, 2001). The two main concerns related
to RAP use in surface mixes are the potential of RAP on friction resistance and the
31
possibility that a high percentage of RAP or aged RAP could over-stiffen the surface
course, making the surface more susceptible to cracking or raveling.
2.1.1 RAP Aggregate Properties
The current AASHTO Standards depict the same requirements for mixtures with
and without RAP content in order to ensure performance. RAP aggregate should be
considered when determining the mixture gradation and consensus properties, except
for sand equivalent value, which is waived for its instability in tests (Shah et al, 2007).
Watson et al. (2008) evaluated the use of RAP in stone matrix asphalt (SMA)
mixtures, which was first used in Europe in 1990. The study recommends stringent
requirements for aggregate selection since SMA requires higher cubical aggregate
content than conventional mixtures to offset potential degradation due to stone-on-stone
contact. The researchers obtained RAP aggregate by removing asphalt coating from
RAP particles. The physical properties of SMA were evaluated by blending up to 30%
RAP aggregate with virgin aggregate and measuring Los Angeles abrasion loss as well
as percent flat and elongated particles. In an analysis of variance to study the effects of
RAP aggregate content, RAP types and virgin aggregate sources on physical
performance of RAP mixtures, the virgin aggregate sources was found to be the
significant factor (p-value less than 0.001). The researchers concluded that RAP
aggregate could, in fact, contribute to the physical properties of a blend since some
irregular edges may have already broken off during initial manufacturing and the initial
pavement life.
32
2.1.2 RAP Binder Properties
2.1.2.1 Blending Ratio of RAP Binder and Virgin Asphalt Binder
Previous research has shown that the structural performance of well-designed
asphalt mixtures containing RAP is generally similar to that of the conventional virgin
asphalt mixtures (Li et al, 2008). The properties of mixtures containing RAP are
influenced mainly by aged RAP binder properties and the amount of RAP in the mixture.
Field practice assumes that complete blending occurs between the RAP binder and the
virgin binder. However, this assumption may not be accurate, as it is unlikely that a
certain amount of binder absorbed by RAP aggregate will be released into the virgin
asphalt binder and reabsorbed by RAP aggregate and virgin aggregate (Al-Qadi et al,
2009).
The amount of virgin asphalt binder can be reduced by the full amount of aged
RAP binder when a low percentage of RAP is used; however, if the RAP percentage or
aged is too great, the particles may act like black rock in which case the RAP binder will
not combine with the virgin binder to any appreciable extent, leading to erroneous
results. In the NCHRP 9-12 project, McDaniel and Anderson (2001) simulated three
possible RAP mixture production scenarios, namely “black rock (no blending), total
blending (100% blending) and actual practice (blending as it usually occurs in practice).
The overall gradation and total asphalt binder content in three cases were kept
constant. Three different RAPs, two different virgin binders and two RAP contents (10
and 40%) were investigated in this study. Produced mixtures were compared using
Superpave performance parameters obtained from the Frequency Sweep (FS) test, the
Simple Shear (SS) test, and the Repeated Shear at Constant Height (RSCH) test, as
well as the Indirect Tensile Creep (ITC) and Strength (ITS) tests for HMA performance
33
evaluation at low temperature. Results indicated that, although a 10% variance of RAP
caused no significant difference between the three scenarios, the black rock case was
significantly different from the other two cases at 40% RAP content. The study also
found that only 42% of all comparisons indicated similar scenarios in the performance
parameters in total blending and actual practice cases, which may suggest that total
blending does not happen in every scenario.
Today, it is understood that the amount of blending occurring between the RAP
binder and the virgin asphalt binder lies between complete blending and no blending
(Al-Qadi et al, 2009). However, there is currently no direct method available to
accurately determine the amount of blending that occurs. Also unclear are the ways in
which RAP binder is blended with virgin asphalt binder and the extent to which blending
affects final mixture properties and performance.
Huang et al. (2005) conducted a coating study to determine how much RAP
binder would be active when blended with virgin aggregate. A No. 4 sieve was used to
screen RAP particles while virgin coarse material larger than No. 4 was mechanically
blended (without virgin asphalt binder), allowing the RAP and virgin aggregate to be
distinguished visually. National Center for Asphalt Technology (NCAT) oven ignition
tests were performed on coarse virgin aggregate and fine RAP aggregate to obtain the
corresponding asphalt contents (Figure 2-1).

34
Figure 2-1. Schematic representation of procedure of coating study (after Huang et al, 2005)
Regardless of RAP proportion (10-30%), the asphalt content of RAP particles
decreased from 6.8% to 6.0% after mixing, which indicates that 11% of RAP binder
shifted to virgin aggregate. Huang et al. (2011) concluded that RAP binder tends to stick
with RAP aggregate, making only a small portion (11% in this study) available to blend
with virgin aggregate. It should be noted that the mixing time is longer and the mixing
temperature is higher in this study than what is recommended in the AASHTO M 323,
Standard Specification for Superpave Volumetric Mix Design, therefore, 11% is unlikely
in a real-world scenario.
In addition to the coating study, Huang et al. (2005) attempted to determine how
much virgin asphalt binder was cut into RAP aggregate by performing staged extraction
and recovery tests on RAP blended mixtures. Both RAP aggregate and virgin aggregate
were limestones, and PG 64-22 was used as virgin asphalt binder. Binder rheological
tests, including the rotational viscometer test and the dynamic shear rheometer test,
were performed to characterize the rheological properties of recovered asphalt binder at
mixing (high) temperatures and service (high and intermediate) temperatures. The
asphalt viscosity around the RAP aggregate increased at both temperatures when the
sample was moved from outside to inside. Around 60% of the inner portion of the binder
35
(nearest the RAP aggregate) had asphalt properties close to pure RAP binder, which
indicates that a large portion of aged RAP binder may form a stiff layer which coats RAP
aggregate rather than blending with virgin asphalt.
Research by Shirodkal et al. (2011) found that the coating study may have
underestimated the amount of RAP binder that blends with virgin aggregate, as some
RAP working binder also coated RAP aggregates and was not included in the
calculations. However, it should be noted that the blending occurred in the coating study
was less than the 100% usually assumed in similar studies. The researchers took a
further step to determine the degree of partial blending. Virgin binder was blended with
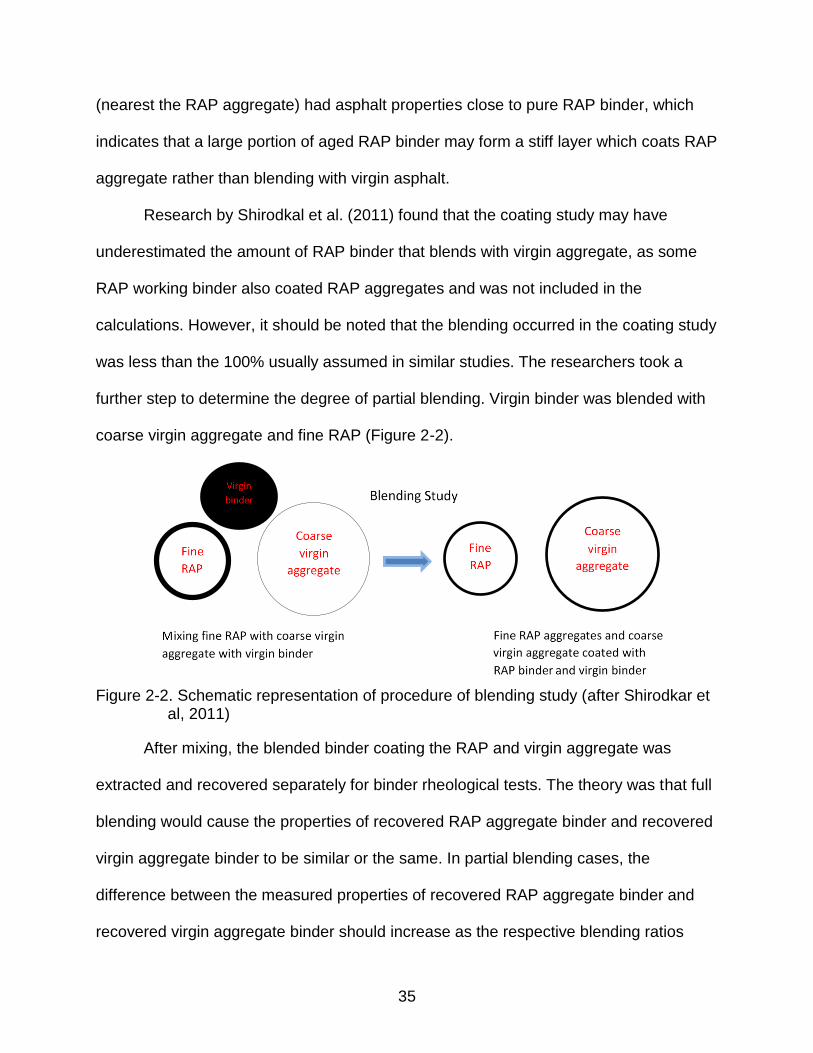
coarse virgin aggregate and fine RAP (Figure 2-2).
Figure 2-2. Schematic representation of procedure of blending study (after Shirodkar et
al, 2011)
After mixing, the blended binder coating the RAP and virgin aggregate was
extracted and recovered separately for binder rheological tests. The theory was that full
blending would cause the properties of recovered RAP aggregate binder and recovered
virgin aggregate binder to be similar or the same. In partial blending cases, the
difference between the measured properties of recovered RAP aggregate binder and
recovered virgin aggregate binder should increase as the respective blending ratios
36
decrease. In zero blending cases, the properties of recovered virgin aggregate binder
should be the same as virgin binder properties, and the properties of recovered RAP
aggregate binder should be the same as a blend of RAP binder and the corresponding
proportion of virgin binder coating RAP particles. The proportion of RAP binder and
virgin binder around the RAP aggregate under a zero blending condition was calculated
by determining film thickness of RAP binder and virgin binder following the Bailey
method. An equation was proposed to calculate the blending ratio and the
corresponding degree of partial blending (Equations 2-1 and 2-2). The Superpave PG
property measured and evaluated in this study was RTFO G*/sin(δ), and the degree of
partial blending measured for 25% RAP by weight of aggregates with PG 70-28 and
35% RAP by weight of aggregates with PG 58-28 were 70% and 96%, respectively.
𝐵𝑙𝑒𝑛𝑑𝑖𝑛𝑔 𝑟𝑎𝑡𝑖𝑜 =|(𝐺∗
sin (𝛿))𝑏𝑙𝑒𝑛𝑑 𝑏𝑖𝑛𝑑𝑒𝑟 𝑣𝑖𝑟𝑔𝑖𝑛 𝑎𝑔𝑔 − (
𝐺∗
sin (𝛿))𝑏𝑙𝑒𝑛𝑑 𝑏𝑖𝑛𝑑𝑒𝑟 𝑅𝐴𝑃 𝑎𝑔𝑔|
|(𝐺∗
sin (𝛿))𝑣𝑖𝑟𝑔𝑖𝑛 𝑏𝑖𝑛𝑑𝑒𝑟 − (
𝐺∗
sin (𝛿))𝑅𝐴𝑃 𝑣𝑖𝑟𝑔𝑖𝑛 𝑏𝑖𝑛𝑑𝑒𝑟 𝑧𝑒𝑟𝑜 𝑏𝑙𝑒𝑛𝑑|
(2-1)
Where, G*/sin(δ)blend binder virgin agg=RTFO G*/sin(δ) of blended binder coating the
coarse virgin aggregate, G*/sin(δ)blend binder RAP agg= RTFO G*/sin(δ) of blended binder
coating the fine RAP aggregate, G*/sin(δ)virgin binder= RTFO G*/sin(δ) of virgin binder,
*/sin(δ)RAP virgin binder 0 blend= RTFO G*/sin(δ) of RAP and virgin binder that coated RAP
aggregate assuming 0% blending
(2-2)
2.1.2.2 Stiffness of Blended Asphalt Binder
In general, asphalt binder ages in two stages: short-term during construction and
long-term during service. Short-term aging occurs when asphalt binder is exposed to
hot air at high construction temperatures which alter the asphalt binder viscosity
𝐷𝑒𝑔𝑟𝑒𝑒 𝑜𝑓 𝑝𝑎𝑟𝑡𝑖𝑎𝑙 𝑏𝑙𝑒𝑛𝑑𝑖𝑛𝑔 (%) = 100 1− 𝑏𝑙𝑒𝑛𝑑𝑖𝑛𝑔 𝑟𝑎𝑡𝑖𝑜

37
significantly, as well as rheological and physiochemical properties such as complex
shear modulus and adhesion. Long-term aging and hardening occur progressively
throughout the service life of asphalt binder due to oxidation, volatilization,
polymerization, thixotropy, syneresis, and separation (Roberts et al, 1996). As a result
of aging, RAP binder is generally harder and stiffer than the virgin binder, except for
RAP that has been removed from a new road that failed to meet construction
specifications. Kemp and Predoehl (1981) found that HMA air void content also
significantly affects the level of aging, as recovered binder from porous HMA is much
stiffer than regular HMA.
While RAP mixture stiffness can be affected by the aggregate and gradation, the
most important factor is the recycled binder stiffness. When RAP is added to a mix,
aged binder is incorporated as well. As RAP content increases, the proportion of aged
binder also increases, causing the resulting asphalt blend to be stiffer (Watson et al,
2008).
Research by Mohammad et al. (2003) found the Superpave binder-rutting factor
of G*/sin (δ) to be fairly sensitive to the mixture performance properties of asphalt
mixtures containing recycled polymer-modified asphalt cement. An eight-year-old
polymer-modified asphalt binder was recovered from a wearing course mixture and
blended proportionally with virgin aggregate and virgin styrene-butadiene-styrene (SBS)
polymer-modified binder to form a 19 mm Superpave mixture for rutting resistance tests.
As expected, there was a good correlation between binder G*/sin (δ) values and asphalt
pavement analyzer (APA) mixture rutting depth. There was also a strong relationship
between indirect tensile (IDT) creep test slopes and permanent shear strain from the
38
repeated shear at constant height tests. Similarly, increasing high-temperature binder
stiffness leads to increased blended mixture rutting resistance. Both the indirect tensile
creep test and APA test identified a threshold value of 20% aged SBS polymer-modified
binder in mixtures. The rutting potential increased as the aged binder increased from
0% to 20% and then decreased gradually as the aged binder increased from 20% to
60% in mixtures.
Watson et al. (2008) concluded that performance properties may show increased
sensitivity to RAP content at high temperatures. Dynamic shear rheometer (DSR) and
bending beam rheometer (BBR) tests were conducted to evaluate the rheological
properties and performance grade of recovered binder from both RAP materials and
samples of the proposed blends. A 10% RAP use showed negligible effects on
performance grade, and adding up to 30% RAP had little effect on low-temperature
performance grade properties. Aged-to-virgin binder ratio was evaluated through this
study to explain the different effects of fine- and coarse-graded RAP on recycled mix
performance.
Kim et al. (2009) evaluated the rheological properties of binder by combining
recovered RAP binder with virgin SBS polymer-modified binder. Rotational viscosity
tests were performed before the RTFO and PAV tests. Though pure RAP binder has the
largest rotational viscosity value and pure SBS-modified binder has the smallest value,
little difference was observed between blended binders containing 15%, 25%, and 35%
recovered RAP binder. The Superpave rutting parameter G*/sin (δ) and cracking
parameter G*sin (δ) values obtained from DSR tests increase as RAP content
increases, which indicates the presence of RAP binder in these mixtures. Results from
39
Multiple Stress Creep Recovery (MSCR) tests show that the maximum strain decreases
with increased RAP contents, indicating an increase in stiffness.
West et al. (2009) concluded that the use of RAP caused an increase in blended
mix stiffness, which impacts field compatibility. By monitoring density changes at a
single point in the sections after each paver and roller pass, it was found that mixtures
with 20% RAP were more easily compacted than mixtures with 45% RAP. Among four
mixes with 45% RAP, two sections which were blended with softer binder required less
compaction effort than mixtures with a polymer-modified binder.
2.2 Volumetric Properties of RAP Mixtures
2.2.1 Gradation of RAP Mixtures
In order for design mixes containing RAP to have acceptable volumetric
properties, the common practice is to account for RAP by adjusting the virgin aggregate
gradation to meet final blend gradation specifications (Gardiner and Wagner, 2007).
However, finer RAP aggregate gradation presents challenges, as the nature of milling,
ripping, and crushing, tends to break the coarse material into fine material. It is unclear
how much binder and fine aggregate are released by RAP particles throughout the
remixing process, making a true determination of RAP aggregate gradation difficult.
Gardiner and Wagner (2007) suggested that RAP should be split into a coarse
and fine fraction in order to meet the Superpave mix design requirements when
incorporating high percentages of RAP. In that study, coarse RAP fraction was used in
a 12.5 mm (below the restricted zone) Superpave gradation. The researchers selected
two sources of RAP (Georgia and Minnesota) and two 12.5 mm Superpave gradations
(one below and one above the restricted zone). Up to 40% coarse RAP fraction was
found to satisfy the below-the-restricted-zone Superpave gradation requirements,
40
mainly due to reductions in the fine aggregate fractions, especially the -0.075 mm (No.
200) material. Meanwhile, a maximum of 15% fine RAP fraction was used to produce an
acceptable above-the-restrict-zone Superpave gradation.
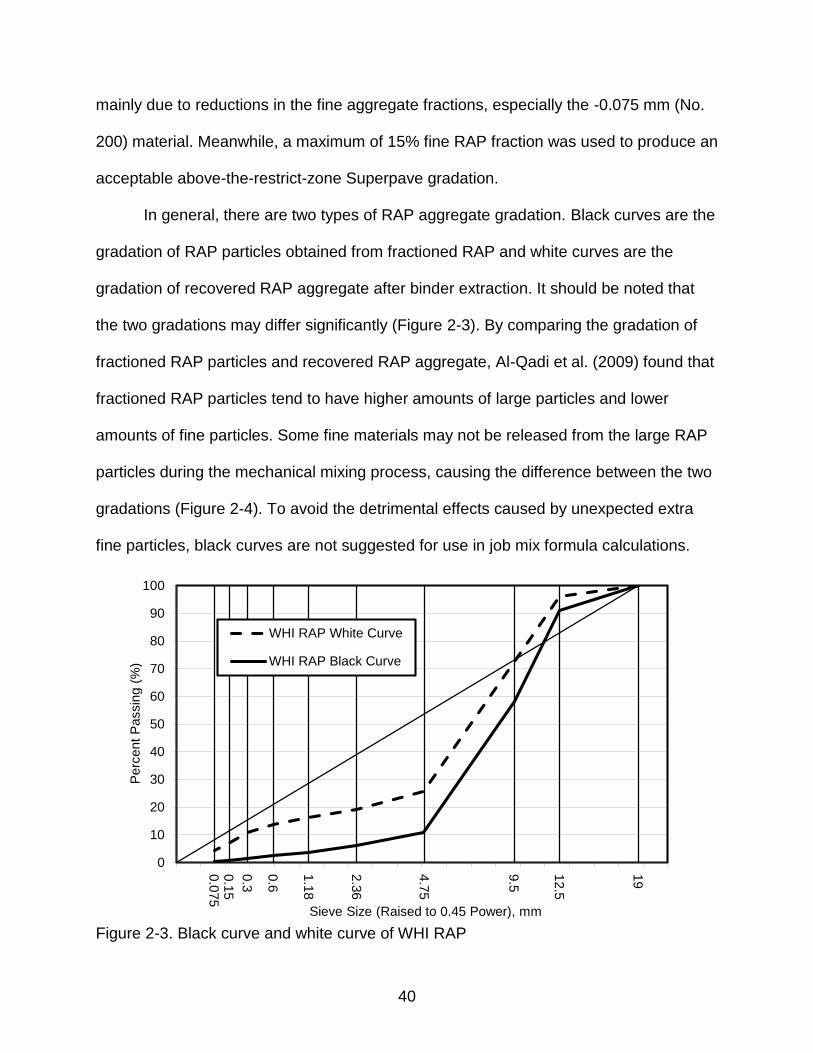
In general, there are two types of RAP aggregate gradation. Black curves are the
gradation of RAP particles obtained from fractioned RAP and white curves are the
gradation of recovered RAP aggregate after binder extraction. It should be noted that
the two gradations may differ significantly (Figure 2-3). By comparing the gradation of
fractioned RAP particles and recovered RAP aggregate, Al-Qadi et al. (2009) found that
fractioned RAP particles tend to have higher amounts of large particles and lower
amounts of fine particles. Some fine materials may not be released from the large RAP
particles during the mechanical mixing process, causing the difference between the two
gradations (Figure 2-4). To avoid the detrimental effects caused by unexpected extra
fine particles, black curves are not suggested for use in job mix formula calculations.
Figure 2-3. Black curve and white curve of WHI RAP
19
12.5
9.5
4.7
5
2.3
6
0.0
75
0.1
5
0.3
0.6
1.1
8
0
10
20
30
40
50
60
70
80
90
100
WHI RAP White Curve
WHI RAP Black Curve
Sieve Size (Raised to 0.45 Power), mm
Perc
ent
Passin
g (
%)
41
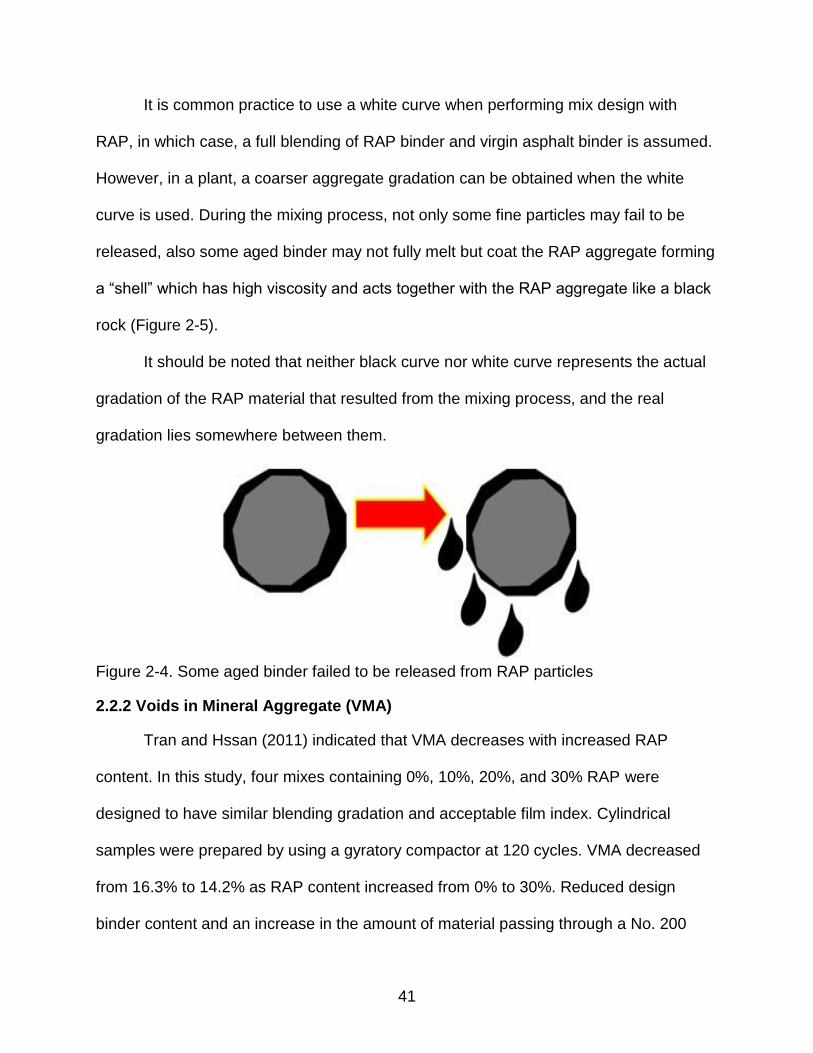
It is common practice to use a white curve when performing mix design with
RAP, in which case, a full blending of RAP binder and virgin asphalt binder is assumed.
However, in a plant, a coarser aggregate gradation can be obtained when the white
curve is used. During the mixing process, not only some fine particles may fail to be
released, also some aged binder may not fully melt but coat the RAP aggregate forming
a “shell” which has high viscosity and acts together with the RAP aggregate like a black
rock (Figure 2-5).
It should be noted that neither black curve nor white curve represents the actual
gradation of the RAP material that resulted from the mixing process, and the real
gradation lies somewhere between them.
Figure 2-4. Some aged binder failed to be released from RAP particles
2.2.2 Voids in Mineral Aggregate (VMA)
Tran and Hssan (2011) indicated that VMA decreases with increased RAP
content. In this study, four mixes containing 0%, 10%, 20%, and 30% RAP were
designed to have similar blending gradation and acceptable film index. Cylindrical
samples were prepared by using a gyratory compactor at 120 cycles. VMA decreased
from 16.3% to 14.2% as RAP content increased from 0% to 30%. Reduced design
binder content and an increase in the amount of material passing through a No. 200
42
(0.075 mm) sieve may explain the decrease in VMA. In addition, there is a reduction in
binder absorption when higher binder viscosity is reached, which may lead to decreased
VMA. West et al. (2009) demonstrated similar results (i.e., decreased VMA with
increased RAP).
Other researchers achieved contrary results. Al-Qadi et al. (2009) investigated
the effect of RAP on the volumetric and mechanical properties of HMA. In that study, six
job mix formulas (JMF) were designed with three sources of RAP at 0%, 20%, and 40%.
For two RAP sources, an increased RAP content resulted opposite VMA trends. Daniel
and Lachance (2005) reported increased VMA of mixtures with 25% and 40% RAP
content. The researchers attributed this increase to the blending of the RAP material
with the virgin materials and the pre-heating time for RAP material. In order to achieve
the greatest extent of blending between RAP binder and virgin binder, it is essential to
preheat RAP in an oven for two hours before mixing, a process that simulates plant
operations. If not heated sufficiently, RAP particles tend to act like black rock rather than
breaking down and blending with virgin materials. Insufficient heating also may result in
coarser gradation, as RAP particles have coarser gradation than RAP aggregates.
Conversely, if RAP is overheated, the RAP binder may age more quickly, allowing fewer
RAP particles to break down and blend with virgin material. In this study, VMA was
found to decrease by 0.5% when the heating time increased from 2 to 3.5 hours, and
then increased by almost 3% with a heating time of 8 hours.
2.3 Performance of RAP Mixtures
The aim of designing HMA containing RAP is to optimize RAP content and
achieve a mix with good performance in rutting, fatigue, thermal resistance, and overall
durability, in addition to meeting stability and compatibility requirements. In general,
43
related literature indicates that the stiffness and rutting resistance of a mix at high
temperatures increases with increased RAP content; however, increased stiffness and
brittleness at intermediate and low service temperatures may result in reduced
resistance to fatigue and low-temperature cracking.
2.3.1 Surface Friction Properties
The results of a 2009 survey indicate that average RAP use in base and
intermediate mixes is higher than use in surface mixes. One concern related to RAP
use in surface mixes is its potential effects on friction. To obtain good friction
performance in regions deficient in non-polishing aggregates, RAP is not commonly
recommended in mainline surface courses for high volume roadways.
Kowalski et al. (2010) concluded that, in order to maintain good frictional
properties, the amount of RAP added to surface mixes should not exceed 30%. In this
study, field RAP samples were collected and NCAT oven ignition tests were performed
to determine binder content and aggregate gradation. A mix using highly polishable
coarse limestone was produced and aged in the laboratory to simulate a worst-case
scenario RAP. Materials commonly used for dense-graded asphalt and stone asphalt
matrix mixes for Indiana high volume roads were selected and mixed with various
contents of laboratory produced RAP. Before and during the polishing process, the
texture and friction of the compacted specimens were measured to calculate an
International Friction Index and to evaluate the frictional resistance of the mixes.
2.3.2 Resistance to Rutting
By performing HMA dynamic modulus tests on gyratory compacted specimens
prepared at target 4% air voids, Al-Qadi et al. (2009) found that increased RAP content
caused a mixture to have increased dynamic modulus and a decreased phase angle.
44
The same trend was observed by Swamy et al. (2011). The effect of RAP binder on the
dynamic modulus of a mix is more pronounced at high temperatures (low frequency)
and high RAP percentage. The effects of 20% RAP on the dynamic modulus of a mix
were considered insignificant. Li et al. (10) reported that mixtures with high RAP
percentages tend to have higher dynamic modulus under low frequency or high
temperature testing conditions. Comparing -20˚C to -10˚C, the dynamic modulus data
showed higher variability, which could be explained by the significant effects of machine
compliance, electronic noise in the sensors, and non-uniform contact of the loading
platens causing stress distribution changes at low temperatures.
Many researchers have conducted APA rutting tests to evaluate how RAP
contents affect the rutting potential of a blended mix (Watson, 2008, Kim, 2009, West,
2009, and Drakos, 2005). West et al. (2009) evaluated the rutting potential of surface
mixes with no RAP (control mix), 20% RAP, and 45% RAP after three years of traffic.
Field cores were collected and APA rutting tests were performed. For mixes blended
with the same grade of virgin binder (PG 67-22), the increases in RAP content caused
significant decreases in rutting depth. All specimens with 45% RAP showed rutting
depths of less than 6 mm while four out of the six control specimens showed rutting
depths larger than 10 mm. It was also observed that softer binders reduce the rutting
resistance of blended mixes.
In 2007, the Virginia Department of Transportation began permitting the use of
surface mixtures with higher than 20% RAP content without requiring binder grade
adjustment. Maupin et al. (2009) found no significant difference between higher RAP
mixes (more than 20%) and control mixes (less than 20%) for rutting potential. The

45
results of rut tests performed on beams using APA showed averages of 3.5 mm and 3.6
mm for higher RAP mixes and the control mixes, respectively. As expected, 12.5 mm
mixes had less rutting depth than 9.5 mm mixes with the same amount of RAP, and
mixes blended with PG 70-22 virgin binder showed higher rutting resistance than mixes
with PG 64-22.
Kim et al. (2009) evaluated the rutting performance of SBS polymer-modified
binder with RAP added. Four different percentages of RAP materials (0%, 15%, 25%,
and 35%) were blended with virgin limestone and virgin SBS polymer-modified binder to
form same-gradation mixes. The average rutting depth for all mixtures was
approximately 2 mm, indicating sufficient rutting resistance. No significant difference
was identified between mixtures blended with different proportions of RAP.
In addition to conventional consolidation rutting, instability rutting, which only
exists in the surface layer, can also occur under the traffic wheel path. Drakos et al.
(2005) reported that traditional APA test measures may not be sensitive to instability
rutting resistance of a mixture. The pressurized loading hose of a specimen is generally
considered a line load, as the loading area is very narrow. This loading area fails to
introduce sufficient shear stress, which may be the main cause for instability rutting
(Darkos et al, 2005). By comparing the rut depths of three asphalt mixtures obtained
from APA results to the rutting performance measured with a heavy vehicle simulator,
Sholar (2010) found that APA tests failed to yield comparable results.
2.3.3 Resistance to Fatigue Cracking
Though aged binder from RAP materials increases the rutting resistance of
blended mixtures at high temperature, it also causes an increase in stiffness and
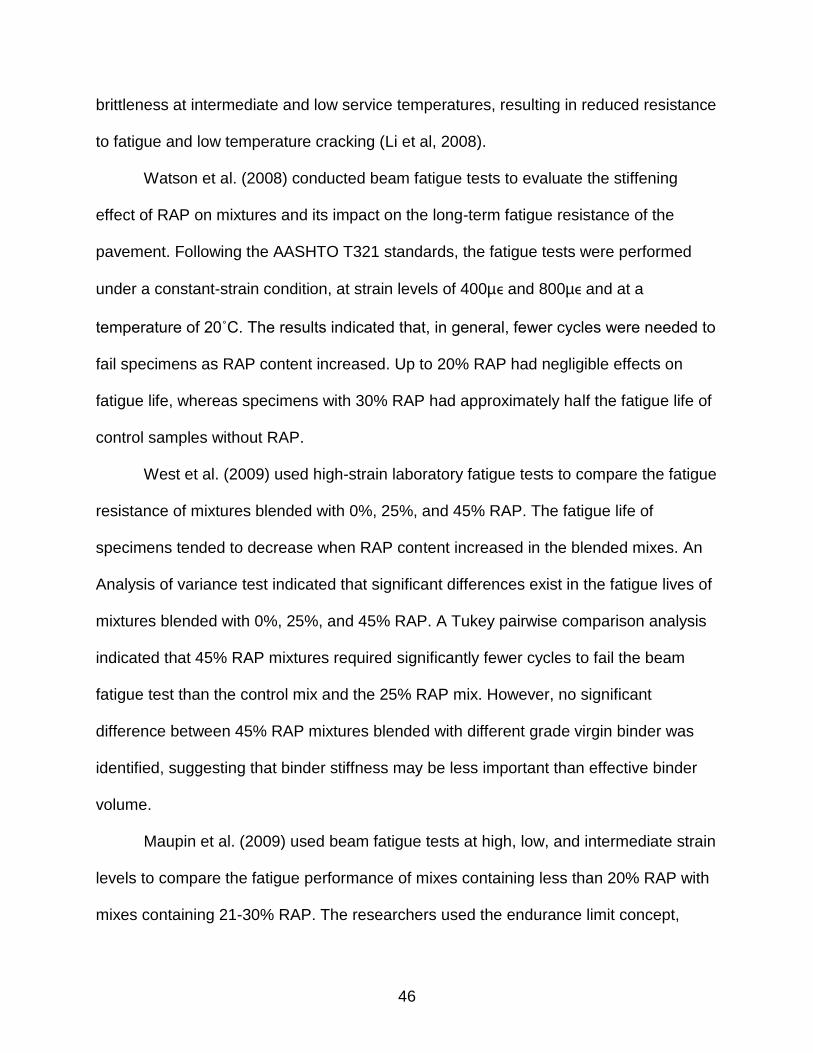
46
brittleness at intermediate and low service temperatures, resulting in reduced resistance
to fatigue and low temperature cracking (Li et al, 2008).
Watson et al. (2008) conducted beam fatigue tests to evaluate the stiffening
effect of RAP on mixtures and its impact on the long-term fatigue resistance of the
pavement. Following the AASHTO T321 standards, the fatigue tests were performed
under a constant-strain condition, at strain levels of 400µϵ and 800µϵ and at a
temperature of 20˚C. The results indicated that, in general, fewer cycles were needed to
fail specimens as RAP content increased. Up to 20% RAP had negligible effects on
fatigue life, whereas specimens with 30% RAP had approximately half the fatigue life of
control samples without RAP.
West et al. (2009) used high-strain laboratory fatigue tests to compare the fatigue
resistance of mixtures blended with 0%, 25%, and 45% RAP. The fatigue life of
specimens tended to decrease when RAP content increased in the blended mixes. An
Analysis of variance test indicated that significant differences exist in the fatigue lives of
mixtures blended with 0%, 25%, and 45% RAP. A Tukey pairwise comparison analysis
indicated that 45% RAP mixtures required significantly fewer cycles to fail the beam
fatigue test than the control mix and the 25% RAP mix. However, no significant
difference between 45% RAP mixtures blended with different grade virgin binder was
identified, suggesting that binder stiffness may be less important than effective binder
volume.
Maupin et al. (2009) used beam fatigue tests at high, low, and intermediate strain
levels to compare the fatigue performance of mixes containing less than 20% RAP with
mixes containing 21-30% RAP. The researchers used the endurance limit concept,
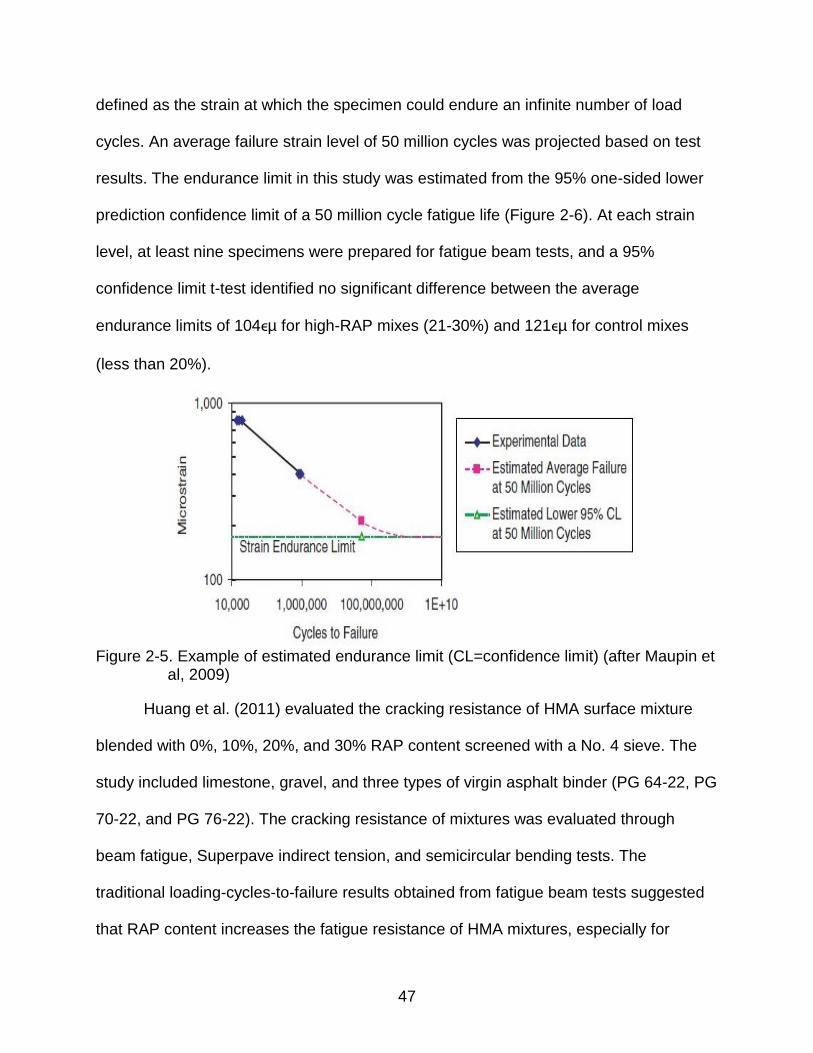
47
defined as the strain at which the specimen could endure an infinite number of load
cycles. An average failure strain level of 50 million cycles was projected based on test
results. The endurance limit in this study was estimated from the 95% one-sided lower
prediction confidence limit of a 50 million cycle fatigue life (Figure 2-6). At each strain
level, at least nine specimens were prepared for fatigue beam tests, and a 95%
confidence limit t-test identified no significant difference between the average
endurance limits of 104ϵµ for high-RAP mixes (21-30%) and 121ϵµ for control mixes
(less than 20%).
Figure 2-5. Example of estimated endurance limit (CL=confidence limit) (after Maupin et
al, 2009)
Huang et al. (2011) evaluated the cracking resistance of HMA surface mixture
blended with 0%, 10%, 20%, and 30% RAP content screened with a No. 4 sieve. The
study included limestone, gravel, and three types of virgin asphalt binder (PG 64-22, PG
70-22, and PG 76-22). The cracking resistance of mixtures was evaluated through
beam fatigue, Superpave indirect tension, and semicircular bending tests. The
traditional loading-cycles-to-failure results obtained from fatigue beam tests suggested
that RAP content increases the fatigue resistance of HMA mixtures, especially for

48
mixtures blended with PG 64-22 virgin asphalt binder. However, when using the ratio of
dissipated energy change approach and based on fatigue beam testing data, increased
RAP content appears to result in higher plateau values, which suggests a decreased
fatigue resistance in blended mixtures. The latter conclusion was confirmed by the
results of indirect tension (IDT) tests, which indicated that increased RAP content
decreased FED and dissipated creep strain energy to failure (DCSEf) of specimens.
Semicircular Bending (SCB) test results indicated that the addition of RAP increased the
tensile strength, but significantly decreased the strain at peak load and toughness
indices, especially when RAP contents are 20% and 30%. It should be noted that the
reduction in cracking resistance is more significant for mixtures blended with
conventional PG 64-22 virgin asphalt binder than for mixtures blended with SBS
polymer-modified asphalt binder. The laboratory study was roughly validated from field
observation, which found that, after four years of service, pavement sections with 30%
RAP had slightly more cracking than mixes with less or no RAP.
Kim et al. (2012) compared the cracking performance of both WM mixtures and
conventional HMA mixtures by using intermediate temperature fracture resistance.
Tensile strength and strain were computed based on IDT strength tests and the
toughness index (TI). The TI describes the toughening characteristics of a mixture in
post-peak stress regions and is computed using the normalized stress-strain curve. The
fracture resistance indicator was either the critical strain energy release rate or the
critical J-integral (Jc) obtained from the SCB test. The results of a paired t-test identified
no significant difference between HMA and WMA in terms of IDT strength and TI
49
values. There was also no significant difference observed for WMA mixtures when RAP
content increased up to 30% in terms of tensile strength and TI.
Watson et al. (2008) concluded that testing temperature has a significant effect
on the fracture energy (FE) measurements when performing SCB tests. Additional RAP
reduces the FE of blended mixtures, a trend more obvious when the testing temperature
ranges from -12 ˚C to -24 ˚C as opposed to testing temperatures ranging from -24 ˚C
to -36 ˚C in which more brittle material property was obtained. Mixtures blended with
20% RAP have similar FE with 0% RAP mixtures, and significant reduction in FE was
observed when RAP content increased to 40%.
2.3.4 Resistance to Low-Temperature Cracking
Behnia et al. (2011) investigated the effects of RAP on the low-temperature
cracking performance of asphalt mixtures. The study evaluated a total of twelve
mixtures using PG 64-22 and PG 58-28 as virgin binder and RAP content blend ranging
from 0% to 50%. Disk-shaped compact tension [DC(T)] tests were performed at -12˚C
to determine the FE of blended asphalt mixtures. In addition, IDT creep tests were
conducted at 0˚C, -10˚C, and -20˚C on HMA specimens containing 20% and 40% RAP.
The study employed the acoustic emissions (AE) technique to capture the transient
elastic mechanical waves from thermal crack formation. Thermal stresses were induced
by subjecting the specimens to a cooling environment (from ambient to -50˚C), and the
embrittlement temperature (TEMB) at which macro cracks propagated was recorded
using AE technique. The results of DC (T) tests indicated that the FE of mixtures using
PG 58-28 as virgin binder decreased with increased RAP content, and a drastic
reduction (59%) in FE was observed when RAP content increased from 10% to 20%.
50
However, for mixtures using PG 64-22 as virgin binder, a threshold of 30% RAP was
identified, as the FE increased initially and then decreased later in the process.
Watson et al. (2008) suggested that it might not be necessary to adjust the virgin
binder grade to achieve desired low-temperature performance when RAP content is
less than 30%. Comparing the FE of 50% RAP mixtures using PG 58-28 as virgin
binder with 0% RAP mixtures using PG 64-22 as virgin binder, the use of softer asphalt
binder compensated for the presence of RAP in terms of FE and cracking performance.
The m-value obtained from IDT tests was found to decrease with the increase of RAP
content, which indicated that 20% RAP mixtures performed better than 40% RAP
mixtures in terms of thermal stress relaxation. A significant difference in TEMB was
observed when comparing mixtures with and without RAP content, but not in mixtures
containing varying percentages of RAP. This observation implies that partial blending
occurs between RAP and virgin materials, as AE tests measure material properties at a
local scale and capture the weakest spot of a composite material system. Stated
differently, RAP suffers damage and incurs fractures before virgin material in a RAP
mixture.
2.3.5 Resistance to Moisture Damage
Maupin et al. (2009) identified no significant difference between mixtures with
high RAP content (21-30%) and control mixtures (0-20% RAP) in terms of resistance to
moisture susceptibility. According to AASHTO T283 Resistance of Compacted
Bituminous Mixture to Moisture Induced Damage, average tensile strength ratio (TSR)
for mixtures with high RAP content is 0.82 and 0.84 for the control mixtures.
Watson et al. (2008) evaluated the moisture susceptibility of SMA mixtures
blended with various RAP contents from 0% to 30% following a version of AASHTO

51
T283 modified by the Georgia Department of Transportation. The tensile strength of
both dry and saturated specimens increased as the percentage of RAP increased;
however, the TSR did not increase significantly with the addition of RAP.
Al-Qadi et al. (2009) confirmed that RAP content increases the tensile strength of
blended mixtures and therefore the resistance to moisture susceptibility. Partial blending
between RAP binder and virgin binder may cause double coating on RAP particles,
which improves the stripping resistance of the particles. However, selective absorption
of binder that creates a bond and improves the stripping resistance does not occur
immediately for virgin aggregate during the mixing process, causing mixtures composed
of virgin material to have weaker stripping resistance. The study found that 40% RAP
mixtures have higher TSR than 0% RAP mixtures, but lower TSR than the 20% RAP
mixtures.
2.4 Closure
While RAP use in asphalt pavement has many economic and environmental
benefits, its use has been limited to certain types of asphalt mixes with limited
percentages. A review of the published literature revealed inconsistent conclusions
regarding the effect of RAP components on blended HMA mixture performance,
especially at high RAP content. RAP use can improve the rutting resistance of a
mixture, but simultaneously raise concerns of blended mixture fatigue and thermal
performance. Some reports indicate that certain percentages of RAP have negligible
effects on mixture fatigue and thermal performance; however, this particular value
varies in different research approaches.
The stiffer nature of aged RAP binder has undeniable effects on blended
mixtures; however, it remains unclear how and to what extent aged RAP binder
52
interacts with virgin asphalt binder. Therefore, it currently is not possible to accurately
predict the performance of mixtures with high RAP content. Long-term performance of
RAP mixtures is especially difficult to predict since other factors will be introduced
during the construction period and service life that may influence the mixtures
endurance.
Material properties and mixture characterizations of RAP materials vary with
each construction projects. The storage technique can also cause the same RAP
materials to vary vastly. The tiered usage concept from the NCHRP 9-12 standards may
improve the longevity and stability of RAP material, but the standards provide only
rough estimates and overly simplistic percentage limits. Although it is important to
establish a comprehensive characterization system for RAP materials, such a tool does
not exist at this time.
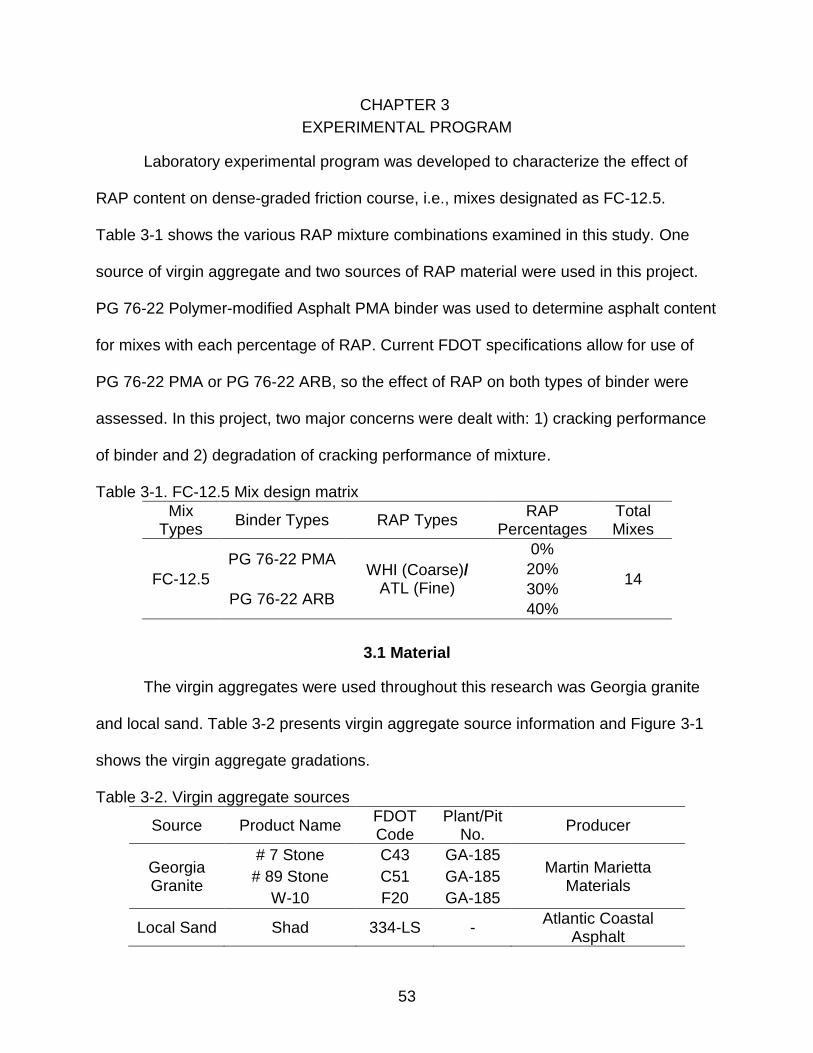
53
CHAPTER 3
EXPERIMENTAL PROGRAM
Laboratory experimental program was developed to characterize the effect of
RAP content on dense-graded friction course, i.e., mixes designated as FC-12.5.
Table 3-1 shows the various RAP mixture combinations examined in this study. One
source of virgin aggregate and two sources of RAP material were used in this project.
PG 76-22 Polymer-modified Asphalt PMA binder was used to determine asphalt content
for mixes with each percentage of RAP. Current FDOT specifications allow for use of
PG 76-22 PMA or PG 76-22 ARB, so the effect of RAP on both types of binder were
assessed. In this project, two major concerns were dealt with: 1) cracking performance
of binder and 2) degradation of cracking performance of mixture.
Table 3-1. FC-12.5 Mix design matrix
Mix Types
Binder Types RAP Types RAP
Percentages Total Mixes
FC-12.5
PG 76-22 PMA WHI (Coarse)/
ATL (Fine)
0%
14 20%
PG 76-22 ARB 30%
40%
3.1 Material
The virgin aggregates were used throughout this research was Georgia granite
and local sand. Table 3-2 presents virgin aggregate source information and Figure 3-1
shows the virgin aggregate gradations.
Table 3-2. Virgin aggregate sources
Source Product Name FDOT Code
Plant/Pit No.
Producer
Georgia Granite
# 7 Stone C43 GA-185 Martin Marietta
Materials # 89 Stone C51 GA-185
W-10 F20 GA-185
Local Sand Shad 334-LS - Atlantic Coastal
Asphalt
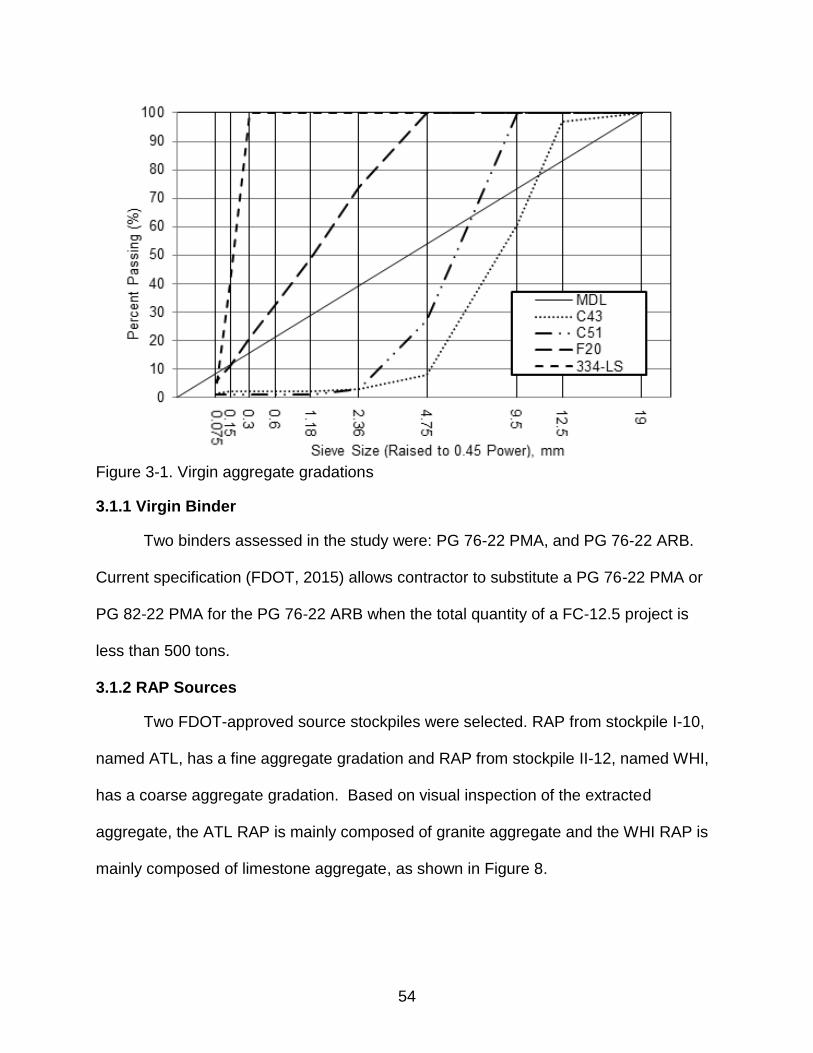
54
Figure 3-1. Virgin aggregate gradations
3.1.1 Virgin Binder
Two binders assessed in the study were: PG 76-22 PMA, and PG 76-22 ARB.
Current specification (FDOT, 2015) allows contractor to substitute a PG 76-22 PMA or
PG 82-22 PMA for the PG 76-22 ARB when the total quantity of a FC-12.5 project is
less than 500 tons.
3.1.2 RAP Sources
Two FDOT-approved source stockpiles were selected. RAP from stockpile I-10,
named ATL, has a fine aggregate gradation and RAP from stockpile II-12, named WHI,
has a coarse aggregate gradation. Based on visual inspection of the extracted
aggregate, the ATL RAP is mainly composed of granite aggregate and the WHI RAP is
mainly composed of limestone aggregate, as shown in Figure 8.
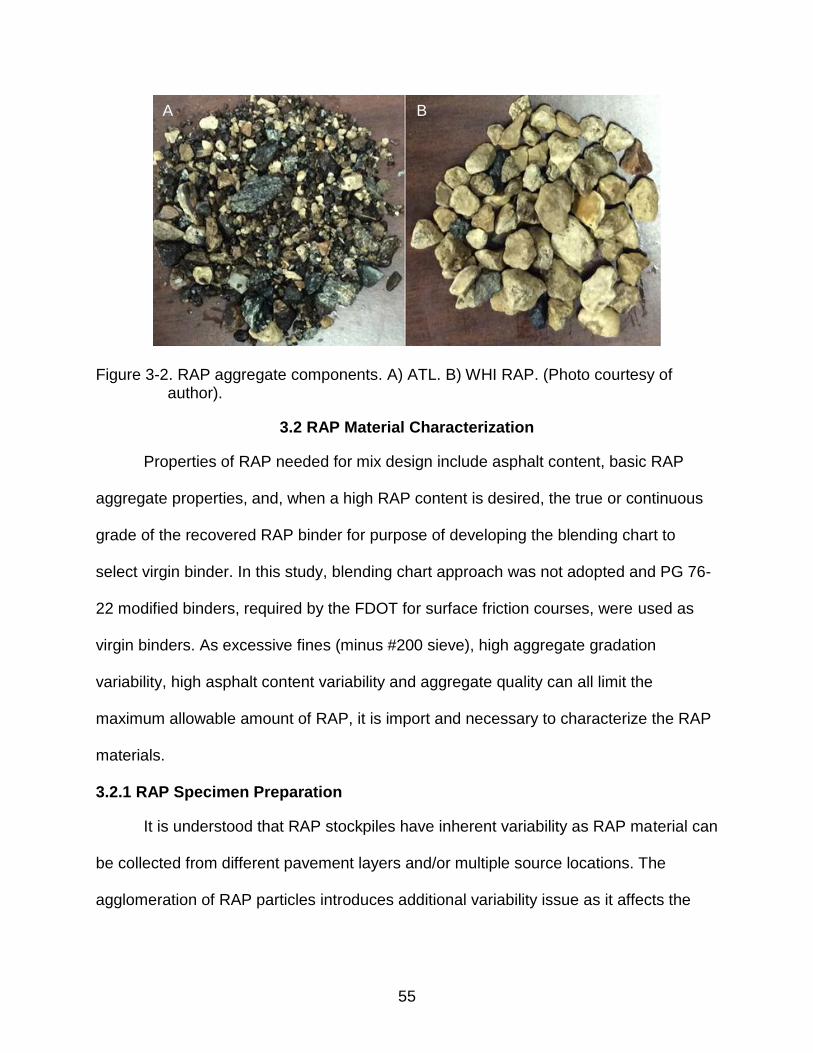
55
Figure 3-2. RAP aggregate components. A) ATL. B) WHI RAP. (Photo courtesy of author).
3.2 RAP Material Characterization
Properties of RAP needed for mix design include asphalt content, basic RAP
aggregate properties, and, when a high RAP content is desired, the true or continuous
grade of the recovered RAP binder for purpose of developing the blending chart to
select virgin binder. In this study, blending chart approach was not adopted and PG 76-
22 modified binders, required by the FDOT for surface friction courses, were used as
virgin binders. As excessive fines (minus #200 sieve), high aggregate gradation
variability, high asphalt content variability and aggregate quality can all limit the
maximum allowable amount of RAP, it is import and necessary to characterize the RAP
materials.
3.2.1 RAP Specimen Preparation
It is understood that RAP stockpiles have inherent variability as RAP material can
be collected from different pavement layers and/or multiple source locations. The
agglomeration of RAP particles introduces additional variability issue as it affects the
A B
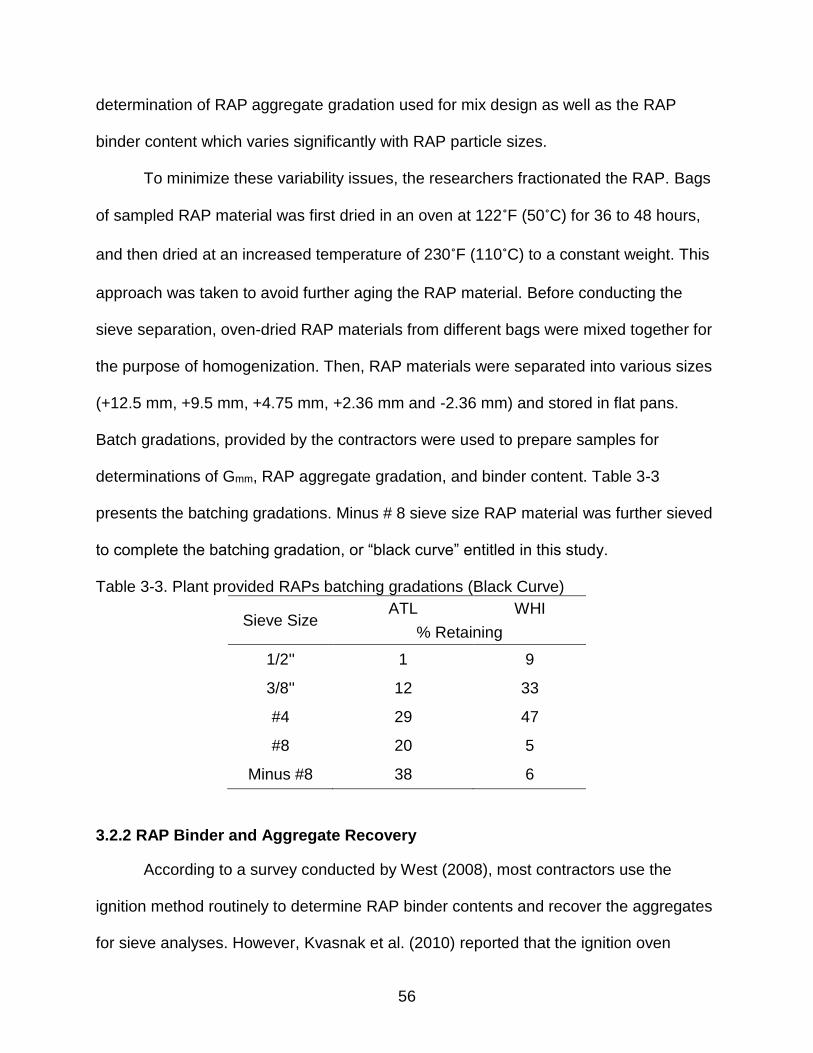
56
determination of RAP aggregate gradation used for mix design as well as the RAP
binder content which varies significantly with RAP particle sizes.
To minimize these variability issues, the researchers fractionated the RAP. Bags
of sampled RAP material was first dried in an oven at 122˚F (50˚C) for 36 to 48 hours,
and then dried at an increased temperature of 230˚F (110˚C) to a constant weight. This
approach was taken to avoid further aging the RAP material. Before conducting the
sieve separation, oven-dried RAP materials from different bags were mixed together for
the purpose of homogenization. Then, RAP materials were separated into various sizes
(+12.5 mm, +9.5 mm, +4.75 mm, +2.36 mm and -2.36 mm) and stored in flat pans.
Batch gradations, provided by the contractors were used to prepare samples for
determinations of Gmm, RAP aggregate gradation, and binder content. Table 3-3
presents the batching gradations. Minus # 8 sieve size RAP material was further sieved
to complete the batching gradation, or “black curve” entitled in this study.
Table 3-3. Plant provided RAPs batching gradations (Black Curve)
Sieve Size ATL WHI
% Retaining
1/2'' 1 9
3/8'' 12 33
#4 29 47
#8 20 5
Minus #8 38 6
3.2.2 RAP Binder and Aggregate Recovery
According to a survey conducted by West (2008), most contractors use the
ignition method routinely to determine RAP binder contents and recover the aggregates
for sieve analyses. However, Kvasnak et al. (2010) reported that the ignition oven

57
method may cause significant changes in specific gravity for some aggregate types,
such as the soft Florida limestone due to the extreme temperatures used in the ignition
method. On the other hand, it is also reported that the solvent extraction methods fail to
remove all of the aged binder from RAP resulting in lower RAP binder contents than
they actually are.
In this study, both solvent extractions and ignition furnace methods were used to
provide more accurate determination of RAP binder contents and RAP aggregate
gradation. Figure 3-3 illustrates the testing plan. For each RAP, four representative
samples of each RAP were tested using both ignition furnace and solvent extraction
methods. Recovered RAP aggregate from both methods was washed, dried and sieved
to obtain the “white curve”, the RAP aggregate gradation for mix design. Detailed data
can be found in Appendix A.
Figure 3-3. RAP binder extraction and recovery
Atlantic
Coast RAP
Whitehurst
RAP
RAP Binder
Recovery
Reflux Method Rotavapor Method Ignition Method
RAP Binder
Extraction
% RAP Binder &
RAP Aggregate
Recovery
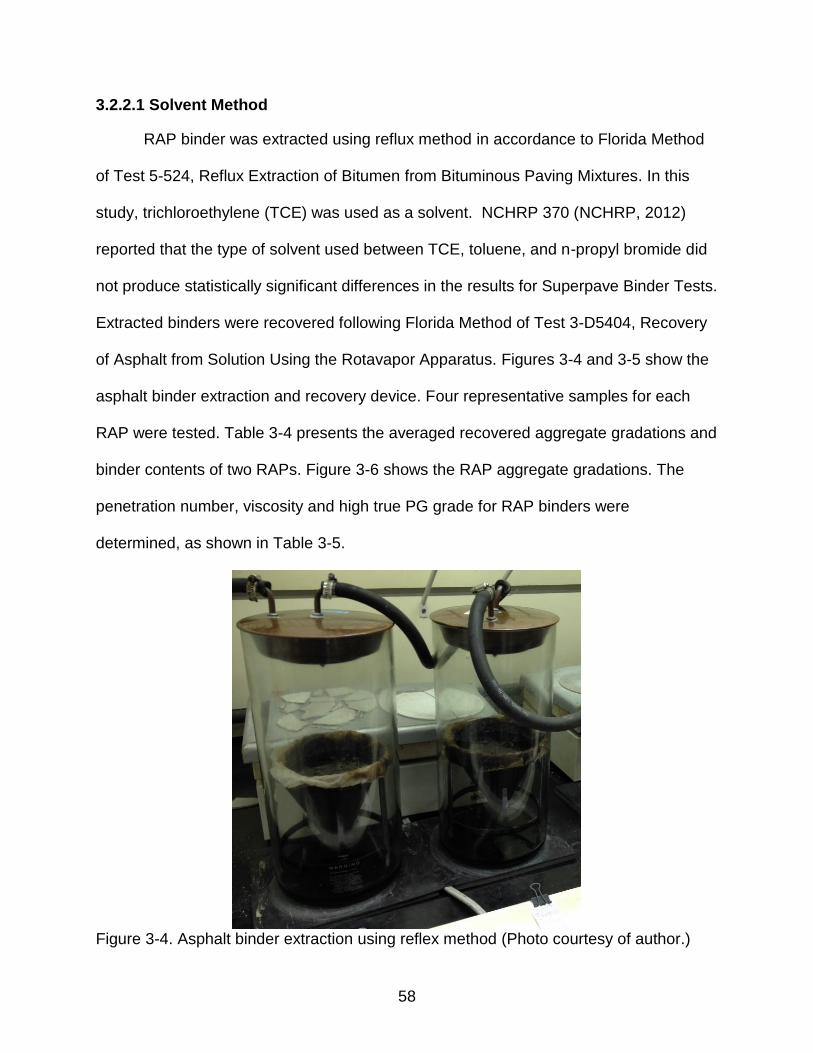
58
3.2.2.1 Solvent Method
RAP binder was extracted using reflux method in accordance to Florida Method
of Test 5-524, Reflux Extraction of Bitumen from Bituminous Paving Mixtures. In this
study, trichloroethylene (TCE) was used as a solvent. NCHRP 370 (NCHRP, 2012)
reported that the type of solvent used between TCE, toluene, and n-propyl bromide did
not produce statistically significant differences in the results for Superpave Binder Tests.
Extracted binders were recovered following Florida Method of Test 3-D5404, Recovery
of Asphalt from Solution Using the Rotavapor Apparatus. Figures 3-4 and 3-5 show the
asphalt binder extraction and recovery device. Four representative samples for each
RAP were tested. Table 3-4 presents the averaged recovered aggregate gradations and
binder contents of two RAPs. Figure 3-6 shows the RAP aggregate gradations. The
penetration number, viscosity and high true PG grade for RAP binders were
determined, as shown in Table 3-5.
Figure 3-4. Asphalt binder extraction using reflex method (Photo courtesy of author.)
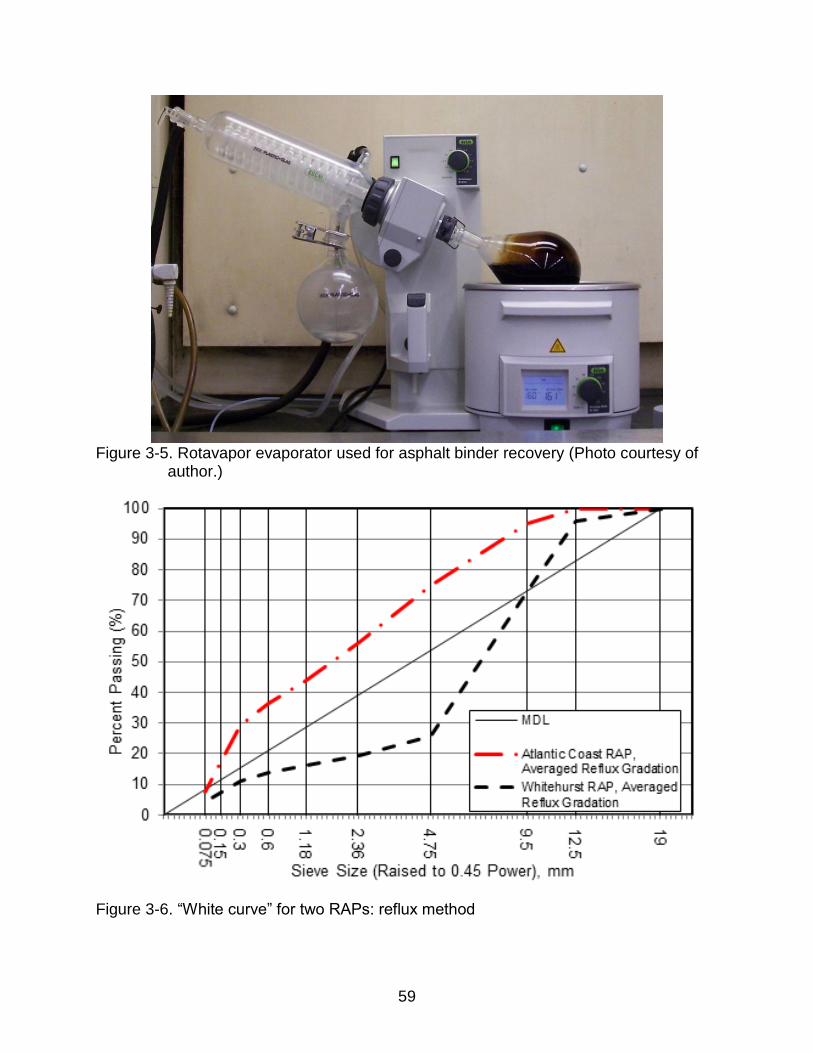
59
Figure 3-5. Rotavapor evaporator used for asphalt binder recovery (Photo courtesy of
author.)
Figure 3-6. “White curve” for two RAPs: reflux method
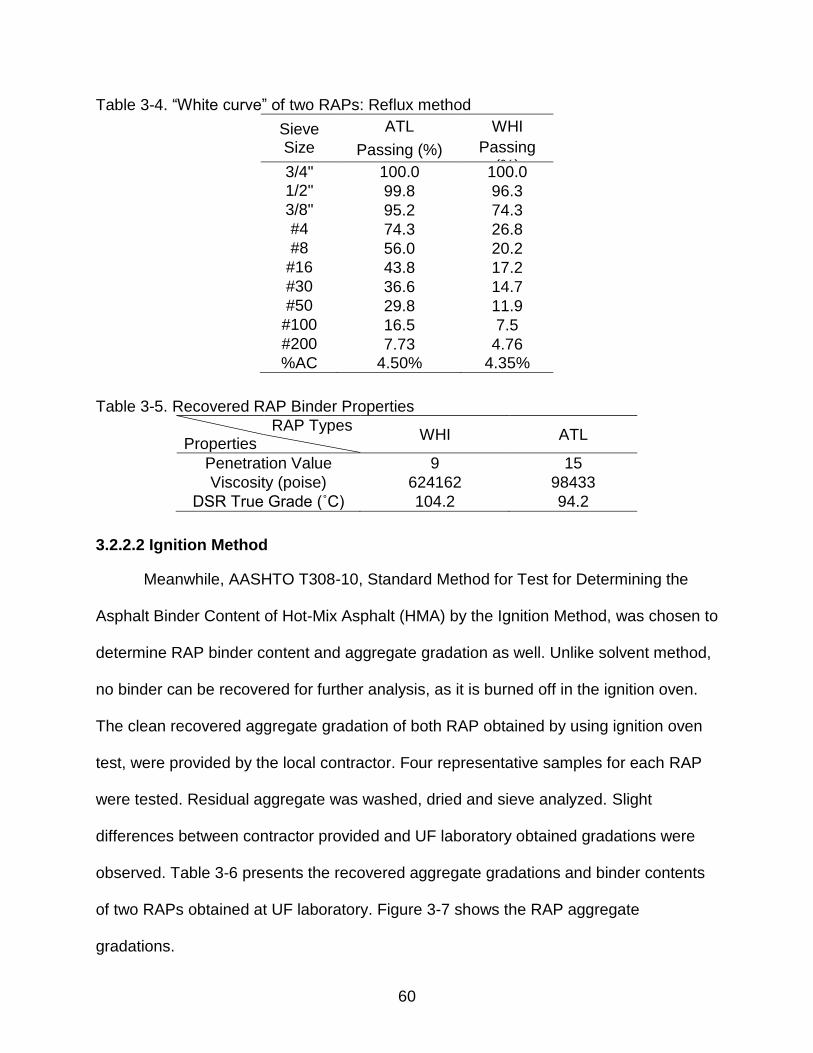
60
Table 3-4. “White curve” of two RAPs: Reflux method
Sieve Size
ATL WHI
Passing (%) Passing (%) 3/4" 100.0 100.0
1/2" 99.8 96.3 3/8" 95.2 74.3 #4 74.3 26.8 #8 56.0 20.2
#16 43.8 17.2 #30 36.6 14.7 #50 29.8 11.9
#100 16.5 7.5
#200 7.73 4.76 %AC 4.50% 4.35%
Table 3-5. Recovered RAP Binder Properties
RAP Types WHI ATL
Properties
Penetration Value 9 15
Viscosity (poise) 624162 98433
DSR True Grade (˚C) 104.2 94.2
3.2.2.2 Ignition Method
Meanwhile, AASHTO T308-10, Standard Method for Test for Determining the
Asphalt Binder Content of Hot-Mix Asphalt (HMA) by the Ignition Method, was chosen to
determine RAP binder content and aggregate gradation as well. Unlike solvent method,
no binder can be recovered for further analysis, as it is burned off in the ignition oven.
The clean recovered aggregate gradation of both RAP obtained by using ignition oven
test, were provided by the local contractor. Four representative samples for each RAP
were tested. Residual aggregate was washed, dried and sieve analyzed. Slight
differences between contractor provided and UF laboratory obtained gradations were
observed. Table 3-6 presents the recovered aggregate gradations and binder contents
of two RAPs obtained at UF laboratory. Figure 3-7 shows the RAP aggregate
gradations.
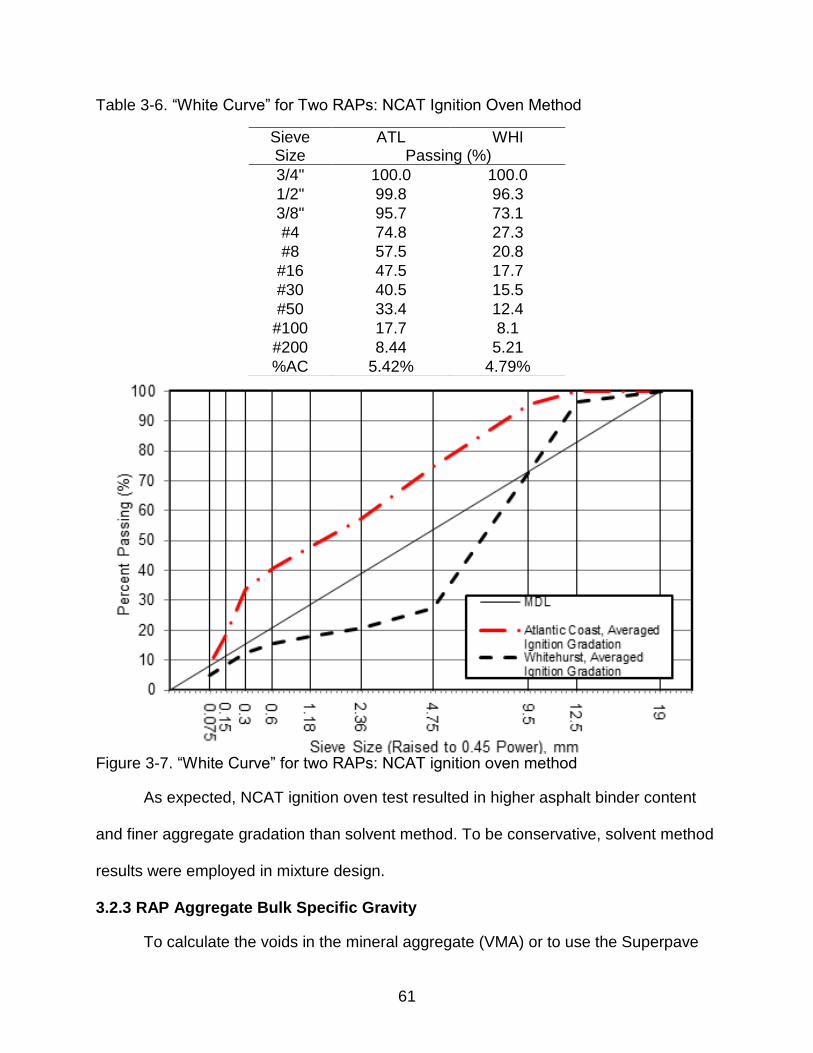
61
Table 3-6. “White Curve” for Two RAPs: NCAT Ignition Oven Method
Sieve Size
ATL WHI Passing (%)
3/4" 100.0 100.0
1/2" 99.8 96.3
3/8" 95.7 73.1
#4 74.8 27.3
#8 57.5 20.8
#16 47.5 17.7
#30 40.5 15.5
#50 33.4 12.4
#100 17.7 8.1
#200 8.44 5.21
%AC 5.42% 4.79%
Figure 3-7. “White Curve” for two RAPs: NCAT ignition oven method
As expected, NCAT ignition oven test resulted in higher asphalt binder content
and finer aggregate gradation than solvent method. To be conservative, solvent method
results were employed in mixture design.
3.2.3 RAP Aggregate Bulk Specific Gravity
To calculate the voids in the mineral aggregate (VMA) or to use the Superpave
62
method for estimating the binder content of a mixture, it is necessary to know the
combined aggregate bulk specific gravity (Gsb). Computing the combined Gsb requires
knowing the Gsb of each aggregate component. However, the RAP binder extraction
process can change the aggregate properties and may also change the amount of fine
material. Generally, there are two approaches to avoid this problem. In the past, many
states used the effective specific gravity (Gse) of the RAP aggregate instead of its Gsb.
The Gse can be calculated from the RAP maximum specific gravity (Gmm), Equation 3-1.
For a given aggregate, Gsb is always smaller than Gse therefore the substitution of Gse
for Gsb will result in overestimating both the combined aggregate Gsb and the VMA. As
the percentage of RAP used increases, the overestimation becomes greater. Later,
some State DOTs applied a reduction factor to minimize this overestimation. For
example, Illinois DOT uses 0.1 as a reduction factor for slag RAP to determine Gsb of
RAP aggregate, Equation 3-2. The second approach is to assume a value for the
asphalt absorption of the RAP aggregate based on past experience with the same virgin
aggregates. Once the asphalt absorption and Gse of RAP aggregate are determined, the
Gsb can be calculated by using Equation 3-3. To estimate the asphalt absorption
accurately, FDOT specifies the RAP aggregate for visual inspection should be
recovered using the solvent method, which prevents any discoloring of the aggregate
that would occur with ignition oven method.
(3-1)
Where, Gse= effective specific gravity of RAP aggregate, Gmm= theoretical
maximum specific gravity of RAP, Pb= RAP binder content, Gb= specific gravity of RAP
binder.
Gse =100 − Pb(RAP )
100Gmm (RAP )
−Pb(RAP )
Gb
63
(3-2)
Where, Gsb= bulk specific gravity of RAP aggregate, Gse= effective specific
gravity of the RAP aggregate
(3-3)
Where, Pba= absorbed binder, percent by mass of RAP aggregate, and others
are the same as previous defined.
In this study, the Gsb of RAP aggregate was calculated based on the measured
RAP Gmm results and assumed asphalt absorption values, Equation 3-3.
3.3 Cracking Performance of RAP Binder Blends
A key concern associated with use of additional RAP in friction course is that the
resulting binder may be significantly lower quality than the modified binders (asphalt
rubber or polymer) typically specified for use in the friction courses. RAP binder was
extracted and recovered in bulk using solvent method. A total number of 14 different
binders composed of two different virgin binders, two recovered RAP binders and four
different proportions of virgin and RAP binder, were evaluated. Note the final relative
percentage of binder to be blended may not correspond exactly to the relative
percentage of RAP and virgin aggregate, because slight adjustments in asphalt content
may be required for mixtures with different RAP contents.
3.3.1 Conventional Binder Tests
The Superpave binder testing methodologies, including Brookfield viscosity (BV),
DSR and BBR, were conducted to evaluate the resulting binder characteristics of
blended binders. However, it is well known that there is no existing binder test or
parameter that reliably predicts cracking performance. The cracking performance of
Gsb = Gse − 0.1
Gsb =Gse
Pba × Gse
100 × Gb+ 1
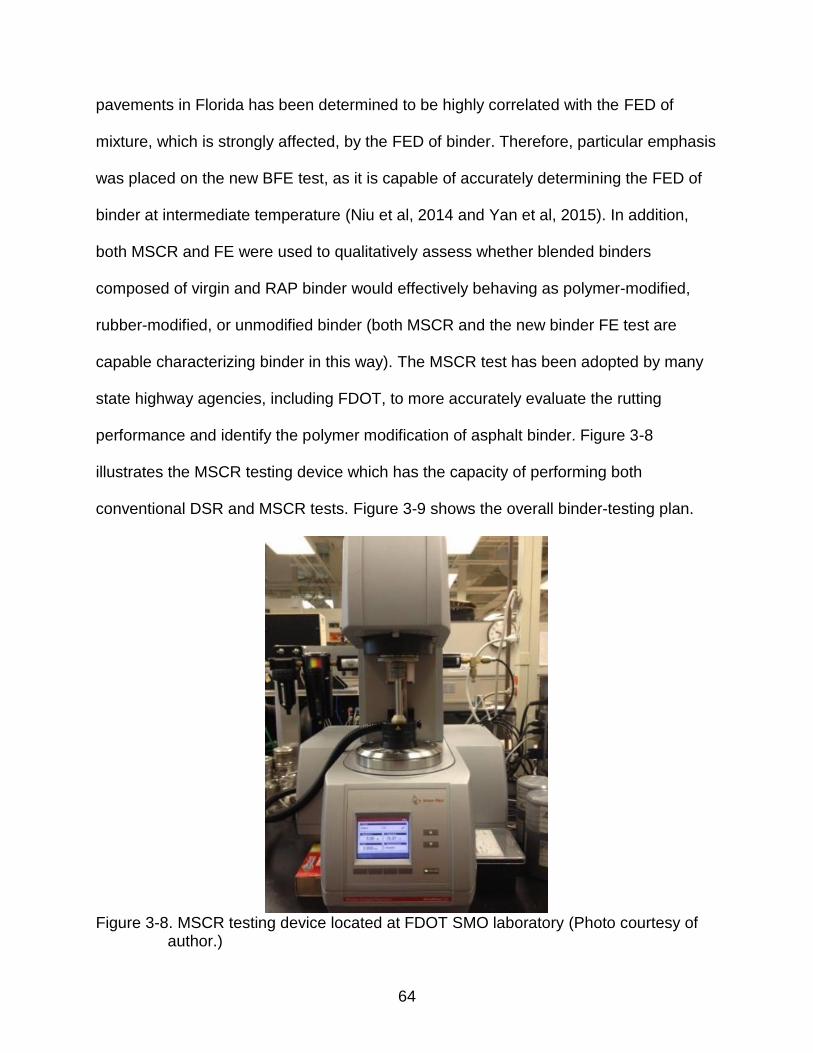
64
pavements in Florida has been determined to be highly correlated with the FED of
mixture, which is strongly affected, by the FED of binder. Therefore, particular emphasis
was placed on the new BFE test, as it is capable of accurately determining the FED of
binder at intermediate temperature (Niu et al, 2014 and Yan et al, 2015). In addition,
both MSCR and FE were used to qualitatively assess whether blended binders
composed of virgin and RAP binder would effectively behaving as polymer-modified,
rubber-modified, or unmodified binder (both MSCR and the new binder FE test are
capable characterizing binder in this way). The MSCR test has been adopted by many
state highway agencies, including FDOT, to more accurately evaluate the rutting
performance and identify the polymer modification of asphalt binder. Figure 3-8
illustrates the MSCR testing device which has the capacity of performing both
conventional DSR and MSCR tests. Figure 3-9 shows the overall binder-testing plan.
Figure 3-8. MSCR testing device located at FDOT SMO laboratory (Photo courtesy of
author.)
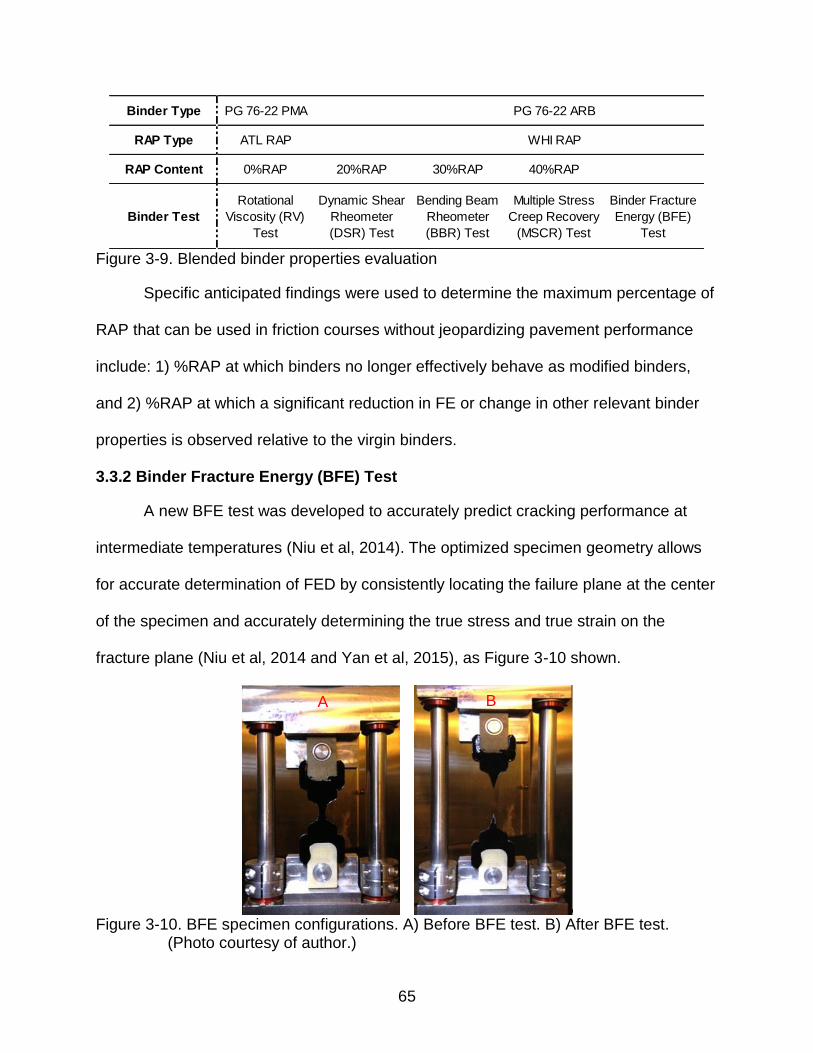
65
Figure 3-9. Blended binder properties evaluation
Specific anticipated findings were used to determine the maximum percentage of
RAP that can be used in friction courses without jeopardizing pavement performance
include: 1) %RAP at which binders no longer effectively behave as modified binders,
and 2) %RAP at which a significant reduction in FE or change in other relevant binder
properties is observed relative to the virgin binders.
3.3.2 Binder Fracture Energy (BFE) Test
A new BFE test was developed to accurately predict cracking performance at
intermediate temperatures (Niu et al, 2014). The optimized specimen geometry allows
for accurate determination of FED by consistently locating the failure plane at the center
of the specimen and accurately determining the true stress and true strain on the
fracture plane (Niu et al, 2014 and Yan et al, 2015), as Figure 3-10 shown.
Figure 3-10. BFE specimen configurations. A) Before BFE test. B) After BFE test.
(Photo courtesy of author.)
Binder Type PG 76-22 PMA PG 76-22 ARB
RAP Type ATL RAP WHI RAP
RAP Content 0%RAP 20%RAP 30%RAP 40%RAP
Binder Test
Rotational
Viscosity (RV)
Test
Dynamic Shear
Rheometer
(DSR) Test
Bending Beam
Rheometer
(BBR) Test
Multiple Stress
Creep Recovery
(MSCR) Test
Binder Fracture
Energy (BFE)
Test
A B
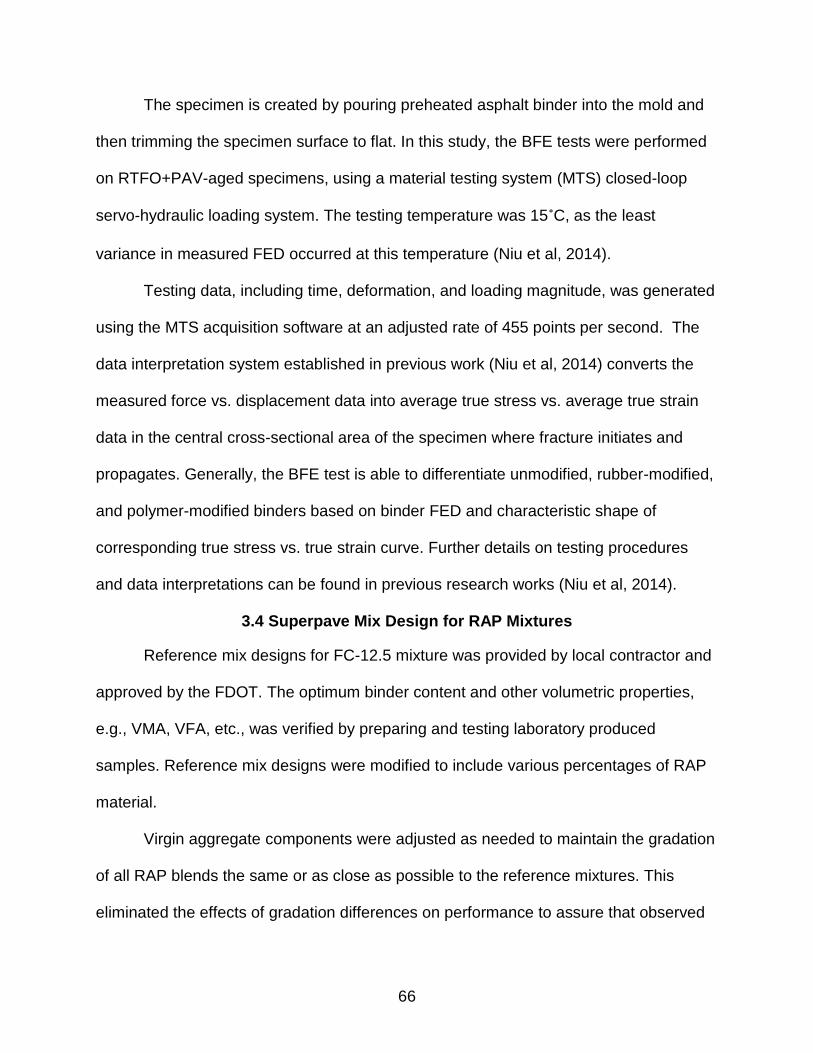
66
The specimen is created by pouring preheated asphalt binder into the mold and
then trimming the specimen surface to flat. In this study, the BFE tests were performed
on RTFO+PAV-aged specimens, using a material testing system (MTS) closed-loop
servo-hydraulic loading system. The testing temperature was 15˚C, as the least
variance in measured FED occurred at this temperature (Niu et al, 2014).
Testing data, including time, deformation, and loading magnitude, was generated
using the MTS acquisition software at an adjusted rate of 455 points per second. The
data interpretation system established in previous work (Niu et al, 2014) converts the
measured force vs. displacement data into average true stress vs. average true strain
data in the central cross-sectional area of the specimen where fracture initiates and
propagates. Generally, the BFE test is able to differentiate unmodified, rubber-modified,
and polymer-modified binders based on binder FED and characteristic shape of
corresponding true stress vs. true strain curve. Further details on testing procedures
and data interpretations can be found in previous research works (Niu et al, 2014).
3.4 Superpave Mix Design for RAP Mixtures
Reference mix designs for FC-12.5 mixture was provided by local contractor and
approved by the FDOT. The optimum binder content and other volumetric properties,
e.g., VMA, VFA, etc., was verified by preparing and testing laboratory produced
samples. Reference mix designs were modified to include various percentages of RAP
material.
Virgin aggregate components were adjusted as needed to maintain the gradation
of all RAP blends the same or as close as possible to the reference mixtures. This
eliminated the effects of gradation differences on performance to assure that observed
67
differences are in fact associated with the difference in RAP content and not in
differences in gradation between mixtures having different RAP contents.
Determination of asphalt content for each percentage of RAP was based on
results of Superpave Gyratory compaction (SGC) of mixture produced with the
combined virgin and RAP aggregate. The asphalt content was determined as that
resulting in 4% air voids at Ndesign. For FC-12.5 mixes, PG 76-22 PMA was used for mix
design and same optimum binder content was adopted for mixes with PG 76-22 ARB
binder. Current FDOT practice for RAP mixtures assumes 100% working binder,
therefore any change in asphalt content was achieved by changing the amount of virgin
binder, as the amount of RAP binder was fixed once the RAP content was fixed.
Detailed information regarding the mixture design is described herein.
3.4.1 FC-12.5: Reference and Low RAP Content Mixtures
During the literature review, it is identified that a level of 20% RAP is
well-accepted as the threshold below which no change in binder selection is required.
Meanwhile, current specification (FDOT, 2015) specifies a maximum amount of 20%
RAP by aggregate weight for FC-12.5 with an exception that higher percentage of RAP
can be used only when less than 20% by weight of total asphalt binder is contributed by
the RAP material. Therefore, preliminary study for FC-12.5 evaluation included a
reference mixture (0% RAP) and a blended mixture with 20% RAP.
The DASR-IC model developed by researchers at the University of Florida (UF)
(Kim et al., 2006, Guarin, 2009, Roque et al., 2011) provides a framework of gradation-
based parameters and associated criteria to link gradation characteristics and
volumetric properties to aggregate structure, mixture properties, and field performance.
These parameters include DASR porosity, disruption factor (DF), effective film thickness
68
(EFT), and fine aggregate ratio (FAR). Primary interlocking of coarse aggregate is
characterized by DASR porosity and DF, which have been used to establish
performance-based criteria based on extensive field rutting data. Two other parameters,
EFT and FAR, were identified to characterize the interstitial component, which recently
have been used by Roque et al. (2015) to evaluate cracking resistance. In this section,
the DASR-IC evaluation was conducted to ensure all mixtures were not deficient in
some aspects of their gradation characteristics, such that the effects of the deficiency
may overwhelm or mask the effects of the RAP. Tables 3-7 and 3-8 present the
Superpave volumetric parameters and the DASR-IC parameters for FC-12.5 reference
mixture. Table 3-9 presents the aggregate usage for the reference mixture and 20%
RAP mixtures (two RAPs). The particle size distribution for three mixtures is shown in
Figure 3-11.
Table 3-7. Superpave volumetric parameters: FC-12.5 reference mixture
Pb (%) Va (%) VMA (%) VFA (%)
5.2 4.1 15.0 73
Table 3-8. DASR-IC parameters: FC-12.5 reference mixture and RAP mixtures
RAP Mixtures DASR
Porosity DF EFT FAR
Reference Mixture
42.7 0.69
23
0.36
20% ATL RAP Mixture 22
30% ATL RAP Mixture 21
40% ATL RAP Mixture 20
20% WHI RAP Mixture 25
30% WHI RAP Mixture 25
40% WHI RAP Mixture 23
DASR-IC criterions 38-48 0.50-0.95 12.5-25 0.28-0.36

69
Table 3-9. Aggregate usage for reference and 20% RAP blended mixtures
Aggregates ATL RAP
WHI RAP
C43 C51 F20 334-LS
Mixtures
Reference Mixture 0% 0% 25% 10% 60% 5%
20% ATL RAP Mixture 20% 0% 20% 5% 53% 2%
20% WHI RAP Mixture 0% 20% 11% 2% 63% 4%
Figure 3-11. Reference and 20% RAP blended aggregate gradation
3.4.2 FC-12.5: High RAP Content Mixtures
Two tentative percentage of RAP content were evaluated in this stage of study,
including 30% and 40% or higher. Table 3-10 shows the aggregate usage for 30% and
40% RAP mixtures. Figure 3-12 and 3-13 illustrate the blended gradations of high RAP
mixtures. All RAP mixtures had identical blended aggregate gradations except for 40%
RAP mixture between which and the reference mixture slight difference exists.
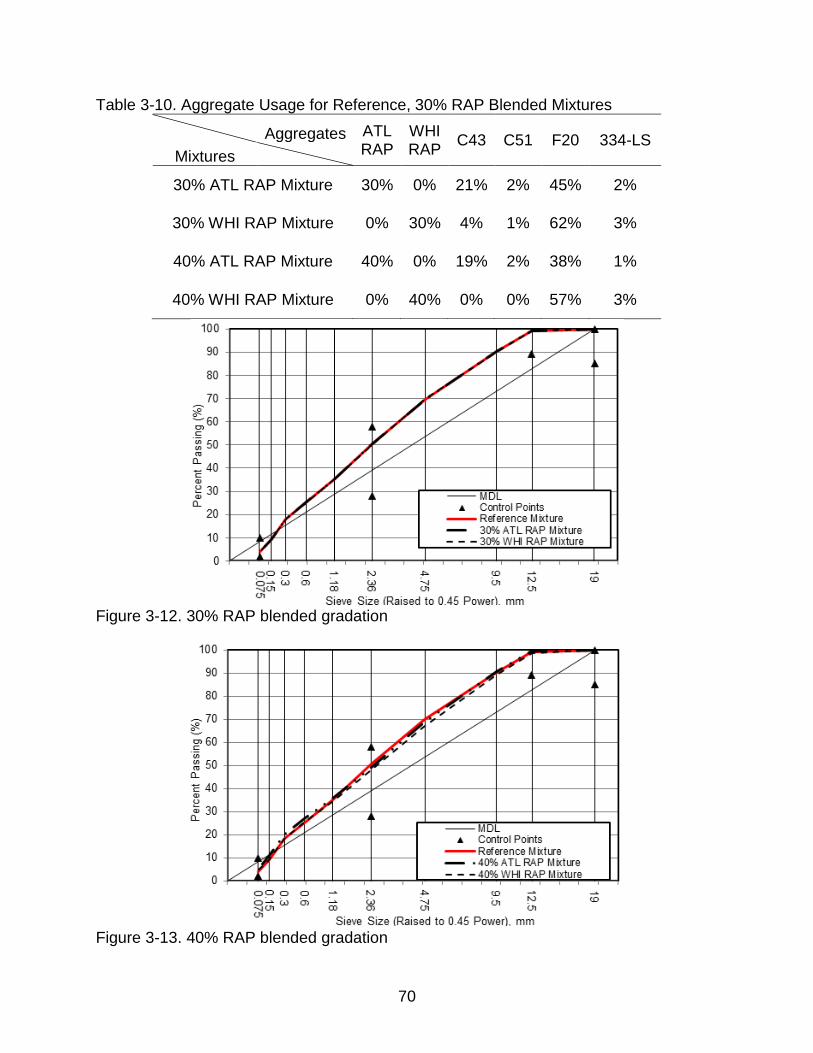
70
Table 3-10. Aggregate Usage for Reference, 30% RAP Blended Mixtures
Aggregates ATL RAP
WHI RAP
C43 C51 F20 334-LS Mixtures
30% ATL RAP Mixture 30% 0% 21% 2% 45% 2%
30% WHI RAP Mixture 0% 30% 4% 1% 62% 3%
40% ATL RAP Mixture 40% 0% 19% 2% 38% 1%
40% WHI RAP Mixture 0% 40% 0% 0% 57% 3%
Figure 3-12. 30% RAP blended gradation
Figure 3-13. 40% RAP blended gradation
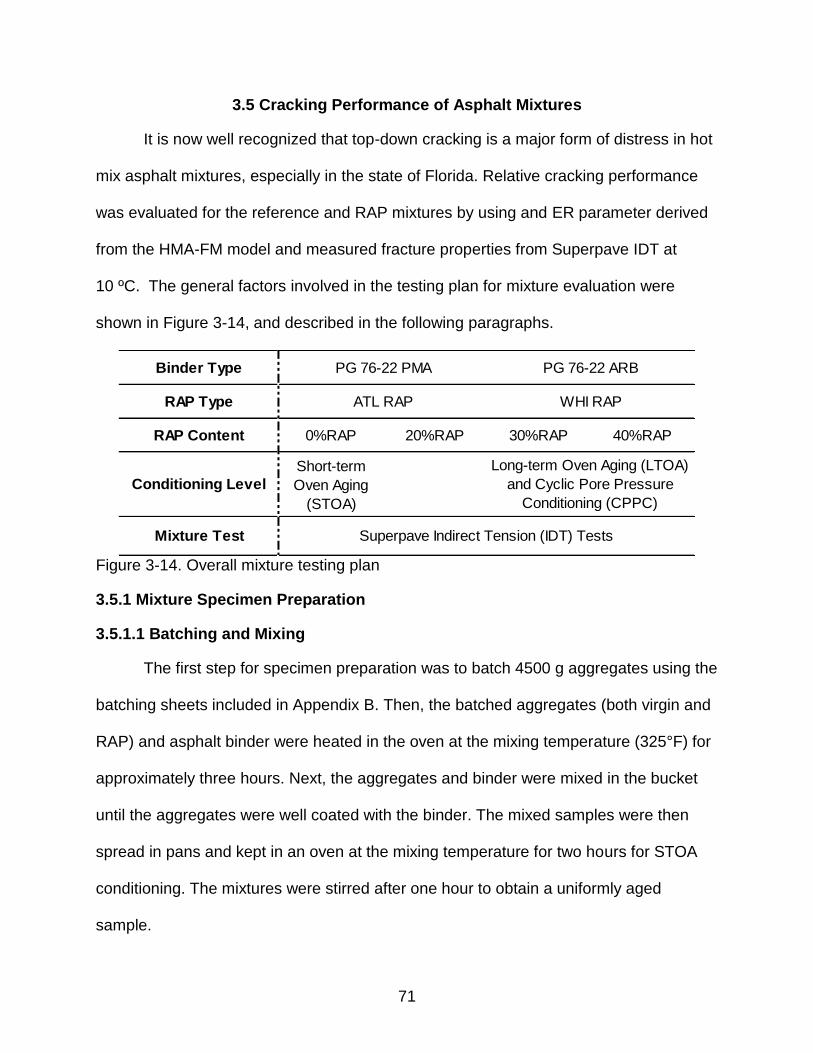
71
3.5 Cracking Performance of Asphalt Mixtures
It is now well recognized that top-down cracking is a major form of distress in hot
mix asphalt mixtures, especially in the state of Florida. Relative cracking performance
was evaluated for the reference and RAP mixtures by using and ER parameter derived
from the HMA-FM model and measured fracture properties from Superpave IDT at
10 ºC. The general factors involved in the testing plan for mixture evaluation were
shown in Figure 3-14, and described in the following paragraphs.
Figure 3-14. Overall mixture testing plan
3.5.1 Mixture Specimen Preparation
3.5.1.1 Batching and Mixing
The first step for specimen preparation was to batch 4500 g aggregates using the
batching sheets included in Appendix B. Then, the batched aggregates (both virgin and
RAP) and asphalt binder were heated in the oven at the mixing temperature (325°F) for
approximately three hours. Next, the aggregates and binder were mixed in the bucket
until the aggregates were well coated with the binder. The mixed samples were then
spread in pans and kept in an oven at the mixing temperature for two hours for STOA
conditioning. The mixtures were stirred after one hour to obtain a uniformly aged
sample.
Binder Type
RAP Type
RAP Content 0%RAP 20%RAP 30%RAP 40%RAP
Conditioning Level
Short-term
Oven Aging
(STOA)
Mixture Test
PG 76-22 PMA PG 76-22 ARB
ATL RAP WHI RAP
Long-term Oven Aging (LTOA)
and Cyclic Pore Pressure
Conditioning (CPPC)
Superpave Indirect Tension (IDT) Tests

72
3.6.1.2 Compaction
After the STOA conditioning procedure, the mixed samples were compacted
using the Superpave Gyratory Compactor (SGC) with a compaction stress of 600 kPa
and a gyratory angle of 1.25° at the mixing temperature. Even though the mixtures were
designed to have a 4% air void content at Ndesign, the gyratory pills were compacted in
the SGC to obtain a 7% air void content at the proper number of gyrations, which
simulates the initial air voids (and density) typically achieved in the field. After letting the
gyratory pills cool down at the room temperature, the bulk specific gravity (Gmb) of each
pill was measured in accordance with AASHTO T166 procedure to determine the
percent air voids. The target air void content of the gyratory pill was approximately 7.8
% because the air void content of the specimens after slicing (described subsequently)
is approximately 0.5–1.0 % lower as compared to that of the pills.
3.6.1.3 RAP mixture gradation and asphalt binder content verification
Due to the inherent variability of RAP materials and uncertainty of RAP
aggregate true gradation, it is considerable to check actual blend gradation against the
design blend, especially for high RAP content mixtures. Before conducting any
conditioning and performance evaluating tests, one SGC specimen for each RAP
mixture was randomly selected and burned in the ignition oven to reclaim the aggregate
and to verify the asphalt binder content. Figure 3-15 shows the recovered aggregate
gradation for various RAP mixtures and Table 3-11 presents the actual binder content
and NCAT ignition oven reported results.
As expected, finer gradations of the recovered aggregate were obtained after the
ignition oven test. Both ATL RAP mixtures and WHI RAP mixtures had identical
recovered gradations and they were all slightly finer than the recovered reference

73
mixture gradation. One potential explanation could be the breakup of RAP (limestone)
aggregate during the ignition oven test. Clear difference between the actual and
measured asphalt content was observed for WHI RAP mixtures, indicating the potential
loss of burned aggregate.
Figure 3-15. Ignition oven test results of RAP mixtures
Table 3-11. Asphalt content of randomly selected SGC specimens
NCAT Ignition Results Actual Asphalt Content
Calibrated Asphalt Content (NCAT Ignition Oven)
FC-12.5 Virgin Mixture 5.50% 5.46%
20% ATL RAP MIXTURE 5.20% 5.35%
30% ATL RAP MIXTURE 6.00% 5.98%
40% ATL RAP MIXTURE 4.90% 4.85%
20% WHI RAP MIXTURE 6.50% 6.72%
30% WHI RAP MIXTURE 6.00% 6.30%
40% WHI RAP MIXTURE 5.80% 5.97%
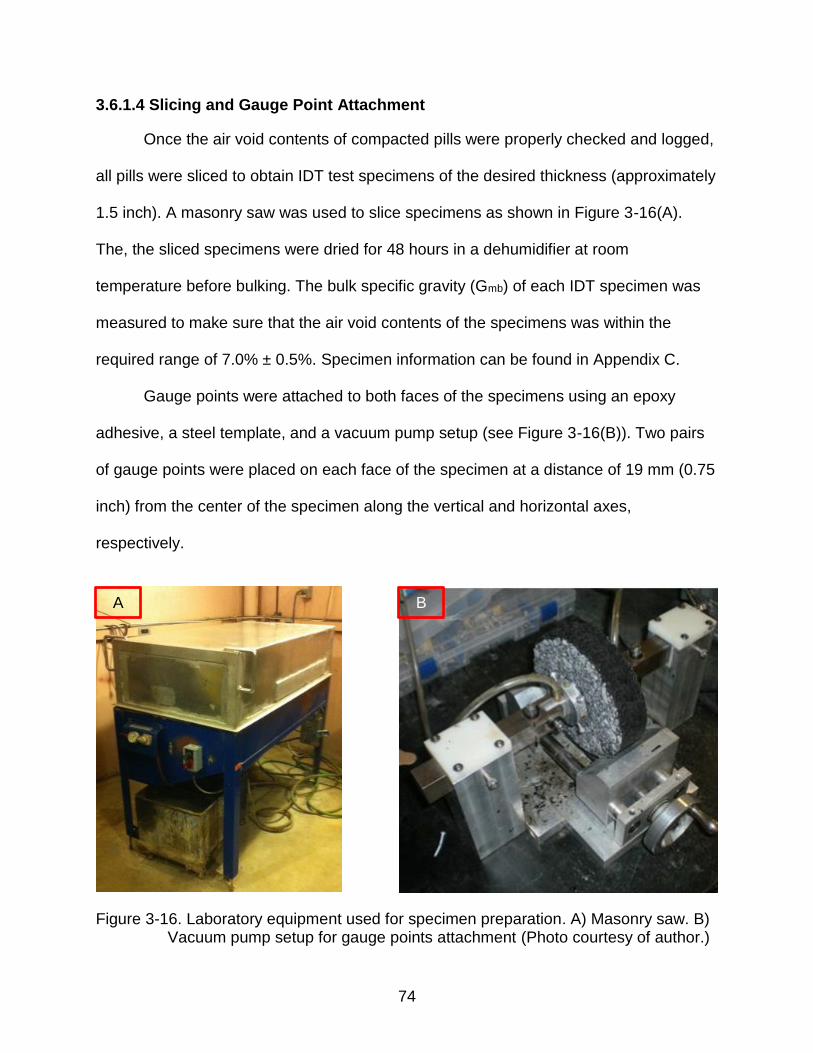
74
3.6.1.4 Slicing and Gauge Point Attachment
Once the air void contents of compacted pills were properly checked and logged,
all pills were sliced to obtain IDT test specimens of the desired thickness (approximately
1.5 inch). A masonry saw was used to slice specimens as shown in Figure 3-16(A).
The, the sliced specimens were dried for 48 hours in a dehumidifier at room
temperature before bulking. The bulk specific gravity (Gmb) of each IDT specimen was
measured to make sure that the air void contents of the specimens was within the
required range of 7.0% ± 0.5%. Specimen information can be found in Appendix C.
Gauge points were attached to both faces of the specimens using an epoxy
adhesive, a steel template, and a vacuum pump setup (see Figure 3-16(B)). Two pairs
of gauge points were placed on each face of the specimen at a distance of 19 mm (0.75
inch) from the center of the specimen along the vertical and horizontal axes,
respectively.
Figure 3-16. Laboratory equipment used for specimen preparation. A) Masonry saw. B) Vacuum pump setup for gauge points attachment (Photo courtesy of author.)
A B

75
3.5.2 Mixture Aging Conditionings
Mixtures were tested in both unconditioned (STOA only) and conditioned states.
The conditioned state corresponds to the new conditioning procedure developed as part
of a recently completed FDOT research effort (Roque et al, 2013), which involves heat
oxidation conditioning (HOC: STOA followed by LTOA) followed by moisture damage
(CPPC). This approach was determined to most effectively represent the long-term
effects of temperature, moisture and traffic on changes in fracture properties of mixture
in the field.
3.5.2.1 Long-Term Oven Aging (LTOA) Conditioning
To better simulate the effect of heat oxidation, after the STOA, specimens were
subjected to LTOA, which involves heating a compacted specimen in a forced-draft
oven at 185±5˚F for 5 days. To prevent the falling apart of smaller aggregate particles
during the LTOA process, a wire mesh with openings of 0.125 inch and steel band
clamps are used to contain the specimens. Great care is necessary to avoid applying
too much pressure when attaching the band clamps. The specimens are placed on
porous metal plates and then placed into the oven, as Figure 3-17 shows.
Figure 3-17. Specimens setup for LTOA conditioning (Photo courtesy of author.)
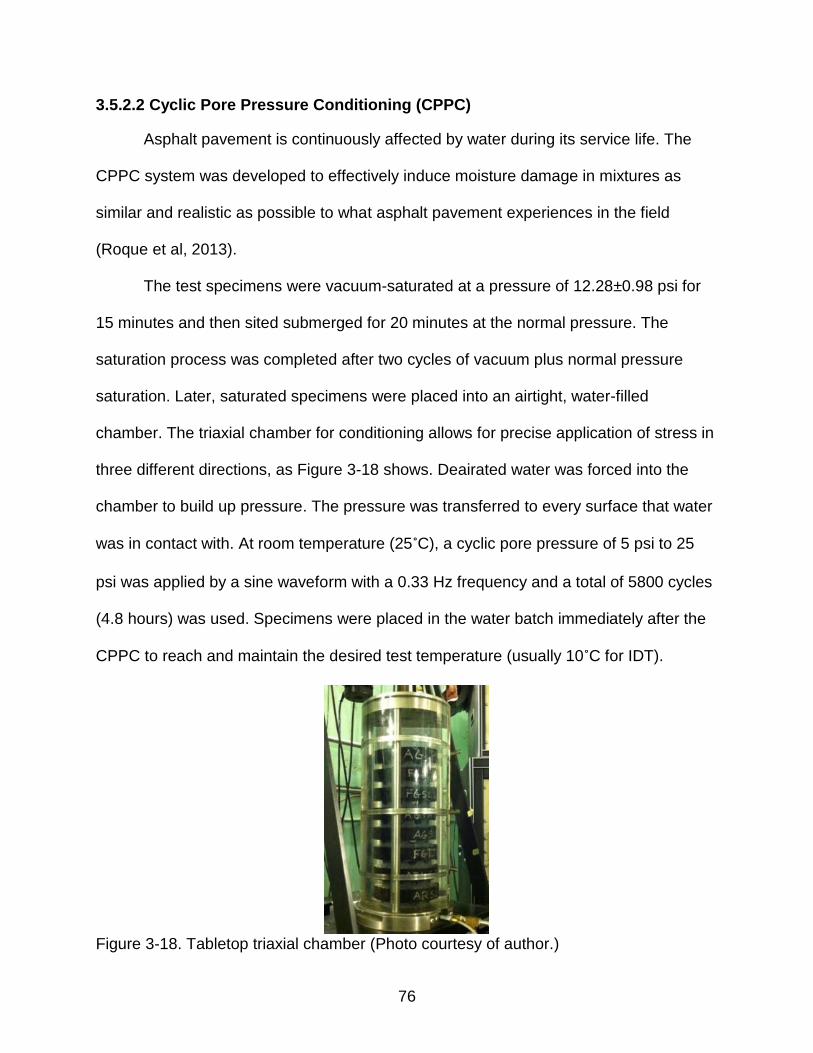
76
3.5.2.2 Cyclic Pore Pressure Conditioning (CPPC)
Asphalt pavement is continuously affected by water during its service life. The
CPPC system was developed to effectively induce moisture damage in mixtures as
similar and realistic as possible to what asphalt pavement experiences in the field
(Roque et al, 2013).
The test specimens were vacuum-saturated at a pressure of 12.28±0.98 psi for
15 minutes and then sited submerged for 20 minutes at the normal pressure. The
saturation process was completed after two cycles of vacuum plus normal pressure
saturation. Later, saturated specimens were placed into an airtight, water-filled
chamber. The triaxial chamber for conditioning allows for precise application of stress in
three different directions, as Figure 3-18 shows. Deairated water was forced into the
chamber to build up pressure. The pressure was transferred to every surface that water
was in contact with. At room temperature (25˚C), a cyclic pore pressure of 5 psi to 25
psi was applied by a sine waveform with a 0.33 Hz frequency and a total of 5800 cycles
(4.8 hours) was used. Specimens were placed in the water batch immediately after the
CPPC to reach and maintain the desired test temperature (usually 10˚C for IDT).
Figure 3-18. Tabletop triaxial chamber (Photo courtesy of author.)
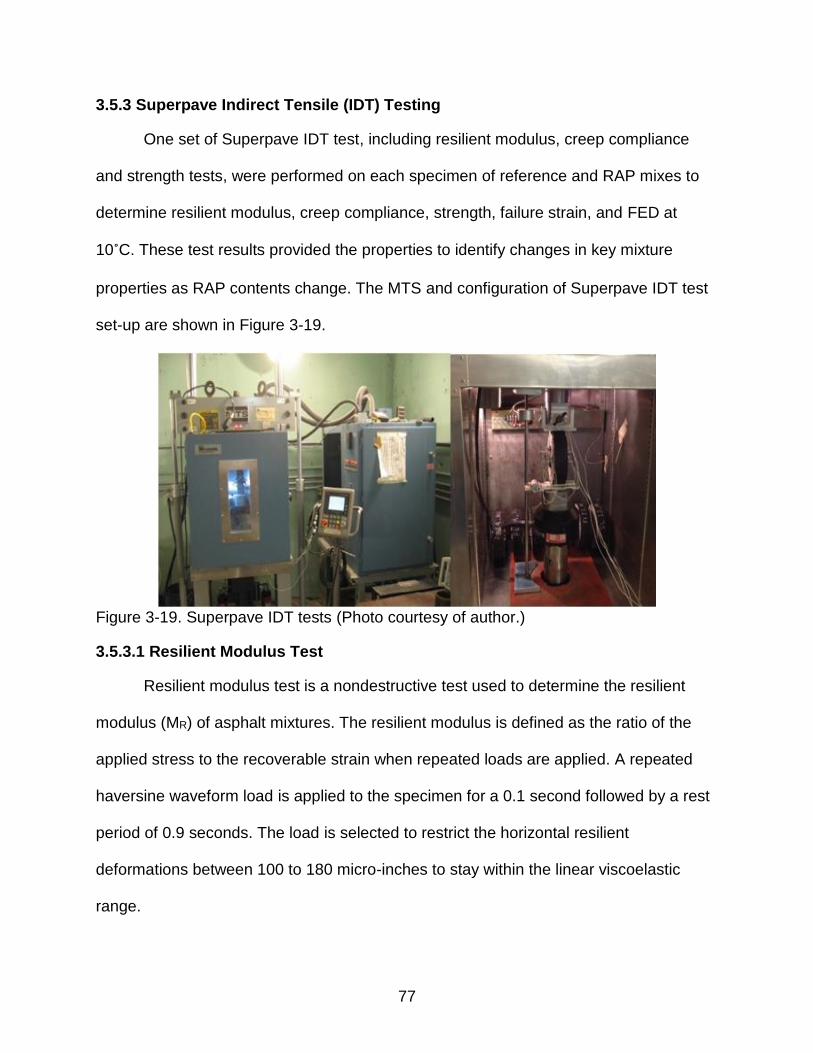
77
3.5.3 Superpave Indirect Tensile (IDT) Testing
One set of Superpave IDT test, including resilient modulus, creep compliance
and strength tests, were performed on each specimen of reference and RAP mixes to
determine resilient modulus, creep compliance, strength, failure strain, and FED at
10˚C. These test results provided the properties to identify changes in key mixture
properties as RAP contents change. The MTS and configuration of Superpave IDT test
set-up are shown in Figure 3-19.
Figure 3-19. Superpave IDT tests (Photo courtesy of author.)
3.5.3.1 Resilient Modulus Test
Resilient modulus test is a nondestructive test used to determine the resilient
modulus (MR) of asphalt mixtures. The resilient modulus is defined as the ratio of the
applied stress to the recoverable strain when repeated loads are applied. A repeated
haversine waveform load is applied to the specimen for a 0.1 second followed by a rest
period of 0.9 seconds. The load is selected to restrict the horizontal resilient
deformations between 100 to 180 micro-inches to stay within the linear viscoelastic
range.
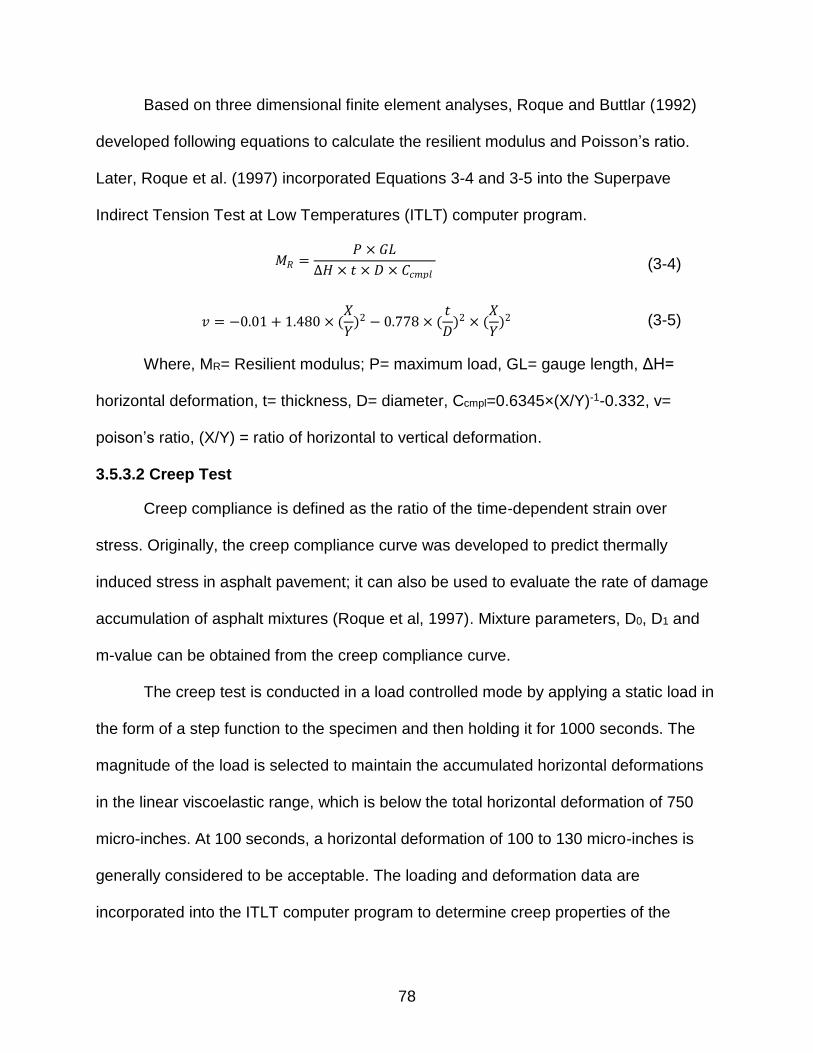
78
Based on three dimensional finite element analyses, Roque and Buttlar (1992)
developed following equations to calculate the resilient modulus and Poisson’s ratio.
Later, Roque et al. (1997) incorporated Equations 3-4 and 3-5 into the Superpave
Indirect Tension Test at Low Temperatures (ITLT) computer program.
(3-4)
(3-5)
Where, MR= Resilient modulus; P= maximum load, GL= gauge length, ΔH=
horizontal deformation, t= thickness, D= diameter, Ccmpl=0.6345×(X/Y)-1-0.332, v=
poison’s ratio, (X/Y) = ratio of horizontal to vertical deformation.
3.5.3.2 Creep Test
Creep compliance is defined as the ratio of the time-dependent strain over
stress. Originally, the creep compliance curve was developed to predict thermally
induced stress in asphalt pavement; it can also be used to evaluate the rate of damage
accumulation of asphalt mixtures (Roque et al, 1997). Mixture parameters, D0, D1 and
m-value can be obtained from the creep compliance curve.
The creep test is conducted in a load controlled mode by applying a static load in
the form of a step function to the specimen and then holding it for 1000 seconds. The
magnitude of the load is selected to maintain the accumulated horizontal deformations
in the linear viscoelastic range, which is below the total horizontal deformation of 750
micro-inches. At 100 seconds, a horizontal deformation of 100 to 130 micro-inches is
generally considered to be acceptable. The loading and deformation data are
incorporated into the ITLT computer program to determine creep properties of the
𝑀𝑅 =𝑃 × 𝐺𝐿
∆𝐻 × 𝑡 × 𝐷 × 𝐶𝑐𝑚𝑝𝑙
𝑣 = −0.01 + 1.480 × (𝑋
𝑌)2 − 0.778 × (
𝑡
𝐷)2 × (
𝑋
𝑌)2
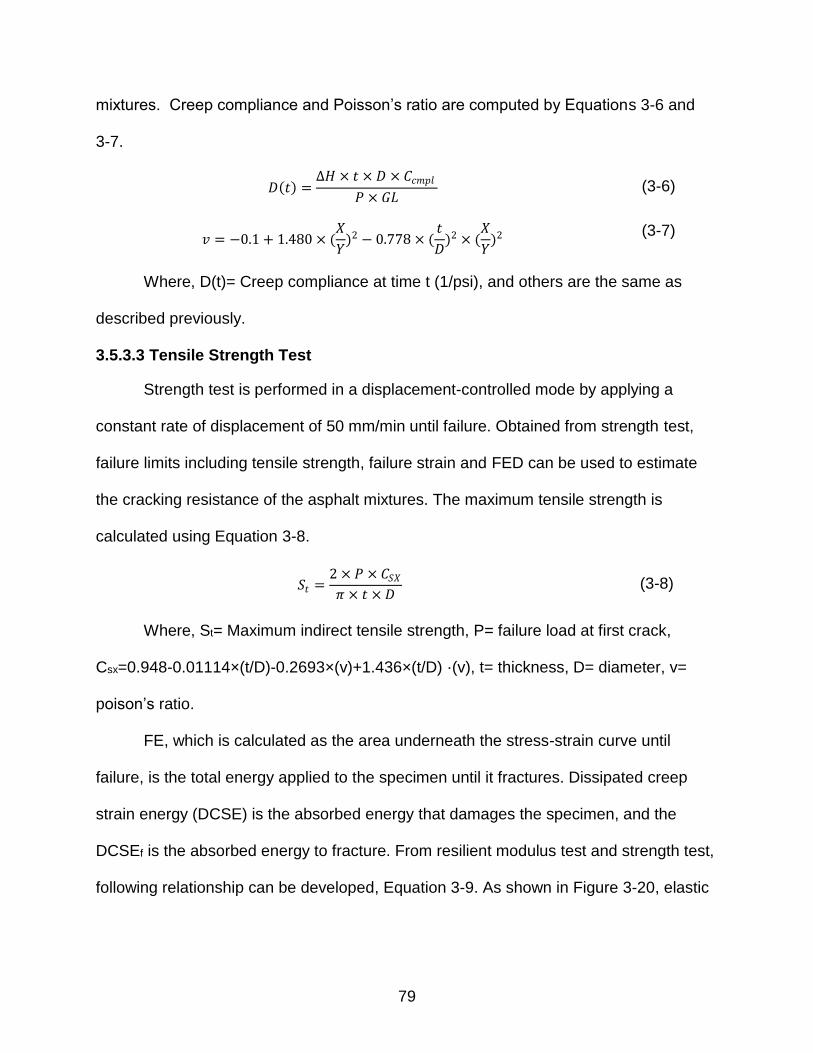
79
mixtures. Creep compliance and Poisson’s ratio are computed by Equations 3-6 and
3-7.
(3-6)
(3-7)
Where, D(t)= Creep compliance at time t (1/psi), and others are the same as
described previously.
3.5.3.3 Tensile Strength Test
Strength test is performed in a displacement-controlled mode by applying a
constant rate of displacement of 50 mm/min until failure. Obtained from strength test,
failure limits including tensile strength, failure strain and FED can be used to estimate
the cracking resistance of the asphalt mixtures. The maximum tensile strength is
calculated using Equation 3-8.
(3-8)
Where, St= Maximum indirect tensile strength, P= failure load at first crack,
Csx=0.948-0.01114×(t/D)-0.2693×(v)+1.436×(t/D) ·(v), t= thickness, D= diameter, v=
poison’s ratio.
FE, which is calculated as the area underneath the stress-strain curve until
failure, is the total energy applied to the specimen until it fractures. Dissipated creep
strain energy (DCSE) is the absorbed energy that damages the specimen, and the
DCSEf is the absorbed energy to fracture. From resilient modulus test and strength test,
following relationship can be developed, Equation 3-9. As shown in Figure 3-20, elastic
𝐷(𝑡) =∆𝐻 × 𝑡 × 𝐷 × 𝐶𝑐𝑚𝑝𝑙
𝑃 × 𝐺𝐿
𝑣 = −0.1 + 1.480 × (𝑋
𝑌)2 − 0.778 × (
𝑡
𝐷)2 × (
𝑋
𝑌)2
𝑆𝑡 =2 × 𝑃 × 𝐶𝑆𝑋𝜋 × 𝑡 × 𝐷
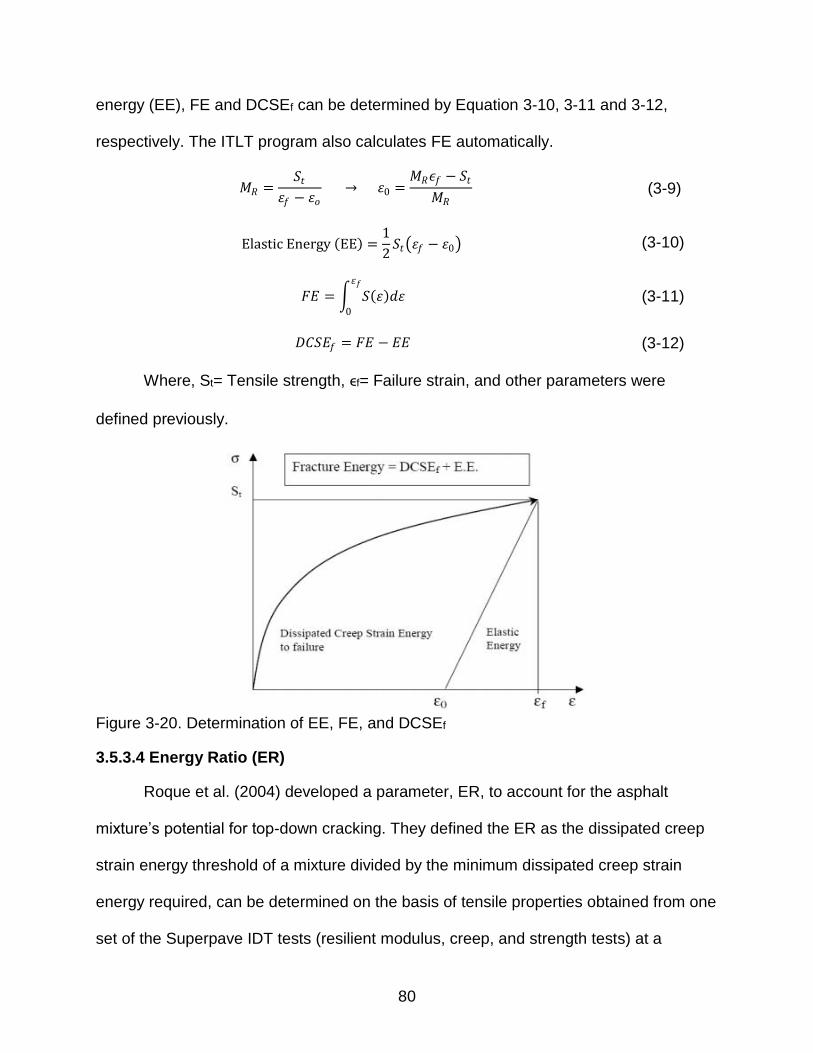
80
energy (EE), FE and DCSEf can be determined by Equation 3-10, 3-11 and 3-12,
respectively. The ITLT program also calculates FE automatically.
(3-9)
(3-10)
(3-11)
(3-12)
Where, St= Tensile strength, ϵf= Failure strain, and other parameters were
defined previously.
Figure 3-20. Determination of EE, FE, and DCSEf
3.5.3.4 Energy Ratio (ER)
Roque et al. (2004) developed a parameter, ER, to account for the asphalt
mixture’s potential for top-down cracking. They defined the ER as the dissipated creep
strain energy threshold of a mixture divided by the minimum dissipated creep strain
energy required, can be determined on the basis of tensile properties obtained from one
set of the Superpave IDT tests (resilient modulus, creep, and strength tests) at a
𝑀𝑅 =𝑆𝑡
휀𝑓 − 휀𝑜 → 휀0 =
𝑀𝑅𝜖𝑓 − 𝑆𝑡
𝑀𝑅
Elastic Energy (EE) =1
2𝑆𝑡 휀𝑓 − 휀0
𝐹𝐸 = 𝑆(휀)𝑑휀 휀𝑓
0
𝐷𝐶𝑆𝐸𝑓 = 𝐹𝐸 − 𝐸𝐸
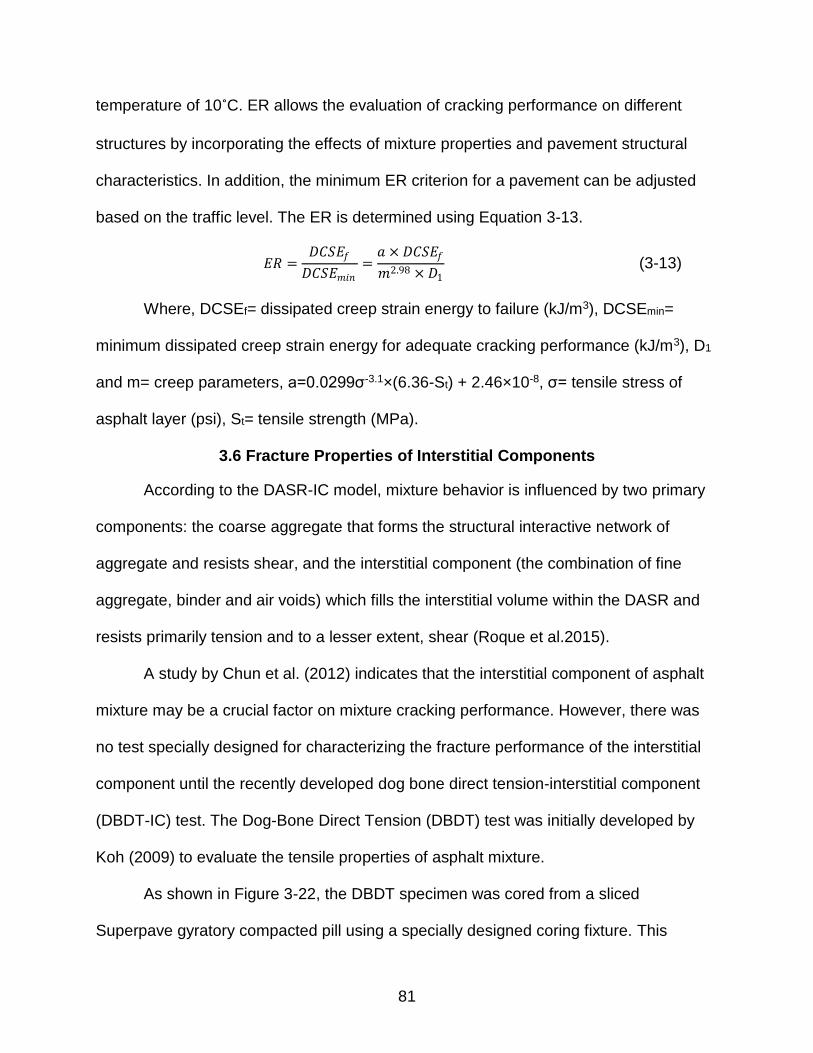
81
temperature of 10˚C. ER allows the evaluation of cracking performance on different
structures by incorporating the effects of mixture properties and pavement structural
characteristics. In addition, the minimum ER criterion for a pavement can be adjusted
based on the traffic level. The ER is determined using Equation 3-13.
(3-13)
Where, DCSEf= dissipated creep strain energy to failure (kJ/m3), DCSEmin=
minimum dissipated creep strain energy for adequate cracking performance (kJ/m3), D1
and m= creep parameters, a=0.0299σ-3.1×(6.36-St) + 2.46×10⁻⁸, σ= tensile stress of
asphalt layer (psi), St= tensile strength (MPa).
3.6 Fracture Properties of Interstitial Components
According to the DASR-IC model, mixture behavior is influenced by two primary
components: the coarse aggregate that forms the structural interactive network of
aggregate and resists shear, and the interstitial component (the combination of fine
aggregate, binder and air voids) which fills the interstitial volume within the DASR and
resists primarily tension and to a lesser extent, shear (Roque et al.2015).
A study by Chun et al. (2012) indicates that the interstitial component of asphalt
mixture may be a crucial factor on mixture cracking performance. However, there was
no test specially designed for characterizing the fracture performance of the interstitial
component until the recently developed dog bone direct tension-interstitial component
(DBDT-IC) test. The Dog-Bone Direct Tension (DBDT) test was initially developed by
Koh (2009) to evaluate the tensile properties of asphalt mixture.
As shown in Figure 3-22, the DBDT specimen was cored from a sliced
Superpave gyratory compacted pill using a specially designed coring fixture. This
𝐸𝑅 =𝐷𝐶𝑆𝐸𝑓
𝐷𝐶𝑆𝐸𝑚𝑖𝑛=𝑎 × 𝐷𝐶𝑆𝐸𝑓
𝑚2.98 × 𝐷1
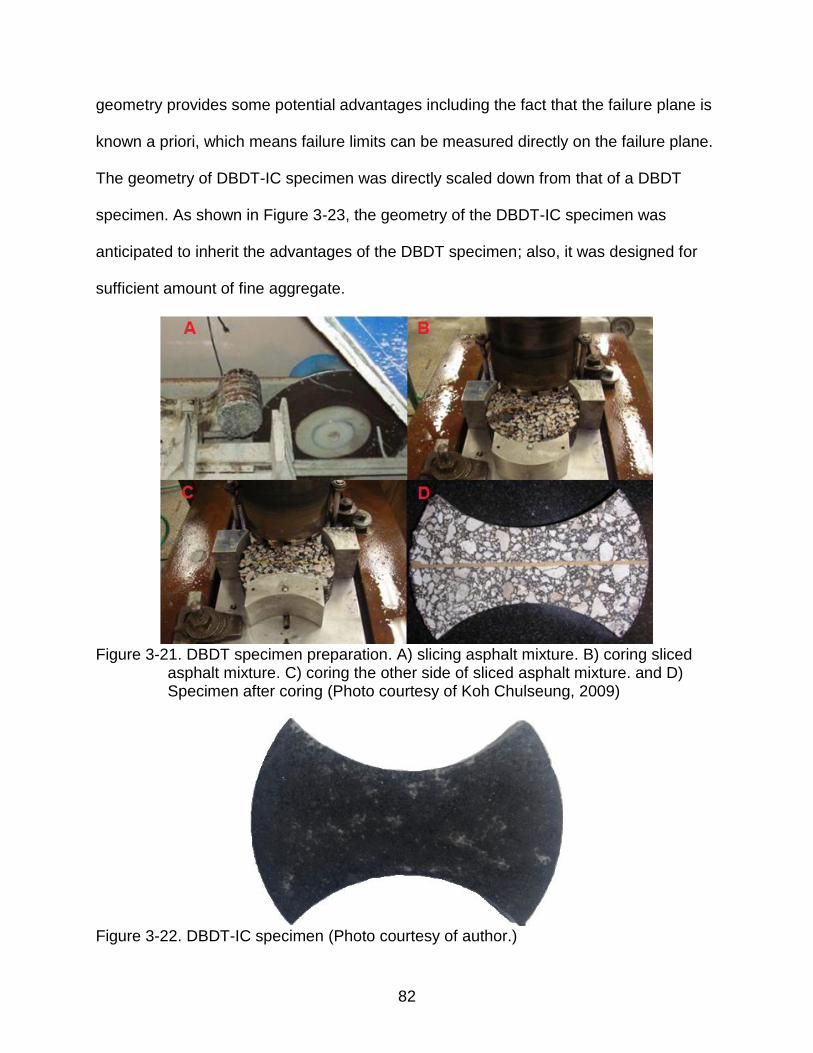
82
geometry provides some potential advantages including the fact that the failure plane is
known a priori, which means failure limits can be measured directly on the failure plane.
The geometry of DBDT-IC specimen was directly scaled down from that of a DBDT
specimen. As shown in Figure 3-23, the geometry of the DBDT-IC specimen was
anticipated to inherit the advantages of the DBDT specimen; also, it was designed for
sufficient amount of fine aggregate.
Figure 3-21. DBDT specimen preparation. A) slicing asphalt mixture. B) coring sliced
asphalt mixture. C) coring the other side of sliced asphalt mixture. and D) Specimen after coring (Photo courtesy of Koh Chulseung, 2009)
Figure 3-22. DBDT-IC specimen (Photo courtesy of author.)
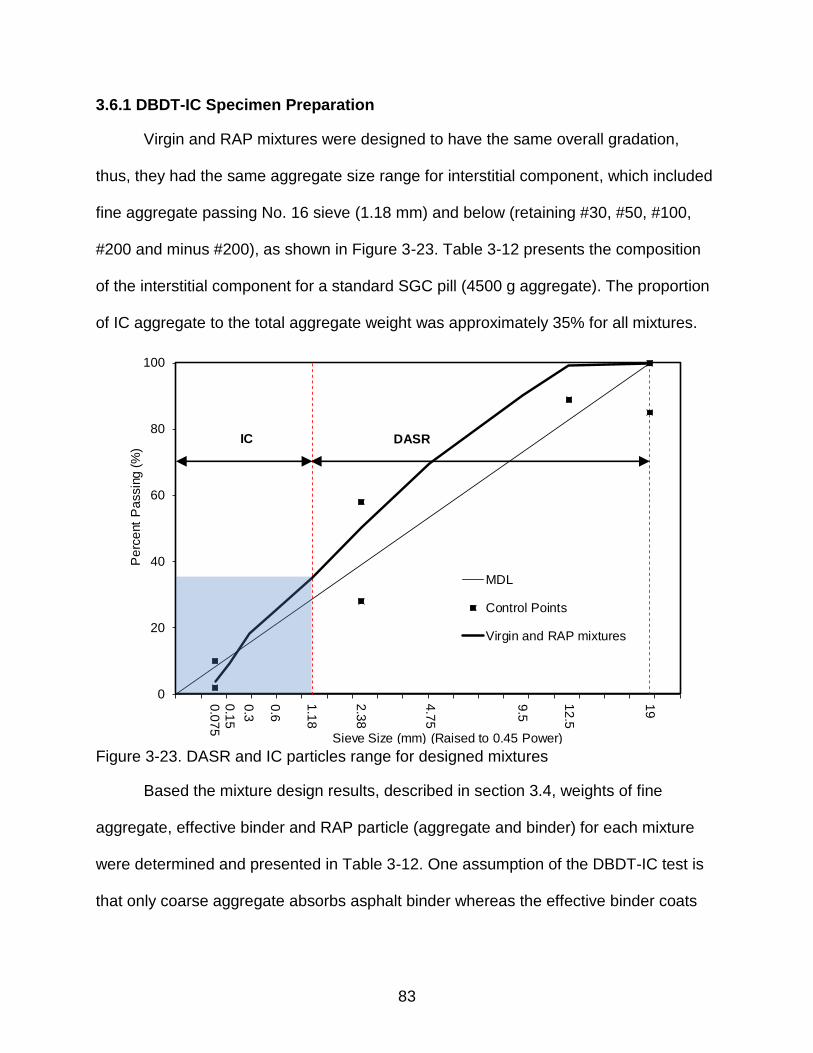
83
3.6.1 DBDT-IC Specimen Preparation
Virgin and RAP mixtures were designed to have the same overall gradation,
thus, they had the same aggregate size range for interstitial component, which included
fine aggregate passing No. 16 sieve (1.18 mm) and below (retaining #30, #50, #100,
#200 and minus #200), as shown in Figure 3-23. Table 3-12 presents the composition
of the interstitial component for a standard SGC pill (4500 g aggregate). The proportion
of IC aggregate to the total aggregate weight was approximately 35% for all mixtures.
Figure 3-23. DASR and IC particles range for designed mixtures
Based the mixture design results, described in section 3.4, weights of fine
aggregate, effective binder and RAP particle (aggregate and binder) for each mixture
were determined and presented in Table 3-12. One assumption of the DBDT-IC test is
that only coarse aggregate absorbs asphalt binder whereas the effective binder coats
19
12
.5
9.5
4.7
5
2.3
8
0.0
75
0.1
5
0.3
0.6
1.1
8
0
20
40
60
80
100
MDL
Control Points
Virgin and RAP mixtures
Sieve Size (mm) (Raised to 0.45 Power)
Pe
rce
nt
Pa
ssin
g (
%)
IC DASR
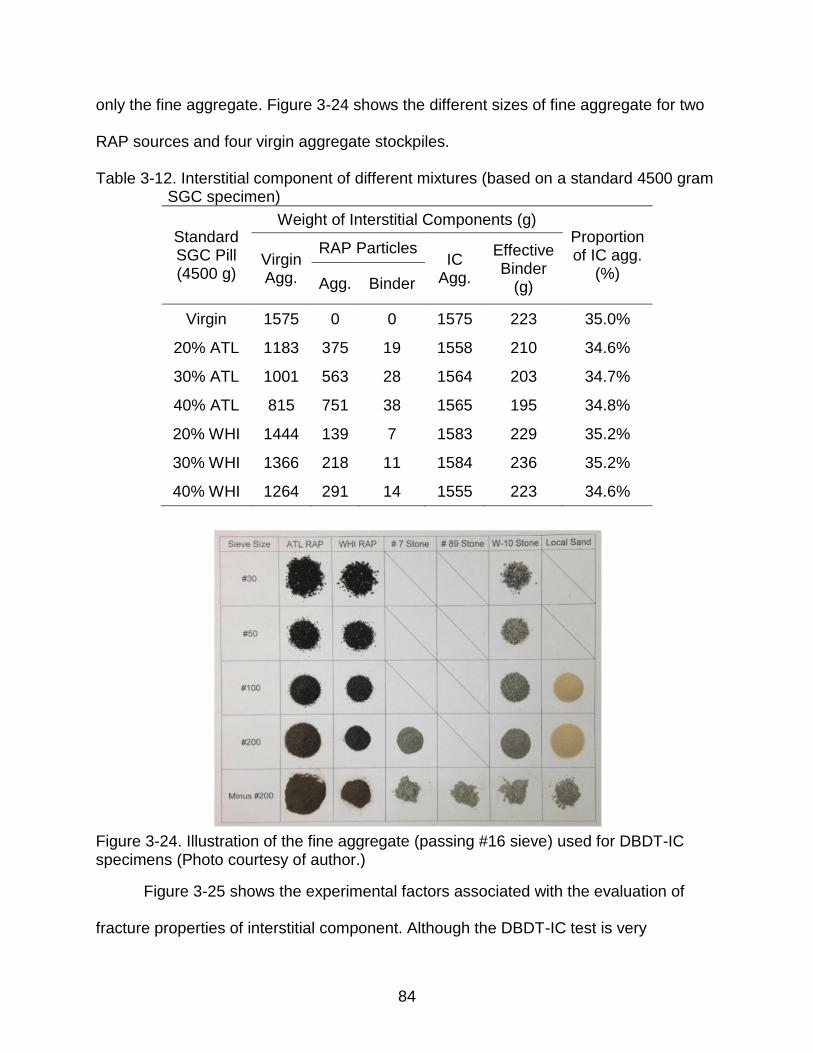
84
only the fine aggregate. Figure 3-24 shows the different sizes of fine aggregate for two
RAP sources and four virgin aggregate stockpiles.
Table 3-12. Interstitial component of different mixtures (based on a standard 4500 gram SGC specimen)
Standard SGC Pill (4500 g)
Weight of Interstitial Components (g) Proportion of IC agg.
(%) Virgin Agg.
RAP Particles IC
Agg.
Effective Binder
(g) Agg. Binder
Virgin 1575 0 0 1575 223 35.0%
20% ATL 1183 375 19 1558 210 34.6%
30% ATL 1001 563 28 1564 203 34.7%
40% ATL 815 751 38 1565 195 34.8%
20% WHI 1444 139 7 1583 229 35.2%
30% WHI 1366 218 11 1584 236 35.2%
40% WHI 1264 291 14 1555 223 34.6%
Figure 3-24. Illustration of the fine aggregate (passing #16 sieve) used for DBDT-IC specimens (Photo courtesy of author.)
Figure 3-25 shows the experimental factors associated with the evaluation of
fracture properties of interstitial component. Although the DBDT-IC test is very
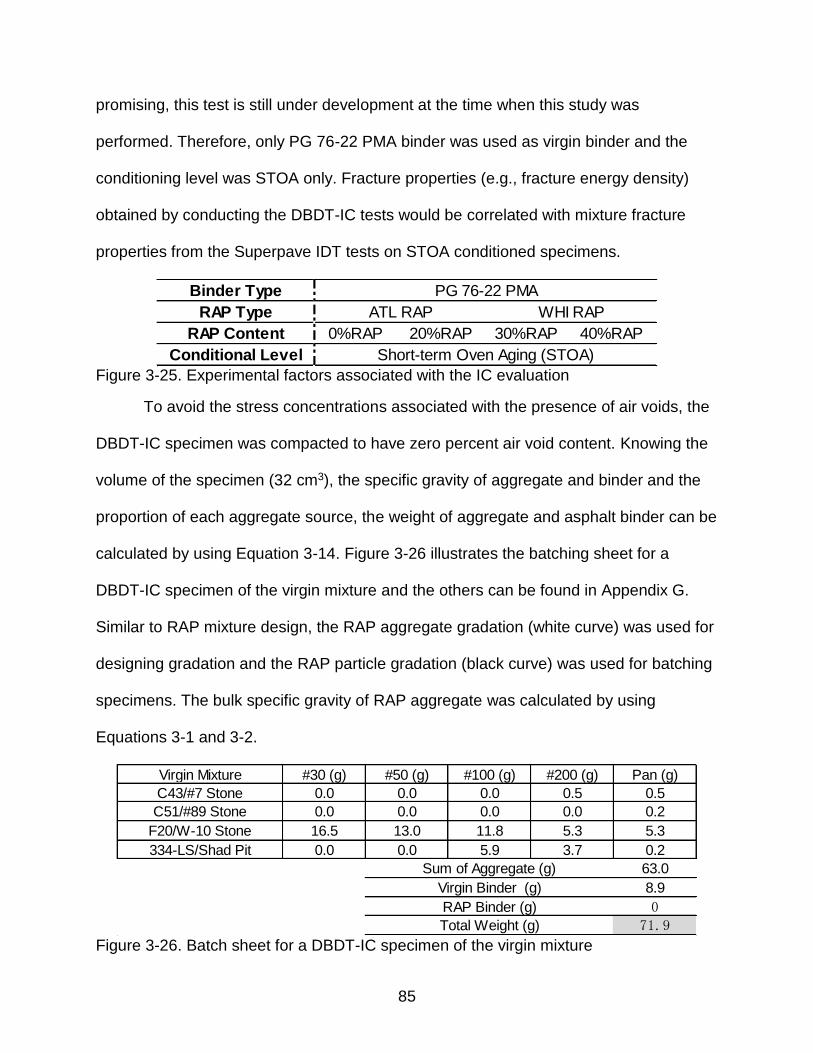
85
promising, this test is still under development at the time when this study was
performed. Therefore, only PG 76-22 PMA binder was used as virgin binder and the
conditioning level was STOA only. Fracture properties (e.g., fracture energy density)
obtained by conducting the DBDT-IC tests would be correlated with mixture fracture
properties from the Superpave IDT tests on STOA conditioned specimens.
Figure 3-25. Experimental factors associated with the IC evaluation
To avoid the stress concentrations associated with the presence of air voids, the
DBDT-IC specimen was compacted to have zero percent air void content. Knowing the
volume of the specimen (32 cm3), the specific gravity of aggregate and binder and the
proportion of each aggregate source, the weight of aggregate and asphalt binder can be
calculated by using Equation 3-14. Figure 3-26 illustrates the batching sheet for a
DBDT-IC specimen of the virgin mixture and the others can be found in Appendix G.
Similar to RAP mixture design, the RAP aggregate gradation (white curve) was used for
designing gradation and the RAP particle gradation (black curve) was used for batching
specimens. The bulk specific gravity of RAP aggregate was calculated by using
Equations 3-1 and 3-2.
Figure 3-26. Batch sheet for a DBDT-IC specimen of the virgin mixture
Binder Type
RAP Type
RAP Content 0%RAP 20%RAP 30%RAP 40%RAP
Conditional Level
PG 76-22 PMA
ATL RAP WHI RAP
Short-term Oven Aging (STOA)
#30 (g) #50 (g) #100 (g) #200 (g) Pan (g)
0.0 0.0 0.0 0.5 0.5
0.0 0.0 0.0 0.0 0.2
16.5 13.0 11.8 5.3 5.3
0.0 0.0 5.9 3.7 0.2
63.0
8.9
0
71.9
Virgin Mixture
C43/#7 Stone
C51/#89 Stone
F20/W-10 Stone
334-LS/Shad Pit
Sum of Aggregate (g)
Virgin Binder (g)
RAP Binder (g)
Total Weight (g)
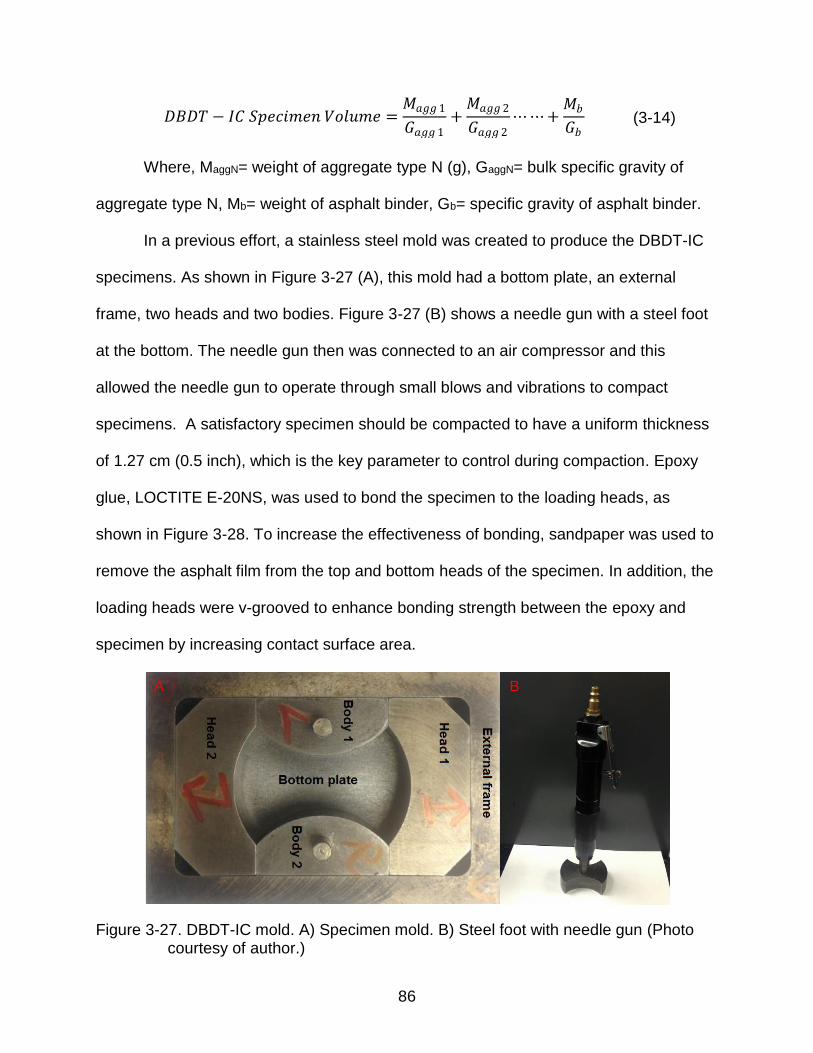
86
(3-14)
Where, MaggN= weight of aggregate type N (g), GaggN= bulk specific gravity of
aggregate type N, Mb= weight of asphalt binder, Gb= specific gravity of asphalt binder.
In a previous effort, a stainless steel mold was created to produce the DBDT-IC
specimens. As shown in Figure 3-27 (A), this mold had a bottom plate, an external
frame, two heads and two bodies. Figure 3-27 (B) shows a needle gun with a steel foot
at the bottom. The needle gun then was connected to an air compressor and this
allowed the needle gun to operate through small blows and vibrations to compact
specimens. A satisfactory specimen should be compacted to have a uniform thickness
of 1.27 cm (0.5 inch), which is the key parameter to control during compaction. Epoxy
glue, LOCTITE E-20NS, was used to bond the specimen to the loading heads, as
shown in Figure 3-28. To increase the effectiveness of bonding, sandpaper was used to
remove the asphalt film from the top and bottom heads of the specimen. In addition, the
loading heads were v-grooved to enhance bonding strength between the epoxy and
specimen by increasing contact surface area.
Figure 3-27. DBDT-IC mold. A) Specimen mold. B) Steel foot with needle gun (Photo courtesy of author.)
𝐷𝐵𝐷𝑇 − 𝐼𝐶 𝑆𝑝𝑒𝑐𝑖𝑚𝑒𝑛 𝑉𝑜𝑙𝑢𝑚𝑒 =𝑀𝑎𝑔𝑔 1
𝐺𝑎𝑔𝑔 1+𝑀𝑎𝑔𝑔 2
𝐺𝑎𝑔𝑔 2⋯⋯+
𝑀𝑏𝐺𝑏
A B
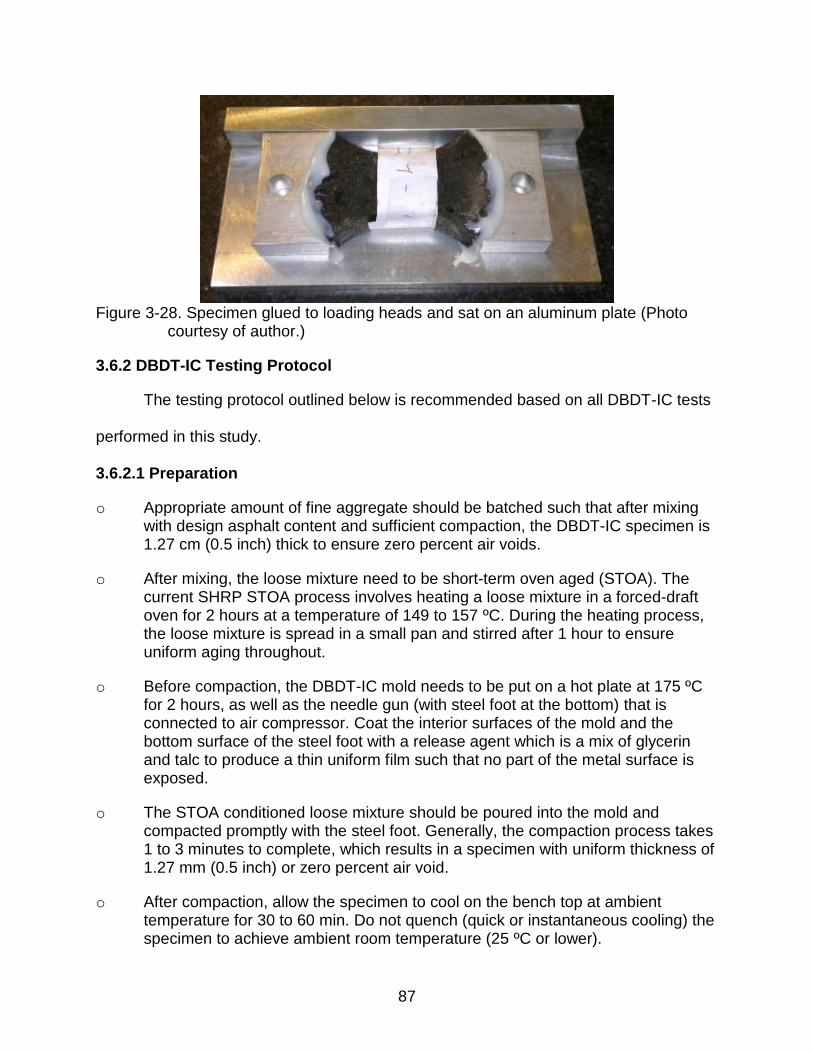
87
Figure 3-28. Specimen glued to loading heads and sat on an aluminum plate (Photo
courtesy of author.)
3.6.2 DBDT-IC Testing Protocol
The testing protocol outlined below is recommended based on all DBDT-IC tests
performed in this study.
3.6.2.1 Preparation
o Appropriate amount of fine aggregate should be batched such that after mixing with design asphalt content and sufficient compaction, the DBDT-IC specimen is 1.27 cm (0.5 inch) thick to ensure zero percent air voids.
o After mixing, the loose mixture need to be short-term oven aged (STOA). The current SHRP STOA process involves heating a loose mixture in a forced-draft oven for 2 hours at a temperature of 149 to 157 ºC. During the heating process, the loose mixture is spread in a small pan and stirred after 1 hour to ensure uniform aging throughout.
o Before compaction, the DBDT-IC mold needs to be put on a hot plate at 175 ºC for 2 hours, as well as the needle gun (with steel foot at the bottom) that is connected to air compressor. Coat the interior surfaces of the mold and the bottom surface of the steel foot with a release agent which is a mix of glycerin and talc to produce a thin uniform film such that no part of the metal surface is exposed.
o The STOA conditioned loose mixture should be poured into the mold and compacted promptly with the steel foot. Generally, the compaction process takes 1 to 3 minutes to complete, which results in a specimen with uniform thickness of 1.27 mm (0.5 inch) or zero percent air void.
o After compaction, allow the specimen to cool on the bench top at ambient temperature for 30 to 60 min. Do not quench (quick or instantaneous cooling) the specimen to achieve ambient room temperature (25 ºC or lower).
88
o Remove the asphalt film on the top and bottom heads of the specimen with sandpaper. Use epoxy to glue two loading heads to the polished specimen, and ensure the specimen and loading heads are perfectly aligned. The time for the epoxy to start the process of hardening is 20 minutes and the total curing time to obtain full strength is approximately 24 hours.
o A minimum of three specimens should be prepared for each mixture type.
3.6.2.2 Testing and Analysis
o Place the specimen in a temperature controlled chamber set to 10 ºC for 2 hours. It is preferable that same temperature chamber be used for both conditioning and testing.
o Orient the specimen vertically and align it with the loading frame by matching the cavities of two heads with two grips. This step should be performed in as short time as possible to avoid a change in the environmental chamber temperature.
o Perform the DBDT-IC test at 10 ºC at a displacement rate of 5.08 cm (2 inch)/min. A significant drop in load/force indicates the completion of a test, and a successful test should have the fracture occur at the center of the specimen.
o Data collected from the Data Acquisition System should be time, force and displacement.
o The measured force needs to be transformed into an average stress in the central cross-sectional area of the specimen where fracture initiates and propagates. This is achieved by dividing force over the area of fracture surface which is assumed to be 32 cm2 (0.5 inch2).
o Displacement data is transformed into strain data by assuming deformation only occur in the middle second of the specimen which is 2.54 cm (1 inch).
o Plot the stress versus strain curve. The fracture energy density is defined as the area under the curve until fracture indicated by a significant reduction in stress to zero kPa.
3.7 Closure
The virgin aggregate used throughout this study was Georgia granite and local
sand. Two different RAP sources were utilized; Atlantic Coast (ATL) RAP and
Whitehurst (WHI) RAP. The aggregate gradation of WHI RAP was much coarser than
the one of ATL RAP. Based on visual inspection of the extracted aggregate, ATL RAP
was mainly composed of granite aggregate and the WHI RAP was mainly composed of
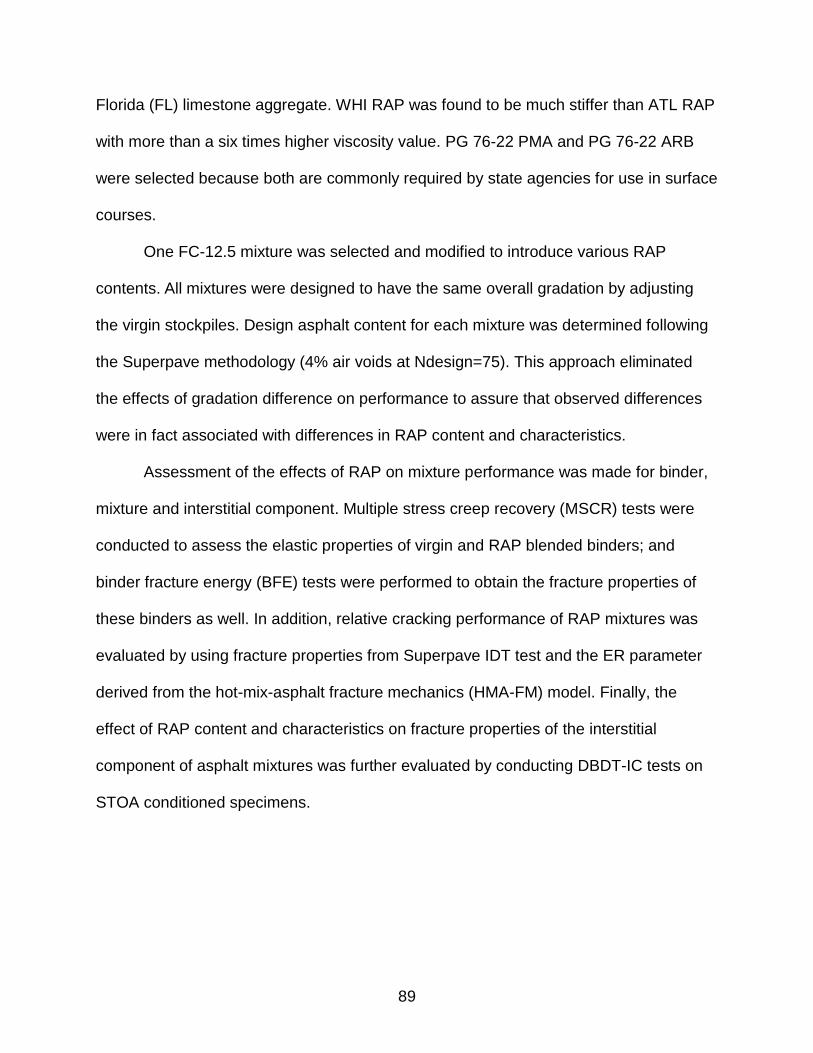
89
Florida (FL) limestone aggregate. WHI RAP was found to be much stiffer than ATL RAP
with more than a six times higher viscosity value. PG 76-22 PMA and PG 76-22 ARB
were selected because both are commonly required by state agencies for use in surface
courses.
One FC-12.5 mixture was selected and modified to introduce various RAP
contents. All mixtures were designed to have the same overall gradation by adjusting
the virgin stockpiles. Design asphalt content for each mixture was determined following
the Superpave methodology (4% air voids at Ndesign=75). This approach eliminated
the effects of gradation difference on performance to assure that observed differences
were in fact associated with differences in RAP content and characteristics.
Assessment of the effects of RAP on mixture performance was made for binder,
mixture and interstitial component. Multiple stress creep recovery (MSCR) tests were
conducted to assess the elastic properties of virgin and RAP blended binders; and
binder fracture energy (BFE) tests were performed to obtain the fracture properties of
these binders as well. In addition, relative cracking performance of RAP mixtures was
evaluated by using fracture properties from Superpave IDT test and the ER parameter
derived from the hot-mix-asphalt fracture mechanics (HMA-FM) model. Finally, the
effect of RAP content and characteristics on fracture properties of the interstitial
component of asphalt mixtures was further evaluated by conducting DBDT-IC tests on
STOA conditioned specimens.

90
CHAPTER 4
BINDER TESTING RESULTS
Historically, state highway agencies limit RAP in HMA mixtures based on RAP
percentage by weight of aggregate or by weight of total mix. However, the percentage
of RAP binder blended with virgin binders used in this study, named binder replacement
ratio, is different from the percentage of RAP mixture in mixtures, as it was calculated
as the percentage of RAP binder divided by the mixture’s total binder content. Before
performing any binder tests, mixture designs were conducted for a total of seven
mixtures, including virgin mixture, 20%, 30% and 40% ATL RAP mixtures, 20%, 30%
and 40% WHI RAP mixtures. The total binder content for different RAP mixtures was
determined as that resulting in 4% air voids at Ndesign. Only PG 76-22 PMA binder was
used to determine the total binder contents and the same asphalt content was assumed
for each mixture using the PG 76-22 ARB. Table 4-1 presents the mixture parameters
and the binder replacement ratios. It was noted that VMA of the 40% ATL RAP mixture
was slightly less than the Superpave specified minimum value (14.0%). Details
regarding mix design can be found in Appendix D.
Once the RAP binder replacement ratio was determined for each mix, Superpave
binder tests, the multiple stress creep recovery (MSCR) test and the newly developed
BFE test were adopted to evaluate the effect of RAP on binder properties. Specimens
were prepared by manually blending RAP binder with virgin binders at the
corresponding binder replacement ratio. The blending temperature was 325 °F (163 °C).
Two types of condition levels were involved, including RTFO and RTFO-plus-PAV
aging. Table 4-2 summarizes the binder tests conditions and parameters applied in this
study. Detailed binder test results can be found in Appendix E.

91
Table 4-1. Verified mix design volumetric parameters and RAP binder replacement ratios
% RAP Ndesign=75, Mixing and Compacting Temp. =325°F
Total Binder
Virgin Binder
Air Voids
VMA (%)
VFA (%)
Replacement Ratio
No RAP 0% 5.2% 5.2% 4.2% 15.3 72.5 0%
ATL RAP
20% 5.2% 4.2% 4.3% 14.9 71.1 18%
30% 5.0% 3.6% 4.0% 14.2 71.8 29%
40% 4.9% 3.0% 3.9% 13.6 71.3 39%
WHI RAP
20% 5.9% 5.0% 3.9% 15.5 74.8 15%
30% 5.9% 4.5% 4.2% 15.7 73.2 23%
40% 5.6% 3.8% 4.0% 14.9 72.9 33%
Table 4-2. Binder tests conditions and parameters
Binder Tests
Aging Level
Temperature (°C)
Parameters Measured
Specification (FDOT, 2016)
RV
Original
135 viscosity Maximum 3.0 Pa·s
DSR 76 G*/sinδ Maximum 1.0 kPa
Phase angle (δ) Maximum 75 °
MSCR RTFO 67 Jnr,3.2
"v"=1.0 kPa-1 max "E"=0.5 kPa-1 max
%Recovery >29.37(Jnr,3.2)-0.2633
DSR
PAV
26.5 G*sinδ Maximum 5000 kPa
BBR -12 m-value Minimum 0.300
S(Stiffness) Maximum 300 Mpa
BFE 15 FED NA
4.1 Superpave Binder Tests
4.1.1 Brookfield Viscosity (BV) Test Results
The Rotational Viscometer test is used to determine the viscosity of asphalt
binders in the high temperature range corresponding to manufacturing and construction.
It measures the torque required to maintain a constant rotational speed (20 RPM) of a
cylindrical spindle while submerged in asphalt binder at a constant temperature
(typically 275 °F (135 °C)). For each blended binder, one specimen was tested.
Figure 4-1 shows the viscosity values for PG 76-22 PMA and blended binders,
including 20%, 30% and 40% RAP (ATL and WHI RAP). It was observed that the
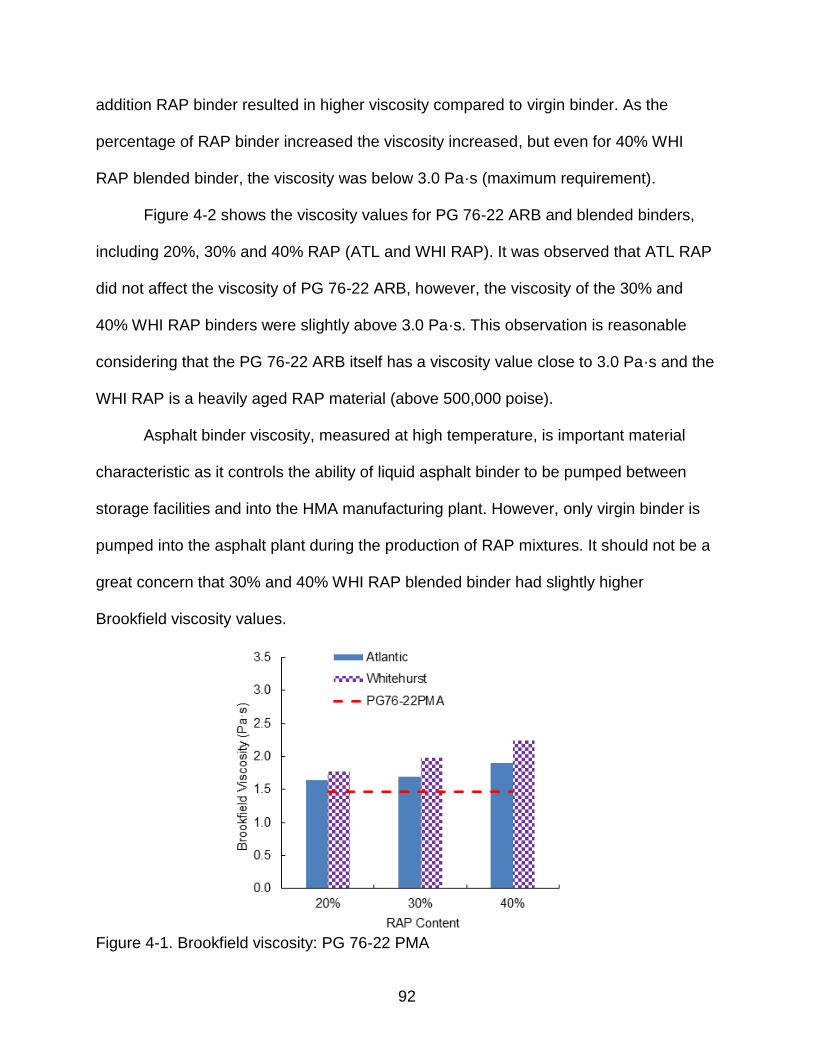
92
addition RAP binder resulted in higher viscosity compared to virgin binder. As the
percentage of RAP binder increased the viscosity increased, but even for 40% WHI
RAP blended binder, the viscosity was below 3.0 Pa·s (maximum requirement).
Figure 4-2 shows the viscosity values for PG 76-22 ARB and blended binders,
including 20%, 30% and 40% RAP (ATL and WHI RAP). It was observed that ATL RAP
did not affect the viscosity of PG 76-22 ARB, however, the viscosity of the 30% and
40% WHI RAP binders were slightly above 3.0 Pa·s. This observation is reasonable
considering that the PG 76-22 ARB itself has a viscosity value close to 3.0 Pa·s and the
WHI RAP is a heavily aged RAP material (above 500,000 poise).
Asphalt binder viscosity, measured at high temperature, is important material
characteristic as it controls the ability of liquid asphalt binder to be pumped between
storage facilities and into the HMA manufacturing plant. However, only virgin binder is
pumped into the asphalt plant during the production of RAP mixtures. It should not be a
great concern that 30% and 40% WHI RAP blended binder had slightly higher
Brookfield viscosity values.
Figure 4-1. Brookfield viscosity: PG 76-22 PMA
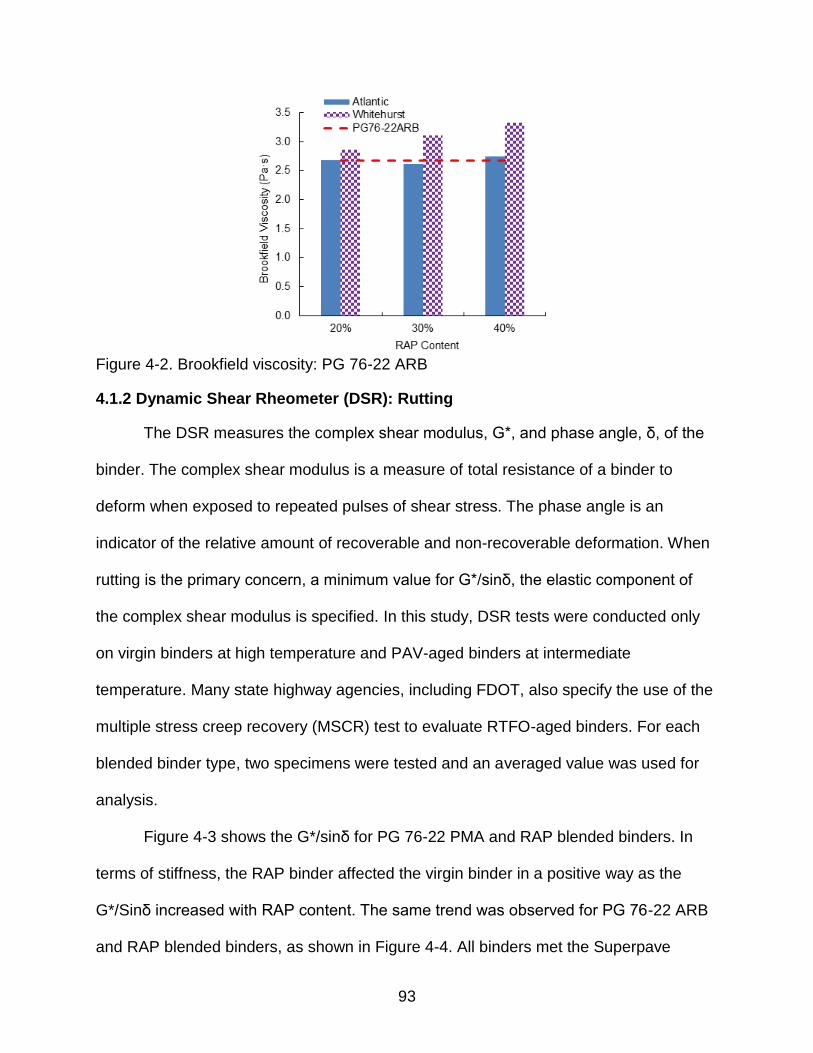
93
Figure 4-2. Brookfield viscosity: PG 76-22 ARB
4.1.2 Dynamic Shear Rheometer (DSR): Rutting
The DSR measures the complex shear modulus, G*, and phase angle, δ, of the
binder. The complex shear modulus is a measure of total resistance of a binder to
deform when exposed to repeated pulses of shear stress. The phase angle is an
indicator of the relative amount of recoverable and non-recoverable deformation. When
rutting is the primary concern, a minimum value for G*/sinδ, the elastic component of
the complex shear modulus is specified. In this study, DSR tests were conducted only
on virgin binders at high temperature and PAV-aged binders at intermediate
temperature. Many state highway agencies, including FDOT, also specify the use of the
multiple stress creep recovery (MSCR) test to evaluate RTFO-aged binders. For each
blended binder type, two specimens were tested and an averaged value was used for
analysis.
Figure 4-3 shows the G*/sinδ for PG 76-22 PMA and RAP blended binders. In
terms of stiffness, the RAP binder affected the virgin binder in a positive way as the
G*/Sinδ increased with RAP content. The same trend was observed for PG 76-22 ARB
and RAP blended binders, as shown in Figure 4-4. All binders met the Superpave
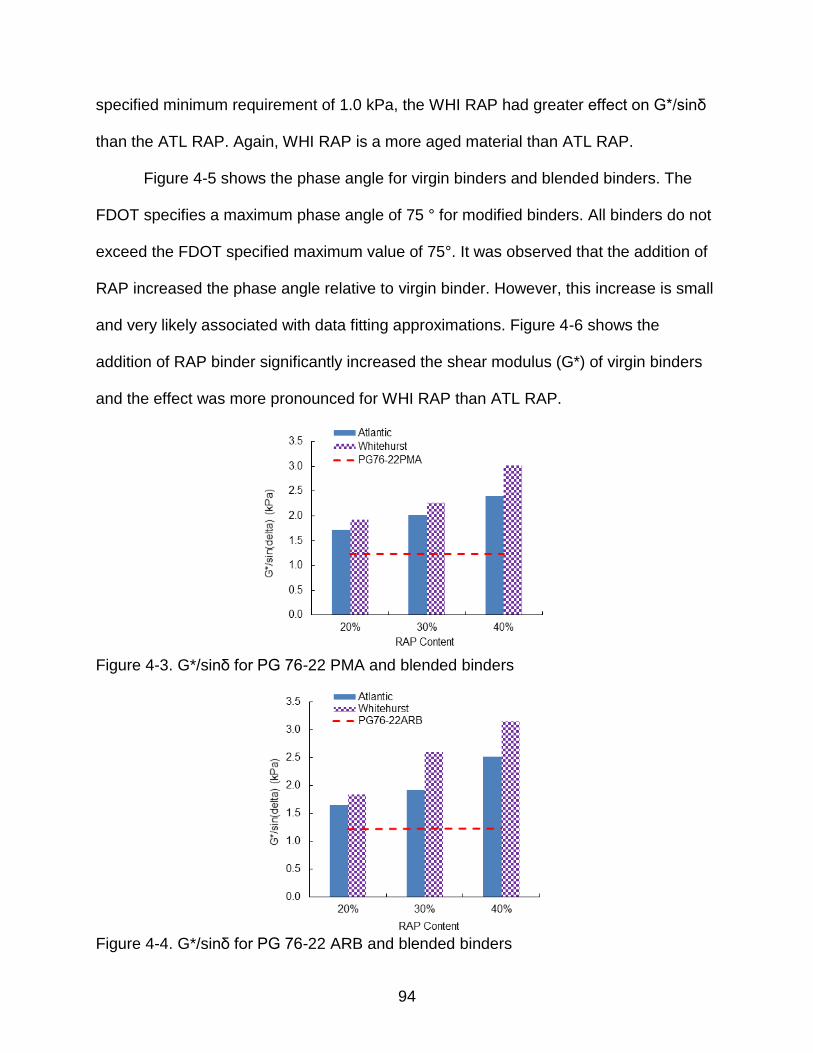
94
specified minimum requirement of 1.0 kPa, the WHI RAP had greater effect on G*/sinδ
than the ATL RAP. Again, WHI RAP is a more aged material than ATL RAP.
Figure 4-5 shows the phase angle for virgin binders and blended binders. The
FDOT specifies a maximum phase angle of 75 ° for modified binders. All binders do not
exceed the FDOT specified maximum value of 75°. It was observed that the addition of
RAP increased the phase angle relative to virgin binder. However, this increase is small
and very likely associated with data fitting approximations. Figure 4-6 shows the
addition of RAP binder significantly increased the shear modulus (G*) of virgin binders
and the effect was more pronounced for WHI RAP than ATL RAP.
Figure 4-3. G*/sinδ for PG 76-22 PMA and blended binders
Figure 4-4. G*/sinδ for PG 76-22 ARB and blended binders
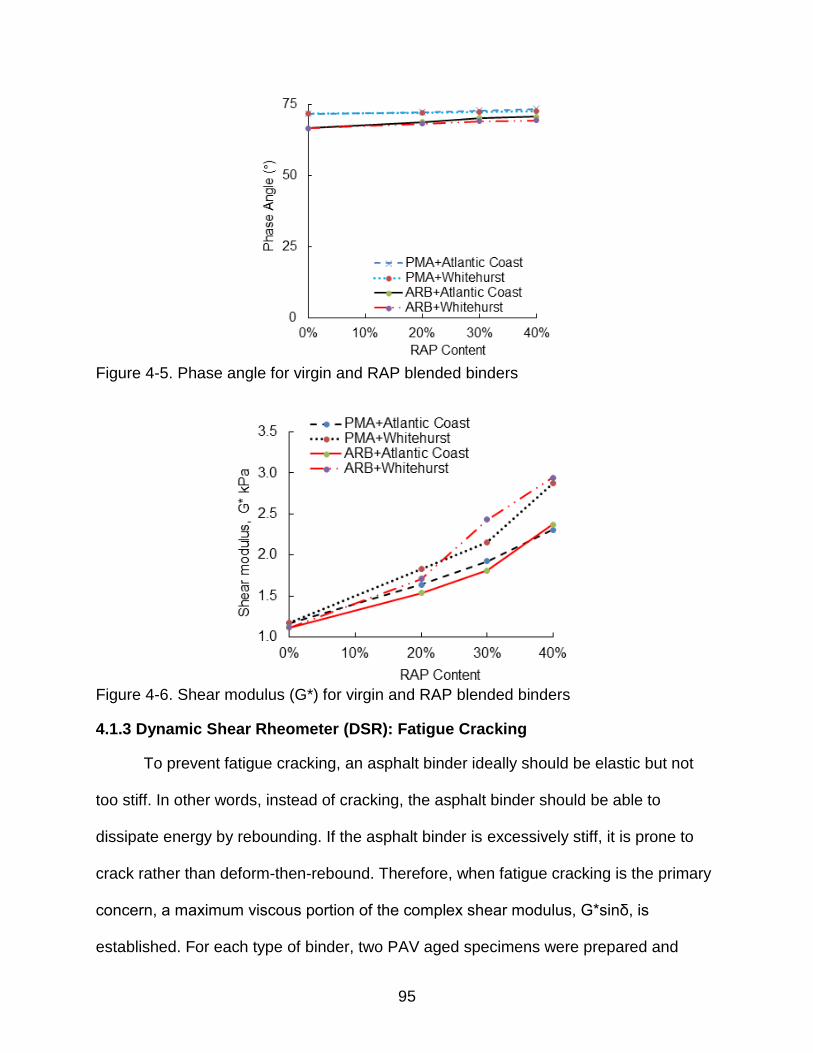
95
Figure 4-5. Phase angle for virgin and RAP blended binders
Figure 4-6. Shear modulus (G*) for virgin and RAP blended binders
4.1.3 Dynamic Shear Rheometer (DSR): Fatigue Cracking
To prevent fatigue cracking, an asphalt binder ideally should be elastic but not
too stiff. In other words, instead of cracking, the asphalt binder should be able to
dissipate energy by rebounding. If the asphalt binder is excessively stiff, it is prone to
crack rather than deform-then-rebound. Therefore, when fatigue cracking is the primary
concern, a maximum viscous portion of the complex shear modulus, G*sinδ, is
established. For each type of binder, two PAV aged specimens were prepared and
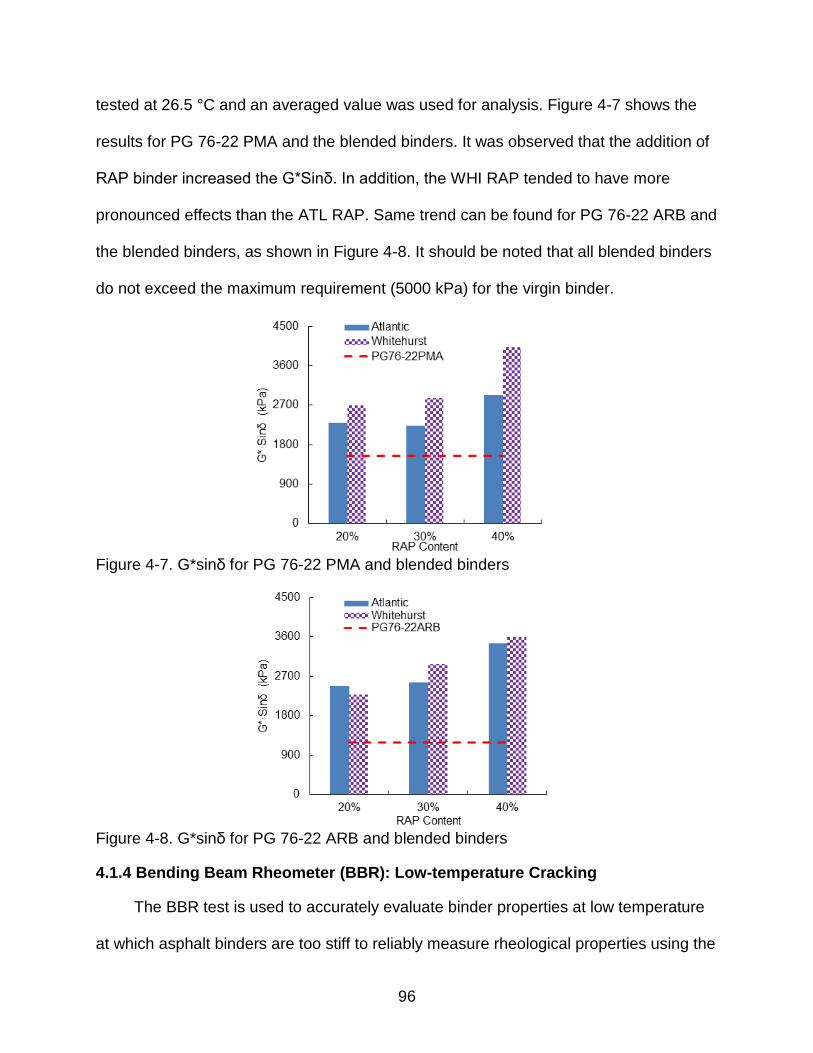
96
tested at 26.5 °C and an averaged value was used for analysis. Figure 4-7 shows the
results for PG 76-22 PMA and the blended binders. It was observed that the addition of
RAP binder increased the G*Sinδ. In addition, the WHI RAP tended to have more
pronounced effects than the ATL RAP. Same trend can be found for PG 76-22 ARB and
the blended binders, as shown in Figure 4-8. It should be noted that all blended binders
do not exceed the maximum requirement (5000 kPa) for the virgin binder.
Figure 4-7. G*sinδ for PG 76-22 PMA and blended binders
Figure 4-8. G*sinδ for PG 76-22 ARB and blended binders
4.1.4 Bending Beam Rheometer (BBR): Low-temperature Cracking
The BBR test is used to accurately evaluate binder properties at low temperature
at which asphalt binders are too stiff to reliably measure rheological properties using the
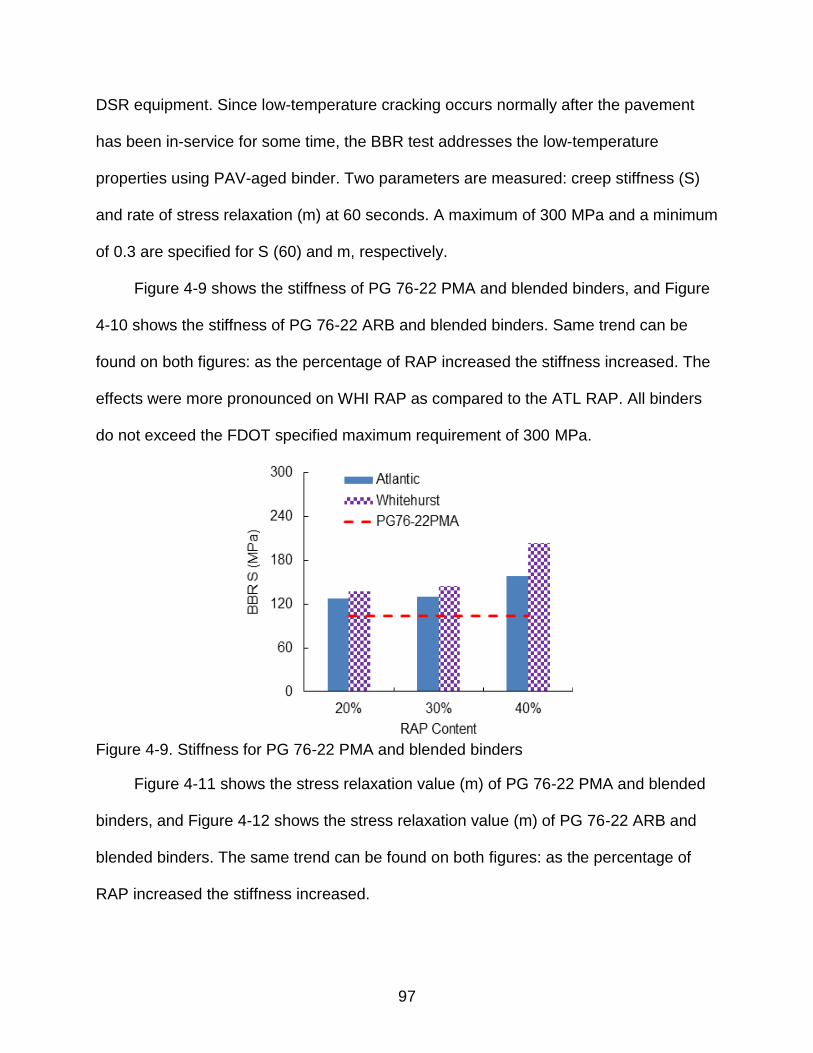
97
DSR equipment. Since low-temperature cracking occurs normally after the pavement
has been in-service for some time, the BBR test addresses the low-temperature
properties using PAV-aged binder. Two parameters are measured: creep stiffness (S)
and rate of stress relaxation (m) at 60 seconds. A maximum of 300 MPa and a minimum
of 0.3 are specified for S (60) and m, respectively.
Figure 4-9 shows the stiffness of PG 76-22 PMA and blended binders, and Figure
4-10 shows the stiffness of PG 76-22 ARB and blended binders. Same trend can be
found on both figures: as the percentage of RAP increased the stiffness increased. The
effects were more pronounced on WHI RAP as compared to the ATL RAP. All binders
do not exceed the FDOT specified maximum requirement of 300 MPa.
Figure 4-9. Stiffness for PG 76-22 PMA and blended binders
Figure 4-11 shows the stress relaxation value (m) of PG 76-22 PMA and blended
binders, and Figure 4-12 shows the stress relaxation value (m) of PG 76-22 ARB and
blended binders. The same trend can be found on both figures: as the percentage of
RAP increased the stiffness increased.
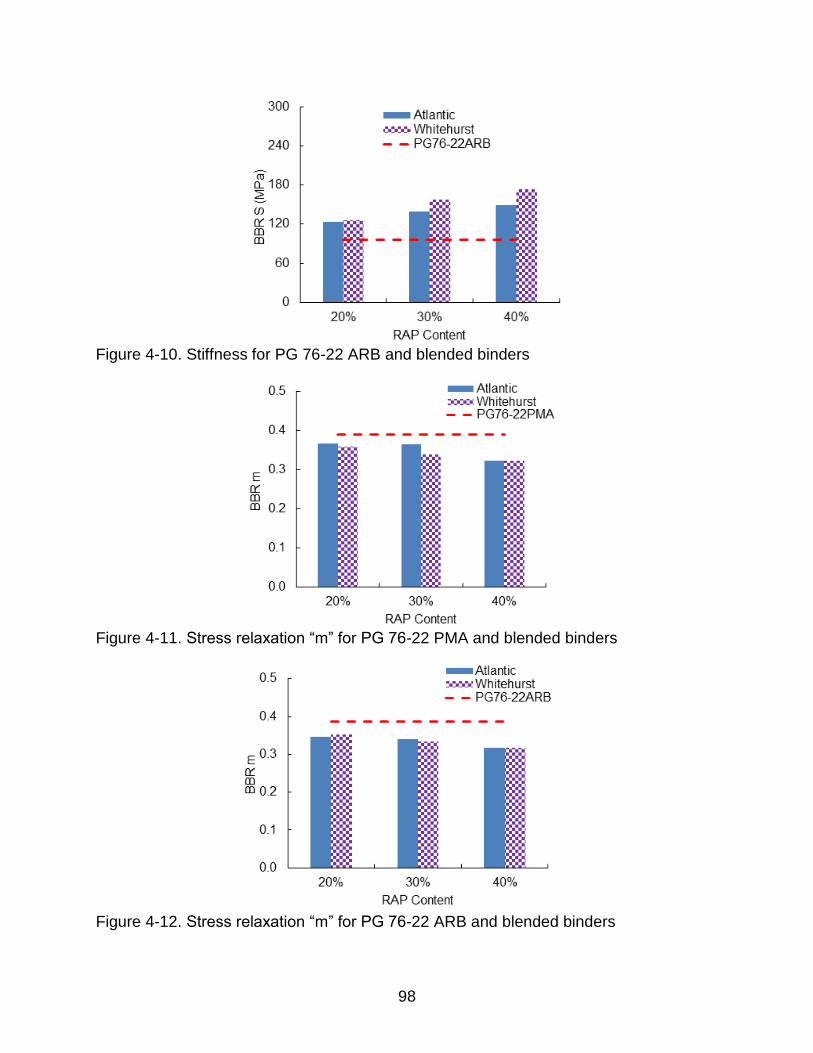
98
Figure 4-10. Stiffness for PG 76-22 ARB and blended binders
Figure 4-11. Stress relaxation “m” for PG 76-22 PMA and blended binders
Figure 4-12. Stress relaxation “m” for PG 76-22 ARB and blended binders
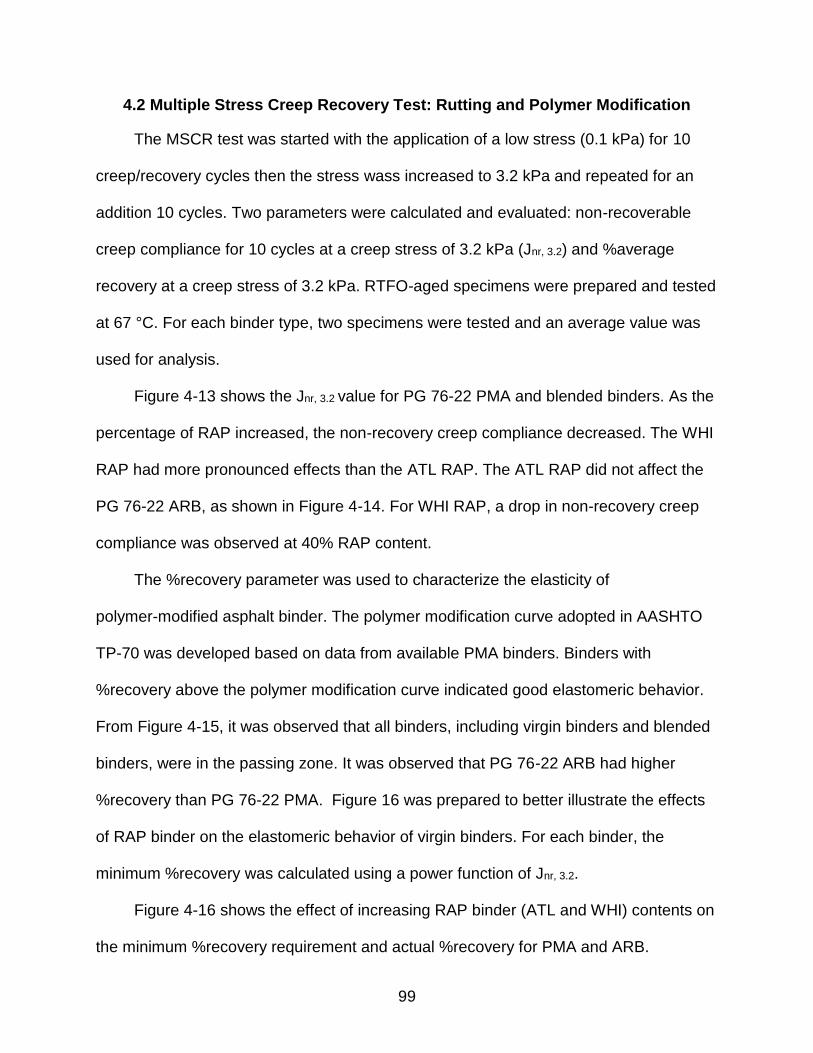
99
4.2 Multiple Stress Creep Recovery Test: Rutting and Polymer Modification
The MSCR test was started with the application of a low stress (0.1 kPa) for 10
creep/recovery cycles then the stress wass increased to 3.2 kPa and repeated for an
addition 10 cycles. Two parameters were calculated and evaluated: non-recoverable
creep compliance for 10 cycles at a creep stress of 3.2 kPa (Jnr, 3.2) and %average
recovery at a creep stress of 3.2 kPa. RTFO-aged specimens were prepared and tested
at 67 °C. For each binder type, two specimens were tested and an average value was
used for analysis.
Figure 4-13 shows the Jnr, 3.2 value for PG 76-22 PMA and blended binders. As the
percentage of RAP increased, the non-recovery creep compliance decreased. The WHI
RAP had more pronounced effects than the ATL RAP. The ATL RAP did not affect the
PG 76-22 ARB, as shown in Figure 4-14. For WHI RAP, a drop in non-recovery creep
compliance was observed at 40% RAP content.
The %recovery parameter was used to characterize the elasticity of
polymer-modified asphalt binder. The polymer modification curve adopted in AASHTO
TP-70 was developed based on data from available PMA binders. Binders with
%recovery above the polymer modification curve indicated good elastomeric behavior.
From Figure 4-15, it was observed that all binders, including virgin binders and blended
binders, were in the passing zone. It was observed that PG 76-22 ARB had higher
%recovery than PG 76-22 PMA. Figure 16 was prepared to better illustrate the effects
of RAP binder on the elastomeric behavior of virgin binders. For each binder, the
minimum %recovery was calculated using a power function of Jnr, 3.2.
Figure 4-16 shows the effect of increasing RAP binder (ATL and WHI) contents on
the minimum %recovery requirement and actual %recovery for PMA and ARB.
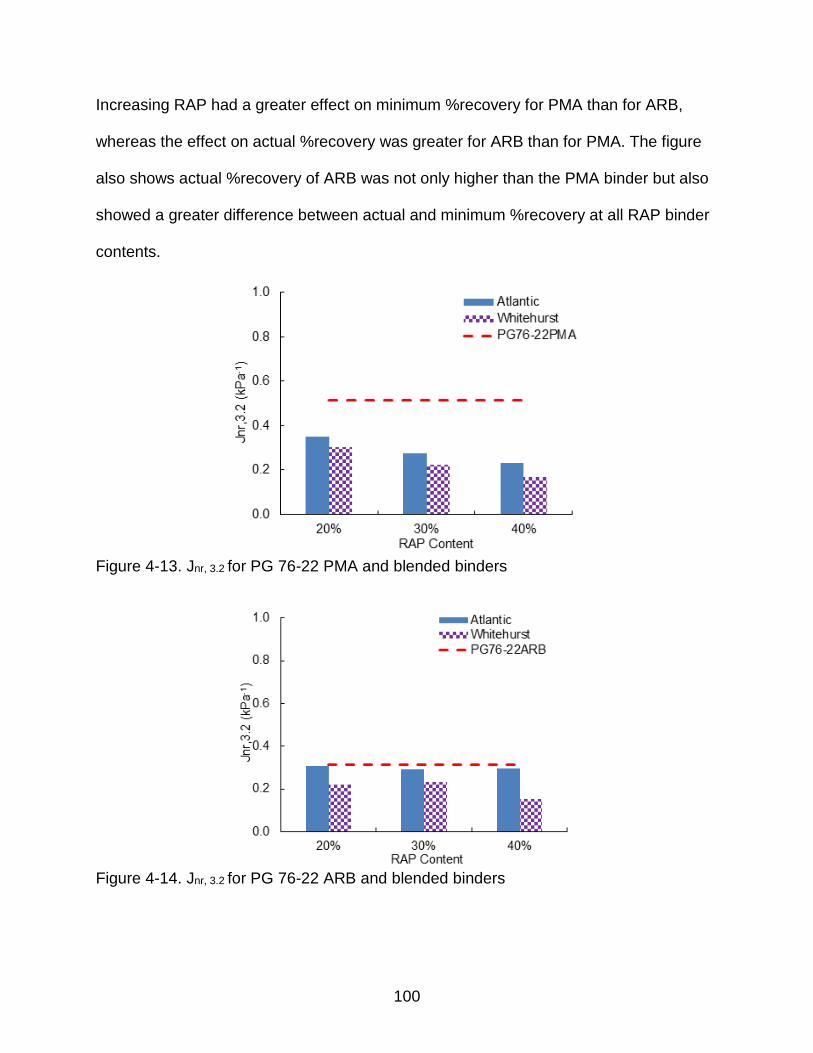
100
Increasing RAP had a greater effect on minimum %recovery for PMA than for ARB,
whereas the effect on actual %recovery was greater for ARB than for PMA. The figure
also shows actual %recovery of ARB was not only higher than the PMA binder but also
showed a greater difference between actual and minimum %recovery at all RAP binder
contents.
Figure 4-13. Jnr, 3.2 for PG 76-22 PMA and blended binders
Figure 4-14. Jnr, 3.2 for PG 76-22 ARB and blended binders
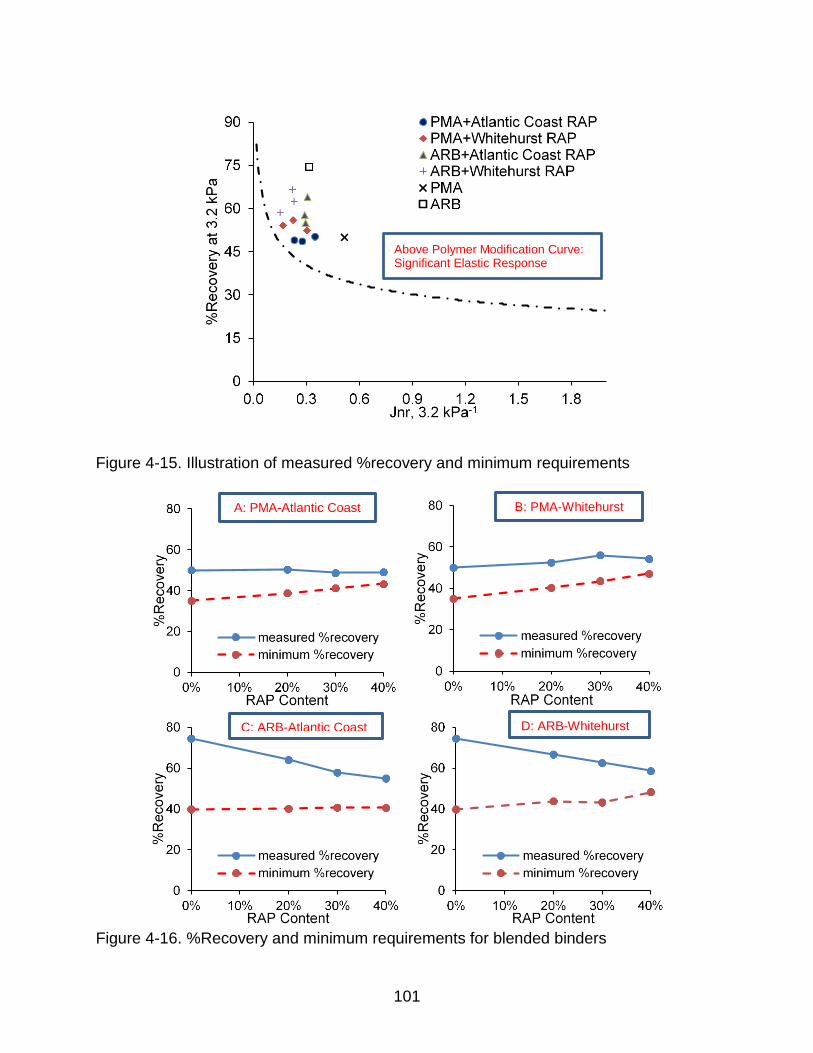
101
Figure 4-15. Illustration of measured %recovery and minimum requirements
Figure 4-16. %Recovery and minimum requirements for blended binders
Above Polymer Modification Curve: Significant Elastic Response
C: ARB-Atlantic Coast D: ARB-Whitehurst
A: PMA-Atlantic Coast B: PMA-Whitehurst
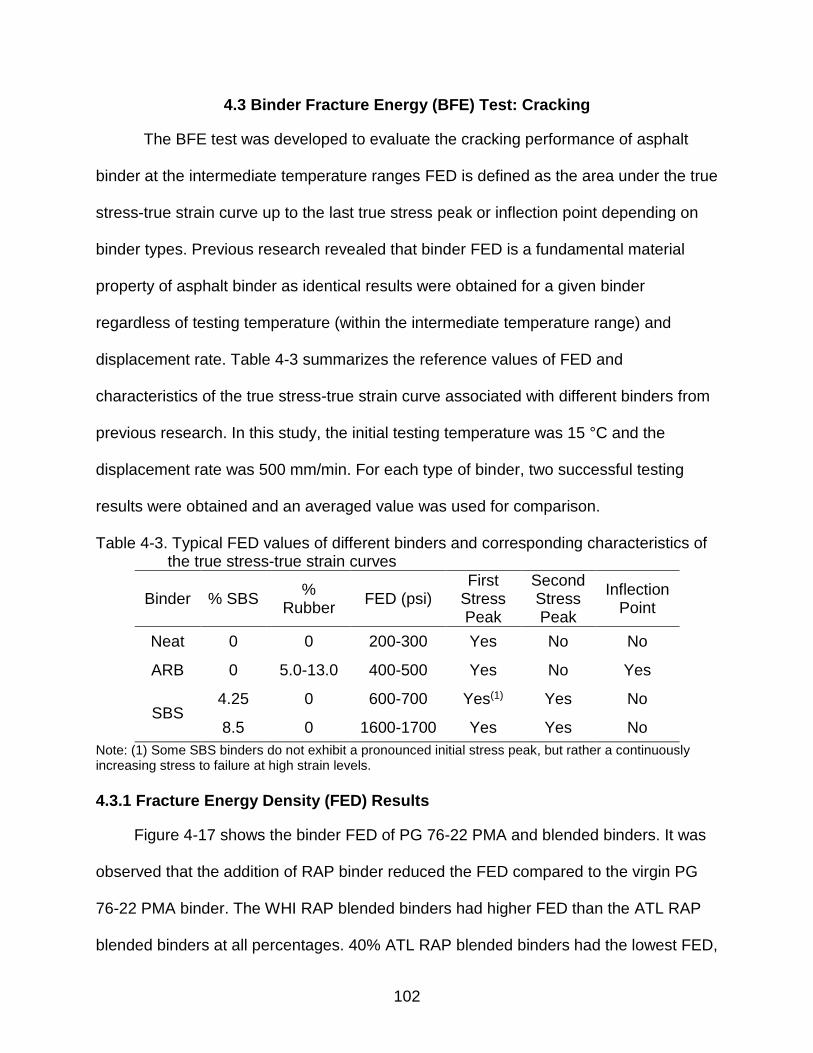
102
4.3 Binder Fracture Energy (BFE) Test: Cracking
The BFE test was developed to evaluate the cracking performance of asphalt
binder at the intermediate temperature ranges FED is defined as the area under the true
stress-true strain curve up to the last true stress peak or inflection point depending on
binder types. Previous research revealed that binder FED is a fundamental material
property of asphalt binder as identical results were obtained for a given binder
regardless of testing temperature (within the intermediate temperature range) and
displacement rate. Table 4-3 summarizes the reference values of FED and
characteristics of the true stress-true strain curve associated with different binders from
previous research. In this study, the initial testing temperature was 15 °C and the
displacement rate was 500 mm/min. For each type of binder, two successful testing
results were obtained and an averaged value was used for comparison.
Table 4-3. Typical FED values of different binders and corresponding characteristics of the true stress-true strain curves
Binder % SBS %
Rubber FED (psi)
First Stress Peak
Second Stress Peak
Inflection Point
Neat 0 0 200-300 Yes No No
ARB 0 5.0-13.0 400-500 Yes No Yes
SBS 4.25 0 600-700 Yes(1) Yes No
8.5 0 1600-1700 Yes Yes No
Note: (1) Some SBS binders do not exhibit a pronounced initial stress peak, but rather a continuously increasing stress to failure at high strain levels.
4.3.1 Fracture Energy Density (FED) Results
Figure 4-17 shows the binder FED of PG 76-22 PMA and blended binders. It was
observed that the addition of RAP binder reduced the FED compared to the virgin PG
76-22 PMA binder. The WHI RAP blended binders had higher FED than the ATL RAP
blended binders at all percentages. 40% ATL RAP blended binders had the lowest FED,
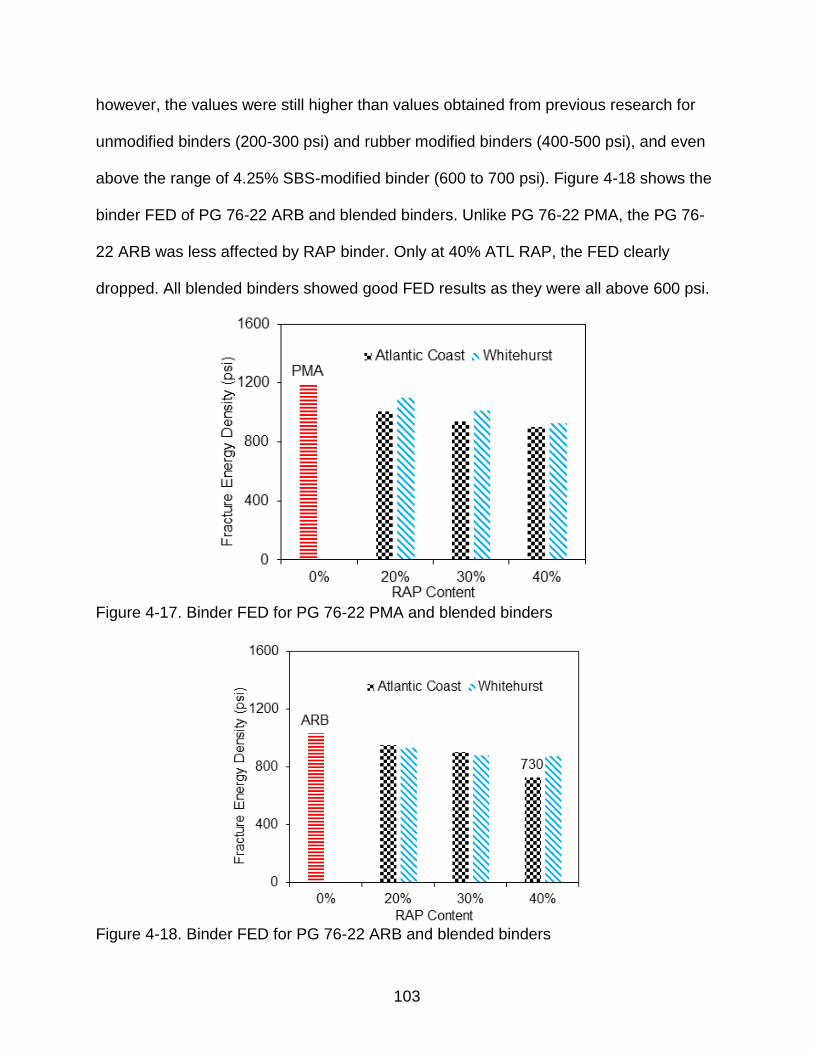
103
however, the values were still higher than values obtained from previous research for
unmodified binders (200-300 psi) and rubber modified binders (400-500 psi), and even
above the range of 4.25% SBS-modified binder (600 to 700 psi). Figure 4-18 shows the
binder FED of PG 76-22 ARB and blended binders. Unlike PG 76-22 PMA, the PG 76-
22 ARB was less affected by RAP binder. Only at 40% ATL RAP, the FED clearly
dropped. All blended binders showed good FED results as they were all above 600 psi.
Figure 4-17. Binder FED for PG 76-22 PMA and blended binders
Figure 4-18. Binder FED for PG 76-22 ARB and blended binders
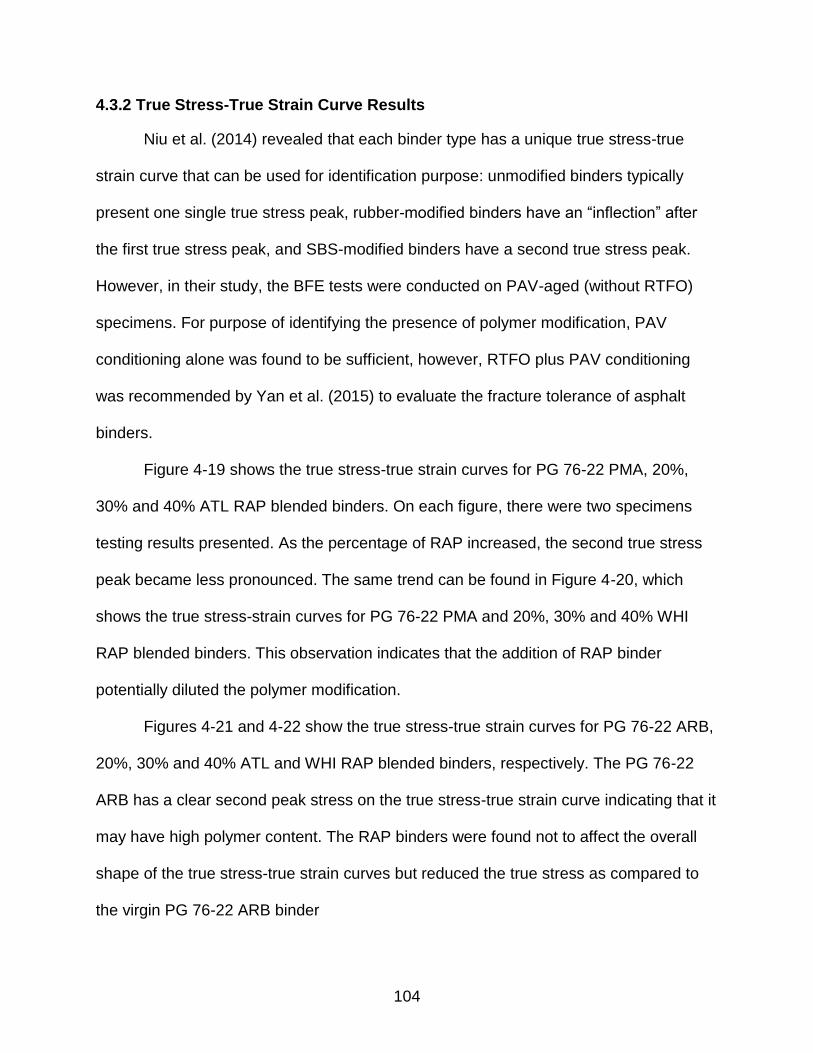
104
4.3.2 True Stress-True Strain Curve Results
Niu et al. (2014) revealed that each binder type has a unique true stress-true
strain curve that can be used for identification purpose: unmodified binders typically
present one single true stress peak, rubber-modified binders have an “inflection” after
the first true stress peak, and SBS-modified binders have a second true stress peak.
However, in their study, the BFE tests were conducted on PAV-aged (without RTFO)
specimens. For purpose of identifying the presence of polymer modification, PAV
conditioning alone was found to be sufficient, however, RTFO plus PAV conditioning
was recommended by Yan et al. (2015) to evaluate the fracture tolerance of asphalt
binders.
Figure 4-19 shows the true stress-true strain curves for PG 76-22 PMA, 20%,
30% and 40% ATL RAP blended binders. On each figure, there were two specimens
testing results presented. As the percentage of RAP increased, the second true stress
peak became less pronounced. The same trend can be found in Figure 4-20, which
shows the true stress-strain curves for PG 76-22 PMA and 20%, 30% and 40% WHI
RAP blended binders. This observation indicates that the addition of RAP binder
potentially diluted the polymer modification.
Figures 4-21 and 4-22 show the true stress-true strain curves for PG 76-22 ARB,
20%, 30% and 40% ATL and WHI RAP blended binders, respectively. The PG 76-22
ARB has a clear second peak stress on the true stress-true strain curve indicating that it
may have high polymer content. The RAP binders were found not to affect the overall
shape of the true stress-true strain curves but reduced the true stress as compared to
the virgin PG 76-22 ARB binder
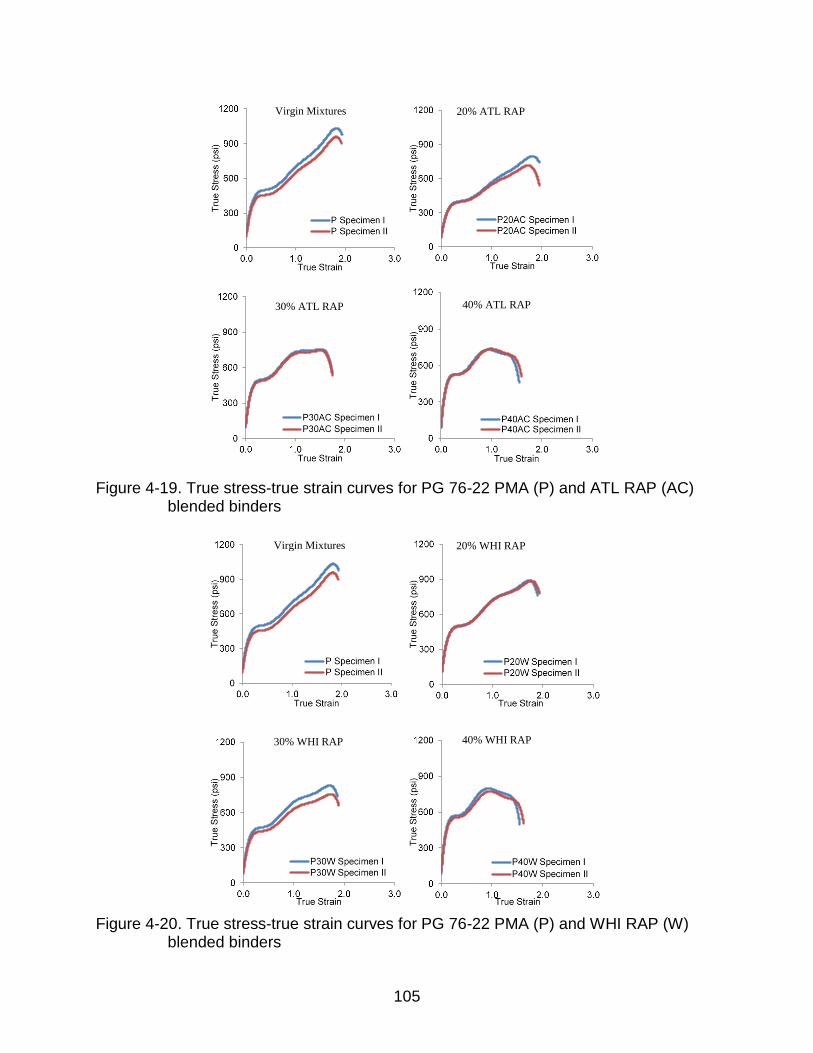
105
Figure 4-19. True stress-true strain curves for PG 76-22 PMA (P) and ATL RAP (AC)
blended binders
Figure 4-20. True stress-true strain curves for PG 76-22 PMA (P) and WHI RAP (W)
blended binders
Virgin Mixtures 20% ATL RAP
30% ATL RAP 40% ATL RAP
Virgin Mixtures 20% WHI RAP
30% WHI RAP 40% WHI RAP
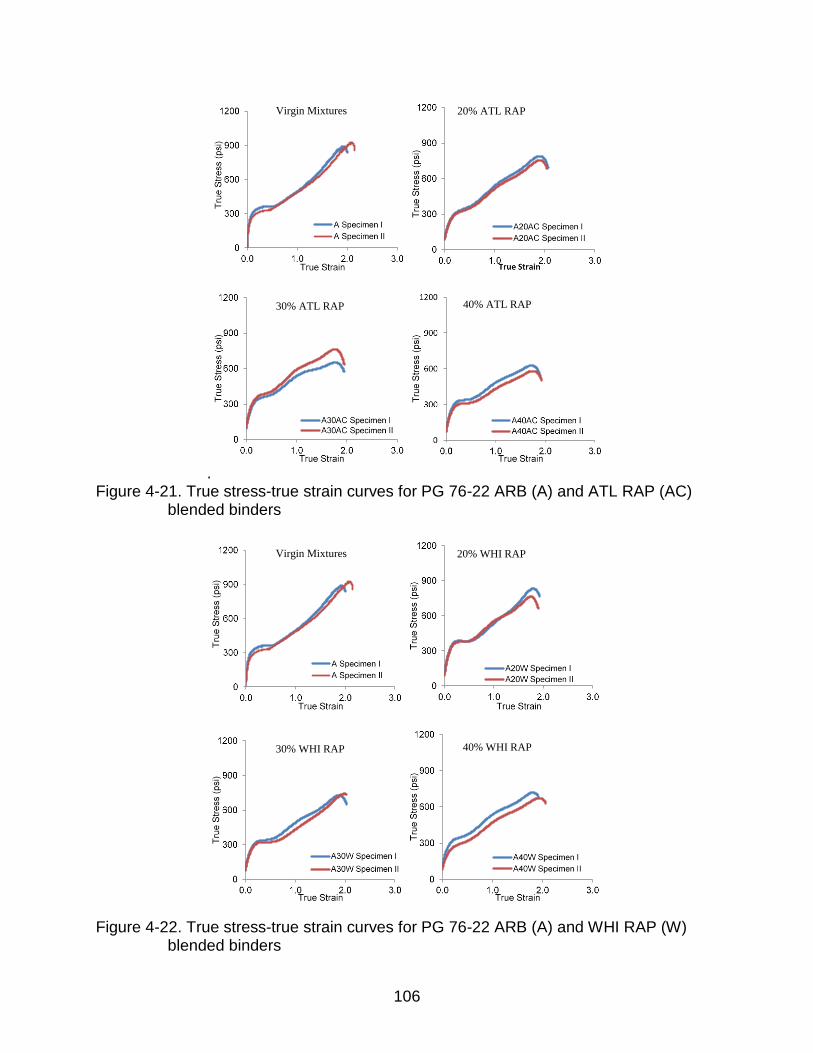
106
. Figure 4-21. True stress-true strain curves for PG 76-22 ARB (A) and ATL RAP (AC)
blended binders
Figure 4-22. True stress-true strain curves for PG 76-22 ARB (A) and WHI RAP (W)
blended binders
Virgin Mixtures 20% ATL RAP
30% ATL RAP 40% ATL RAP
Virgin Mixtures 20% WHI RAP
30% WHI RAP 40% WHI RAP
107
4.4 Closure
To evaluate the effects of RAP on binder properties, laboratory blended binder
specimens were prepared and tested using the Superpave binder tests, the multiple
stress creep recovery (MSCR) test and the BFE test.
All binders including the virgin binders and the blended binders met the
Superpave low, intermediate and high-temperature requirements for virgin modified
binders. The addition of RAP binder increased the stiffness of the virgin binders. The
WHI RAP had more pronounced effect on binder properties than the ATL RAP.
Based on the Jnr, 3.2 results obtained from the MSCR test, the addition of RAP
binder enhanced the rutting resistance of virgin binders. Although RAP binders reduced
the %Recovery of virgin binders, all blended binders, even at 40% RAP content,
exhibited good elastomeric behavior.
BFE tests were conducted to evaluate the cracking resistance of asphalt binders
at an intermediate temperature. Both virgin binders, PG 76-22 PMA and ARB, exhibited
excellent FED. The addition of RAP binders reduced the FED of the PG 76-22 PMA, but
even 40% RAP blended binder retained FED above the reference value range of the
4.5% SBS-modified binder (approximately 600 to 700 psi from previous research). The
addition of RAP binder did not notably reduce the FED of PG 76-22 ARB except for
40% ATL RAP blended binder. Again, the lowest retained FED was greater than the
reference value of the rubber-modified binder (approximately 400 to 500 psi from
previous research).
These binder testing results indicate that use of up to 40% RAP was potentially
acceptable. Therefore, mixture test evaluation was performed using up to 40% RAP.
108
CHAPTER 5
MIXTURE TESTING RESULTS
A total of 28 mixture combinations was designed and evaluated to determine the
maximum amount of RAP material allowable in friction courses without jeopardizing
pavement performance. The experimental factors included two RAP sources, four RAP
contents, two virgin binders, and two mixture conditioning levels. Fracture properties
from Superpave IDT tests at 10 °C and the ER parameter derived from HMA-FM were
used to evaluate the relative cracking performance of mixtures with various RAP
contents. One complete set of Superpave IDT tests consisted of MR, creep compliance,
and fracture tests. For each combination, three IDT specimens were tested, and the
ITLT software was used to reduce and process the testing data. Detailed Superpave
IDT testing data can be found in Appendix F.
Mixture properties determined from the analysis included MR, creep compliance
rate, FED, strength, DCSE, and failure strain. Properties determined after STOA
conditioning provided a quick glance at the general effects of experimental factors on
mixture properties. Roque et al. (2004) determined that the combination of
LTOA+CPPC conditioning most closely represents the effects of long-term changes in
mixture properties observed in the field. They also determined that ER is a better
predictor of cracking-related performance than any other single mixture property.
Therefore, the determination of maximum allowable amount of RAP material was
conducted based on mixture properties at LTOA+CPPC conditioning level using the ER
parameter.
109
5.1 Mixtures Evaluation after STOA Conditioning
Based on Superpave IDT testing results on STOA conditioned specimens, the
following sections discuss the effect of RAP content and RAP characteristics on mixture
properties. Comparisons were also made between same mixtures with different virgin
binder. For clearer presentation, ATL RAP mixtures mixed with PG 76-22 PMA and PG
76-22 ARB were designated as ATL-PMA and ATL-ARB mixtures, respectively.
Similarly, WHI RAP mixtures mixed with PG 76-22 PMA and PG 76-22 ARB were
designated as WHI-PMA and WHI-ARB mixtures, respectively.
5.1.1 Atlantic Coastal (ATL) RAP Mixtures
Figures 5-1 and 5-2 show that tensile strength slightly increased and failure strain
decreased as the RAP content increased. The overall effect of these trends was a
reduction in FED as ATL RAP content increased, as shown in Figure 5-3. Interestingly,
the clear reduction in failure strain and FE gradually slowed down when more than 20%
of ATL RAP was introduced. In general, mixtures with PG 76-22 ARB had lower tensile
strength, higher failure strain, and slightly higher FED than mixtures with PG
76-22 PMA.
Figure 5-4 depicts the resilient modulus increased as ATL RAP content
increased indicating that addition of ATL RAP content stiffened the virgin mixtures. As
shown in Figure 5-5, the creep compliance rate decreased as RAP content increased,
which was expected as compliance is related to stiffness at longer loading time. It was
also observed that mixtures with PG 76-22 PMA consistently had lower creep
compliance rate than mixtures with PG 76-22 ARB.
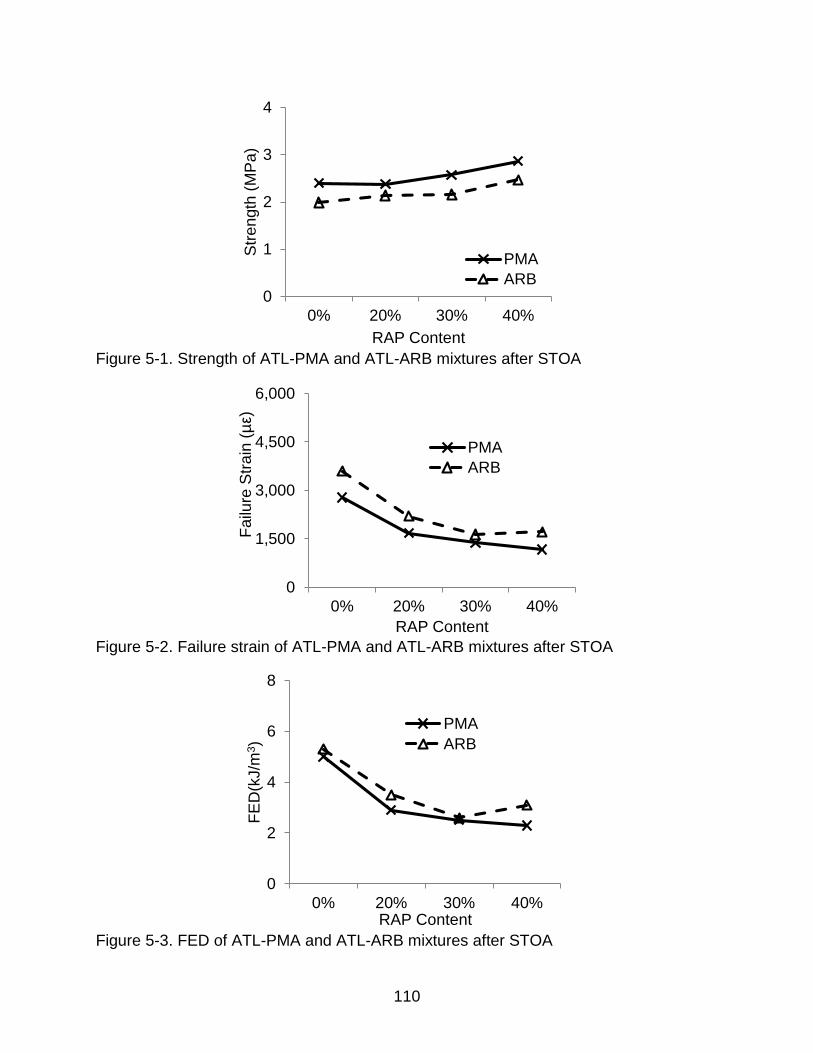
110
Figure 5-1. Strength of ATL-PMA and ATL-ARB mixtures after STOA
Figure 5-2. Failure strain of ATL-PMA and ATL-ARB mixtures after STOA
Figure 5-3. FED of ATL-PMA and ATL-ARB mixtures after STOA
0
1
2
3
4
0% 20% 30% 40%
Str
en
gth
(M
Pa
)
RAP Content
PMA
ARB
0
1,500
3,000
4,500
6,000
0% 20% 30% 40%
Fa
ilure
Str
ain
(µ
ε)
RAP Content
PMA
ARB
0
2
4
6
8
0% 20% 30% 40%
FE
D(k
J/m
3)
RAP Content
PMA
ARB
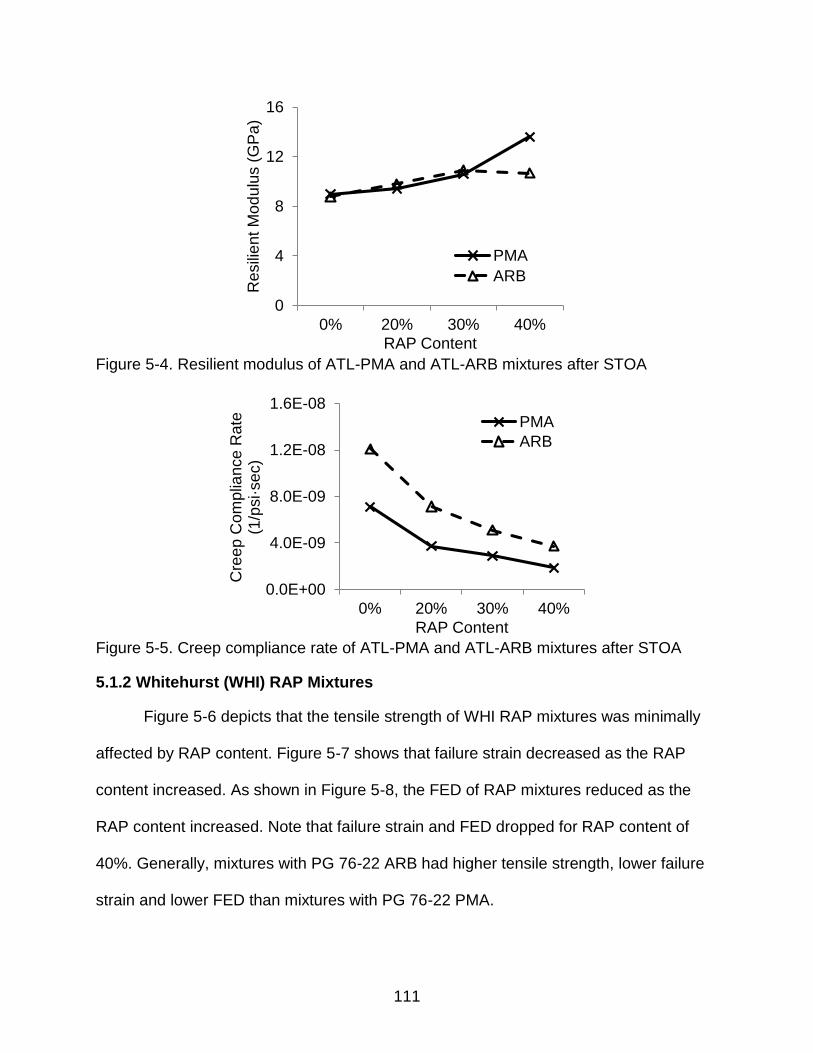
111
Figure 5-4. Resilient modulus of ATL-PMA and ATL-ARB mixtures after STOA
Figure 5-5. Creep compliance rate of ATL-PMA and ATL-ARB mixtures after STOA
5.1.2 Whitehurst (WHI) RAP Mixtures
Figure 5-6 depicts that the tensile strength of WHI RAP mixtures was minimally
affected by RAP content. Figure 5-7 shows that failure strain decreased as the RAP
content increased. As shown in Figure 5-8, the FED of RAP mixtures reduced as the
RAP content increased. Note that failure strain and FED dropped for RAP content of
40%. Generally, mixtures with PG 76-22 ARB had higher tensile strength, lower failure
strain and lower FED than mixtures with PG 76-22 PMA.
0
4
8
12
16
0% 20% 30% 40%
Resili
en
t M
od
ulu
s (
GP
a)
RAP Content
PMA
ARB
0.0E+00
4.0E-09
8.0E-09
1.2E-08
1.6E-08
0% 20% 30% 40%
Cre
ep
Com
plia
nce
Rate
(1
/psi·se
c)
RAP Content
PMA
ARB
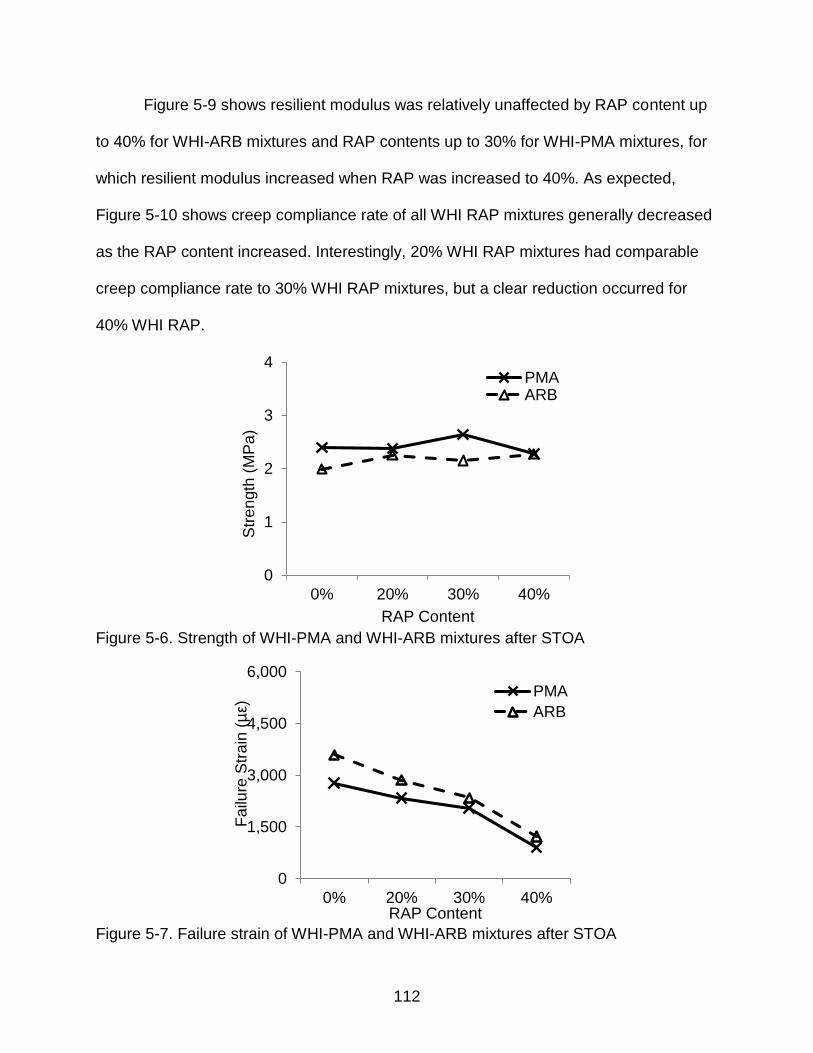
112
Figure 5-9 shows resilient modulus was relatively unaffected by RAP content up
to 40% for WHI-ARB mixtures and RAP contents up to 30% for WHI-PMA mixtures, for
which resilient modulus increased when RAP was increased to 40%. As expected,
Figure 5-10 shows creep compliance rate of all WHI RAP mixtures generally decreased
as the RAP content increased. Interestingly, 20% WHI RAP mixtures had comparable
creep compliance rate to 30% WHI RAP mixtures, but a clear reduction occurred for
40% WHI RAP.
Figure 5-6. Strength of WHI-PMA and WHI-ARB mixtures after STOA
Figure 5-7. Failure strain of WHI-PMA and WHI-ARB mixtures after STOA
0
1
2
3
4
0% 20% 30% 40%
Str
en
gth
(M
Pa
)
RAP Content
PMAARB
0
1,500
3,000
4,500
6,000
0% 20% 30% 40%
Fa
ilure
Str
ain
(µ
ε)
RAP Content
PMA
ARB
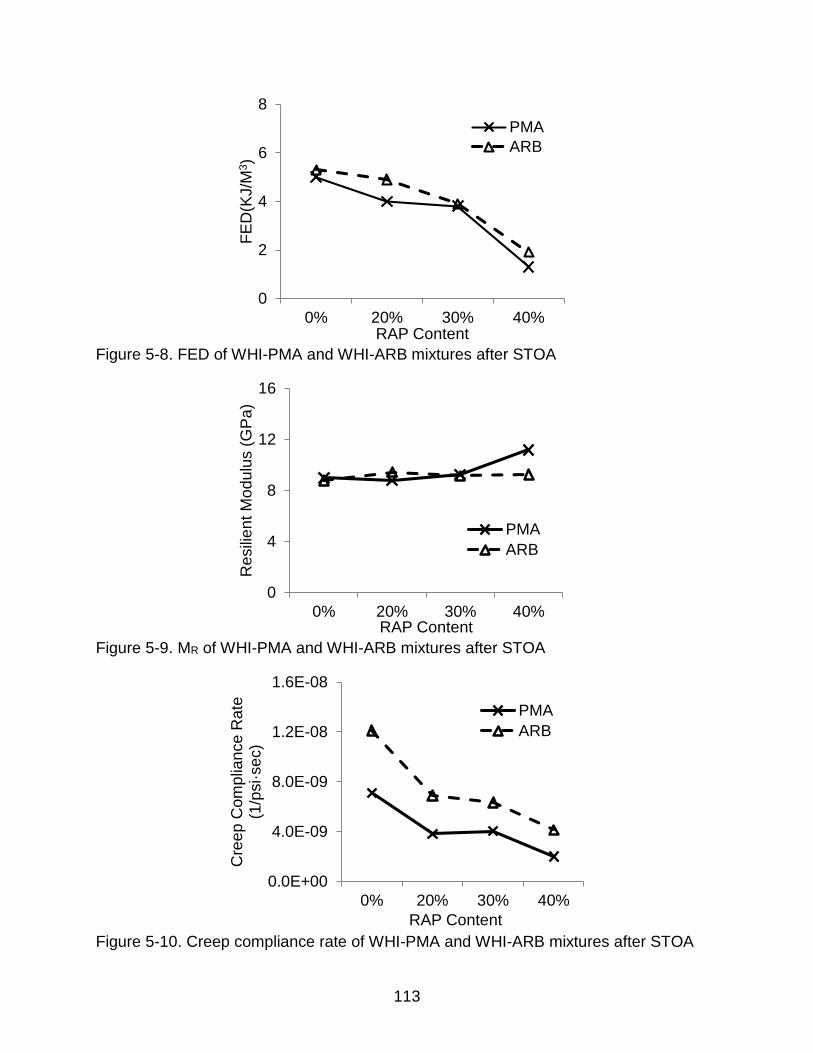
113
Figure 5-8. FED of WHI-PMA and WHI-ARB mixtures after STOA
Figure 5-9. MR of WHI-PMA and WHI-ARB mixtures after STOA
Figure 5-10. Creep compliance rate of WHI-PMA and WHI-ARB mixtures after STOA
0
2
4
6
8
0% 20% 30% 40%
FE
D(K
J/M
3)
RAP Content
PMA
ARB
0
4
8
12
16
0% 20% 30% 40%
Resili
en
t M
od
ulu
s (
GP
a)
RAP Content
PMA
ARB
0.0E+00
4.0E-09
8.0E-09
1.2E-08
1.6E-08
0% 20% 30% 40%
Cre
ep
Com
plia
nce
Ra
te
(1/p
si·se
c)
RAP Content
PMA
ARB

114
5.1.3 Comparison between ATL RAP and WHI RAP Mixtures
Based on mixture properties obtained at STOA conditioning level, comparisons
were made between ATL RAP and WHI RAP mixtures. Figure 5-11 presents a complete
set of tensile strength data for all mixtures. PMA results were presented on the left side
and ARB results on the right. Regardless of virgin binder type, ATL RAP mixtures
generally had similar tensile strength to WHI RAP mixtures up to 30%RAP content.
However, 40% ATL RAP mixtures yield higher tensile strength than 40% WHI RAP
mixtures and the difference was more pronounced for PG 76-22 PMA mixtures than for
those with PG 76-22 ARB.
Figures 5-12 and 5-13 illustrate how RAP gradation can have a dominant effect
on failure strain and FED. For both PMA and ARB binder, the coarser WHI RAP had
higher failure strain and FED for RAP contents up to 30%. As shown in Figure 5-14,
WHI RAP was very coarse with 72% of its aggregate retained on the 4.75 mm sieve,
while the ATL-RAP was much finer with 75% passing the 4.75 mm sieve.
Consequently, the virgin portion of the WHI RAP mixture was relatively fine, while the
virgin portion of the ATL RAP was relatively coarse. Since failure strain and FED are
primarily controlled by the finer portion of the mixture, mixtures with virgin finer
aggregate (e.g., WHI RAP mixture) were expected to have higher failure strain and
FED.
However, Figures 5-12 and 5-13 also show this trend was dramatically reversed
at 40% RAP content where the failure strain and FED of the WHI RAP mixture dropped
below that of the ATL RAP mixture. It appears the amount of coarse weak limestone in
the WHI RAP was enough to become the dominant factor in mixture failure strain and
FED. Figure 5-15 shows the limestone RAP aggregate in the WHI RAP makes up
115
almost 100% of the RAP mixture aggregate retained on the 4.75 mm sieve. This effect
appeared to overwhelm the positive effects of having virgin finer RAP observed in WHI
RAP mixtures with RAP levels up to 30%.
The resilient modulus results presented in Figure 5-16 substantiate that the
reduction in FED observed at 40% RAP for the WHI RAP resulted primarily from the
weakness of the limestone in the RAP. Since resilient modulus is a small strain
response parameter, it is unaffected by strength or brittleness of rock and is primarily a
reflection of the stiffness of the finer portion of the mixture. So, as expected, resilient
modulus was lower for the WHI RAP mixtures because the finer portion of these
mixtures was primarily virgin aggregate. This trend was observed even at the 40% RAP
level.
Creep compliance, on the other hand, is a larger strain response parameter
affected by all components of the mixture. Consequently, the effect of RAP level on
creep compliance rate was almost the same for the ATL and WHI RAP mixtures (Figure
5-17). Explained in another way, whereas small strain response associated with
resilient modulus was primarily affected by the finer portion of mixtures, creep
compliance rate was also affected by the coarser portion. Therefore, the stiffer and
coarser WHI RAP counterbalanced the effect of the lower stiffness of the virgin finer
portion. Figure 5-17 also shows that PMA binder resulted in lower creep compliance
rate than ARB binder. This observation is consistent with results of all previous
research comparing PMA and ARB mixtures.
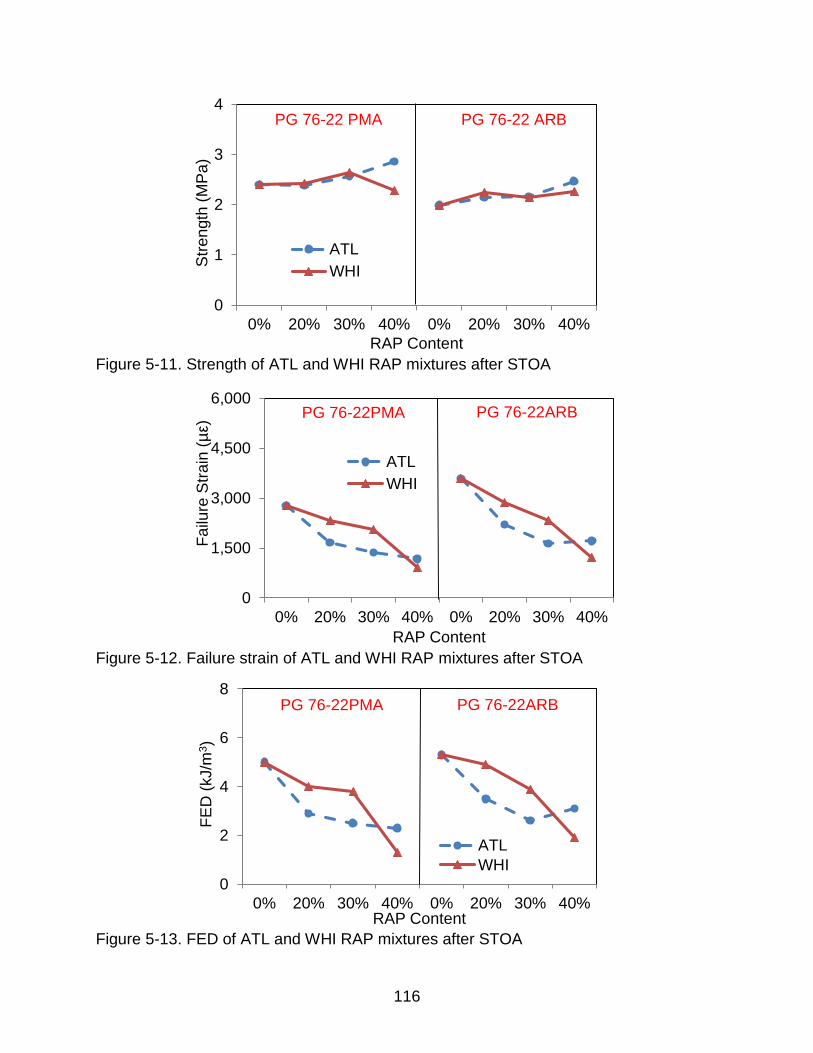
116
Figure 5-11. Strength of ATL and WHI RAP mixtures after STOA
Figure 5-12. Failure strain of ATL and WHI RAP mixtures after STOA
Figure 5-13. FED of ATL and WHI RAP mixtures after STOA
0
1
2
3
4
0% 20% 30% 40% 0% 20% 30% 40%
Str
en
gth
(M
Pa
)
RAP Content
ATL
WHI
0
1,500
3,000
4,500
6,000
0% 20% 30% 40% 0% 20% 30% 40%
Fa
ilure
Str
ain
(µ
ε)
RAP Content
ATL
WHI
PG 76-22PMA PG 76-22ARB
0
2
4
6
8
0% 20% 30% 40% 0% 20% 30% 40%
FE
D (
kJ/m
3)
RAP Content
ATL
WHI
PG 76-22PMA PG 76-22ARB
PG 76-22 PMA PG 76-22 ARB

117
Figure 5-14. RAP “White curve” and reference mixture gradation
Figure 5-15. Aggregate component of 40% WHI RAP mixture (Photo courtesy of
author.)
19
12.5
9.5
4.7
5
2.3
6
0.0
75
0.1
5
0.3
0.6
1.1
8
0
20
40
60
80
100
Atlantic Coast RAP (White Curve)
Whihurst RAP (White Curve)
FC-12.5 Reference Mixture
Sieve Size (Raised to 0.45 Power), mm
Pe
rce
nt P
assin
g (
%)
0
5
10
15
20
25
0.075 0.15 0.3 0.6 1.18 2.36 4.75 9.5 12.5 19
Pe
rce
nt R
eta
inin
g (
%)
Sieve Size (Raised to 0.45 Power), mm
Virgin aggregate
RAP aggregate
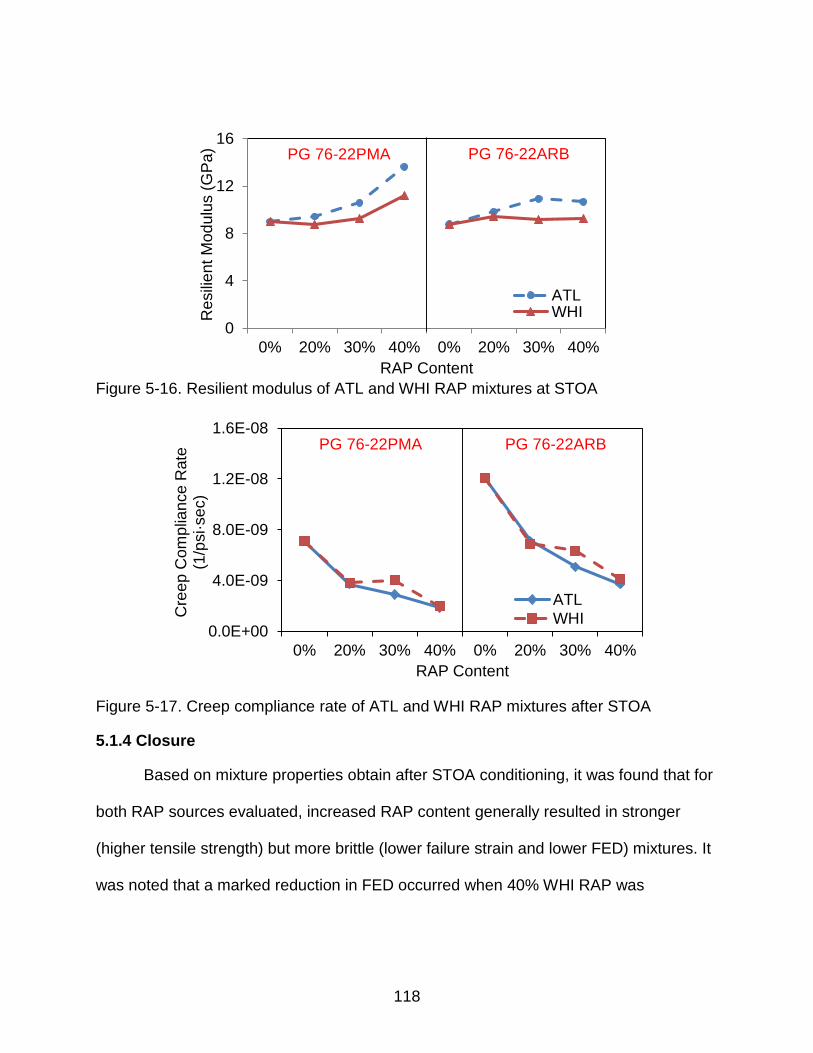
118
Figure 5-16. Resilient modulus of ATL and WHI RAP mixtures at STOA
Figure 5-17. Creep compliance rate of ATL and WHI RAP mixtures after STOA
5.1.4 Closure
Based on mixture properties obtain after STOA conditioning, it was found that for
both RAP sources evaluated, increased RAP content generally resulted in stronger
(higher tensile strength) but more brittle (lower failure strain and lower FED) mixtures. It
was noted that a marked reduction in FED occurred when 40% WHI RAP was
0
4
8
12
16
0% 20% 30% 40% 0% 20% 30% 40%
Resili
en
t M
od
ulu
s (
GP
a)
RAP Content
ATLWHI
0.0E+00
4.0E-09
8.0E-09
1.2E-08
1.6E-08
0% 20% 30% 40% 0% 20% 30% 40%
Cre
ep
Com
plia
nce
Rate
(1
/psi·se
c)
RAP Content
ATL
WHI
PG 76-22PMA PG 76-22ARB
PG 76-22PMA PG 76-22ARB

119
introduced, which was attributed to the natural weakness of coarse limestone aggregate
in this particular RAP source.
Effects of RAP gradation and virgin binder type were evident. Coarser WHI RAP
generally resulted in higher FED (except at 40% RAP content where limestone
aggregate weakness controlled FED) and lower resilient modulus than finer ATL RAP
because the coarser RAP mixture required introduction of finer virgin aggregate that
controls these two properties. RAP gradation effect was not observed in creep
compliance rate results. PMA resulted in lower rate of damage (creep compliance) but
lower FED than ARB. The PMA appears to result in a more integrated binder that better
resists permanent deformation. It was hypothesized that the less integrated ARB binder
has more asphalt that is free to blend with RAP binder, which resulted in the less brittle,
higher FED mixture.
5.2 Mixture Evaluation after LTOA+CPPC Conditioning
Roque et al. (2013) found that the combination of oxidative aging and cyclic pore
water pressure (i.e., LTOA+CPPC) is a viable approach to simulate mixture property
changes to levels observed in the field. Properties determined after LTOA+CPPC
conditioning procedure provided the clearest opportunity to evaluate the effects of RAP
on mixture durability (i.e., changes in mixture fracture properties with time).
5.2.1 Atlantic Coastal (ATL) RAP Mixtures
As shown in Figure 5-18, LTOA+CPPC increased the tensile strength of all RAP
mixtures, except for 40% ATL-PMA mixture. Failure strain of all mixtures decreased
after LTOA+CPPC (Figure 5-19). In general, the combined effect of LTOA+CPPC was a
reduction in FED of all mixtures (Figure 5-20), which seems to indicates that all mixtures
were stiffened (mainly by LTOA) and permanently damaged (by CPPC) during
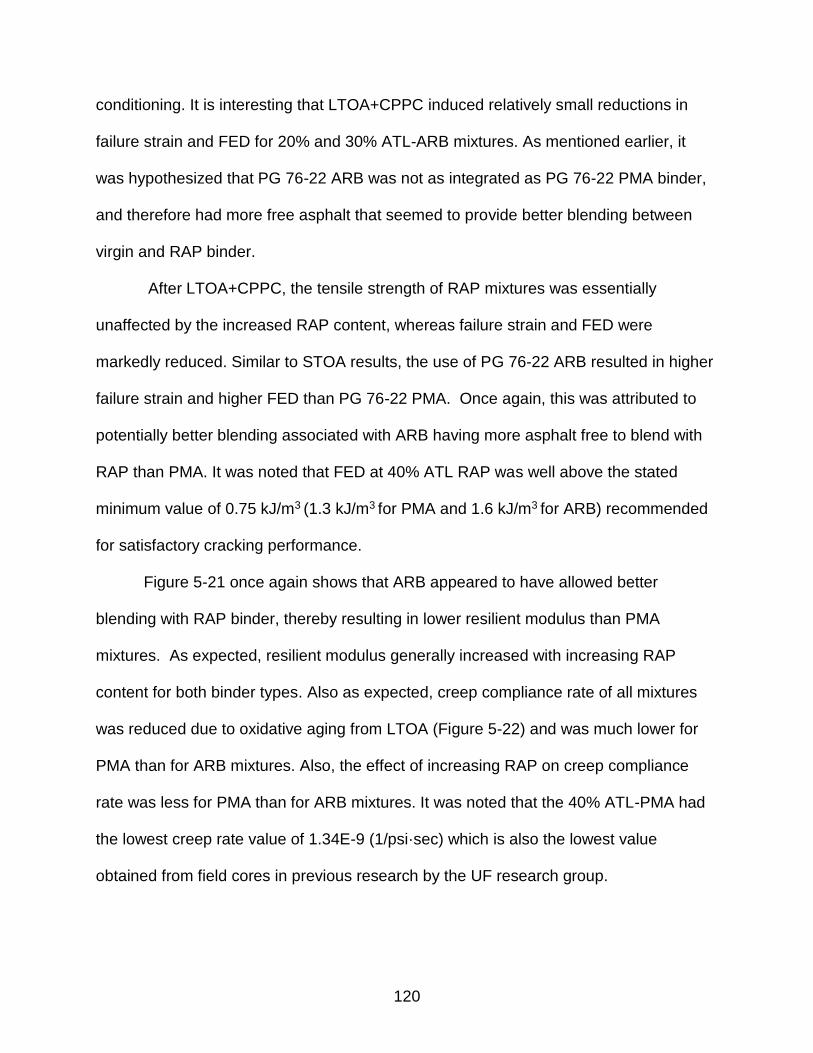
120
conditioning. It is interesting that LTOA+CPPC induced relatively small reductions in
failure strain and FED for 20% and 30% ATL-ARB mixtures. As mentioned earlier, it
was hypothesized that PG 76-22 ARB was not as integrated as PG 76-22 PMA binder,
and therefore had more free asphalt that seemed to provide better blending between
virgin and RAP binder.
After LTOA+CPPC, the tensile strength of RAP mixtures was essentially
unaffected by the increased RAP content, whereas failure strain and FED were
markedly reduced. Similar to STOA results, the use of PG 76-22 ARB resulted in higher
failure strain and higher FED than PG 76-22 PMA. Once again, this was attributed to
potentially better blending associated with ARB having more asphalt free to blend with
RAP than PMA. It was noted that FED at 40% ATL RAP was well above the stated
minimum value of 0.75 kJ/m3 (1.3 kJ/m3 for PMA and 1.6 kJ/m3 for ARB) recommended
for satisfactory cracking performance.
Figure 5-21 once again shows that ARB appeared to have allowed better
blending with RAP binder, thereby resulting in lower resilient modulus than PMA
mixtures. As expected, resilient modulus generally increased with increasing RAP
content for both binder types. Also as expected, creep compliance rate of all mixtures
was reduced due to oxidative aging from LTOA (Figure 5-22) and was much lower for
PMA than for ARB mixtures. Also, the effect of increasing RAP on creep compliance
rate was less for PMA than for ARB mixtures. It was noted that the 40% ATL-PMA had
the lowest creep rate value of 1.34E-9 (1/psi·sec) which is also the lowest value
obtained from field cores in previous research by the UF research group.
121
Figure 5-18. Strength of ATL RAP mixtures at two conditioning levels
Figure 5-19. Failure strain of ATL RAP mixtures at two conditioning levels
Figure 5-20. FED of ATL RAP mixtures at two conditioning levels
0
1
2
3
4
0% 20% 30% 40% 0% 20% 30% 40%
Str
en
gth
(M
Pa
)
RAP Content
STOA
LTOA+CPPC
0
1500
3000
4500
0% 20% 30% 40% 0% 20% 30% 40%
Fa
ilure
Str
ain
(µ
ε)
RAP Content
STOA
LTOA+CPPC
PG 76-22 PMA PG 76-22 ARB
0
2
4
6
8
0% 20% 30% 40% 0% 20% 30% 40%
FE
D (
kJ/m
3)
RAP Content
STOALTOA+CPPC
PG 76-22 PMA PG 76-22 ARB
PG 76-22 PMA PG 76-22 ARB
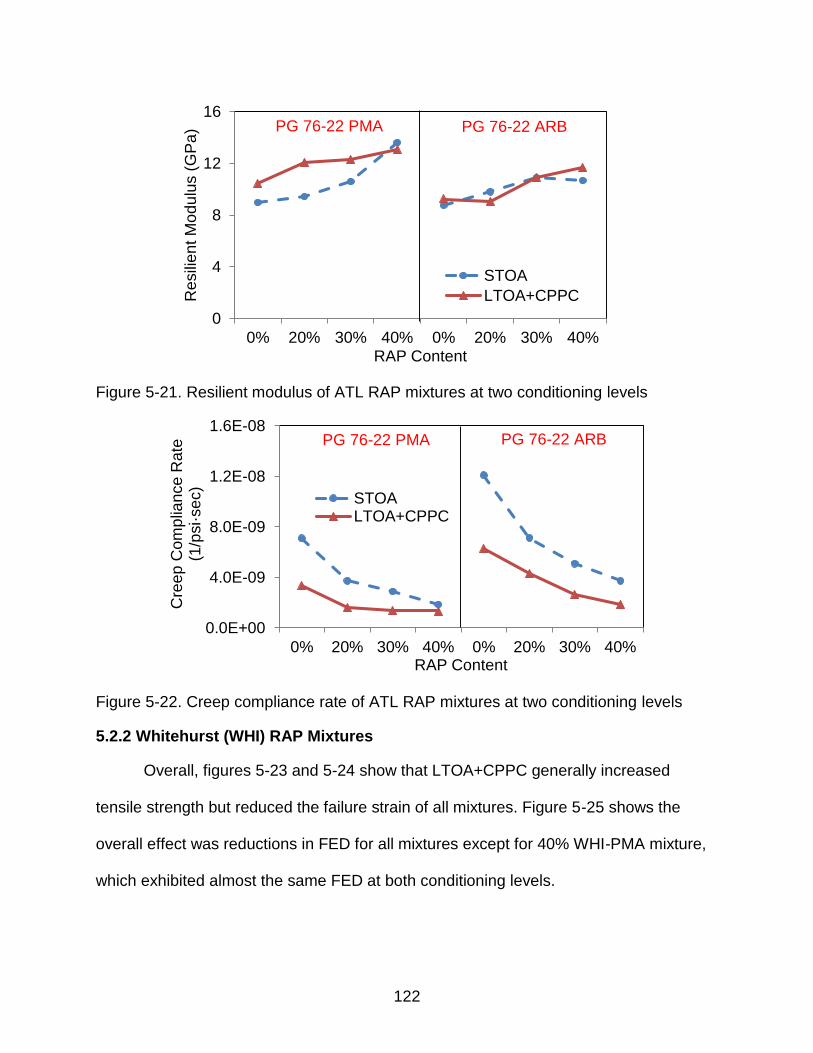
122
Figure 5-21. Resilient modulus of ATL RAP mixtures at two conditioning levels
Figure 5-22. Creep compliance rate of ATL RAP mixtures at two conditioning levels
5.2.2 Whitehurst (WHI) RAP Mixtures
Overall, figures 5-23 and 5-24 show that LTOA+CPPC generally increased
tensile strength but reduced the failure strain of all mixtures. Figure 5-25 shows the
overall effect was reductions in FED for all mixtures except for 40% WHI-PMA mixture,
which exhibited almost the same FED at both conditioning levels.
0
4
8
12
16
0% 20% 30% 40% 0% 20% 30% 40%
Resili
en
t M
od
ulu
s (
GP
a)
RAP Content
STOA
LTOA+CPPC
0.0E+00
4.0E-09
8.0E-09
1.2E-08
1.6E-08
0% 20% 30% 40% 0% 20% 30% 40%
Cre
ep
Com
plia
nce
Rate
(1
/psi·se
c)
RAP Content
STOALTOA+CPPC
PG 76-22 PMA PG 76-22 ARB
PG 76-22 PMA PG 76-22 ARB
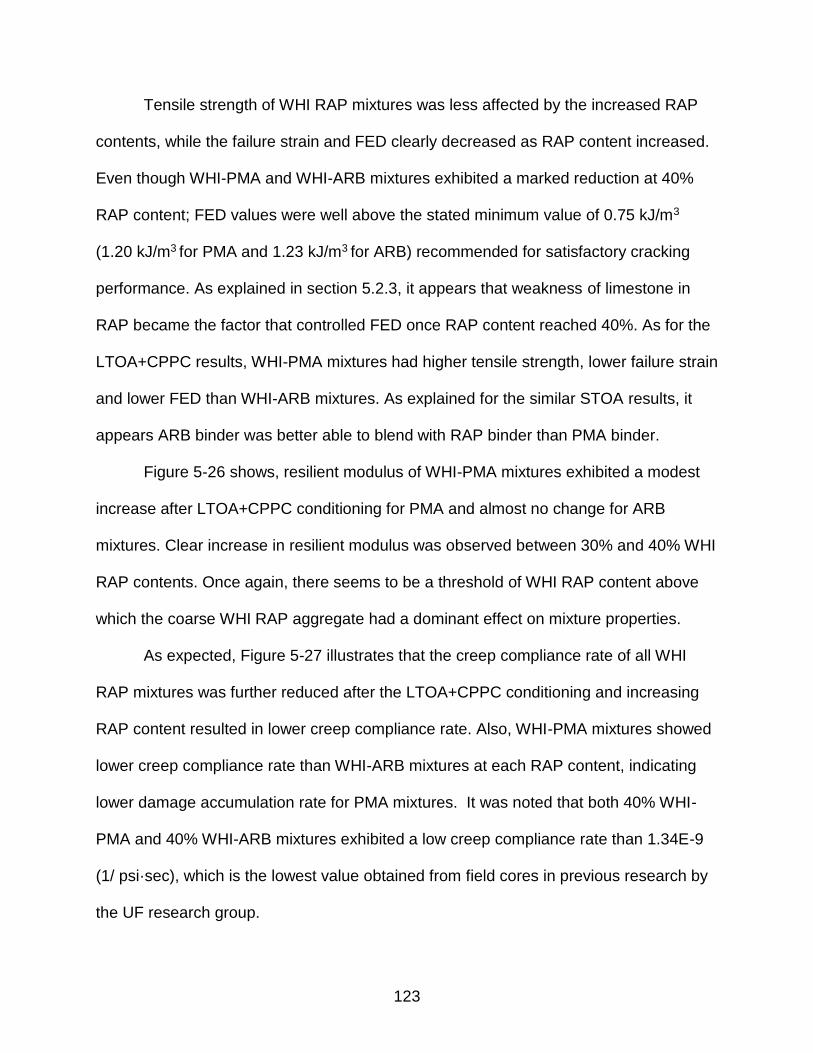
123
Tensile strength of WHI RAP mixtures was less affected by the increased RAP
contents, while the failure strain and FED clearly decreased as RAP content increased.
Even though WHI-PMA and WHI-ARB mixtures exhibited a marked reduction at 40%
RAP content; FED values were well above the stated minimum value of 0.75 kJ/m3
(1.20 kJ/m3 for PMA and 1.23 kJ/m3 for ARB) recommended for satisfactory cracking
performance. As explained in section 5.2.3, it appears that weakness of limestone in
RAP became the factor that controlled FED once RAP content reached 40%. As for the
LTOA+CPPC results, WHI-PMA mixtures had higher tensile strength, lower failure strain
and lower FED than WHI-ARB mixtures. As explained for the similar STOA results, it
appears ARB binder was better able to blend with RAP binder than PMA binder.
Figure 5-26 shows, resilient modulus of WHI-PMA mixtures exhibited a modest
increase after LTOA+CPPC conditioning for PMA and almost no change for ARB
mixtures. Clear increase in resilient modulus was observed between 30% and 40% WHI
RAP contents. Once again, there seems to be a threshold of WHI RAP content above
which the coarse WHI RAP aggregate had a dominant effect on mixture properties.
As expected, Figure 5-27 illustrates that the creep compliance rate of all WHI
RAP mixtures was further reduced after the LTOA+CPPC conditioning and increasing
RAP content resulted in lower creep compliance rate. Also, WHI-PMA mixtures showed
lower creep compliance rate than WHI-ARB mixtures at each RAP content, indicating
lower damage accumulation rate for PMA mixtures. It was noted that both 40% WHI-
PMA and 40% WHI-ARB mixtures exhibited a low creep compliance rate than 1.34E-9
(1/ psi·sec), which is the lowest value obtained from field cores in previous research by
the UF research group.
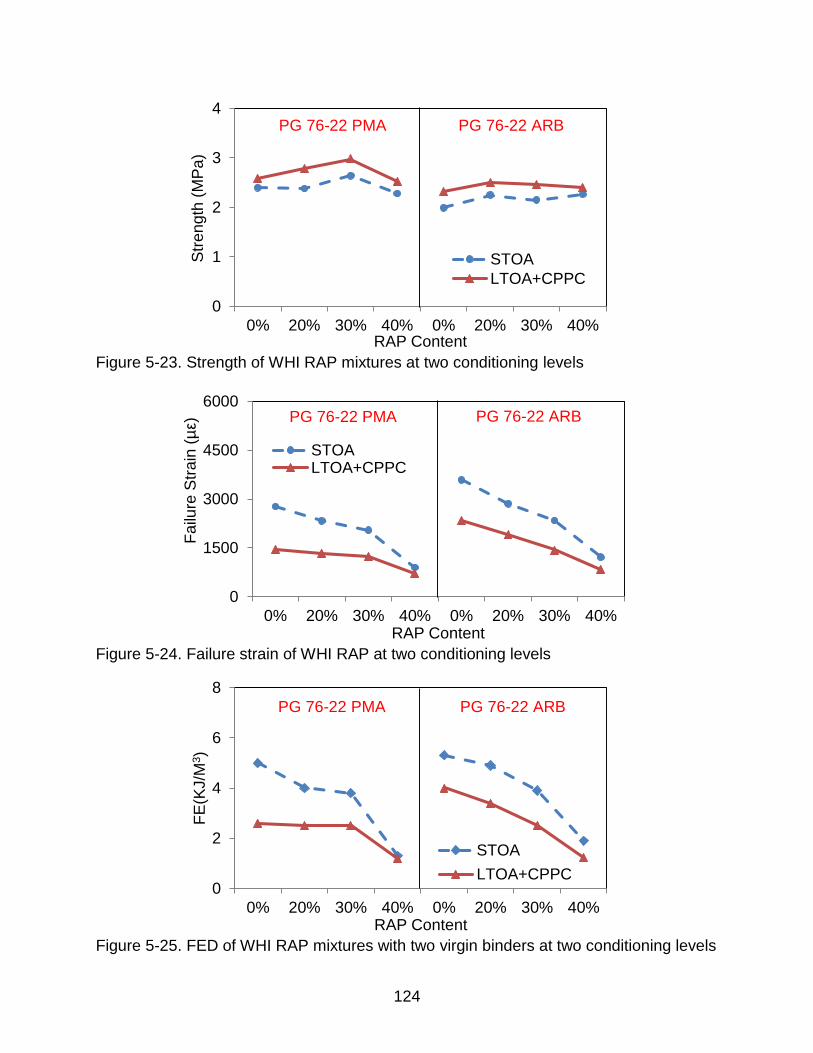
124
Figure 5-23. Strength of WHI RAP mixtures at two conditioning levels
Figure 5-24. Failure strain of WHI RAP at two conditioning levels
Figure 5-25. FED of WHI RAP mixtures with two virgin binders at two conditioning levels
0
1
2
3
4
0% 20% 30% 40% 0% 20% 30% 40%
Str
en
gth
(M
Pa
)
RAP Content
STOA
LTOA+CPPC
0
1500
3000
4500
6000
0% 20% 30% 40% 0% 20% 30% 40%
Fa
ilure
Str
ain
(µ
ε)
RAP Content
STOALTOA+CPPC
PG 76-22 PMA PG 76-22 ARB
0
2
4
6
8
0% 20% 30% 40% 0% 20% 30% 40%
FE
(KJ/M
3)
RAP Content
STOA
LTOA+CPPC
PG 76-22 PMA PG 76-22 ARB
PG 76-22 PMA PG 76-22 ARB
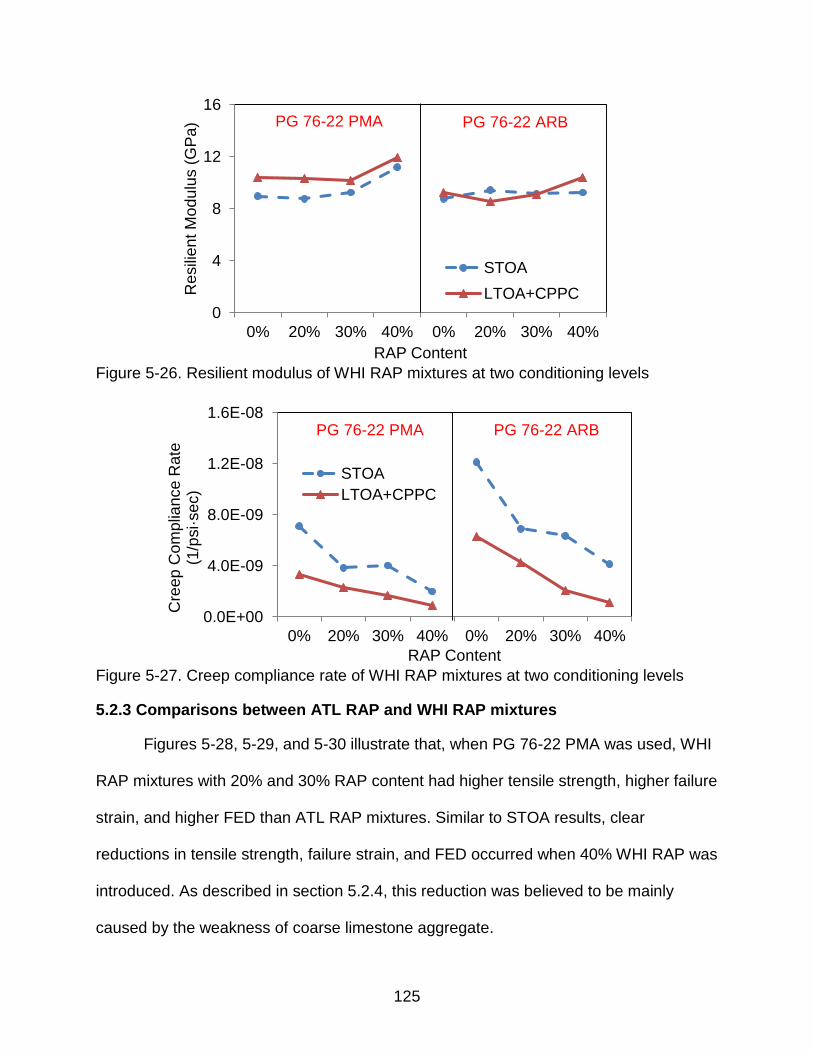
125
Figure 5-26. Resilient modulus of WHI RAP mixtures at two conditioning levels
Figure 5-27. Creep compliance rate of WHI RAP mixtures at two conditioning levels
5.2.3 Comparisons between ATL RAP and WHI RAP mixtures
Figures 5-28, 5-29, and 5-30 illustrate that, when PG 76-22 PMA was used, WHI
RAP mixtures with 20% and 30% RAP content had higher tensile strength, higher failure
strain, and higher FED than ATL RAP mixtures. Similar to STOA results, clear
reductions in tensile strength, failure strain, and FED occurred when 40% WHI RAP was
introduced. As described in section 5.2.4, this reduction was believed to be mainly
caused by the weakness of coarse limestone aggregate.
0
4
8
12
16
0% 20% 30% 40% 0% 20% 30% 40%
Resili
en
t M
od
ulu
s (
GP
a)
RAP Content
STOA
LTOA+CPPC
0.0E+00
4.0E-09
8.0E-09
1.2E-08
1.6E-08
0% 20% 30% 40% 0% 20% 30% 40%
Cre
ep
Com
plia
nce
Rate
(1
/psi·se
c)
RAP Content
STOA
LTOA+CPPC
PG 76-22 PMA PG 76-22 ARB
PG 76-22 PMA PG 76-22 ARB
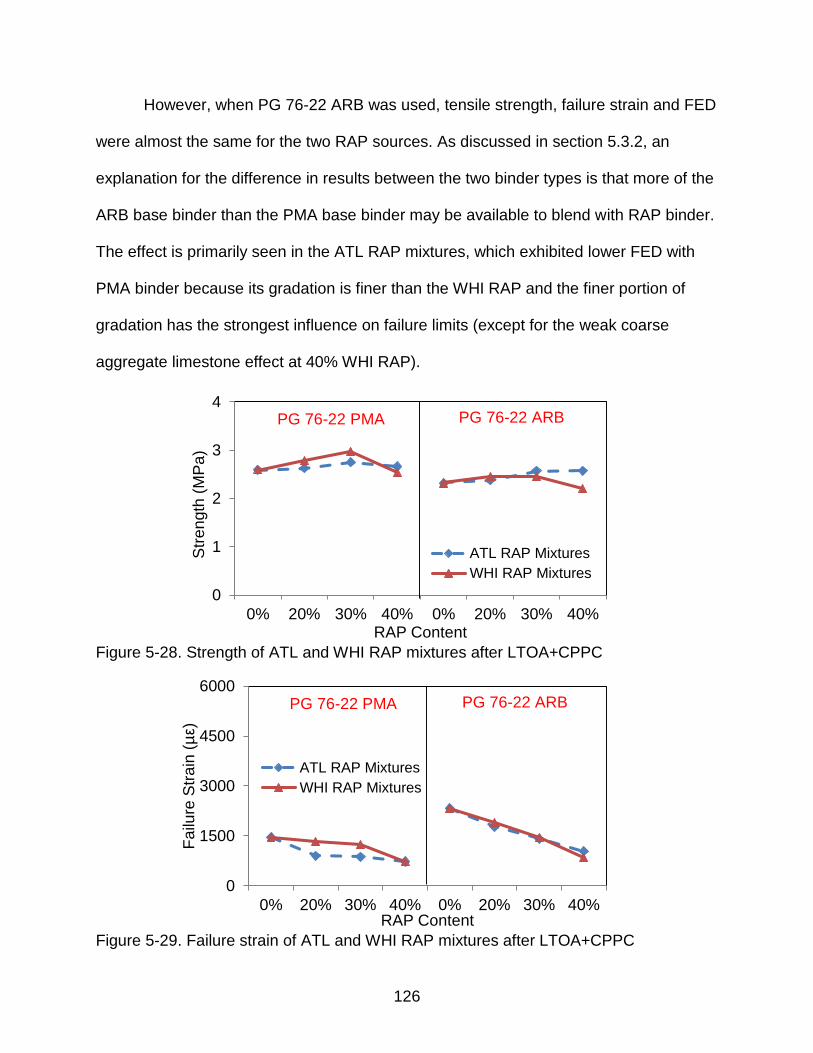
126
However, when PG 76-22 ARB was used, tensile strength, failure strain and FED
were almost the same for the two RAP sources. As discussed in section 5.3.2, an
explanation for the difference in results between the two binder types is that more of the
ARB base binder than the PMA base binder may be available to blend with RAP binder.
The effect is primarily seen in the ATL RAP mixtures, which exhibited lower FED with
PMA binder because its gradation is finer than the WHI RAP and the finer portion of
gradation has the strongest influence on failure limits (except for the weak coarse
aggregate limestone effect at 40% WHI RAP).
Figure 5-28. Strength of ATL and WHI RAP mixtures after LTOA+CPPC
Figure 5-29. Failure strain of ATL and WHI RAP mixtures after LTOA+CPPC
0
1
2
3
4
0% 20% 30% 40% 0% 20% 30% 40%
Str
en
gth
(M
Pa
)
RAP Content
ATL RAP Mixtures
WHI RAP Mixtures
0
1500
3000
4500
6000
0% 20% 30% 40% 0% 20% 30% 40%
Fa
ilure
Str
ain
(µ
ε)
RAP Content
ATL RAP Mixtures
WHI RAP Mixtures
PG 76-22 PMA PG 76-22 ARB
PG 76-22 PMA PG 76-22 ARB
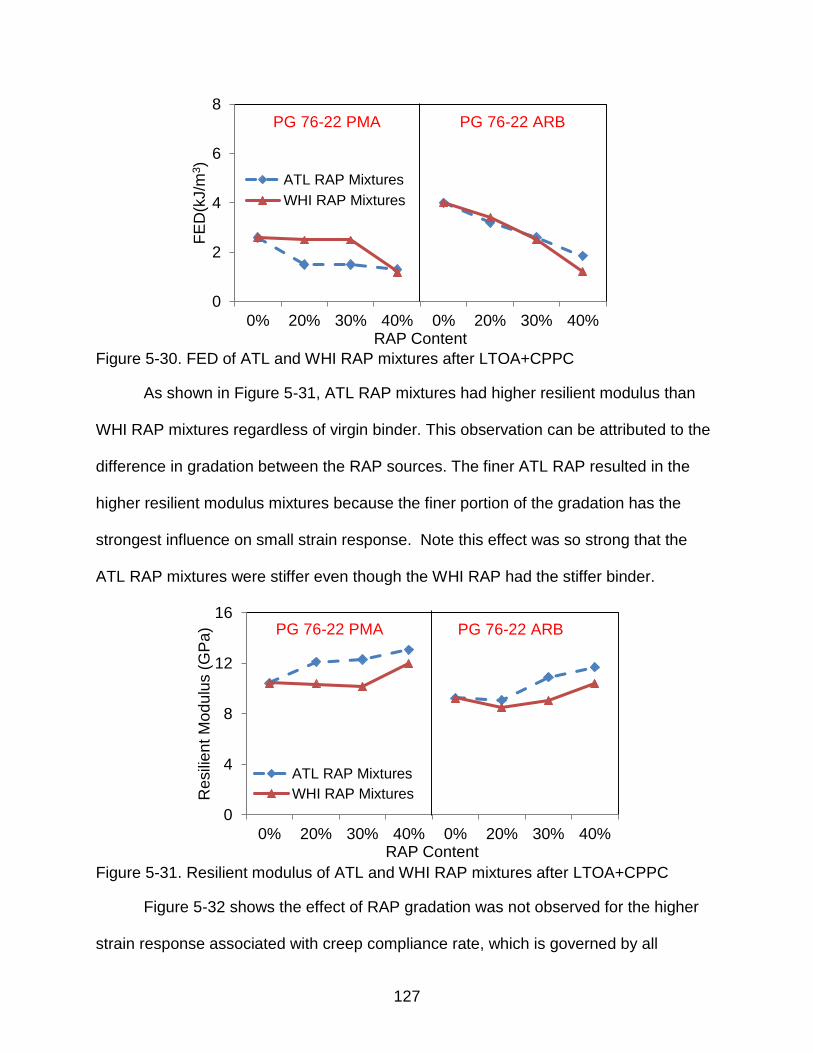
127
Figure 5-30. FED of ATL and WHI RAP mixtures after LTOA+CPPC
As shown in Figure 5-31, ATL RAP mixtures had higher resilient modulus than
WHI RAP mixtures regardless of virgin binder. This observation can be attributed to the
difference in gradation between the RAP sources. The finer ATL RAP resulted in the
higher resilient modulus mixtures because the finer portion of the gradation has the
strongest influence on small strain response. Note this effect was so strong that the
ATL RAP mixtures were stiffer even though the WHI RAP had the stiffer binder.
Figure 5-31. Resilient modulus of ATL and WHI RAP mixtures after LTOA+CPPC
Figure 5-32 shows the effect of RAP gradation was not observed for the higher
strain response associated with creep compliance rate, which is governed by all
0
2
4
6
8
0% 20% 30% 40% 0% 20% 30% 40%
FE
D(k
J/m
3)
RAP Content
ATL RAP Mixtures
WHI RAP Mixtures
0
4
8
12
16
0% 20% 30% 40% 0% 20% 30% 40%
Resili
en
t M
od
ulu
s (
GP
a)
RAP Content
ATL RAP Mixtures
WHI RAP Mixtures
PG 76-22 PMA PG 76-22 ARB
PG 76-22 PMA PG 76-22 ARB
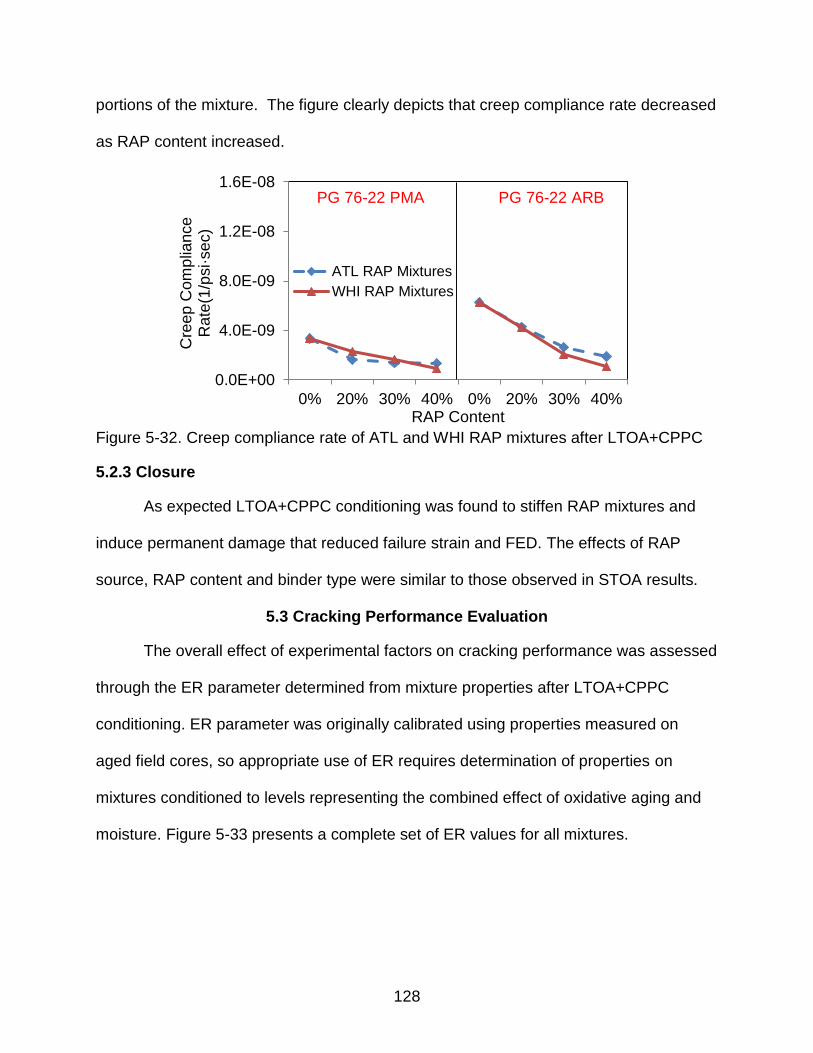
128
portions of the mixture. The figure clearly depicts that creep compliance rate decreased
as RAP content increased.
Figure 5-32. Creep compliance rate of ATL and WHI RAP mixtures after LTOA+CPPC
5.2.3 Closure
As expected LTOA+CPPC conditioning was found to stiffen RAP mixtures and
induce permanent damage that reduced failure strain and FED. The effects of RAP
source, RAP content and binder type were similar to those observed in STOA results.
5.3 Cracking Performance Evaluation
The overall effect of experimental factors on cracking performance was assessed
through the ER parameter determined from mixture properties after LTOA+CPPC
conditioning. ER parameter was originally calibrated using properties measured on
aged field cores, so appropriate use of ER requires determination of properties on
mixtures conditioned to levels representing the combined effect of oxidative aging and
moisture. Figure 5-33 presents a complete set of ER values for all mixtures.
0.0E+00
4.0E-09
8.0E-09
1.2E-08
1.6E-08
0% 20% 30% 40% 0% 20% 30% 40%
Cre
ep
Com
plia
nce
R
ate
(1/p
si·se
c)
RAP Content
ATL RAP Mixtures
WHI RAP Mixtures
PG 76-22 PMA PG 76-22 ARB
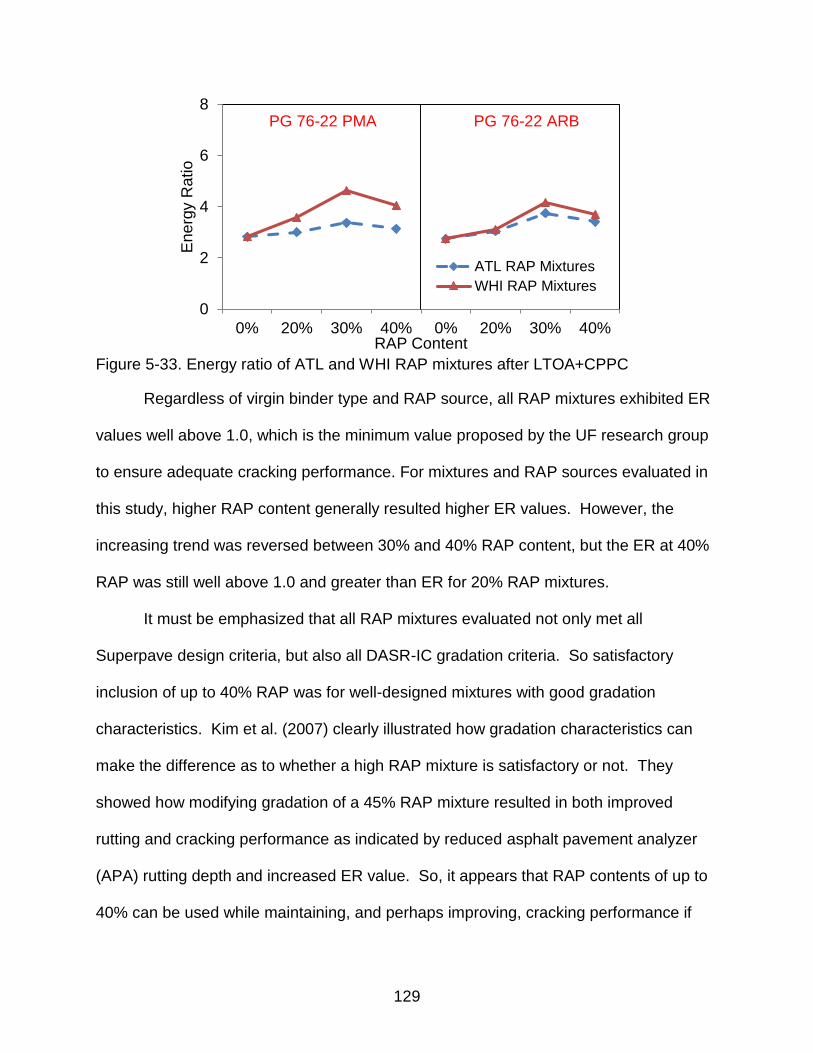
129
Figure 5-33. Energy ratio of ATL and WHI RAP mixtures after LTOA+CPPC
Regardless of virgin binder type and RAP source, all RAP mixtures exhibited ER
values well above 1.0, which is the minimum value proposed by the UF research group
to ensure adequate cracking performance. For mixtures and RAP sources evaluated in
this study, higher RAP content generally resulted higher ER values. However, the
increasing trend was reversed between 30% and 40% RAP content, but the ER at 40%
RAP was still well above 1.0 and greater than ER for 20% RAP mixtures.
It must be emphasized that all RAP mixtures evaluated not only met all
Superpave design criteria, but also all DASR-IC gradation criteria. So satisfactory
inclusion of up to 40% RAP was for well-designed mixtures with good gradation
characteristics. Kim et al. (2007) clearly illustrated how gradation characteristics can
make the difference as to whether a high RAP mixture is satisfactory or not. They
showed how modifying gradation of a 45% RAP mixture resulted in both improved
rutting and cracking performance as indicated by reduced asphalt pavement analyzer
(APA) rutting depth and increased ER value. So, it appears that RAP contents of up to
40% can be used while maintaining, and perhaps improving, cracking performance if
0
2
4
6
8
0% 20% 30% 40% 0% 20% 30% 40%
En
erg
y R
atio
RAP Content
ATL RAP Mixtures
WHI RAP Mixtures
PG 76-22 PMA PG 76-22 ARB
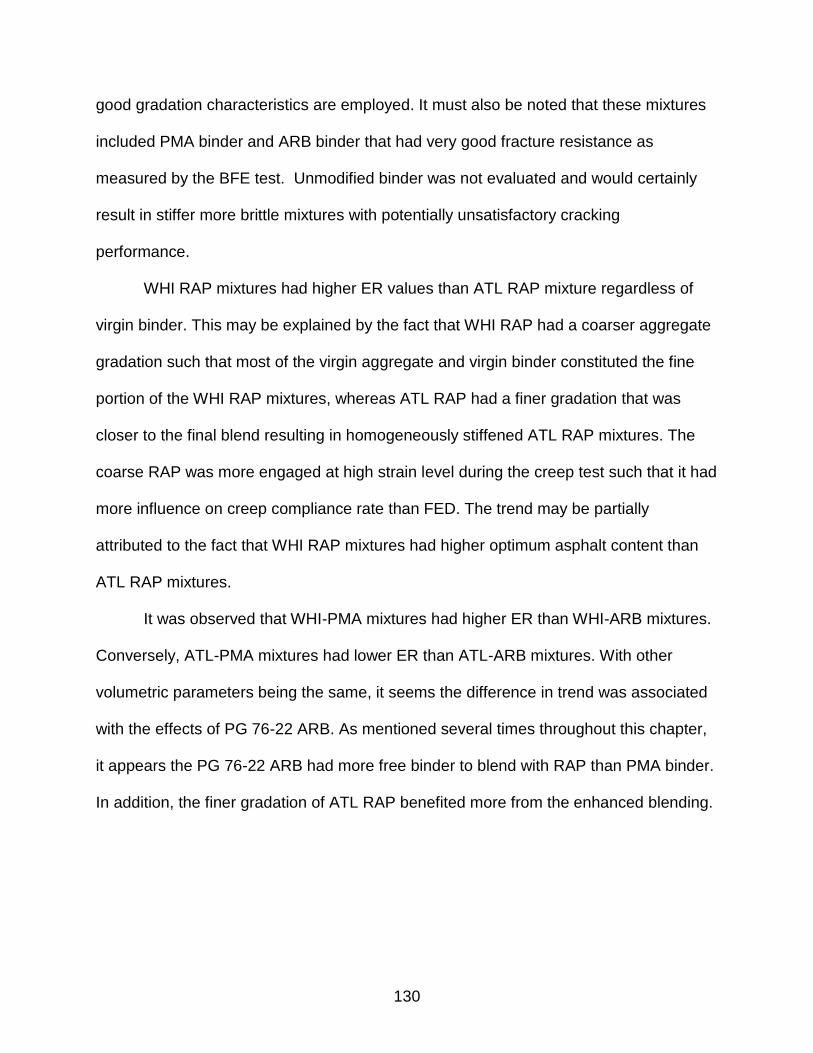
130
good gradation characteristics are employed. It must also be noted that these mixtures
included PMA binder and ARB binder that had very good fracture resistance as
measured by the BFE test. Unmodified binder was not evaluated and would certainly
result in stiffer more brittle mixtures with potentially unsatisfactory cracking
performance.
WHI RAP mixtures had higher ER values than ATL RAP mixture regardless of
virgin binder. This may be explained by the fact that WHI RAP had a coarser aggregate
gradation such that most of the virgin aggregate and virgin binder constituted the fine
portion of the WHI RAP mixtures, whereas ATL RAP had a finer gradation that was
closer to the final blend resulting in homogeneously stiffened ATL RAP mixtures. The
coarse RAP was more engaged at high strain level during the creep test such that it had
more influence on creep compliance rate than FED. The trend may be partially
attributed to the fact that WHI RAP mixtures had higher optimum asphalt content than
ATL RAP mixtures.
It was observed that WHI-PMA mixtures had higher ER than WHI-ARB mixtures.
Conversely, ATL-PMA mixtures had lower ER than ATL-ARB mixtures. With other
volumetric parameters being the same, it seems the difference in trend was associated
with the effects of PG 76-22 ARB. As mentioned several times throughout this chapter,
it appears the PG 76-22 ARB had more free binder to blend with RAP than PMA binder.
In addition, the finer gradation of ATL RAP benefited more from the enhanced blending.
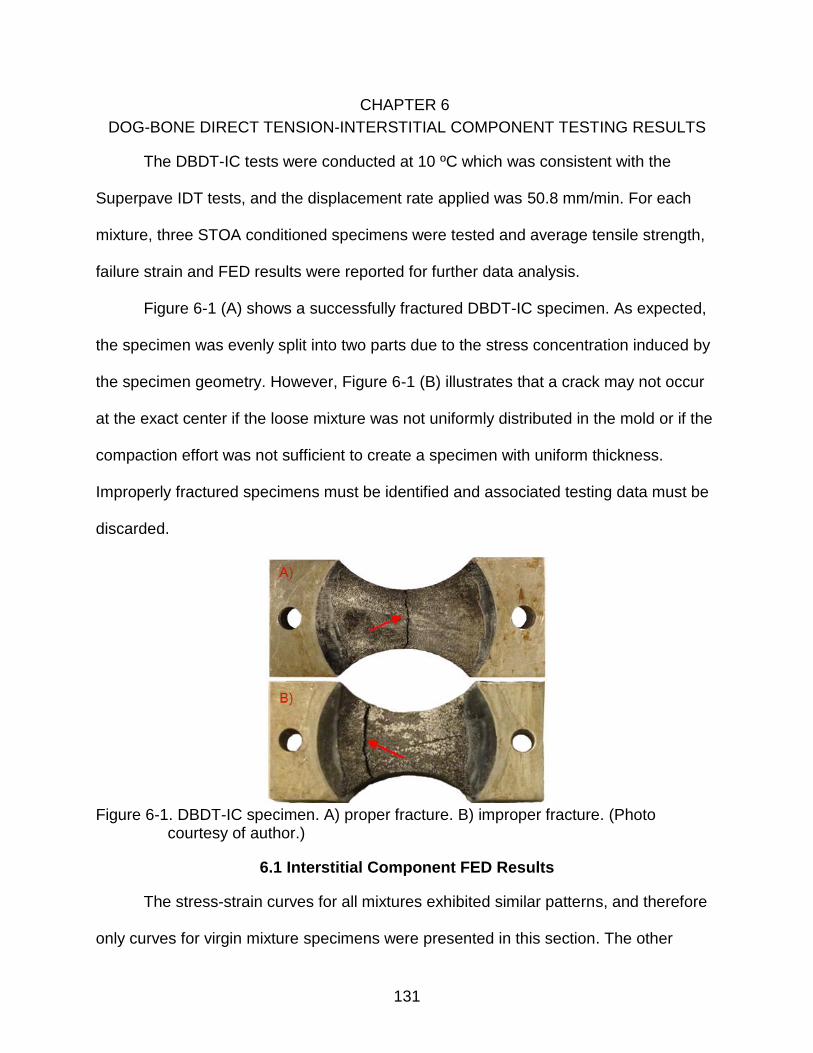
131
CHAPTER 6
DOG-BONE DIRECT TENSION-INTERSTITIAL COMPONENT TESTING RESULTS
The DBDT-IC tests were conducted at 10 ºC which was consistent with the
Superpave IDT tests, and the displacement rate applied was 50.8 mm/min. For each
mixture, three STOA conditioned specimens were tested and average tensile strength,
failure strain and FED results were reported for further data analysis.
Figure 6-1 (A) shows a successfully fractured DBDT-IC specimen. As expected,
the specimen was evenly split into two parts due to the stress concentration induced by
the specimen geometry. However, Figure 6-1 (B) illustrates that a crack may not occur
at the exact center if the loose mixture was not uniformly distributed in the mold or if the
compaction effort was not sufficient to create a specimen with uniform thickness.
Improperly fractured specimens must be identified and associated testing data must be
discarded.
Figure 6-1. DBDT-IC specimen. A) proper fracture. B) improper fracture. (Photo
courtesy of author.)
6.1 Interstitial Component FED Results
The stress-strain curves for all mixtures exhibited similar patterns, and therefore
only curves for virgin mixture specimens were presented in this section. The other
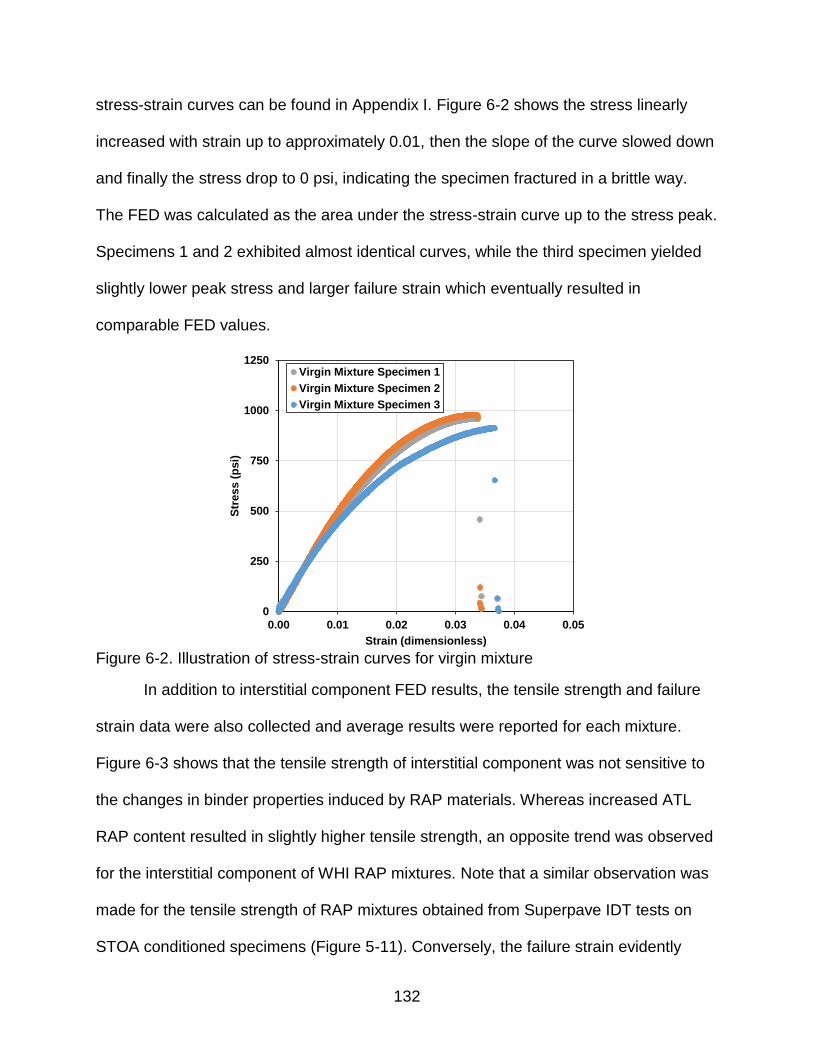
132
stress-strain curves can be found in Appendix I. Figure 6-2 shows the stress linearly
increased with strain up to approximately 0.01, then the slope of the curve slowed down
and finally the stress drop to 0 psi, indicating the specimen fractured in a brittle way.
The FED was calculated as the area under the stress-strain curve up to the stress peak.
Specimens 1 and 2 exhibited almost identical curves, while the third specimen yielded
slightly lower peak stress and larger failure strain which eventually resulted in
comparable FED values.
Figure 6-2. Illustration of stress-strain curves for virgin mixture
In addition to interstitial component FED results, the tensile strength and failure
strain data were also collected and average results were reported for each mixture.
Figure 6-3 shows that the tensile strength of interstitial component was not sensitive to
the changes in binder properties induced by RAP materials. Whereas increased ATL
RAP content resulted in slightly higher tensile strength, an opposite trend was observed
for the interstitial component of WHI RAP mixtures. Note that a similar observation was
made for the tensile strength of RAP mixtures obtained from Superpave IDT tests on
STOA conditioned specimens (Figure 5-11). Conversely, the failure strain evidently
0
250
500
750
1000
1250
0.00 0.01 0.02 0.03 0.04 0.05
Str
es
s (
psi)
Strain (dimensionless)
Virgin Mixture Specimen 1
Virgin Mixture Specimen 2
Virgin Mixture Specimen 3

133
captured the stiffening effect of RAP material on the interstitial component of asphalt
mixtures, as shown in Figure 6-4. Regardless of RAP type, the failure strain of DBDT-IC
specimens gradually decreased as the RAP content increased indicating mixtures
became more brittle. The overall effect of these trends was a reduction in interstitial
component FED as RAP content increased, as shown in Figure 6-5.
Figures 6-3, 6-4, and 6-5 supported the effect of RAP gradation on mixture
fracture properties observed in mixture results and described in section 5.1.3. Whereas
the difference in tensile strength between interstitial components of ATL and WHI RAP
mixtures was not significant, the ATL RAP consistently resulted in lower failure strain
and lower FED than WHI RAP. This observation indicated that full blending between
virgin and RAP binder does not occur in mixtures and instead RAP binder stays close to
RAP aggregate. Consequently, at a given RAP content, the interstitial component of a
mixture with a coarse RAP was filled primarily with virgin material which resulted in
better fracture properties over a mixture with a fine RAP.
Figure 6-3. Interstitial component tensile strength results
0
300
600
900
1200
1500
VirginMixture
20%ATL RAP
30%ATL RAP
40%ATL RAP
20%WHI RAP
30%WHI RAP
40%WHI RAP
Te
nsile
str
ength
(psi)
Mixture Type
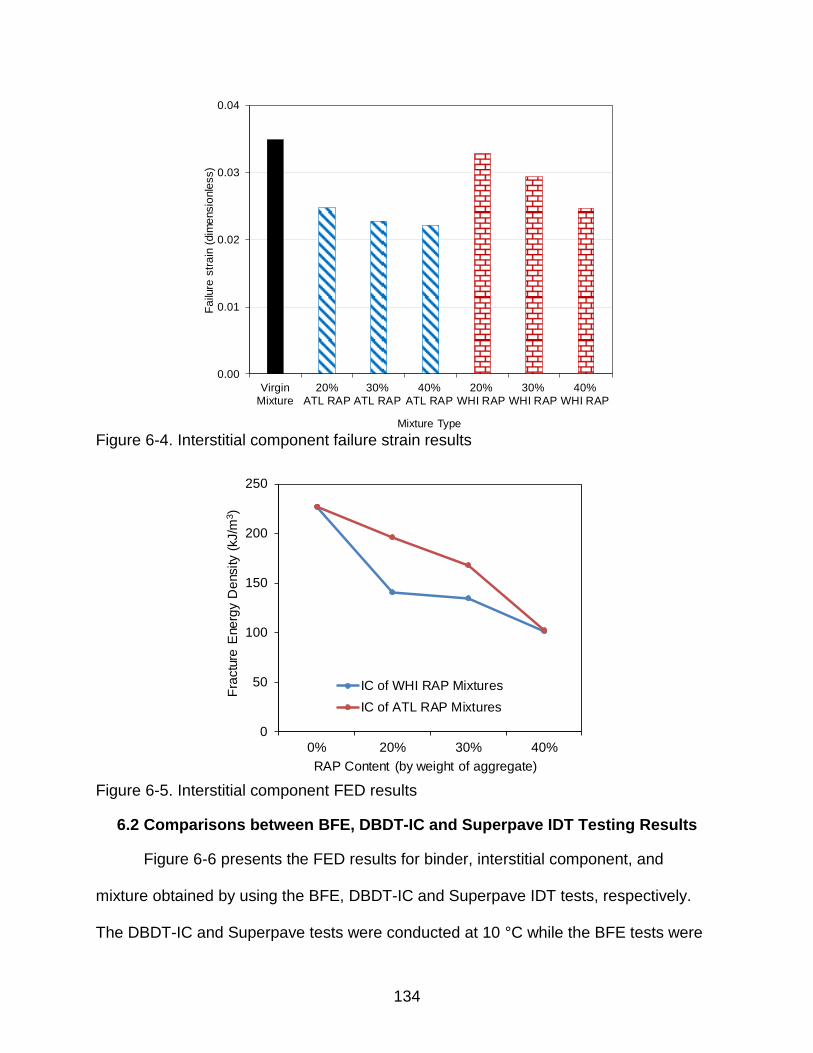
134
Figure 6-4. Interstitial component failure strain results
Figure 6-5. Interstitial component FED results
6.2 Comparisons between BFE, DBDT-IC and Superpave IDT Testing Results
Figure 6-6 presents the FED results for binder, interstitial component, and
mixture obtained by using the BFE, DBDT-IC and Superpave IDT tests, respectively.
The DBDT-IC and Superpave tests were conducted at 10 °C while the BFE tests were
0.00
0.01
0.02
0.03
0.04
VirginMixture
20%ATL RAP
30%ATL RAP
40%ATL RAP
20%WHI RAP
30%WHI RAP
40%WHI RAP
Fa
ilure
str
ain
(dim
ensio
nle
ss)
Mixture Type
0
50
100
150
200
250
0% 20% 30% 40%
Fra
ctu
re E
ne
rgy
De
nsity
(kJ/m
3)
RAP Content (by weight of aggregate)
IC of WHI RAP Mixtures
IC of ATL RAP Mixtures
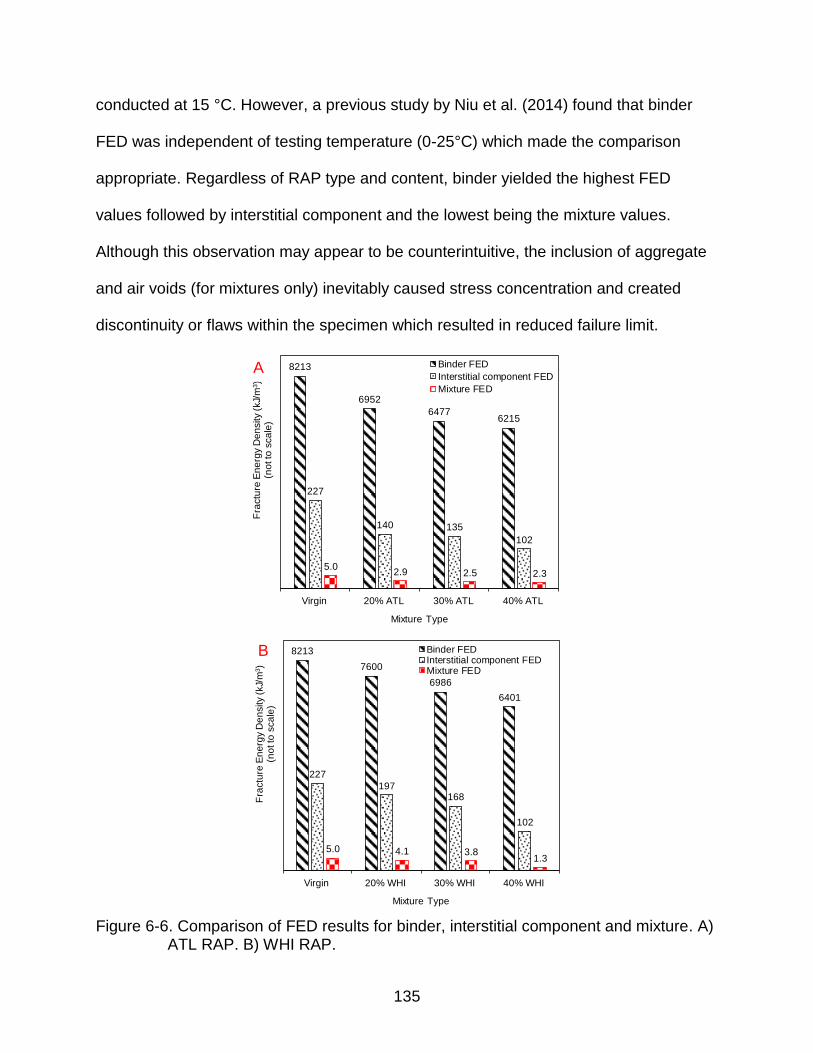
135
conducted at 15 °C. However, a previous study by Niu et al. (2014) found that binder
FED was independent of testing temperature (0-25°C) which made the comparison
appropriate. Regardless of RAP type and content, binder yielded the highest FED
values followed by interstitial component and the lowest being the mixture values.
Although this observation may appear to be counterintuitive, the inclusion of aggregate
and air voids (for mixtures only) inevitably caused stress concentration and created
discontinuity or flaws within the specimen which resulted in reduced failure limit.
Figure 6-6. Comparison of FED results for binder, interstitial component and mixture. A) ATL RAP. B) WHI RAP.
8213
6952
64776215
227
140 135
102
5.02.9 2.5 2.3
Virgin 20% ATL 30% ATL 40% ATL
Fra
ctu
re E
ne
rgy D
en
sity (
kJ/
m3)
(no
t to
sca
le)
Mixture Type
Binder FED
Interstitial component FED
Mixture FED
8213
7600
6986
6401
227
197168
102
5.0 4.1 3.81.3
Virgin 20% WHI 30% WHI 40% WHI
Fra
ctu
re E
ne
rgy D
en
sity (
kJ/
m3)
(no
t to
sca
le)
Mixture Type
Binder FEDInterstitial component FEDMixture FED
A
B
136
FED results were normalized in Figure 6-7 with respect to the values obtained for
the virgin mixture to evaluate the correlations in failure limit between binder, interstitial
component and asphalt mixture. Mixtures and interstitial components exhibited almost
identical normalized FED results with the only exception being the 40% WHI RAP
mixture, indicating that fracture performance of a mixture was primarily controlled by the
fine portion of mixtures. As highlighted in Figure 6-7 (B), a significant reduction in
normalized mixture FED occurred for the 40% WHI RAP mixture, which was not
observed on its interstitial component FED. As discussed in section 5.1.3, the coarse FL
limestone primarily dominated the FED of the 40% WHI RAP mixture; however, this
weak aggregate had no impact on interstitial component FED since only fine aggregate
(passing #16 sieve) was employed for interstitial component specimens.
Figure 6-7 also shows that the three fracture tests captured the adverse impact
of RAP on FED. Of note, the reduction in binder FED associated with increased RAP
content was less pronounced than the reduction in interstitial component and mixture
FED. This observation supported the premise that full blending of virgin and RAP binder
does not occur in the RAP mixtures. Whereas binder tests were performed on artificially
fully blended binders (a homogeneous system being tested), blending of the interstitial
component and mixture only occurred to a certain degree. This was governed by
characteristics of RAP and virgin binder. This partial blending may result in a non-
homogeneous stiffness distribution in the mixture, as well as a stress concentration
associated with stiffness gradient. Consequently, a localized stiffening effect may
promote crack development along the stiffer and brittle portion of materials around the
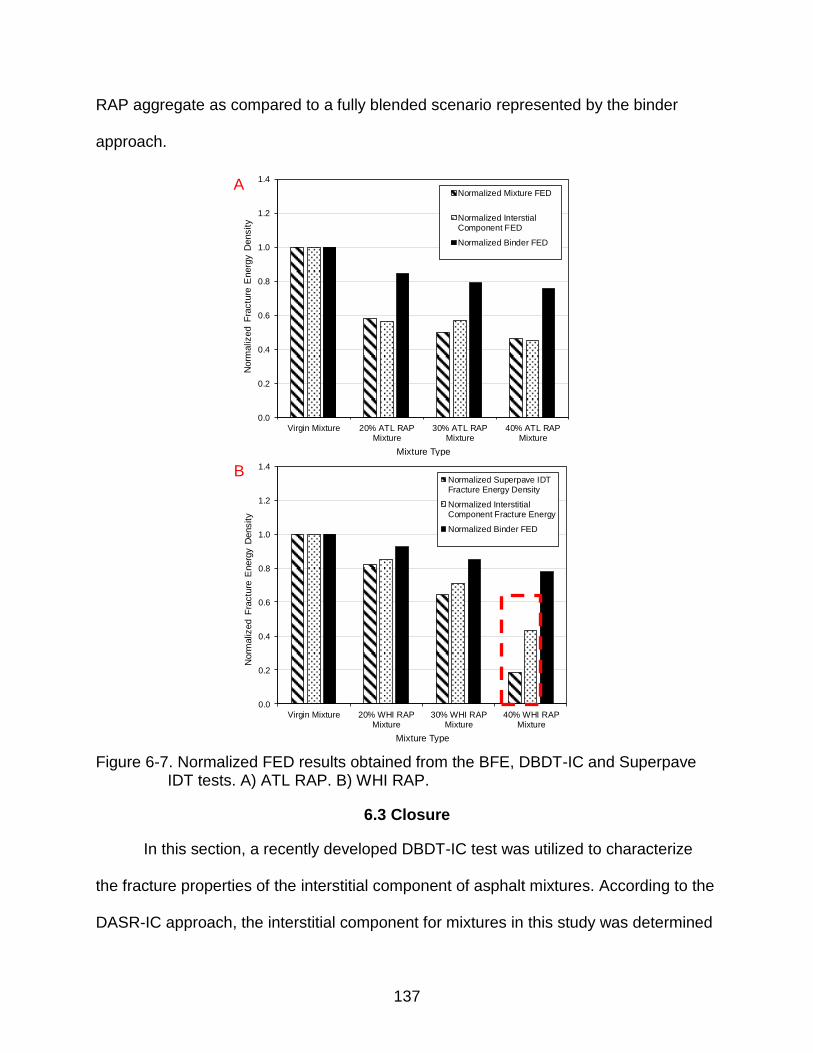
137
RAP aggregate as compared to a fully blended scenario represented by the binder
approach.
Figure 6-7. Normalized FED results obtained from the BFE, DBDT-IC and Superpave IDT tests. A) ATL RAP. B) WHI RAP.
6.3 Closure
In this section, a recently developed DBDT-IC test was utilized to characterize
the fracture properties of the interstitial component of asphalt mixtures. According to the
DASR-IC approach, the interstitial component for mixtures in this study was determined
0.0
0.2
0.4
0.6
0.8
1.0
1.2
1.4
Virgin Mixture 20% ATL RAPMixture
30% ATL RAPMixture
40% ATL RAPMixture
Norm
aliz
ed F
ractu
re E
nerg
y D
ensity
Mixture Type
Normalized Mixture FED
Normalized InterstialComponent FED
Normalized Binder FED
0.0
0.2
0.4
0.6
0.8
1.0
1.2
1.4
Virgin Mixture 20% WHI RAPMixture
30% WHI RAPMixture
40% WHI RAPMixture
Norm
aliz
ed F
ractu
re E
nerg
y D
ensity
Mixture Type
Normalized Superpave IDTFracture Energy Density
Normalized InterstitialComponent Fracture Energy
Normalized Binder FED
A
B
138
to include fine aggregate passing #16 sieve and below. Specimens were prepared and
compacted to have a dog-bone shape with zero percent air voids. For each mixture,
three STOA conditioned specimens were tested.
Whereas the tensile strength of RAP mixtures was minimally affected by RAP
content, the failure strain was significantly reduced and consequently resulted in
decreased FED results. WHI RAP mixtures with up to 30% RAP content exhibited
higher failure strain and FED than ATL RAP mixtures, which was consistent with
mixture results. This observation clearly indicated that RAP binder tended to reside
close to RAP aggregate, thus, the fine portion of a mixture with coarser RAP was
primarily filled with virgin material, which resulted in better fracture properties than those
for a mixture with fine RAP. Whereas a significant reduction in mixture FED occurred for
WHI RAP mixtures, such a reduction was not observed in interstitial component FED
result, which could be explained by the absence of weak coarse FL limestone in
interstitial component specimens.
The Superpave IDT and DBDT-IC tests yielded almost identical normalized FED
results indicating that the interstitial component had a dominant impact on the fracture
limit of asphalt mixture. In addition, as RAP content increased, interstitial component
and mixture FED results decreased at a much faster rate than binder FED. This
observation substantiated that full blending of the virgin and RAP binder does not occur
and partial blending creates a non-homogeneous stiffness distribution in mixtures. It
appeared that localized stiffening effect of RAP binder along the RAP aggregate had a
more adverse impact on mixture fracture properties than a fully blended scenario
typically assumed in binder approach.
139
CHAPTER 7
CONCLUSIONS
7.1 Summary and Findings
This study was conducted to determine whether high RAP content (>20%) RAP
can be used in surface course mixtures without negatively affecting cracking
performance. The main purpose was to enhance understanding of how RAP aggregate
gradation and RAP content affect mixture fracture properties and to identify a
methodology to obtain properties relevant to cracking performance.
Virgin mixture was modified to include RAP content of 20%, 30% and 40% by
adjusting the virgin aggregate stockpiles. This approach eliminated the effects of
gradation difference on performance to assure that observed differences were in fact
associated with the differences in RAP content and characteristics (RAP aggregate
gradation and RAP binder properties). Fracture properties for binder, mixture and
interstitial component were obtained by conducing the BFE, Superpave IDT and
DBDT-IC tests. An energy-based parameter named ER, which has been calibrated with
field pavement cracking performance, was used to evaluate the cracking performance
of lab mixtures. Whether high RAP content (>25%) RAP can be used in surface course
mixtures without negatively affecting cracking performance was determined based on
the FED and ER requirements proposed by the UF research group.
The main findings based on results of laboratory testing are listed below:
Fully blended virgin and RAP binders exhibited good elastomeric behavior according to %recovery values obtained from the MSCR test, which were above the minimum requirements.
The addition of RAP binder reduced the FED of virgin binders, however, the resulting FED of fully blended virgin and RAP binders were well above the FED of unmodified binders.
140
Increased RAP content generally resulted in stronger (higher tensile strength) but more brittle (lower failure strain and lower FED) mixtures. Similar trends were observed at both STOA and LTOA plus CPPC conditions.
RAP gradation had a dominant effect on mixture fracture properties:
o Although the coarser gradation RAP used in this study was much stiffer than the finer gradation RAP, it resulted in lower mixture resilient modulus than the finer gradation RAP, indicating full blending between virgin and RAP binder did not occur in mixtures; instead, the RAP binder tended to stay close to the RAP aggregate.
o The coarser gradation RAP generally resulted in higher mixture FED than the finer gradation RAP. This indicates that greater degree of blending is not necessarily favorable for mixture cracking since the finer portion of the coarse RAP mixture was primarily virgin aggregate and binder.
RAP tended to reduce the rate of damage, but it also reduced the FED of asphalt mixtures. Since the mixture cracking performance is governed by both of the rate of damage and the FED, it appeared that reduction in the FED became the critical element in terms of detrimental cracking performance.
After LTOA plus CPPC conditioning, all RAP mixtures exhibited FED values above 1.0 kJ/m3 and ER values well above 1.0, which are the minimum values proposed by the UF research group to ensure acceptable cracking performance.
IC FED of the finer gradation RAP mixture was lower than coarser gradation RAP mixture substantiated that full blending did not occur and stiff RAP binder remained in the fine portion of fine RAP mixture.
IC FED results correlated with mixture FED results, better than binder FED results. This indicates that the DBDT-IC test can be adopted as an effective tool to predict fracture properties of RAP mixtures, because:
o IC test is conducted directly on the fine portion of a mixture that controls cracking performance; and
o IC specimen is produced by blending the RAP and virgin materials in the same way a mixture would normally being blended.
7.2 Conclusions and Recommendations
RAP gradation controls the distribution of RAP binder in the mixtures since full
blending does not occur. Based on the results of this research, mixture cracking
performance was strongly affected by the RAP binder that resided in the fine portion of
141
resultant mixtures. Therefore, in addition to RAP content and RAP binder properties, it
is also important to consider RAP gradation, which varies from RAP source to source,
when designing RAP mixtures.
Properties obtained directly from the fine portion of RAP mixtures provide a
better criterion for cracking performance evaluation than properties of fully blended
virgin and RAP binders. The newly developed DBDT-IC test is recommended for use as
an effective tool to predict the fracture properties of RAP mixtures.
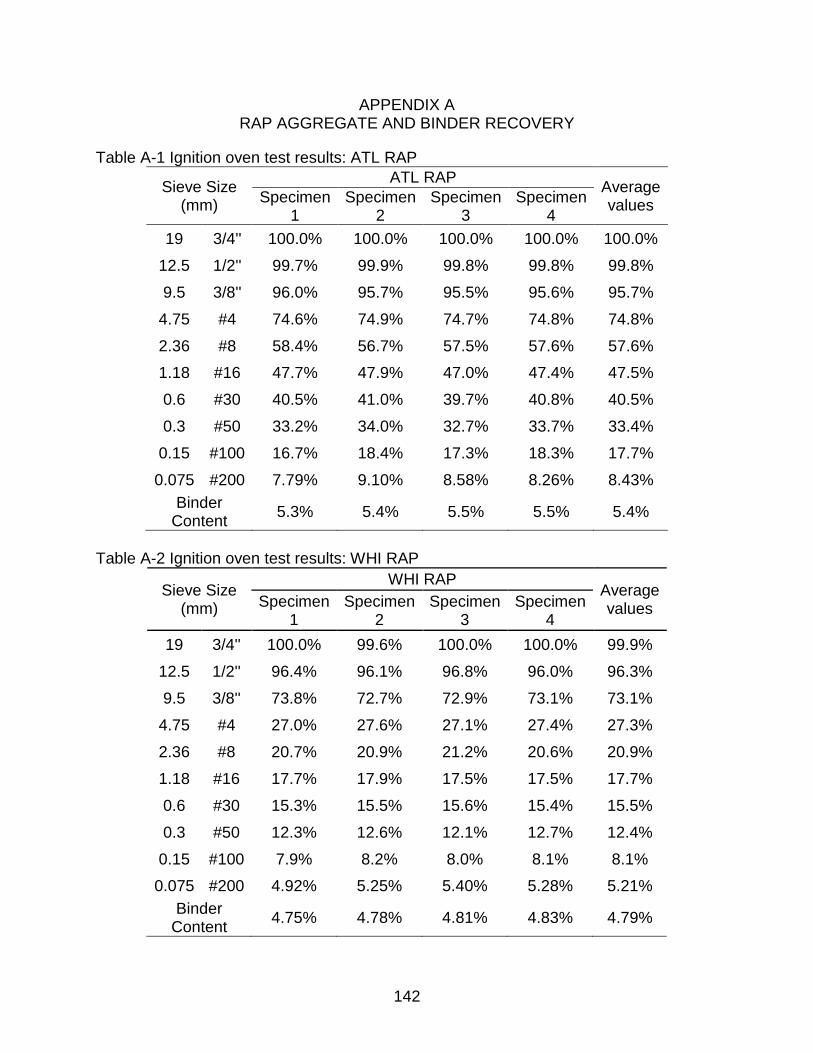
142
APPENDIX A RAP AGGREGATE AND BINDER RECOVERY
Table A-1 Ignition oven test results: ATL RAP
Sieve Size (mm)
ATL RAP Average values
Specimen 1
Specimen 2
Specimen 3
Specimen 4
19 3/4'' 100.0% 100.0% 100.0% 100.0% 100.0%
12.5 1/2'' 99.7% 99.9% 99.8% 99.8% 99.8%
9.5 3/8'' 96.0% 95.7% 95.5% 95.6% 95.7%
4.75 #4 74.6% 74.9% 74.7% 74.8% 74.8%
2.36 #8 58.4% 56.7% 57.5% 57.6% 57.6%
1.18 #16 47.7% 47.9% 47.0% 47.4% 47.5%
0.6 #30 40.5% 41.0% 39.7% 40.8% 40.5%
0.3 #50 33.2% 34.0% 32.7% 33.7% 33.4%
0.15 #100 16.7% 18.4% 17.3% 18.3% 17.7%
0.075 #200 7.79% 9.10% 8.58% 8.26% 8.43%
Binder Content
5.3% 5.4% 5.5% 5.5% 5.4%
Table A-2 Ignition oven test results: WHI RAP
Sieve Size (mm)
WHI RAP Average values Specimen
1 Specimen
2 Specimen
3 Specimen
4
19 3/4'' 100.0% 99.6% 100.0% 100.0% 99.9%
12.5 1/2'' 96.4% 96.1% 96.8% 96.0% 96.3%
9.5 3/8'' 73.8% 72.7% 72.9% 73.1% 73.1%
4.75 #4 27.0% 27.6% 27.1% 27.4% 27.3%
2.36 #8 20.7% 20.9% 21.2% 20.6% 20.9%
1.18 #16 17.7% 17.9% 17.5% 17.5% 17.7%
0.6 #30 15.3% 15.5% 15.6% 15.4% 15.5%
0.3 #50 12.3% 12.6% 12.1% 12.7% 12.4%
0.15 #100 7.9% 8.2% 8.0% 8.1% 8.1%
0.075 #200 4.92% 5.25% 5.40% 5.28% 5.21%
Binder Content
4.75% 4.78% 4.81% 4.83% 4.79%
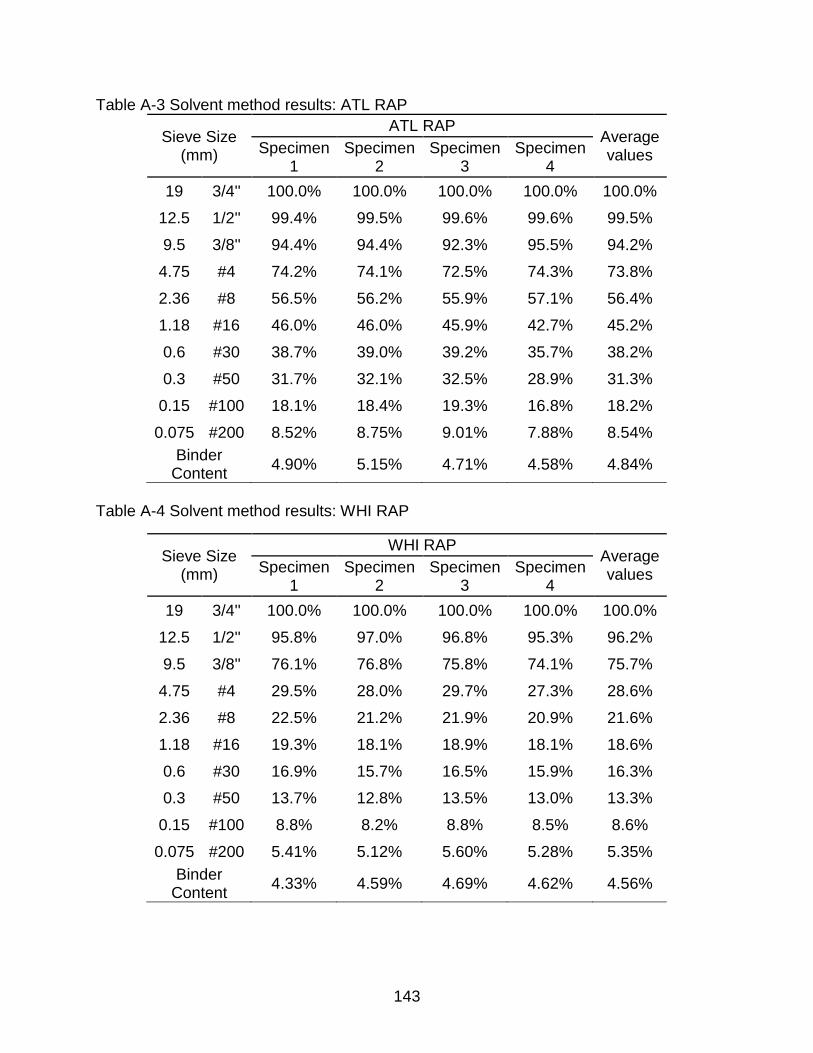
143
Table A-3 Solvent method results: ATL RAP
Sieve Size (mm)
ATL RAP Average values Specimen
1 Specimen
2 Specimen
3 Specimen
4
19 3/4'' 100.0% 100.0% 100.0% 100.0% 100.0%
12.5 1/2'' 99.4% 99.5% 99.6% 99.6% 99.5%
9.5 3/8'' 94.4% 94.4% 92.3% 95.5% 94.2%
4.75 #4 74.2% 74.1% 72.5% 74.3% 73.8%
2.36 #8 56.5% 56.2% 55.9% 57.1% 56.4%
1.18 #16 46.0% 46.0% 45.9% 42.7% 45.2%
0.6 #30 38.7% 39.0% 39.2% 35.7% 38.2%
0.3 #50 31.7% 32.1% 32.5% 28.9% 31.3%
0.15 #100 18.1% 18.4% 19.3% 16.8% 18.2%
0.075 #200 8.52% 8.75% 9.01% 7.88% 8.54%
Binder Content
4.90% 5.15% 4.71% 4.58% 4.84%
Table A-4 Solvent method results: WHI RAP
Sieve Size (mm)
WHI RAP Average values Specimen
1 Specimen
2 Specimen
3 Specimen
4
19 3/4'' 100.0% 100.0% 100.0% 100.0% 100.0%
12.5 1/2'' 95.8% 97.0% 96.8% 95.3% 96.2%
9.5 3/8'' 76.1% 76.8% 75.8% 74.1% 75.7%
4.75 #4 29.5% 28.0% 29.7% 27.3% 28.6%
2.36 #8 22.5% 21.2% 21.9% 20.9% 21.6%
1.18 #16 19.3% 18.1% 18.9% 18.1% 18.6%
0.6 #30 16.9% 15.7% 16.5% 15.9% 16.3%
0.3 #50 13.7% 12.8% 13.5% 13.0% 13.3%
0.15 #100 8.8% 8.2% 8.8% 8.5% 8.6%
0.075 #200 5.41% 5.12% 5.60% 5.28% 5.35%
Binder Content
4.33% 4.59% 4.69% 4.62% 4.56%

144
APPENDIX B BATCHING WEIGHTS FOR DESIGNED MIXTURES
Table B-1. Batching sheet: FC-12.5 reference mixture
Reference Mixture Retained Weight (g)
Sieve Size (mm) C43/#7 Stone
C51/#89 Stone
F20/W-10 Stone
334-LS
29 1'' 0.0 0.0 0.0 0.0
19 3/4'' 0.0 0.0 0.0 0.0
12.5 1/2'' 33.8 0.0 0.0 0.0
9.5 3/8'' 461.3 0.0 0.0 0.0
4.75 #4 540.0 328.5 162.0 0.0
2.36 #8 56.3 108.0 756.0 0.0
1.18 #16 11.3 9.0 594.0 0.0
0.6 #30 0.0 0.0 378.0 0.0
0.3 #50 0.0 0.0 297.0 0.0
0.15 #100 0.0 0.0 270.0 135.0
0.075 #200 11.3 0.0 121.5 85.5
Pan 11.3 4.5 121.5 4.5
Sum 1125.0 450.0 2700.0 225.0
Pb (%) 5.2 Gyration 75 SUM 4500.0
Table B-2. Batching sheet: 20% ARL RAP mixture
20% ATL RAP Retained Weight (g)
Sieve Size (mm) C43/#7 Stone
C51/#89 Stone
F20/W-10 Stone
334-LS ATL RAP
29 1'' 0.0 0.0 0.0 0.0 0.0
19 3/4'' 0.0 0.0 0.0 0.0 0.0
12.5 1/2'' 27.0 0.0 0.0 0.0 9.5
9.5 3/8'' 369.0 0.0 0.0 0.0 113.4
4.75 #4 432.0 164.3 143.1 0.0 274.2
2.36 #8 45.0 54.0 667.8 0.0 189.1
1.18 #16 9.0 4.5 524.7 0.0 111.5
0.6 #30 0.0 0.0 333.9 0.0 86.1
0.3 #50 0.0 0.0 262.4 0.0 76.9
0.15 #100 0.0 0.0 238.5 54.0 68.4
0.075 #200 9.0 0.0 107.3 34.2 14.3
Pan 9.0 2.3 107.3 1.8 2.0
Sum 900.0 225.0 2385.0 90.0 945.4
Pb (%) 5.2 Gyration 75 SUM 4545.4
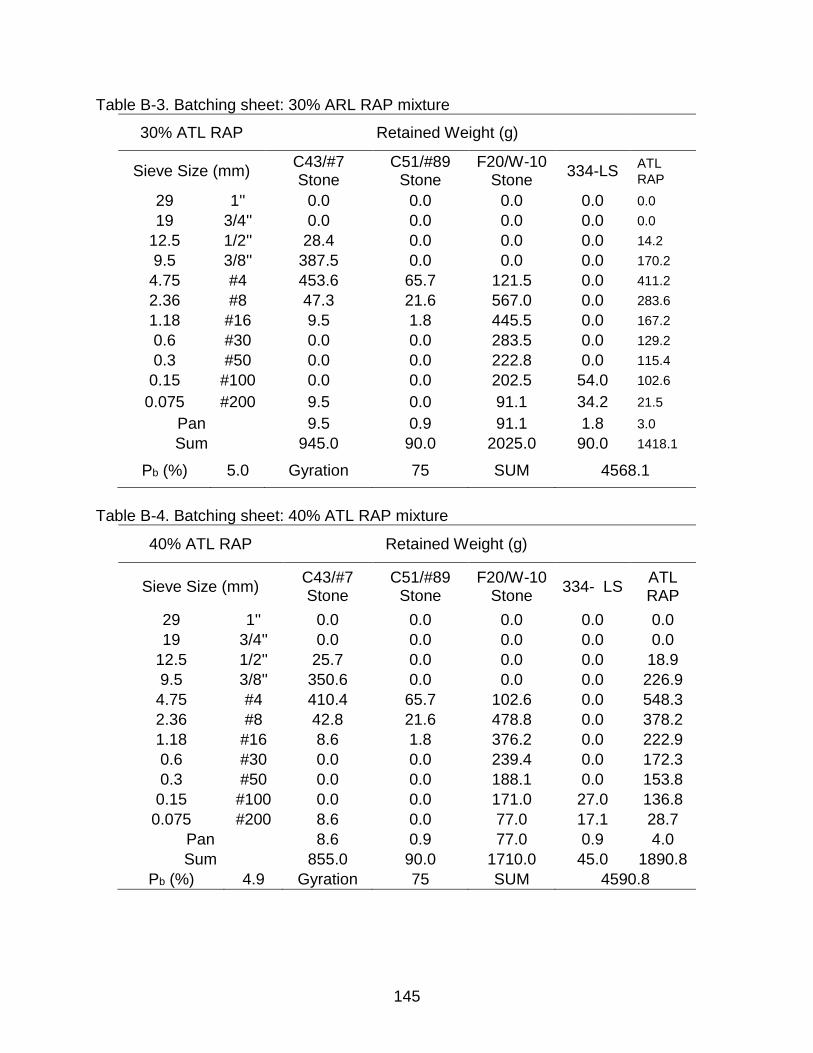
145
Table B-3. Batching sheet: 30% ARL RAP mixture
30% ATL RAP Retained Weight (g)
Sieve Size (mm) C43/#7 Stone
C51/#89 Stone
F20/W-10 Stone
334-LS ATL
RAP
29 1'' 0.0 0.0 0.0 0.0 0.0
19 3/4'' 0.0 0.0 0.0 0.0 0.0
12.5 1/2'' 28.4 0.0 0.0 0.0 14.2
9.5 3/8'' 387.5 0.0 0.0 0.0 170.2
4.75 #4 453.6 65.7 121.5 0.0 411.2
2.36 #8 47.3 21.6 567.0 0.0 283.6
1.18 #16 9.5 1.8 445.5 0.0 167.2
0.6 #30 0.0 0.0 283.5 0.0 129.2
0.3 #50 0.0 0.0 222.8 0.0 115.4
0.15 #100 0.0 0.0 202.5 54.0 102.6
0.075 #200 9.5 0.0 91.1 34.2 21.5
Pan 9.5 0.9 91.1 1.8 3.0
Sum 945.0 90.0 2025.0 90.0 1418.1
Pb (%) 5.0 Gyration 75 SUM 4568.1
Table B-4. Batching sheet: 40% ATL RAP mixture
40% ATL RAP Retained Weight (g)
Sieve Size (mm) C43/#7 Stone
C51/#89 Stone
F20/W-10 Stone
334- LS ATL RAP
29 1'' 0.0 0.0 0.0 0.0 0.0
19 3/4'' 0.0 0.0 0.0 0.0 0.0
12.5 1/2'' 25.7 0.0 0.0 0.0 18.9
9.5 3/8'' 350.6 0.0 0.0 0.0 226.9
4.75 #4 410.4 65.7 102.6 0.0 548.3
2.36 #8 42.8 21.6 478.8 0.0 378.2
1.18 #16 8.6 1.8 376.2 0.0 222.9
0.6 #30 0.0 0.0 239.4 0.0 172.3
0.3 #50 0.0 0.0 188.1 0.0 153.8
0.15 #100 0.0 0.0 171.0 27.0 136.8
0.075 #200 8.6 0.0 77.0 17.1 28.7
Pan 8.6 0.9 77.0 0.9 4.0
Sum 855.0 90.0 1710.0 45.0 1890.8
Pb (%) 4.9 Gyration 75 SUM 4590.8
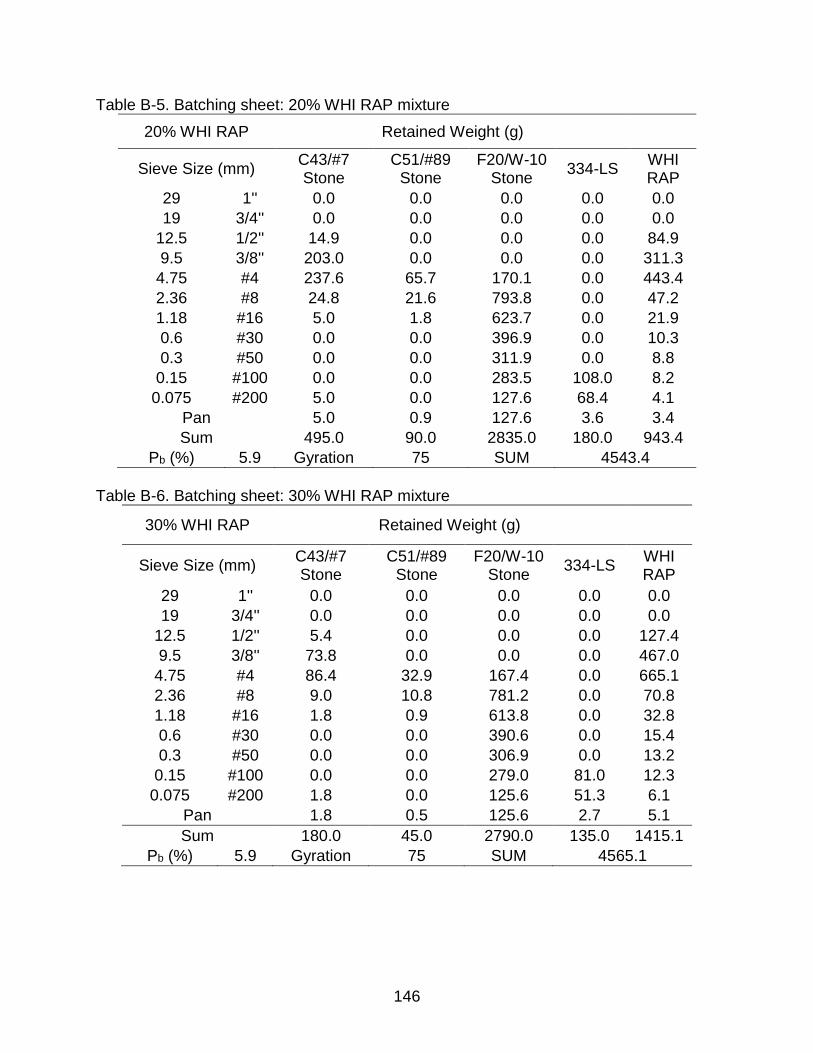
146
Table B-5. Batching sheet: 20% WHI RAP mixture
20% WHI RAP Retained Weight (g)
Sieve Size (mm) C43/#7 Stone
C51/#89 Stone
F20/W-10 Stone
334-LS WHI RAP
29 1'' 0.0 0.0 0.0 0.0 0.0
19 3/4'' 0.0 0.0 0.0 0.0 0.0
12.5 1/2'' 14.9 0.0 0.0 0.0 84.9
9.5 3/8'' 203.0 0.0 0.0 0.0 311.3
4.75 #4 237.6 65.7 170.1 0.0 443.4
2.36 #8 24.8 21.6 793.8 0.0 47.2
1.18 #16 5.0 1.8 623.7 0.0 21.9
0.6 #30 0.0 0.0 396.9 0.0 10.3
0.3 #50 0.0 0.0 311.9 0.0 8.8
0.15 #100 0.0 0.0 283.5 108.0 8.2
0.075 #200 5.0 0.0 127.6 68.4 4.1
Pan 5.0 0.9 127.6 3.6 3.4
Sum 495.0 90.0 2835.0 180.0 943.4
Pb (%) 5.9 Gyration 75 SUM 4543.4
Table B-6. Batching sheet: 30% WHI RAP mixture
30% WHI RAP Retained Weight (g)
Sieve Size (mm) C43/#7 Stone
C51/#89 Stone
F20/W-10 Stone
334-LS WHI RAP
29 1'' 0.0 0.0 0.0 0.0 0.0
19 3/4'' 0.0 0.0 0.0 0.0 0.0
12.5 1/2'' 5.4 0.0 0.0 0.0 127.4
9.5 3/8'' 73.8 0.0 0.0 0.0 467.0
4.75 #4 86.4 32.9 167.4 0.0 665.1
2.36 #8 9.0 10.8 781.2 0.0 70.8
1.18 #16 1.8 0.9 613.8 0.0 32.8
0.6 #30 0.0 0.0 390.6 0.0 15.4
0.3 #50 0.0 0.0 306.9 0.0 13.2
0.15 #100 0.0 0.0 279.0 81.0 12.3
0.075 #200 1.8 0.0 125.6 51.3 6.1
Pan 1.8 0.5 125.6 2.7 5.1
Sum 180.0 45.0 2790.0 135.0 1415.1
Pb (%) 5.9 Gyration 75 SUM 4565.1
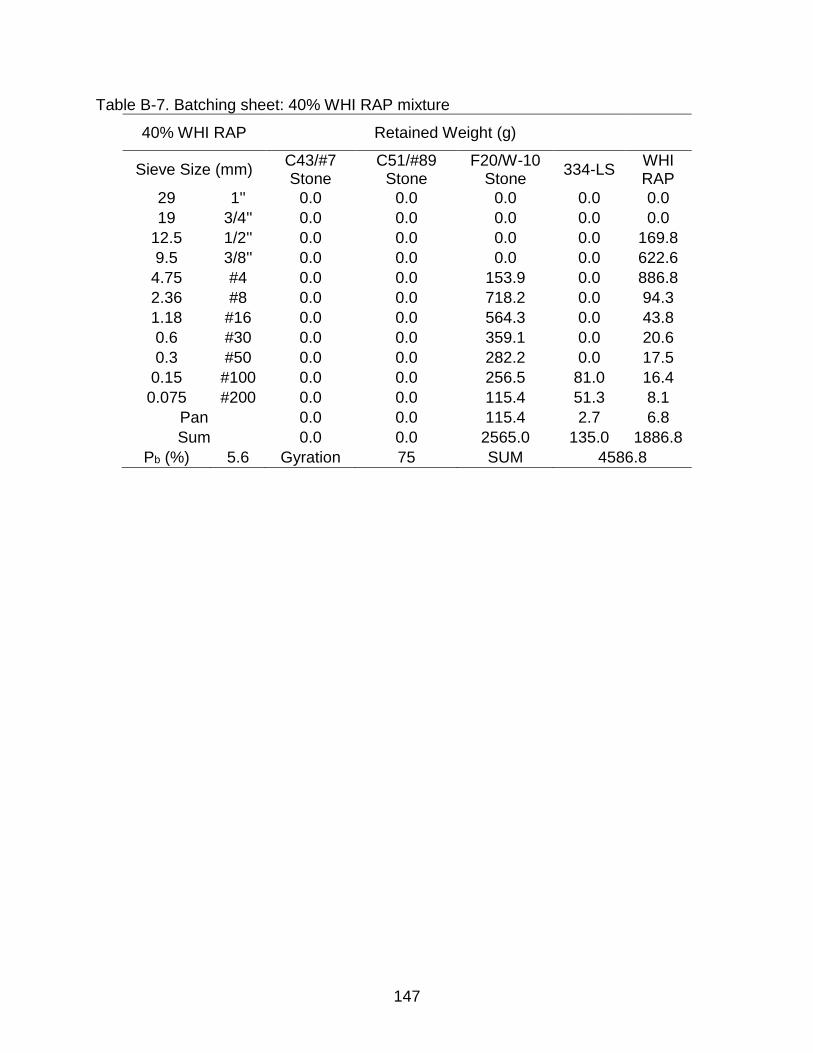
147
Table B-7. Batching sheet: 40% WHI RAP mixture
40% WHI RAP Retained Weight (g)
Sieve Size (mm) C43/#7 Stone
C51/#89 Stone
F20/W-10 Stone
334-LS WHI RAP
29 1'' 0.0 0.0 0.0 0.0 0.0
19 3/4'' 0.0 0.0 0.0 0.0 0.0
12.5 1/2'' 0.0 0.0 0.0 0.0 169.8
9.5 3/8'' 0.0 0.0 0.0 0.0 622.6
4.75 #4 0.0 0.0 153.9 0.0 886.8
2.36 #8 0.0 0.0 718.2 0.0 94.3
1.18 #16 0.0 0.0 564.3 0.0 43.8
0.6 #30 0.0 0.0 359.1 0.0 20.6
0.3 #50 0.0 0.0 282.2 0.0 17.5
0.15 #100 0.0 0.0 256.5 81.0 16.4
0.075 #200 0.0 0.0 115.4 51.3 8.1
Pan 0.0 0.0 115.4 2.7 6.8
Sum 0.0 0.0 2565.0 135.0 1886.8
Pb (%) 5.6 Gyration 75 SUM 4586.8
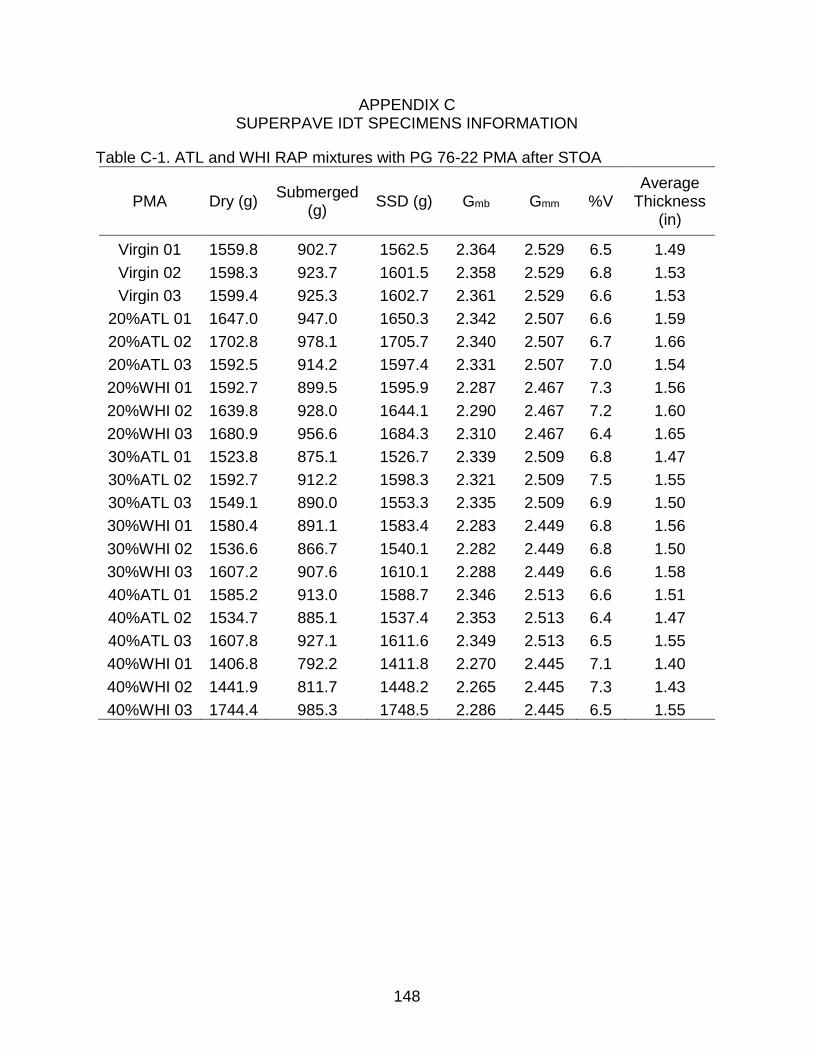
148
APPENDIX C SUPERPAVE IDT SPECIMENS INFORMATION
Table C-1. ATL and WHI RAP mixtures with PG 76-22 PMA after STOA
PMA Dry (g) Submerged
(g) SSD (g) Gmb Gmm %V
Average Thickness
(in)
Virgin 01 1559.8 902.7 1562.5 2.364 2.529 6.5 1.49
Virgin 02 1598.3 923.7 1601.5 2.358 2.529 6.8 1.53
Virgin 03 1599.4 925.3 1602.7 2.361 2.529 6.6 1.53
20%ATL 01 1647.0 947.0 1650.3 2.342 2.507 6.6 1.59
20%ATL 02 1702.8 978.1 1705.7 2.340 2.507 6.7 1.66
20%ATL 03 1592.5 914.2 1597.4 2.331 2.507 7.0 1.54
20%WHI 01 1592.7 899.5 1595.9 2.287 2.467 7.3 1.56
20%WHI 02 1639.8 928.0 1644.1 2.290 2.467 7.2 1.60
20%WHI 03 1680.9 956.6 1684.3 2.310 2.467 6.4 1.65
30%ATL 01 1523.8 875.1 1526.7 2.339 2.509 6.8 1.47
30%ATL 02 1592.7 912.2 1598.3 2.321 2.509 7.5 1.55
30%ATL 03 1549.1 890.0 1553.3 2.335 2.509 6.9 1.50
30%WHI 01 1580.4 891.1 1583.4 2.283 2.449 6.8 1.56
30%WHI 02 1536.6 866.7 1540.1 2.282 2.449 6.8 1.50
30%WHI 03 1607.2 907.6 1610.1 2.288 2.449 6.6 1.58
40%ATL 01 1585.2 913.0 1588.7 2.346 2.513 6.6 1.51
40%ATL 02 1534.7 885.1 1537.4 2.353 2.513 6.4 1.47
40%ATL 03 1607.8 927.1 1611.6 2.349 2.513 6.5 1.55
40%WHI 01 1406.8 792.2 1411.8 2.270 2.445 7.1 1.40
40%WHI 02 1441.9 811.7 1448.2 2.265 2.445 7.3 1.43
40%WHI 03 1744.4 985.3 1748.5 2.286 2.445 6.5 1.55
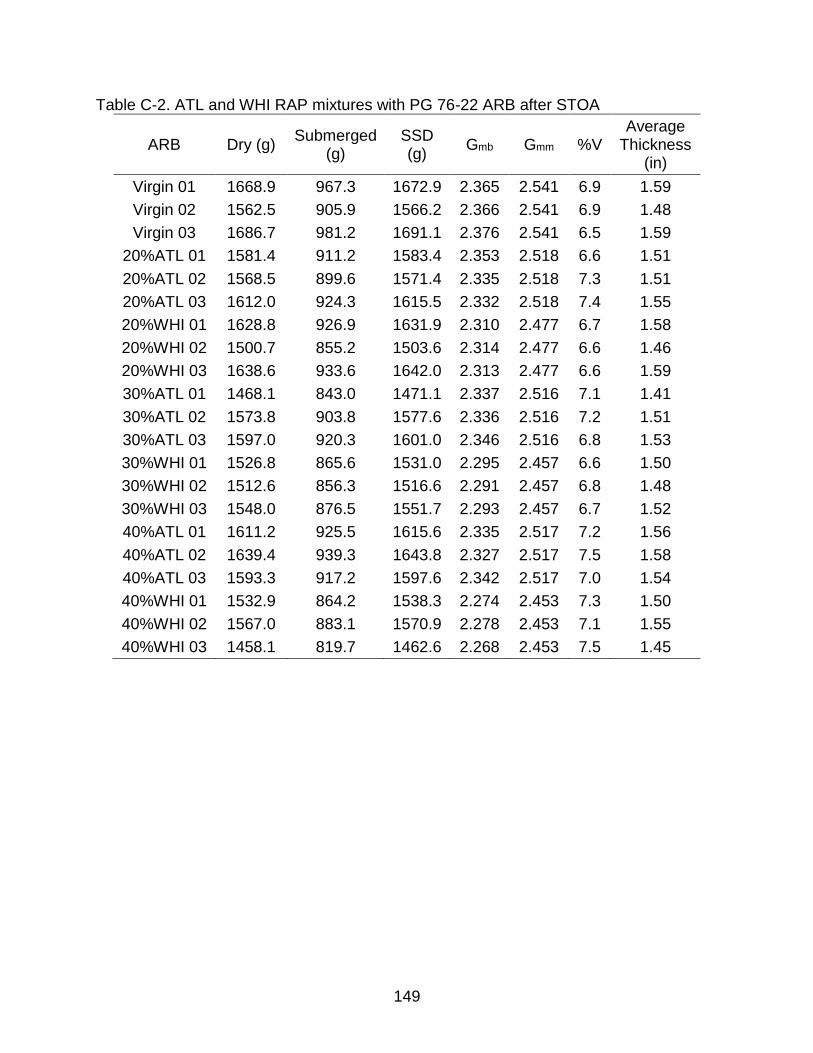
149
Table C-2. ATL and WHI RAP mixtures with PG 76-22 ARB after STOA
ARB Dry (g) Submerged
(g) SSD (g)
Gmb Gmm %V Average
Thickness (in)
Virgin 01 1668.9 967.3 1672.9 2.365 2.541 6.9 1.59
Virgin 02 1562.5 905.9 1566.2 2.366 2.541 6.9 1.48
Virgin 03 1686.7 981.2 1691.1 2.376 2.541 6.5 1.59
20%ATL 01 1581.4 911.2 1583.4 2.353 2.518 6.6 1.51
20%ATL 02 1568.5 899.6 1571.4 2.335 2.518 7.3 1.51
20%ATL 03 1612.0 924.3 1615.5 2.332 2.518 7.4 1.55
20%WHI 01 1628.8 926.9 1631.9 2.310 2.477 6.7 1.58
20%WHI 02 1500.7 855.2 1503.6 2.314 2.477 6.6 1.46
20%WHI 03 1638.6 933.6 1642.0 2.313 2.477 6.6 1.59
30%ATL 01 1468.1 843.0 1471.1 2.337 2.516 7.1 1.41
30%ATL 02 1573.8 903.8 1577.6 2.336 2.516 7.2 1.51
30%ATL 03 1597.0 920.3 1601.0 2.346 2.516 6.8 1.53
30%WHI 01 1526.8 865.6 1531.0 2.295 2.457 6.6 1.50
30%WHI 02 1512.6 856.3 1516.6 2.291 2.457 6.8 1.48
30%WHI 03 1548.0 876.5 1551.7 2.293 2.457 6.7 1.52
40%ATL 01 1611.2 925.5 1615.6 2.335 2.517 7.2 1.56
40%ATL 02 1639.4 939.3 1643.8 2.327 2.517 7.5 1.58
40%ATL 03 1593.3 917.2 1597.6 2.342 2.517 7.0 1.54
40%WHI 01 1532.9 864.2 1538.3 2.274 2.453 7.3 1.50
40%WHI 02 1567.0 883.1 1570.9 2.278 2.453 7.1 1.55
40%WHI 03 1458.1 819.7 1462.6 2.268 2.453 7.5 1.45
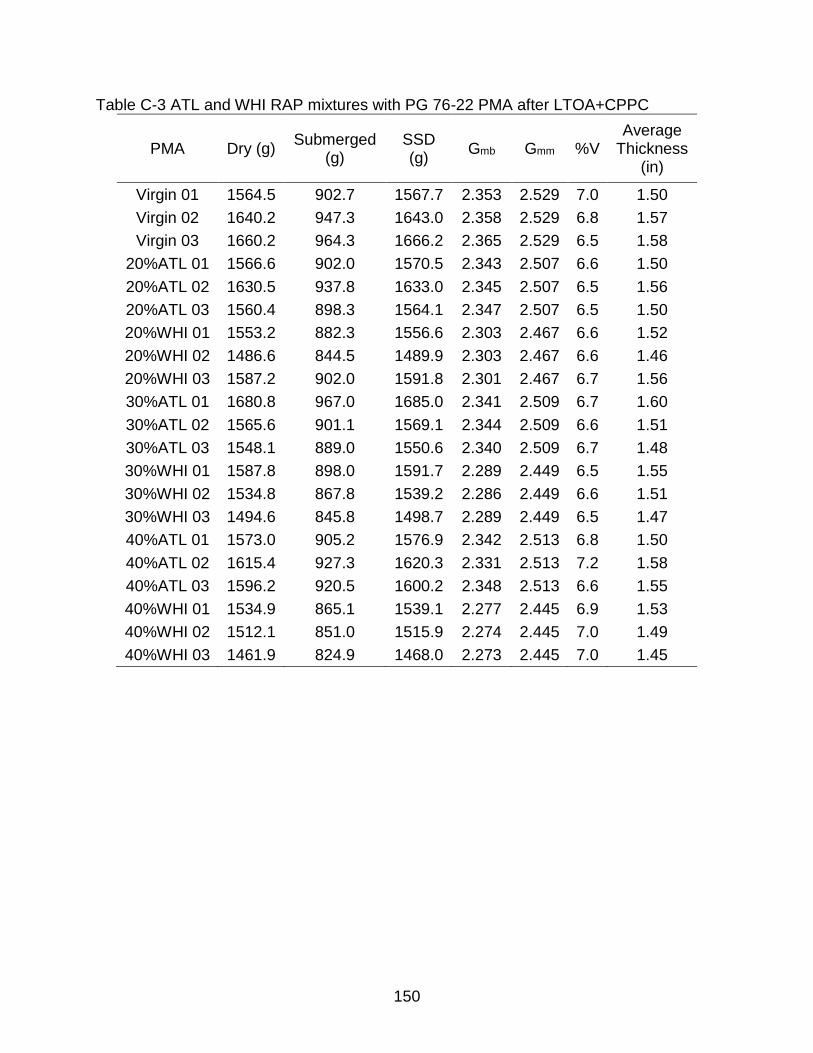
150
Table C-3 ATL and WHI RAP mixtures with PG 76-22 PMA after LTOA+CPPC
PMA Dry (g) Submerged
(g) SSD (g)
Gmb Gmm %V Average
Thickness (in)
Virgin 01 1564.5 902.7 1567.7 2.353 2.529 7.0 1.50
Virgin 02 1640.2 947.3 1643.0 2.358 2.529 6.8 1.57
Virgin 03 1660.2 964.3 1666.2 2.365 2.529 6.5 1.58
20%ATL 01 1566.6 902.0 1570.5 2.343 2.507 6.6 1.50
20%ATL 02 1630.5 937.8 1633.0 2.345 2.507 6.5 1.56
20%ATL 03 1560.4 898.3 1564.1 2.347 2.507 6.5 1.50
20%WHI 01 1553.2 882.3 1556.6 2.303 2.467 6.6 1.52
20%WHI 02 1486.6 844.5 1489.9 2.303 2.467 6.6 1.46
20%WHI 03 1587.2 902.0 1591.8 2.301 2.467 6.7 1.56
30%ATL 01 1680.8 967.0 1685.0 2.341 2.509 6.7 1.60
30%ATL 02 1565.6 901.1 1569.1 2.344 2.509 6.6 1.51
30%ATL 03 1548.1 889.0 1550.6 2.340 2.509 6.7 1.48
30%WHI 01 1587.8 898.0 1591.7 2.289 2.449 6.5 1.55
30%WHI 02 1534.8 867.8 1539.2 2.286 2.449 6.6 1.51
30%WHI 03 1494.6 845.8 1498.7 2.289 2.449 6.5 1.47
40%ATL 01 1573.0 905.2 1576.9 2.342 2.513 6.8 1.50
40%ATL 02 1615.4 927.3 1620.3 2.331 2.513 7.2 1.58
40%ATL 03 1596.2 920.5 1600.2 2.348 2.513 6.6 1.55
40%WHI 01 1534.9 865.1 1539.1 2.277 2.445 6.9 1.53
40%WHI 02 1512.1 851.0 1515.9 2.274 2.445 7.0 1.49
40%WHI 03 1461.9 824.9 1468.0 2.273 2.445 7.0 1.45
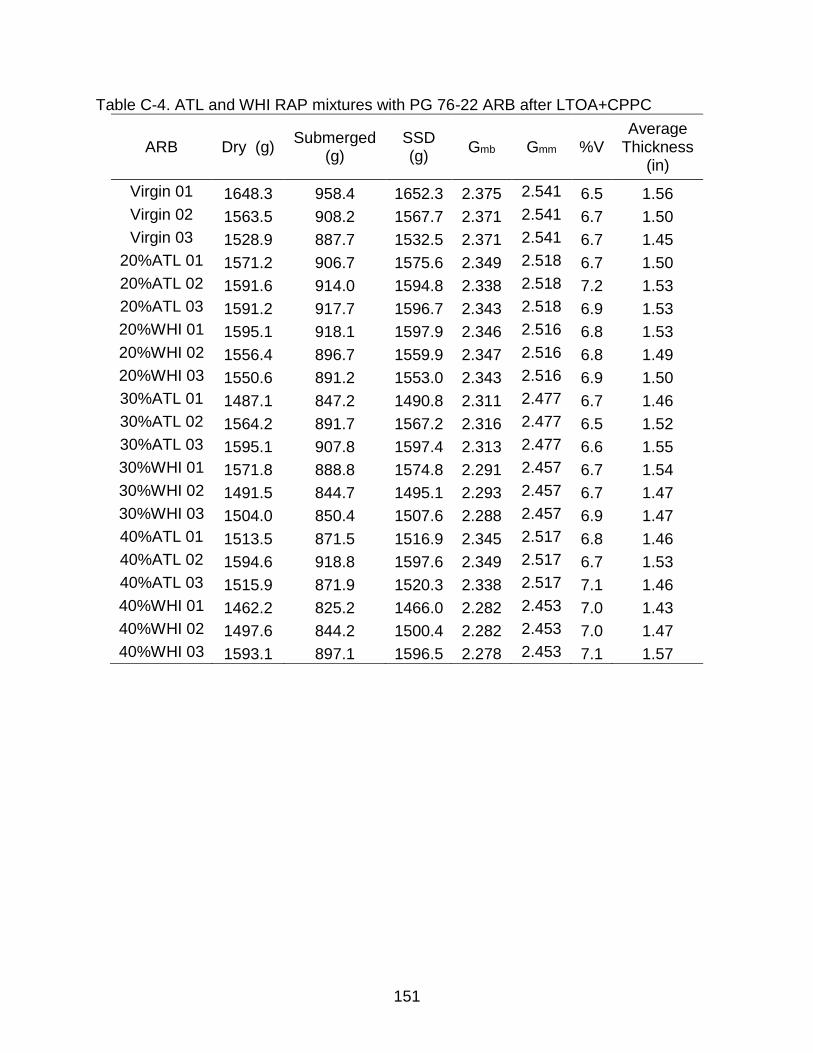
151
Table C-4. ATL and WHI RAP mixtures with PG 76-22 ARB after LTOA+CPPC
ARB Dry (g) Submerged
(g) SSD (g)
Gmb Gmm %V Average
Thickness (in)
Virgin 01 1648.3 958.4 1652.3 2.375 2.541 6.5 1.56
Virgin 02 1563.5 908.2 1567.7 2.371 2.541 6.7 1.50
Virgin 03 1528.9 887.7 1532.5 2.371 2.541 6.7 1.45
20%ATL 01 1571.2 906.7 1575.6 2.349 2.518 6.7 1.50
20%ATL 02 1591.6 914.0 1594.8 2.338 2.518 7.2 1.53
20%ATL 03 1591.2 917.7 1596.7 2.343 2.518 6.9 1.53
20%WHI 01 1595.1 918.1 1597.9 2.346 2.516 6.8 1.53
20%WHI 02 1556.4 896.7 1559.9 2.347 2.516 6.8 1.49
20%WHI 03 1550.6 891.2 1553.0 2.343 2.516 6.9 1.50
30%ATL 01 1487.1 847.2 1490.8 2.311 2.477 6.7 1.46
30%ATL 02 1564.2 891.7 1567.2 2.316 2.477 6.5 1.52
30%ATL 03 1595.1 907.8 1597.4 2.313 2.477 6.6 1.55
30%WHI 01 1571.8 888.8 1574.8 2.291 2.457 6.7 1.54
30%WHI 02 1491.5 844.7 1495.1 2.293 2.457 6.7 1.47
30%WHI 03 1504.0 850.4 1507.6 2.288 2.457 6.9 1.47
40%ATL 01 1513.5 871.5 1516.9 2.345 2.517 6.8 1.46
40%ATL 02 1594.6 918.8 1597.6 2.349 2.517 6.7 1.53
40%ATL 03 1515.9 871.9 1520.3 2.338 2.517 7.1 1.46
40%WHI 01 1462.2 825.2 1466.0 2.282 2.453 7.0 1.43
40%WHI 02 1497.6 844.2 1500.4 2.282 2.453 7.0 1.47
40%WHI 03 1593.1 897.1 1596.5 2.278 2.453 7.1 1.57
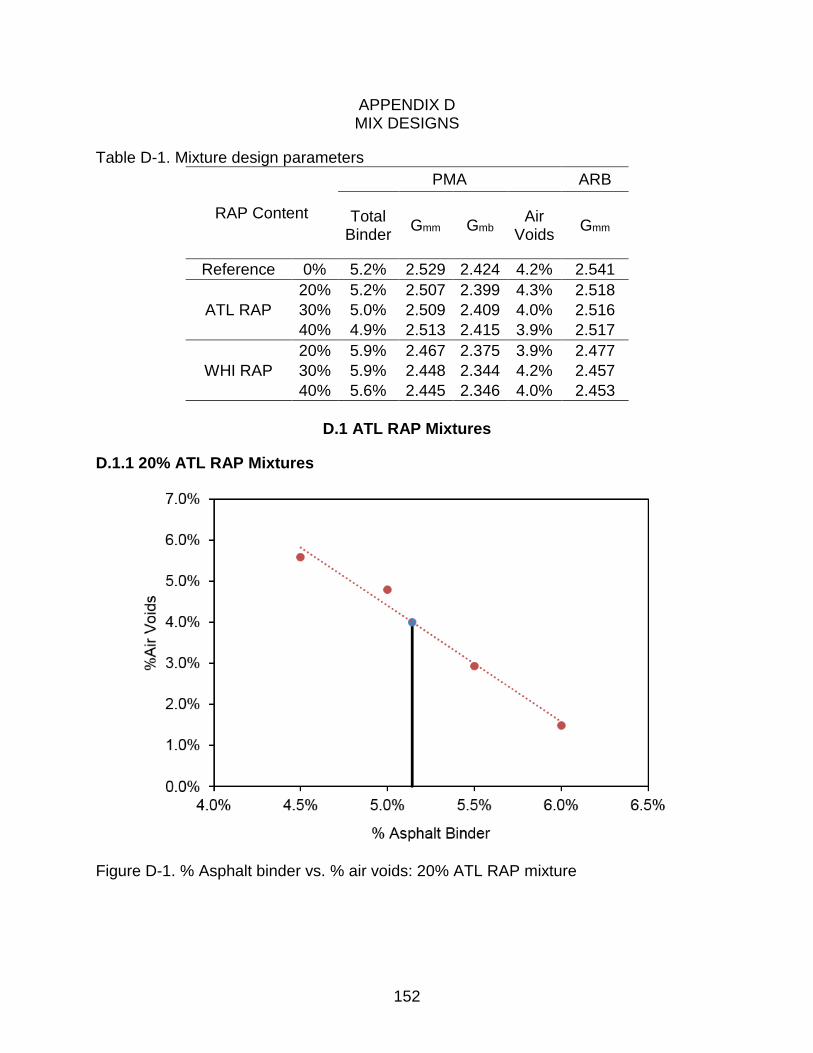
152
APPENDIX D MIX DESIGNS
Table D-1. Mixture design parameters
RAP Content
PMA ARB
Total Binder
Gmm Gmb Air
Voids Gmm
Reference 0% 5.2% 2.529 2.424 4.2% 2.541
ATL RAP
20% 5.2% 2.507 2.399 4.3% 2.518
30% 5.0% 2.509 2.409 4.0% 2.516
40% 4.9% 2.513 2.415 3.9% 2.517
WHI RAP
20% 5.9% 2.467 2.375 3.9% 2.477
30% 5.9% 2.448 2.344 4.2% 2.457
40% 5.6% 2.445 2.346 4.0% 2.453
D.1 ATL RAP Mixtures
D.1.1 20% ATL RAP Mixtures
Figure D-1. % Asphalt binder vs. % air voids: 20% ATL RAP mixture
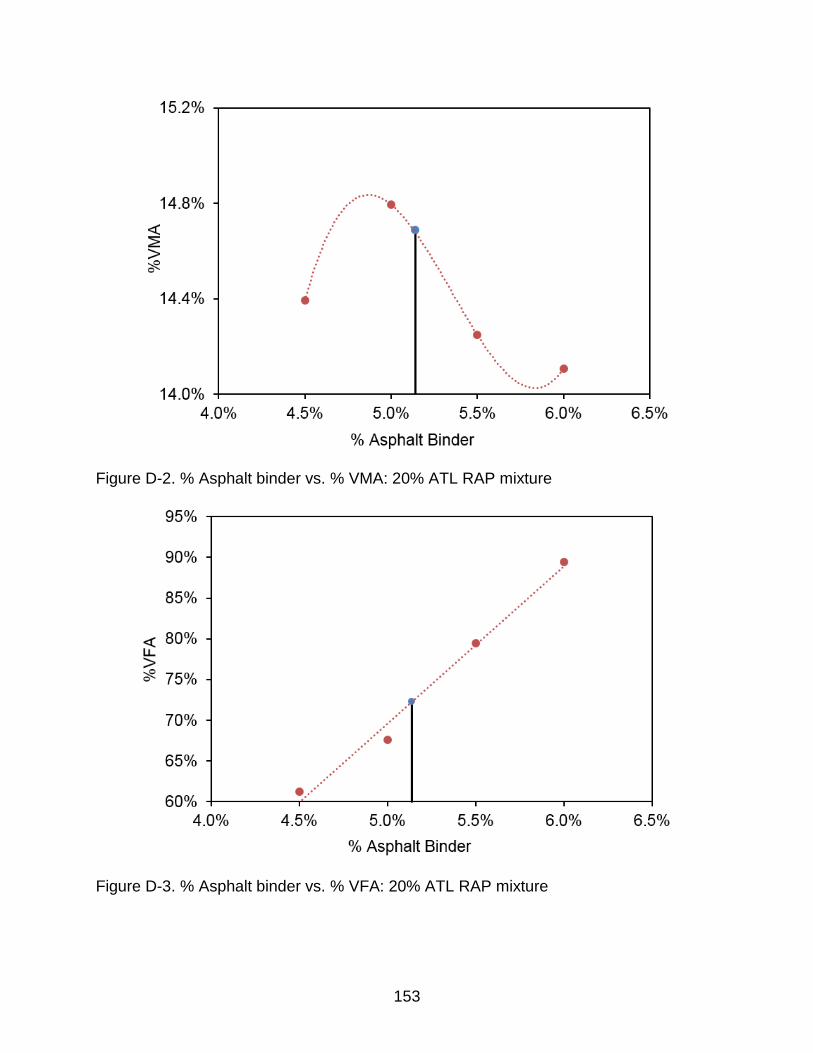
153
Figure D-2. % Asphalt binder vs. % VMA: 20% ATL RAP mixture
Figure D-3. % Asphalt binder vs. % VFA: 20% ATL RAP mixture
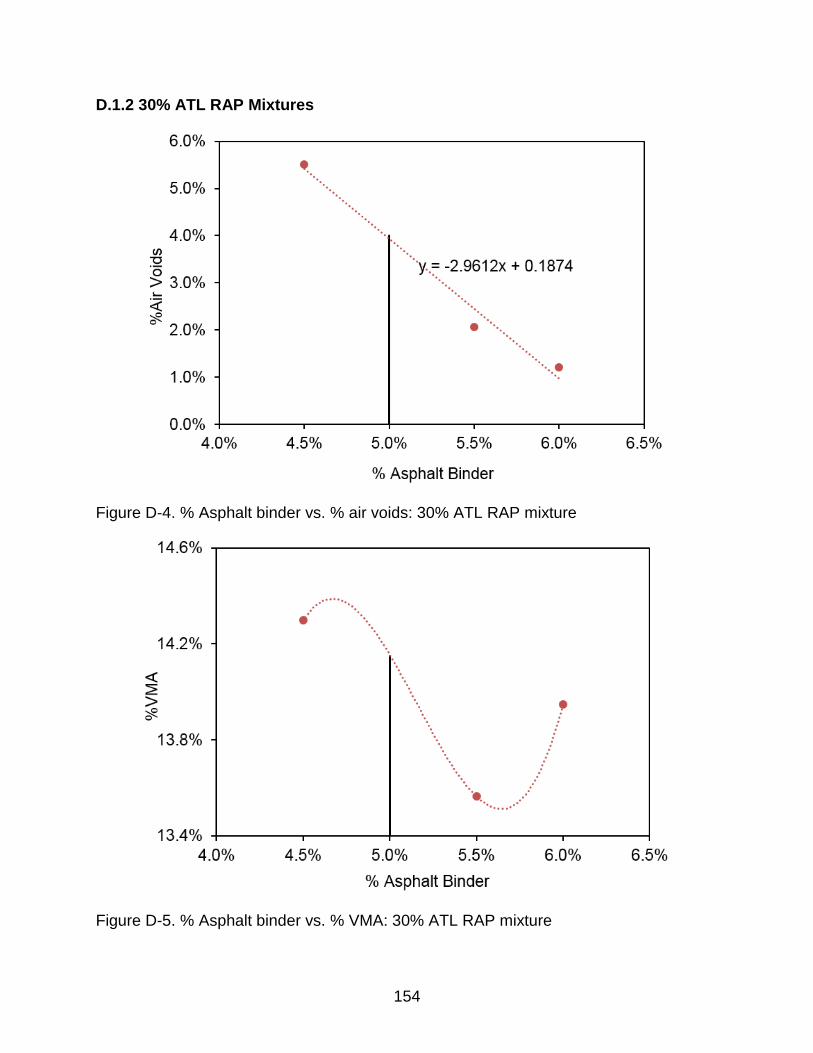
154
D.1.2 30% ATL RAP Mixtures
Figure D-4. % Asphalt binder vs. % air voids: 30% ATL RAP mixture
Figure D-5. % Asphalt binder vs. % VMA: 30% ATL RAP mixture
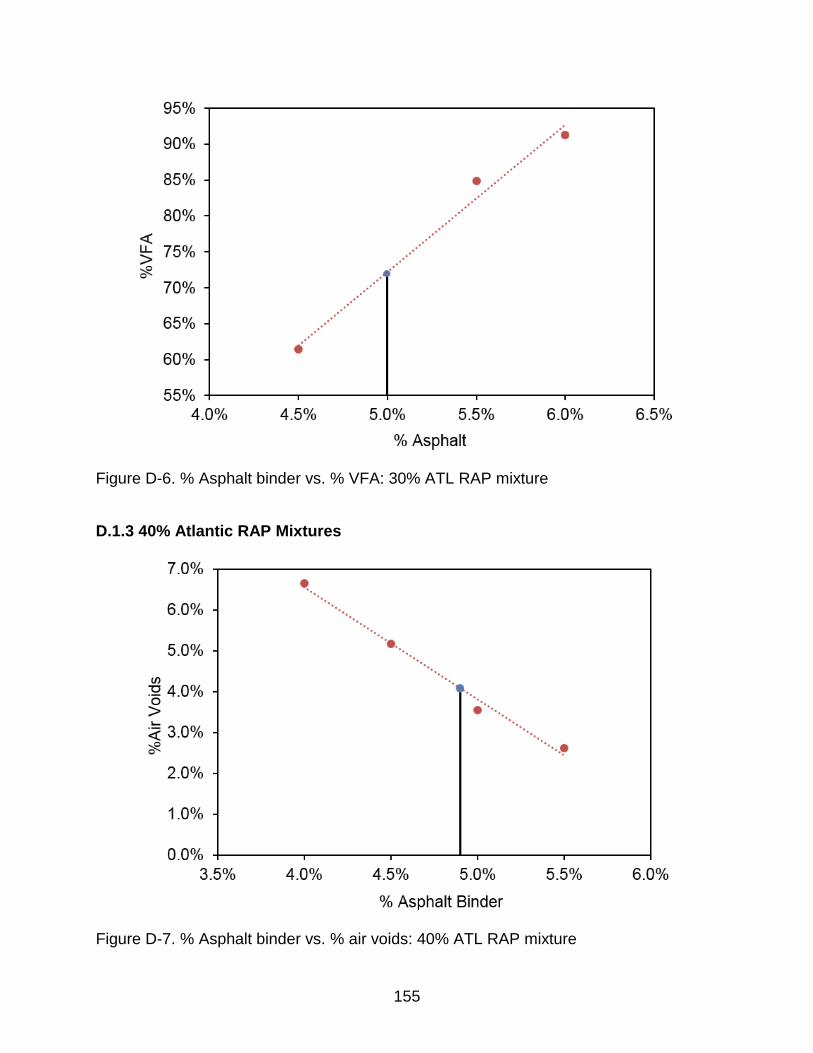
155
Figure D-6. % Asphalt binder vs. % VFA: 30% ATL RAP mixture
D.1.3 40% Atlantic RAP Mixtures
Figure D-7. % Asphalt binder vs. % air voids: 40% ATL RAP mixture
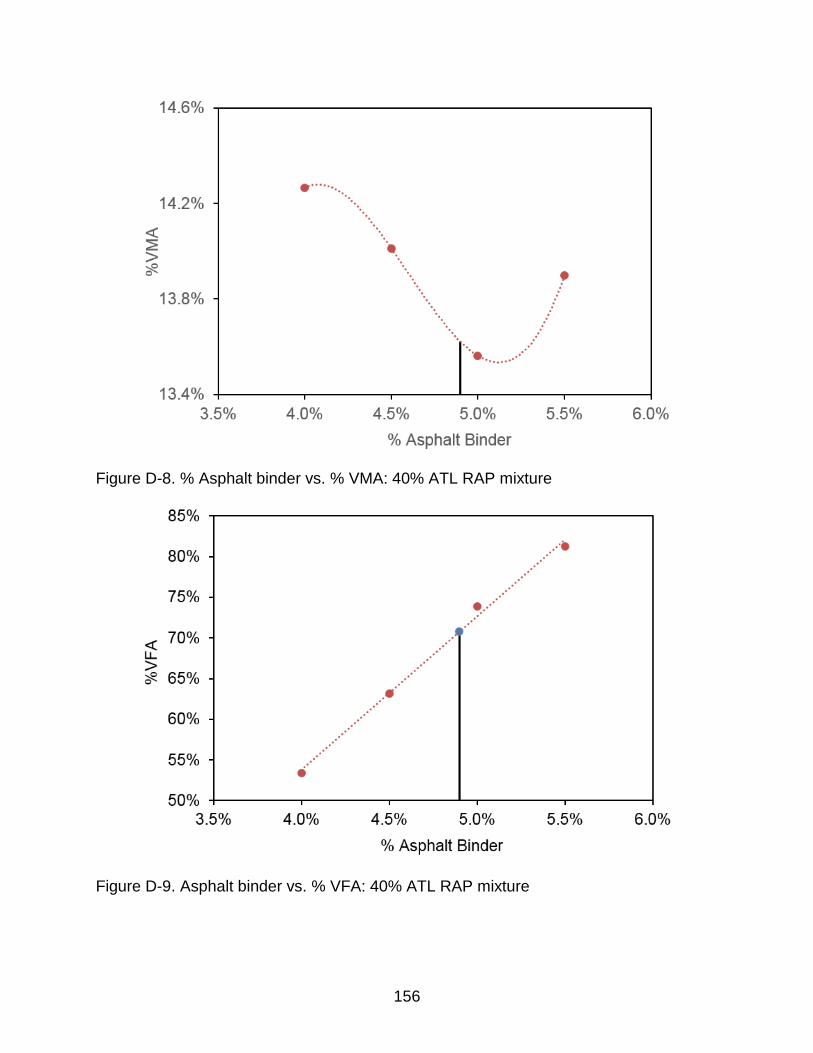
156
Figure D-8. % Asphalt binder vs. % VMA: 40% ATL RAP mixture
Figure D-9. Asphalt binder vs. % VFA: 40% ATL RAP mixture
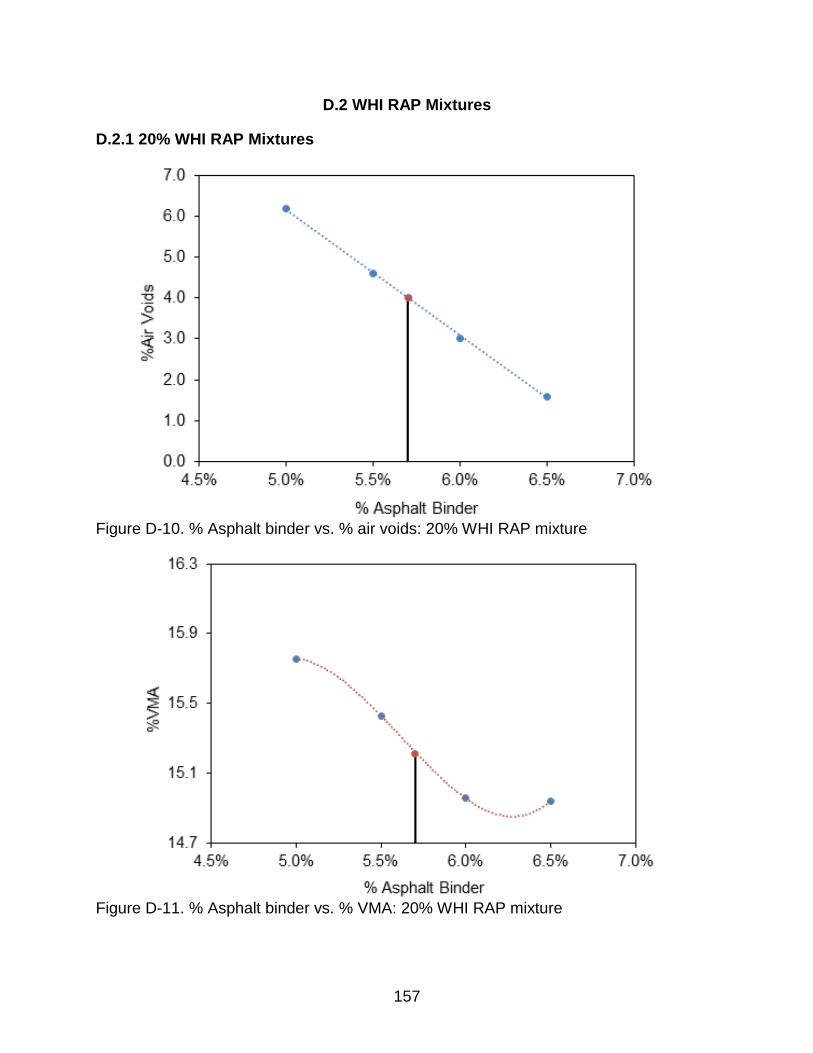
157
D.2 WHI RAP Mixtures
D.2.1 20% WHI RAP Mixtures
Figure D-10. % Asphalt binder vs. % air voids: 20% WHI RAP mixture
Figure D-11. % Asphalt binder vs. % VMA: 20% WHI RAP mixture
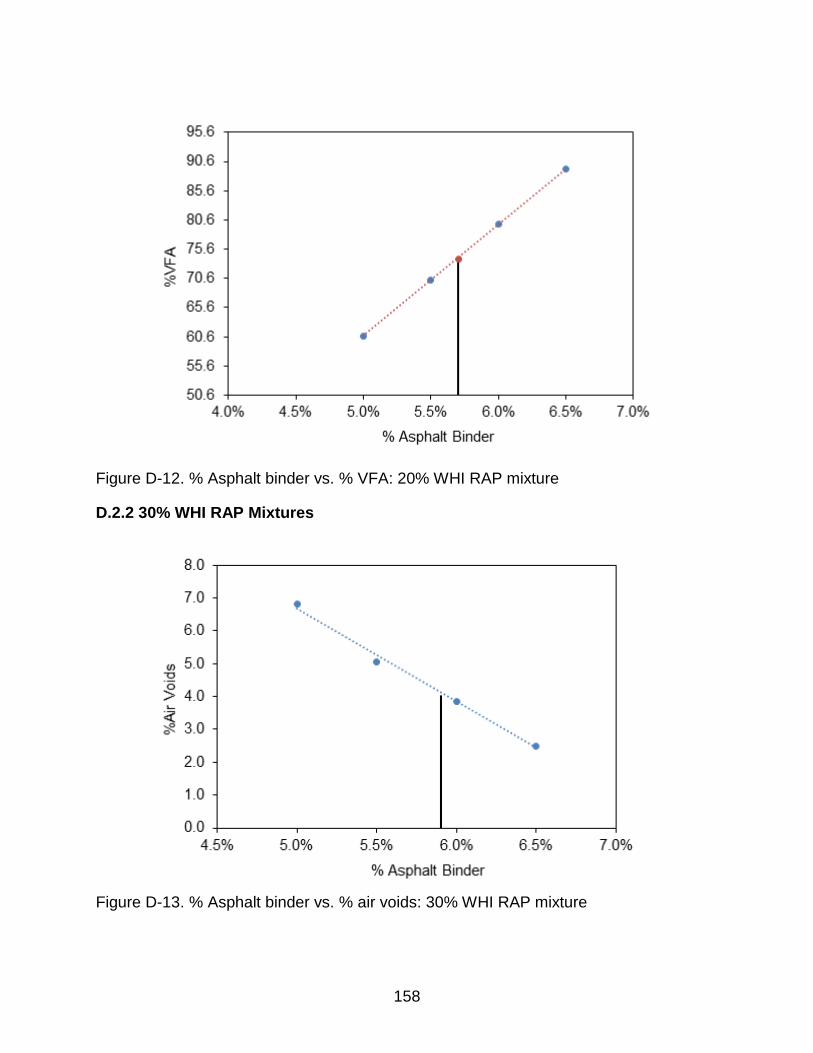
158
Figure D-12. % Asphalt binder vs. % VFA: 20% WHI RAP mixture
D.2.2 30% WHI RAP Mixtures
Figure D-13. % Asphalt binder vs. % air voids: 30% WHI RAP mixture
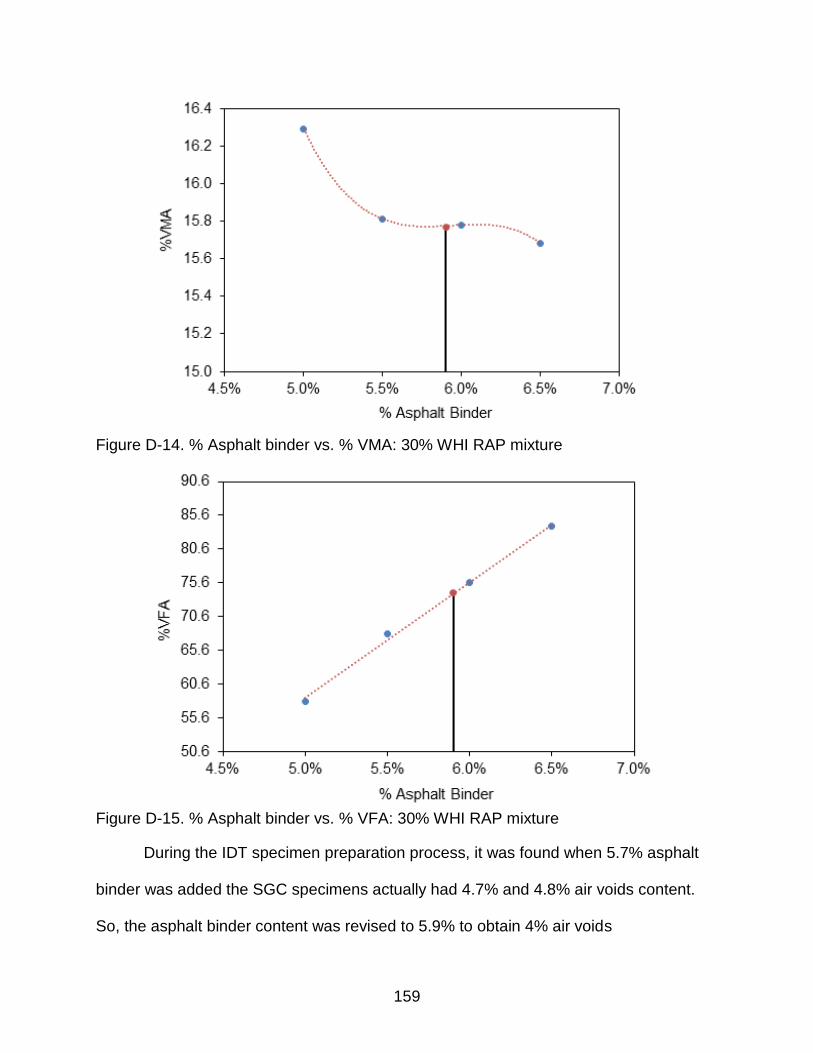
159
Figure D-14. % Asphalt binder vs. % VMA: 30% WHI RAP mixture
Figure D-15. % Asphalt binder vs. % VFA: 30% WHI RAP mixture
During the IDT specimen preparation process, it was found when 5.7% asphalt
binder was added the SGC specimens actually had 4.7% and 4.8% air voids content.
So, the asphalt binder content was revised to 5.9% to obtain 4% air voids
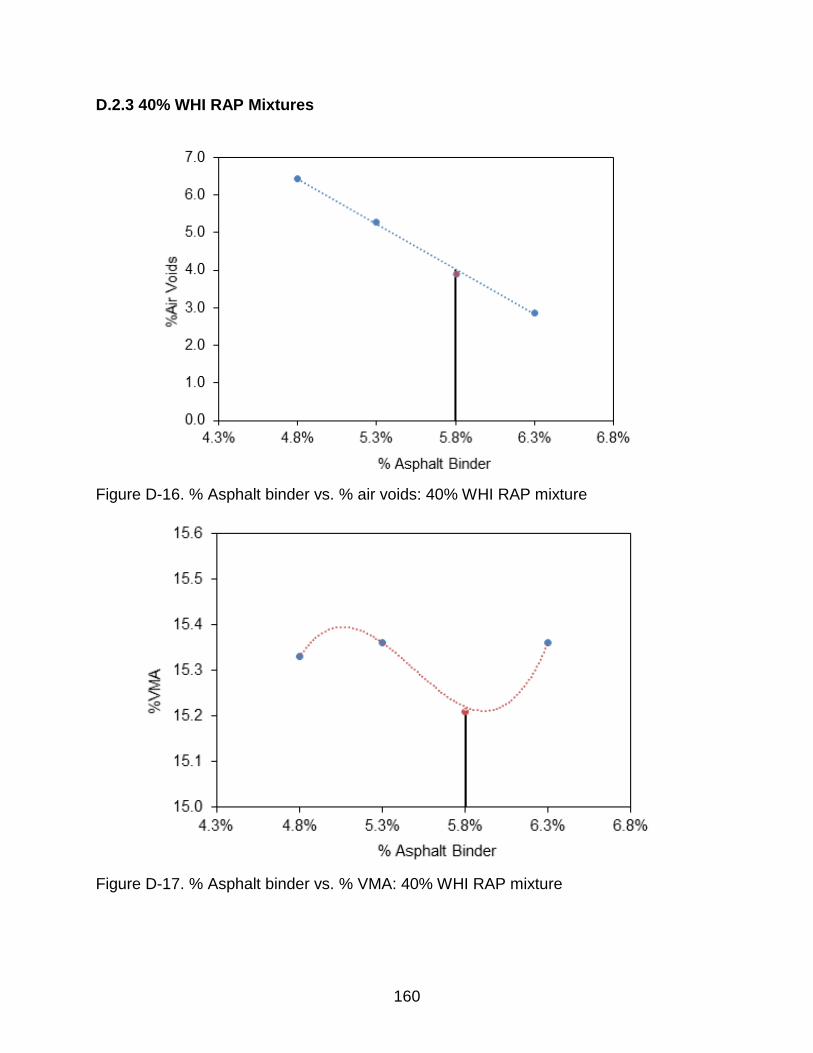
160
D.2.3 40% WHI RAP Mixtures
Figure D-16. % Asphalt binder vs. % air voids: 40% WHI RAP mixture
Figure D-17. % Asphalt binder vs. % VMA: 40% WHI RAP mixture
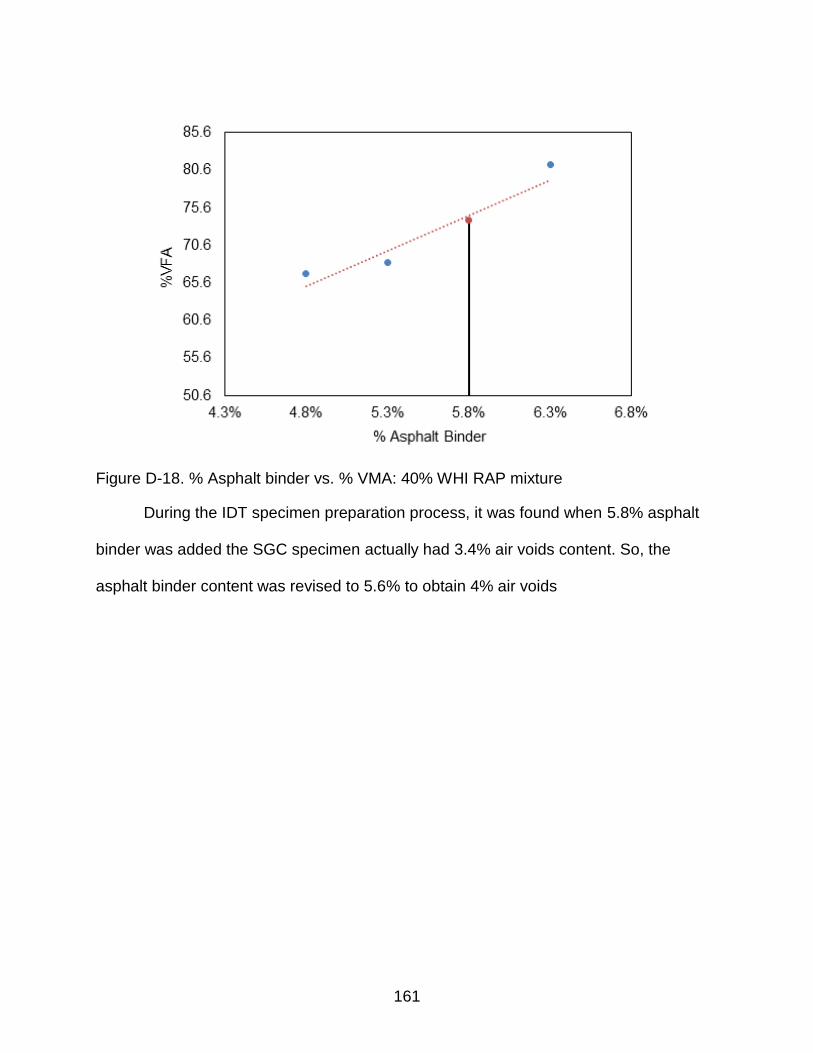
161
Figure D-18. % Asphalt binder vs. % VMA: 40% WHI RAP mixture
During the IDT specimen preparation process, it was found when 5.8% asphalt
binder was added the SGC specimen actually had 3.4% air voids content. So, the
asphalt binder content was revised to 5.6% to obtain 4% air voids
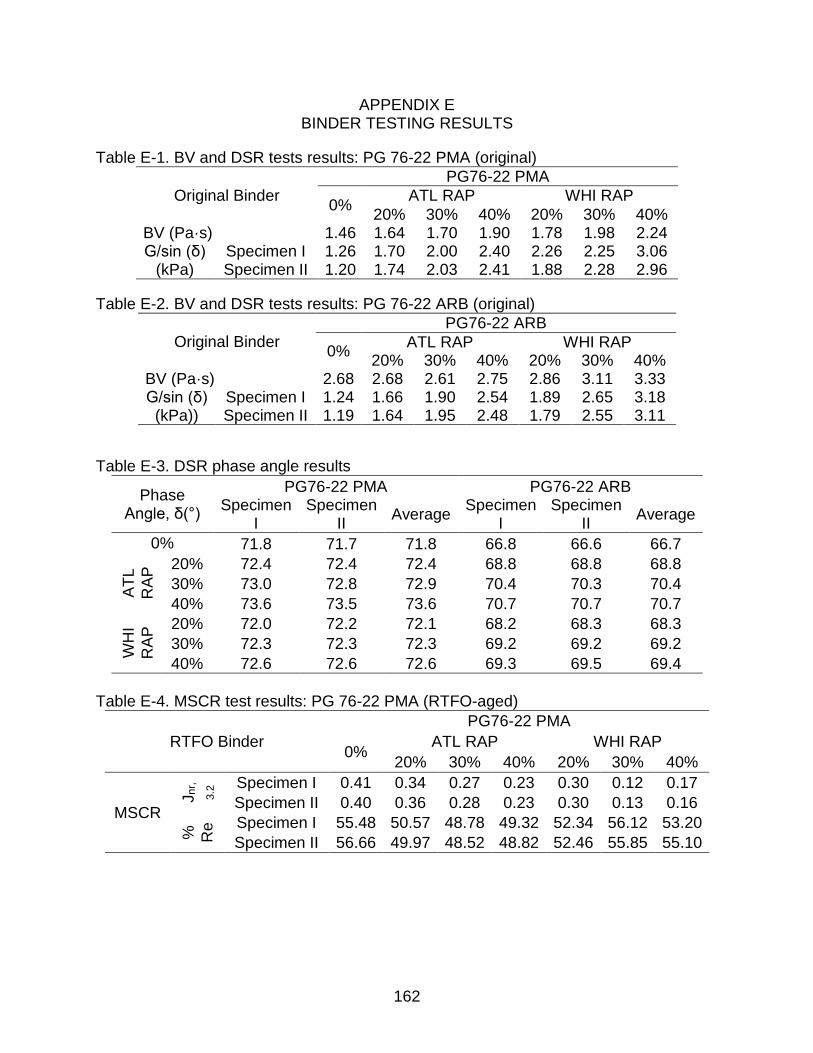
162
APPENDIX E BINDER TESTING RESULTS
Table E-1. BV and DSR tests results: PG 76-22 PMA (original)
Original Binder
PG76-22 PMA
0% ATL RAP WHI RAP
20% 30% 40% 20% 30% 40% BV (Pa·s) 1.46 1.64 1.70 1.90 1.78 1.98 2.24 G/sin (δ)
(kPa) Specimen I 1.26 1.70 2.00 2.40 2.26 2.25 3.06 Specimen II 1.20 1.74 2.03 2.41 1.88 2.28 2.96
Table E-2. BV and DSR tests results: PG 76-22 ARB (original)
Original Binder
PG76-22 ARB
0% ATL RAP WHI RAP
20% 30% 40% 20% 30% 40% BV (Pa·s) 2.68 2.68 2.61 2.75 2.86 3.11 3.33 G/sin (δ)
(kPa)) Specimen I 1.24 1.66 1.90 2.54 1.89 2.65 3.18 Specimen II 1.19 1.64 1.95 2.48 1.79 2.55 3.11
Table E-3. DSR phase angle results
Phase Angle, δ(°)
PG76-22 PMA PG76-22 ARB Specimen
I Specimen
II Average
Specimen I
Specimen II
Average
0% 71.8 71.7 71.8 66.8 66.6 66.7
AT
L
RA
P 20% 72.4 72.4 72.4 68.8 68.8 68.8
30% 73.0 72.8 72.9 70.4 70.3 70.4
40% 73.6 73.5 73.6 70.7 70.7 70.7
WH
I
RA
P 20% 72.0 72.2 72.1 68.2 68.3 68.3
30% 72.3 72.3 72.3 69.2 69.2 69.2
40% 72.6 72.6 72.6 69.3 69.5 69.4
Table E-4. MSCR test results: PG 76-22 PMA (RTFO-aged)
RTFO Binder
PG76-22 PMA
0% ATL RAP WHI RAP
20% 30% 40% 20% 30% 40%
MSCR
Jnr,
3.2
Specimen I 0.41 0.34 0.27 0.23 0.30 0.12 0.17
Specimen II 0.40 0.36 0.28 0.23 0.30 0.13 0.16
% Re
Specimen I 55.48 50.57 48.78 49.32 52.34 56.12 53.20
Specimen II 56.66 49.97 48.52 48.82 52.46 55.85 55.10
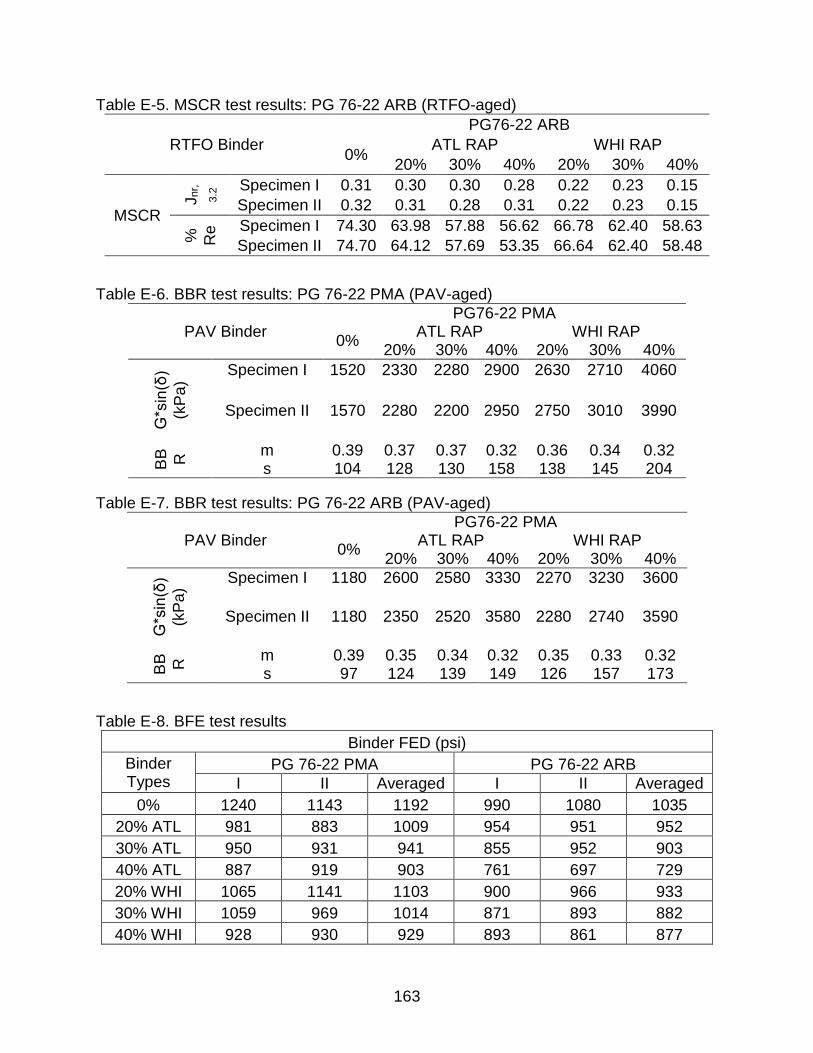
163
Table E-5. MSCR test results: PG 76-22 ARB (RTFO-aged)
RTFO Binder
PG76-22 ARB
0% ATL RAP WHI RAP
20% 30% 40% 20% 30% 40%
MSCR
Jnr,
3.2
Specimen I 0.31 0.30 0.30 0.28 0.22 0.23 0.15
Specimen II 0.32 0.31 0.28 0.31 0.22 0.23 0.15 % Re
Specimen I 74.30 63.98 57.88 56.62 66.78 62.40 58.63
Specimen II 74.70 64.12 57.69 53.35 66.64 62.40 58.48
Table E-6. BBR test results: PG 76-22 PMA (PAV-aged)
PAV Binder PG76-22 PMA
0% ATL RAP WHI RAP
20% 30% 40% 20% 30% 40%
G*s
in(δ
)
(kP
a)
Specimen I 1520 2330 2280 2900 2630 2710 4060
Specimen II 1570 2280 2200 2950 2750 3010 3990
BB R m 0.39 0.37 0.37 0.32 0.36 0.34 0.32
s 104 128 130 158 138 145 204
Table E-7. BBR test results: PG 76-22 ARB (PAV-aged)
PAV Binder PG76-22 PMA
0% ATL RAP WHI RAP
20% 30% 40% 20% 30% 40%
G*s
in(δ
)
(kP
a)
Specimen I 1180 2600 2580 3330 2270 3230 3600
Specimen II 1180 2350 2520 3580 2280 2740 3590
BB R m 0.39 0.35 0.34 0.32 0.35 0.33 0.32
s 97 124 139 149 126 157 173
Table E-8. BFE test results
Binder FED (psi)
Binder Types
PG 76-22 PMA PG 76-22 ARB
I II Averaged I II Averaged
0% 1240 1143 1192 990 1080 1035
20% ATL 981 883 1009 954 951 952
30% ATL 950 931 941 855 952 903
40% ATL 887 919 903 761 697 729
20% WHI 1065 1141 1103 900 966 933
30% WHI 1059 969 1014 871 893 882
40% WHI 928 930 929 893 861 877
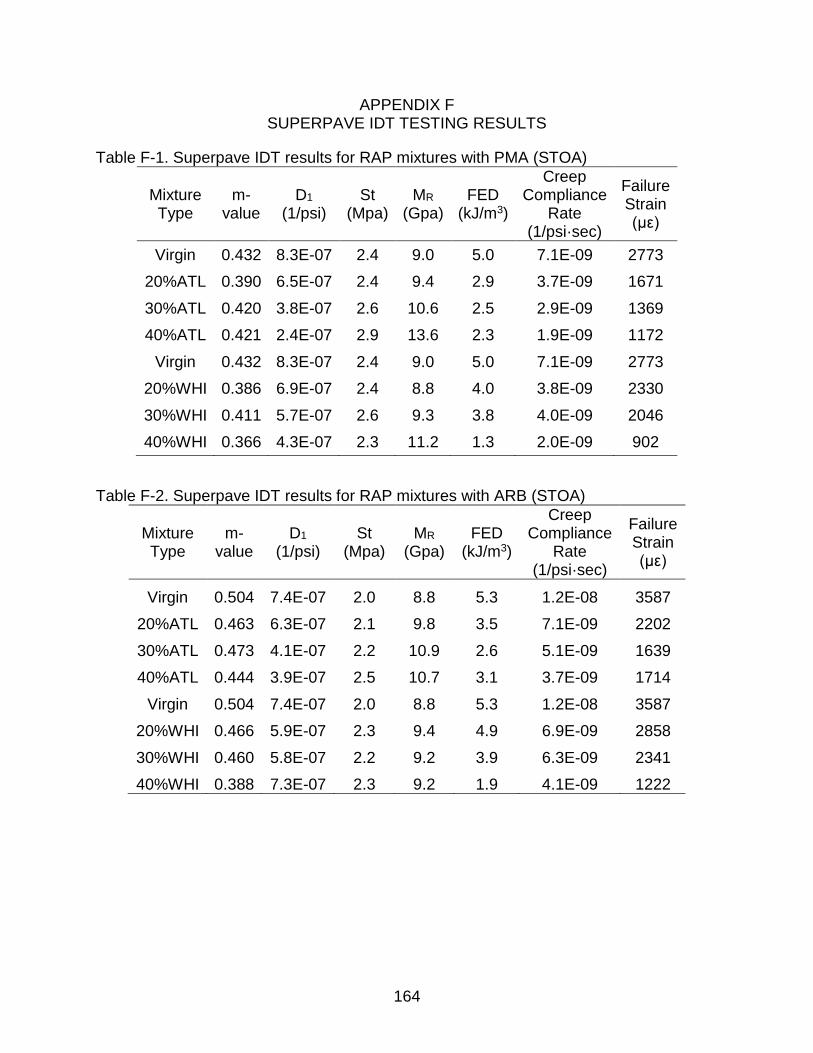
164
APPENDIX F SUPERPAVE IDT TESTING RESULTS
Table F-1. Superpave IDT results for RAP mixtures with PMA (STOA)
Mixture Type
m-value
D1 (1/psi)
St (Mpa)
MR (Gpa)
FED (kJ/m3)
Creep Compliance
Rate (1/psi·sec)
Failure Strain (με)
Virgin 0.432 8.3E-07 2.4 9.0 5.0 7.1E-09 2773
20%ATL 0.390 6.5E-07 2.4 9.4 2.9 3.7E-09 1671
30%ATL 0.420 3.8E-07 2.6 10.6 2.5 2.9E-09 1369
40%ATL 0.421 2.4E-07 2.9 13.6 2.3 1.9E-09 1172
Virgin 0.432 8.3E-07 2.4 9.0 5.0 7.1E-09 2773
20%WHI 0.386 6.9E-07 2.4 8.8 4.0 3.8E-09 2330
30%WHI 0.411 5.7E-07 2.6 9.3 3.8 4.0E-09 2046
40%WHI 0.366 4.3E-07 2.3 11.2 1.3 2.0E-09 902
Table F-2. Superpave IDT results for RAP mixtures with ARB (STOA)
Mixture Type
m-value
D1 (1/psi)
St (Mpa)
MR (Gpa)
FED (kJ/m3)
Creep Compliance
Rate (1/psi·sec)
Failure Strain (με)
Virgin 0.504 7.4E-07 2.0 8.8 5.3 1.2E-08 3587
20%ATL 0.463 6.3E-07 2.1 9.8 3.5 7.1E-09 2202
30%ATL 0.473 4.1E-07 2.2 10.9 2.6 5.1E-09 1639
40%ATL 0.444 3.9E-07 2.5 10.7 3.1 3.7E-09 1714
Virgin 0.504 7.4E-07 2.0 8.8 5.3 1.2E-08 3587
20%WHI 0.466 5.9E-07 2.3 9.4 4.9 6.9E-09 2858
30%WHI 0.460 5.8E-07 2.2 9.2 3.9 6.3E-09 2341
40%WHI 0.388 7.3E-07 2.3 9.2 1.9 4.1E-09 1222

165
Table F-3. Superpave IDT results for RAP mixtures with PMA (LTOA+CPPC)
Mixture Type
m-value
D1 (1/psi)
St (Mpa)
MR (Gpa)
FED (kJ/m3)
Creep Compliance
Rate (1/psi·sec)
Failure Strain (με)
ER
Virgin 0.362 7.6E-7 2.6 10.4 2.6 3.3E-09 1464 2.83
20%ATL 0.337 4.7E-7 2.6 12.1 1.5 1.6E-09 901 3.00
30%ATL 0.314 5.0E-7 2.8 12.3 1.5 1.4E-09 869 3.37
40%ATL 0.357 3.2E-7 2.7 13.1 1.3 1.3E-09 727 3.14
Virgin 0.407 9.3E-7 2.3 9.3 4.0 6.3E-09 2334 2.74
20%WHI 0.397 7.0E-7 2.4 9.1 3.2 4.3E-09 1777 3.05
30%WHI 0.383 4.9E-7 2.6 10.9 2.6 2.6E-09 1412 3.74
40%WHI 0.353 4.7E-7 2.6 11.7 1.9 1.9E-09 1039 3.41
Table F-4. Superpave IDT results for RAP mixtures with ARB (LTOA+CPPC)
Mixture Type
m-value
D1 (1/psi)
St (Mpa)
MR (Gpa)
FED (kJ/m3)
Creep Compliance
Rate (1/psi·sec)
Failure Strain (με)
ER
Virgin 0.407 9.3E-07 2.3 9.3 4.0 6.3E-09 2334 2.74
20%ATL 0.397 7.0E-07 2.4 9.1 3.2 4.3E-09 1777 3.05
30%ATL 0.383 4.9E-07 2.6 10.9 2.6 2.6E-09 1412 3.74
40%ATL 0.353 4.7E-07 2.6 11.7 1.9 1.9E-09 1039 3.41
Virgin 0.407 9.3E-07 2.3 9.3 4.0 6.3E-09 2334 2.74
20%WHI 0.378 8.3E-07 2.5 8.5 3.4 4.2E-09 1900 3.11
30%WHI 0.301 8.6E-07 2.5 9.1 2.5 2.1E-09 1438 4.18
40%WHI 0.260 7.1E-07 2.2 10.4 1.2 1.1E-09 850.27 3.71
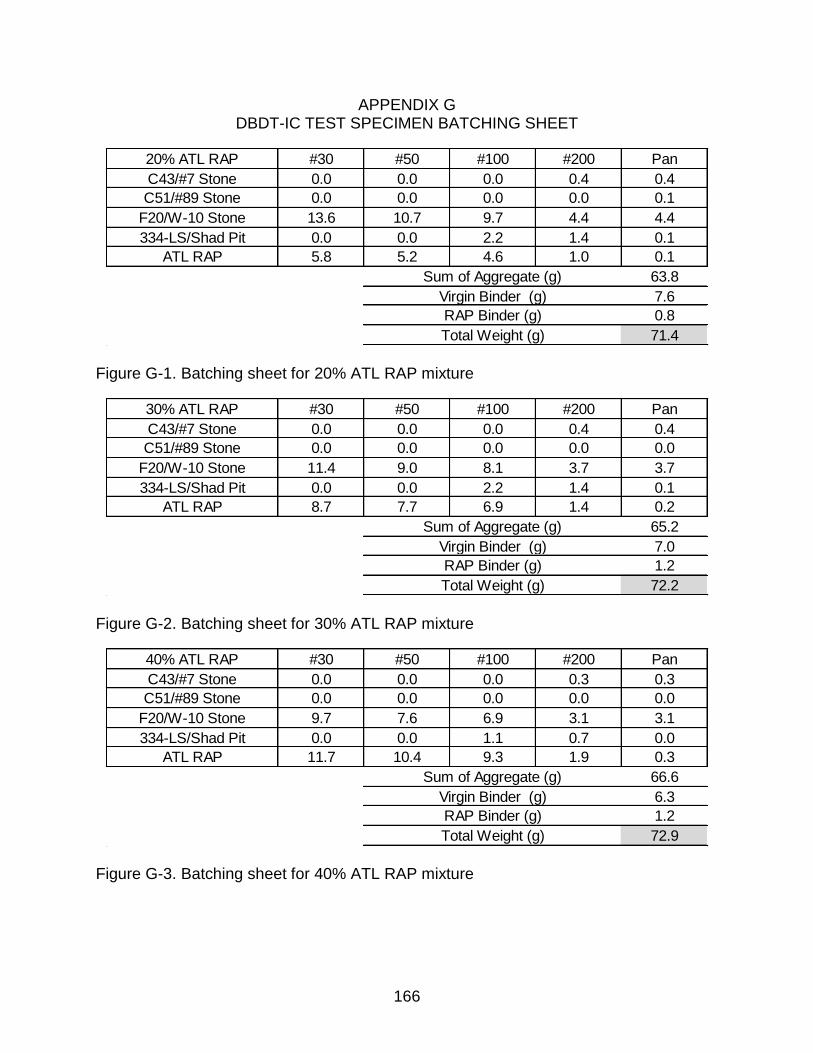
166
APPENDIX G DBDT-IC TEST SPECIMEN BATCHING SHEET
Figure G-1. Batching sheet for 20% ATL RAP mixture
Figure G-2. Batching sheet for 30% ATL RAP mixture
Figure G-3. Batching sheet for 40% ATL RAP mixture
#30 #50 #100 #200 Pan
0.0 0.0 0.0 0.4 0.4
0.0 0.0 0.0 0.0 0.1
13.6 10.7 9.7 4.4 4.4
0.0 0.0 2.2 1.4 0.1
5.8 5.2 4.6 1.0 0.1
63.8
7.6
0.8
71.4
C43/#7 Stone
C51/#89 Stone
F20/W-10 Stone
334-LS/Shad Pit
Sum of Aggregate (g)
Virgin Binder (g)
RAP Binder (g)
Total Weight (g)
20% ATL RAP
ATL RAP
#30 #50 #100 #200 Pan
0.0 0.0 0.0 0.4 0.4
0.0 0.0 0.0 0.0 0.0
11.4 9.0 8.1 3.7 3.7
0.0 0.0 2.2 1.4 0.1
8.7 7.7 6.9 1.4 0.2
65.2
7.0
1.2
72.2
C43/#7 Stone
C51/#89 Stone
F20/W-10 Stone
334-LS/Shad Pit
Sum of Aggregate (g)
Virgin Binder (g)
RAP Binder (g)
Total Weight (g)
30% ATL RAP
ATL RAP
#30 #50 #100 #200 Pan
0.0 0.0 0.0 0.3 0.3
0.0 0.0 0.0 0.0 0.0
9.7 7.6 6.9 3.1 3.1
0.0 0.0 1.1 0.7 0.0
11.7 10.4 9.3 1.9 0.3
66.6
6.3
1.2
72.9
C43/#7 Stone
C51/#89 Stone
F20/W-10 Stone
334-LS/Shad Pit
Sum of Aggregate (g)
Virgin Binder (g)
RAP Binder (g)
Total Weight (g)
40% ATL RAP
ATL RAP
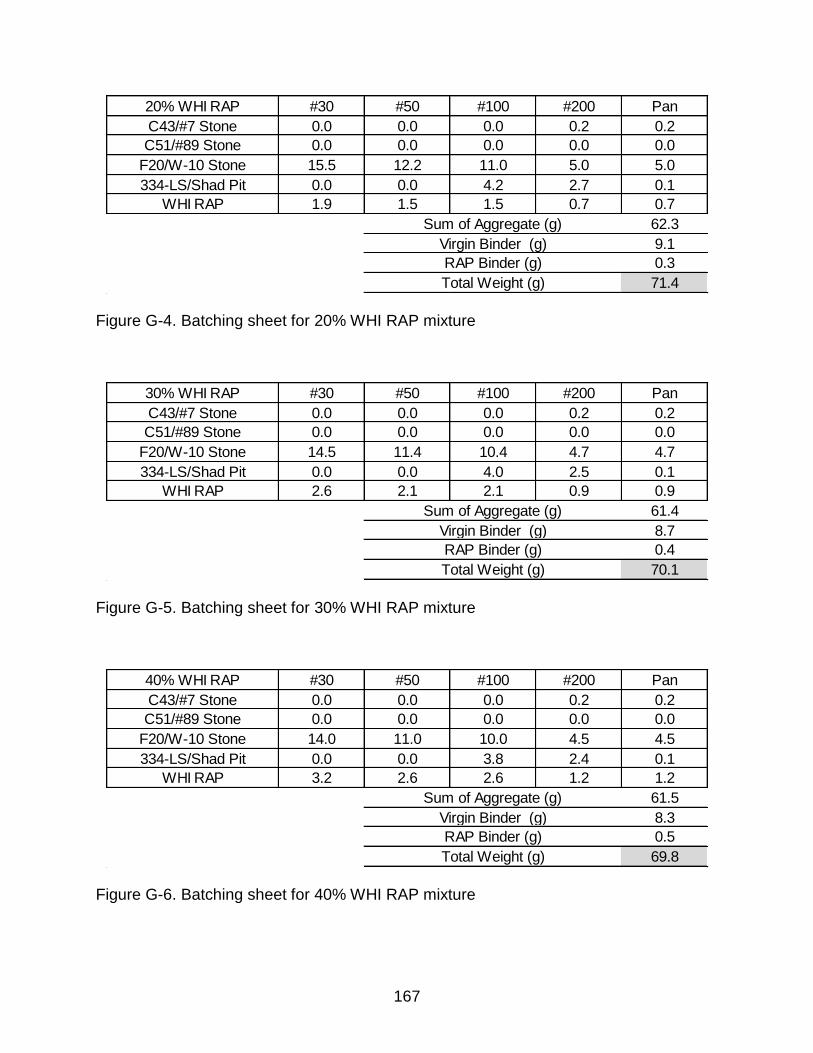
167
Figure G-4. Batching sheet for 20% WHI RAP mixture
Figure G-5. Batching sheet for 30% WHI RAP mixture
Figure G-6. Batching sheet for 40% WHI RAP mixture
#30 #50 #100 #200 Pan
0.0 0.0 0.0 0.2 0.2
0.0 0.0 0.0 0.0 0.0
15.5 12.2 11.0 5.0 5.0
0.0 0.0 4.2 2.7 0.1
1.9 1.5 1.5 0.7 0.7
62.3
9.1
0.3
71.4
C43/#7 Stone
C51/#89 Stone
F20/W-10 Stone
334-LS/Shad Pit
Sum of Aggregate (g)
Virgin Binder (g)
RAP Binder (g)
Total Weight (g)
20% WHI RAP
WHI RAP
#30 #50 #100 #200 Pan
0.0 0.0 0.0 0.2 0.2
0.0 0.0 0.0 0.0 0.0
14.5 11.4 10.4 4.7 4.7
0.0 0.0 4.0 2.5 0.1
2.6 2.1 2.1 0.9 0.9
61.4
8.7
0.4
70.1
C43/#7 Stone
C51/#89 Stone
F20/W-10 Stone
334-LS/Shad Pit
Sum of Aggregate (g)
Virgin Binder (g)
RAP Binder (g)
Total Weight (g)
30% WHI RAP
WHI RAP
#30 #50 #100 #200 Pan
0.0 0.0 0.0 0.2 0.2
0.0 0.0 0.0 0.0 0.0
14.0 11.0 10.0 4.5 4.5
0.0 0.0 3.8 2.4 0.1
3.2 2.6 2.6 1.2 1.2
61.5
8.3
0.5
69.8
C43/#7 Stone
C51/#89 Stone
F20/W-10 Stone
334-LS/Shad Pit
Sum of Aggregate (g)
Virgin Binder (g)
RAP Binder (g)
Total Weight (g)
40% WHI RAP
WHI RAP
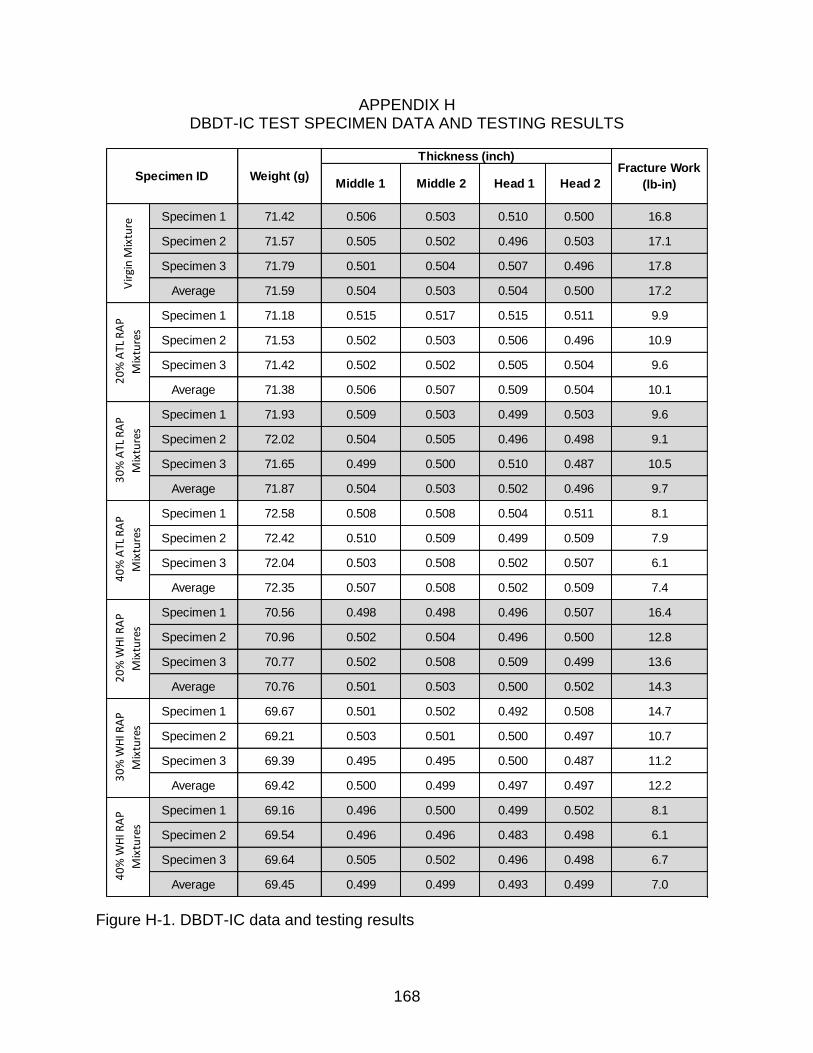
168
APPENDIX H DBDT-IC TEST SPECIMEN DATA AND TESTING RESULTS
Figure H-1. DBDT-IC data and testing results
Middle 1 Middle 2 Head 1 Head 2
Specimen 1 71.42 0.506 0.503 0.510 0.500 16.8
Specimen 2 71.57 0.505 0.502 0.496 0.503 17.1
Specimen 3 71.79 0.501 0.504 0.507 0.496 17.8
Average 71.59 0.504 0.503 0.504 0.500 17.2
Specimen 1 71.18 0.515 0.517 0.515 0.511 9.9
Specimen 2 71.53 0.502 0.503 0.506 0.496 10.9
Specimen 3 71.42 0.502 0.502 0.505 0.504 9.6
Average 71.38 0.506 0.507 0.509 0.504 10.1
Specimen 1 71.93 0.509 0.503 0.499 0.503 9.6
Specimen 2 72.02 0.504 0.505 0.496 0.498 9.1
Specimen 3 71.65 0.499 0.500 0.510 0.487 10.5
Average 71.87 0.504 0.503 0.502 0.496 9.7
Specimen 1 72.58 0.508 0.508 0.504 0.511 8.1
Specimen 2 72.42 0.510 0.509 0.499 0.509 7.9
Specimen 3 72.04 0.503 0.508 0.502 0.507 6.1
Average 72.35 0.507 0.508 0.502 0.509 7.4
Specimen 1 70.56 0.498 0.498 0.496 0.507 16.4
Specimen 2 70.96 0.502 0.504 0.496 0.500 12.8
Specimen 3 70.77 0.502 0.508 0.509 0.499 13.6
Average 70.76 0.501 0.503 0.500 0.502 14.3
Specimen 1 69.67 0.501 0.502 0.492 0.508 14.7
Specimen 2 69.21 0.503 0.501 0.500 0.497 10.7
Specimen 3 69.39 0.495 0.495 0.500 0.487 11.2
Average 69.42 0.500 0.499 0.497 0.497 12.2
Specimen 1 69.16 0.496 0.500 0.499 0.502 8.1
Specimen 2 69.54 0.496 0.496 0.483 0.498 6.1
Specimen 3 69.64 0.505 0.502 0.496 0.498 6.7
Average 69.45 0.499 0.499 0.493 0.499 7.0
40
% W
HI R
AP
Mix
ture
s
20
% W
HI R
AP
Mix
ture
s
Specimen ID
Thickness (inch)
40
% A
TL R
AP
Mix
ture
s
30
% W
HI R
AP
Mix
ture
s
Fracture Work
(lb-in)Weight (g)
Vir
gin
Mix
ture
20
% A
TL R
AP
Mix
ture
s
30
% A
TL R
AP
Mix
ture
s
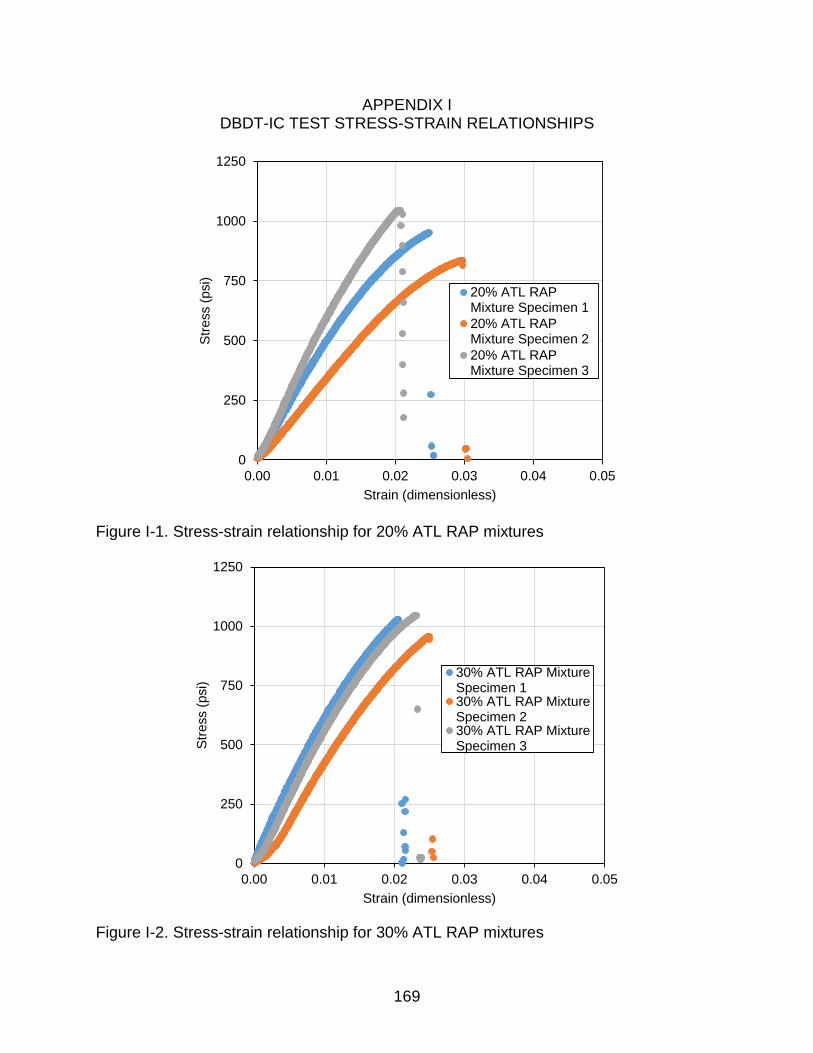
169
APPENDIX I DBDT-IC TEST STRESS-STRAIN RELATIONSHIPS
Figure I-1. Stress-strain relationship for 20% ATL RAP mixtures
Figure I-2. Stress-strain relationship for 30% ATL RAP mixtures
0
250
500
750
1000
1250
0.00 0.01 0.02 0.03 0.04 0.05
Str
ess (
psi)
Strain (dimensionless)
20% ATL RAPMixture Specimen 1
20% ATL RAPMixture Specimen 2
20% ATL RAPMixture Specimen 3
0
250
500
750
1000
1250
0.00 0.01 0.02 0.03 0.04 0.05
Str
ess (
psi)
Strain (dimensionless)
30% ATL RAP MixtureSpecimen 130% ATL RAP MixtureSpecimen 230% ATL RAP MixtureSpecimen 3
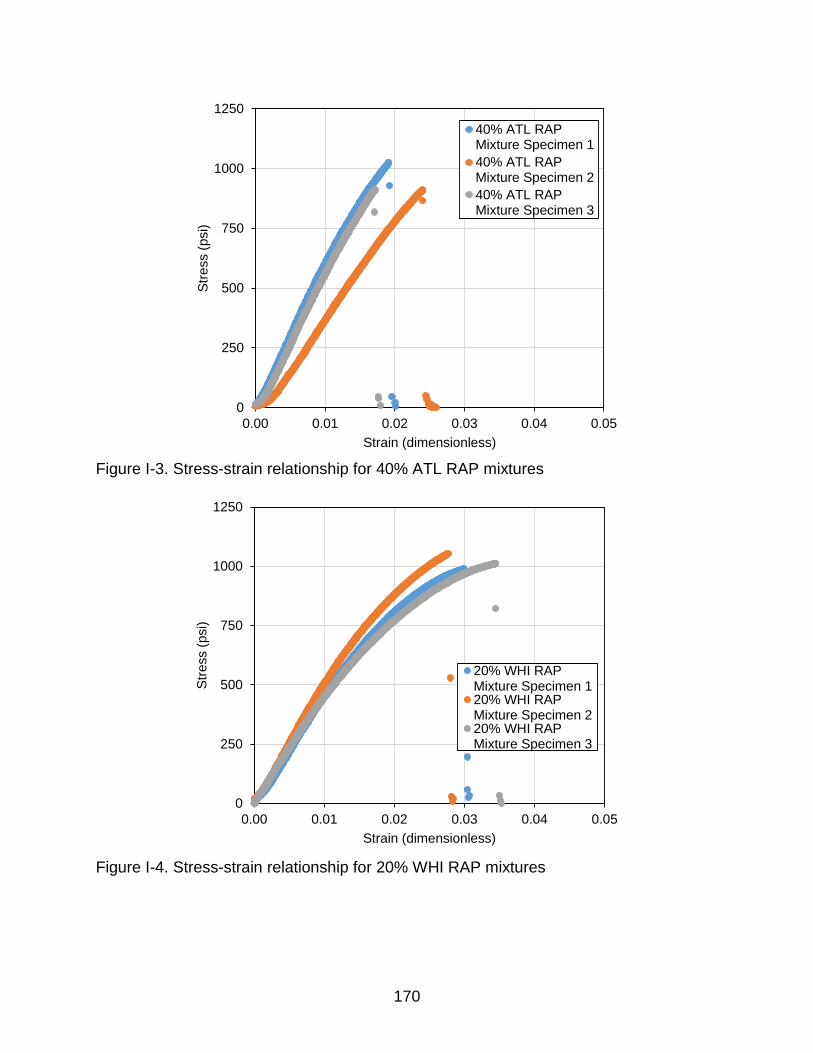
170
Figure I-3. Stress-strain relationship for 40% ATL RAP mixtures
Figure I-4. Stress-strain relationship for 20% WHI RAP mixtures
0
250
500
750
1000
1250
0.00 0.01 0.02 0.03 0.04 0.05
Str
ess (
psi)
Strain (dimensionless)
40% ATL RAPMixture Specimen 1
40% ATL RAPMixture Specimen 2
40% ATL RAPMixture Specimen 3
0
250
500
750
1000
1250
0.00 0.01 0.02 0.03 0.04 0.05
Str
ess (
psi)
Strain (dimensionless)
20% WHI RAPMixture Specimen 120% WHI RAPMixture Specimen 220% WHI RAPMixture Specimen 3
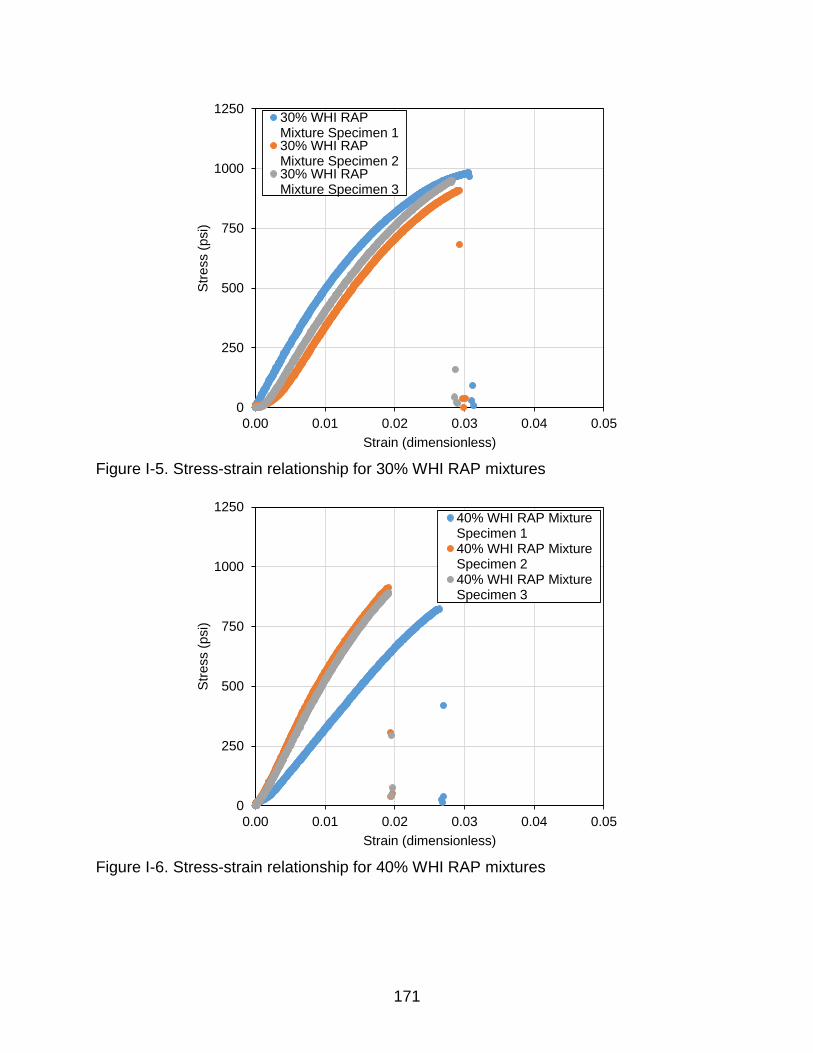
171
Figure I-5. Stress-strain relationship for 30% WHI RAP mixtures
Figure I-6. Stress-strain relationship for 40% WHI RAP mixtures
0
250
500
750
1000
1250
0.00 0.01 0.02 0.03 0.04 0.05
Str
ess (
psi)
Strain (dimensionless)
30% WHI RAPMixture Specimen 130% WHI RAPMixture Specimen 230% WHI RAPMixture Specimen 3
0
250
500
750
1000
1250
0.00 0.01 0.02 0.03 0.04 0.05
Str
ess (
psi)
Strain (dimensionless)
40% WHI RAP MixtureSpecimen 140% WHI RAP MixtureSpecimen 240% WHI RAP MixtureSpecimen 3

172
LIST OF REFERENCES
Al-Qadi, I. L., Carpenter, S.H., Roberts, G., Ozer, H., & Aurangzeb, Q. (2009). Determination of Usable Residual Asphalt Binder in RAP (Research Report ICT-09-031). Illinois Center for Transportation.
Behnia, B., Dave, E. V., Ahmen, S., Buttlar, W. G., & Reis, H. (2011). Effects of Recycled Asphalt Pavement Amounts on Low-Temperature Cracking Performance of Asphalt Mixtures Using Acoustic Emissions, In Transportation Research Record: Journal of the Transportation Research Board, No. 2208,
TRB, National Research Council, Washington, D.C., 64–71.
Bukowski, J.R. (1997). Guidelines for the Design of Superpave Mixtures Containing Reclaimed Asphalt Pavement (RAP), Memorandum, Expert Task Group Meeting, FHWA Superpave Mixtures Expert Task Group, San Antonio, TX.
Daniel, J. S., & Lachance, A. (2005) Mechanistic and Volumetric Properties of Asphalt Mixtures with Recycled Asphalt Pavement, In Transportation Research Record: Journal of the Transportation Research Board, No. 1929, TRB, National
Research Council, Washington, D.C., 28–36.
Drakos, C. A., Roque, R., Birgisson, B., & M. Novak. (2005). Identification of a Physical Model to Evaluate Rutting Performance of Asphalt Mixtures, Journal of ASTM International, Volume 2, Issue 3.
Gardiner, M.S., & Wagner. C. (1999). Use of Reclaimed Asphalt Pavement in Superpave Hot-Mix Asphalt Applications, In Transportation Research Record: Journal of the Transportation Research Board, No. 1681, TRB, National Research Council, Washington, D.C.,
Guarin, A. (2009) Interstitial Component Characterization to Evaluate Asphalt Mixture Performance, Ph.D. Dissertation, University of Florida, Gainesville, Florida.
Hansen, K.R., & Newcomb, D. E. (2011) Asphalt Pavement Mix Production Survey, Reclaimed Asphalt Pavement, Reclaimed Asphalt Shingles, Warm-mix Asphalt
Usage: 2009–2010 (Research Report 2009-2010), National Asphalt Pavement
Association.
Huang, B., Li, G., Vukosavljevic, D., Shu, X., & Egan, B. K. (2005). Laboratory Investigation of Mixing Hot-Mix Asphalt with Reclaimed Asphalt Pavement, In Transportation Research Record: Journal of the Transportation Research Board,
No. 1929, TRB, National Research Council, Washington, D.C., 37–45.
Huang, B., Shu, X., & Vukosavljevic, D. (2011). (2011) Laboratory Investigation of Cracking Resistance of Hot-Mix Asphalt Field Mixtures Containing Screened Reclaimed Asphalt Pavement, Journal of Materials in Civil Engineering, ASCE, Volume 23, Special Issue.
173
Jones, C. (2009) Survey of State RAP Use, RAP Expert Task Group Meeting Presentation, Manchester, New Hampshire.
Kandhal, P.S., & Foo, K.Y. (1997) Design Recycled Hot Mix Asphalt Mixture Using Superpave Technology (Research Report No. 96-5), National Center for Asphalt Technology.
Kemp, G.R., & Predoehl, N. H. (1981). A comparison of Field and Laboratory Environments on Asphalt Durability, Proceedings of the Association of Asphalt
Paving Technologists, Vol. 50, 492–537.
Kim, S., Roque, R., Guarin, A. & Birgisson, B. (2006). Identification and Assessment of the Dominant Aggregate Size Range (DASR) of Asphalt Mixture, Journal of the
Association of Asphalt Paving Technologists, Vol 75, 789–814.
Kim, S., Byron, T., Sholar, G. A., & Kim, J. (2007). Evaluation of Use of High Percentage of Reclaimed Asphalt Pavement (RAP) for Superpave Mixtures (Research Report FL/DOT/SMO/07-507). Florida Department of Transportation, State Materials Office.
Kim, S., Scholar, G. A., Byron, T., & Kim, J. (2009). Performance of Polymer-Modified Asphalt Mixture with Reclaimed Asphalt Pavement. In Transportation Research Record: Journal of the Transportation Research Board, No. 2126, TRB, National
Research Council, Washington, D.C., 109–114.
Kim, M., Mohammad, L. N., & Elseifi, M. A. (2012). Characterization of Fracture Properties of Asphalt Mixtures as Measured by Semicircular Bend Test and Indirect Tension Test, In Transportation Research Record: Journal of the Transportation Research Board, No. 2296, TRB, National Research Council,
Washington, D.C., 115–124.
Koh, C., Lopp, G., & Roque, R. (2009). Development of a Dog-Done Direct Tension Test (DBDT) for Asphalt Concrete. Proceeding of the 7th International RILEM Symposium ATCBM09 on Advanced Testing and Characterization of Bituminous
Materials, Rhodes, Greece, 585–596
Kowalski, K. J., McDaniel, R. S, & Olek, J. (2010). Influence of Reclaimed Asphalt Pavement (RAP) on Surface Friction. Proceedings of the 89th Annual Meeting of the Transportation Research Board, Washington, D.C.,
Kvasnak, A., West, R., Michael, J., Loria, L., Hajj, E., & Tran, N. (2010). Bulk Specific Gravity of Reclaimed Asphalt Pavement Aggregate, Evaluating the Effect of Voids in Mineral Aggregate. In Transportation Research Record: Journal of the Transportation Research Board, No. 2180, TRB, National Research Council,
Washington, D.C., 30–35.

174
Li, X., Marasteanu, M. O., Williams, R. C., & Clyne, T. R. (2008). Effect of Reclaimed Asphalt Pavement (Proportion and Type) and Binder Grade on Asphalt Mixtures, In Transportation Research Record: Journal of the Transportation Research
Board, No. 2051, TRB, National Research Council, Washington, D.C., 90–97.
McDaniel, R., & Anderson, R. M. (2001). Recommended Use of Reclaimed Asphalt Pavement in the Superpave Mix Design Method: Technician’s Manual (Research Report 452), National Cooperative Highway Research Program (NCHRP), TRB, Washington, D.C.
Maupin, G. W., Diefenderfer, S. D., & Gillespie, J. S. (2009). Virginia’s Higher Specification for Reclaimed Asphalt Pavement: Performance and Economic Evaluation, In Transportation Research Record: Journal of the Transportation Research Board, No. 2126, TRB, National Research Council, Washington, D.C.,
142–150.
McDaniel, R., Huber, G. A., & Gallivan, V. (2006). Conserving Resources and Quality with High RAP Content Mixes, HMAT: Hot Mix Asphalt Technology, National
Asphalt Pavement Association, Volume 11, pp. 44–46.
Mohammad, L.N., Negulescu, I. I., Wu, Z., Daranga, C., Daly, W. H., & Abadie, C. (2003). Investigation of the Use of Recycled Polymer-modified Asphalt Binder in Asphalt Concrete Pavements. Journal of the Association of Asphalt Paving
Technologists, Vol. 72, 551–594.
Nash, T., Sholar, G. A., & Musselman, J. A. (2011). Evaluation of High RAP asphalt Mixture Performance in Florida (Research Report FL/DOT/SMO/11-545). Florida Department of Transportation, State Materials Office.
National Cooperative Highway Research Program (2012). NCHRP Research Results Digest 370: Guidelines for Project Selection and Materials Sampling, Conditioning, and Testing in WMA Research Studies, Appendix B: Extraction and Recovery Procedures at TFGRC Asphalt Laboratories, TRB, National Research Council, Washington, D.C.
Niu, Tianying., Roque, R., & Lopp, G. (2014). Development of a Binder Fracture Test to Determine Fracture Energy Properties, Journal of the Association of Asphalt
Paving Technologists, Volume 83, 517–548.
Pappas, J. (2011). Recycling Materials Survey, RAP Expert Task Group Meeting Presentation, Irvine, California.
Roberts, F.L., Kandhal, P. S., Brown, E. R., Lee, D., & Kennedy, T. W. (1996). Hot Mix Asphalt Materials, Mixture Design, and Construction (2nd.). National Asphalt Pavement Association Education Foundation.

175
Roque, R., & W. G. Buttlar. (1992). The Development of a Measurement and Analysis System to Accurately Determine Asphalt Concrete Properties Using the Indirect Tensile Mode, Journal of the Association of Asphalt Paving Technologists, Vol.
61, 304–332.
Roque, R., Buttlar, W. G., Ruth, B. E., Tia, M., Dickson, S. W. & Reid, B. (1997). Evaluation of SHRP Indirect Tension Tester to Mitigate Cracking in Asphalt Pavements and Overlays (Research Report for B-9885 Contract), Florida Department of Transportation, University of Florida.
Roque, R., Drakos, C. A., & Dietrich, B. (2004). Development and Field Evaluation of Energy-Based Criteria for Top-Down Cracking Performance of Hot Mix Asphalt,
Journal of the Association of Asphalt Paving Technologists, Vol. 73, 229–260.
Roque, R., Kim, S., & Guarin, A. (2006). Mixture to Evaluate Gradations for Investigations in the Accelerated Pavement Testing Facility (Research Report for 00056261 Contract), Florida Department of Transportation, University of Florida
Roque, R., Chun, S., Zou, J., Lopp, G., & Villiers, C. (2011). Continuation of Superpave Projects Monitoring (Research Report for BDK-75-977-06 Contract), Florida Department of Transportation, University of Florida.
Roque, R., Simms, R., Chen, Y., Koh, C., & Lopp, G. (2012). Development of a Test Method that will Allow Evaluation and Quantification of The Effects of Healing on Asphalt Mixture (Research Report for BDK 75-977-26 Contract), Florida Department of Transportation, University of Florida.
Roque, R., Isola, M., Chun, S., Zou, J., Koh, C., & Lopp, G. (2013). Effects of Laboratory Heating, Cyclic Pore Pressure, and Cyclic Loading on Fracture
Properties of Asphalt Mixture (Research Report for BDK 977–28 Contract),
Florida Department of Transportation, University of Florida
Roque. R., Isola, M., Bekoe, M., Zou, J., & Lopp, G. (2015). Validation and Refinement of Mixture Volumetric Material Properties Identified in Superpave Monitoring Project: Phase II (Research Report for BDV31-977-18 Contract), Florida Department of Transportation, University of Florida.
Santucci, L. (2007). Recycling Asphalt Pavements-A Strategy Revisited, Pavement Research Center, Institute of Transportation Studies, University of California Berkeley.
Shah, A., McDaniel, R. S., Huber, G. A., & Gallivan, V. L. (2007). Investigation of Properties of Plant-Produced Reclaimed Asphalt Pavement Mixtures, In Transportation Research Record: Journal of the Transportation Research Board,
No.1998, TRB, National Research Council, Washington, D.C., 103–111.
Shirodkar, P., Mehta, T., Nolan, A., Sonpal, K., Norton, A., Tomlinson, C., Dubois, E., Sullivan, P., & Sauber, R. (2011). A Study to Determine the Degree of Partial
176
Blending of Reclaimed Asphalt Pavement (RAP) Binder for High RAP Hot Mix
Asphalt, Construction and Building Materials, Volume 25, Issue 1, 150–155.
Sholar, G.A. (2010). Comparison of Rutting Test Results between Laboratory Tests and Heavy Vehicle Simulator Testing (Research Report FL/DOT/SMO/10-534), Florida Department of Transportation, State Materials Office.
Florida Department of Transportation. (2016). Standard Specification for Road and Bridge Construction: Section 337 Asphalt Concrete Friction Courses. Florida Department of Transportation, Tallahassee, FL
Swamy, A. K., Mitchell, L. F., Hall, S. J., & Daniel, J. S. (2011). Impact of RAP on the Volumetric, Stiffness, Strength, and Low-Temperature Properties of HMA,
Journal of Materials in Civil Engineering, ASCE, Volume 23, Special Issue, 1490–1497.
Tran, B.T., & Hassan, R. A. (2011). Performance of Hot-Mix Asphalt Containing Recycled Asphalt Pavement, In Transportation Research Record: Journal of the Transportation Research Board, No.2205, TRB, National Research Council, Washington, D.C., 121-129.
Watson, D.E., Nordcbeck, A. V., Moore, J., Jared, D., & Wu, P. (2008). Evaluation of the Use of Reclaimed Asphalt Pavement in Stone Matrix Asphalt Mixtures, In Transportation Research Record: Journal of the Transportation Research Board,
No. 2051, TRB, National Research Council, Washington, D.C., 64–70.
West, R., Kvasnak, A., Tran, N., Powell, B., & Turner, P. (2009). Testing of Moderate and High Reclaimed Asphalt Pavement Content Mixes: Laboratory and Accelerated Field Performance Testing at the National Center for Asphalt Technology Test Track, In Transportation Research Record: Journal of the Transportation Research Board, No. 2126, TRB, National Research Council,
Washington, D.C., 100–108
West, R.C. (2008). Summary of Survey on RAP Management Practices and RAP Variability, National Center for Asphalt Technology, Alabama.
Yan. Y., Cocconcelli, C., Roque, R., Nash, T., Zou, J., Hernando, D., & Lopp G. (2015). Performance Evaluation of Alternative Polymer Modified Asphalt Binders, Road
Material and Pavement Design, EATA Issue, 389–404.
177
BIOGRAPHICAL SKETCH
Yu Yan came from China and was born in 1987. He received the Bachelor of
Science in 2010 at China University of Geoscience (Beijing), China and Master of
Science in 2012 at the West Virginia University, WV, U.S.A.
Yu Yan joined the Ph.D. program of the material group at the Department of Civil
and Costal Engineering of the University of Florida in 2012, and worked as a graduate
research assistant under the supervisory of Dr. Reynaldo Roque. He received the
Graduate School Fellowship for four years starting in 2012. He has been invited to give
presentations at several conferences, including the Transportation Research Board
Annual Meeting, Association of Asphalt Technologists Annual Meeting, as well as
several top universities in China. After graduation, he plans to work in academic or
public sector in civil engineering.
Related Documents