Evaluation of a Droplet Digital Polymerase Chain Reaction Format for DNA Copy Number Quantification Leonardo B. Pinheiro,* ,† Victoria A. Coleman, † Christopher M. Hindson, ‡ Jan Herrmann, † Benjamin J. Hindson, ‡ Somanath Bhat, † and Kerry R. Emslie † † National Measurement Institute, Lindfield, New South Wales, Australia ‡ Bio-Rad Laboratories, Inc., Pleasanton, California, United States * S Supporting Information ABSTRACT: Droplet digital polymerase chain reaction (ddPCR) is a new technology that was recently commercialized to enable the precise quantification of target nucleic acids in a sample. ddPCR measures absolute quantities by counting nucleic acid molecules encapsulated in discrete, volumetrically defined, water-in-oil droplet partitions. This novel ddPCR format offers a simple workflow capable of generating highly stable partitioning of DNA molecules. In this study, we assessed key performance parameters of the ddPCR system. A linear ddPCR response to DNA concentration was obtained from 0.16% through to 99.6% saturation in a 20,000 droplet assay corresponding to more than 4 orders of magnitude of target DNA copy number per ddPCR. Analysis of simplex and duplex assays targeting two distinct loci in the Lambda DNA genome using the ddPCR platform agreed, within their expanded uncertainties, with values obtained using a lower density microfluidic chamber based digital PCR (cdPCR). A relative expanded uncertainty under 5% was achieved for copy number concentration using ddPCR. This level of uncertainty is much lower than values typically observed for quantification of specific DNA target sequences using currently commercially available real-time and digital cdPCR technologies. T he ability to quantify nucleic acids with accuracy and precision is fundamental to many fields of basic research, molecular diagnostic tests, and commercial processes. Although real-time polymerase chain reaction (PCR) has found wide- spread utility for nucleic acid quantification, it requires the comparison of an unknown to a standard to obtain quantitative information. Real-time PCR is an analogue measurement based on monitoring amplification after each cycle of PCR using fluorescence probes. The point at which the reaction fluore- scence crosses an intensity threshold is called the cycle threshold (Ct). As many factors can influence PCR efficiency and hence the Ct value, the accuracy and precision of real-time PCR can vary widely. The principle of digital PCR was first introduced in the 1990s 1,2 and is increasingly being utilized for quantification of DNA targets. 3−5 Digital PCR is an end-point measurement that provides the ability to quantify nucleic acids without the use of standard curves. In a typical digital PCR experiment, the sample is randomly distributed into discrete partitions, such that some contain no nucleic acid template and others contain one or more template copies. The partitions are thermally cycled to end-point and then read to determine the fraction of positive partitions, from which the concentration is calculated using eq 1. =− − ⎜ ⎟ ⎛ ⎝ ⎜ ⎛ ⎝ ⎞ ⎠ ⎞ ⎠ ⎟ M P R ln 1 copy number per droplet (1) where M is the average number of target molecules per partition, P is the number of partitions containing amplified product, and R is the number of partitions or reactions analyzed. 6 Two key factors influence the reliability of digital PCR measurements: the number of reactions analyzed (R) and the number of template molecules in the assay. 7 Since concen- tration is derived by dividing the copy number estimate by the assay volume, an additional key factor, partition volume (V d ) (and its associated uncertainty) needs to be considered when measuring DNA concentration using digital PCR. Currently, the commercially available microfluidic chamber based digital PCR (cdPCR) formats contain up to a few thousand individual reactions or microfluidic chambers for each technical replicate. Using these formats, confidence in the estimated copy number can be improved by increasing the number of technical replicates and hence, the total number of reactions analyzed. However, there have been practical limitations, primarily cost, to the number of technical replicates that can be analyzed by cdPCR. A new dPCR format called Droplet Digital PCR (ddPCR) has recently been commercial- ized. 8 A single ddPCR is comprised of approximately 20 000 partitioned droplets, a number which is about 25 times the 765 Received: September 29, 2011 Accepted: November 28, 2011 Published: November 28, 2011 Article pubs.acs.org/ac © 2011 American Chemical Society 1003 dx.doi.org/10.1021/ac202578x | Anal. Chem. 2012, 84, 1003−1011

Welcome message from author
This document is posted to help you gain knowledge. Please leave a comment to let me know what you think about it! Share it to your friends and learn new things together.
Transcript
Evaluation of a Droplet Digital Polymerase Chain Reaction Formatfor DNA Copy Number QuantificationLeonardo B. Pinheiro,*,† Victoria A. Coleman,† Christopher M. Hindson,‡ Jan Herrmann,†
Benjamin J. Hindson,‡ Somanath Bhat,† and Kerry R. Emslie†
†National Measurement Institute, Lindfield, New South Wales, Australia‡Bio-Rad Laboratories, Inc., Pleasanton, California, United States
*S Supporting Information
ABSTRACT: Droplet digital polymerase chain reaction (ddPCR) is a newtechnology that was recently commercialized to enable the precisequantification of target nucleic acids in a sample. ddPCR measures absolutequantities by counting nucleic acid molecules encapsulated in discrete,volumetrically defined, water-in-oil droplet partitions. This novel ddPCRformat offers a simple workflow capable of generating highly stable partitioningof DNA molecules. In this study, we assessed key performance parameters ofthe ddPCR system. A linear ddPCR response to DNA concentration wasobtained from 0.16% through to 99.6% saturation in a 20,000 droplet assaycorresponding to more than 4 orders of magnitude of target DNA copynumber per ddPCR. Analysis of simplex and duplex assays targeting two distinct loci in the Lambda DNA genome using theddPCR platform agreed, within their expanded uncertainties, with values obtained using a lower density microfluidic chamberbased digital PCR (cdPCR). A relative expanded uncertainty under 5% was achieved for copy number concentration usingddPCR. This level of uncertainty is much lower than values typically observed for quantification of specific DNA target sequencesusing currently commercially available real-time and digital cdPCR technologies.
The ability to quantify nucleic acids with accuracy andprecision is fundamental to many fields of basic research,
molecular diagnostic tests, and commercial processes. Althoughreal-time polymerase chain reaction (PCR) has found wide-spread utility for nucleic acid quantification, it requires thecomparison of an unknown to a standard to obtain quantitativeinformation. Real-time PCR is an analogue measurement basedon monitoring amplification after each cycle of PCR usingfluorescence probes. The point at which the reaction fluore-scence crosses an intensity threshold is called the cycle threshold(Ct). As many factors can influence PCR efficiency and hence theCt value, the accuracy and precision of real-time PCR can varywidely.The principle of digital PCR was first introduced in the
1990s1,2 and is increasingly being utilized for quantification ofDNA targets.3−5 Digital PCR is an end-point measurement thatprovides the ability to quantify nucleic acids without the use ofstandard curves. In a typical digital PCR experiment, the sampleis randomly distributed into discrete partitions, such that somecontain no nucleic acid template and others contain one ormore template copies. The partitions are thermally cycled toend-point and then read to determine the fraction of positivepartitions, from which the concentration is calculated usingeq 1.
= − − ⎜ ⎟⎛⎝⎜
⎛⎝
⎞⎠⎞⎠⎟M
PR
ln 1 copy number per droplet(1)
where M is the average number of target molecules perpartition, P is the number of partitions containing amplifiedproduct, and R is the number of partitions or reactionsanalyzed.6
Two key factors influence the reliability of digital PCRmeasurements: the number of reactions analyzed (R) and thenumber of template molecules in the assay.7 Since concen-tration is derived by dividing the copy number estimate by theassay volume, an additional key factor, partition volume (Vd)(and its associated uncertainty) needs to be considered whenmeasuring DNA concentration using digital PCR.Currently, the commercially available microfluidic chamber
based digital PCR (cdPCR) formats contain up to a fewthousand individual reactions or microfluidic chambers for eachtechnical replicate. Using these formats, confidence in theestimated copy number can be improved by increasing thenumber of technical replicates and hence, the total number ofreactions analyzed. However, there have been practicallimitations, primarily cost, to the number of technical replicatesthat can be analyzed by cdPCR. A new dPCR format calledDroplet Digital PCR (ddPCR) has recently been commercial-ized.8 A single ddPCR is comprised of approximately 20 000partitioned droplets, a number which is about 25 times the 765
Received: September 29, 2011Accepted: November 28, 2011Published: November 28, 2011
Article
pubs.acs.org/ac
© 2011 American Chemical Society 1003 dx.doi.org/10.1021/ac202578x | Anal. Chem. 2012, 84, 1003−1011
chambers of a single sample panel on a microfluidic cdPCRarray.In this study, we evaluated key factors that can influence the
reliability of results obtained from an early access beta-prototypeddPCR system (Bio-Rad, Pleasanton, CA). The linearity of theresponse and the precision over the dynamic range of the 20 000-droplet assay (referred to as 20 000-ddPCR) were assessed. Sincethe droplets are generated from a single-use eight channel dropletgenerator cartridge, we examined both the intra- and inter-cartridge repeatability of assays. Copy number concentration andratio together with their expanded uncertainties were assessedusing both a high density ddPCR technology and a lower densitycdPCR platform.
■ EXPERIMENTAL SECTION
Lambda DNA Solution and PCR Assays. Lambda DNAsolution (Fermentas) was analyzed using the primer and probesequences and concentrations for assays 2 and 5 as previouslydescribed.9 (Table S-1 in the Supporting Information). Assays2 and 5 target different regions of the Lambda DNA genome(5′ base of the amplicon is 16 541 and 44 925, respectively,in the 48 502 base pair Lambda DNA genome) and pro-duce amplicons of 188 and 76 base pair (bp), respectively.9
The Lambda DNA was used as supplied and not physically orenzymatically treated to reduce fragment length prior toanalysis.
Droplet Digital PCR Instrumentation, Workflow, andData Analysis. All experimental work including ddPCR anddroplet volume measurements was conducted at the NationalMeasurement Institute, Australia. Reaction mixtures of 20 μLvolume comprising 1× ddPCR Master Mix (Bio-Rad), relevantforward and reverse primers and probe(s) (Table S-1 in theSupporting Information), and DNA were prepared using agravimetric protocol to minimize the uncertainty due topipetting. The ddPCR reagents, except DNA, were premixedand the final reaction mix was prepared gravimetrically bycombining the DNA and PCR components (SupportingInformation S-1). Each 20 μL reaction was dispensed into aseparate well of a disposable eight channel droplet generatorcartridge (Figure 1A; Bio-Rad). A volume of 60 μL of dropletgeneration oil (Bio-Rad) was then loaded into each of thecorresponding oil wells before the consumable chip was loadedinto a beta-prototype droplet generator (Bio-Rad). The dropletgenerator applies a vacuum to each of the outlet wells togenerate droplets in the eight channels simultaneously at a rateof ∼1 000 droplets/channel/second until the complete 20 μLddPCR mixture has been partitioned into the monodispersewater-in-oil emulsion format. Each water-in-oil emulsion wastransferred by pipet to a separate well of a 96-wellpolypropylene plate (Eppendorf), heat sealed with foil, andamplified in a conventional calibrated thermal cycler(Eppendorf Mastercycler ep “S” thermocycler). Thermalcycling conditions consisted of a 10 min activation period at
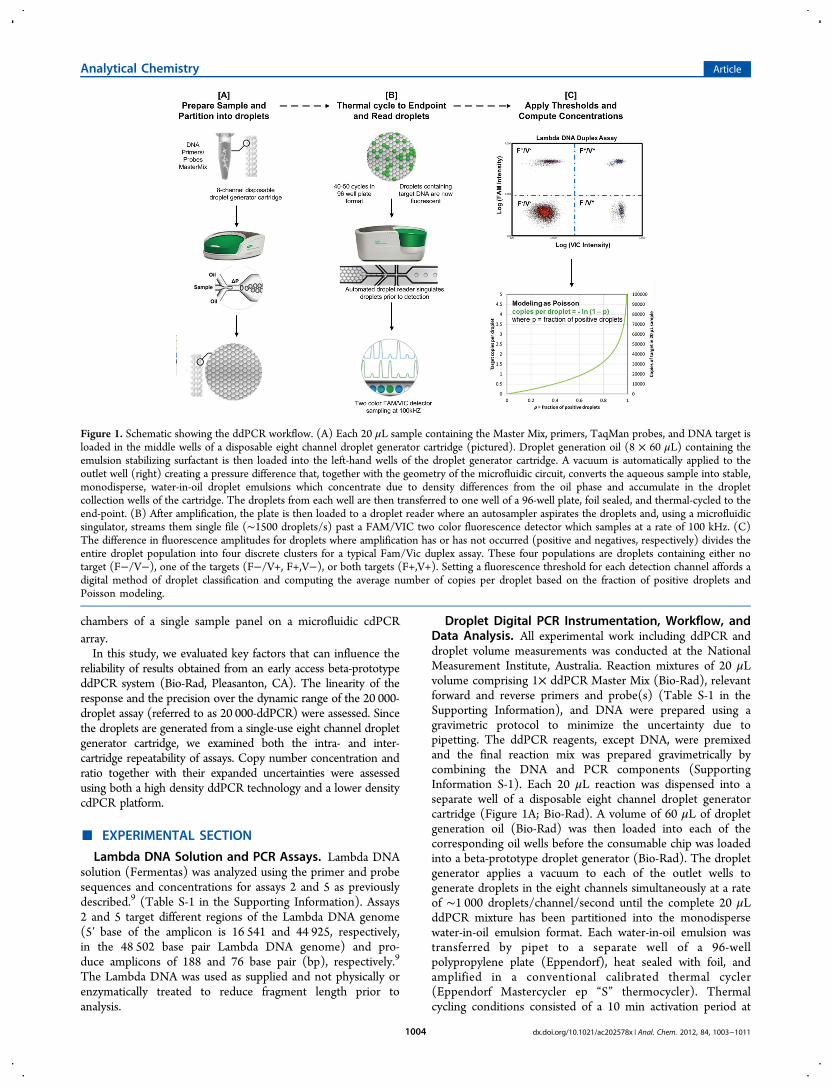
Figure 1. Schematic showing the ddPCR workflow. (A) Each 20 μL sample containing the Master Mix, primers, TaqMan probes, and DNA target isloaded in the middle wells of a disposable eight channel droplet generator cartridge (pictured). Droplet generation oil (8 × 60 μL) containing theemulsion stabilizing surfactant is then loaded into the left-hand wells of the droplet generator cartridge. A vacuum is automatically applied to theoutlet well (right) creating a pressure difference that, together with the geometry of the microfluidic circuit, converts the aqueous sample into stable,monodisperse, water-in-oil droplet emulsions which concentrate due to density differences from the oil phase and accumulate in the dropletcollection wells of the cartridge. The droplets from each well are then transferred to one well of a 96-well plate, foil sealed, and thermal-cycled to theend-point. (B) After amplification, the plate is then loaded to a droplet reader where an autosampler aspirates the droplets and, using a microfluidicsingulator, streams them single file (∼1500 droplets/s) past a FAM/VIC two color fluorescence detector which samples at a rate of 100 kHz. (C)The difference in fluorescence amplitudes for droplets where amplification has or has not occurred (positive and negatives, respectively) divides theentire droplet population into four discrete clusters for a typical Fam/Vic duplex assay. These four populations are droplets containing either notarget (F−/V−), one of the targets (F−/V+, F+,V−), or both targets (F+,V+). Setting a fluorescence threshold for each detection channel affords adigital method of droplet classification and computing the average number of copies per droplet based on the fraction of positive droplets andPoisson modeling.
Analytical Chemistry Article
dx.doi.org/10.1021/ac202578x | Anal. Chem. 2012, 84, 1003−10111004
95 °C followed by 40 cycles of a two step thermal profile of15 s at 94 °C denaturation and 60 s at 60 °C for combinedannealing-extension at 100% ramp rate and a final 10 mininactivation step at 98 °C. After thermal cycling, plates weretransferred to a beta-prototype droplet reader (Bio-Rad) thatemploys an integrated autosampler and fluidics to seriallyaspirate droplets from each well and stream them single-file,at a rate of ∼1 500 droplets/second, past a two-colorfluorescence detector sampled at a rate of 100 kHz on bothFAM and VIC fluorescence channels (Figure 1B). Sampling at100 kHz affords the ability to gate outliers on a case-by-casebasis using properties of the fluorescence trace (automated byBio-Rad Signal Processing Algorithm v0.43). Discriminationbetween droplets that did not contain target (negatives) andthose which did (positives) was achieved by applying a globalfluorescence amplitude threshold in QuantaSoft (Bio-Rad), thesoftware package provided with the ddPCR system for dataacquisition and analysis. The droplet reader was calibrated onceupon installation of the ddPCR system at the National Mea-surement Institute, Australia. The simple calibration proceduregenerated an instrument-specific color compensation matrix thatwas subsequently stored on the droplet reader and automaticallyapplied to data to eliminate cross talk between FAM and VIClabeled probes. The QuantaSoft software had a factory presetvalue for droplet volume. QuantaSoft uses a proprietary signal-processing algorithm to automatically perform droplet gatingwithin each run. The threshold was set as the midpoint betweenthe average fluorescence amplitude of positives and negativedroplet clusters on each of the FAM and VIC channels (Figure 1C).Droplets appeared stable through the entire process includingpipet manipulations, thermal cycling, and reading. Rejection criteriafor excluding a well from subsequent analysis during our dynamicrange studies on the prototype droplet reader included (i) a clogdetected by the Bio-Rad Signal Processing Algorithm softwareof the droplet reader or (ii) a low number of droplets measured per20 μL PCR.Digital PCR Instrumentation and Data Analysis. Digital
PCR analysis was performed using 12.765 digital arrayson a BioMark System (Fluidigm, South San Francisco)(referred to as 765-cdPCR). The final reaction mix for eachdigital panel comprised 1000 predicted copies of Lambda DNA,1× ABI Taqman FAST PCR Mastermix with no UNG
AmpErase (Applied Biosystems Melbourne, Australia), 1×sample loading reagent (Fluidigm, South San Francisco), andrelevant forward and reverse primers and probe (Table S-1 inthe Supporting Information). To minimize the uncertaintyfrom pipetting, all PCR components excluding DNA were pre-mixed and then the final reaction mix was preparedgravimetrically by combining the DNA and PCR components.A volume of 10 μL of the reaction mix was aliquoted into eachsample inlet on the digital array with approximately 4.6 μL ofthe reaction mix distributed throughout the partitions withineach panel using an automated MX Integrated Fluidic Circuit(IFC) Controller (Fluidigm, South San Francisco). The chipsetup was randomized. No Template Controls (NTC)containing 1× TE0.1 buffer (10 mM Tris, 0.1 mM EDTA,pH 8.0) in place of DNA or blank panels containing 1× TE0.1buffer in place of DNA and primer/probes were analyzed inone or more alternate panels. Blank panels were used in orderto accommodate the chip-setup (Figure S-1 in the SupportingInformation). Digital array thermal cycling conditions consistedof a 2 min activation period at 95 °C, followed by 50 cycles of atwo-step thermal profile involving 10 s at 95 °C for denatura-tion, and 30 s at 60 °C, for combined annealing and extension.The data was analyzed using BioMark data analysis software(v3.0.2) using a manually set quality threshold of 0.01 and targetCt range of 15−50.
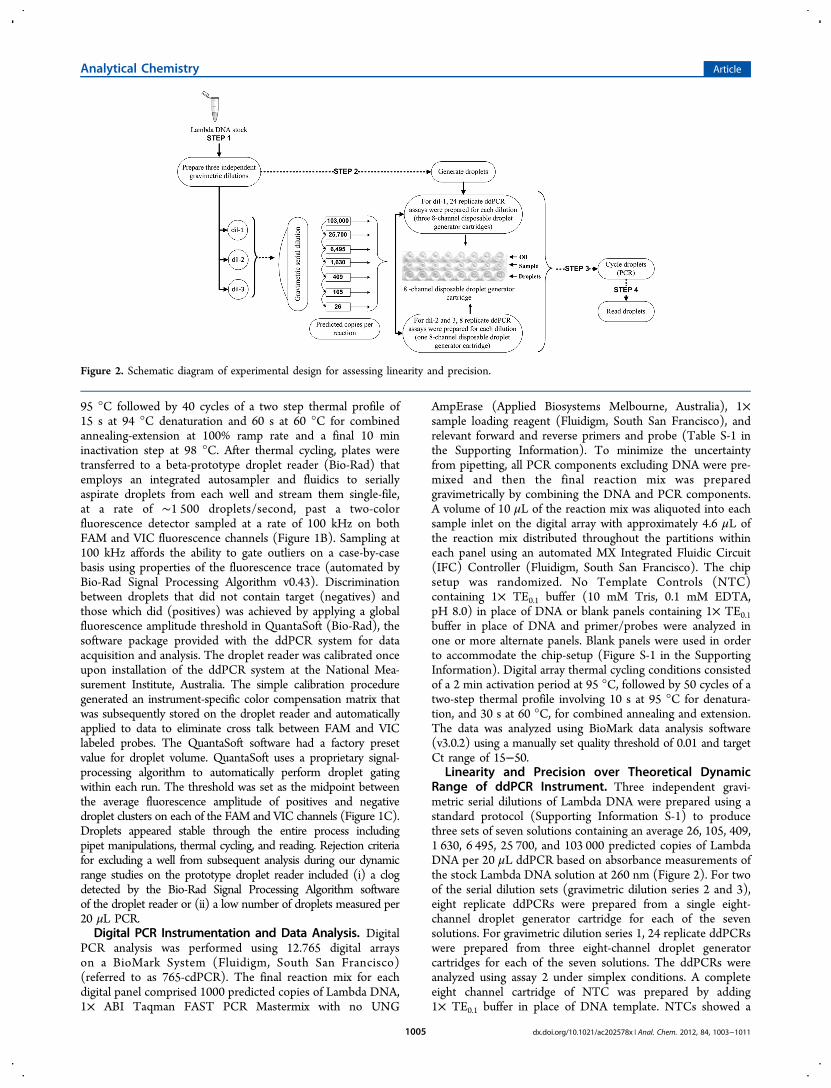
Linearity and Precision over Theoretical DynamicRange of ddPCR Instrument. Three independent gravi-metric serial dilutions of Lambda DNA were prepared using astandard protocol (Supporting Information S-1) to producethree sets of seven solutions containing an average 26, 105, 409,1 630, 6 495, 25 700, and 103 000 predicted copies of LambdaDNA per 20 μL ddPCR based on absorbance measurements ofthe stock Lambda DNA solution at 260 nm (Figure 2). For twoof the serial dilution sets (gravimetric dilution series 2 and 3),eight replicate ddPCRs were prepared from a single eight-channel droplet generator cartridge for each of the sevensolutions. For gravimetric dilution series 1, 24 replicate ddPCRswere prepared from three eight-channel droplet generatorcartridges for each of the seven solutions. The ddPCRs wereanalyzed using assay 2 under simplex conditions. A completeeight channel cartridge of NTC was prepared by adding1× TE0.1 buffer in place of DNA template. NTCs showed a
Figure 2. Schematic diagram of experimental design for assessing linearity and precision.
Analytical Chemistry Article
dx.doi.org/10.1021/ac202578x | Anal. Chem. 2012, 84, 1003−10111005
low-level background signal of approximately three positivedroplets per NTC assay, which could possibly be attributed tolow-level template contamination during the preparation ofthe reaction mixture. The data generated was used to assesslinearity and precision over the theoretical dynamic range of theinstrument in addition to intracartridge and intercartridgeddPCR precision.Comparison of DNA Concentration and Ratio Mea-
surements Using Two Different dPCR Formats underSimplex and Duplex Conditions. Three independentgravimetric serial dilutions of Lambda DNA were prepared.For each gravimetric dilution series, one dilution was selectedfor analysis using both 20 000-ddPCR and 765-cdPCR. Thisdilution provided a predicted number of 1.3 copies per 6 nLreaction (based on A260 measurement of NaOH denaturedstock Lambda DNA9) for the microfluidic 765-cdPCR which isclose to the optimal 1.5 molecules per reaction for minimizingthe uncertainty of the copy number estimate.10 Since thedroplet volume is approximately one-sixth of the chambervolume, the predicted number of copies per 1 nL dropletvolume was 0.2 copies per droplet which is less thanthe optimal number for this digital PCR format. For each of thethree gravimetric dilutions, five replicate ddPCR and five repli-cate microfluidic cdPCR were prepared and analyzed. TheddPCRs droplets were generated from one eight channel dropletgenerator cartridge, and the replicates were transferred to separatewells within a single column of a 96-well plate for thermal cyclingand droplet reading. A total of 15 NTCs containing 1× TE0.1 inplace of DNA template were similarly prepared and transferred tothree individual columns (five replicas assays each) of the 96-wellplate. NTCs showed a low-level background signal of approxi-mately two positive droplets per NTC assay. The microfluidiccdPCR assays were prepared and then analyzed across two 12.765chips (randomly designated to two panels in one chip and threepanels in the other chip). Each microfluidic cdPCR experimentcontained either one or two NTC panels per chip. All NTCpanels were negative. For ddPCR and microfluidic cdPCR, thereplicate assays were analyzed using assay 2 under simplex con-ditions. A similar experimental setup was used for analysis withassay 5 under simplex conditions and for both assays 2 and 5under duplex conditions.Optical Microscope Imaging to Determine Droplet
Volume. The average droplet volume was independentlymeasured at the National Measurement Institute, Australia, tocompare with that quoted by the ddPCR instrument manu-facturer (BioRad, personal communication), by measurement ofdroplets generated from 16 different channels. Droplets used foroptical imaging to determine droplet volume were preparedusing the same reagents as used for ddPCR estimation of LambdaDNA concentration. Either three or four wells were randomlyselected from each of five different droplet generator cartridgesfor this analysis. Between 61 and 77 droplets were measuredfrom each channel providing measurement of 1 122 droplets intotal.The droplets were transferred by pipet into 1 μ-Slide VI flat
uncoated microscopy chambers (IBIDI Germany) that hadbeen prefilled with droplet generation oil (Bio-Rad). Afterfilling, the slides were gently held at an angle to allow a uniformmonolayer of droplets to develop at the upper oil−slideinterface for imaging. An optical microscope (Leica DM6000M)with a digital CCD camera (Leica DFC490) was used to imagethe droplets. Images were recorded under uniform illuminationin a bright field, using a HC PL FLUOTAR 20×/0.50 BD/
Coverglass: O/ICT upright: K2+D (K3+D1)/ICR: D1/D/thread: M32/FWD: 1.27 objective with numerical aperture 5, toproduce images at 200× apparent magnification. A 12 V 100 Wtungsten halogen lamp was used as the illumination source.Digital images were collected on a computer running the LeicaApplication Suite Software v3.5. Images were captured ininterlaced large high-quality format, corresponding to an imagesize of 3264 × 2448 pixels.The x and y length scales of the microscope/camera system
were calibrated using a stage micrometer, model MW-1540.Calibration values indicated the CCD comprised a square pixelarray to within the limits of relative uncertainty of the scale barmeasurement of 0.1%. The calibration was repeated by placingone 1 μ-Slide VI filled with droplet generation oil over themicrometer features to investigate the impact of refractive indexdifferences of the slide−oil interface. A change of the calibra-tion of less than 0.1% was observed which is of the same orderas the uncertainty of the calibration.ImageJ software v1.4211 was used for analysis of the digital
images. Images were first converted to a bit depth of 8-bit forprocessing. The edges of the droplets were identified using the“find edges” algorithm. The image was then inverted, andthe edges of the droplets were identified by thresholding theimages. To enable detection of the full droplet, a “fill holes”algorithm was run after noise reduction and despeckling.The image was then thresholded again to achieve detectionof the entire droplet. The watershed algorithm implementedin the ImageJ software was used to separate touching drop-lets. Droplets on the edge of the image were excluded fromanalysis.The binary images of the droplets were then analyzed. The
major and minor axis of an elliptical fit to the dropletoutline were determined and used to calculate the area in(pixels)2 of an ellipse of equivalent dimensions. This valuewas then used to determine the diameter of a circle of anequivalent area. This equivalent circular diameter, measuredin pixels, was converted to length units by applying theconversion factor between the length measured in pixel unitsand length measured in micrometers determined from theinstrument calibration. Finally, the equivalent spherical volumeof a sphere having the equivalent circular diameter wascalculated.The sensitivity of the droplet size to the focus was
investigated by analyzing images taken at focal planes displacedby up to ±6 μm from ideal focus. The resulting variation of themeasured volume due to minor out of focus variationintroduced during image data collection was found to be lessthan 1.4% (Figure S-2 in the Supporting Information).
Determination of Stock DNA Copy Number Concen-tration from ddPCR and cdPCR Data. The numberof accepted droplet reactions in each ddPCR, R, was between10 000 and 18 000. The droplet copy number concentration,Td, was calculated by multiplying M by 1000/Vd, where Vd isthe mean droplet volume (nL) (eq 2).
= − − μ⎜ ⎟⎛⎝⎜
⎛⎝
⎞⎠⎞⎠⎟T
VPR
1000ln 1 copy number per Ld
d (2)
The template DNA concentration in the original stocksolution, T, can then be calculated by multiplying Td by thetotal dilution factor, D, used to dilute the stock DNA solutioninto the final ddPCR solution (eq 3).
Analytical Chemistry Article
dx.doi.org/10.1021/ac202578x | Anal. Chem. 2012, 84, 1003−10111006
= − × −
μ
⎜ ⎟⎛⎝⎜
⎛⎝
⎞⎠⎞⎠⎟T
DV
PR
1000ln 1
copy number per L stock solutiond
(3)
To estimate the template copy number concentration using a12.765 cdPCR chip, R was substituted with 765 in the aboveequations since this is the number of chambers per panel.Estimation of Measurement Uncertainty. Measure-
ment uncertainty was estimated using a top-down approach.Experimental data from independent sets (such asindependent gravimetric dilutions) and replicate measure-ments was combined using the pooled relative standarddeviation. Equations 4 and 5 were used for precision data forM and copy number ratio, respectively, where ni is thenumber of replicates in the ith data set and CNRi is the ratioof the copy number concentration determined betweenassays 5 and 2. Equation 4 captures the precision of the copynumber estimate from Poisson modeling as well as otherType A components such as any variation in the volume ofdroplets generated from different channels of the dropletgenerator or in the preparation of the gravimetric dilutionseries.
=
− + − + −
+ + −
⎜ ⎟⎜ ⎟ ⎜ ⎟⎛⎝
⎞⎠
⎛⎝⎜⎜
⎞⎠⎟⎟ ⎛
⎝⎞⎠
⎛⎝⎜⎜
⎞⎠⎟⎟ ⎛
⎝⎞⎠
⎛⎝⎜⎜
⎞⎠⎟⎟
SD
M
n n n
n n n i
1 1 ... 1
...
M
SD
M
SD
M
SD
M i
i
2
1
2
2
2
1 2
prec
M M Mi
i
1
1
2
2
(4)
=
− + − + −
+ + −
⎜ ⎟⎜ ⎟ ⎜ ⎟⎛⎝
⎞⎠
⎛⎝⎜⎜
⎞⎠⎟⎟ ⎛
⎝⎞⎠
⎛⎝⎜⎜
⎞⎠⎟⎟ ⎛
⎝⎞⎠
⎛⎝⎜⎜
⎞⎠⎟⎟
SDCNR
n n n
n n n i
1 1 ... 1
...
CNR
SD
CNR
SD
CNR
SD
CNR i
i
2
1
2
2
2
1 2
CNR CNR CNRi
i
1
1
2
2
(5)
The relative standard uncertainty of the precision data wasthen determined by dividing the pooled relative standarddeviation by the square root of the number of data sets asshown in eqs 6 and 7, respectively.
=
u
M M i
SDM Mprec prec
(6)
=u
iCNRSDCNR
CNR CNRprec
(7)
The relative standard uncertainty of the droplet volume,(uVd
)/(Vd), is a Type B uncertainty evaluation (obtained frominformation such as calibration certificates and limits deducedfrom personal experience12) and was determined from theanalysis of an individual droplet image. Factors such asthe goodness of the elliptical fit, operator bias, microscopecalibration, and effect of focus were all considered in theestimation of this uncertainty. The combined standarduncertainty of the concentration based on the top-downapproach, u(T), was calculated by combining the precision data(Type A uncertainty component evaluated by statistical analysisof a series of measurements) with a Type B uncertaintycomponent associated with measurement of the droplet volumeusing eq 8. A full assessment of bias using this prototypeinstrument was not feasible. However, the dynamic rangeexperiment and the comparison with an independent cdPCRsystem provided data to make an assessment of bias from the
measurements of M.
=
+
μ
⎛⎝⎜
⎞⎠⎟
⎛⎝⎜
⎞⎠⎟u T T
u
V
u
M( )
copy number per L stock solution
V M
d
2 2d prec
(8)
The standard uncertainty of the copy number ratio based onthe top-down approach, uCNR, was equivalent to the standarduncertainty of the precision data, uCNRprec
. Since the assays wererun under duplex conditions, the uncertainty associated withdroplet volume is minimized and was not considered in thisestimation.The expanded uncertainty was calculated by multiplying
the standard uncertainty by a coverage factor12 which providesa level of confidence of 95% that the true value for themeasurand falls within the expanded uncertainty. The coveragefactor varied from 2.05 to 2.18 depending on the effectivedegrees of freedom which was derived from the Welch-Satterthwaite formula12 and was influenced by the number ofreplicates and independent data sets analyzed in eachexperiment.
■ RESULTS AND DISCUSSION
Dynamic Range. The theoretical dynamic range in digitalPCR is largely determined by the number of partitions thatare analyzed. A typical ddPCR contains approximately 20 000individually partitioned droplet reactions. On the basis ofbinomial approximation, 99.5% saturation of the droplets (i.e.,100 negative droplets in a ddPCR containing 20 000 droplets)would indicate between 102 000 and 110 000 copies of targetDNA (95% confidence interval) in the 20 000-droplet reac-tion. This provides a theoretical dynamic range of 105 targetcopies.We examined the ddPCR response over concentrations
ranging from approximately 37 to 131 000 copies per 20 μL ofddPCR. This resulted in as little as 0.16% positive dropletsthrough to almost complete saturation (99.6% positivedroplets). The study, which included data from threeindependent gravimetric dilution series, comprised a total of168 ddPCRs. Less than 5% of these assays were excluded fromdata analysis. Five assays were excluded because a clog wasdetected by the droplet reader software and an additional threeassays were excluded because either no droplets or only 192droplets were detected by the droplet reader. The averagenumber of droplets read for each ddPCR was 13,825 with astandard deviation of 1,892 droplets.The ddPCR response was linear over this dynamic range,
which covered more than 4 orders of magnitude (r2 = 0.9994;Figure 3a). However, as previously described for cdPCR,7 therelative uncertainty in concentration was not constant acrossthe dynamic range. The stochastic effect associated withsampling a DNA solution increases as the concentration of theDNA solution decreases. Consequently, as the copy numberconcentration of a sample decreases, the number of targetDNA molecules in replicate ddPCR assays is more variable.This is reflected in the relative expanded uncertainty of theestimated stock DNA concentration which was 30 and 13%for the assays containing 37 and 142 copies, respectively, per20 μL of ddPCR. In comparison, the relative expanded
Analytical Chemistry Article
dx.doi.org/10.1021/ac202578x | Anal. Chem. 2012, 84, 1003−10111007
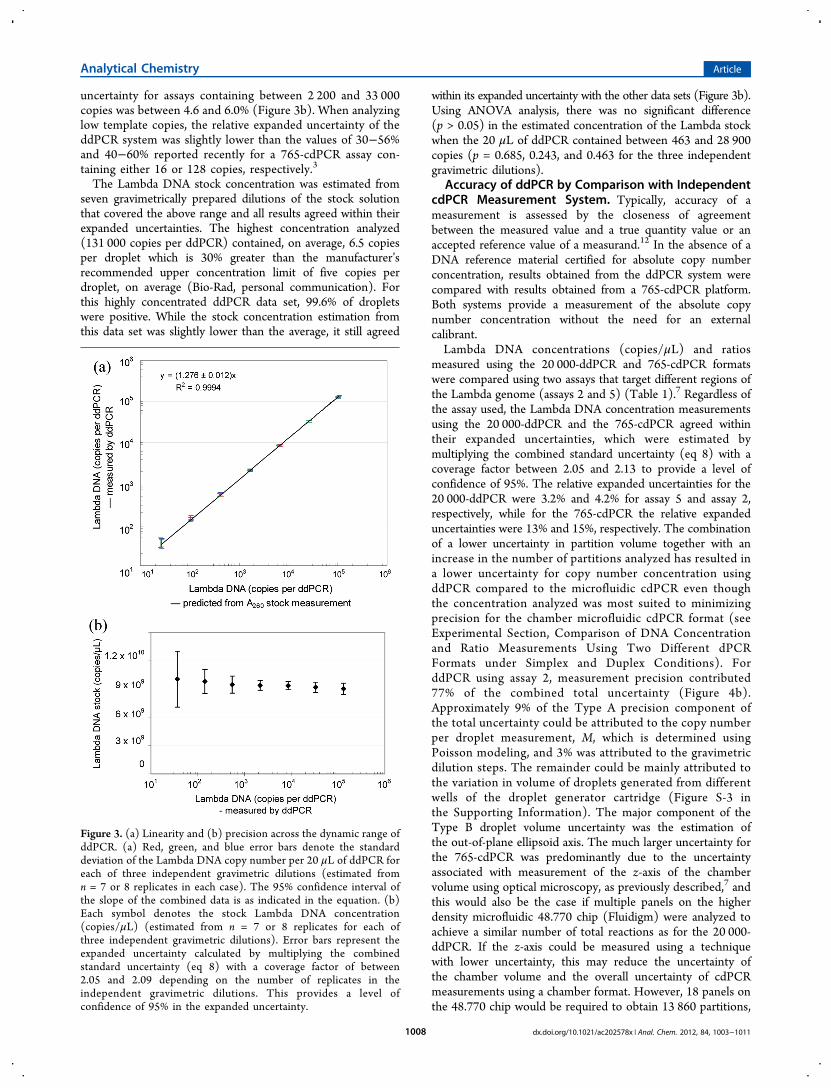
uncertainty for assays containing between 2 200 and 33 000copies was between 4.6 and 6.0% (Figure 3b). When analyzinglow template copies, the relative expanded uncertainty of theddPCR system was slightly lower than the values of 30−56%and 40−60% reported recently for a 765-cdPCR assay con-taining either 16 or 128 copies, respectively.3
The Lambda DNA stock concentration was estimated fromseven gravimetrically prepared dilutions of the stock solutionthat covered the above range and all results agreed within theirexpanded uncertainties. The highest concentration analyzed(131 000 copies per ddPCR) contained, on average, 6.5 copiesper droplet which is 30% greater than the manufacturer’srecommended upper concentration limit of five copies perdroplet, on average (Bio-Rad, personal communication). Forthis highly concentrated ddPCR data set, 99.6% of dropletswere positive. While the stock concentration estimation fromthis data set was slightly lower than the average, it still agreed
within its expanded uncertainty with the other data sets (Figure 3b).Using ANOVA analysis, there was no significant difference(p > 0.05) in the estimated concentration of the Lambda stockwhen the 20 μL of ddPCR contained between 463 and 28 900copies (p = 0.685, 0.243, and 0.463 for the three independentgravimetric dilutions).
Accuracy of ddPCR by Comparison with IndependentcdPCR Measurement System. Typically, accuracy of ameasurement is assessed by the closeness of agreementbetween the measured value and a true quantity value or anaccepted reference value of a measurand.12 In the absence of aDNA reference material certified for absolute copy numberconcentration, results obtained from the ddPCR system werecompared with results obtained from a 765-cdPCR platform.Both systems provide a measurement of the absolute copynumber concentration without the need for an externalcalibrant.Lambda DNA concentrations (copies/μL) and ratios
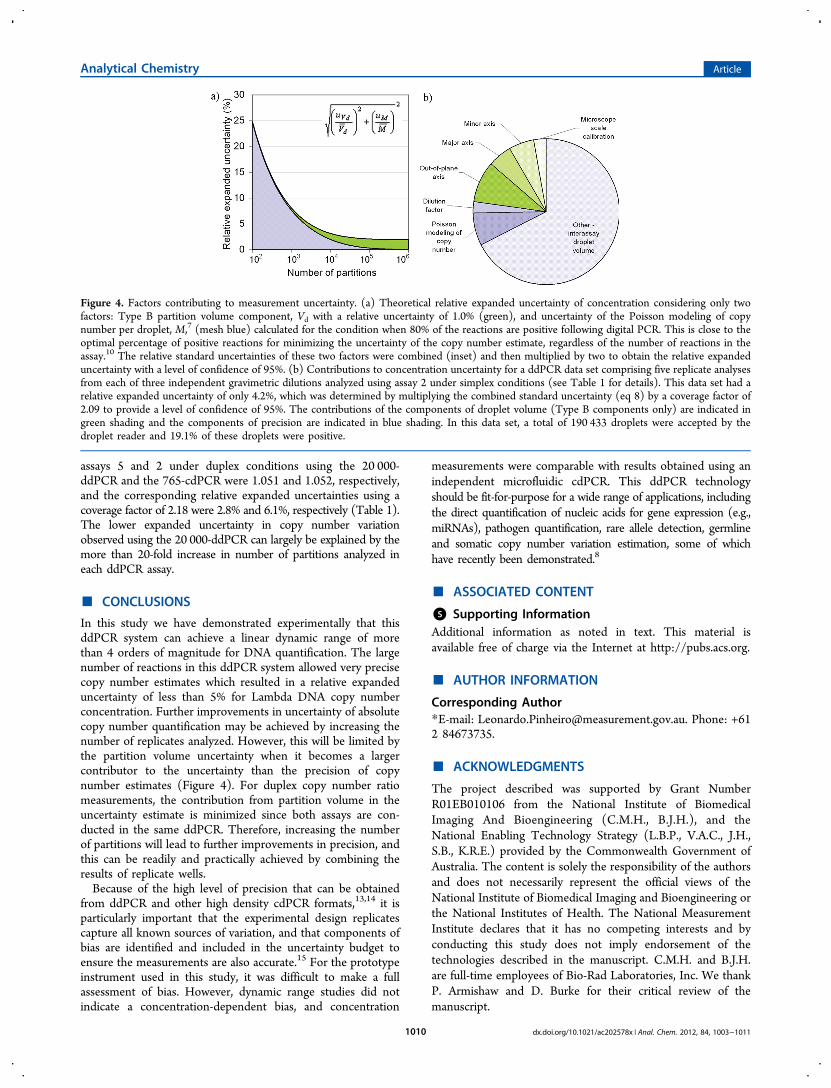
measured using the 20 000-ddPCR and 765-cdPCR formatswere compared using two assays that target different regions ofthe Lambda genome (assays 2 and 5) (Table 1).7 Regardless ofthe assay used, the Lambda DNA concentration measurementsusing the 20 000-ddPCR and the 765-cdPCR agreed withintheir expanded uncertainties, which were estimated bymultiplying the combined standard uncertainty (eq 8) with acoverage factor between 2.05 and 2.13 to provide a level ofconfidence of 95%. The relative expanded uncertainties for the20 000-ddPCR were 3.2% and 4.2% for assay 5 and assay 2,respectively, while for the 765-cdPCR the relative expandeduncertainties were 13% and 15%, respectively. The combinationof a lower uncertainty in partition volume together with anincrease in the number of partitions analyzed has resulted ina lower uncertainty for copy number concentration usingddPCR compared to the microfluidic cdPCR even thoughthe concentration analyzed was most suited to minimizingprecision for the chamber microfluidic cdPCR format (seeExperimental Section, Comparison of DNA Concentrationand Ratio Measurements Using Two Different dPCRFormats under Simplex and Duplex Conditions). ForddPCR using assay 2, measurement precision contributed77% of the combined total uncertainty (Figure 4b).Approximately 9% of the Type A precision component ofthe total uncertainty could be attributed to the copy numberper droplet measurement, M, which is determined usingPoisson modeling, and 3% was attributed to the gravimetricdilution steps. The remainder could be mainly attributed tothe variation in volume of droplets generated from differentwells of the droplet generator cartridge (Figure S-3 inthe Supporting Information). The major component of theType B droplet volume uncertainty was the estimation ofthe out-of-plane ellipsoid axis. The much larger uncertainty forthe 765-cdPCR was predominantly due to the uncertaintyassociated with measurement of the z-axis of the chambervolume using optical microscopy, as previously described,7 andthis would also be the case if multiple panels on the higherdensity microfluidic 48.770 chip (Fluidigm) were analyzed toachieve a similar number of total reactions as for the 20 000-ddPCR. If the z-axis could be measured using a techniquewith lower uncertainty, this may reduce the uncertainty ofthe chamber volume and the overall uncertainty of cdPCRmeasurements using a chamber format. However, 18 panels onthe 48.770 chip would be required to obtain 13 860 partitions,
Figure 3. (a) Linearity and (b) precision across the dynamic range ofddPCR. (a) Red, green, and blue error bars denote the standarddeviation of the Lambda DNA copy number per 20 μL of ddPCR foreach of three independent gravimetric dilutions (estimated fromn = 7 or 8 replicates in each case). The 95% confidence interval ofthe slope of the combined data is as indicated in the equation. (b)Each symbol denotes the stock Lambda DNA concentration(copies/μL) (estimated from n = 7 or 8 replicates for each ofthree independent gravimetric dilutions). Error bars represent theexpanded uncertainty calculated by multiplying the combinedstandard uncertainty (eq 8) with a coverage factor of between2.05 and 2.09 depending on the number of replicates in theindependent gravimetric dilutions. This provides a level ofconfidence of 95% in the expanded uncertainty.
Analytical Chemistry Article
dx.doi.org/10.1021/ac202578x | Anal. Chem. 2012, 84, 1003−10111008
and this is not a practical approach for most ddPCR appli-cations.When the number of reactions in digital PCR is less than one
thousand, the estimated copy number will tend to be a largercontributor to the uncertainty than the partition volume(Figure 4a). As the number of reactions increases, theconfidence associated with the predicted copy number andthe copy number concentration improves dramatically.However, at some point, the reaction volume will become alarger contributor to the uncertainty than the copy numbermeasurement. When this point is reached, any additionalincrease in the number of reactions will only have a smallimpact on reducing the total uncertainty (Figure 4a). When thenumber of reactions is more than 10 000, as is the case forddPCR, copy number measurement can be achieved with a veryhigh level of precision providing there are no other sources ofvariability (Figure 4a). To translate this potential improvementin precision to the concentration estimate, droplets must begenerated consistently from one assay to the next. The ddPCRdroplets are generated using an eight channel injection moldedcartridge. Significant variation in the size of droplets generatedfrom different wells either within or between cartridges wouldbe reflected in the variation in concentration estimatesfollowing ddPCR.To investigate the intra- and intercartridge copy number
concentration repeatability, a ddPCR was prepared from eachwell in three eight channel cartridges providing a total of 24replicate ddPCR assays. This process was undertaken for eachof the seven dilutions of the Lambda DNA which containedan average 26, 105, 409, 1 630, 6 495, 25 700, and 103 000predicted copies of Lambda DNA per 20 μL of ddPCR, basedon absorbance measurements of the stock Lambda DNAsolution at 260 nm. The eight replicate ddPCR from onecartridge were dispensed into the wells of one column of a 96-well plate prior to end-point PCR. For each Lambda DNAdilution, the assays prepared from three replicate cartridges
were analyzed in adjacent columns on the same 96-well plate tominimize possible contributions caused by intraplate variability.ANOVA within and between the ddPCR derived from threereplicate cartridges demonstrated no significant intracartridgeeffect at any of the Lambda DNA concentrations analyzed(p-values ranging from 0.124 to 0.716). There was no significantintercartridge effect for seven of the nine dilutions analyzed(p-values ranging from 0.153 to 0.698), implying that anyintracartridge variability in the size of droplets generated wassimilar to that of the intercartridge variability.To verify the reproducibility of droplet volume, a sample of
1 122 droplets generated from a total of 16 wells located across5 separate cartridges were imaged, and each droplet volume wasmeasured using image processing (Figure S-3 in the SupportingInformation). The mean droplet volume obtained from imageprocessing measurements was 0.868 nL. A Type B uncertaintyevaluation of an individual droplet volume measurementestimated the relative expanded uncertainty of this measure-ment as 2.0% using a coverage factor of 2.04. This measureddroplet volume and associated uncertainty agrees with themanufacturer’s independently estimated value of 0.89 nL fordroplets generated from the eight channel droplet generatorcartridges (Bio-Rad, personal communication). The relativestandard deviation of the mean interwell droplet volume for the16 wells was 2.8%. ANOVA demonstrated no significantintracartridge (p = 0.801) or intercartridge (p = 0.053) effect onthe partition volume confirming that the observed variation indroplet volume between wells was independent of the cartridge.Provided sufficient numbers of replicate wells are analyzed, thiswell-to-well variation in droplet volume is likely to be capturedwithin the precision data of replicate concentration measurements(Figure 4b) and was, therefore, not considered as a separatecomponent in the top down uncertainty estimation.Assuming that the Lambda DNA genome is intact, the copy
number ratio between assay 5 and assay 2 should result in aratio of 1.0. The Lambda DNA copy number ratio between
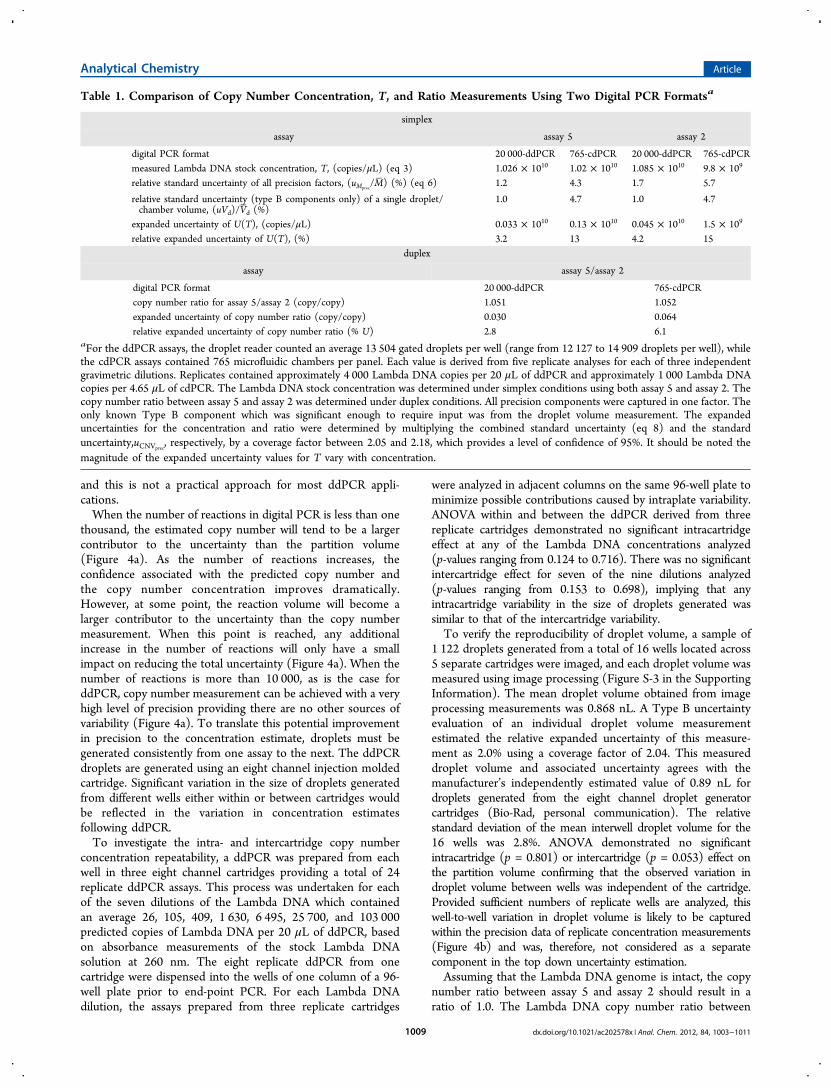
Table 1. Comparison of Copy Number Concentration, T, and Ratio Measurements Using Two Digital PCR Formatsa
simplex
assay assay 5 assay 2
digital PCR format 20 000-ddPCR 765-cdPCR 20 000-ddPCR 765-cdPCRmeasured Lambda DNA stock concentration, T, (copies/μL) (eq 3) 1.026 × 10¹⁰ 1.02 × 10¹⁰ 1.085 × 10¹⁰ 9.8 × 10⁹
relative standard uncertainty of all precision factors, (uMprec/M) (%) (eq 6) 1.2 4.3 1.7 5.7
relative standard uncertainty (type B components only) of a single droplet/chamber volume, (uVd)/Vd (%)
1.0 4.7 1.0 4.7
expanded uncertainty of U(T), (copies/μL) 0.033 × 10¹⁰ 0.13 × 10¹⁰ 0.045 × 10¹⁰ 1.5 × 10⁹
relative expanded uncertainty of U(T), (%) 3.2 13 4.2 15duplex
assay assay 5/assay 2
digital PCR format 20 000-ddPCR 765-cdPCRcopy number ratio for assay 5/assay 2 (copy/copy) 1.051 1.052expanded uncertainty of copy number ratio (copy/copy) 0.030 0.064relative expanded uncertainty of copy number ratio (% U) 2.8 6.1
aFor the ddPCR assays, the droplet reader counted an average 13 504 gated droplets per well (range from 12 127 to 14 909 droplets per well), whilethe cdPCR assays contained 765 microfluidic chambers per panel. Each value is derived from five replicate analyses for each of three independentgravimetric dilutions. Replicates contained approximately 4 000 Lambda DNA copies per 20 μL of ddPCR and approximately 1 000 Lambda DNAcopies per 4.65 μL of cdPCR. The Lambda DNA stock concentration was determined under simplex conditions using both assay 5 and assay 2. Thecopy number ratio between assay 5 and assay 2 was determined under duplex conditions. All precision components were captured in one factor. Theonly known Type B component which was significant enough to require input was from the droplet volume measurement. The expandeduncertainties for the concentration and ratio were determined by multiplying the combined standard uncertainty (eq 8) and the standarduncertainty,uCNVprec
, respectively, by a coverage factor between 2.05 and 2.18, which provides a level of confidence of 95%. It should be noted themagnitude of the expanded uncertainty values for T vary with concentration.
Analytical Chemistry Article
dx.doi.org/10.1021/ac202578x | Anal. Chem. 2012, 84, 1003−10111009
assays 5 and 2 under duplex conditions using the 20 000-ddPCR and the 765-cdPCR were 1.051 and 1.052, respectively,and the corresponding relative expanded uncertainties using acoverage factor of 2.18 were 2.8% and 6.1%, respectively (Table 1).The lower expanded uncertainty in copy number variationobserved using the 20 000-ddPCR can largely be explained by themore than 20-fold increase in number of partitions analyzed ineach ddPCR assay.
■ CONCLUSIONS
In this study we have demonstrated experimentally that thisddPCR system can achieve a linear dynamic range of morethan 4 orders of magnitude for DNA quantification. The largenumber of reactions in this ddPCR system allowed very precisecopy number estimates which resulted in a relative expandeduncertainty of less than 5% for Lambda DNA copy numberconcentration. Further improvements in uncertainty of absolutecopy number quantification may be achieved by increasing thenumber of replicates analyzed. However, this will be limited bythe partition volume uncertainty when it becomes a largercontributor to the uncertainty than the precision of copynumber estimates (Figure 4). For duplex copy number ratiomeasurements, the contribution from partition volume in theuncertainty estimate is minimized since both assays are con-ducted in the same ddPCR. Therefore, increasing the numberof partitions will lead to further improvements in precision, andthis can be readily and practically achieved by combining theresults of replicate wells.Because of the high level of precision that can be obtained
from ddPCR and other high density cdPCR formats,13,14 it isparticularly important that the experimental design replicatescapture all known sources of variation, and that components ofbias are identified and included in the uncertainty budget toensure the measurements are also accurate.15 For the prototypeinstrument used in this study, it was difficult to make a fullassessment of bias. However, dynamic range studies did notindicate a concentration-dependent bias, and concentration
measurements were comparable with results obtained using anindependent microfluidic cdPCR. This ddPCR technologyshould be fit-for-purpose for a wide range of applications, includingthe direct quantification of nucleic acids for gene expression (e.g.,miRNAs), pathogen quantification, rare allele detection, germlineand somatic copy number variation estimation, some of whichhave recently been demonstrated.8
■ ASSOCIATED CONTENT
*S Supporting InformationAdditional information as noted in text. This material isavailable free of charge via the Internet at http://pubs.acs.org.
■ AUTHOR INFORMATION
Corresponding Author*E-mail: [email protected]. Phone: +612 84673735.
■ ACKNOWLEDGMENTS
The project described was supported by Grant NumberR01EB010106 from the National Institute of BiomedicalImaging And Bioengineering (C.M.H., B.J.H.), and theNational Enabling Technology Strategy (L.B.P., V.A.C., J.H.,S.B., K.R.E.) provided by the Commonwealth Government ofAustralia. The content is solely the responsibility of the authorsand does not necessarily represent the official views of theNational Institute of Biomedical Imaging and Bioengineering orthe National Institutes of Health. The National MeasurementInstitute declares that it has no competing interests and byconducting this study does not imply endorsement of thetechnologies described in the manuscript. C.M.H. and B.J.H.are full-time employees of Bio-Rad Laboratories, Inc. We thankP. Armishaw and D. Burke for their critical review of themanuscript.
Figure 4. Factors contributing to measurement uncertainty. (a) Theoretical relative expanded uncertainty of concentration considering only twofactors: Type B partition volume component, Vd with a relative uncertainty of 1.0% (green), and uncertainty of the Poisson modeling of copynumber per droplet, M,7 (mesh blue) calculated for the condition when 80% of the reactions are positive following digital PCR. This is close to theoptimal percentage of positive reactions for minimizing the uncertainty of the copy number estimate, regardless of the number of reactions in theassay.10 The relative standard uncertainties of these two factors were combined (inset) and then multiplied by two to obtain the relative expandeduncertainty with a level of confidence of 95%. (b) Contributions to concentration uncertainty for a ddPCR data set comprising five replicate analysesfrom each of three independent gravimetric dilutions analyzed using assay 2 under simplex conditions (see Table 1 for details). This data set had arelative expanded uncertainty of only 4.2%, which was determined by multiplying the combined standard uncertainty (eq 8) by a coverage factor of2.09 to provide a level of confidence of 95%. The contributions of the components of droplet volume (Type B components only) are indicated ingreen shading and the components of precision are indicated in blue shading. In this data set, a total of 190 433 droplets were accepted by thedroplet reader and 19.1% of these droplets were positive.
Analytical Chemistry Article
dx.doi.org/10.1021/ac202578x | Anal. Chem. 2012, 84, 1003−10111010
■ REFERENCES(1) Sykes, P. J.; Neoh, S. H.; Brisco, M. J.; Hughes, E.; Condon, J.;Morley, A. A. Biotechniques 1992, 13, 444−449.(2) Vogelstein, B.; Kinzler, K. W. Proc. Natl. Acad. Sci. U.S.A. 1999,96, 9236−9241.(3) Sanders, R.; Huggett, J. F.; Bushell, C. A.; Cowen, S.; Scott, D. J.;Foy, C. A. Anal. Chem. 2011, 83, 6474−6484.(4) Lo, Y. M.; Lun, F. M.; Chan, K. C.; Tsui, N. B.; Chong, K. C.;Lau, T. K.; Leung, T. Y.; Zee, B. C.; Cantor, C. R.; Chiu, R. W. Proc.Natl. Acad. Sci. U.S.A. 2007, 104, 13116−13121.(5) Wang, J.; Ramakrishnan, R.; Tang, Z.; Fan, W.; Kluge, A.;Dowlati, A.; Jones, R. C.; Ma, P. C. Clin. Chem. 2010, 56, 623−632.(6) Dube, S.; Qin, J.; Ramakrishnan, R. PLoS One 2008, 3, e2876.(7) Bhat, S.; Herrmann, J.; Armishaw, P.; Corbisier, P.; Emslie, K. R.Anal. Bioanal. Chem. 2009, 394, 457−467.(8) Hindson, B. J.; Ness, K. D.; Masquelier, D. A.; Belgrader, P.;Heredia, N. J.; Makarewicz, A. J.; Bright, I. J.; Lucero, M. Y.;Hiddessen, A. L.; Legler, T. C.; Kitano, T. K.; Hodel, M. R.; Petersen,J. F.; Wyatt, P. W.; Steenblock, E. R.; Shah, P. H.; Bousse, L. J.; Troup,C. B.; Mellen, J. C.; Wittmann, D. K.; Erndt, N. G.; Cauley, T. H.;Koehler, R. T.; So, A. P.; Dube, S.; Rose, K. A.; Montesclaros, L.;Wang, S.; Stumbo, D. P.; Hodges, S. P.; Romine, S.; Milanovich, F. P.;White, H. E.; Regan, J. F.; Karlin-Neumann, G. A.; Hindson, C. M.;Saxonov, S.; Colston, B. W. Anal. Chem. 2011, 83, 8604−8610.(9) Bhat, S.; Curach, N.; Mostyn, T.; Bains, G. S.; Griffiths, K. R.;Emslie, K. R. Anal. Chem. 2010, 82, 7185−7192.(10) Weaver, S.; Dube, S.; Mir, A.; Qin, J.; Sun, G.; Ramakrishnan,R.; Jones, R. C.; Livak, K. J. Methods 2010, 50, 271−276.(11) Abramoff, M. D.; Magalhaes, P. J.; Ram, S. J. Biophoton. Int.2004, 11, 36−42.(12) Joint Committee for Guides in Metrology Working Group 2.International Vocabulary of Metrology - Basic and general concepts andassociated terms (VIM); http://www.bipm.org/utils/common/documents/jcgm/JCGM_200_2008.pdf, 3rd ed.; BIPM: SevresCedex, France, 2008.(13) Heyries, K. A.; Tropini, C.; Vaninsberghe, M.; Doolin, C.;Petriv, O. I.; Singhal, A.; Leung, K.; Hughesman, C. B.; Hansen, C. L.Nat. Methods 2011, 8, 649−651.(14) Pekin, D.; Skhiri, Y.; Baret, J. C.; Le Corre, D.; Mazutis, L.;Salem, C. B.; Millot, F.; El Harrak, A.; Hutchison, J. B.; Larson, J. W.;Link, D. R.; Laurent-Puig, P.; Griffiths, A. D.; Taly, V. Lab Chip 2011,11, 2156−2166.(15) Griffiths, K. R.; Burke, D. G.; Emslie, K. R. Anal. Methods 2011,3, 2201−2211.
Analytical Chemistry Article
dx.doi.org/10.1021/ac202578x | Anal. Chem. 2012, 84, 1003−10111011
Related Documents


![Chapter 2 - GENE QUANTIFICATION › johnson-et-al-miqe-mimb-ch2...real-time PCR) guidelines [ 1 ] represent a major milestone in the transformation of the real-time quantitative polymerase](https://static.cupdf.com/doc/110x72/5f03fa417e708231d40bb586/chapter-2-gene-a-johnson-et-al-miqe-mimb-ch2-real-time-pcr-guidelines-.jpg)