EVALUATION OF A COANDA NOZZLE FOR PNEUMATIC CONVEYING By ALAN CURTIS WETM:>RE tf Bachelor of Science Oklahoma State University Stillwater, Oklahoma 1970 Submitted to the Faculty of the Graduate College of the Oklahoma State University in partial fulfillment of the requirements for the Degree of MASTER OF SCIENCE July, 1972

Welcome message from author
This document is posted to help you gain knowledge. Please leave a comment to let me know what you think about it! Share it to your friends and learn new things together.
Transcript

EVALUATION OF A COANDA NOZZLE
FOR PNEUMATIC CONVEYING
By
ALAN CURTIS WETM:>RE tf
Bachelor of Science
Oklahoma State University
Stillwater, Oklahoma
1970
Submitted to the Faculty of the Graduate College of the Oklahoma State University
in partial fulfillment of the requirements for the Degree of MASTER OF SCIENCE
July, 1972

EVALUATION OF A COANDA NOZZLE
FOR PNEUMATIC CONVEYING
Thesis Approved:
Dean of the Graduate College
837154 ii
OKLAHOMA IMTE UWIYERflll
't~JfARV
FEB 7 1973

I
ACKNOWLEDGEMENTS
The research reported in this thesis was financed in part by the
Oklahoma Experim~ntal Station. This financial support is sincerely
appreciated.
I am grateful to my major advisor Dr. Allen F. Butchbaker for his
council and encouragement throughout this study.
Appreciation is expressed to Professor E. w. Schroeder, head of
the Agricultural Engineering Department, for providing facilities and
an assistantship which made this study possible.
Appreciation is also extended to Mr. Clyde Skoch, Mr. Norvil Cole
and the late Mr. Jesse Hoisington for their valuable assistance in the
construction of the apparatus. Thanks also is given to Mr. Jack
Fryrear and Mr. Sam Harp, draftsmen, for their excellent preparation
of illustrative material. I would also like to thank Mrs. Ann Smith
for typing the final copy of this thesis.
Sincere thanks is extended to my father, Albert Wetmore, whos~
sound advice and assistance in construction of the apparatus was
essential in completing this study. Also thanks to my brother, Duane
Wetmore, who was a great help in conducting the tests for this project.
A very special thanks is given to my wife, Debrah, for her pa
tience, encouragement and the typing of the rough draft of this thesis
while caring for our daughter, Tiffany.
iii

TABLE OF CONT~T&
Chapter Page
r.· INTRODUCTION • • • • • • • • • 1111 • • • • • • • • • • .. • • • 1
Background l.nfoJ:"mation ••••••••••• Objectives• ••• , ••••••••••••
• _. • • e •
• • • • • • 1 4
II. REVIEW OF LITERATURE •e••••••••••ooo••o•• 5
III.
IV.
v.
VI.
Conventional Pne1,1mat:l.e Conveyors • • • • • ... .... • • • • • 5 Material-Feeding Devices , •• , ••• • • , • • • • • • 6 Coanda Nozzle ••• , , •••• , • , ••••• , • •• 8
DESIGN AND CONSTRUCTION OF THE SYSTEM • • • • • • • • • • • • 11
The Coanda Nozzle I • I t • • • • t • • e • • • • • • • 11 Material Feeding Device ••••••••• Pneumatic Control and Distribution System
• • • • • • • 13 • • • 0 • • • 15
EXPERIMENTAL PROCEDURES •• • • e • • • • • • • • • • • • • • 21
Rotameter Calibration ••••••••••• , • , , • , .21 Secondary Air Flow Calibration ••••• , ••• , ••• 24 Free Air Measurement •••• m ••••••••••••• 24' Particle Sizing •• • ••••••••••••••••• 27 Bulk Density Tests ••••••••••••••••••• 28 Material Conveying Capacity •••••••••••••• 29
PRESENTATION AND ANALYSIS OF DATA • • • • • • • • • • • • • • .32
Free Air Measurement • • ••• , •••••• , • • , •• _32 Nozzle Tests o • ~- •• •'• • , •·• • •• , •••• 32 Nozzle Plus Bin Tests ••••••••••••••• 35
Material Conveying Capacity •••••••••••••• 37
SUMMARY AND CONCLUSIONS . . Sunnnary ••••••• Conclusions ••••• Suggestions for Future
GI· t • .• • t t e t • I ·• t t I t t
• • • • • • • • • • • • • • • • • • • • • • • • • • • • • • • • • • Worlc • & • • • • • • • • • • • •
4_2 43 43
BIBLIOGRAPHY O O m O t t t D O O • • • • • • • • • • . . .. • • • ti •
APPENDIX A - WORKING DRAWINGS OF CONVEYING APPARATUS •••• • •• • 46
iv

Chapter
APPENDIX B - COMPUTER PROGRAMS fOR PRESSURE AND FLOW CALCULATIONS •••••••• . . . . . '
APPENDIX C - COANDA NOZZLE TEST DATA • • . . . . • • • • •
v
Page
. . . .. • 53
.. . . ~ • 59

LIST OF TABLES
Table Page
I. Feed Rate and RPM Calibration for the Material Feeding Device •••• . . . . . • • • • • . . . . . . . 18
II. Calibration of Rotameter Flow Data. • • • • • • • • • 22
III. Secondary Flow Velocity Head in Inches of Red Oil •. . . . 26
IV. Grain Sizing Test Data •••• . . . • • • • • . . . . . . . 28
v. Grain Bulk Density Test Data • • • • • • • • • • • • • • • 29
vi

LIST OF ~IGUJU;S
\•
Figure Page
1. Internal Coanda Nozzle ••••ov••~•••l!le•e&q, • 3
2. External Coanda Nozzle . . . . . . . . . . . . . . . . . . . • 9
3. Coanda Nozzle. . . . . • • 8 • • • • • . . • • • Q • e • ~ .12
4. Grahm Variable Speed Drive With Auger Grain Bin • • • • • 0 •• 14
5. Feeder Calibration Curve 0 • • • • • • • • • • • • e . . . . .16
6. Pneumatic Control System • • . . . . . . . . . . . • & !II 9 .17
7. Pneumatic Conveyor Distribution Syste~ • • . . . • • .20
8. Rotameter Calibration Curve and Regression Equation. • • • • .23
9. Average Air Flow Calibration Curve and Regression ·Equation •••••••••••••••••• • •••• 25
10. Coanda Nozzle Output Curves. • e e • e • • • • • e • • • • .36 . '
11. Coanda Nozzle, Total System, Free Air Output • 9 • • 0 Q O e .38
12. Pressure Loss for Conveying Rates 9 • ·~· •• • • • • . . . .41
vii

CHAPTER I
INTRODUCTION
Background Information
For many years, pneumatic conveying has been an acceptable method
for the conveying of particulate material. Some of the reasons fair its
popularity are the ease of linkige to other systems, the total enclo
sure of the system and the economy of such an installation.
In recent years, the pneumatic conveyor has been used to mechanize
the feed handling for confinement feeding operations, With this system,
the operator has a fully mechanized feeding ~ystem with little manual
labor and the elimination of feeding trucks and wagons. The conveying
system empties itself in a matter of seconds which permits rapid
changes in rations. Conveying systems constructed with augers and drag
chains have considerable time delay and thus do not empty rapidly.
The most popular type of pneumatic conveyor uses a high velocity
air stream to carry the particles through the pipe. The minimum air
velocity required to transport . feed grain over 100 feet is approximately
3,500 feet per minute. The pressure available to the system is the
limiting factor for the conveying distance (3).
Material may be introduced into a pneumatic conveying system by
many different methods. The type of feeding device depends upon
whether the system is a low or high pressure system. A system that
1

2
has a low or negative pressure can u;e a c;olumn-type injector or g;i:-avi ..
ty feed system on free flowing material. A disadvantage o:f this system
is the lack of material flow regulation, For systems under higher
pressures a venturi can be used, Other types of material feeding de-
vices are the star-wheel ai,r-lock and the auger with a plugging
chamber, which are quite expensive. This study ;is an attempt to con-
struct a pneumatic conveying system that will allow a posi,ti,ve and
inexpensive method of material injection.
The Coanda effect causes a tendency for a fluid to adhere to walls
or to be deflected by a boundary in its path. '.I'his effect may be
demonstrated by pouring liquid from a bottle and watching the curvature
of the stream around the lip of the bottle. Henri Coanda describes
this effect in a 1932 French patent. The turning caused by the boundary
between the flu;i.d and the wall allows momentum and flow augmentation~
An internal nozzle has been made that uses this Coanda effect.
The fundamental features of the Coanda nozzle are shown in Figure
1. The primary air flow enters the reservoir from outside sources and
then leaves the chamber through a slot which causes a h;i.gh velocity
air stream. This high velocity air entrai.ns large quantities of
ambient air in the nozzle. The fluid that is entrained near the de-
flection surface, which is called the secondary air stream, is accele-
rated causing a reduction in the static pressure on the surface. The
lower pressure causes the jet stream to deflect towa;i:-d the lower
pressure and as a result, the jet stream is able to turn through a
large angle and follow the deflecting surface.

Secondary ,.. Flow
Primary Flow
Internal Coanda Nozzle
· Total Flow
Figure 1.. Internal Coanda Nozzle
l,.;)

4
The use of the Coanda ndzzle as the air injector allows the con~
veyed material to be fed into the secondary air stream which is a
negative pressure area. After the nozzle, the conveyor has the charac ..
teristic of a medium pressure~low volume conveying system.
'l'he above discussi,on is presented in the £allowing formal objec ... 1
tives.
Objectives
A. 'l'o construct and evaluate the perforIIlqnce 9f a Coanda
nozzle system for the pneu1Tu;1tic conveying of granular agri~
cultural products.
B. To determine the effect of the secondary air flow rate
on the material conveyin~ <;:haracteristics of the system.
c. 'l'o determine the effect of the material flow rate,
introduced into the secondary air stream, on the
material conveying characteristics of the system.

CHAPTER II
REVIEW OF LlTERATURE
Conventional Pne1,1matic Conveyors
Pneumatic conveying is the t;;t."anspo;rt of gran\llar matex-ial through
a closed pipe system. The conveying is accomplished by the introduc~
tion of air into this closed system. These systems are becc:>ming more
popular because of economy, mechanical simplicity, ease of path design
and construction, and its adaptability to equipment already in use.
Two disadvantages are possible damage to the conveyed material and the
high power requirement to overcom(;!. energy losses from the ai;i:- alone (2).
Pneumatic conveying· systems can be grouped into three generc;1l
classes: negative .pressure, low or medium press\lre and high pressure.
The negative pressure system ha::, below atmosphe+:Lc pressures. The·
pressure differential has a maximum of two-thirds atmospheric pressure
which results in a high air to material ratio and limits the convey:i,ng
distance (1). Nega.t:i,.ve pre~s\lre-'.conveyi:i1g .systefus p:rodt,1ce a m:f,nimum
of material damage and c;1 dust free atmQsphere in case of
leaks.
The second class, low or medium pressure, has two subclasses. Low
pressure-high volume conveying usually uses an impeller or centrifugal
type blower. A pressure up to 14 inches of water is obtained with the
system. The material is generally fed into the system through the
blower which may damage the material. The other sub.class, medium
"i

6
pressure-low volume conveying, uses some kind of positive displacement
blower to obtain approximately 20 psi conveying pressure. This system
allows the use of small diameter pipes. The air velocity for both
types of conveyors in the second classification is approximately 3,500
feet per minute. The smallest pipe size should be selected that will
handle the material flow at the given pressure.
The third class of pneumatic conveying is the high pressure-low
volume system. This is often called a fluidized system. The pressure
exceeds 20 psi for this system. The material should behave as a fluid
and will be conveyed as a fluid (2,3).
A successful medium pressure-low volume pneumatic conveying
system, developed by H.B. Puckett at the University of Illinois, has
been in operation since 1958. This system is designed to handle the
feed preparation and distribution portion of a hog finishing operation.
A second system was installed on a turkey farm. The system has a
capacity to handle approximately 30,000 turkeys (3,8).
Puckett has done extensive studies on these conveying systems and
similar systems. The conveying system uses a one-inch conveying pipe.
The typical feed flow rate is 1200 pounds of feed per hour, at 7-1/4
psi, which gives a maximum conveying distance of about 400 feet. The
air flow to convey this capacity is about 25 CFM (8).
Material-Feeding Devices
The type of material feeder is dependent largely on the operating
pressure of the conveyor. One method of setting particles in motion
in a pneumatic conveyor is to inject air into the material hopper.
Another way to convey particulate material is to inject this material

into an already moving air stream. For this study the Latter type
of feeding device will be considered.
7
Positive pressure systems use the simplest type of material feed ...
er, the gravity flow feeder, and usually with the aid of a venturi.
This venturi lowers the pressure of the air ~tream to below atmospheric
pressure at the point of matet:i,al introduction, which aids in the pre ...
vention of blow back through the feed hopper. The venturi also adds
to the cost of the system. Another disadvantage of this system is
that it is not a positive metering device (1),
Another popular type of feeding mechanism is thQ rotary air lock.
This system uses gravity flow to the rotor. The mat~rial drops into
the compartments of the rotor,, whose div!ders provide an q.ir seal and
a positive metering mechanism. When the material is brought around to
the outlet, the material drops again into the air stream, If a feeding
device like this is used it is one of the major costs of a small pneu ...
matic c;onveying. system. 'l'he cost of a rotary air lock is between $300
and $1000 for a l-,l/2 inchdia 0 pipe system (4),
Augers are used as metering devices for many conveying systems.
Ibwever, they have trouble holcling an air seal when the auger is hot
injecting material into the system. Puckett (4) made an auger metering
device with a flared plugging chamber that provided an adequate air
seal. The injector used a 2-1/2 inch auger and worked under a pressure
of 10 psi. It could inject up to 2000 pounds of material per hour into
a one inch conveying line while turning 1800 RPM and had a power re
quirement of about 1.5 hp,
Negative pressure conveying systems can use the same types of
feeders that are used by the positive presst,1re systems. If a gravity
8
free flow feeder is used with the negative pressure systems, th~re is
no need to use a venturi. The free flowing material will adju~t itself
to the demands of the conveyer. The rotary air~lock and the augel;' with
plugging chamber injectors are not needed for negat:i;ve pressure systems
because the pressure seal is not needed; the:refore, clo!;le tolerance$
are not essential.
Coanda Nozzle
According to Reba (6), Henri Coanda wa$ one of the first to observe
and describe the effect of a jet stream's tendency to adhere to and
follow a surface that is in its path. Henri Coanda made several devices
that utilized this effect. These devices are called Coanda nozzles.
Two more common types of these nozzles are the internal and external
nozzles. The internal nozzle (Figure 1) has the primary air chamber
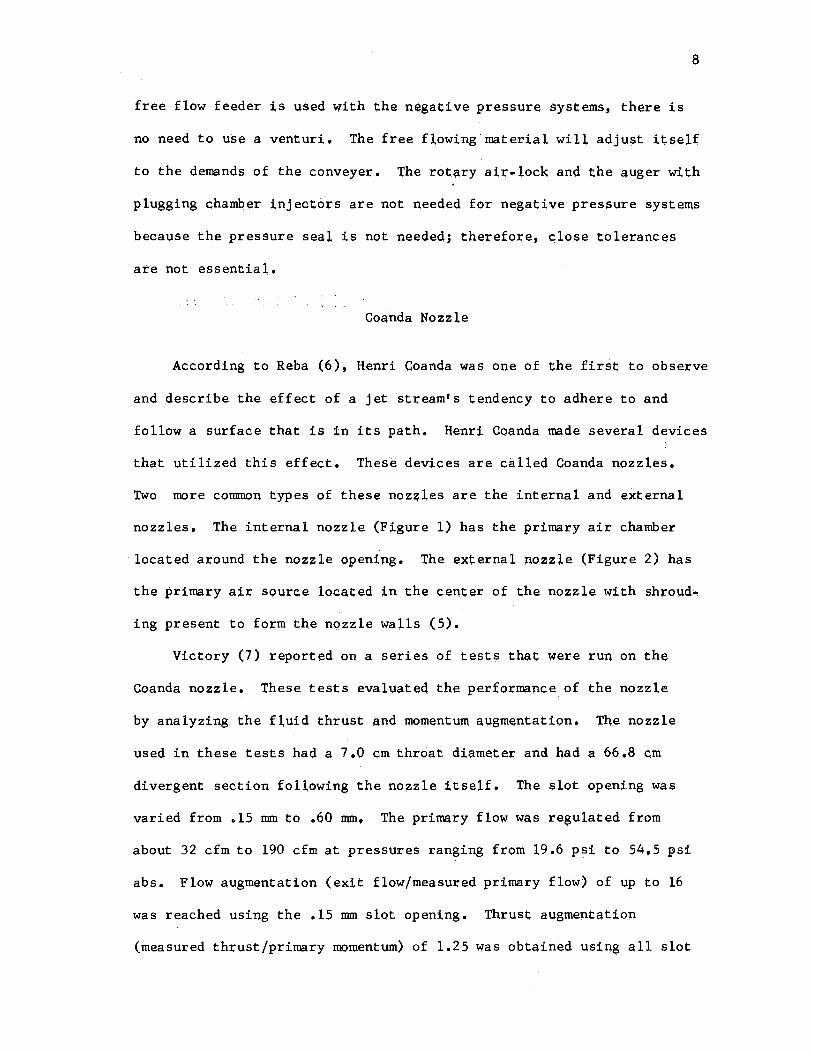
· located around the nozzle opening. The external nozzle (Figure 2) has
the primary air source located in the center of the nozzle with shroud ..
ing present to form the nozzle walls (5).
Victory (7) reported on a series of tests that were run on the
Coanda nozzle. These tests evaluated the performance of the nozzle
by analyzing the £1,uid thrust and momentum augmentation. The nozzle
used in these tests had a 7.0 cm throat diameter and had a 66.8 cm
divergent section following the nozzle itself. The slot opening was
varied from .15 mm to .60 mm, The primary flow was regulated from
about 32 cfm to 190 cfm at pressures ranging from 19,6 psi to 54,5 psi
abs. Flow augmentation (exit flow/measured primary flow) of up to 16
was reached using the .15 mm slot opening. Thrust augmentation
(measured thrust/primary momentum) of 1.25 was obtained using all slot
Secondary Flow •
~
rtimary Flaw
Reservoir
Figure 2. External Coanda .Nozzle
Total -Flow
'°
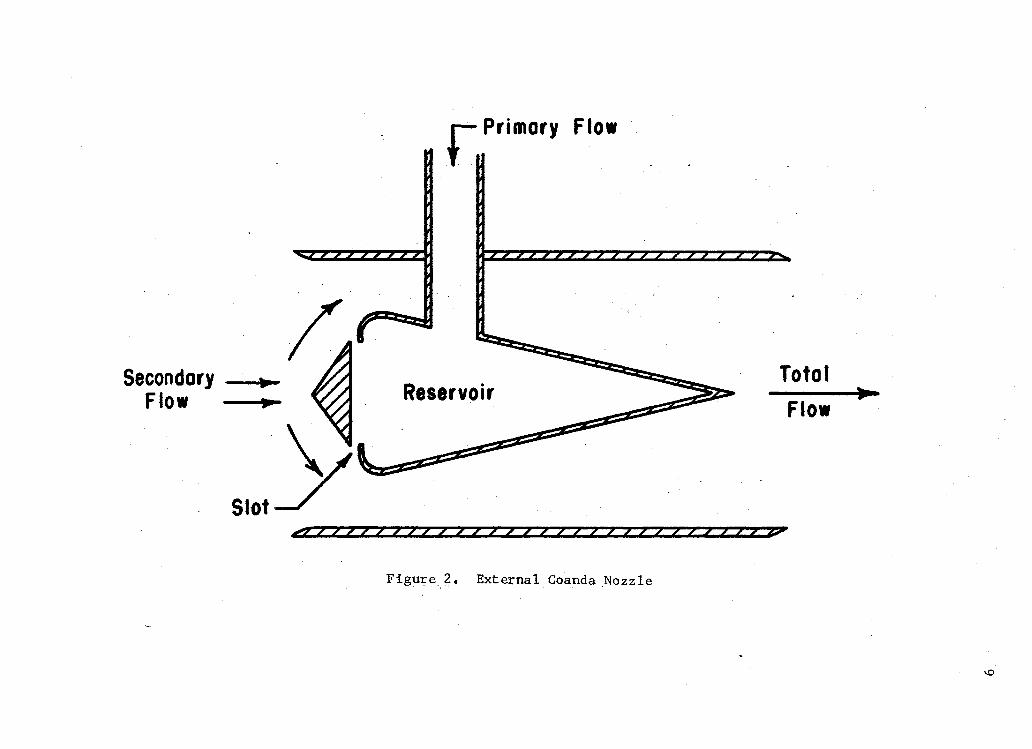
openings. Momentum augmentation (exit momentum/primary momentum) of
1.71 was obtained a_!~_?. ~sing all slot bpenings (7).
Experimental studies have been run on a Coanda nozzle by Reba,
10
to determine the feasibility of mass transportation through use of the
nozzle. In this series of tests, Reba used Coanda nozzles that had a
1-1/2 inch throat. The total system had a length of 78 feet with a
nozzle at the entrance, one in the middle, and another two feet from
the exit of the 1-1/2 inch diameter tube. The slot openings were
varied from .002 inch to .010 inch. The primary flow was held constant
for different slot openings res4lting in diffe;rent pressures. The
flow was held at 25.74 cfm. Air flow augmentation up to 25.74 was re
corded while testing' nozzle performance. The static pressure across a
nozzle was recorded as going from Oto 36 inches of water. The pres
sure decreased to 20 inches of water in 33 feet of pipe. The velocity
over this same length went from 135 feet/second to 143 feet/second.
The conveyed material used was table tennis balls (2.5 gm), water.
filled table tennis balls (30 gm), 3~inch long cylinders (8.3 gm) and
3 inch cylinders (165 gm), both with 1-1/2 inch diameters.
While using all three nozzles of the system, a velocity of 320
feet per second could be reached with the 2.5 gm table tennis ball,
while the 165 gm cylinder only reached a veloc;i,t;y of 180 feet/second
at the end of the system. The cyl;l.nder had not reached its terminal
velocity because i,t w&s still accelerating when it had reached the
end of the system (5).
CHAPTER III
DESIGN AND CONSTRUCTION OF THE SYSTEM
Several considerations were made before design parameters were
established. A tube size and material was needed that would allow easy
laboratory handling and construction, A one-inch aluminum conduit size
was chosen so comparisons. could be made with the sy~tems researched by
PucketL(3.,4). ThE:i conduit size .set the· design charact·eristics for the
rest of the system. Design of the Coanda nozzle was the first con
sideration in the construction of the conveying systems.
The Coand, Nozzle
With the conveyi·ng tube diametijr set at one inch, a Coanda nozzle
needed to be scaled down from a prototype discus~ed in the literature.
Since the velocity of the jet stream ~epends largely on the slot
width, it was believed an adequate v~1ocity could be reached on a
scaled down version of the Coanda no~~le.
A sectional view of the 70/84 nozzle, designed by Dr. Henri Coanda,
was scaled down from a 7.0 cm throat t9 a one inch throat, The pro
file dimensions were taken graphically from a copy of the report from
SFERI-Coanda (9). After the dimension~ were taken and scaled down,
drawings were made for fabrication by the Agricultural Engineering lab
technicians.
The Coanda nozzle (Figure 3) was ~de of machined aluminum with
11

12
Figure 3. Coanda Nozzle

13
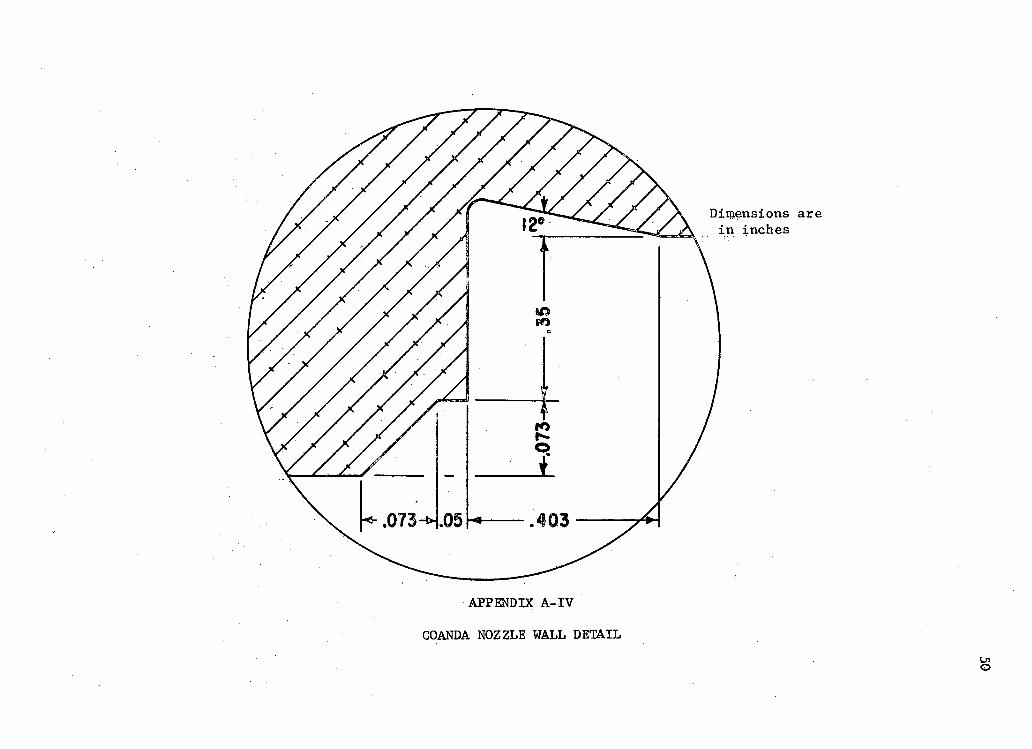
the comple1;:.e nozzle in two sections. O~e section contains the Coanda
surface (Appendix A-I and A-II), and the other section (Appendix A-III
and A-IV) contains the wall that forms the slot between it and the
Coanda surface. The slot width used shim stock space:rs of .001, .002,
.005, and .010 inch so that slot width cot.dd be varied in increments
of .002 inch. The outside dimensions of the combined no~zle sections
are 5 inches long x 4 inches in diameter. Both nozzle sections are
machined to allow the conveying pipe to be slipped into place and
fastened with set screws. The primary air enters the air reservoir
through two separate port&: 180° apart to provide for -eve-n air distribu
tion around the nozzle's slot.
Material Feeding Device
An auger injection system was used because it was the simplest
and most economical method available that would produce a regulated
grain flow. A two inch downspout was used between the auger and the
pneumatic conveying system, Tµe pressl.lre at the point of material
injection was below atmospp.eric which eliminateq the need for a pres
sure seal between the auger and pneumatic conveying pipe.
The hopper (Appendix A,,.V) was made of 16 gauge steel. Its volume
was 4. 5 cµbic feet. The auger was 2 .• 37 5 inc;hes in diameter and had a
pitch of 2.1875 inches, with a total length of 24 inches. A 3/4 inch
pipe was used as the auger shaft. Grahm variable speed drive unit
(Figure 4) with a speed range of 0-250 RPM was used to power the feed
er. A number 40 chain drive having a 17:22 speed decrease was used
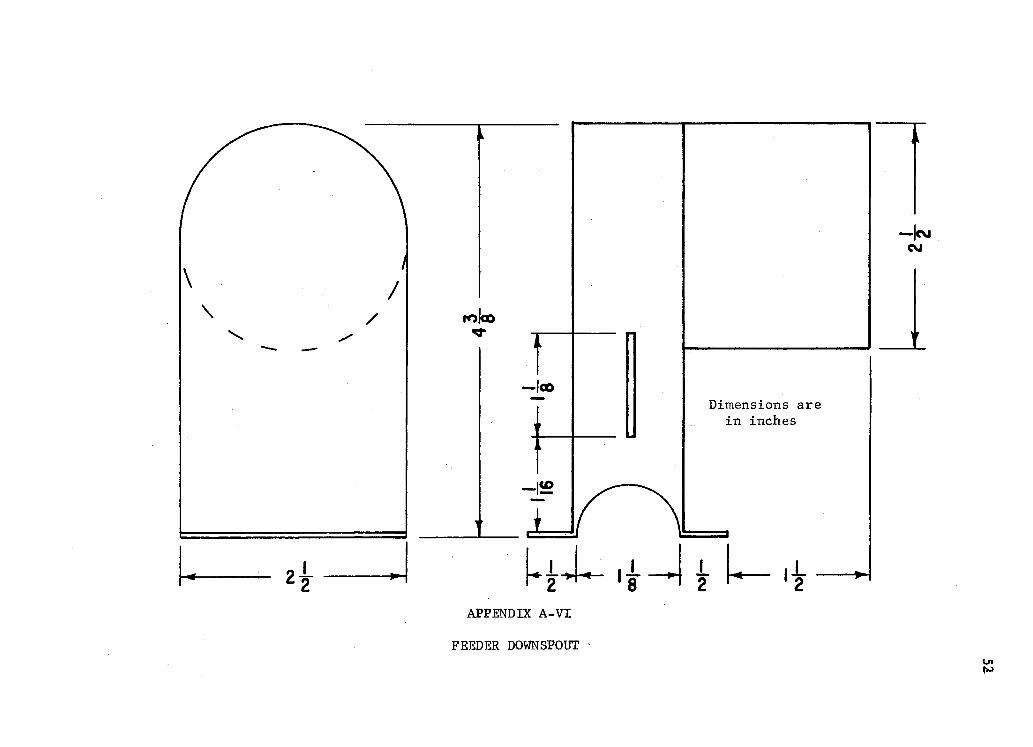
for the drive. The downspout was made as a separate pa;rt from the
auger tube (Appendix A-VI). A slide was located on the ambient air

Figure 4. Grahm Variable Speed Drive With Auger Grain Bin
14

15
side of the spout which could change the secondary air flow and veloci~
ty at the point of feed introduction into the system.
Since the conveying capacity of the pne\,llllatic system was not known,
the different feed rate settings were marked at the time of testing.
These settings were later \,lsed to determine feeder discharge capacity
with unobstructed flow. The caUbration data is presented in Table I and
is plotted in Figure 5. A third degree least-square polynomial equa
tion was derived which had a standard estimate of error of .07364 or
the largest percent difference from the original data was 3 • 75 percent.
While testing the nozzle with the feeder attached, it was dis
covered the bin must be sealed to eliminate air flow through the feed
ing system. Air movement through the feeder ~ould not be monitored
which would result; in inaccurate jecondary air flow readings. There
fore, a plastic cover was taped to the top of the feeder and all con
necting joints were sealed with silicone rubber.
Pneumatic Control and Distribl.ltion System
The pneumatic control system (Figure 6) consisted of the primary
air source, plumbing, controls, and monitoring devices. Also included
in the control system was the secondary air tube ap.d ;lts velocity
measurement device.
A Schramm 22 CFM-100 psi portable gasoline air comptessor was used
to supply the primary air flow for the conveying system. As the air
left the compressor, it went through a 6 inch diameter by 24 inch water
trap to help remove moisture from the air flow. An 11-002-74 Norgren
pressure regulator was used to control the primary flow pressure. A
number 10Al735X4 Fisher-Porter rotameter was used to measure air flow

4
-c -E ": 3 en .a ...J -Q) -a a:: 2 ,:, Q)
if Q= 43.58- 23.98 S + 7.25 52 - .8472 51
Where Q = Feed Rate
S = Feeder Speed
05 10 15 20 25
Feeder Speed (RPM)
Figure 5. Feeder Calibration Curve
• • •
!"""
°'

Pressure Regulator
Rota meter
Water Trap
Figure 6.
Pressure Gage
Secondary Air Pipe
Pneumatic Control System
Coando Nozzle
U -Tube Manometer
f-1 -...J

TABLE I
FEED RATE AND RPM CALIBRATION FOR THE MATERIAL FEEDING DEVICE
No. on Feed Conveying Rate
Test RPM lb/hr
1 26 3.4
26 3.32
26 3 .18
2 18 2.47
17-1/2 2.34
18 2.3
3 14-3/4 2.0
13-3/ 4 1.88
13-1/2 1.83
4 9-1/2 1.4
9-1/2 1.32
9-1/4 1.3
18
through the primary line. The approximate nozzle pressure was measured
by a 200 psi pressure gauge mounted immediately after the rotameter.
The 3/4 inch air line split from a tee into two 3/8 inch flexible,
hydraulic hoses which were connected to the Coanda nozzle.
The secondary air path was directed through a one-inch electrical
conduit that was 38-1/2 inches long. The actual inside diameter of the
conduit was 1.040 inches. A 1/16 inch outside diameter pitot-static
tube was located 20 inches from the secondary tube inlet. The pitot
tube was connected to a 10 inch U-tube manometer to measure the

19
secondary flow velocity head, which enabled the flow to be calculated.
A 2-3/8 inches wide opening allowed the feeder downspout to clamp on
the pipe which was 11 inches from the pitot tube and 4 inches from the
nozzle.
The distribution system or the conveying pipe system (Figure 7)
had a conveying pipe constructed of one inch electrical aluminum con
duit with a true inside diameter of 1.040 inches. The pipe's 10 foot
sections were connected with 4 inch pieces of 1-1/8 inch rubber tubing
and clamped with 1-1/2 inch hose clamps. A static pressure reading was
taken 32 inches downstream from the Coanda nozzle. A single copper
tube perpendicular to the flow was used to take the static pressure
reading. The tube was connected to a U-tube manometer, which had one
side open to the atmosphere. This manometer was scaled to read inches
of water using red oil, but in this case mercury was used as the
manometer fluid. Another static pressure reading was taken 38 feet
from the nozzle with a U-tube manometer. Forty feet from the nozzle,
there were two nine inch elbows separated with a 20 inch pipe rise.
Another static pressure reading was taken 14 feet from the last elbow
with a 90 cm U-tube manometer. One foot from the pressure tap was a
cyclone separater or dust collector with a double sacker downspout.
The double sacker permitted samples to be obtained while the conveying
system was running under steady state conditions.

U-Tube Monometert
I Coonda Nozzle
Cyclone Seperotor
I
U-Tube Manometer
Conveying Pipe
Figure 7. Pneumatic Conveyor Distribution System
U-Tube · Manometer
.:, .. ' ·;,.;.;,:':
N 0

CHAPTER rv
EXPERIMENTAL PROCEDURE
Calibration of the input flow measuring devices and experimental
design are discussed in this chapter, Methods of obtaining the physj.
cal properties of the conveyed material are also shown in this chapter.
Detailed procedures are given for test;Lng the nozzle free air flow and
material conveying capacities.
Rotameter Calibration
The rotameter was calibrated so that air flow rates could be cal
culated from the scale readings. The rotameter had a scale of a Oto
1.5 etched on its glass tube. A 1/16 inch pitot-stqtic probe was used
to measure the velocity in the 3/4 inch pipe preceding the flow rota
meter. The pit:ot tt1be was located in the middle of the 12 inch pipe.
The velocity head of the air stream was read from a 10 inch manometer.
Velocity profile readings in the primary flow pipe were taken at a
rotameter setting of 1.3 which was within the working range of the
rotameter. '.I;'he results of the velocity profUe readings showed that the
outer 1/3 area of the pipe had a pressure head of 1.95 inches of red
oil (sog •• 827) while the inner 2/3 had a pressure head of 2.15, The
average air velocity was 97 .2 percent of the center velocity which was
assumed to be constant for all rotameter readings in the working range
(any reading above 1.0). There were very smaU. variations between the
two replications. The rotameter reading and the velocity head pressure
21

22
were recorded as shown in Table U. The calculated velocities and air
flows are also shown.
, TABLE II
CALIBMTlON OF ROTAMETER FLOW DATA
Air Vol. Head Densit! Rotameter Pressure Velocity- Air Flow ( lb/ft ) Reading (in. red oil) (FPM) (CFM)
.0728 1.0 1.3 4215 15.362
1.1 1.4 4374 15.937
1.2 1.7' 4820 17. 566
1.3 2 .10 5357 19. 524
1.4 2,4 5727 20 ,872
.1.45 2,6 5961 21.725
.0732 1.0 1.3 4203 15.32
1.1 1.4 4362 15.898
1.2 1, 7 5 4877 17,775
1.3 2.2 5468 19.929
1.4 2.4 5711 20.815
1.45 2.6 5944 21.66
The primary air flow was, then calcµlated \.Ising the CPS-360 IBM
computer program in Appendix B-I. After the average velocities were
calculated, a third degree least square polynomial equat:i,.on was deri,ved
(Figure 8) from a pub lie program called !IPOLFIT" in the CPS library.
The equation had an index of determination of .995 with the largest
calcl.llated error of 1.88 percent.

-:== LL (.) -• 0 -LL ....
<t >, .... 0 .§ .... a.
22
20
18
16 •
• •
· 2 3 Q = 200.9 - 4 78.8 N + 400.6 N -107.3 N
Where Q = Primary Air Flow N = Rotameter Number
15-------...._ __ ___,,~-----------------~---------w I.I 1.2 1.3 l.4 1.5
Rotameter Scale Number
Figure 8. Rotameter Calibration Curve and Regression Equation
N (.,..)

24
Secondary Air Flow Ca1ibration
The secondary air flow was calculated from data taken from veloci-
ty head measurements. The readings were made on a 10 inch manometer
connected to a 1/16 inch pitot static tube. The pitot t.ube was
located 20 inches from the secondary air inlet. Since air flowing
through a pipe has a velocity profile, it was necessary to calibli."ate
or find the average velocity for a given center velocity. This would
eliminate the need to take readings across the entire air stream and
then integrate to obtain the average velocity for a given flow. The
values are shown in Table III. Because of the sma11 va;r:i,ation in data
only two replications were run.
The average velocities were calculated for each flow by usin~
the computer program shown in Appendix B-II. After the maximum a~~
' average velocities were calculated, a second degree least square poly-
nomial equation was derived. A plot of maximum velocity vs average
velocity is illustrated in Figure 9. The equation had an index of
determination of .998 and the largest calculated error was 2.38 per-
cent. This equation was later used to derive the average air velocity
from the reading of the maximum velocity.
Free Air Mea&urement
Coanda nozzles of different sizes and design have different out.
put characteristics. Since the nozzle was scaled down from a model
70/84 Coanda nozzle, the output characteristics would not be the same
as previously tested nozzles. Therefore new nozzle characteristics had
to be determined. All free air tests were run using a slot width of

-:!!: CL. LI.. -~ ~ u _g Cl)
> Cl) c::,. 0
·~ Cl) >
Cl
4000
3000
·2000
(000 o = - 79.36 + o.9481 c - 0.000001242 c2
· Where Q =. Average Velocity ( F PM) C = Center Velocity
.1000 2000 3000 4000 Center Velocity ( FPM)
Figure 9 •. Average Air Flow Calibration Curve and Regression Equation
25

26
TABLE Ill
SECONDARY FLOW VELOCITY HEAD IN INCHES OF RED OIL
Rota- Air Pi tot Tube Height From Bqttom meter Slot t~i~:!) Reading Width 1/64 5/64 9/64 7/32 11/32. 33/64
.7 .008 .0712 .2 .25 .3 .35 .37 5 .375
.8 .275 .3,5 .4 ,47 5 .s -.5
.9 .40 .s .6 .7 .75 .75
1.0 .6 .8 .9 ,95 1.05 1.05
1.1 .8 1.0 1.1 1.25 1.35 1.35
.. 8 .010 .071 ,09 .15 .17 .19 .2 .2
.9 .16 .21 .26 .27 .3 .3
1.0 .35 .45 .47 .51 .55 ,55
1.1 .65 • 7 5 ,85 .95 .95 .95
1.2 • 7 5 1.05 1.25 1.35 1.35 1.3~
primary air flow was regulated by the pressure regulator and monitored
on the flow rotameter. Tests were run with the rotameter reading abpve
1.0 (15.3 CFM) which helped to eliminate fluctuations in flow due to
pressure variation. The tests were run with primary flow from 1.0 to
1,45 or until a maximum flow was reached, The slot width, barometric
pressure, temperature, rotameter scale number, nozzle pressure, velocity
head pressure and the conveying line pressure was recorded as shown in,
Appendix C-I. There were three replications run at each slot width.
The range of nozzle slot width was selected from the air flow calcula-
tions obtained from the computer program shown in Appendix B-III.

The free air measurement procedure for the totally enclosed
secondary air tube with 27 feet of conveying pipe was as follows:
1. Barometric pressure and conveyed air temperature were taken.
2, The Coanda nozzle was shimmed to obtain the selected slot
width.
3. The air compressor was started and the pressure was allowed
to stabilize.
4. The desired primary air flow was set with the pressure
regulator.
5. Data was taken on the rotameter scale number, nozzle
pressure, secondary velocity head, and the conveying
line pressure 32 inches downstream from the nozzle.
6. Steps four and five were repeated until the complete
rotameter scale was used.
The test procedure, when the grain bin was connected to the sec
ondary air tube and 27 feet of conveying pipe was used, was the same
as the previous six steps. The only difference was the apparatus
setup. With this data (Appendix C-11), comparisons could be made
27
for velocity loss due to any air leaks. The previous test results
revealed the greatest secondary air velocities at slot widths of .010
inch and .012 inch. These slot widths were chosen because they showed
the greatest secondary air flow velocities due to higher working
pr~ssures.
Particle Sizing
The grain sorghum that was to be conveyed had no fines in it.
While sieving the grain with 8 inch Tyler sieves, it was found that

28
three sieves were catching aH the material: .132, .093 and .046 inch,
Approximately one half pound of grain sorghum was put in the stack of
three sieves and then hand shook for 40 seconds. Each sieve was
emptied into its respective barrel and them the procedure was repeated.
After the data was taken, calculations showed that 36. 5 percent of the
grain was retained on the .132 inch si,eve, 60 pe:t;'cent was retained on
the .093 inch sieve and the other 3.5 percent was retained on the .046
inch si.eve. The weights and percentages are shown i.n Table IVo:
TABLE J;V
GRAIN SIZING TEST DATA
Sieve Grain and Qan Grain Percent Opening Can Wei.ght Weight Weight Retained Size (in.) ( lb) (lb) (lb)
.132 38.25 19.5 18. 7 5 36.5
.093 49.4 18 ,9 30,5 60.0
.046 22 19.2:? 2,75 3.,?
Bulk Density Tests
The procedure for finding the bulk density of the grain sorghum
was to take a di.rect re,;1cling of pounds per bushel from a one p:i,nt OHAUS
measure and scale. There were three different samples taken. Then,
the average bulk density, in pounds per bushel, was Oii~cuLa,tecl from

29
the data in Table v.
TABLE V
GRAIN BULK DENSITY TESl DATA
Bulk Sclmple Weight Number (lb/bu)
1 58. 7
2 58.0
3 59.1
Material Conveying Capacity
Before the conveying capacity tests were run, it was necessary
to select a nozzle slot w.idth t·hat would best support pneumatic con-
veying. From previous tests, it appeared that small slot widths gave
the optimum velocities.
The complete conveying apparatus was assembled. Tests were then
run using slot widths of .010, .012, and .014 inch to establish which
single slot width would be the best and to establish the friction
losses in the conveying system due to air flow only. The complete
rotatneter scale above leO was us.ed 0111 ea.G,h slot w.:Ldt-h-•. - :Because of
consistency in the results for all slot width data, only one test was
run for each slot. Air flow calculations from the data in Appendix
30
C-III were made using the CPS-360 IBM computer program (Appendix B-IV).
The test procedure for free air flow measurement with complete
system assembled i·s as follows:
l~ Take barometric pressure and conveying air temperature
after air flow has been established.
2. Shim Coanda nozzle to selected slot width.
3. Start air compressor and allow pressure to stabilize.
4. Set the desired primary air flow with the pressute
regulator.
5. Data were taken on the rotameter scale number, nozzle
pressure secondary velocity head, and static pressure
readings at points 32 inches, 38 feet.; and· 57 .fe:et downstream
from the nozzle.
6. Steps four and five were repeated until the complete
rotameter scale was used.
From the r.esults of the free air tests, the decision was made to
use a slot width of .012 inch. At this slot width the maximum pri
mary air flow could be used and there was little variation in the
secondary air flow. For the conveying tests, rotameter settings of
1.35 and 1.25 were used on the highest material flow rate and on all
the lower material flow rates respectively. The material flow rates
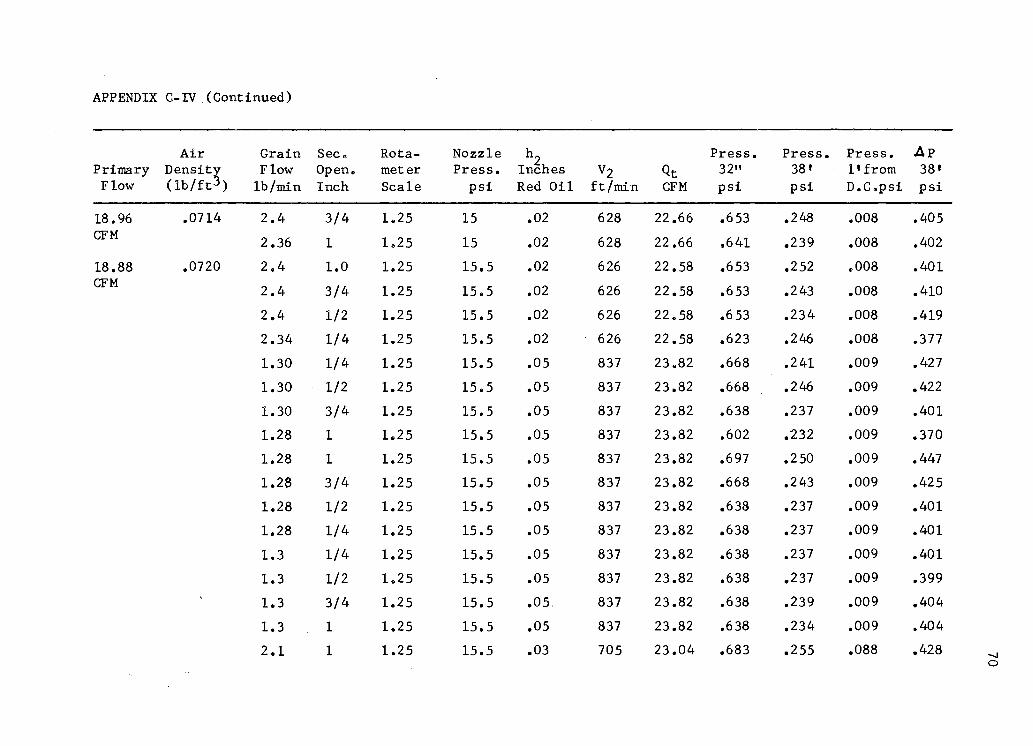
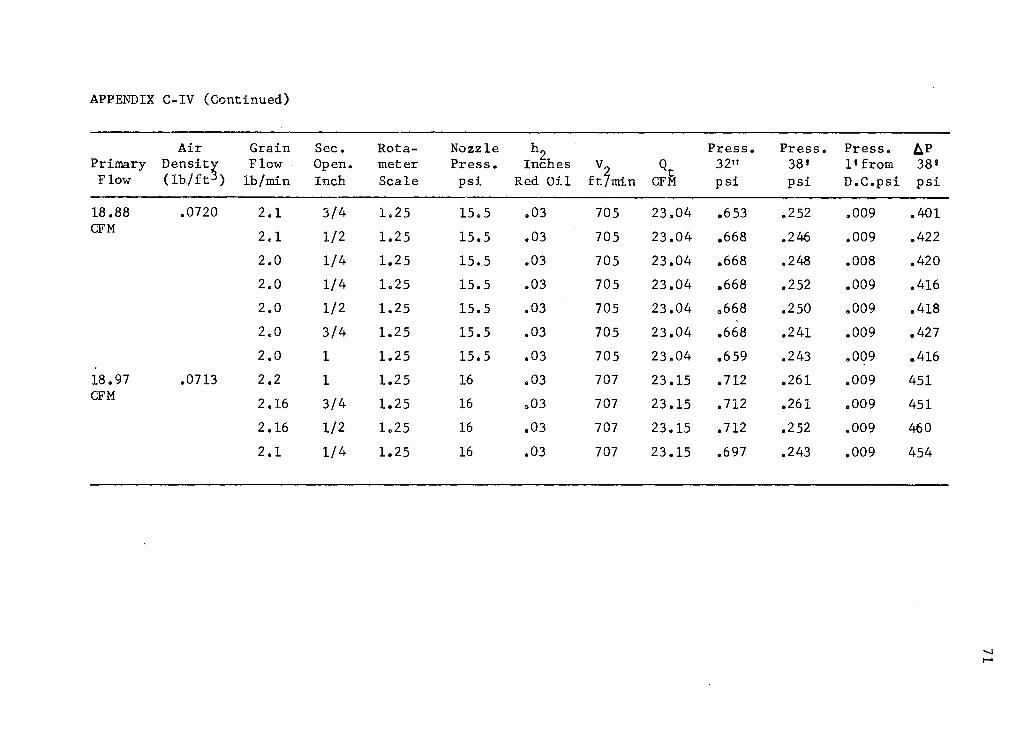
were 3.75, 2.4, 2.1 and 1.3 pounds per minute. The data obtained
is shown in Appendix C-IV. Calculations of the primary air flow,
secondary air velocity and flow, and total air flow were made by the
CPS-360 IBM computer program shown in Appendix B-IV.
The procedure for testing the Coanda nozzle's material conveying
capacity was as follows:

1. The barometric pressure reading and conveying air stream
temperature were taken after the flow was established.
2. The air compressor was started allowing pressure to
stabilize and then the primary air flow was set with
the pressure regulator.
3. The secondary air stream slide was set to regulate
secondary air flow.
4. The variable speed drive wa~ set to the desired
material flow rate, then the feeder was started.
5. Dataweretaken on the rotameter scale number, nozzle
pressure, secondary velocity head, and the static
pressure readings 32 inches, 38 feet and 57 feet down
stream from the nozzle.
6. A 30 second sample of the material being conveyed was
taken using the double sacker after the conveying
system wa~ in steady state.
7. Steps three through six were repeated until the four
secondary flow openings were tested.
31

CHAPTER V
PRESENTATION AND ANALYSIS OF DATA
The first objective and the primary concern of this research was
to determine the ability of a Coanda nozzle to convey particulate ma
terial. Data weretaken from the primary and secondary flow measuring
devices along with the static pressure readings on the conveying pipe.
Air flow and pressure calculations were made with the use of a computer
program. A first degree polynomial line was fit to the test results
to allow graphical representation.
Free Air Measurement
Nozzle Tests
The air density was needed for use in the secondary flow calcula
tions and for corrections in the primary flow calculations. The air
temperature and barometric pressure were the two variables needed for
density calculationso The temperature of the conveying air stream was
taken prior to any conveying. The air density equation in Marks (10),
and shown below was used for the calculation.
D = (B - .38P) /RT
Whereg D = Air density, lb/ft 3
B = Barometric pressure, in. Hg
P -· Vapor pressure of water, in. Hg qt 32°F

R = Constant, .7541 in. Hg
0 T = Absolute temperature, R
33
The temperature and barometric pressure were observed and recorded.
The vapor pressure for the temperature was obtained from Table I in
Mark ( 10) o Then the air density was calculated by a computer program
shown in Appendix B~V.
The nozzle slot widths were varied from .006 inch to .020 inch,
so that the best combination of slot width and primary air flow could
be used for conveying. The primary air flow was regulated i.n a rota-
meter scale range of from 1.0 to L45 which was equivalent to 15.5 CFM
to 22 CFM respectively. The nozzle was tested with 27 feet of convey-
ing pipe attached.
There were three sets of tests run at each rotameter setting for
all slot widthso The tests were run on different days which resulted
in different air densities for the flow calculations.
At the smaller slot widths, the primary air flow was limited
because a high nozzle pressure was requiredo The air compressor had
an output of approximately 15 C:fM at 50 psi which was the pressure
requirement at the 0006 inch slot width. If the nozzle pressure was
low (under 9 psi)~ the air compressor would cut off and on which
caused the primary flow to varyo Because of this, an average reading
had to be made from the rotameter. When the primary air flow was
started in nozzle widths greater than .012 inch, the secondary air
passage had to be blocked to allow the Coanda effect to begin. If
this was not done the primary air would exit through the secondary
passage.
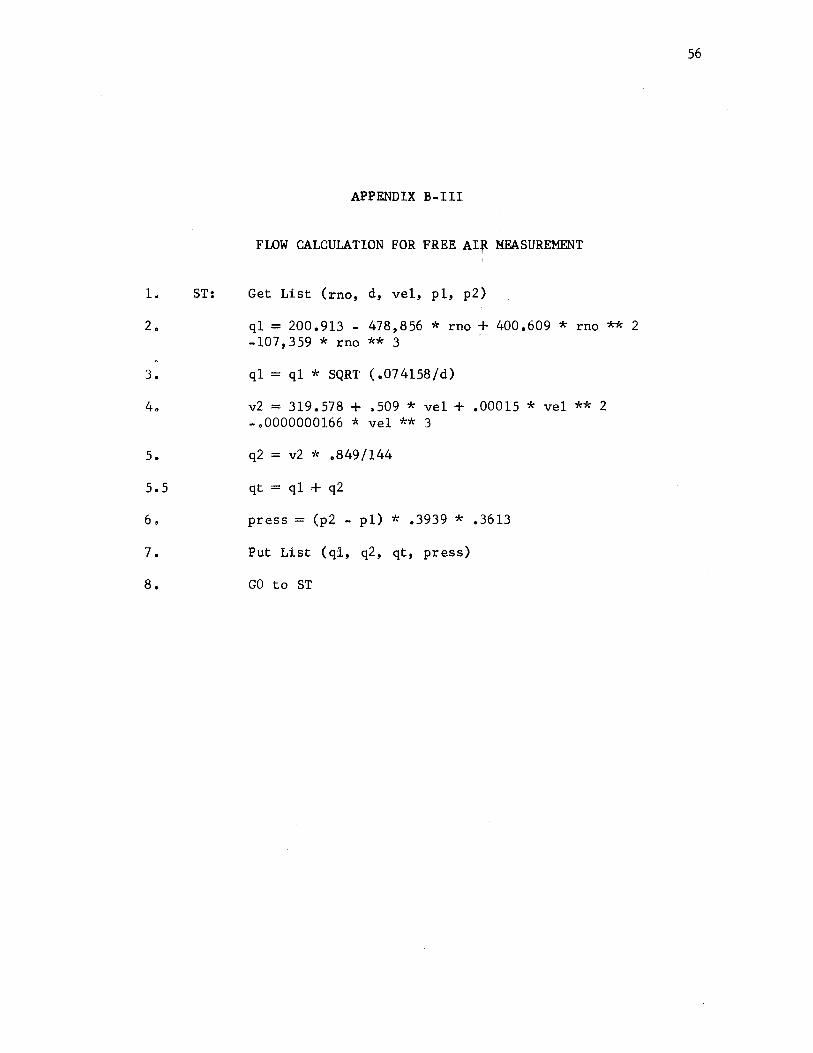
The computer program shown in Appendix B-III was written to make

the nozzle's flow and pressure calculations from the raw data. Using
a regression program, the followin$ equations were calculated which
were based upon the flow calculations obtained from the first program:
where~
slot width (inch)
.006
.008
.012
.014
.016
.018
.020
y = total air flow (CFM)
x = rotameter scale number
equation
y =:.10.36 + 31.17x
y = -1.685 + 37.97x
y = 7.652 + 39.92x
y = -8.395 + 37.22x
y = -9.243 + 34.22x
y = -3.983 + 27.62x
y = -4.243 + 26. 48x
y = -2.449 + 23.34x
The regression program was called 11POLFIT," a regression program
34
in the conversational programing system (CPS) public library. The CPS
terminal was linked to the IBM 360 computer at the Oklahoma State
University Computer Center.
The 11POLFITu program calculated a percent difference, which was
the actual data value of y minus the calculated valu~ of y divided by
the calculated value of y all multipled by one-hundred, for each value
in the first order polynomial equations. The largest percent differ-
ence between the test data and the calculated value obtained from the
above equations was five percent for only one of the value):i of Y•
Several differences of four percent were calculated but the average
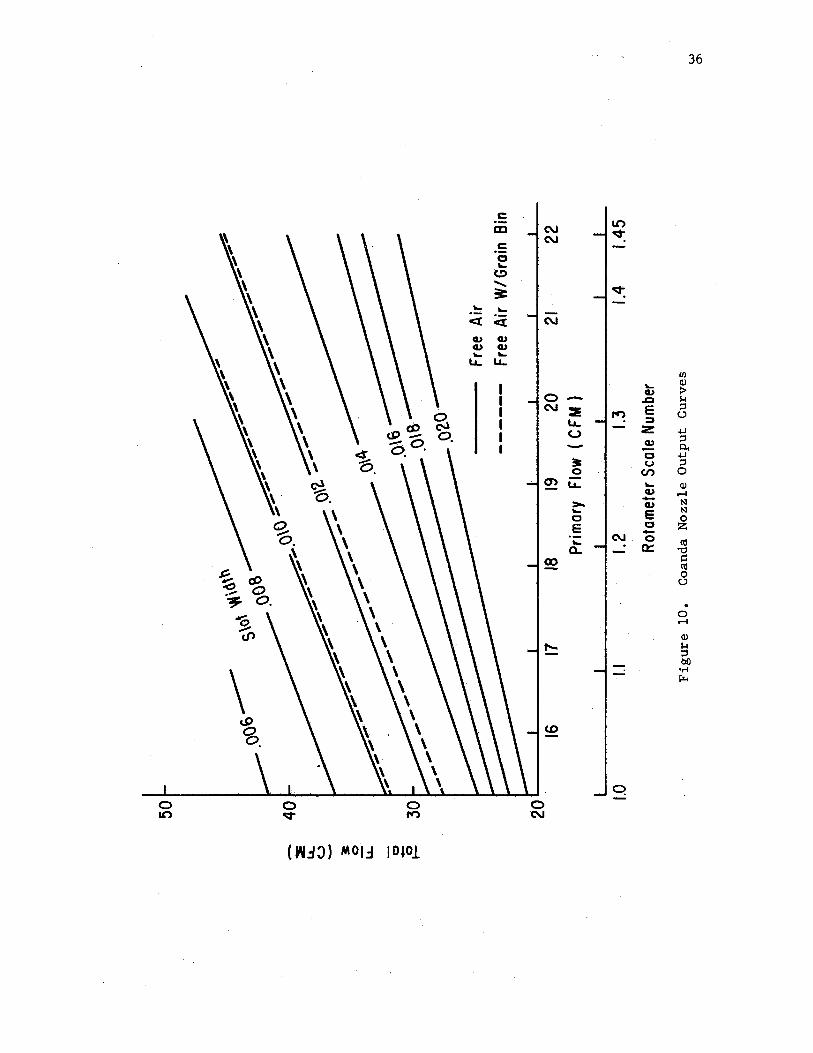
was about 1.5 percent. The equations were plotted on a single graph

35
(Figure 10) of rotameter scale number vs total flow so that the best
slot width could be selected. The original data is given in Appendix
C-Ie
Nozzle Plus Bin Tests
Tests were run with the grain bin attached to the secondary air
pipe. From the nozzle performance calculations, the .010 inch and .012
inch slot widths were the best for the desired output. These slot
widths would permit a large primary flow and still provide a large
secondary air augmentation. After these considerations were made, a
single set of tests for each slot width was conducted with the grain
bin attached. Calculations were made on the test results in the same
manner as before. The following equations were plotted on the same
graph (Figure 10) as the preceding data results:
where:
slot width (inch)
.010
.012
y = total air flow (CFM)
x = rotameter scale number
equation
y = -11.06 + 38.85x
y = -7.251 + 39.15x
The secondary flows with and without the grain bin attached were com-
pared and the difference in flows was only three percent. With this
small difference the sy~tem with the bin was assu~ed to he sealed or
to have no leaks. The data for free air conveying with the grain bin
attached is presented in Ap1fendi.x C-II.
36
c al N LO
N v ·= 0 ..... (!) ........
~ 3: ..... .....
<t <t N
0, 0, 0, 0, ..... .....
LL. LL. (/)
..... Q)
0 0, :> - .c J..I
N :e E ::s ~
rr, c.:> LL. ::,
o. (..) z .j.J
::s - 0, 0..
3 0 .j.J
u ::s 0 U) 0
~ O') LL. ..... Q)
o. 0, ,-1 - N >, 0,
\ ..... E N 0 0
\ E 0 z -\ ..... N 0 m . 0:: \ a.. - "Cl
!:!2 s:: \ m
0 \ c.:>
\ \
. "'o 0
\ ,-1
~ \ Q)
"" J..I
\ ::s bO
\ \ - •.-l
\ i:,;...
\ (S) \
<3. \ (!)
\ \ \ \ q
0 0 0 0 LO v rt') N
(W.::IJ) MOl.::I IDJOl

37
Material Conveying Capacity
In order to finalize the decision of which slot size to use for
conveying, three more groups of tests were run. The total apparatus
was assembled and tests were run using the .010, .012 and .014 inch
slot widths. The range above 1.0 on the rotameter was used for all
tests. The input flow and pressure readings were recorded and the
static pressure readings were taken. All data recorded in this set of
tests was later compared to values obtained while the material was
being conveyed.
A single set of tests were run for each nozzle slot width. Air
flow and pressure calculations were made from the test data (Appendix
C-111) by using the computer program in Appendix B-IV. The pressure
loss and total flow calculation results were collectively put in the
11 POLFIT11 regression program which resulted in the following equation.
y = -.8677 + .0508x
where:
y = pressure (psi)
x = total air flow (CFM)
The above equation was plotted (Figure 11) so the pressure loss vs
total flow could be easily analyzed to find the pressure loss for the
38 foot section of conveying pipe due to air flow only. From the data in
Appecdix C-IIIit was found that the most desirable slot width was .012
inch. This slot width allowed the full primary flow to be used with
only small differences in the secondary air flow.
Since the conveying capacity of the pneumatic system was unknown,
a maximum value was found by trial and error. At the beginning of the

1.00
(/) 0.90 Q.. -x_ 0.80 ·-Q..
0 0.70 -c:
0 -~ 0.60 ... 0 :c 00
0.50 ,..., ..... ~ 0.40 U) Cf)
0 0.30 _J
.cu ... 0.20 :::, Cf) en Cl) ....
CL. 0.10
0.00 15
P = -0.86 77 + 0.0508 Q
Where P = Pressure Loss, PSI Q= Total Flow, C FM
20 25
Totol Flow ( CFII)
•
Figure 11. Coanda Nozzle, Total System, Free Air Output
•
• •
._
30 32
~

39
test the primary air flow was set at its maximum value or about 22 CFM.
The Grahm variable speed drive was increased in speed until the pneu
matic conveyor would plug. The conveying capacity w~s increased by
lowering the primary flow to 20.7 CFM. After the first material flow
rate was marked on the variable speed drfve (3. 7 5 lb/min.) the speed
was lowered to the next desired flow rate. Again it was found that a
lower primary air flow (18.8 CFM) aided in the system cohveying capaci
ty. The air supply was left at 18.8 CFM for the remainder of the con
veying tests. The Grahm variable speed drive was set for conveying
capacities of 2 .4, 2 .1 and 1.3 pounds per minute for the other .. sets of
t,f;\St,So
Three sets of tests were run for each material flow ... ;i.,ate. The
secondary flow pipe was restricted with a slide on the grain bin down
spout. The slide heights were 1/4, 1/2, 3/4 and linch for each materi
al flow rateo A test to determine the slide's effect on the secondary
flow with free air was run. The primary air flow was 18.8 CFM while
the slide was set at 1/4, 1/2, 3/4 and 1 inch. All secondary air flow
readings were about 6075 CFM which showed the slide had no effect on
the free air system.
During the conveying tests, the material would surg~ through the
pipe. This surging was apparently from the build-up of material in the
secondary air pipe. When an air seal was formed by the grain, the
suction from the nozzle would pull the grain into the nozzle. The
grain build-up in the secondary flow pipe caused a large force in the
auger and consequently the grain bin and variable speed drive had to be
braced to overcome the large torque. When the auger was turned off, the
grain would continue to flow i!'i the conveying pipe for five tq t~n
seconds.

40
Flow and pressure calculations were made on the data shown in
Appendix G~IV with the computer program in Appendix B-IV .: The pressure
loss and feed rate data were then put in the regression program "POLFIT"
which calculated the following equations~
where
feet rate (lb/min)
2 0 4, 2. 1, 1. 3
y = pressure psi
x = feed rate lb/min
equation
y = .5109 + 0069x
y = .3909 + .0148x
The largest calculated difference percent from these equations was
eleven percent with the standard error of estimate being 0 020 psi for
the smaller feed rates and seven percent difference with the standard
error of estimate being .022 psi for the highest feed rate. The
equations were plotted in Figure 12 with pressure loss vs feed rate
to allow determination of pressure loss for a certain feed rate. Since
the values of total air flow were known for the different feed rates
(Appendix IV), values of pressure loss due to air flow only could be
taken graphically from Figure lL The total air flows for 1.3, 2 .1,
2.4, and 3.75 lb/min. material flow rates were 23.8, 23.0, 22.6, and
23. 9 GFM respectively. The pressure loss for air only in each case was
.35, .32, .3 and .36 psi per 38 foot section. The free air pressure
losses were plotted in Figure 1.2 under its corresponding feed rate-
pressure loss curve. The difference between these curves were assumed
to be the pressure loss due to the material conveyed.

1.00 --en 0.90 Q. -a.,
l 0.80 -'E 0. 70 0 N
~ 0.60 :::c co 0.50 rt')
""' 0
u.. 0.40 •· en en 0
...J 0.30 a., ""' ::, 0.20 en en cu ""' Q. 0.10
0.00 J.O
Air And Groin
---- Air Only
------~~~~~~-
2.0 · 3.0
Feed Rote (Lb/Min)
20.7 CFM
-~--------------
4.0
Figure 12. Pressure Loss for Conveying Rates .i::,, ....

CHAPTER VI
SUMMARY AND CONCLUSIONS
Summary
A pneumatic conveying system was designed and constructed with a
Coanda nozzle as the device used for air introduction into the con
veyor1s pipe system. An auger injector was used to meter the grain
sorghum that was to be conveyed. A one inch aluminum electrical
conduit conveying pipe formed the path to the cyclone separator where
test samples were taken.
Free air tests were run on the Coanda nozzle with varying primary
air flow (15-22 CFM) and nozzle slot widths (.006- .020 inch). Based
upon these tests a slot width and primary air flow combination was
selected that would best support conveying of particulate material.·
Final slot width selection was made after the total conveying
system was fabricated and performance determined for three nozzle
slot widths ( .010, .012, and .014 inch).
The nozzle slot width of .012 inch was chosen for the conveying
tests. A primary air flow of 20.7 CFM was used for the 3.75 pounds
per minuce conveying capacity and 18.8 CFM for the 2.4, 2.1, and 1.3
pounds per minute conveying capacity. The pressure loss for 38 feet
of horizontal pipe was recorded while conveying.
A metal slide was used to restrict the secondary air pipe while
42

conveying. The effect of the secondary air flow restriction was re
corded.
Conclusions
The following conclusions are presented as a result of the work
in this study:
1. The Coanda nozzle that was constructed had an adequate
Coanda effect to cause a high velocity secondary flow.
2. When the 58 feet conveying pipe ~~s linked with the
nozzle, the greatly added pressure losses for the free air
only caused the secondary flow to be lowered below the
velocity requirements of pneumatic material conveying.
3. The maximum material flow ratew~::i considerably lower than
the capacities of other one inch pneumatic conveying systems
reported in the literature.
4. The pressure losses while conveyin~ grain sorghum for the 38
feet of horizontal pipe were 65 to 80 percent due to the air
flow only, with the remainder due to the material.
5. The slide in the secondary air flow pipe had no apparent
effect on the systems conveying capacity.
Suggestions for Future Work
lo A divergent section immediately following the nozzle which
would connect the nozzle to a larger diameter conveying pipe
should be tested for particulate conveying.
2. A shorter secondary pipe with the material introduction
closer to the nozzle should be tested.
43
3. A method to allow a constant flow rate of material into
the system should replace the present ma.terial injection
system.
4. The possibility of conveying other agric~ltural products,
such as peanuts, should be investi,gated.
44

BIBLIOGRAPHY
lo Pneumatic Handlings of Powdered Materials, EoE.U.A. Handbook, No. 15 3 PP• 30-69 (1963)0
2o Henderson, So M. and R. Lo Perry. Agricultural Process Engineering, pp. 216-224 (1966)0
3o Puckett, Ho B. "Performance of a Pneumatic Feed-Conveying System.11 Agricultural Engineering, 41, pp. 808-812 (1960).
4-. Puckett, Ho B. and Ho H. Klueter. "Auger-Feed Injector for Pneumatic Conveyor. 11 Trans. Amer. Soc. Agri. Engr., Vol. 9, No. 3, pp. 406=408 (1966).
5. Reba, Imant s. 11A Preliminary Study of the Coanda Nozzle Principle for Propulsion of Tube Vehicles." Report !ITRI.:!_ 6128 (1968).
6. Reba, Imants. "Applications of the Coanda Effect." Scientific American, 214, No. 6, pp. 84-92 (1966).
7. Victory, Eo L. "Analysis of Thrust and Fl.ow Augmentation of a Coanda Nozzle." Report ARL, pp. 65-86 (1965).
8. Klueter, Ho H., Ho B. Puckett, and Eo F. Oliver. "Medium-Pressure Pneumatic Feed Conveyor." Illinois Research, Winter, pp. 6, 7 (1.964) 0
9. 11Analysis of Thrust Due to Coanda Phenomenon." SFERI - Coanda (Clichy, France) AFOSR Repor_! £E, Contract AF .§.1(052) 382, Oct. (1960).
10 o Marksi, Lo So Mechanical Engineers Handbook, pp. 355 (1951).
45

APPENDIX A
WORKING DRAWINGS OF
CONVEYING APPARATUS
46

APPENDIX A-I
COANDA NOZZLE SURFACE SECTION
· 0--:-- 0 / , __ --; "'
.,,,\ . ' . I / I I I , '
I ~ \
LL~G)~-c \
!Y I G) 1\ \ . \ I I
\ ' . / '\,_ /' - - -'\ / 0 I 0·/ ---1 )( ---
See Appendix A-II -
I.I~, .75 l.75
PY7Y? ?i 0 "'?
·+·
I ~X//fll/:T;//a(<'./ ".' < K CO:t:IC, t I 1 I ""'t ...... 'I. I t I
---:-. I - I~~ I I - N I ..; I ...;
~---.:- - - -' - - --t"" _!.12: ~ t l· \.;, -- - - i -, I \ .
I ,,--- - ..J . I I I
i
I I I I I I L- _...J
11 1.62 __J 4.00 ---'-----~
3.12
Note: Drill 11/32 dia., 6.holes equispaced Drill #7, Tap 1/4-20NC, 2 Holes Material - 411 Dia x 3.12 Aluminum Dimensions are in inches
.,:-. ......

APPENDIX A-II
COANDA SURFACE DETAIL
f
/ R~di_us Centers are on Previous Angle Li,nes
Dimensions are in inches
~

APPENDIX A-III
.50 1.00 ~ 2.00 ~ COANDA NOZZLE
L I I WALL SECTION
.375 -1'1 f ,,,.j_;t,
I .r """' <....aa.;;i;=r=· .&..< "-' "-' "-' "-' """' ~tA>NN
o ~- I I II I . I :e ~-:I 111-1 I-: N - I . I I I N C·I-- -. - __ J. :: k,.22'7-...jj
I -. -J,J I I . I I
L-c,, . I .J_ I - I ', l-- - - ....,.. --1
' I '- I
'- I
' '---------' ~----3.50 ~I
~ "'0
. 1.50~
------4~·0·0 -----
Note: Drill 17 /64 dia, Tip 5/16-18NC, 6 Holes Drill #7, -Tap 1/4 - ZONC, 2 Holes Material - 411 Dia x 3.50 Aluminum Dimensions are in inches
__ J
$
,,, ,._ 0 i .
. 05r-' .403 ,r+ I
APPENDIX A-IV
COANDA NOZZLE WALL DETAIL
Dimensions are i,n :inches
\JI 0

,---I, ~
~ ~ ~
~
~ ~ ~
~ I, ~ ~
~
~ ~ ~
I~ 12
0 rt)
N
-IN v f
51
Dimensions are in inches . '
e /
'
- 'U 18
APPENDIX A-V
MATERIAL FEEDING DEVICE
\ I '\ /
.......... ./ - -
L '
I ~I 22
-IN N
..,,jm ~ __ j
-la,
-I!!?
Dimensions are in inches
. I l~ 1.L I l ~ ,L ,.. , l'---2 8 ~ 2 2
APPENDIX A-VI
FEEDER DOWNSPOUT· I.J1 ~

APPENDIX B
COMPUTER PROGRAMS
FOR PRESSURE AND FLOW
CALCULATIONS
53

54
APPENDIX B ... I
FLOW CALCULATION FOR ROTAMETER CALIBRATION
1. Get List (h, df' da)
2. V = SQRT (2 * 32.2 * h * df/(12 *da))
2.5 V = V * 60
3. Put List (V)
4. Q = v * .0037
5. Put List (Q)

APPENDIX B-II
VELOCITY CALCUIATION FOR ONE INCH
PIPE CALIBRATION
1. Get List (h)
2. V = SQRT (2 *32.2 * h * df/(12 * da))
3. V = V * 60
4. Put List (V)
55
L ST:
2.
3.
4.
5.
5.5
6.
7.
8.
APPENDIX B-III
FLOW CALCULATION FOR FREE All{ MEASUREMENT
Get List (rno, d, vel, pl, p2)
ql = 200.913 - 478,856 * rno + 400.609 * rno ** 2 -107,359 * rno ** 3
ql = ql * SQRT (.074158/d)
v2 = 319.578 + .509 * vel + .00015 * vel ** 2 -.0000000166 * vel ** 3
q2 = v2 * .849/144
qt = ql + q2
press= (p2 - pl)* .3939 * .3613
Put List (ql, q2, qt, press)
GO to ST
56

1. ST:
2.
3.
4.
5.
6.
7.
8.
9.
10.
ll.
12.
13.
APPENDIX B-lV
FLOW AND PRESSURE CALCULATIONS FOR
MATERIAL CONVEYING CAPACITY
Get List (rno, h, hm, hw, mwh)
ql = 200.913 - 478.856 * rno + 400.609 * rno ** 2 -107.359 * rno ** 3 ql = ql * SQRT (.074158/da)
V = SQRT (2 * 32.2 * h * df/(12 *da))
V = V * 60
V2 = 319.5782432 + .5094530 * V + .0001505915 * V ** 2 -.0000000166 * v ** 3
q2 = V2 * .849/144
qt = ql + q2
P32 - hm * .4912/.827
P38 = hw * .03613
PDC = mwh * .03907 * .03613
Put List (ql, V2, q2, qt, p32, p38, POC)
Go to ST
57

1.
2.
3.
4.
ST:
APPENDIX B-V
AIR DENSITY CALCULATION FOR
ALL FLOW CALCULATIONS
Get List (bp, vp, t)
da = (bp -.38 * vp) /((t, + 460) * .754)
Put List (da)
Go to ST
58

APPENDIX C
COANDA NOZZLE TEST OATA
59

APPENDIX C-I
COANDA NOZZLE FREE AIR TEST DATA AND CALCUI.ATION
Air Nozzle Primary Secondary Secondary Total Line Slot Deitsit~ Rotameter Press. Air Flow Vol. Head Velocity Air -Flow Press. Width ( lb/ft ) Number (PSI) (CFM) (in. Red Oil) (FPM) (CF-M) (PSI)
•• 006 .0712 1.0 40 15.62 1.7 4874 41.905 .768 in.
1.1 49 16 .34 2.0 5286 44.457 .896
.0705 1.0 43 15.699 1. 7 5 4969 42.42 .817
1.05 49 15.90 la85 5109 43.25 .896
.0724 1.0 45 15.732 1. 7 5 4980 40.092 .853
1.05 49 15.935 1.85 5120 43.33 .903
.008 .0724 1.0 18 15.49 1.0 3707 35. 725 ~469 in. 1.1 25 16.2067 1.35 4307 39.678 .661
1.2 32 17 .859 1.7 4833 43.95 .839
le3 38 19.797 1.9 5109 47 .15 .981
.0696 1.0 20 15.8 .95 3685 35.91 .512
1.1 28 16 .529 '1.25 4227 39.58 .704
1.2 34 18.215 1.45 4552 42.937 .889
1.25 38 19.208 1. 7 5 5001 46 .078 .946
.0702 1.0 23 15.73 1.09 3930 37 .19 .569
1.1 32 16.4587 1.45 4533 41.086 • 775
1.2 39 18 .137 1.65 4835 44.237 .946
°' 0

APPENDIX C-I (Continued) I
Air Nozzle Primary Secondary Secondary Total Line Slot Densit~ Rotameter Press. Air Flow Vol. Head Velocity Air Flow Press. Width ( lb/ft ) Number (PSI) (CFM) (in. Red Oil) (FPM) (CFM) (.ESi)
.010 00724 1.0 12.5 15.49 .67 5 3045 31. 991 .369
1.1 16 16.2067 .85 3417• 34.8162 .498
1.2 21 17 .859 1.25 4144 40.47 .654
1.275 24 19.322 1.4 4386 43.20 .739
1.3 26 19.797 le5 4540 44.46 .804
1.4 32 21.369 1.7 4833 47 .46 .946
.0696 1.0 13 15.8 .65 3048 32.31 .377
1.1 18 16 .529 .9 3586 36.08 .547
1.2 23 18.215 1.15 4054 40.347 .704
1.3 29 20.19 1.35 4393 44.108 -.8"8-
1.35 33 21.82 1.5 4630 46 .19 .946
.0702 1.0 13 15.73 .65 3035 32.17 .384
1.1 18 16. 458 1.02 3802 37.218 .533
1.2 23 18 .137 1.29 427 5 41.44 • 704
1.3 29 20.1 1.42 4486 44.49 .874
1.35 32 20.99 1.53 4656 46 .22 .953
.012 .0712 1.0 11 15.62 .35 22ll 27 .43 .2759 -
1.1 15 16 .34 .65 3013 32.66 .4196
1.2 19 18.009 .8 3343 36.203 • 547 °' 1--'

APPENDIX C-I (Continued)
Air Nozzle Primary Secondary Secondary Total Line Slot Dens it! Rotameter Press. Air Fl.ow Vol. Head Velocity Air Flow Press. -Width ( lb/ft ) Number (PSI) (CFM) (in. Red Oil) (FPM) (CFM) (PSI)
0012 .0712 1.3 23 19.96 .95 3643 39.8449 .6614
.0696 1.0 9 15.8 .45 2536 29.41 .298
1.1 12 16 .529 .65 3048 33.045 .384
1.2 14 18.215 • 79 3360 36.50 .512
1.3 18 20.19 .95 3685 40.30 .63
1.4 22 21.79 1.1 3965 43~446 .782
1.45. 23.5 22 .249 1.15 4054 44.38 .839
.0704 1.0 9 15. 71 .45 2521 29.24 .313
1.1 12 16 .43 .59 2887 32.036 a398
1.2 14 18.11 .85 3466 36 .. 997 .51
1.3 18 20.07 .95 3664 40.07 .647
1.4 22 21.67 1.25 4203 44.597 .789
1.45 24 22.12 1~35 4368 45.91 .867
e014 .0726 1.0 7 15.47 .2 1655 24.31 .200
1.1 8 16.18 .3 2027 26.99 .270
1.2 9 17 .83 .4 2341 30.36 .348
1.3 12 19.77 .6 2867 35.26 .44
1 .. 35 13 20.64 .7 3097 37.43 .476
1.4 13.5 21.34 • 7 5 3206 38 .. 75 .536 °' N

APPENDIX C-I (Continued)
Air Nozzle Primary Secondary Secondary Total Line Slot Dens it~ Rotameter Press. Air Flow Vol. Head Velocity Air Flow Press Width ( lb/ft ) Number (PSI) (CFM) (in. Red Oil) (FPM) (CFM) (PSI)
.014 .0726 1.45 14.5 2L78 .8 3311 39.79 .593
.0696 1.0 7 15.80 .25 1890 25.87 .263
1.1 8 16 .529 .37 2299 28.82 .327
1.2 9.5 18.215 .47 2592 32.14 .3769
1.3 12 20.19 .57 2854 35.60 .476
1.4 14 21.795 .. 75 3274 39.59 .576
1.45 15 22 .249 • 7 5 3274 40.049 .632
.0704 LO 7 15.71 .25 1879 25.72 .227
1.1 8.5 16 .435 .35 2224 28.31 .298
1.2 10 18.11 .49 2631 32.2 .391
1.3 12 20.07 .57 2838 35.39 .476
1.4 14 21.67 .69 3122 38.608 .576
1.45 15.5 22 .12 .82 3404 40.658 .647
.016 .0726 1.0 3 15.47 .2 1655 24.3138 .170
1.1 6 16 .18 .22 1736 25.446 .232
1.2 7 17 .8347 .3 2027 28.64 .277
1.3 8.5 19.77 .35 2190 31.46 .348
1.4 9.5 21.34 .45 2483 34.658 .418
1.45 10 21.78 .5 2617 35.85 .448 a-· w
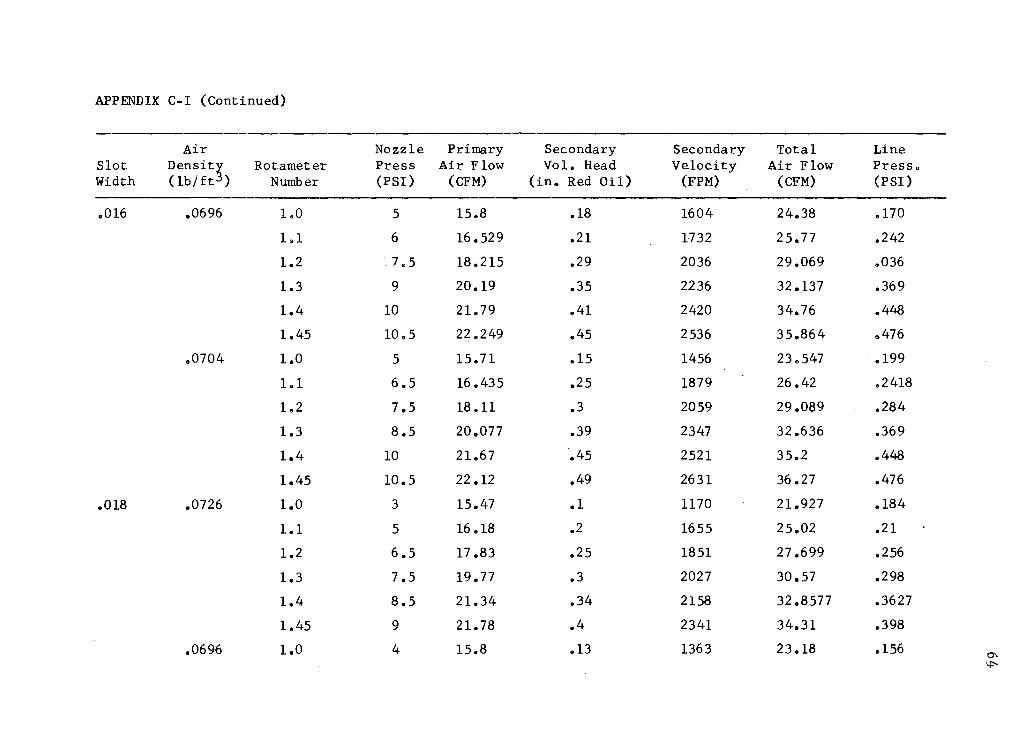
APPENDIX C-I (Continued)
Air Nozzle Primary Secondary Secondary Total Line Slot Dens it! Rotameter Press Air Flow Vol. Head Velocity Air Flow Press. Width (lb/ft ) Number (PSI) (CFM) (in .. Red Oil) (FPM) (CFM) (PSI)
.016 .0696 1.0 5 15.8 .18 1604 24.38 .170
1.1 6 16 .529 .21 1732 25.77 .242
1.2 .7.5 18 .215 .29 2036 29.069 .036
1.3 9 20.19 .35 2236 32 .137 .369
1.4 10 21. 79 • 41 2420 34.76 .448
1.45 10.5 22 .249 .45 2536 35.864 .,476
.0704 1.0 5 15. 71 .15 1456 23.,547 .199
1.1 6.5 16 .435 .25 1879 26.42 e2418
1.2 7.5 18.11 .3 2059 29.089 .284
1.3 8.5 20~077 .39 2347 32.636 .369
1.4 10 21.67 .45 2521 35.2 .448
1.45 10.5 22 .12 .49 2631 36.27 .476
.018 .0726 1.0 3 15.47 .1 1170 21.927 .184
1.1 5 16 .18 .2 1655 25.02 .21
1.2 6.5 17.83 .25 1851 27.699 .256
1.3 7.5 19. 77 .3 2027 30.57 .298
1.4 8.5 21.34 .34 2158 32 .8577 .3627
1.45 9 21.78 .4 2341 34.31 .398
.0696 1.0 4 15.8 .13 1363 23.18 .156 °' \.P-

APPENDIX C~I (Continued)
Air Nozzle Primary Secondary Secondary Total Line Slot Density Rotameter Press Air Flow Vol. Head Velocity Air Flow Press. Width (lb/ft3) Number (PSI) (CFM) (in. Red Oil) (FPM) (CFM) (PSI)
.018 .0696 1.1 5 16 .529 .15 1464 24e4068 .199
L2 6 18.21 .2 1690 27.2388 .25
1.3 7.5 20.19 .25 1890 30.26 .32
1.4 8 21.79 .3 2070 32.8~36 .376
1.45 8.5 22 .249 .33 2171 33.837 .398
.0705 1.0 5 15.699 .13 1354 23.035 .149
1.1 6 16 .42 .15 1454_ 24.25 .199
1.2 7 18 .098 .18 1593 26.62 .. 241
1.3 8 20.062 .21 1721 29.247 .327
1.4 8.5 21.656 .34 2190 33 .348 .384
1.45 9 22.107 .4 2375 34.82 .419
.020 .0726 1.0 3 15.47 .1 1170 21.927 .128
1.1 5 16 .18 .12 1282 23.172 .184
1.2 5.5 17 .8347 .15 1433 25.558 .213
1.3 6 19. 77 .17 5 1548 28.0688 .256
1.4 7 21.34 .2 1655 30 .. 18 .312
1.45 7.5 21.78 .22 1736 31.047 .341
.0696 1.0 3 15.8 .as 845 20.797 .145
1.1 5 16 .529 .08 1069 22.519 .194 °' _I.JI

APPENDIX C-I (Continued)
Air Nozzle Primary Slot Densit! Rotameter Press Air Flow Width ( lb/ft ) Number (PSI) (CFM)
.020 .0696 1.2 6 18.21
1.3 6 20.19
1.4 7 21.79
1.45 8 22 .249
1.0 3 15.699
1.1 4 16.42
1.2 5 18.098
1.3 6 20.62
1.4 7 21.656
1.45 7 22 .107
Secondary Secondary Vol. Head Velocity
(in. Red Oil) (FPM)
.ll 1254
.15 1464
.2 1690
.24 1852
.07 993
.1 ll87
.13 1354
.14 1405
.18 1593
.23 1801
Total Air Flow
(CFM)
25.069
28.069
30.819
32.12
21.345
22 .96
25.43
26.64
30.177
31.7
Line Press. (PSI)
.227
.256
.308
.352
.170
.199
.242
~256
.298
.341
°' °'

APPENDIX C=II
FREE AIR TEST OF THE COANDA NOZZLE WITH GRAIN BIN ATTACHED
Air Nozzle Primary Secondary Secondary Slot Densit! Rotameter Press Air Flow Vel_. Head Velocity Width ( lb/ft ) Number (PSI) (CFM) (in. Red Oil) (FPM)
.012 .072 1.0 9 15.53 .4 2134
1.1 11 16 .25 .55 2520
1.2 14 17.90 • 7 5 2966
1.3 18 19.85 .97 3388
1.4 22 21.43 1.21 3785
1.45 24 21.87 1.28 3891
.010 .072 1.0 13 15.53 .65 2752
1.1 18 16 .25 .95 3352
1.2 24 17.91 1.15 3692
1.3 28 19.85 1~40 4061
1.35 33 20. 72 1.5 4193
Total Air Flow (CFM)
28 .116
31.11
35.40
39.83
43. 7 5
44.81
31.76
36 .02
39.67
43.80
45.45
Line Press. (PSI)
.273
.356
.47 5
.617
• 772
.831
.344
.564
.683
.843
.950
°' "

APPENDIX C-III
TOTAL SYSTEM FREE AIR TEST DATA AND CALCULATIONS
Air ", Sec. Prim. Nozzle h2 Slot Densit~ Rotameter Open. Flow Press. triches v Q Width ( lb/ft ) Scale Inch CFM psi Red Oil ft7min CFB:
.012 .0708 1.0 l 15.66 -9 .08 1000 21.61 Inch
1.1 1 16 .38 11 .10 1107 22.91
1.2 1 18.06 14 .15 1325 25.87
1.3 1 20.02 18 .19 1481 28. 7 5
1. 4 1 21.61 22 .2 1518 30.56
1.45 1 22.06 24 .22 1590 31.43
.010 .0714 1.0 1 15.66 13 .13 1242 22.99 Inch
1.1 l 16 .38 18 .17 1405 24.67
1.2 1 18.06 23 .22 1590 27 .43
1.3 1 20.02 28 .25 1694 30.00
1.35 1 20.90 34 .25 1694 30.89
.014 .0714 1.0 1 15.66 7 .03 709 19.84 Inch 1.2 1 18.06 9 .06 901 23.37
1.4 l 21.61 14 .08 1009 27 .56
1.45 1 22.06 15 .11 1153 28.86
Press. Press. 3211 38' psi psi
.368 .142
.498 .180
.635 .243
.831 .316
1.063 .390
1.187 .426
.498 .185
• 712 .275
.902 .352
1.128 .433
1.306 .483
.296 .117
.47 5 .185
• 742 .293
.819 .311
Press. l 1 from D.C.psi
.002
.005
.008
.001
.001
.001
.005
.-00,8
.014
.018
.022
.004
.007
.012
.012
8P 38' psi
.226
.318
.392
.515
.673
• 761
.313 ' ·;!.
.-437 -t
.550
.695
.823
.179
.290
.449
.508
°' '00

APPEND-IX C-IV
MATERIAL CONVEYING TEST DATA AND CALCUIATIONS
Air Grain Sec. Rota- Nozzle h Press. Press. Press. AP Pri~ry Densit! Flow Open. meter Press. ][nctes v2 Qt 3211 38 1 .1 v from 38V Flow ( lb/ft ) lb/min Inch Scale psi Red Oil ft/min CFM psi psi D.C.psi psi
20.74 .0719 4.62 1 1.35 19 .01 529 23.86 .861 .334 .011 .537 CFM
4.52 3/4 1.35 19 .01 529 23.86 .890 .338 .012 • 552
4.4 1/2 1.35 19 .01 529 23.86 .861 .329 .012 .537
4.38 1/4 1.35 19 .01 529 23.86 .846 .320 .011 .520
20.77 .07169 4.06 1/4 1.35 19 .01 529 23.89 .890 .316 .011 .574 CFM 3.84 1/2 1.35 19 .01 529 23.89 .861 .320 .012 .541
3 .46 3/4 1.35 19 .01 529 23.89 .890 .316 .012 .574
3.56 1 1.35 19 .01 529 23.89 .861 .309 .012 .552
3.56 1 1.35 19 .01 529 23.89 .831 .311 .012 • .520
3.56 3/4 1.35 19 .01 529 23.89 .831 .309 .011 .522
3.64 1/2 1.35 19 .01 529 23.89 .831 .313 .011 .518
3 .18 1/4 1.3 19 .01 529 23.89 • 772 .261 .011 .511
18 .• 96 .0714 2.4 1 1.25 16 .02 628 22.66 • 712 .261 . .o_o8 .451 CFM 2.4 3/4 1.25 16 .02 628 22.66 .683 .250 .008 .433
2.4 1/2 1.25 16 .02 628 22.66 .683 .241 .008 .442
2.38 1/4 1.25 16 .02 628 22.66 .683 .250 .009 .433
2.5 1/4 1.25 16 .02 628 22.66 .683 .257 .009 .426
2.4 1/2 1.25 16 .02 628 22.66 .683 .250 .008 .433 °' '°
APPENDIX C-IV (Continued)
Air Grain Sec a Rota- Nozzle h2 Press. Press. Press. AP Primary Densit! Flow Open. meter Press. Inches V2 Qt 3211 38' l'from 38'
Flow ( lb/ft ) lb/min Inch Scale psi Red Oil ft/min CFM psi psi D.C.psi psi
18.96 .0714 2.4 3/4 1.25 15 .02 628 22.66 .653 .248 .008 .405 CFM 2.36 1 1.25 15 .02 628 22.66 .641 .239 .008 .402
18.88 .0720 2.4 1.0 1.25 15.5 .02 626 22.58 .653 .252 .008 .401 CFM
2.4 3/4 1.25 15.5 .02 626 22.58 .653 .243 .008 .410
2.4 1/2 1.25 15.5 .02 626 22.58 .653 .234 .008 .419
2.34 1/4 1.25 15.5 .02 626 22.58 .623 .246 .008 .377
1.30 1/4 1.25 15.5 .05 837 23.82 .668 .241 .009 .427
1.30 1/2 1.25 15.5 .05 837 23.82 .668 .246 .009 .422
1.30 3/4 1.25 15.5 .05 837 23.82 .638 .237 .009 .401
1.28 1 1.25 15.5 .05 837 23.82 .602 .232 .009 .370
L28 1 1.25 15.5 .05 837 23.82 .697 .250 .009 .447
1.28 3/4 1.25 15.5 .05 837 23.82 .668 .243 .009 .425
1.28 1/2 1.25 15.5 .05 837 23.82 .638 .237 .009 .401
1.28 1/4 1.25 15.5 .05 837 23.82 .638 .237 .009 .401
1.3 1/4 1.25 15.5 .05 837 23.82 .638 .237 .009 .401
1.3 1/2 1.25 15.5 .05 837 23.82 .638 .237 .009 .399
1.3 3/4 1.25 15.5 .05. 837 23.82 .638 .239 .009 .404
1.3 1 1.25 15.5 .05 837 23.82 .638 .234 .009 .404
2.1 1 1.25 15.5 .03 705 23.04 .683 .255 .088 .428 ....... 0
APPENDIX C-IV (Continued)
Air Grain Sec. Rota- Nozzle Primary Densit! Flow Open. meter Press. Flow (lb,/ft ) lb/min Inch Scale psi
18.88 .0720 2.1 3/4 1.25 15.5 CFM
2.1 1/2 1.25 15.5
2.0 1/4 1.25 15.5
2.0 1/4 1.25 15.5
2.0 1/2 1.25 15.5
2.0 3/4 1.25 15.5
2.0 1 1.25 15.5
18.97 .0713 2.2 1 1.25 16 CFM
2.16 3/4 1.25 16
2 .16 1/2 1.25 16
2.1 1/4 1.25 16
h2 Press. Inches v Q 3211
Red Oil ft]min CFB psi
.03 705 23.04 .653
.03 705 23.04 .668
.03 705 23.04 .668
.03 705 23.04 .. 668
.03 705 23.04 0668
.03 705 23.04 .668
.03 705 23.04 .659
.03 707 23.15 • 712
003 707 23.15 • 712
.03 707 23.15 • 712
.03 707 23.15 .697
Press. Press. 38 1 l'from psi D.C.psi
.252 .009
.246 .009
.248 .008
.252 .009
.250 .009
.241 .009
.243 .009
.261 .009
.261 0009
.252 .009
.243 .009
AP 381 psi
.401
.422
.420
.416
.418
.427
.416
451
451
460
454
-..J I-'

VITA
Alan Curtis Wetmore
Candidate for the Degree of
Master of Science
Thesis: EVALUATION OF.A COANDA NOZZLE FOR PNEUMATIC CONVEYING
Major Field: Agricultural Engineering
Biographical:
Personal Data: Born in Ponca City, Oklahoma, March 27, 1947, the son of Albert and Doris Wetmore; married to Debrah Liles on August 30, 1968; father of Tiffany Danielle, who was born July 29, 1971.
Education: Graduated from Tonkawa High School, Tonkawa, Oklahoma, in 1965; received the degree of Bachelor of Science in Agricultural Engineering from Oklahoma State University in 1970; completed requirements for the Master of Science degree from Oklahoma State University in July, 1972.
Professional Experience: Part time Engineering Assistant, Wetmore Inc. at Tonkawa, Oklahoma, 1962-1970; Graduate Research Assistant, Oklahoma State University from June 1970 to July 1972.
Professional Organizations: Graduate Student Member of the American Society of Agricultural Engineers.
Related Documents