T-0012-02-0510-M 1 of 39 Evaluation Guidelines for Air Sampling Methods Utilizing Spectroscopic Analysis October 2005 Mary E. Eide Phil J. Giles Michael K. Simmons Warren D. Hendricks Methods Development Team Industrial Hygiene Chemistry Division OSHA Salt Lake Technical Center Sandy UT 84070-6406

Welcome message from author
This document is posted to help you gain knowledge. Please leave a comment to let me know what you think about it! Share it to your friends and learn new things together.
Transcript
T-0012-02-0510-M1 of 39
Evaluation Guidelines for Air Sampling MethodsUtilizing Spectroscopic Analysis
October 2005 Mary E. EidePhil J. Giles
Michael K. SimmonsWarren D. Hendricks
Methods Development TeamIndustrial Hygiene Chemistry Division
OSHA Salt Lake Technical CenterSandy UT 84070-6406

T-0012-02-0510-M2 of 39
For assistance with accessibility problems in using figures and illustrations presented in this document, pleasecontact OSHA Salt Lake Technical Center at (801) 233-4900. These Guidelines were developed for internaluse by OSHA personnel. Mention of any company name or commercial product does not constituteendorsement by OSHA.
CONTENTS
EVALUATION GUIDELINES . . . . . . . . . . . . . . . . . . . . . . . . . . . . . . . . . . . . . . . . . . . . . . . . . . . . . . . . . . . 5Preliminary Considerations . . . . . . . . . . . . . . . . . . . . . . . . . . . . . . . . . . . . . . . . . . . . . . . . . . . . . . . . 5Analytical Procedure . . . . . . . . . . . . . . . . . . . . . . . . . . . . . . . . . . . . . . . . . . . . . . . . . . . . . . . . . . . . . 5Sampling Procedure . . . . . . . . . . . . . . . . . . . . . . . . . . . . . . . . . . . . . . . . . . . . . . . . . . . . . . . . . . . . . 8Overall Procedure . . . . . . . . . . . . . . . . . . . . . . . . . . . . . . . . . . . . . . . . . . . . . . . . . . . . . . . . . . . . . . 12
PREPARATION OF WRITTEN REPORTS . . . . . . . . . . . . . . . . . . . . . . . . . . . . . . . . . . . . . . . . . . . . . . . 15Fully Validated Methods . . . . . . . . . . . . . . . . . . . . . . . . . . . . . . . . . . . . . . . . . . . . . . . . . . . . . . . . 15Partially Validated Methods . . . . . . . . . . . . . . . . . . . . . . . . . . . . . . . . . . . . . . . . . . . . . . . . . . . . . . 33Studies . . . . . . . . . . . . . . . . . . . . . . . . . . . . . . . . . . . . . . . . . . . . . . . . . . . . . . . . . . . . . . . . . . . . . . 39
LIST OF FIGURES
Figure 1. Evaluation scheme for OSHA spectroscopic methods . . . . . . . . . . . . . . . . . . . . . . . . . . . . . 4Figure 2. Example of plotted DLAP data . . . . . . . . . . . . . . . . . . . . . . . . . . . . . . . . . . . . . . . . . . . . . . . 6Figure 3. Example of a calibration curve . . . . . . . . . . . . . . . . . . . . . . . . . . . . . . . . . . . . . . . . . . . . . . . 7Figure 4. Example of sampler capacity test results . . . . . . . . . . . . . . . . . . . . . . . . . . . . . . . . . . . . . . . 9Figure 5. Example of a storage test . . . . . . . . . . . . . . . . . . . . . . . . . . . . . . . . . . . . . . . . . . . . . . . . . . 12Figure 6. Example of plotted DLOP/RQL data . . . . . . . . . . . . . . . . . . . . . . . . . . . . . . . . . . . . . . . . . . 12Figure 7. Example of a calculated RQL when recovery is the determining factor . . . . . . . . . . . . . . . 13Figure 3.5. Calibration curve for {analyte} . . . . . . . . . . . . . . . . . . . . . . . . . . . . . . . . . . . . . . . . . . . . . . . 24Figure 4.1. Plot of data to determine DLAP . . . . . . . . . . . . . . . . . . . . . . . . . . . . . . . . . . . . . . . . . . . . . . 26Figure 4.2. Plot of data to determine DLOP/RQL . . . . . . . . . . . . . . . . . . . . . . . . . . . . . . . . . . . . . . . . . 27Figure 4.5. Ambient storage test for {analyte} . . . . . . . . . . . . . . . . . . . . . . . . . . . . . . . . . . . . . . . . . . . . 28Figure 4.7. Sampler capacity test results . . . . . . . . . . . . . . . . . . . . . . . . . . . . . . . . . . . . . . . . . . . . . . . . 29Figure 4.10. Mass spectrum of {analyte} . . . . . . . . . . . . . . . . . . . . . . . . . . . . . . . . . . . . . . . . . . . . . . . . . 32Figure 1.2. Plot of data to determine DLOP/RQL . . . . . . . . . . . . . . . . . . . . . . . . . . . . . . . . . . . . . . . . . 36
T-0012-02-0510-M3 of 39
INTRODUCTION
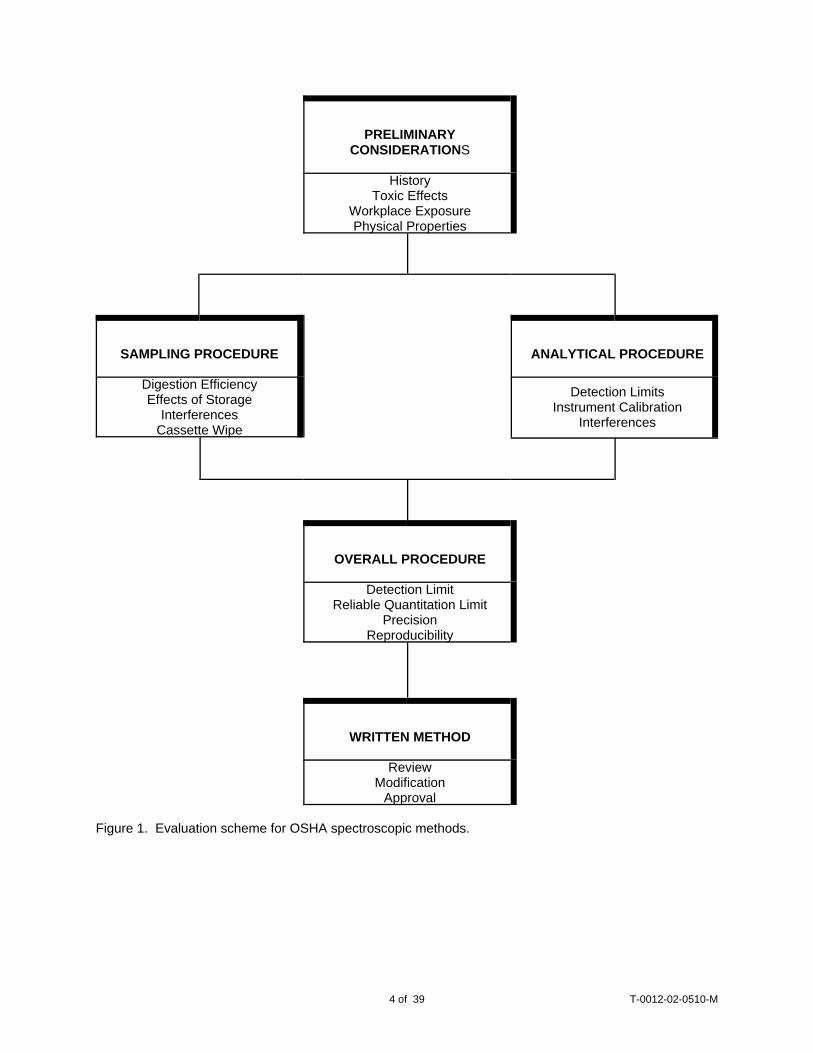
The following evaluation guidelines were developed to provide chemists of the Methods Development Teamwith a uniform and practical means for evaluating sampling methods that utilize spectroscopic analyticaltechniques. The guidelines define sampling and analytical parameters, specify required laboratory tests,statistical calculations, criteria for acceptance, and provide a detailed outline for preparation of written reports.An overview of the guidelines is shown in Figure 1. The overall goal of these guidelines is to provide OSHAwith sampling and analytical methods that can clearly be defended with evaluation data. Other tests deemednecessary for any evaluation are permissible, and a description of these tests and the resultant experimentaldata shall be included in the back-up data section following the format prescribed in this document. Summaryresults of these tests shall be presented in the main body of the method.
These guidelines are continually open to examination by the OSHA Methods Development Team andrefinements are formally made on a periodic basis. The resulting evolution in the guidelines is apparent whencomparing early methods to more recent ones.
T-0012-02-0510-M4 of 39
PRELIMINARYCONSIDERATIONS
HistoryToxic Effects
Workplace ExposurePhysical Properties
SAMPLING PROCEDURE ANALYTICAL PROCEDURE
Digestion EfficiencyEffects of Storage
InterferencesCassette Wipe
Detection LimitsInstrument Calibration
Interferences
OVERALL PROCEDURE
Detection LimitReliable Quantitation Limit
PrecisionReproducibility
WRITTEN METHOD
ReviewModification
Approval
Figure 1. Evaluation scheme for OSHA spectroscopic methods.
1 Burkhart, A.J. Appl. Ind. Hyg. 1986, 1, 153-155.
T-0012-02-0510-M5 of 39
EVALUATION GUIDELINES
I. Preliminary Considerations
A. Review literature and consult appropriate sources for information on the following:
The most common insoluble and soluble chemical forms of the substance Sampling and analytical interferencesExisting or related sampling and analytical procedures and techniquesToxic effectsWorkplace exposure (what industries and how many people are involved)Physical properties and other descriptive informationOSHA standards that may necessitate method validation at more than one level (General Industry,Construction, or Maritime; peak, STEL, ceiling, etc.)
B. Determine the analyte concentration at which the evaluation will be performed. This value, which shallbe known as the target concentration (TC), may be an OSHA PEL, an ACGIH TLV, or some otherconcentration for which there is some basis for selection.
Perform preliminary tests to determine the following parameters: sampling medium, analyticalconditions, digestion acids, and internal standard (if used).
II. Analytical Procedure
These guidelines were written from the perspective of Inductively-Coupled Plasma/Mass Spectrometry orInductively-Coupled Plasma/Opticial Emission Spectrometry analysis. Typically, 2 to 3 consecutivereplicate readings are taken and averaged to obtain instrument response for a single sample. The formatcan be modified to accommodate analytical data from other instruments, but should be followed as closelyas possible.
The substance being tested must be of known and confirmed purity whenever possible (NIST-traceableor other certified standard). Materials and reagents must be of high and acceptable quality.
The following sequence of experiments may be altered if necessary.
Instrument calibration and calculation of results is performed in a manner designed to provide the mostaccurate and consistent data for the evaluation parameter under study.
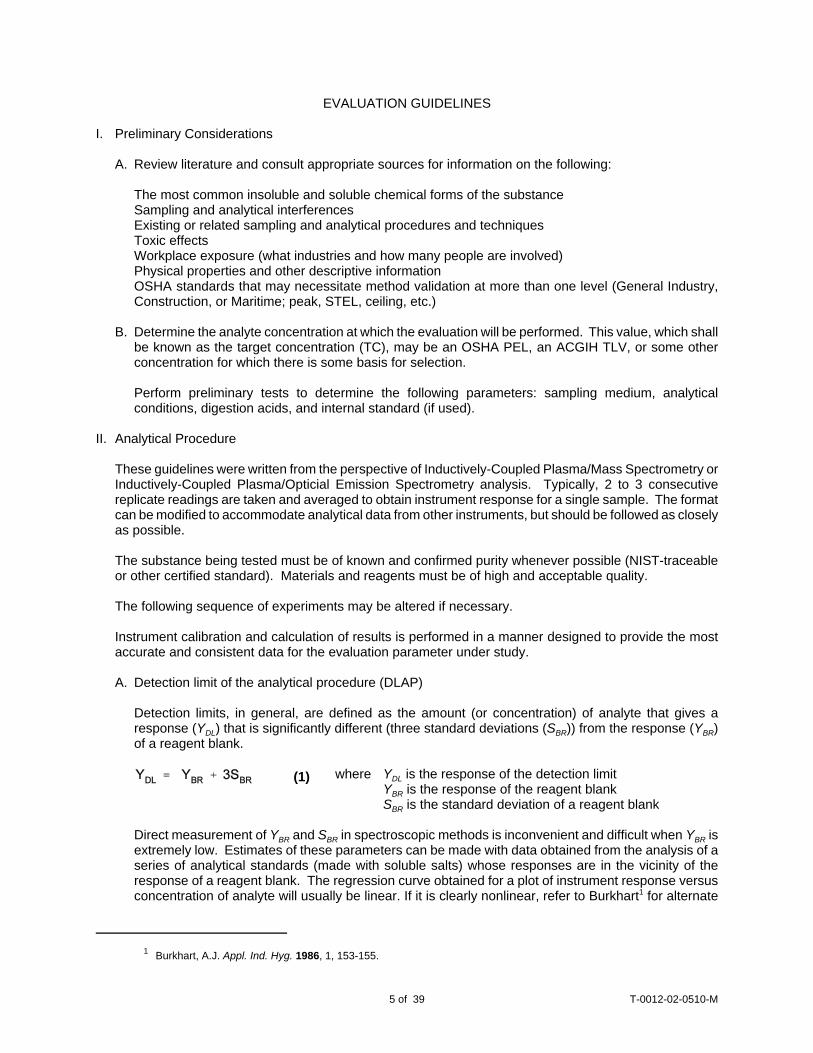
A. Detection limit of the analytical procedure (DLAP)
Detection limits, in general, are defined as the amount (or concentration) of analyte that gives aresponse (YDL) that is significantly different (three standard deviations (SBR)) from the response (YBR)of a reagent blank.
where YDL is the response of the detection limitYBR is the response of the reagent blankSBR is the standard deviation of a reagent blank
Direct measurement of YBR and SBR in spectroscopic methods is inconvenient and difficult when YBR isextremely low. Estimates of these parameters can be made with data obtained from the analysis of aseries of analytical standards (made with soluble salts) whose responses are in the vicinity of theresponse of a reagent blank. The regression curve obtained for a plot of instrument response versusconcentration of analyte will usually be linear. If it is clearly nonlinear, refer to Burkhart1 for alternate
(1)
T-0012-02-0510-M6 of 39
0
5000
10000
15000
20000
0 0.2 0.4 0.6 0.8
DLAP
Y = 2.10E04X + 326SY•X(DLAP) = 143DLAP = 0.02 ng/mL
Concentration (ng/mL)
Mea
n In
tens
ity (c
ps)
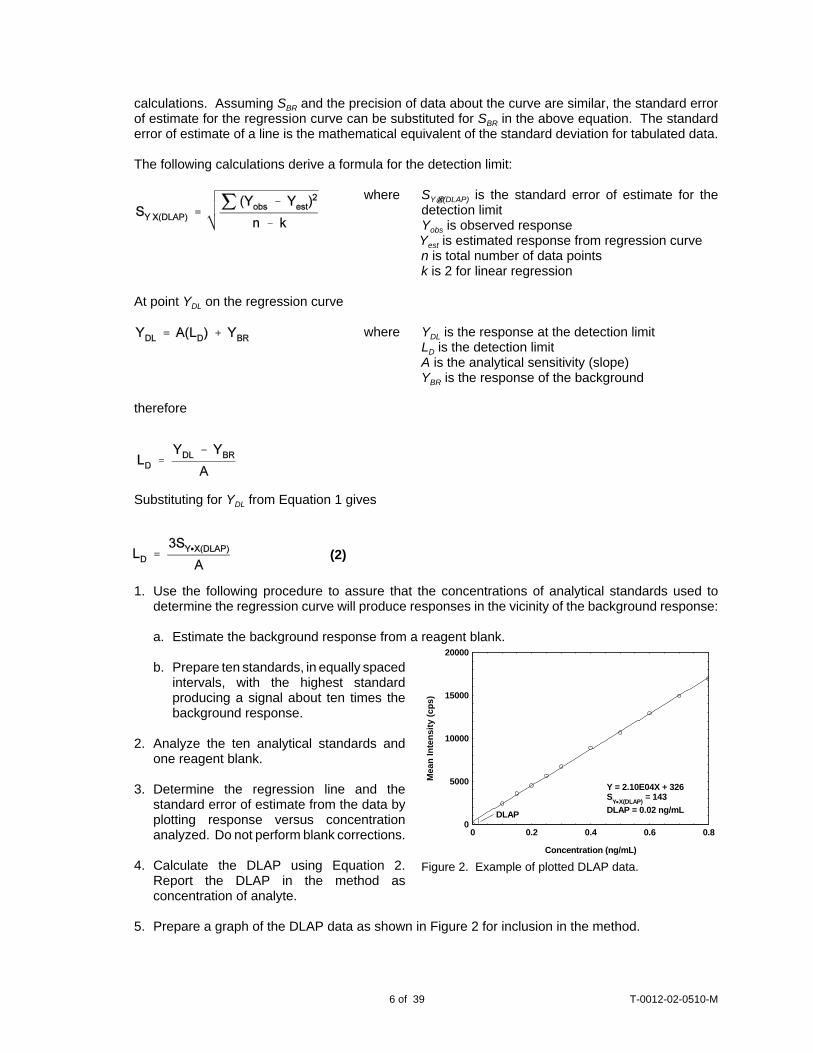
Figure 2. Example of plotted DLAP data.
(2)
calculations. Assuming SBR and the precision of data about the curve are similar, the standard errorof estimate for the regression curve can be substituted for SBR in the above equation. The standarderror of estimate of a line is the mathematical equivalent of the standard deviation for tabulated data.
The following calculations derive a formula for the detection limit:
where SY@X(DLAP) is the standard error of estimate for thedetection limitYobs is observed responseYest is estimated response from regression curven is total number of data pointsk is 2 for linear regression
At point YDL on the regression curve
where YDL is the response at the detection limitLD is the detection limitA is the analytical sensitivity (slope)YBR is the response of the background
therefore
Substituting for YDL from Equation 1 gives
1. Use the following procedure to assure that the concentrations of analytical standards used todetermine the regression curve will produce responses in the vicinity of the background response:
a. Estimate the background response from a reagent blank.
b. Prepare ten standards, in equally spacedintervals, with the highest standardproducing a signal about ten times thebackground response.
2. Analyze the ten analytical standards andone reagent blank.
3. Determine the regression line and thestandard error of estimate from the data byplotting response versus concentrationanalyzed. Do not perform blank corrections.
4. Calculate the DLAP using Equation 2.Report the DLAP in the method asconcentration of analyte.
5. Prepare a graph of the DLAP data as shown in Figure 2 for inclusion in the method.
2 Arkin, H.; Colton, R. C. Statistical Methods, 5th ed.; Barnes & Noble: New York, 1970; pp 84-88.
T-0012-02-0510-M7 of 39
6. The detection limit of the overall procedure (DLOP) and the reliable quantitation limit (RQL),described in Sections IV.A and IV.B, can be determined simultaneously with this test. DLOP andRQL is determined in a similar test in which soluble standards are spiked on the sampling medium.
Alternatively, if YBR is measurable, use the data from the analyses of 10 reagent blank samples tocalculate YBR and SBR. Use Equation 1 to determine YDL.
B. Instrument calibration
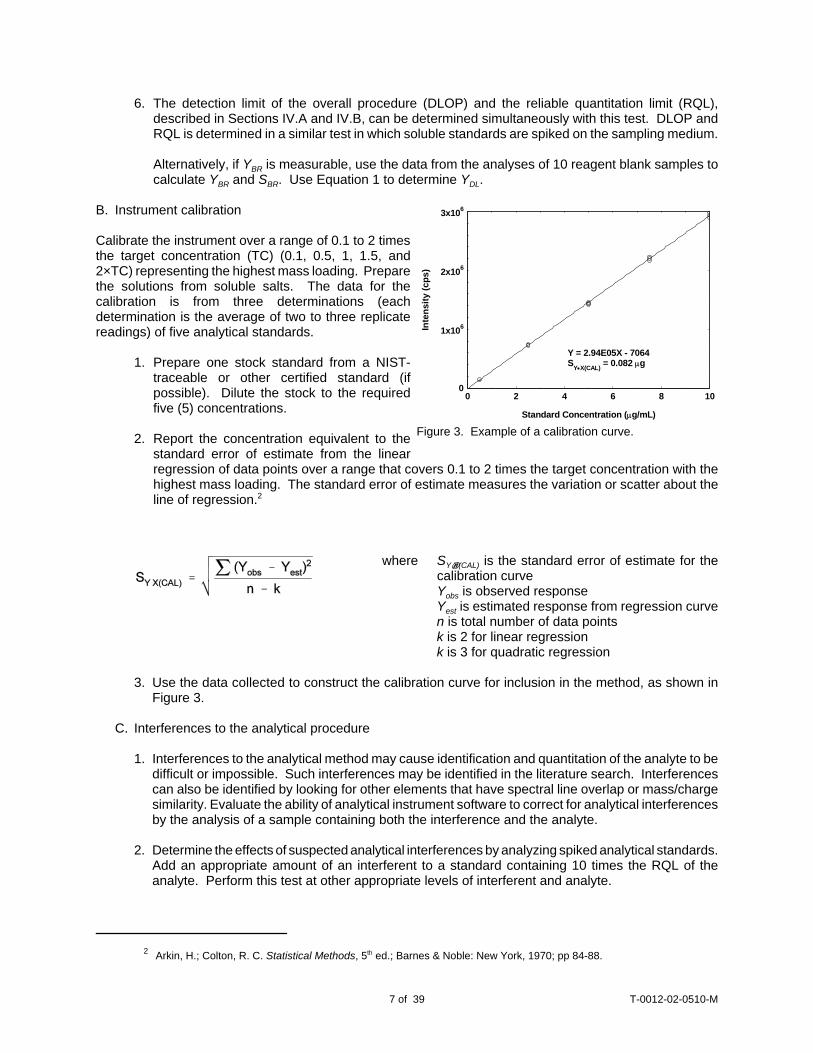
Calibrate the instrument over a range of 0.1 to 2 timesthe target concentration (TC) (0.1, 0.5, 1, 1.5, and2×TC) representing the highest mass loading. Preparethe solutions from soluble salts. The data for thecalibration is from three determinations (eachdetermination is the average of two to three replicatereadings) of five analytical standards.
1. Prepare one stock standard from a NIST-traceable or other certified standard (ifpossible). Dilute the stock to the requiredfive (5) concentrations.
2. Report the concentration equivalent to thestandard error of estimate from the linearregression of data points over a range that covers 0.1 to 2 times the target concentration with thehighest mass loading. The standard error of estimate measures the variation or scatter about theline of regression.2
where SY@X(CAL) is the standard error of estimate for thecalibration curveYobs is observed responseYest is estimated response from regression curven is total number of data pointsk is 2 for linear regressionk is 3 for quadratic regression
3. Use the data collected to construct the calibration curve for inclusion in the method, as shown inFigure 3.
C. Interferences to the analytical procedure
1. Interferences to the analytical method may cause identification and quantitation of the analyte to bedifficult or impossible. Such interferences may be identified in the literature search. Interferencescan also be identified by looking for other elements that have spectral line overlap or mass/chargesimilarity. Evaluate the ability of analytical instrument software to correct for analytical interferencesby the analysis of a sample containing both the interference and the analyte.
2. Determine the effects of suspected analytical interferences by analyzing spiked analytical standards.Add an appropriate amount of an interferent to a standard containing 10 times the RQL of theanalyte. Perform this test at other appropriate levels of interferent and analyte.
0
1x10⁶
2x10⁶
3x10⁶
0 2 4 6 8 10
Y = 2.94E05X - 7064SY•X(CAL) = 0.082 µg
Standard Concentration (µg/mL)In
tens
ity (c
ps)
Figure 3. Example of a calibration curve.
3 Evaluation Guidelines for Surface Sampling Methods,http://www.osha.gov/dts/sltc/methods/surfacesampling/t-006-01-0104-m.html (accessed 9/2005).
4 Evaluation Guidelines for Air Sampling Methods Utilizing Chromatographic Analysis,http://www.osha.gov/dts/sltc/methods/chromguide/index.html (accessed 9/2005).
T-0012-02-0510-M8 of 39
3. If a reagent has been added to the sampling media, generate a spectral line chart (for inclusion inthe method) of a sample at the target concentration showing the extra reagent’s relationship to theanalyte.
4. The presence of the analyte or of analytical interferences in blank samples is to be avoided ifpossible. Blank corrections are performed as appropriate.
5. The possibility exists that interferences may also be present in reference standards. Obtaincertificates of analysis whenever possible.
D. Qualitative analysis
Analysis with alternative instruments or spectral lines may be useful in confirming the identity or purityof the analyte. Present a mass spectrum of the analyte if possible. Include this information in themethod.
III. Sampling Procedure
These guidelines address the evaluation of samplers containing filters. There are different filter holdersavailable such as IOM, Button Sampler, and 37-mm polystyrene cassette. Cyclones may be used tocollect respirable particles and to exclude larger particles. Each sampler has different samplingcharacteristics and guidance for selection of the appropriate sampler to address the particle size issueunder study might be found during the literature search. If no specific filter holder is identified, a 37-mmclosed-face polystyrene cassette shall be used. These evaluation guidelines might require slightmodification for adequate evaluation of more unique samplers such as those utilizing reactive reagents,or those containing both adsorbent and filter components. Modification may also be required for theevaluation of bubbler sampling procedures. Consider bubblers only as a sampling technique of last resort.
Surface (wipe) sampling methods are validated using Evaluation Guidelines for Surface SamplingMethods3.
If it is determined that a diffusive sampler can be used to collect the analyte, specific requirements thatapply to the evaluation of diffusive samplers are found in Evaluation Guidelines for Air Sampling MethodsUtilizing Chromatographic Analysis4.
The use of controlled test atmospheres is the preferred technique to test candidate sampling methods.Preparation and generation of such atmospheres may not be possible due to safety or other reasons. Ifthis is the case, then retention efficiency experiments provide a way to partially test sampler capacity.
A. Sampler capacity
1. For those substances that have a peak, ceiling, or short-term exposure limit, determine thelimitations of taking a short-term sample (applicable time from Table Z-2 or expanded healthstandards of 29 CFR 1910) at the selected sampling rate. If a short-term sample collected at therecommended sampling rate does not result in a mass of analyte equal to or greater than 10 timesthe RQL, study the use of a higher flow rate through additional capacity or retention efficiencystudies. For ceiling exposure limits listed in Table Z-1, determine if 15 minutes is practical as therecommended sampling time.
T-0012-02-0510-M9 of 39
0
2
4
6
8
10
0 500 1000 1500
Air Volume (L)B
reak
thro
ugh
(%)
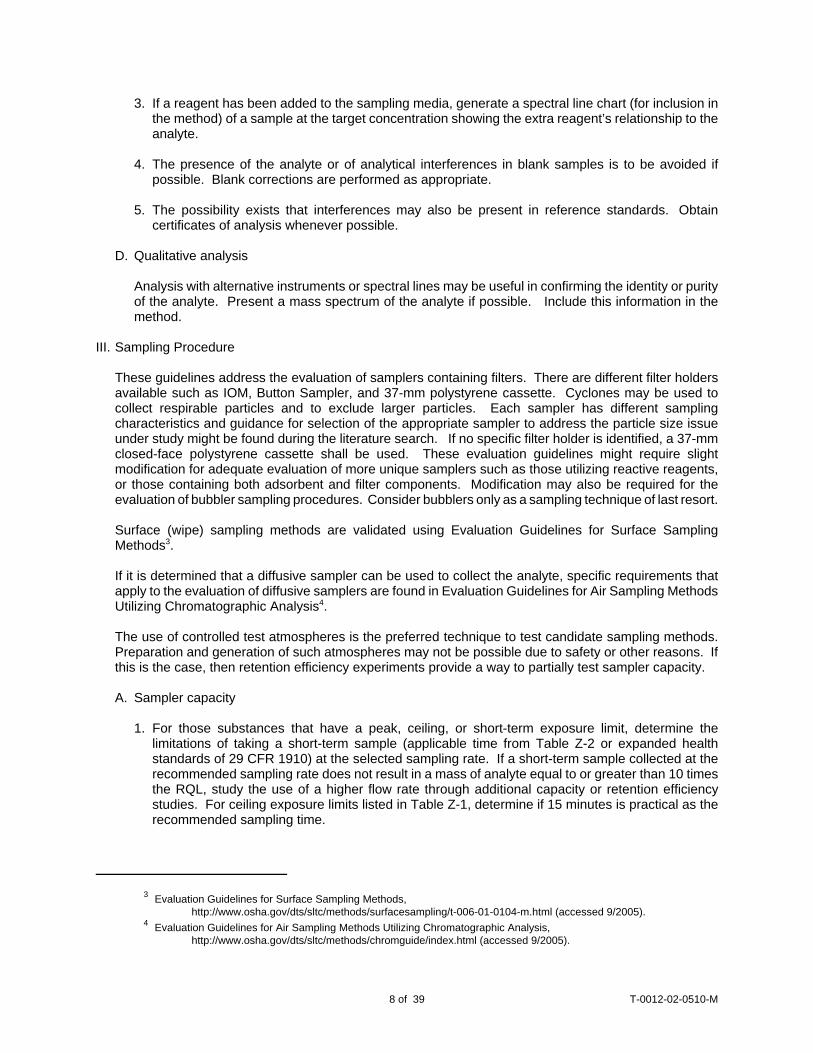
Figure 4. Example of sampler capacity test results.
2. Select a sampling rate that is suitable for the sampler. The goal is to have an 8-hour recommendedsampling time for TWA samples.
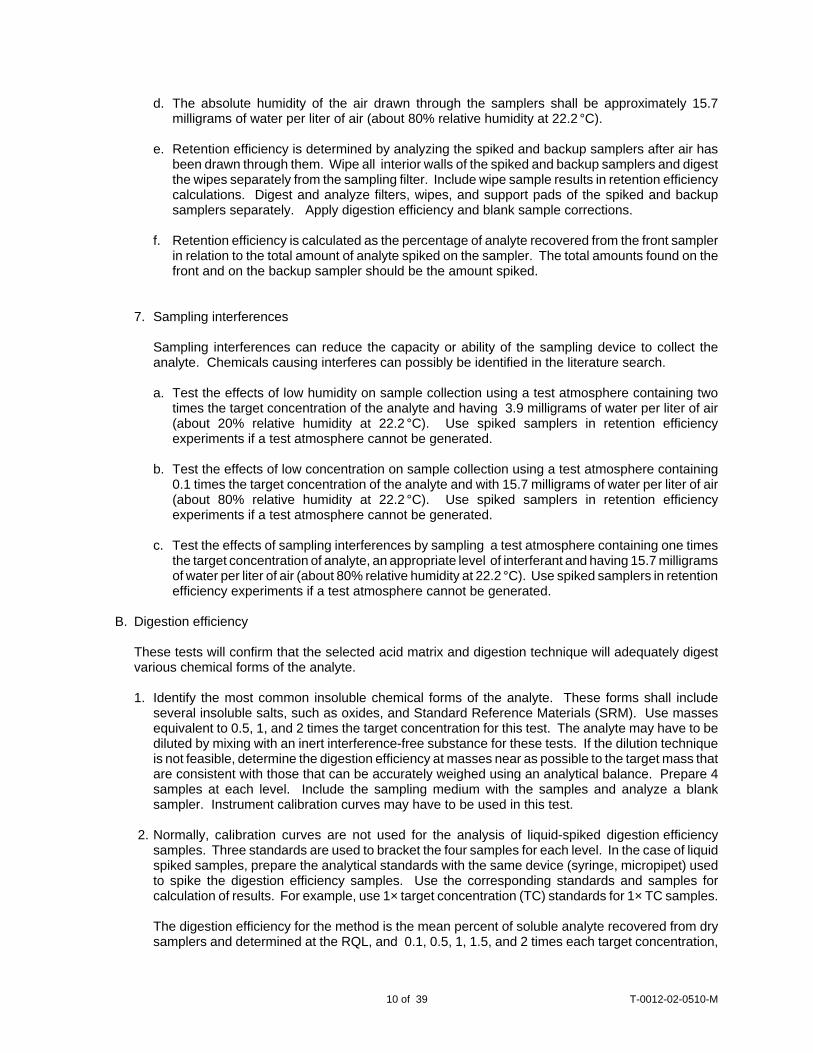
3. Sampler capacity is defined by the length of time a sampler can be used under a set of known testconditions without significant loss of analyte. It can also be described as a corresponding air volumeor as mass collected at a specified sampling rate and at a known analyte concentration. Anexample of a sampler capacity test is shown in Figure 4.
4. If an atmosphere can be generated, sampleat ambient temperature from a testatmosphere containing an analyteconcentration equal to 2 times the targetconcentration. True concentration of testatmospheres could be the theoreticalconcentration or experimental concentrationas determined by some method completelyindependent of the test sampling method.Use an absolute humidity for the testatmosphere of 15.7 milligrams of water perliter of air (about 80% relative humidity at22.2 °C). All test atmospheres generatedthroughout these guidelines must be non-condensing.
5. The analytical procedure should includewiping the inside surfaces of the sampling device (such as the interior walls of a filter cassette) aspart of routine analysis. The wipe shall be analyzed separate from the sample filter for methodsdevelopment tests. The wipe sample can be digested along with the sample filter during routineanalysis.
6. Retention efficiency
Retention efficiency tests are useful when it is not possible to perform breakthrough tests withcontrolled test atmospheres. They will provide partial support of sampler capacity by showing thatanalyte present on the sampler is retained when the recommended sampling conditions are used.If possible, select volatile and water-soluble salts of the analyte and perform this test with each salt.
Retention efficiency is the percentage of analyte retained on a spiked sampler after a volume ofappropriately conditioned air is drawn through it.
a. Spike three samplers with an amount of analyte equivalent to two times the target concentrationbased on a tentative recommended air volume. Allow the spiked samplers to equilibrate for asufficient time for the solvent to evaporate. Place a blank sampler immediately downstream ofeach spiked sampler to collect any analyte that is stripped from the front sampler.
b. Spike three filters as in Step ‘a’ and place them in separate sealed cassettes, with backup pads,for the maximum sampling time with no air pulled through them. These filters will be used ascontrols to determine if contamination of the support pad occurs before air is pulled through thecassette.
c. Select a recommended sampling time that is suitable for the samplers and draw air through thesamplers prepared in Step ‘a’ for 1.25 times the maximum sampling time. The maximumsampling time recommended in the completed method is not to exceed 8 h. Perform furtherretention efficiency tests as necessary to support the sampling time and maximum air volumerecommenced in the completed method.
T-0012-02-0510-M10 of 39
d. The absolute humidity of the air drawn through the samplers shall be approximately 15.7milligrams of water per liter of air (about 80% relative humidity at 22.2 °C).
e. Retention efficiency is determined by analyzing the spiked and backup samplers after air hasbeen drawn through them. Wipe all interior walls of the spiked and backup samplers and digestthe wipes separately from the sampling filter. Include wipe sample results in retention efficiencycalculations. Digest and analyze filters, wipes, and support pads of the spiked and backupsamplers separately. Apply digestion efficiency and blank sample corrections.
f. Retention efficiency is calculated as the percentage of analyte recovered from the front sampler
in relation to the total amount of analyte spiked on the sampler. The total amounts found on thefront and on the backup sampler should be the amount spiked.
7. Sampling interferences
Sampling interferences can reduce the capacity or ability of the sampling device to collect theanalyte. Chemicals causing interferes can possibly be identified in the literature search.
a. Test the effects of low humidity on sample collection using a test atmosphere containing twotimes the target concentration of the analyte and having 3.9 milligrams of water per liter of air(about 20% relative humidity at 22.2 °C). Use spiked samplers in retention efficiencyexperiments if a test atmosphere cannot be generated.
b. Test the effects of low concentration on sample collection using a test atmosphere containing0.1 times the target concentration of the analyte and with 15.7 milligrams of water per liter of air(about 80% relative humidity at 22.2 °C). Use spiked samplers in retention efficiencyexperiments if a test atmosphere cannot be generated.
c. Test the effects of sampling interferences by sampling a test atmosphere containing one timesthe target concentration of analyte, an appropriate level of interferant and having 15.7 milligramsof water per liter of air (about 80% relative humidity at 22.2 °C). Use spiked samplers in retentionefficiency experiments if a test atmosphere cannot be generated.
B. Digestion efficiency
These tests will confirm that the selected acid matrix and digestion technique will adequately digestvarious chemical forms of the analyte.
1. Identify the most common insoluble chemical forms of the analyte. These forms shall includeseveral insoluble salts, such as oxides, and Standard Reference Materials (SRM). Use massesequivalent to 0.5, 1, and 2 times the target concentration for this test. The analyte may have to bediluted by mixing with an inert interference-free substance for these tests. If the dilution techniqueis not feasible, determine the digestion efficiency at masses near as possible to the target mass thatare consistent with those that can be accurately weighed using an analytical balance. Prepare 4samples at each level. Include the sampling medium with the samples and analyze a blanksampler. Instrument calibration curves may have to be used in this test.
2. Normally, calibration curves are not used for the analysis of liquid-spiked digestion efficiencysamples. Three standards are used to bracket the four samples for each level. In the case of liquidspiked samples, prepare the analytical standards with the same device (syringe, micropipet) usedto spike the digestion efficiency samples. Use the corresponding standards and samples forcalculation of results. For example, use 1× target concentration (TC) standards for 1× TC samples.
The digestion efficiency for the method is the mean percent of soluble analyte recovered from drysamplers and determined at the RQL, and 0.1, 0.5, 1, 1.5, and 2 times each target concentration,
T-0012-02-0510-M11 of 39
based on the recommended air volume. {If there are several target concentrations, select the targetconcentration and recommended sampling time combination which will produce the highest massloading on the sampler.} Prepare 4 samples at each level by spiking the sampling medium withsoluble salts. Store the spiked samples at room temperature overnight unless a shorter time periodcan be justified. A dry sampler is one that is used as received from the manufacturer. The averageof all four determinations will be the digestion efficiency for the analytical procedure providing theresults are similar. If digestion efficiency does not remain constant at lower sample loadingsattempts should be made to produce a digestion method that will provide constant digestionefficiency. If these attempts are not successful, a plot of digestion efficiency versus concentrationshall be constructed and included in the method. Test the stability of digested samples byreanalyzing the 1 times the target concentration samples after 1and 7 days of ambient storage. Theoriginal analysis is “day 0". Use fresh standards and recalibrate the instrument for each analysis.
3. Perform a test of the digestion efficiency with wet samplers. Pull an air volume equivalent to therecommended sampling time through four samplers using a contaminant-free atmospherecontaining an absolute humidity of 15.7 milligrams of water per liter of air (about 80% relativehumidity at 22.2 °C). Spike the wet samplers at one times the target concentration with a solublesalt. {If there are several target concentrations, select the target concentration and recommendedsampling time combination which will produce the highest mass loading on the sampler.} If thereis a significant difference in the mean of the wet sampler’s digestion recovery from the mean drysampler’s digestion recovery, repeat the test. A significant difference is when the mean of the wetsamplers is more than two standard deviations from the mean of the dry sampler at the same massloading. If the difference persists, change the sampler digestion scheme to minimize the difference.
4. Determine the digestion efficiency of support pads at 10 times the RQL (or 0.1× target concentration(TC), whichever is less) and at 1 times the target concentration. Spike 4 samples at each level.Allow these samples to stand overnight after spiking. A minimum digestion efficiency of 75% isrequired for this test.
5. Select a medium and a technique (wet or dry) to be used to wipe interior cassette walls. Spike theinterior walls of 4 cassettes with 10 times the RQL (or 0.1×TC, whichever is less) and 4 separatecassettes with 1.0 times the target concentration of the analyte to determine the efficiency at whichthe analyte is removed by wiping. Allow these cassettes to stand overnight after spiking and thenuse the selected technique to perform the test. Determine the digestion efficiency of the wipemedium by spiking the medium separately and allowing them to stand overnight. Spike 4 samplesat each level. A minimum recovery of 75% is required for this test.
6. Calculate the digestion efficiency as follows:
where DE is digestion efficiencyMR is mass recoveredMS is mass spiked
7. An average digestion efficiency of 75% is acceptable, but an average greater than 90% is preferredfor all insoluble and soluble salts.
C. Effects of storage
Volatile salts, if identified, shall be used for storage tests.
A refrigerated-temperature storage stability test will not be performed unless the ambient temperaturetest gives unacceptable results.
1. Collect eighteen samples from a controlled test atmosphere containing the analyte at the targetconcentration. If the analyte has a ceiling, peak or STEL, generate another set of storage stabilitysamples if the mass of analyte for the short-term sample is less than 10% of the mass collected for
T-0012-02-0510-M12 of 39
0
40
80
120
0 5 10 15
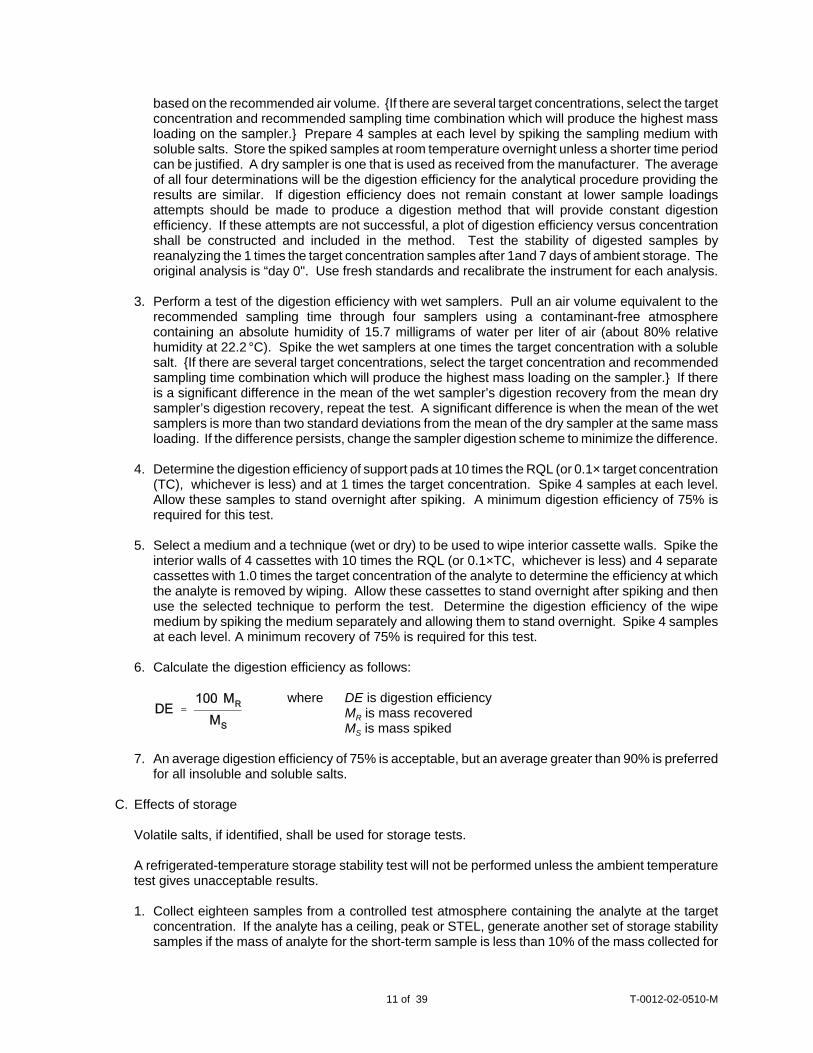
Ambient StorageY = 0.116X + 99.4Std Error of Estimate = 5.3095% Confidence Limits = ±(1.96)(5.30) = ±10.4
Storage time (days)
Rec
over
y (%
)
Figure 5. Example of a storage test.
0
2000
4000
6000
0 5 10
RQL
DLOP
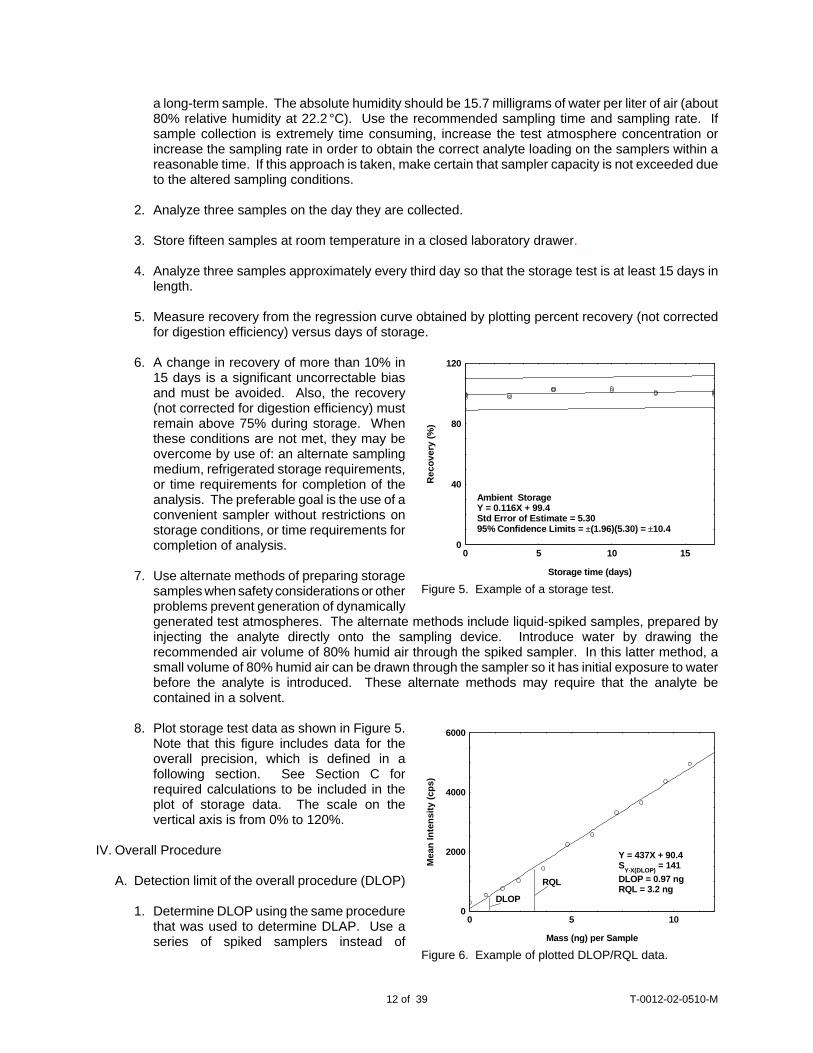
Y = 437X + 90.4SY·X(DLOP) = 141DLOP = 0.97 ngRQL = 3.2 ng
Mass (ng) per Sample
Mea
n In
tens
ity (c
ps)
Figure 6. Example of plotted DLOP/RQL data.
a long-term sample. The absolute humidity should be 15.7 milligrams of water per liter of air (about80% relative humidity at 22.2 °C). Use the recommended sampling time and sampling rate. Ifsample collection is extremely time consuming, increase the test atmosphere concentration orincrease the sampling rate in order to obtain the correct analyte loading on the samplers within areasonable time. If this approach is taken, make certain that sampler capacity is not exceeded dueto the altered sampling conditions.
2. Analyze three samples on the day they are collected.
3. Store fifteen samples at room temperature in a closed laboratory drawer.
4. Analyze three samples approximately every third day so that the storage test is at least 15 days inlength.
5. Measure recovery from the regression curve obtained by plotting percent recovery (not correctedfor digestion efficiency) versus days of storage.
6. A change in recovery of more than 10% in15 days is a significant uncorrectable biasand must be avoided. Also, the recovery(not corrected for digestion efficiency) mustremain above 75% during storage. Whenthese conditions are not met, they may beovercome by use of: an alternate samplingmedium, refrigerated storage requirements,or time requirements for completion of theanalysis. The preferable goal is the use of aconvenient sampler without restrictions onstorage conditions, or time requirements forcompletion of analysis.
7. Use alternate methods of preparing storagesamples when safety considerations or otherproblems prevent generation of dynamicallygenerated test atmospheres. The alternate methods include liquid-spiked samples, prepared byinjecting the analyte directly onto the sampling device. Introduce water by drawing therecommended air volume of 80% humid air through the spiked sampler. In this latter method, asmall volume of 80% humid air can be drawn through the sampler so it has initial exposure to waterbefore the analyte is introduced. These alternate methods may require that the analyte becontained in a solvent.
8. Plot storage test data as shown in Figure 5.Note that this figure includes data for theoverall precision, which is defined in afollowing section. See Section C forrequired calculations to be included in theplot of storage data. The scale on thevertical axis is from 0% to 120%.
IV. Overall Procedure
A. Detection limit of the overall procedure (DLOP)
1. Determine DLOP using the same procedurethat was used to determine DLAP. Use aseries of spiked samplers instead of
5 Snedcor, G.W.; Cochran, W.G. Statistical Methods, 6th ed.; Iowa State University: Ames, Iowa, 1967, p 467.6 Arkin, H.; Colton, R.R. Statistical Methods, 5th ed.; Barnes and Noble: New York, 1970, p 85.
T-0012-02-0510-M13 of 39
65
75
85
95
0 5 10 15 20 25 30 35
RQL
Concentration (µg/mL)
Rec
over
y (%
)
Figure 7. Example of a calculated RQL when recoveryis the determining factor (Y = 0.808X + 65.1).
analytical standards for Equation 2 (Section II.A). Use a soluble salt. Analyze a blank sampler butdo not subtract blank results from spiked sampler results. Include a blank cassette wipe medium(Section A.5.) to determine if it affects results.
2. Report the DLOP as mass per sample and as an equivalent air concentration based on therecommended sample air volume.
3. Prepare a plot of the DLOP data for inclusion in the method as shown in Figure 6.
B. Reliable quantitation limit (RQL)
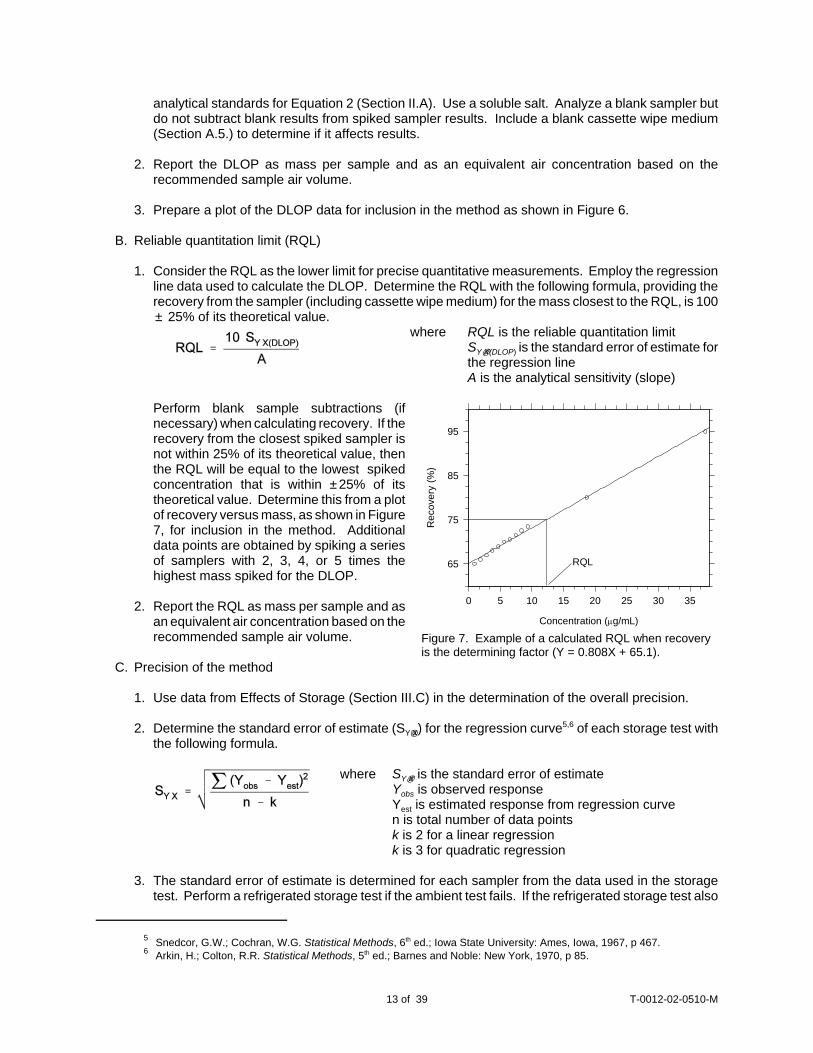
1. Consider the RQL as the lower limit for precise quantitative measurements. Employ the regressionline data used to calculate the DLOP. Determine the RQL with the following formula, providing therecovery from the sampler (including cassette wipe medium) for the mass closest to the RQL, is 100± 25% of its theoretical value.
where RQL is the reliable quantitation limitSY@X(DLOP) is the standard error of estimate forthe regression lineA is the analytical sensitivity (slope)
Perform blank sample subtractions (ifnecessary) when calculating recovery. If therecovery from the closest spiked sampler isnot within 25% of its theoretical value, thenthe RQL will be equal to the lowest spikedconcentration that is within ± 25% of itstheoretical value. Determine this from a plotof recovery versus mass, as shown in Figure7, for inclusion in the method. Additionaldata points are obtained by spiking a seriesof samplers with 2, 3, 4, or 5 times thehighest mass spiked for the DLOP.
2. Report the RQL as mass per sample and asan equivalent air concentration based on therecommended sample air volume.
C. Precision of the method
1. Use data from Effects of Storage (Section III.C) in the determination of the overall precision.
2. Determine the standard error of estimate (SY@X) for the regression curve5,6 of each storage test withthe following formula.
where SY@X is the standard error of estimateYobs is observed responseYest is estimated response from regression curven is total number of data pointsk is 2 for a linear regressionk is 3 for quadratic regression
3. The standard error of estimate is determined for each sampler from the data used in the storagetest. Perform a refrigerated storage test if the ambient test fails. If the refrigerated storage test also
T-0012-02-0510-M14 of 39
fails, restrictions must be set on the maximum storage time that will be allowed before samples mustbe analyzed.
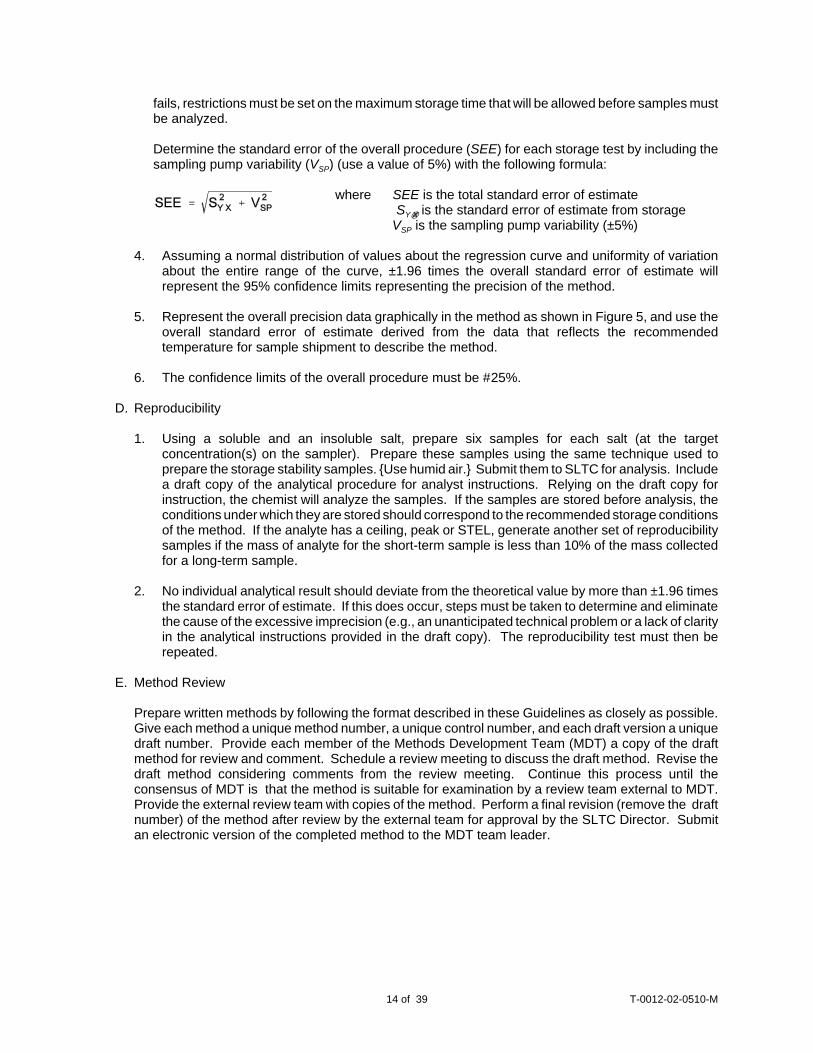
Determine the standard error of the overall procedure (SEE) for each storage test by including thesampling pump variability (VSP) (use a value of 5%) with the following formula:
where SEE is the total standard error of estimate SY@X is the standard error of estimate from storage
VSP is the sampling pump variability (±5%)
4. Assuming a normal distribution of values about the regression curve and uniformity of variationabout the entire range of the curve, ±1.96 times the overall standard error of estimate willrepresent the 95% confidence limits representing the precision of the method.
5. Represent the overall precision data graphically in the method as shown in Figure 5, and use theoverall standard error of estimate derived from the data that reflects the recommendedtemperature for sample shipment to describe the method.
6. The confidence limits of the overall procedure must be #25%.
D. Reproducibility
1. Using a soluble and an insoluble salt, prepare six samples for each salt (at the targetconcentration(s) on the sampler). Prepare these samples using the same technique used toprepare the storage stability samples. {Use humid air.} Submit them to SLTC for analysis. Includea draft copy of the analytical procedure for analyst instructions. Relying on the draft copy forinstruction, the chemist will analyze the samples. If the samples are stored before analysis, theconditions under which they are stored should correspond to the recommended storage conditionsof the method. If the analyte has a ceiling, peak or STEL, generate another set of reproducibilitysamples if the mass of analyte for the short-term sample is less than 10% of the mass collectedfor a long-term sample.
2. No individual analytical result should deviate from the theoretical value by more than ±1.96 timesthe standard error of estimate. If this does occur, steps must be taken to determine and eliminatethe cause of the excessive imprecision (e.g., an unanticipated technical problem or a lack of clarityin the analytical instructions provided in the draft copy). The reproducibility test must then berepeated.
E. Method Review
Prepare written methods by following the format described in these Guidelines as closely as possible.Give each method a unique method number, a unique control number, and each draft version a uniquedraft number. Provide each member of the Methods Development Team (MDT) a copy of the draftmethod for review and comment. Schedule a review meeting to discuss the draft method. Revise thedraft method considering comments from the review meeting. Continue this process until theconsensus of MDT is that the method is suitable for examination by a review team external to MDT.Provide the external review team with copies of the method. Perform a final revision (remove the draftnumber) of the method after review by the external team for approval by the SLTC Director. Submitan electronic version of the completed method to the MDT team leader.
T-0012-02-0510-M15 of 39
PREPARATION OF WRITTEN REPORTS
Prepare each type of report in accordance with the following respective formats:
Written reports fall into three basic categories:
I. Validated Methods - Sampling and analytical methodology that has been thoroughly evaluated accordingto the evaluation guidelines.
II. Partially Validated Methods - Sampling and analytical procedures for which an in-depth evaluation has notbeen performed. The evaluation of these methods is often performed rapidly in order to meet theimmediate need of field personnel when established methodology does not exist.
III. Studies - Investigations that involve a class or group of analytes, or an aspect of methodology that maybe common to many methods in general. Unsuccessful evaluations will be reported as studies.
I. Fully Validated Methods
The following format provides a means of reporting data obtained during evaluation of spectroscopicsampling and analytical methods. The cover page is intended as a quick reference that provides basicinformation. The backup data section contains tabulated and graphical laboratory data that are referencedthroughout the report. This outline was prepared from the perspective of filter sample collection andICP/MS (or ICP/OES) analysis.
Each fully validated method shall have a unique control number, for example: T-1xxx-FV-01-0501-M. SeeSLTC SOP “The Preparation of SOPs” (number A-001) for an explanation of the control number format.Place the control number immediately following the method number on the cover page and again in thelower right margin of each page as shown in these guidelines.
All fully validated methods completed by the Methods Development Team shall have the followingstatement on the cover page:
"Validated method. This method has been subjected to the established evaluation procedures of theMethods Development Team."
Page Numbering - Page number shall be at the bottom center, for example, 1 of XX. Use 8-point Arial.
Comments and instructions in these guidelines are for use by the author and are set off with braces "{ }",and shall not be not included in the final method.
Text shall be10 point Arial font with full justification with no hyphenation
Tabs shall be: method cover page: 2.0; main body of method: 0.2, 0.59, 1.12, 1.36
DOL logo shall be placed on the cover page - size = 0.500", attach to paragraph, 0" horizontal, 0" from top,right margin, wrap behind text
The following disclaimer shall be in 10-point Arial font and be placed immediately following Section 1:
{example} 1. General Discussion
“For assistance with accessibility problems in using figures and illustrations presented in this document,please contact OSHA Salt Lake Technical Center at (801) 233-4900. These Guidelines were developedfor internal use by OSHA personnel. Mention of any company name or commercial product does notconstitute endorsement by OSHA.”
T-0012-02-0510-M16 of 39
Table caption shall be 9-point Arial, 0.02" for left inside margin, right inside margin, top row margin, bottomrow margin. Numbers shall be aligned on the decimal point.
Graphs shall be size = 3.1", attached to paragraph, 0" horizontal, 0" from top, right margin, wrap left,caption is 9-point Arial
Table boxes shall be size = 3.1", attached to paragraph, 0" horizontal, 0" from top, left margin if next to agraph, wrap left or neither, 9-point Arial
References shall follow as closely as possible the format recommended by the American Chemical Societyin their 1997 edition of "The ACS Style Guide - A Manual for Authors and Editors." If a reference isrepeated, do not give it a new number.
T-0012-02-0510-M17 of 39
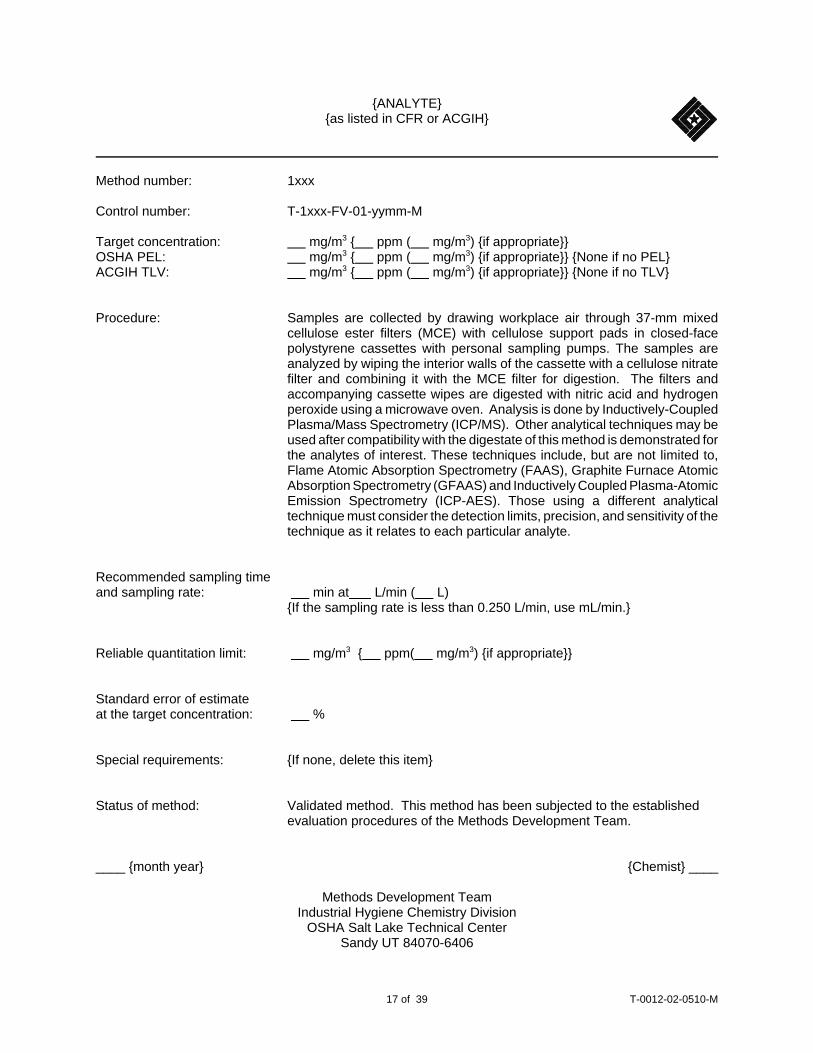
{ANALYTE}{as listed in CFR or ACGIH}
Method number: 1xxx
Control number: T-1xxx-FV-01-yymm-M
Target concentration: mg/m3 { ppm ( mg/m3) {if appropriate}} OSHA PEL: mg/m3 { ppm ( mg/m3) {if appropriate}} {None if no PEL}ACGIH TLV: mg/m3 { ppm ( mg/m3) {if appropriate}} {None if no TLV}
Procedure: Samples are collected by drawing workplace air through 37-mm mixedcellulose ester filters (MCE) with cellulose support pads in closed-facepolystyrene cassettes with personal sampling pumps. The samples areanalyzed by wiping the interior walls of the cassette with a cellulose nitratefilter and combining it with the MCE filter for digestion. The filters andaccompanying cassette wipes are digested with nitric acid and hydrogenperoxide using a microwave oven. Analysis is done by Inductively-CoupledPlasma/Mass Spectrometry (ICP/MS). Other analytical techniques may beused after compatibility with the digestate of this method is demonstrated forthe analytes of interest. These techniques include, but are not limited to,Flame Atomic Absorption Spectrometry (FAAS), Graphite Furnace AtomicAbsorption Spectrometry (GFAAS) and Inductively Coupled Plasma-AtomicEmission Spectrometry (ICP-AES). Those using a different analyticaltechnique must consider the detection limits, precision, and sensitivity of thetechnique as it relates to each particular analyte.
Recommended sampling timeand sampling rate: min at L/min ( L)
{If the sampling rate is less than 0.250 L/min, use mL/min.}
Reliable quantitation limit: mg/m3 { ppm( mg/m3) {if appropriate}}
Standard error of estimate at the target concentration: %
Special requirements: {If none, delete this item}
Status of method: Validated method. This method has been subjected to the establishedevaluation procedures of the Methods Development Team.
____ {month year} {Chemist} ____
Methods Development TeamIndustrial Hygiene Chemistry Division
OSHA Salt Lake Technical CenterSandy UT 84070-6406
7 This reference was used for most of the physical properties.8 Evaluation Guidelines for Air Sampling Methods Utilizing Chromatographic Analysis,
http://www.osha.gov/dts/sltc/methods/chromguide/index.html (accessed 9/2005).
T-0012-02-0510-M18 of 39
1. General Discussion
{include the following disclaimer}For assistance with accessibility problems in using figures and illustrations presented in this method, pleasecontact OSHA Salt Lake Technical Center at (801) 233-4900. This procedure was designed and tested forinternal use by OSHA personnel. Mention of any company name or commercial product does not constituteendorsement by OSHA.
{The backup data section will be referenced throughout the method in the following manner: "(Section4.____)". Literature citations will be footnotes. If a reference is repeated, do not give it a new number}
1.1 Background
1.1.1 History
{Explain why past methodology is inadequate, and how the new procedure is superior.Also, obvious questions that may be raised by knowledgeable readers should beaddressed. Keep length to 1.5 pages or less.}
1.1.2 Toxic effects (This section is for information only and should not be taken as the basis ofOSHA policy.)
{Cite sources for presented information. If both animal data and human data arepresented, present the animal data first. If the entire section is taken from one reference,the reference notation can be placed behind the qualifying statement in the heading.}
1.1.3 Workplace exposure
{Report major sources of exposure in the workplace and, if available, the size of the workpopulation that is exposed. If the entire section is taken from one reference, the referencenotation can be placed behind the heading.}
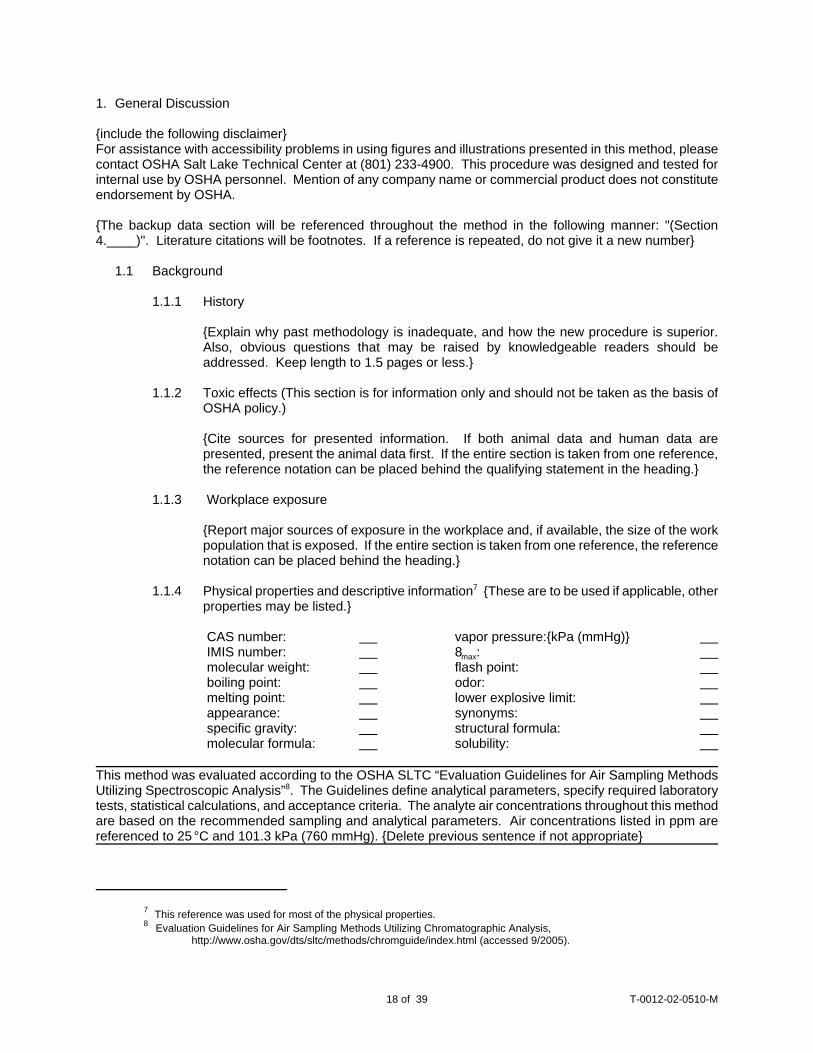
1.1.4 Physical properties and descriptive information7 {These are to be used if applicable, otherproperties may be listed.}
CAS number: vapor pressure:{kPa (mmHg)} IMIS number: 8max: molecular weight: flash point: boiling point: odor: melting point: lower explosive limit: appearance: synonyms: specific gravity: structural formula: molecular formula: solubility:
This method was evaluated according to the OSHA SLTC “Evaluation Guidelines for Air Sampling MethodsUtilizing Spectroscopic Analysis”8. The Guidelines define analytical parameters, specify required laboratorytests, statistical calculations, and acceptance criteria. The analyte air concentrations throughout this methodare based on the recommended sampling and analytical parameters. Air concentrations listed in ppm arereferenced to 25 °C and 101.3 kPa (760 mmHg). {Delete previous sentence if not appropriate}
T-0012-02-0510-M19 of 39
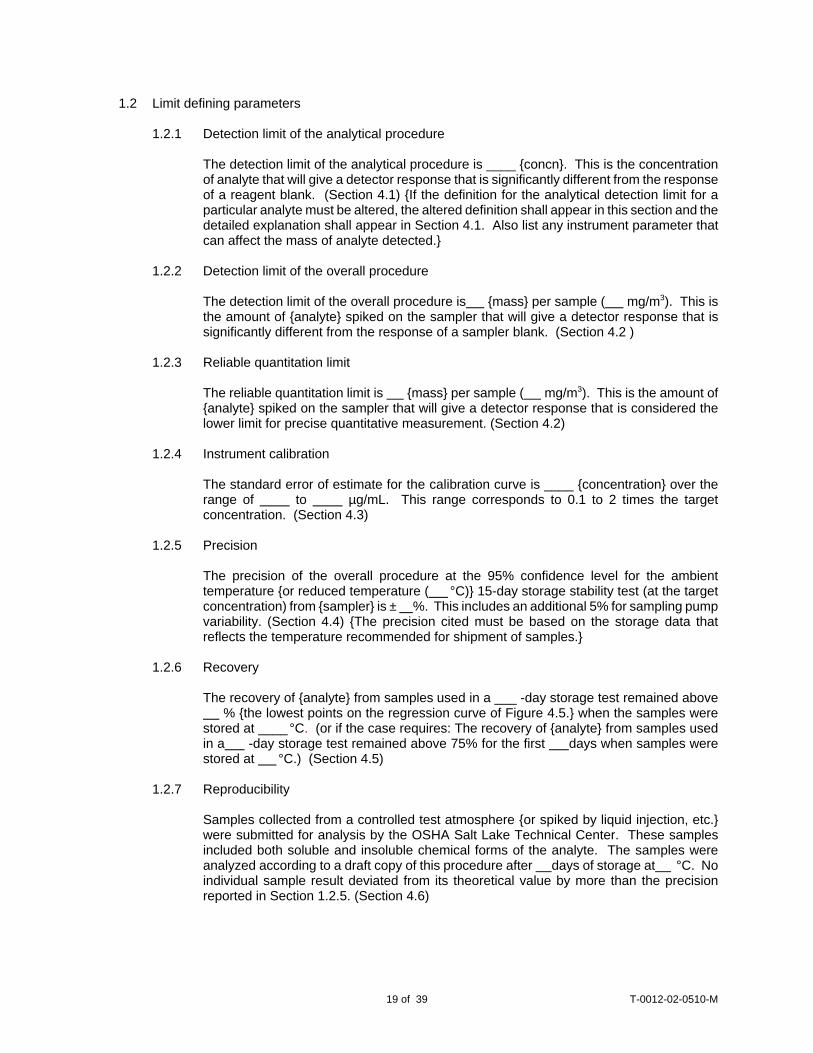
1.2 Limit defining parameters
1.2.1 Detection limit of the analytical procedure
The detection limit of the analytical procedure is ____ {concn}. This is the concentrationof analyte that will give a detector response that is significantly different from the responseof a reagent blank. (Section 4.1) {If the definition for the analytical detection limit for aparticular analyte must be altered, the altered definition shall appear in this section and thedetailed explanation shall appear in Section 4.1. Also list any instrument parameter thatcan affect the mass of analyte detected.}
1.2.2 Detection limit of the overall procedure
The detection limit of the overall procedure is {mass} per sample ( mg/m3). This isthe amount of {analyte} spiked on the sampler that will give a detector response that issignificantly different from the response of a sampler blank. (Section 4.2 )
1.2.3 Reliable quantitation limit
The reliable quantitation limit is {mass} per sample ( mg/m3). This is the amount of{analyte} spiked on the sampler that will give a detector response that is considered thelower limit for precise quantitative measurement. (Section 4.2)
1.2.4 Instrument calibration
The standard error of estimate for the calibration curve is ____ {concentration} over therange of to µg/mL. This range corresponds to 0.1 to 2 times the targetconcentration. (Section 4.3)
1.2.5 Precision
The precision of the overall procedure at the 95% confidence level for the ambienttemperature {or reduced temperature ( °C)} 15-day storage stability test (at the targetconcentration) from {sampler} is ± %. This includes an additional 5% for sampling pumpvariability. (Section 4.4) {The precision cited must be based on the storage data thatreflects the temperature recommended for shipment of samples.}
1.2.6 Recovery
The recovery of {analyte} from samples used in a ___ -day storage test remained above % {the lowest points on the regression curve of Figure 4.5.} when the samples werestored at ____ °C. (or if the case requires: The recovery of {analyte} from samples usedin a -day storage test remained above 75% for the first days when samples werestored at °C.) (Section 4.5)
1.2.7 Reproducibility
Samples collected from a controlled test atmosphere {or spiked by liquid injection, etc.}were submitted for analysis by the OSHA Salt Lake Technical Center. These samplesincluded both soluble and insoluble chemical forms of the analyte. The samples wereanalyzed according to a draft copy of this procedure after days of storage at °C. Noindividual sample result deviated from its theoretical value by more than the precisionreported in Section 1.2.5. (Section 4.6)
T-0012-02-0510-M20 of 39
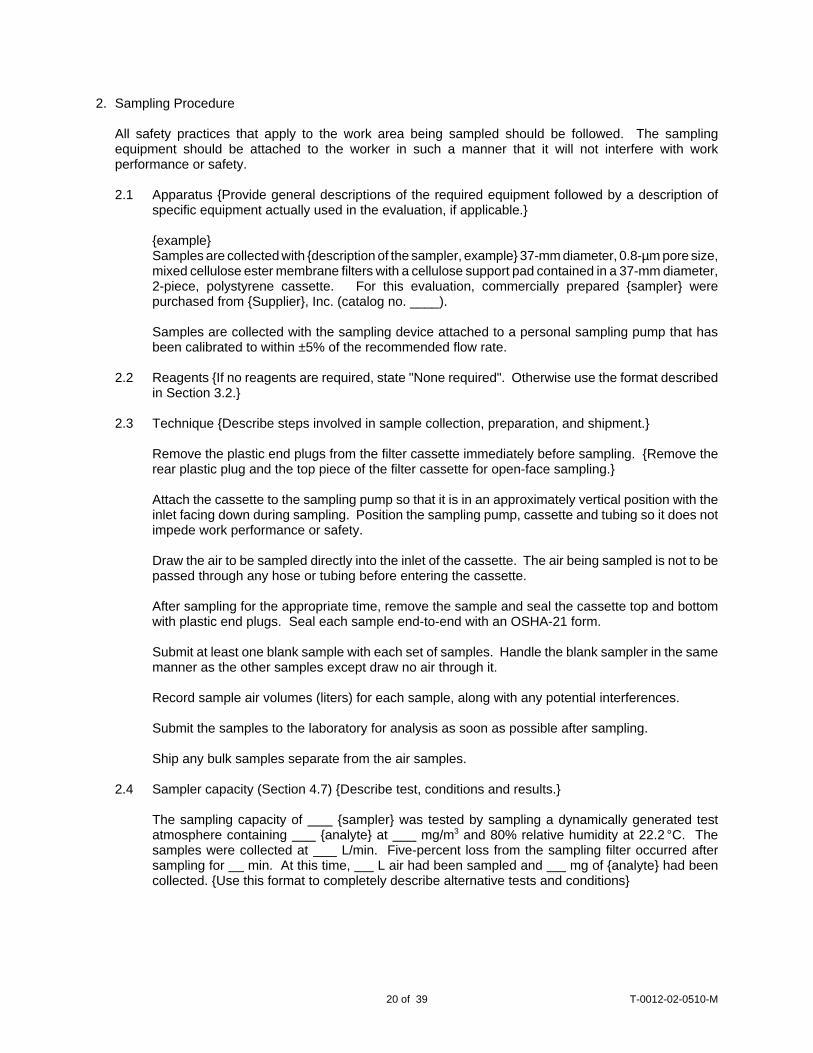
2. Sampling Procedure
All safety practices that apply to the work area being sampled should be followed. The samplingequipment should be attached to the worker in such a manner that it will not interfere with workperformance or safety.
2.1 Apparatus {Provide general descriptions of the required equipment followed by a description ofspecific equipment actually used in the evaluation, if applicable.}
{example}Samples are collected with {description of the sampler, example} 37-mm diameter, 0.8-µm pore size,mixed cellulose ester membrane filters with a cellulose support pad contained in a 37-mm diameter,2-piece, polystyrene cassette. For this evaluation, commercially prepared {sampler} werepurchased from {Supplier}, Inc. (catalog no. ____).
Samples are collected with the sampling device attached to a personal sampling pump that hasbeen calibrated to within ±5% of the recommended flow rate.
2.2 Reagents {If no reagents are required, state "None required". Otherwise use the format describedin Section 3.2.}
2.3 Technique {Describe steps involved in sample collection, preparation, and shipment.}
Remove the plastic end plugs from the filter cassette immediately before sampling. {Remove therear plastic plug and the top piece of the filter cassette for open-face sampling.}
Attach the cassette to the sampling pump so that it is in an approximately vertical position with theinlet facing down during sampling. Position the sampling pump, cassette and tubing so it does notimpede work performance or safety.
Draw the air to be sampled directly into the inlet of the cassette. The air being sampled is not to bepassed through any hose or tubing before entering the cassette.
After sampling for the appropriate time, remove the sample and seal the cassette top and bottomwith plastic end plugs. Seal each sample end-to-end with an OSHA-21 form.
Submit at least one blank sample with each set of samples. Handle the blank sampler in the samemanner as the other samples except draw no air through it.
Record sample air volumes (liters) for each sample, along with any potential interferences.
Submit the samples to the laboratory for analysis as soon as possible after sampling.
Ship any bulk samples separate from the air samples.
2.4 Sampler capacity (Section 4.7) {Describe test, conditions and results.}
The sampling capacity of {sampler} was tested by sampling a dynamically generated testatmosphere containing {analyte} at mg/m3 and 80% relative humidity at 22.2 °C. Thesamples were collected at L/min. Five-percent loss from the sampling filter occurred aftersampling for min. At this time, L air had been sampled and mg of {analyte} had beencollected. {Use this format to completely describe alternative tests and conditions}
T-0012-02-0510-M21 of 39
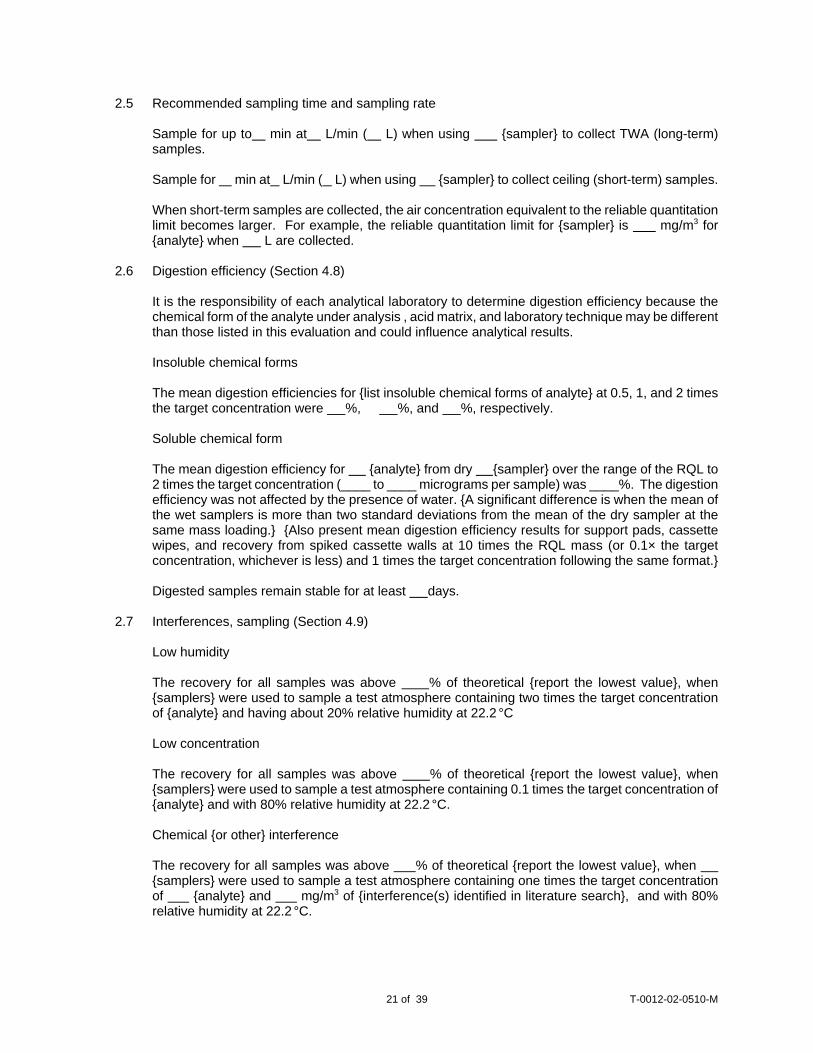
2.5 Recommended sampling time and sampling rate
Sample for up to min at L/min ( L) when using {sampler} to collect TWA (long-term)samples.
Sample for min at L/min ( L) when using {sampler} to collect ceiling (short-term) samples.
When short-term samples are collected, the air concentration equivalent to the reliable quantitationlimit becomes larger. For example, the reliable quantitation limit for {sampler} is mg/m3 for{analyte} when L are collected.
2.6 Digestion efficiency (Section 4.8)
It is the responsibility of each analytical laboratory to determine digestion efficiency because thechemical form of the analyte under analysis , acid matrix, and laboratory technique may be differentthan those listed in this evaluation and could influence analytical results.
Insoluble chemical forms
The mean digestion efficiencies for {list insoluble chemical forms of analyte} at 0.5, 1, and 2 timesthe target concentration were %, %, and %, respectively.
Soluble chemical form
The mean digestion efficiency for {analyte} from dry {sampler} over the range of the RQL to2 times the target concentration (____ to ____ micrograms per sample) was ____%. The digestionefficiency was not affected by the presence of water. {A significant difference is when the mean ofthe wet samplers is more than two standard deviations from the mean of the dry sampler at thesame mass loading.} {Also present mean digestion efficiency results for support pads, cassettewipes, and recovery from spiked cassette walls at 10 times the RQL mass (or 0.1× the targetconcentration, whichever is less) and 1 times the target concentration following the same format.}
Digested samples remain stable for at least days.
2.7 Interferences, sampling (Section 4.9)
Low humidity
The recovery for all samples was above % of theoretical {report the lowest value}, when{samplers} were used to sample a test atmosphere containing two times the target concentrationof {analyte} and having about 20% relative humidity at 22.2 °C
Low concentration
The recovery for all samples was above % of theoretical {report the lowest value}, when{samplers} were used to sample a test atmosphere containing 0.1 times the target concentration of{analyte} and with 80% relative humidity at 22.2 °C.
Chemical {or other} interference
The recovery for all samples was above % of theoretical {report the lowest value}, when {samplers} were used to sample a test atmosphere containing one times the target concentrationof {analyte} and mg/m3 of {interference(s) identified in literature search}, and with 80%relative humidity at 22.2 °C.

9 Occupational Exposure to Hazardous Chemicals in Laboratories. Code of Federal Regulations, Part 1910.1450, Title29, 2002.
10 Personal communication from Connie MacDonald, Corning Life Sciences, 10/20/2004.
T-0012-02-0510-M22 of 39
3. Analytical Procedure
Adhere to the rules set down in your Chemical Hygiene Plan as required by Occupational Exposure toHazardous Chemicals in Laboratories9 standard. Avoid skin contact and inhalation of all chemicals, andreview all appropriate MSDSs before sample analysis. Follow any internal SOP or accreditation protocolnecessary for proper instrument optimization and analysis.
3.1 Apparatus {Provide general descriptions of the required equipment. Follow each general
description with a specific description of equipment actually used in the evaluation.}
3.1.1 Inductively coupled plasma - mass spectrometer (ICP-MS). A Perkin-Elmer Elan 6100 wasused in this evaluation. Instrument accessories included: auto-sampler, peristaltic pump,mass flow controller, and water chiller. The Elan software controlled the instrument andprovided the analytical results.
3.1.2 Laboratory quality microwave oven. A CEM MARS-5 microwave oven with accessories,including temperature probe and high throughput accessory set, was used in thisevaluation.
3.1.3 Centrifuge. A Thermo IEC Centra CL3 centrifuge with accessories was used in thisevaluation.
3.1.4 Plastic graduated centrifuge tubes, 50-mL, accuracy of ±2% or better at the 50-mL mark. Corning (accuracy of ±2%10) polypropylene centrifuge tubes were used in this evaluation.
3.1.5 Cellulose nitrate filters for use to wipe inside surfaces of cassettes. Whatman (Cat. No.
7184-004) , 0.45-:m pore size, 47-mm diameter filters were used in this evaluation.
3.2 Reagents
3.2.1 Nitric acid, [CAS no. 7697-37-2], for trace metal analysis. Nitric acid, ‘Baker Instra-Analyzed’, 69.0-70.0%, (lot V17032) purchased from JT Baker was used in this evaluation.
3.2.2 Hydrochloric acid, [CAS no. 7647-01-0], for trace metal analysis. Hydrochloric acid,‘Baker Instra-Analyzed’, 36.5-38.0%, (lot T45036) purchased from JT Baker was used inthis evaluation.
3.2.3 Calibration standards
3.2.3.1 Arsenic standard, [CAS no. 7440-38-2]. CPI International (CPI), 1000 :g/mLarsenic in 2% HNO3 (lot 3AD064) was used in this evaluation.
3.2.3.2 Cadmium standard, [CAS no. 7440-43-9]. CPI 1000 :g/mL cadmium in 2% HNO3(lot 1LM044) was used in this evaluation.
3.2.3.3 Cobalt standard, [CAS no. 7440-48-4]. CPI 1000 :g/mL cobalt in 2% HNO3 (lot2JT116) was used in this evaluation.
3.2.3.4 Copper standard, [CAS no. 7440-50-8]. CPI 1000 :g/mL copper in 2% HNO3, (lot3AM188) was used in this evaluation.
T-0012-02-0510-M23 of 39
3.2.3.5 Lead standard, [CAS no. 7439-92-1]. CPI 1000 :g/mL lead in 2% HNO3 (lot2LF025) was used in this evaluation.
3.2.3.6 Nickel standard, [CAS no. 7440-02-0]. SPEX 1000 :g/mL nickel in 2% HNO3 (lotPLNI2-2Y) was used in this evaluation.
3.2.4 Internal standards (IS). The elements and concentrations used may be specific for theparticular instrument used and the elements in the calibration. Internal standards are usedto correct for matrix interferences, instrument drift and short-term noise. The following wereused for the evaluation of this method.
3.2.4.1 Germanium standard, [CAS no. 7440-56-4]. CPI 1000 :g/mL germanium in 2%HNO3 (lot OBF145) was used in this evaluation. Germanium is used as an internalstandard for arsenic, cobalt, copper, and nickel.
3.2.4.2 Indium standard, [CAS no. 7440-74-6]. CPI 1000 :g/mL indium in 2% HNO3, (lotOBF173) was used in this evaluation. Indium is used as an internal standard forcadmium.
3.2.4.3 Lutetium standard, [CAS no. 7439-94-3]. CPI 1000 :g/mL, in 2% HNO3 lutium (lot1IF013) was used in this evaluation. Lutetium is used as an internal standard forlead.
3.2.4.4 Interference check sample. {describe using the format of this section}
3.2.5 De-ionized water (DIW), 18 megaohm. A Barnstead Model D11901 NANOpure DIamondwater purifier was used in this evaluation.
3.2.6 Hydrogen peroxide, [CAS no. 7722-84-1], 30%. Mallinckrodt hydrogen peroxide solution,30%, (lot 5240 T45A05) was used in this evaluation.
3.2.7 Ethanol, [CAS no. 64-17-5], 95%. AAPER Alcohol and Chemical Co. ethanol, 95%, (lot98G23BB) was used in this evaluation.
3.3 Standard preparation
3.3.1 Match the matrix of standards to the final digested sample matrix of 4% nitric acid, 1%hydrochloric acid, 1% internal standard (IS) mix, and 1% ethanol. For this method, the ISand ethanol are added during preparation of the samples and standards. Alternatively, theycould be added at the time of introduction into the instrument (e.g., using a mixing blockjust prior to the nebulizer).
3.3.2 Bracket sample concentrations with standard concentrations. If, upon analysis, sampleconcentrations are above the range of prepared standards, dilute the high samples withthe proper acid matrix and reanalyze the samples.
3.4 Sample preparation
3.4.1 Transfer the sampling filter from the 37-mm cassette to the bottom of the plastic centrifugetube. Wipe the interior walls of the cassette with a cellulose nitrate filter that has beenmoistened with 2-3 drops of DIW. Place the wipe at the bottom of the centrifuge tube withthe sampling filter. If the support pad is visibly contaminated, digest and analyze itseparately. Add 2 mL of concentrated nitric acid and 0.2 mL of 30% hydrogen peroxide tothe centrifuge tube. Cap the tube loosely (no more than ¼ turn), to allow any excesspressure to vent around the cap. Swirl the tube to wet the filters contents. Place the tube
T-0012-02-0510-M24 of 39
in the fast throughput carousel in the microwave oven. Digest the samples in themicrowave. Samples are digested in the microwave using the following parameters:
First stepMaximum power = 600 WStarting temperature = ambientRamp temperature to 104 ºC over 9 minHold temperature at 104 ºC for 3 min
Allow the samples to cool at least 10 min before removing from the microwave. Add 0.5mL of concentrated hydrochloric acid. Recap the samples, return them to the microwave,and further digest them using the following parameters:
Second StepMaximum power = 600 WStarting temperature = ambientRamp temperature to 86 ºC over 5 minHold temperature at 86 ºC for 1 min
Allow the samples at least 10 minutes to cool before removing from the microwave. Add0.5 mL of IS solution and 0.5 mL of 95% ethanol. Dilute the sample to the 50-mL markwith DIW. If solid particles remain after diluting to volume, filter the sample and digest thefilter and particles in the microwave using the second step described above. Sampleresults shall be added together after both solutions have been analyzed separately. Forthis evaluation, the final matrix contains 4% nitric acid, 1% hydrochloric acid, 1% IS, and1% ethanol.
Note: If volumes other than 50 mL are used, amounts of acids should be adjusted to keepthe matrix approximately the same for samples and standards.
3.4.2 Digest a contaminated support pad, that has been identified by a discoloration on the whitepad, separately using a modification of the above microwave procedure. Instead of using2 mL of nitric acid, use 4 mL of nitric acid and 0.3 mL of 30% hydrogen peroxide. In thesecond step, use 1 mL of concentrated hydrochloric acid. Lastly, transfer the contents ofthe centrifuge tube to a 100-mL volumetric flask, add 1 mL of IS solution and 1 mL of 95%ethanol, and dilute to volume with DIW. Although the procedure may not completely digestall of the fibers present, a study was done to show that analytes spiked on the support paddo go into the solution (Section 4.8.2). Centrifuge the tubes at 2000 rpm for 10 min tocompact the fibers, If necessary, before analyzing the sample.
3.5 Analysis
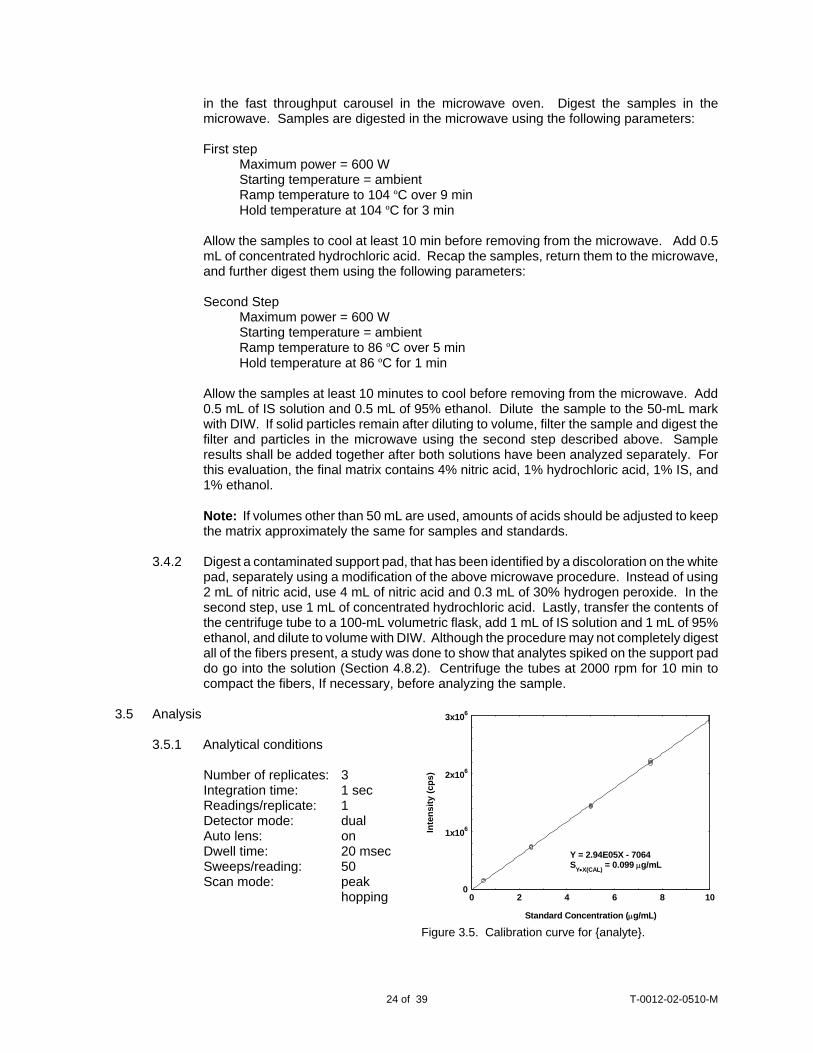
3.5.1 Analytical conditions
Number of replicates: 3Integration time: 1 secReadings/replicate: 1Detector mode: dualAuto lens: onDwell time: 20 msecSweeps/reading: 50Scan mode: peak
hopping0
1x10⁶
2x10⁶
3x10⁶
0 2 4 6 8 10
Y = 2.94E05X - 7064SY•X(CAL) = 0.099 µg/mL
Standard Concentration (µg/mL)
Inte
nsity
(cps
)
Figure 3.5. Calibration curve for {analyte}.
T-0012-02-0510-M25 of 39
3.5.2 An internal standard (ISTD) calibration method is used. The calibration curve shown inFigure 3.5 was constructed by plotting ISTD-corrected response of standard determinationsversus micrograms of analyte per milliliter. Bracket sample concentrations with freshlyprepared analytical standards over the calibration range. The calibration curve wasprepared with a soluble salt over the concentration range of 0.1 to 2 times the targetconcentration. The standard error of estimate for this curve is 0.099 :g/mL of {analyte}calculated from the precision of the calibration.
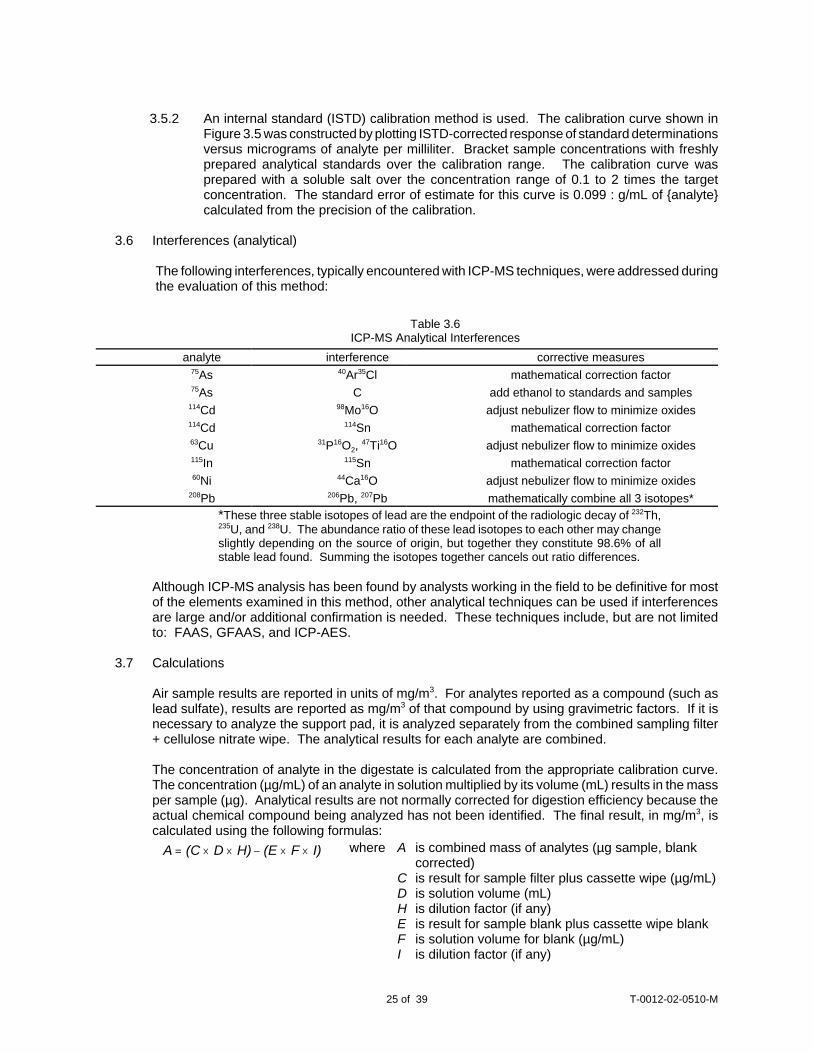
3.6 Interferences (analytical)
The following interferences, typically encountered with ICP-MS techniques, were addressed duringthe evaluation of this method:
Table 3.6ICP-MS Analytical Interferences
analyte interference corrective measures75As 40Ar35Cl mathematical correction factor75As C add ethanol to standards and samples
114Cd 98Mo16O adjust nebulizer flow to minimize oxides114Cd 114Sn mathematical correction factor63Cu 31P16O2, 47Ti16O adjust nebulizer flow to minimize oxides115In 115Sn mathematical correction factor60Ni 44Ca16O adjust nebulizer flow to minimize oxides
208Pb 206Pb, 207Pb mathematically combine all 3 isotopes**These three stable isotopes of lead are the endpoint of the radiologic decay of 232Th,235U, and 238U. The abundance ratio of these lead isotopes to each other may changeslightly depending on the source of origin, but together they constitute 98.6% of allstable lead found. Summing the isotopes together cancels out ratio differences.
Although ICP-MS analysis has been found by analysts working in the field to be definitive for mostof the elements examined in this method, other analytical techniques can be used if interferencesare large and/or additional confirmation is needed. These techniques include, but are not limitedto: FAAS, GFAAS, and ICP-AES.
3.7 Calculations
Air sample results are reported in units of mg/m3. For analytes reported as a compound (such aslead sulfate), results are reported as mg/m3 of that compound by using gravimetric factors. If it isnecessary to analyze the support pad, it is analyzed separately from the combined sampling filter+ cellulose nitrate wipe. The analytical results for each analyte are combined.
The concentration of analyte in the digestate is calculated from the appropriate calibration curve.The concentration (µg/mL) of an analyte in solution multiplied by its volume (mL) results in the massper sample (µg). Analytical results are not normally corrected for digestion efficiency because theactual chemical compound being analyzed has not been identified. The final result, in mg/m3, iscalculated using the following formulas:
A (C D H) (E F I)= × × − × × where A is combined mass of analytes (µg sample, blankcorrected)
C is result for sample filter plus cassette wipe (µg/mL)D is solution volume (mL)H is dilution factor (if any)E is result for sample blank plus cassette wipe blankF is solution volume for blank (µg/mL)I is dilution factor (if any)
11 Evaluation Guidelines for Air Sampling Methods Utilizing Chromatographic Analysis,http://www.osha.gov/dts/sltc/methods/chromguide/index.html (accessed 9/2005).
T-0012-02-0510-M26 of 39
0
5000
10000
15000
20000
0 0.2 0.4 0.6 0.8
DLAP
Y = 2.10E04X + 326SY•X(DL) = 143DLAP = 0.02 ng/mL
Concentration (ng/mL)
Mea
n In
tens
ity (c
ps)
Figure 4.1. Plot of data to determine DLAP.
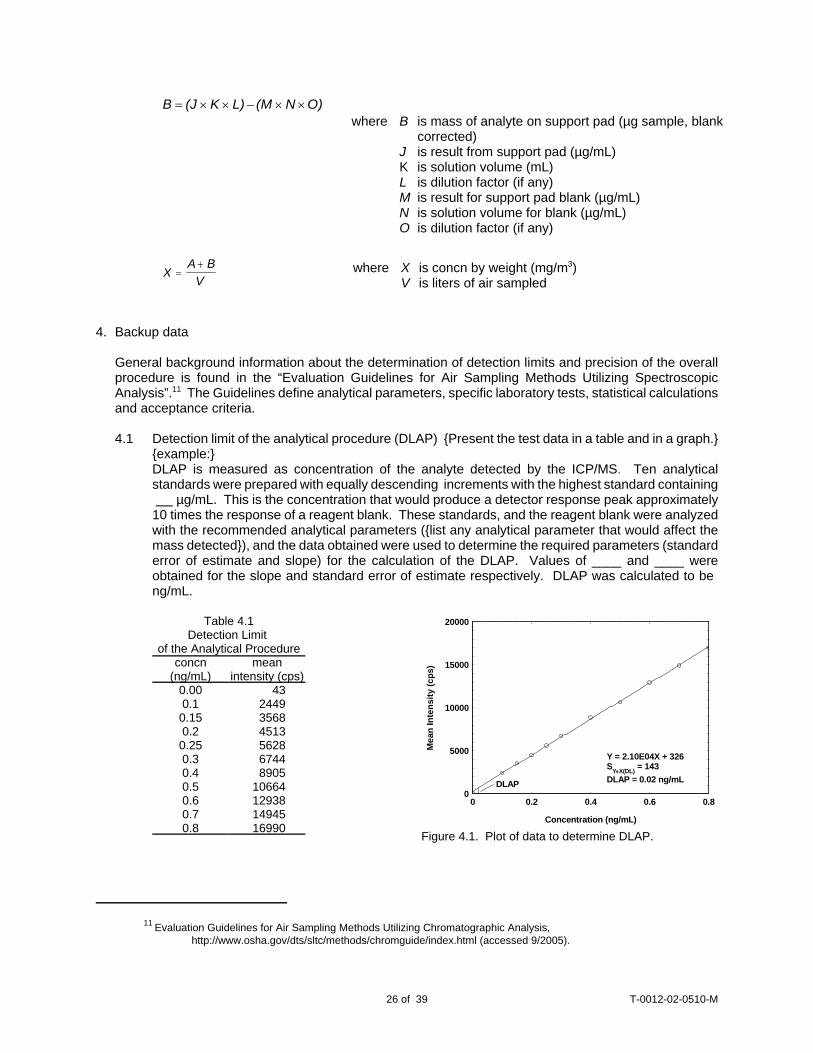
4. Backup data
General background information about the determination of detection limits and precision of the overallprocedure is found in the “Evaluation Guidelines for Air Sampling Methods Utilizing SpectroscopicAnalysis”.11 The Guidelines define analytical parameters, specific laboratory tests, statistical calculationsand acceptance criteria.
4.1 Detection limit of the analytical procedure (DLAP) {Present the test data in a table and in a graph.}{example:}DLAP is measured as concentration of the analyte detected by the ICP/MS. Ten analyticalstandards were prepared with equally descending increments with the highest standard containing µg/mL. This is the concentration that would produce a detector response peak approximately10 times the response of a reagent blank. These standards, and the reagent blank were analyzedwith the recommended analytical parameters ({list any analytical parameter that would affect themass detected}), and the data obtained were used to determine the required parameters (standarderror of estimate and slope) for the calculation of the DLAP. Values of ____ and ____ wereobtained for the slope and standard error of estimate respectively. DLAP was calculated to be ng/mL.
where B is mass of analyte on support pad (µg sample, blankcorrected)
J is result from support pad (µg/mL)K is solution volume (mL)L is dilution factor (if any)M is result for support pad blank (µg/mL)N is solution volume for blank (µg/mL)O is dilution factor (if any)
B (J K L) (M N O)= × × − × ×
XA B
V=
+ where X is concn by weight (mg/m3)V is liters of air sampled
Table 4.1Detection Limit
of the Analytical Procedureconcn
(ng/mL)mean
intensity (cps)0.00 430.1 24490.15 35680.2 45130.25 56280.3 67440.4 89050.5 106640.6 129380.7 149450.8 16990
T-0012-02-0510-M27 of 39
0
2000
4000
6000
0 5 10
RQL
DLOP
Y = 437X + 90.4SY·X(DLOP) = 141DLOP = 0.97 ngRQL = 3.2 ng
Mass (ng) per Sample
Mea
n In
tens
ity (c
ps)
Figure 4.2. Plot of data to determine DLOP/RQL.
Table 4.2Detection Limit of the
Overall Proceduremass per sample
(ng)
meanintensity
(cps)0 2860.8 5451.6 7642.4 10243.6 14434.8 22376 25727.2 33128.4 36479.6 4354
10.8 4954
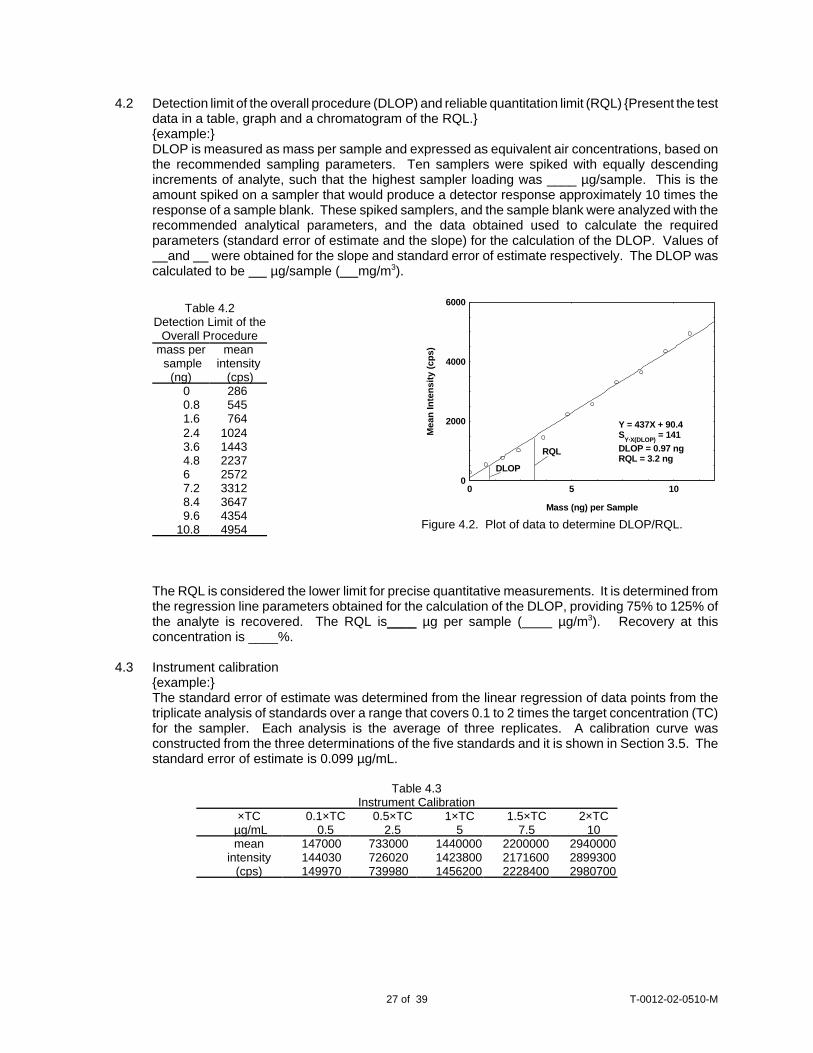
4.2 Detection limit of the overall procedure (DLOP) and reliable quantitation limit (RQL) {Present the testdata in a table, graph and a chromatogram of the RQL.}{example:}DLOP is measured as mass per sample and expressed as equivalent air concentrations, based onthe recommended sampling parameters. Ten samplers were spiked with equally descendingincrements of analyte, such that the highest sampler loading was ____ µg/sample. This is theamount spiked on a sampler that would produce a detector response approximately 10 times theresponse of a sample blank. These spiked samplers, and the sample blank were analyzed with therecommended analytical parameters, and the data obtained used to calculate the requiredparameters (standard error of estimate and the slope) for the calculation of the DLOP. Values of and were obtained for the slope and standard error of estimate respectively. The DLOP wascalculated to be µg/sample ( mg/m3).
The RQL is considered the lower limit for precise quantitative measurements. It is determined fromthe regression line parameters obtained for the calculation of the DLOP, providing 75% to 125% ofthe analyte is recovered. The RQL is____ µg per sample ( µg/m3). Recovery at thisconcentration is ____%.
4.3 Instrument calibration{example:}The standard error of estimate was determined from the linear regression of data points from thetriplicate analysis of standards over a range that covers 0.1 to 2 times the target concentration (TC)for the sampler. Each analysis is the average of three replicates. A calibration curve wasconstructed from the three determinations of the five standards and it is shown in Section 3.5. Thestandard error of estimate is 0.099 µg/mL.
Table 4.3Instrument Calibration
×TC µg/mL
0.1×TC0.5
0.5×TC2.5
1×TC5
1.5×TC7.5
2×TC10
meanintensity
(cps)
147000 733000 1440000 2200000 2940000144030 726020 1423800 2171600 2899300149970 739980 1456200 2228400 2980700
T-0012-02-0510-M28 of 39
0
40
80
120
0 5 10 15
Ambient StorageY = 0.116X + 99.4Std Error of Estimate = 5.3095% Confidence Limits = ±(1.96)(5.30) = ±10.4
Storage time (days)
Rec
over
y (%
)
Figure 4.5. Ambient storage test for {analyte}.
4.4 Precision (overall procedure)
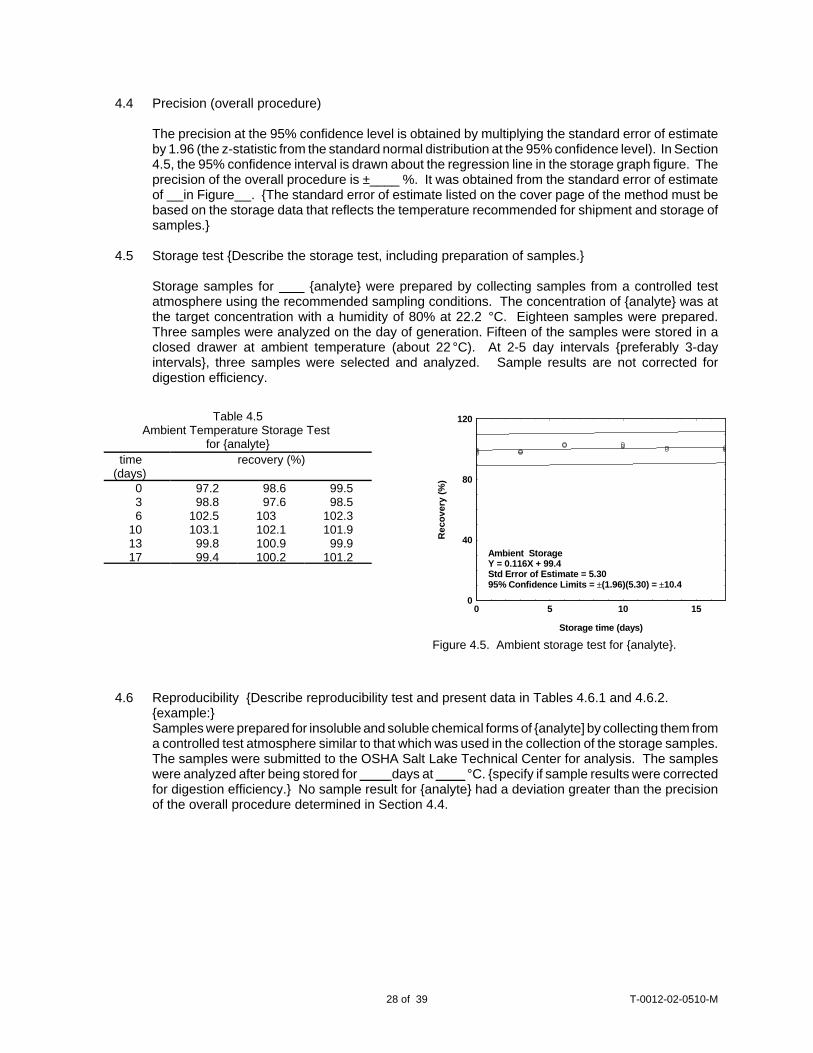
The precision at the 95% confidence level is obtained by multiplying the standard error of estimateby 1.96 (the z-statistic from the standard normal distribution at the 95% confidence level). In Section4.5, the 95% confidence interval is drawn about the regression line in the storage graph figure. Theprecision of the overall procedure is ±____ %. It was obtained from the standard error of estimateof in Figure . {The standard error of estimate listed on the cover page of the method must bebased on the storage data that reflects the temperature recommended for shipment and storage ofsamples.}
4.5 Storage test {Describe the storage test, including preparation of samples.}
Storage samples for {analyte} were prepared by collecting samples from a controlled testatmosphere using the recommended sampling conditions. The concentration of {analyte} was atthe target concentration with a humidity of 80% at 22.2 °C. Eighteen samples were prepared.Three samples were analyzed on the day of generation. Fifteen of the samples were stored in aclosed drawer at ambient temperature (about 22 °C). At 2-5 day intervals {preferably 3-dayintervals}, three samples were selected and analyzed. Sample results are not corrected fordigestion efficiency.
4.6 Reproducibility {Describe reproducibility test and present data in Tables 4.6.1 and 4.6.2.{example:}Samples were prepared for insoluble and soluble chemical forms of {analyte] by collecting them froma controlled test atmosphere similar to that which was used in the collection of the storage samples.The samples were submitted to the OSHA Salt Lake Technical Center for analysis. The sampleswere analyzed after being stored for ____ days at ____ °C. {specify if sample results were correctedfor digestion efficiency.} No sample result for {analyte} had a deviation greater than the precisionof the overall procedure determined in Section 4.4.
Table 4.5Ambient Temperature Storage Test
for {analyte}time
(days)recovery (%)
0 97.2 98.6 99.53 98.8 97.6 98.56 102.5 103 102.3
10 103.1 102.1 101.913 99.8 100.9 99.917 99.4 100.2 101.2
T-0012-02-0510-M29 of 39
Table 4.6.1Reproducibility Data for
Insoluble {Analyte} on {Sampler}theoretical
(µg/sample)recovered
(µg/sample)recovery
(%)deviation
(%)50.050.050.050.050.050.0
45.545.745.347.046.248.7
91.091.490.694.092.497.4
-9.0-8.6-9.4-6.0-7.6-2.6
Table 4.6.2Reproducibility Data for
Soluble {analyte} on {Sampler}theoretical
(µg/sample)recovered
(µg/sample)recovery
(%)deviation
(%)50.050.050.050.050.050.0
47.249.149.150.651.048.0
94.498.298.2
101.2102.096.1
-5.6-1.8-1.81.22.0
-3.9
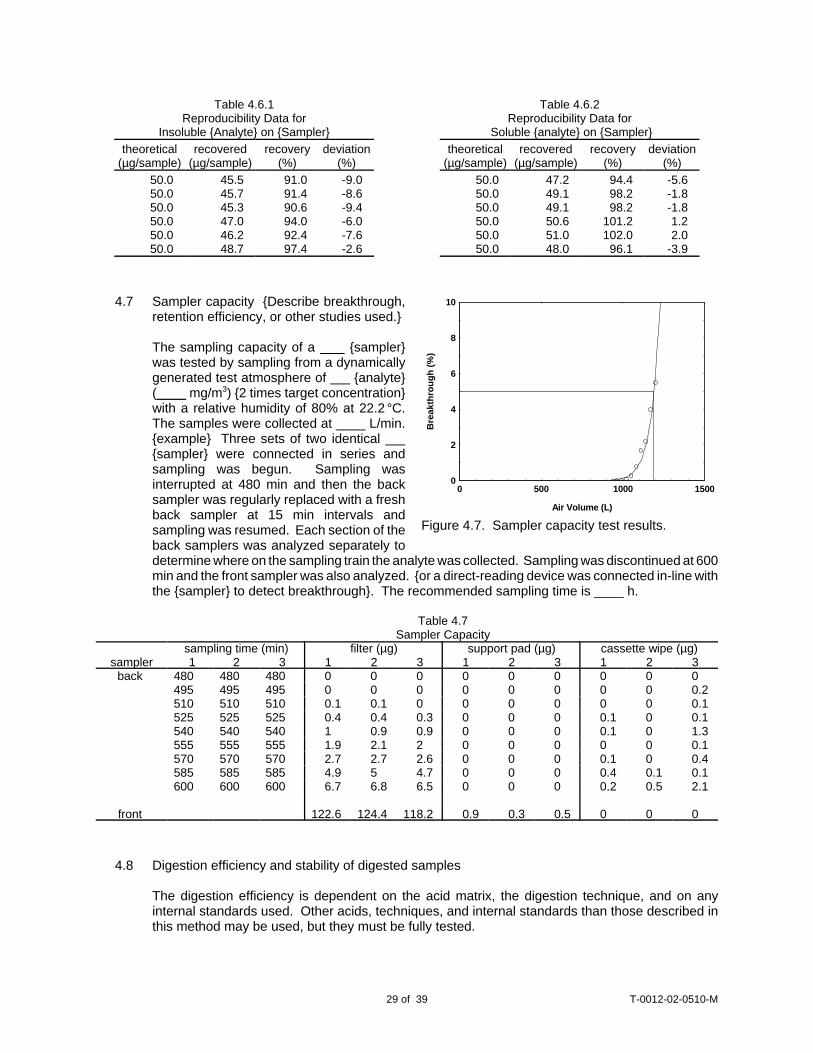
4.7 Sampler capacity {Describe breakthrough,retention efficiency, or other studies used.}
The sampling capacity of a {sampler}was tested by sampling from a dynamicallygenerated test atmosphere of {analyte}(____ mg/m3) {2 times target concentration}with a relative humidity of 80% at 22.2 °C.The samples were collected at ____ L/min.{example} Three sets of two identical {sampler} were connected in series andsampling was begun. Sampling wasinterrupted at 480 min and then the backsampler was regularly replaced with a freshback sampler at 15 min intervals andsampling was resumed. Each section of theback samplers was analyzed separately todetermine where on the sampling train the analyte was collected. Sampling was discontinued at 600min and the front sampler was also analyzed. {or a direct-reading device was connected in-line withthe {sampler} to detect breakthrough}. The recommended sampling time is ____ h.
4.8 Digestion efficiency and stability of digested samples
The digestion efficiency is dependent on the acid matrix, the digestion technique, and on anyinternal standards used. Other acids, techniques, and internal standards than those described inthis method may be used, but they must be fully tested.
0
2
4
6
8
10
0 500 1000 1500
Air Volume (L)
Bre
akth
roug
h (%
)
Figure 4.7. Sampler capacity test results.
Table 4.7Sampler Capacity
sampling time (min) filter (µg) support pad (µg) cassette wipe (µg)sampler 1 2 3 1 2 3 1 2 3 1 2 3
back 480 480 480 0 0 0 0 0 0 0 0 0495 495 495 0 0 0 0 0 0 0 0 0.2510 510 510 0.1 0.1 0 0 0 0 0 0 0.1525 525 525 0.4 0.4 0.3 0 0 0 0.1 0 0.1540 540 540 1 0.9 0.9 0 0 0 0.1 0 1.3555 555 555 1.9 2.1 2 0 0 0 0 0 0.1570 570 570 2.7 2.7 2.6 0 0 0 0.1 0 0.4585 585 585 4.9 5 4.7 0 0 0 0.4 0.1 0.1600 600 600 6.7 6.8 6.5 0 0 0 0.2 0.5 2.1
front 122.6 124.4 118.2 0.9 0.3 0.5 0 0 0

T-0012-02-0510-M30 of 39
4.8.1 Insoluble forms
Digestion efficiency
The digestion efficiencies of insoluble forms of {analyte} were determined by {describetechnique} at masses equivalent to 0.5, 1, and 2 times the target concentration (TC).{describe materials and spiking techniques}
Table 4.8.1Digestion Efficiency for Insoluble Forms of {analyte} from {sampler}
digestion efficiency (%)chemical
compoundgravimetric
factor ×TCmass
digested (µg) 1 2 3 4 mean
chemical 1 0.683 0.5 17.6 93.5 92.4 89.9 94.5 92.61 35.1 92.9 94.9 95 97.6 95.12 70.3 90.4 96.1 96.3 95.9 94.7
ave 94.1
chemical 2 0.982 0.5 12.2 99.4 97.6 95.9 100.3 98.31 24.4 98.9 96.9 99.2 98.9 98.52 48.9 98.6 96.1 99.9 97.5 98
ave 98.3
chemical 3 0.641 0.5 18.7 89.4 88.4 88.1 88.8 88.71 37.4 90.6 85.9 86.6 85.6 87.22 74.9 91.1 89.9 84.1 82.3 86.9
ave 87.6The gravimetric factor is the decimal equivalent of the percent of the analyzed element in the tested compound.
4.8.2 Soluble forms
The digestion efficiency of a soluble form of {analyte} from {sampler} wasdetermined by liquid-spiking {sampler} with the analyte diluted with {acid matrix} atthe RQL, 0.1, 0.5, 1, 1.5, and 2 times the target concentration. {describe materials andspiking techniques} An additional digestion efficiency test was performed with wetsamplers at 1 times the target concentration. The spiked samples were all stored overnightat ambient temperature and then analyzed. The mean digestion efficiency over the workingrange of the RQL to 2 times the target concentration is %. The extraction efficiency forthe wet samplers was not included in the overall mean because it would bias the results.
Table 4.8.2.1Digestion Efficiency for Soluble Form of {analyte} from {sampler} (%)
levelmass spiked
(µg) 1 2 3 4 meanRQL 0.32 93.5 90.4 91.1 87.2 90.60.1× 3.83 92 94.6 99.2 99.6 96.40.5× 19.2 94.7 96.4 97.2 98.7 96.81.0× 38.3 92.5 92.7 96.9 97.6 94.91.5× 57.5 95.4 89.6 97 99.9 95.52.0× 76.6 99.1 99.8 99.6 100.3 99.7
wet 1.0× 38.3 94.9 99.1 99.2 93.5 96.7
T-0012-02-0510-M31 of 39
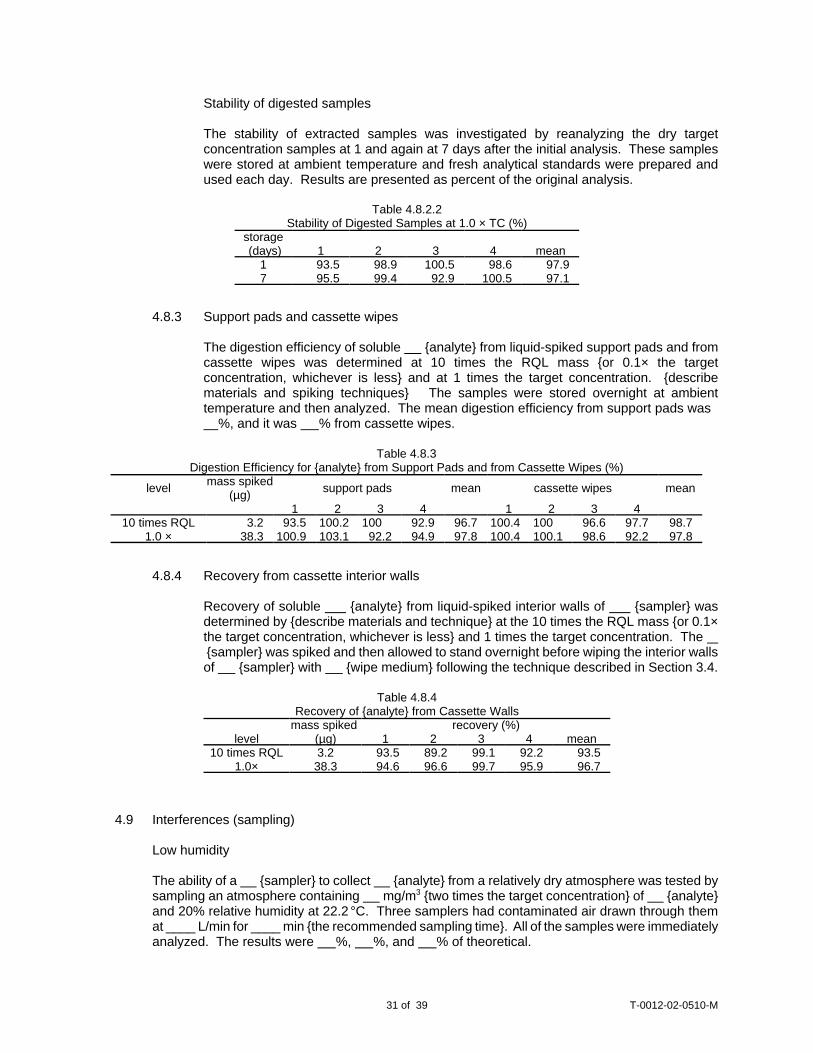
Stability of digested samples
The stability of extracted samples was investigated by reanalyzing the dry targetconcentration samples at 1 and again at 7 days after the initial analysis. These sampleswere stored at ambient temperature and fresh analytical standards were prepared andused each day. Results are presented as percent of the original analysis.
4.8.3 Support pads and cassette wipes
The digestion efficiency of soluble {analyte} from liquid-spiked support pads and fromcassette wipes was determined at 10 times the RQL mass {or 0.1× the targetconcentration, whichever is less} and at 1 times the target concentration. {describematerials and spiking techniques} The samples were stored overnight at ambienttemperature and then analyzed. The mean digestion efficiency from support pads was %, and it was % from cassette wipes.
4.8.4 Recovery from cassette interior walls
Recovery of soluble {analyte} from liquid-spiked interior walls of {sampler} wasdetermined by {describe materials and technique} at the 10 times the RQL mass {or 0.1×the target concentration, whichever is less} and 1 times the target concentration. The {sampler} was spiked and then allowed to stand overnight before wiping the interior wallsof {sampler} with {wipe medium} following the technique described in Section 3.4.
4.9 Interferences (sampling)
Low humidity
The ability of a {sampler} to collect {analyte} from a relatively dry atmosphere was tested bysampling an atmosphere containing mg/m3 {two times the target concentration} of {analyte}and 20% relative humidity at 22.2 °C. Three samplers had contaminated air drawn through themat ____ L/min for ____ min {the recommended sampling time}. All of the samples were immediatelyanalyzed. The results were %, %, and % of theoretical.
Table 4.8.2.2Stability of Digested Samples at 1.0 × TC (%)
storage (days) 1 2 3 4 mean
1 93.5 98.9 100.5 98.6 97.97 95.5 99.4 92.9 100.5 97.1
Table 4.8.3Digestion Efficiency for {analyte} from Support Pads and from Cassette Wipes (%)
level mass spiked(µg) support pads mean cassette wipes mean
1 2 3 4 1 2 3 410 times RQL 3.2 93.5 100.2 100 92.9 96.7 100.4 100 96.6 97.7 98.7
1.0 × 38.3 100.9 103.1 92.2 94.9 97.8 100.4 100.1 98.6 92.2 97.8
Table 4.8.4Recovery of {analyte} from Cassette Walls
mass spiked recovery (%)level (µg) 1 2 3 4 mean
10 times RQL 3.2 93.5 89.2 99.1 92.2 93.51.0× 38.3 94.6 96.6 99.7 95.9 96.7
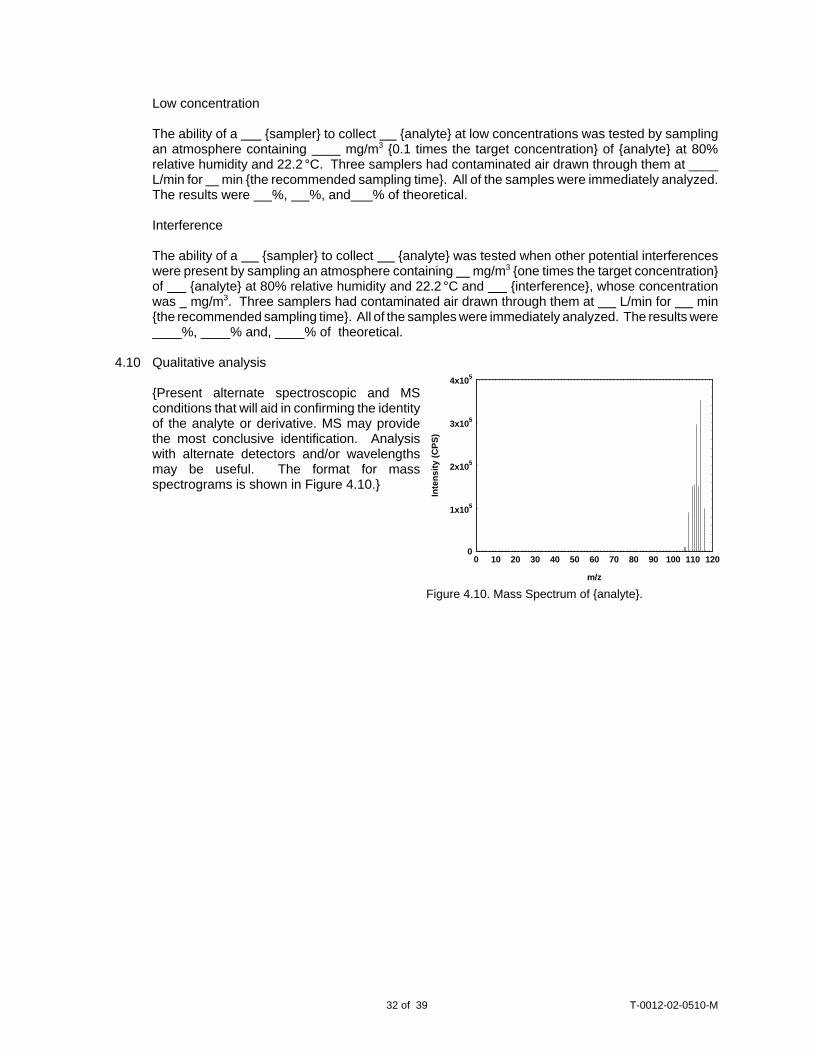
T-0012-02-0510-M32 of 39
Low concentration
The ability of a {sampler} to collect {analyte} at low concentrations was tested by samplingan atmosphere containing mg/m3 {0.1 times the target concentration} of {analyte} at 80%relative humidity and 22.2 °C. Three samplers had contaminated air drawn through them at ____L/min for min {the recommended sampling time}. All of the samples were immediately analyzed.The results were %, %, and % of theoretical.
Interference
The ability of a {sampler} to collect {analyte} was tested when other potential interferenceswere present by sampling an atmosphere containing mg/m3 {one times the target concentration}of {analyte} at 80% relative humidity and 22.2 °C and {interference}, whose concentrationwas mg/m3. Three samplers had contaminated air drawn through them at L/min for min{the recommended sampling time}. All of the samples were immediately analyzed. The results were____%, ____% and, ____% of theoretical.
4.10 Qualitative analysis
{Present alternate spectroscopic and MSconditions that will aid in confirming the identityof the analyte or derivative. MS may providethe most conclusive identification. Analysiswith alternate detectors and/or wavelengthsmay be useful. The format for massspectrograms is shown in Figure 4.10.}
0
1x10⁵
2x10⁵
3x10⁵
4x10⁵
0 10 20 30 40 50 60 70 80 90 100 110 120
m/z
Inte
nsity
(CPS
)
Figure 4.10. Mass Spectrum of {analyte}.

T-0012-02-0510-M33 of 39
II. Partially Validated Methods - Data shall be included on the following items:
1. Background information - Include the purpose of the work, physical properties and other easily acquiredinformation that would normally be reported in the Background Section of a fully validated procedure.
2. Detection limit of the overall procedure (DLOP) - Determine this parameter in the same manner as ina fully validated procedure.
3. Reliable quantitation limit (RQL) - Determine this parameter in the same manner as in a fully validatedprocedure.
4. Digestion efficiency - Determine these parameters over the working rage of 0.5 to 2 times the targetconcentration plus the RQL, in the same manner as in a fully validated procedure.
5. Recommended sampling time and sampling rate - The recommended sampling information will at leastbe based, in part, on retention efficiencies. Retention efficiencies must be performed with loadingsequivalent to twice the target concentration and with humid air (80% relative humidity at 22.2 °C).
6. Storage test - A storage test shall be performed with spiked samples at loadings equivalent to the targetconcentration. Draw the recommended air volume through the spiked samplers using humid air (80%relative humidity at 22.2°C). This test shall be performed for two weeks. The age of submitted samplescould also be the basis for the length of a storage test.
7. Recommendation for further study - These include recommendations that shall be considered beforea full validation is performed.
8. Method Review Prepare written methods by following the format described in these Guidelines asclosely as possible. Give each method a unique method number, a unique control number, and eachdraft version a unique draft number. Provide the team leader of Methods Development Team (MDT)with four copies of the draft method for review and comment. Schedule a review meeting to discussthe draft method. Revise the draft method considering comments from the review meeting. Continuethis process until the consensus of the reviewers is that the method is suitable. Perform a final revision(remove the draft number) of the method for approval by the IHC Director. Submit an electronicversion of the completed method to the MDT team leader.
Prepare written Partially Validated Methods according to the following outline. This outline is similar to thatused for a Fully Validated Method except the evaluation data is included in the various appropriate methodsections instead of in a separate Backup Data section. The outline for Fully Validated Methods can be areference for more specific format details. All Partially Validated Methods shall have the followingstatement of status on the cover page:
"Partially Validated Method”. This method has been subjected to established evaluation procedures of theMethods Development Team and is presented for information and trial use.
Follow the formatting information of a Fully Validated Method.
T-0012-02-0510-M34 of 39
{ANALYTE}{as listed in CFR or ACGIH}
Method number: PV2xxx
Control no: T-PV2xxx-01-yymm-S
Target concentration: mg/m3 { ppm ( mg/m3) {if appropriate}} OSHA PEL: mg/m3 { ppm ( mg/m3) {if appropriate}} {None if no PEL}ACGIH TLV: mg/m3 { ppm ( mg/m3) {if appropriate}} {None if no TLV}
Procedure: Samples are collected by drawing workplace air through ____ with personalsampling pumps. Samples are extracted with ____ and analyzed by ____using a ____ detector.
Recommended sampling time and sampling rate: min at L/min ( L)
Reliable quantitation limit: mg/m3 { ppm ( mg/m3) {if appropriate}}
Special requirements: {If none, delete this item}
Status of method: Partially validated method. This method has been subjected to establishedevaluation procedures of the Methods Development Team and is presentedfor information and trial use.
{month year} {chemist}
Spectroscopy TeamIndustrial Hygiene Chemistry Division
OSHA Salt Lake Technical CenterSandy UT 84070-6406
12 This reference was used for most of the physical properties.13 Evaluation Guidelines for Air Sampling Methods Utilizing Chromatographic Analysis,
http://www.osha.gov/dts/sltc/methods/chromguide/index.html (accessed 9/2005).
T-0012-02-0510-M35 of 39
1. General Discussion
{include the following disclaimer}For assistance with accessibility problems in using figures and illustrations presented in this method, pleasecontact OSHA Salt Lake Technical Center at (801) 233-4900. This procedure was designed and tested forinternal use by OSHA personnel. Mention of any company name or commercial product does not constituteendorsement by OSHA.
1.1 Background
1.1.1 History
{Explain the purpose of this work. Also, obvious questions that may be raised byknowledgeable readers should be addressed. Keep length at 1 to 1.5 pages or less.}
1.1.2 Toxic effects (This section is for information only and should not be taken as the basis ofOSHA policy.)
{Cite sources for presented information. If both animal data and human data arepresented, present the animal data first. If the entire section is taken from one reference,the reference notation can be placed behind the qualifying statement in the heading.}
1.1.3 Workplace exposure
{Report major sources of exposure in the workplace and, if available the size of the workpopulation that is exposed. If the entire section is taken from one reference, the referencenotation can be placed behind the heading.}
1.1.4 Physical properties and other descriptive information {for example}12
CAS number: ____ vapor pressure:{kPa (mmHg)} ____IMIS number: ____ 8max: ____molecular weight: ____ flash point: ____boiling point: ____ odor: ____appearance: ____ lower explosive limit: ____specific gravity: ____ synonyms: ____molecular formula: ____ structural formula: ____melting point: ____ solubility: ____
This method was evaluated according to OSHA SLTC “Evaluation Guidelines for Air Sampling MethodsUtilizing Spectroscopic Analysis”13. The Guidelines define analytical parameters, specify required laboratorytests, statistical calculations and acceptance criteria. The analyte air concentrations throughout this methodare based on the recommended sampling and analytical parameters. Air concentrations listed in ppm arereferenced to 25 °C and 101.3 kPa (760 mmHg).
1.2 Detection limit of the overall procedure (DLOP) and reliable quantitation limit (RQL) {Present the testdata in a table and in a graph.}Example:DLOP is measured as mass per sample and expressed as equivalent air concentrations, based onthe recommended sampling parameters. Ten samplers were spiked with equally descending
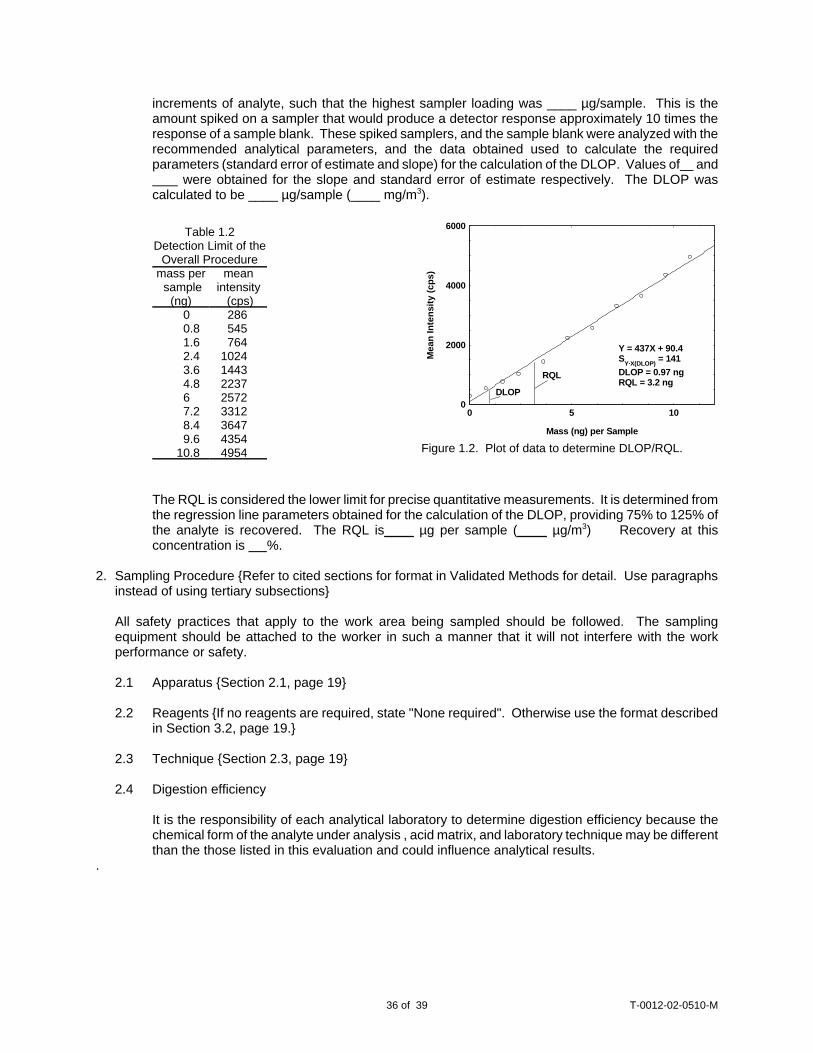
T-0012-02-0510-M36 of 39
Table 1.2Detection Limit of the
Overall Proceduremass per sample
(ng)
meanintensity
(cps)0 2860.8 5451.6 7642.4 10243.6 14434.8 22376 25727.2 33128.4 36479.6 4354
10.8 4954
0
2000
4000
6000
0 5 10
RQL
DLOP
Y = 437X + 90.4SY·X(DLOP) = 141DLOP = 0.97 ngRQL = 3.2 ng
Mass (ng) per SampleM
ean
Inte
nsity
(cps
)
Figure 1.2. Plot of data to determine DLOP/RQL.
increments of analyte, such that the highest sampler loading was ____ µg/sample. This is theamount spiked on a sampler that would produce a detector response approximately 10 times theresponse of a sample blank. These spiked samplers, and the sample blank were analyzed with therecommended analytical parameters, and the data obtained used to calculate the requiredparameters (standard error of estimate and slope) for the calculation of the DLOP. Values of and were obtained for the slope and standard error of estimate respectively. The DLOP wascalculated to be ____ µg/sample (____ mg/m3).
The RQL is considered the lower limit for precise quantitative measurements. It is determined fromthe regression line parameters obtained for the calculation of the DLOP, providing 75% to 125% ofthe analyte is recovered. The RQL is____ µg per sample (____ µg/m3) Recovery at thisconcentration is %.
2. Sampling Procedure {Refer to cited sections for format in Validated Methods for detail. Use paragraphsinstead of using tertiary subsections}
All safety practices that apply to the work area being sampled should be followed. The samplingequipment should be attached to the worker in such a manner that it will not interfere with the workperformance or safety.
2.1 Apparatus {Section 2.1, page 19}
2.2 Reagents {If no reagents are required, state "None required". Otherwise use the format describedin Section 3.2, page 19.}
2.3 Technique {Section 2.3, page 19}
2.4 Digestion efficiency
It is the responsibility of each analytical laboratory to determine digestion efficiency because thechemical form of the analyte under analysis , acid matrix, and laboratory technique may be differentthan the those listed in this evaluation and could influence analytical results.
.
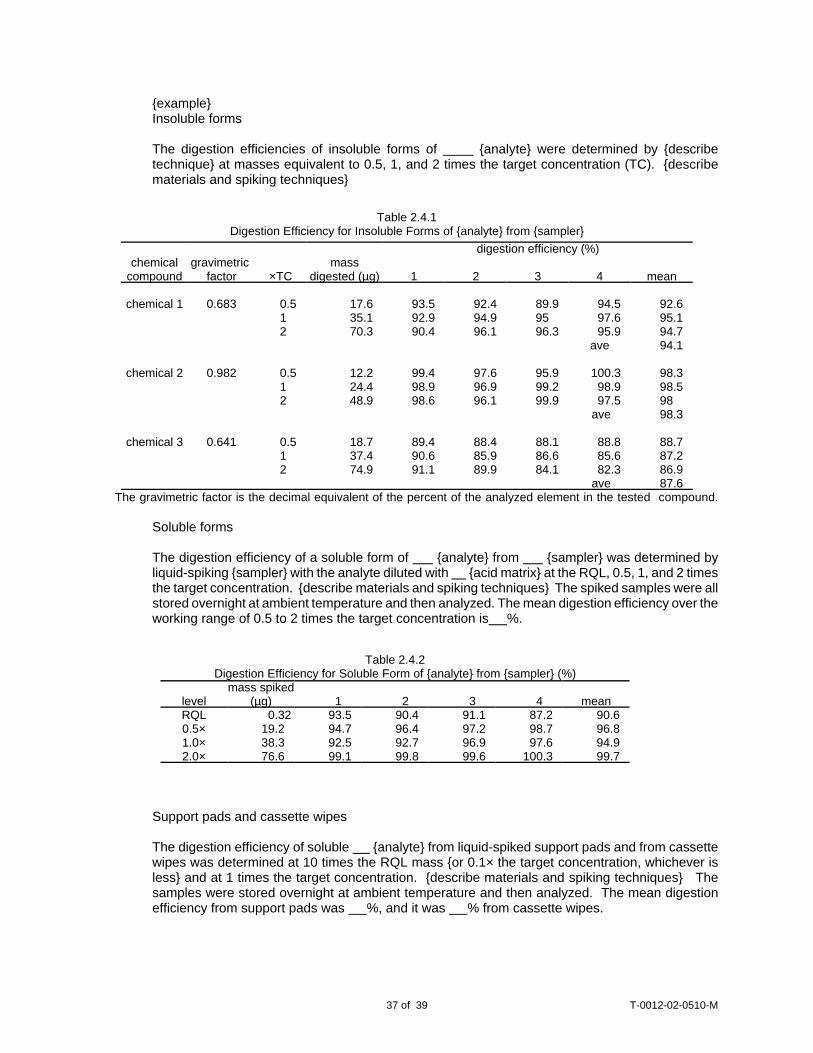
T-0012-02-0510-M37 of 39
{example}Insoluble forms
The digestion efficiencies of insoluble forms of {analyte} were determined by {describetechnique} at masses equivalent to 0.5, 1, and 2 times the target concentration (TC). {describematerials and spiking techniques}
Table 2.4.1Digestion Efficiency for Insoluble Forms of {analyte} from {sampler}
digestion efficiency (%)chemical
compoundgravimetric
factor ×TCmass
digested (µg) 1 2 3 4 mean
chemical 1 0.683 0.5 17.6 93.5 92.4 89.9 94.5 92.61 35.1 92.9 94.9 95 97.6 95.12 70.3 90.4 96.1 96.3 95.9 94.7
ave 94.1
chemical 2 0.982 0.5 12.2 99.4 97.6 95.9 100.3 98.31 24.4 98.9 96.9 99.2 98.9 98.52 48.9 98.6 96.1 99.9 97.5 98
ave 98.3
chemical 3 0.641 0.5 18.7 89.4 88.4 88.1 88.8 88.71 37.4 90.6 85.9 86.6 85.6 87.22 74.9 91.1 89.9 84.1 82.3 86.9
ave 87.6The gravimetric factor is the decimal equivalent of the percent of the analyzed element in the tested compound.
Soluble forms
The digestion efficiency of a soluble form of {analyte} from {sampler} was determined byliquid-spiking {sampler} with the analyte diluted with {acid matrix} at the RQL, 0.5, 1, and 2 timesthe target concentration. {describe materials and spiking techniques} The spiked samples were allstored overnight at ambient temperature and then analyzed. The mean digestion efficiency over theworking range of 0.5 to 2 times the target concentration is %.
Support pads and cassette wipes
The digestion efficiency of soluble {analyte} from liquid-spiked support pads and from cassettewipes was determined at 10 times the RQL mass {or 0.1× the target concentration, whichever isless} and at 1 times the target concentration. {describe materials and spiking techniques} Thesamples were stored overnight at ambient temperature and then analyzed. The mean digestionefficiency from support pads was %, and it was % from cassette wipes.
Table 2.4.2Digestion Efficiency for Soluble Form of {analyte} from {sampler} (%)
levelmass spiked
(µg) 1 2 3 4 meanRQL 0.32 93.5 90.4 91.1 87.2 90.60.5× 19.2 94.7 96.4 97.2 98.7 96.81.0× 38.3 92.5 92.7 96.9 97.6 94.92.0× 76.6 99.1 99.8 99.6 100.3 99.7
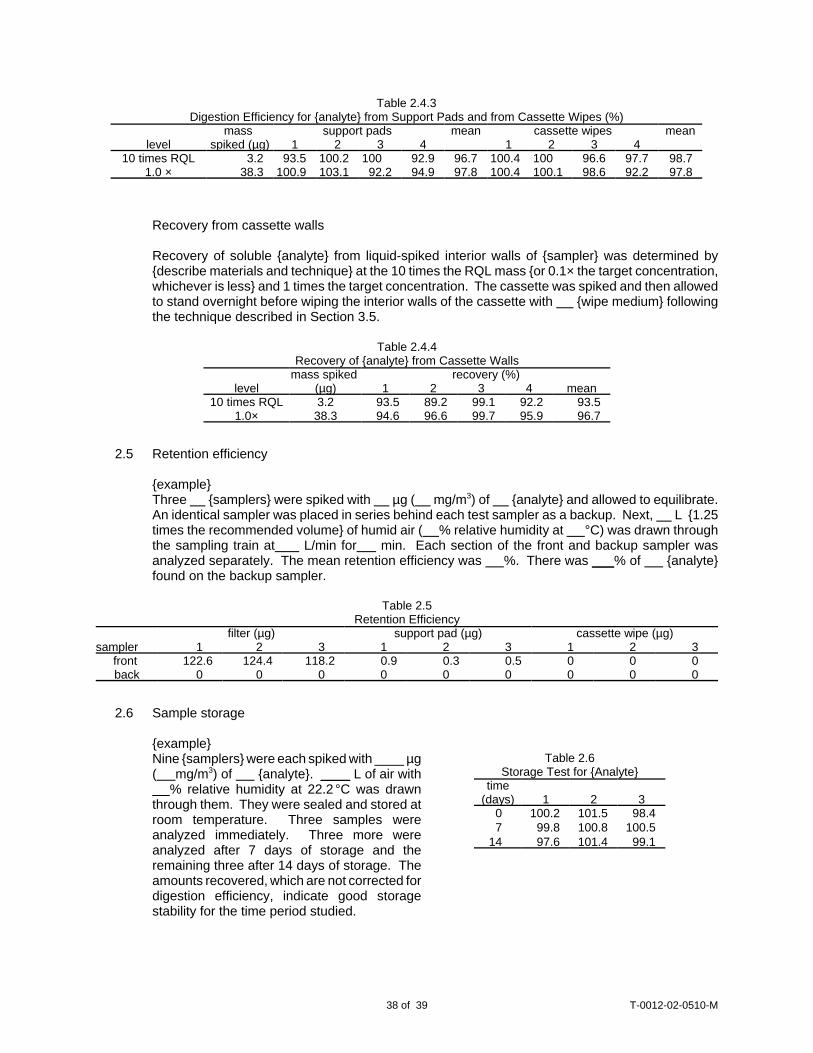
T-0012-02-0510-M38 of 39
Table 2.6Storage Test for {Analyte}
time(days) 1 2 3
0 100.2 101.5 98.47 99.8 100.8 100.5
14 97.6 101.4 99.1
Recovery from cassette walls
Recovery of soluble {analyte} from liquid-spiked interior walls of {sampler} was determined by{describe materials and technique} at the 10 times the RQL mass {or 0.1× the target concentration,whichever is less} and 1 times the target concentration. The cassette was spiked and then allowedto stand overnight before wiping the interior walls of the cassette with {wipe medium} followingthe technique described in Section 3.5.
2.5 Retention efficiency
{example}Three {samplers} were spiked with µg ( mg/m3) of {analyte} and allowed to equilibrate.An identical sampler was placed in series behind each test sampler as a backup. Next, L {1.25times the recommended volume} of humid air ( % relative humidity at °C) was drawn throughthe sampling train at L/min for min. Each section of the front and backup sampler wasanalyzed separately. The mean retention efficiency was %. There was ___% of {analyte}found on the backup sampler.
2.6 Sample storage
{example}Nine {samplers} were each spiked with ____ µg( mg/m3) of {analyte}. ____ L of air with % relative humidity at 22.2 °C was drawnthrough them. They were sealed and stored atroom temperature. Three samples wereanalyzed immediately. Three more wereanalyzed after 7 days of storage and theremaining three after 14 days of storage. Theamounts recovered, which are not corrected fordigestion efficiency, indicate good storagestability for the time period studied.
Table 2.4.3Digestion Efficiency for {analyte} from Support Pads and from Cassette Wipes (%)
mass support pads mean cassette wipes meanlevel spiked (µg) 1 2 3 4 1 2 3 4
10 times RQL 3.2 93.5 100.2 100 92.9 96.7 100.4 100 96.6 97.7 98.71.0 × 38.3 100.9 103.1 92.2 94.9 97.8 100.4 100.1 98.6 92.2 97.8
Table 2.4.4Recovery of {analyte} from Cassette Walls
mass spiked recovery (%)level (µg) 1 2 3 4 mean
10 times RQL 3.2 93.5 89.2 99.1 92.2 93.51.0× 38.3 94.6 96.6 99.7 95.9 96.7
Table 2.5Retention Efficiency
filter (µg) support pad (µg) cassette wipe (µg)sampler 1 2 3 1 2 3 1 2 3
front 122.6 124.4 118.2 0.9 0.3 0.5 0 0 0back 0 0 0 0 0 0 0 0 0

14 Occupational Exposure to Hazardous Chemicals in Laboratories. Code of Federal Regulations, Part 1910.1450, Title29, 1998.
T-0012-02-0510-M39 of 39
2.7 Recommended air volume and sampling rate. {example}Based on the data collected in this evaluation, -L air samples should be collected at a samplingrate of L/min.
3. Analytical Procedure {Refer to cited sections of format for Evaluated Methods for detail. Use paragraphsinstead of using tertiary subsections}
Adhere to the rules set down in your Chemical Hygiene Plan14. Avoid skin contact and inhalation of allchemicals.
3.1 Apparatus {Section 3.1, page 22}
3.2 Reagents {Section 3.2, page 22}
3.3 Standard preparation {Section 3.3, page 23}
3.4 Sample preparation {Section 3.4, page 23}
3.5 Analysis {Section 3.5, page 24}
3.6 Interferences (analytical) {Section 3.6, page 25}
3.7 Calculations {Section 3.7, page 25}
4. Recommendations for Further Study
Cite sampling and analytical parameters that should receive more study.
III. Studies - Report studies using the following format:
1. Introduction (include purpose) 2. Experimental 3. Results and Discussion 4. References
Related Documents