Evaluation Briefing Paper: Community Resilience to Acute Malnutrition Programme in Chad

Welcome message from author
This document is posted to help you gain knowledge. Please leave a comment to let me know what you think about it! Share it to your friends and learn new things together.
Transcript
Evaluation Briefing Paper: Community Resilience to Acute Malnutrition Programme in Chad

CRAM EVALUATION BRIEF 2
INTRODUCTION
In 2012, Concern Worldwide, initiated its Community Resilience to Acute Malnutrition (CRAM) programme in the Sila Region of Eastern Chad. The overall goal of the programme was to improve the nutrition of young children and build community resilience to the shocks and stresses causing poor nutrition and health in Goz Beida. The programme was designed to do this by: supporting delivery of essential health and nutrition services; increasing access to clean water and latrines; promoting uptake of climate smart agriculture; and promoting essential hygiene, health and nutrition behaviours and gender equality. It also introduced an early warning component to provide early response to signs of drought. The CRAM programme was planned as a three-year pilot implemented in 35 settlements in the sub-prefecture of Goz Beida. A robust impact evaluation was designed and led by the Feinstein International Centre at Tufts University’s Freidman School of Nutrition Science and Policy.
This briefing paper draws from the final evaluation report of the CRAM programme as well as an internal Concern project evaluation.1 Findings are presented in relation to several key indicators.
CONTEXT
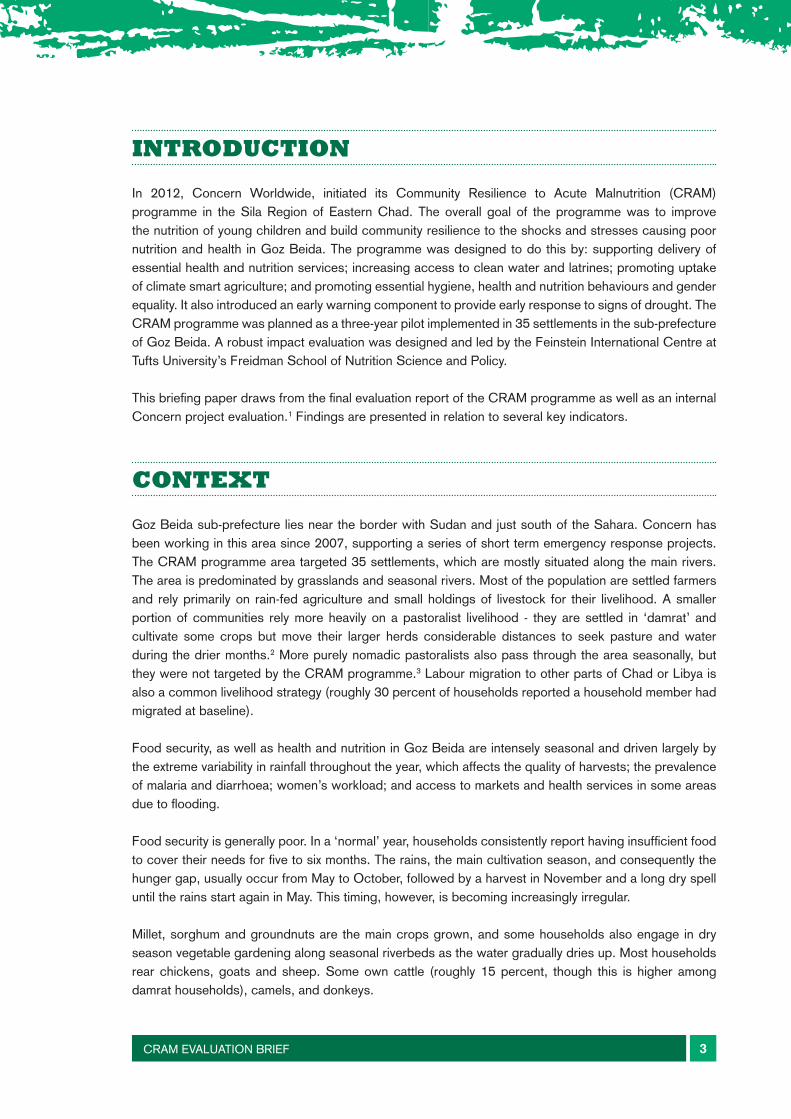
Goz Beida sub-prefecture lies near the border with Sudan and just south of the Sahara. Concern has been working in this area since 2007, supporting a series of short term emergency response projects. The CRAM programme area targeted 35 settlements, which are mostly situated along the main rivers. The area is predominated by grasslands and seasonal rivers. Most of the population are settled farmers and rely primarily on rain-fed agriculture and small holdings of livestock for their livelihood. A smaller portion of communities rely more heavily on a pastoralist livelihood - they are settled in ‘damrat’ and cultivate some crops but move their larger herds considerable distances to seek pasture and water during the drier months.2 More purely nomadic pastoralists also pass through the area seasonally, but they were not targeted by the CRAM programme.3 Labour migration to other parts of Chad or Libya is also a common livelihood strategy (roughly 30 percent of households reported a household member had migrated at baseline).
Food security, as well as health and nutrition in Goz Beida are intensely seasonal and driven largely by the extreme variability in rainfall throughout the year, which affects the quality of harvests; the prevalence of malaria and diarrhoea; women’s workload; and access to markets and health services in some areas due to flooding.
Food security is generally poor. In a ‘normal’ year, households consistently report having insufficient food to cover their needs for five to six months. The rains, the main cultivation season, and consequently the hunger gap, usually occur from May to October, followed by a harvest in November and a long dry spell until the rains start again in May. This timing, however, is becoming increasingly irregular.
Millet, sorghum and groundnuts are the main crops grown, and some households also engage in dry season vegetable gardening along seasonal riverbeds as the water gradually dries up. Most households rear chickens, goats and sheep. Some own cattle (roughly 15 percent, though this is higher among damrat households), camels, and donkeys.
CRAM EVALUATION BRIEF 3
Map showing programme area
Access to water and sanitation services was very low before CRAM started (see baseline figures below) but is gradually improving. The existing government infrastructure for health and nutrition services is very weak, and Concern supports the four health centres in the sub-prefecture. Exclusive breastfeeding rates for Chad are some of the lowest in the world at less than 4 percent nationally. Child diet diversity is also consistently low. Levels of acute and chronic malnutrition are high. Regular surveys show that more than a third of all children under five in the area are stunted, roughly 15 percent are wasted (even post-harvest) and 3 percent suffer from severe acute malnutrition.4
CRAM EVALUATION BRIEF 4
THE CRAM PROGRAMME
The CRAM programme targeted roughly 4,000 households living in 35 settlements (31 settled villages and four damrat) and ran from mid-2012 to December 2015. The programme provided technical and material support to government health teams to deliver the basic package of child and maternal health and nutrition services - including the management of acute malnutrition - at four static health facilities and 16 outreach sites. Boreholes were dug in 14 of the 35 CRAM villages. Meanwhile, the rehabilitation of existing boreholes occurred in the remaining 21 settlements as the need arose.
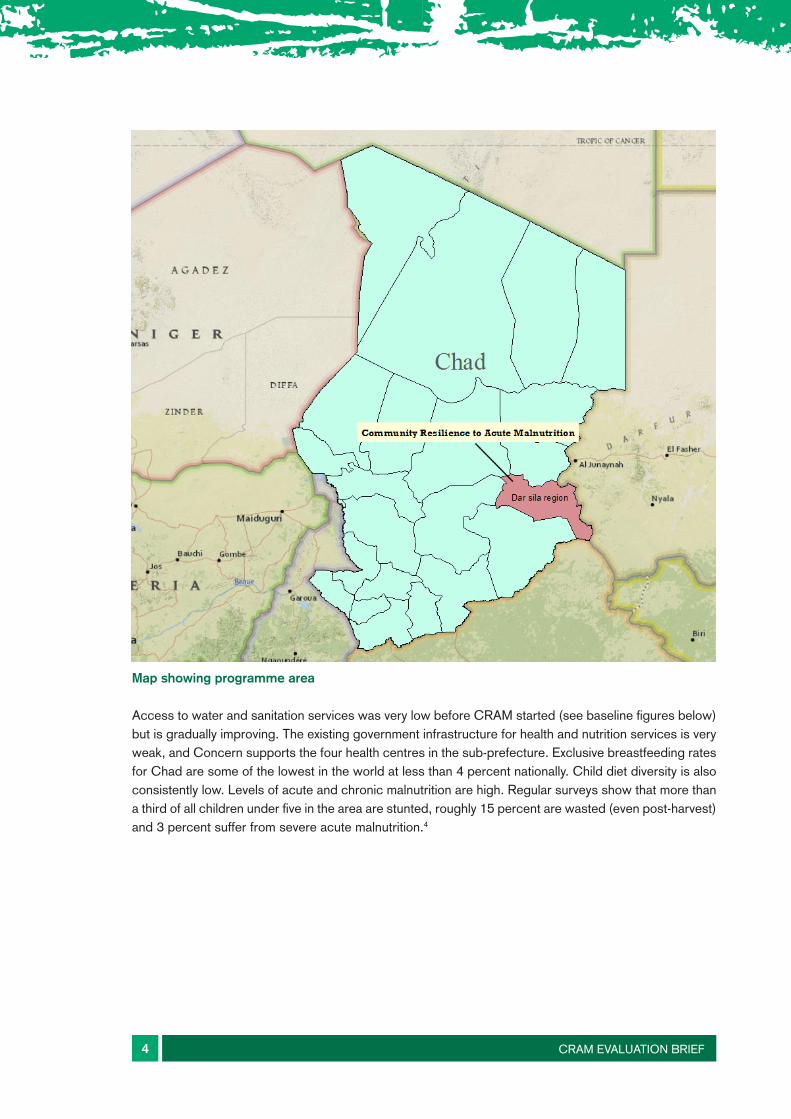
Figure 1: Community Resilience to Acute Malnutrition conceptual model
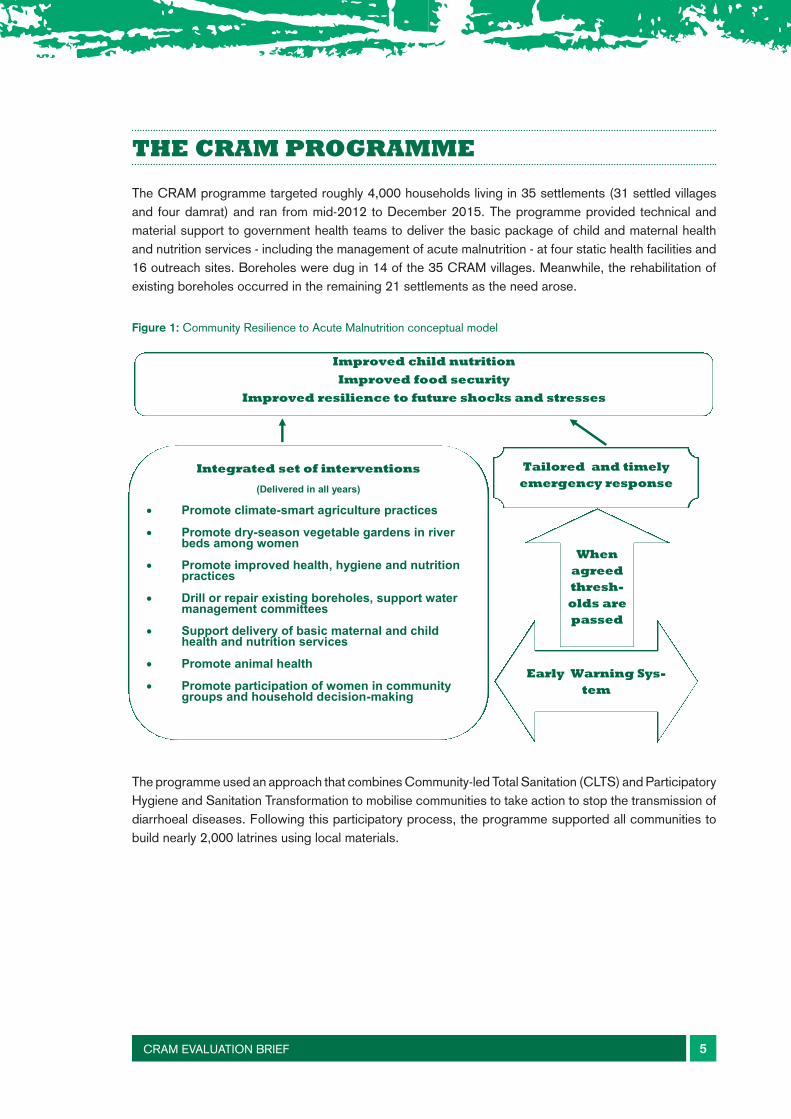
The programme used an approach that combines Community-led Total Sanitation (CLTS) and Participatory Hygiene and Sanitation Transformation to mobilise communities to take action to stop the transmission of diarrhoeal diseases. Following this participatory process, the programme supported all communities to build nearly 2,000 latrines using local materials.
CRAM EVALUATION BRIEF 5
CRAM EVALUATION BRIEF 3
The CRAM programme
The CRAM programme targeted roughly 4,000 households living in 35 settlements (31 settled vil-lages and four damrat) and ran from mid-2012 to December 2015. The programme provided tech-nical and material support to government health teams to deliver the basic package of child and maternal health and nutrition services – including the management of acute malnutrition – at four static health facilities and 16 outreach sites. Boreholes were dug in 14 of the 35 CRAM villages. Meanwhile, the rehabilitation of existing boreholes occurred in the remaining 21 settlements as the need arose.
Figure 1: Community Resilience to Acute Malnutrition conceptual model
The programme used an approach that combines Community-led Total Sanitation (CLTS) and Participatory Hygiene and Sanitation Transformation to mobilise communities to take action to stop the transmission of diarrhoeal diseases. Following this participatory process, the programme supported all communities to build nearly 2,000 latrines using local materials.
Improved child nutrition
Improved food security
Improved resilience to future shocks and stresses
Integrated set of interventions
(Delivered in all years)
Promote climate-smart agriculture practices
Promote dry-season vegetable gardens in river beds among women
Promote improved health, hygiene and nutrition practices
Drill or repair existing boreholes, support water management committees
Support delivery of basic maternal and child health and nutrition services
Promote animal health
Promote participation of women in community groups and household decision-making
Tailored and timely emergency response
When agreed thresh-olds are passed
Early Warning Sys-tem
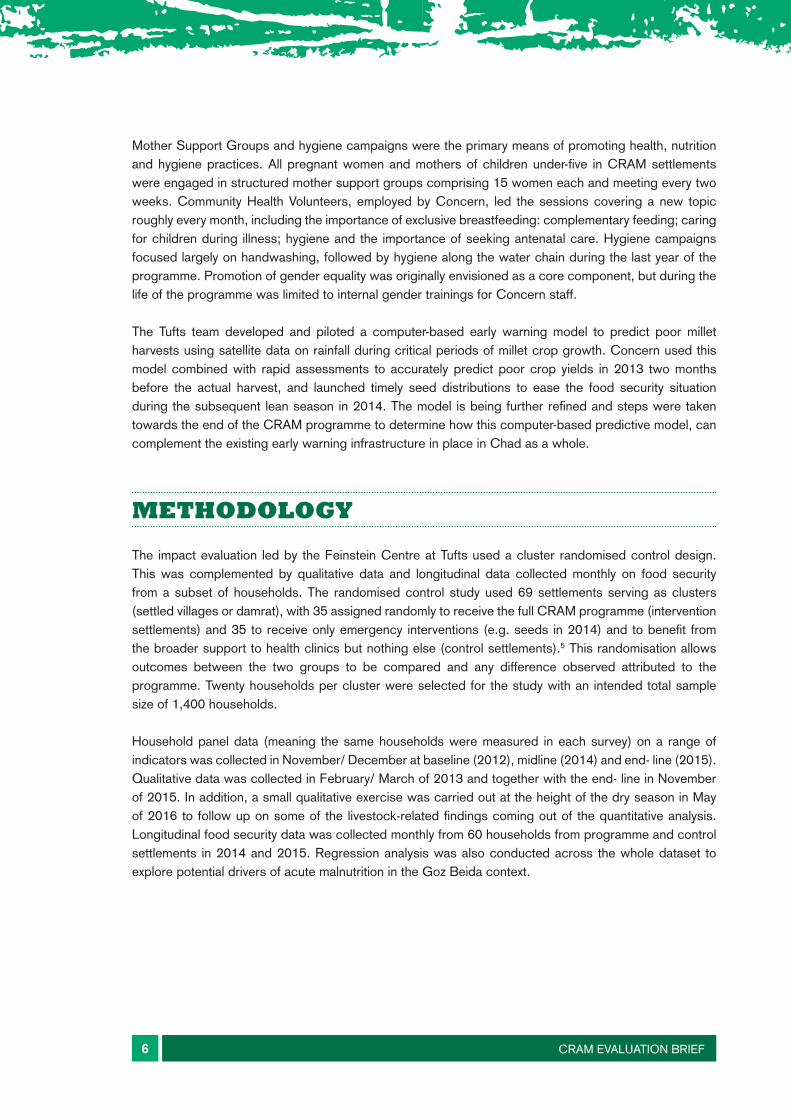
Mother Support Groups and hygiene campaigns were the primary means of promoting health, nutrition and hygiene practices. All pregnant women and mothers of children under-five in CRAM settlements were engaged in structured mother support groups comprising 15 women each and meeting every two weeks. Community Health Volunteers, employed by Concern, led the sessions covering a new topic roughly every month, including the importance of exclusive breastfeeding: complementary feeding; caring for children during illness; hygiene and the importance of seeking antenatal care. Hygiene campaigns focused largely on handwashing, followed by hygiene along the water chain during the last year of the programme. Promotion of gender equality was originally envisioned as a core component, but during the life of the programme was limited to internal gender trainings for Concern staff.
The Tufts team developed and piloted a computer-based early warning model to predict poor millet harvests using satellite data on rainfall during critical periods of millet crop growth. Concern used this model combined with rapid assessments to accurately predict poor crop yields in 2013 two months before the actual harvest, and launched timely seed distributions to ease the food security situation during the subsequent lean season in 2014. The model is being further refined and steps were taken towards the end of the CRAM programme to determine how this computer-based predictive model, can complement the existing early warning infrastructure in place in Chad as a whole.
METHODOLOGY
The impact evaluation led by the Feinstein Centre at Tufts used a cluster randomised control design. This was complemented by qualitative data and longitudinal data collected monthly on food security from a subset of households. The randomised control study used 69 settlements serving as clusters (settled villages or damrat), with 35 assigned randomly to receive the full CRAM programme (intervention settlements) and 35 to receive only emergency interventions (e.g. seeds in 2014) and to benefit from the broader support to health clinics but nothing else (control settlements).5 This randomisation allows outcomes between the two groups to be compared and any difference observed attributed to the programme. Twenty households per cluster were selected for the study with an intended total sample size of 1,400 households.
Household panel data (meaning the same households were measured in each survey) on a range of indicators was collected in November/ December at baseline (2012), midline (2014) and end- line (2015). Qualitative data was collected in February/ March of 2013 and together with the end- line in November of 2015. In addition, a small qualitative exercise was carried out at the height of the dry season in May of 2016 to follow up on some of the livestock-related findings coming out of the quantitative analysis. Longitudinal food security data was collected monthly from 60 households from programme and control settlements in 2014 and 2015. Regression analysis was also conducted across the whole dataset to explore potential drivers of acute malnutrition in the Goz Beida context.
CRAM EVALUATION BRIEF 6
KEY FINDINGS
IMPACT ON ACUTE AND CHRONIC MALNUTRITION
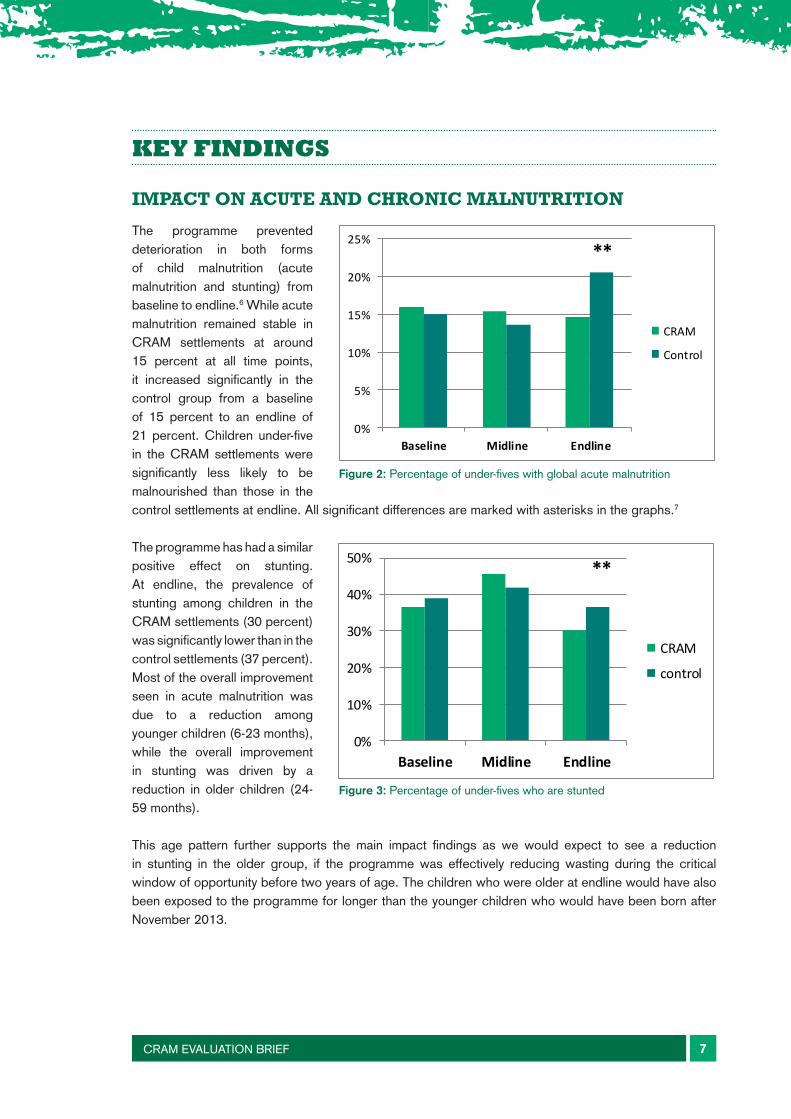
The programme prevented deterioration in both forms of child malnutrition (acute malnutrition and stunting) from baseline to endline.6 While acute malnutrition remained stable in CRAM settlements at around 15 percent at all time points, it increased significantly in the control group from a baseline of 15 percent to an endline of 21 percent. Children under-five in the CRAM settlements were significantly less likely to be malnourished than those in the control settlements at endline. All significant differences are marked with asterisks in the graphs.7
The programme has had a similar positive effect on stunting. At endline, the prevalence of stunting among children in the CRAM settlements (30 percent) was significantly lower than in the control settlements (37 percent). Most of the overall improvement seen in acute malnutrition was due to a reduction among younger children (6-23 months), while the overall improvement in stunting was driven by a reduction in older children (24-59 months).
This age pattern further supports the main impact findings as we would expect to see a reduction in stunting in the older group, if the programme was effectively reducing wasting during the critical window of opportunity before two years of age. The children who were older at endline would have also been exposed to the programme for longer than the younger children who would have been born after November 2013.
CRAM EVALUATION BRIEF 7 CRAM EVALUATION BRIEF 5
Key findings
Impact on acute and chronic malnutrition
The programme prevented deteri-oration in both forms of child mal-nutrition (acute malnutrition and stunting) from baseline to endline.6 While acute malnutrition remained stable in CRAM settlements at around 15 percent at all time points, it increased significantly in the control group from a baseline of 15 percent to an endline of 21 percent. Children under-five in the CRAM settlements were signifi-cantly less likely to be malnour-ished than those in the control set-
tlements at endline. All significant differences are marked with aster-
isks in the graphs.7
The programme has had a similar positive effect on stunting. At end-line, the prevalence of stunting among children in the CRAM set-tlements (30 percent) was signifi-cantly lower than in the control settlements (37 percent). Most of the overall improvement seen in acute malnutrition was due to a reduction among younger children (6-23 months), while the overall improvement in stunting was driv-en by a reduction in older children (24-59 months).
This age pattern further supports the main impact findings as we would expect to see a reduction in stunting in the older group, if the programme was effectively reducing wasting during the critical window of opportunity before two years of age. The children who were older at endline would have also been exposed to the programme for longer than the younger children who would have been born after November 2013.
Figure 2: Percentage of under-fives with global acute malnutrition
Figure 3: Percentage of under-fives who are stunted
0%
5%
10%
15%
20%
25%
Baseline Midline Endline
CRAM
Control
**
0%
10%
20%
30%
40%
50%
Baseline Midline Endline
CRAM
control
**
CRAM EVALUATION BRIEF 5
Key findings
Impact on acute and chronic malnutrition
The programme prevented deteri-oration in both forms of child mal-nutrition (acute malnutrition and stunting) from baseline to endline.6 While acute malnutrition remained stable in CRAM settlements at around 15 percent at all time points, it increased significantly in the control group from a baseline of 15 percent to an endline of 21 percent. Children under-five in the CRAM settlements were signifi-cantly less likely to be malnour-ished than those in the control set-
tlements at endline. All significant differences are marked with aster-
isks in the graphs.7
The programme has had a similar positive effect on stunting. At end-line, the prevalence of stunting among children in the CRAM set-tlements (30 percent) was signifi-cantly lower than in the control settlements (37 percent). Most of the overall improvement seen in acute malnutrition was due to a reduction among younger children (6-23 months), while the overall improvement in stunting was driv-en by a reduction in older children (24-59 months).
This age pattern further supports the main impact findings as we would expect to see a reduction in stunting in the older group, if the programme was effectively reducing wasting during the critical window of opportunity before two years of age. The children who were older at endline would have also been exposed to the programme for longer than the younger children who would have been born after November 2013.
Figure 2: Percentage of under-fives with global acute malnutrition
Figure 3: Percentage of under-fives who are stunted
0%
5%
10%
15%
20%
25%
Baseline Midline Endline
CRAM
Control
**
0%
10%
20%
30%
40%
50%
Baseline Midline Endline
CRAM
control
**
Figure 2: Percentage of under-fives with global acute malnutrition
Figure 3: Percentage of under-fives who are stunted
CRAM EVALUATION BRIEF 8
IMPACT ON THE PREVALENCE OF CHILD ILLNESS
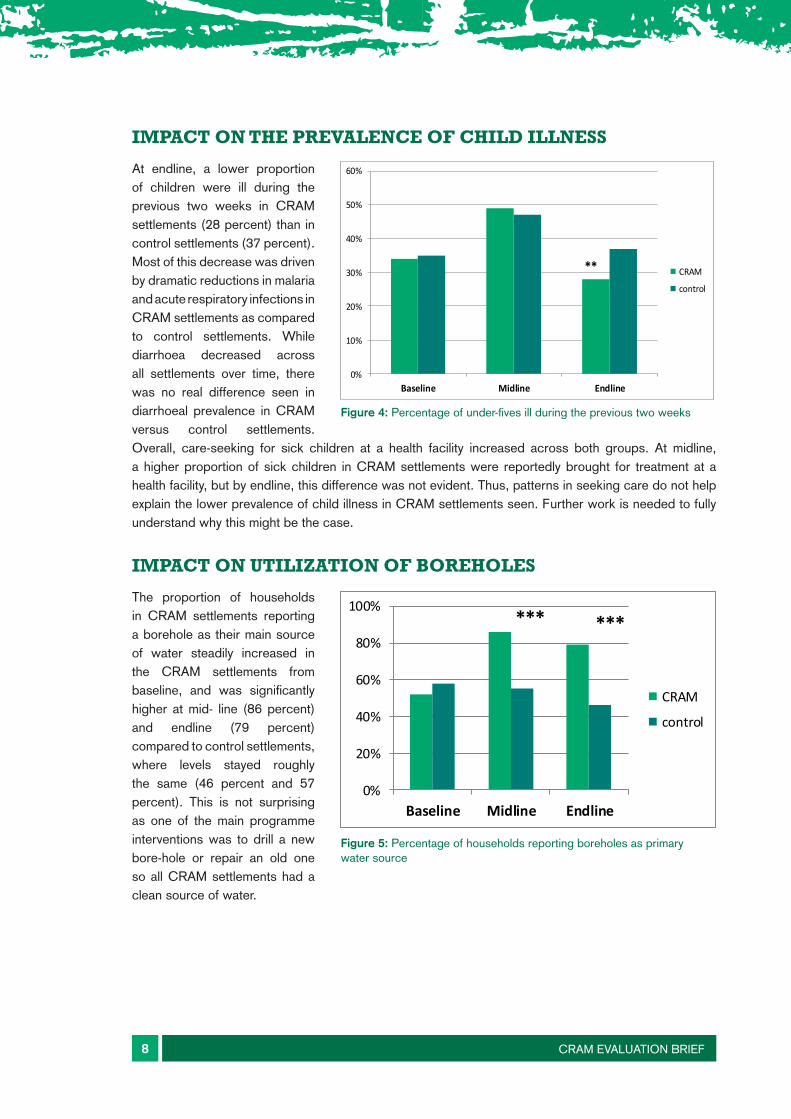
At endline, a lower proportion of children were ill during the previous two weeks in CRAM settlements (28 percent) than in control settlements (37 percent). Most of this decrease was driven by dramatic reductions in malaria and acute respiratory infections in CRAM settlements as compared to control settlements. While diarrhoea decreased across all settlements over time, there was no real difference seen in diarrhoeal prevalence in CRAM versus control settlements. Overall, care-seeking for sick children at a health facility increased across both groups. At midline, a higher proportion of sick children in CRAM settlements were reportedly brought for treatment at a health facility, but by endline, this difference was not evident. Thus, patterns in seeking care do not help explain the lower prevalence of child illness in CRAM settlements seen. Further work is needed to fully understand why this might be the case.
IMPACT ON UTILIZATION OF BOREHOLES
The proportion of households in CRAM settlements reporting a borehole as their main source of water steadily increased in the CRAM settlements from baseline, and was significantly higher at mid- line (86 percent) and endline (79 percent) compared to control settlements, where levels stayed roughly the same (46 percent and 57 percent). This is not surprising as one of the main programme interventions was to drill a new bore-hole or repair an old one so all CRAM settlements had a clean source of water.
CRAM EVALUATION BRIEF 6
Impact on the prevalence of child illness
At endline, a lower proportion of children were ill during the previous two weeks in CRAM settlements (28 percent) than in control settlements (37 percent). Most of this decrease was driven by dramatic reductions in malaria and acute respiratory in-fections in CRAM settlements as compared to control settlements. While diarrhoea decreased across all settlements over time, there was no real difference seen in diarrhoeal prevalence in CRAM versus control settlements. Overall, care-seeking
for sick children at a health facility increased across both groups. At
midline, a higher proportion of sick children in CRAM settlements were reportedly brought for treatment at a health facility, but by endline, this difference was not evident. Thus, patterns in seeking care do not help explain the lower prevalence of child illness in CRAM settlements seen. Further work is needed to fully understand why this might be the case.
Impact on utilization of boreholes
The proportion of households in CRAM settlements reporting a borehole as their main source of water steadily increased in the CRAM settlements from baseline, and was significantly higher at mid-line (86 percent) and endline (79 percent) compared to control set-tlements, where levels stayed roughly the same (46 percent and 57 percent). This is not surprising as one of the main programme in-terventions was to drill a new bore-hole or repair an old one so all CRAM settlements had a clean source of water.
Figure 4: Percentage of under-fives ill during the previous two weeks
Figure 5: Percentage of households reporting boreholes as primary water source
0%
10%
20%
30%
40%
50%
60%
Baseline Midline Endline
CRAM
control
**
0%
20%
40%
60%
80%
100%
Baseline Midline Endline
CRAM
control
******
Figure 4: Percentage of under-fives ill during the previous two weeks
Figure 5: Percentage of households reporting boreholes as primary water source

CRAM EVALUATION BRIEF 9
IMPACT ON THE PRACTICE OF OPEN DEFECATION
The levels of open defecation in the control group were significantly higher than in the CRAM villages by midline and endline. While we would have hoped for a reduction in open defecation in CRAM settlements, the reported collapse of many latrines two years after being constructed likely explains this result. Concern has is now promoting a revised latrine design using local materials that is adapted to sandy soils. This should be a priority at the start of any similar programme, particularly one relying on the Community-Led Total Sanitation (CLTS) approach to trigger communities to build their own sanitation facilities. Future surveys will hopefully be able to assess the effect of this new approach.
CRAM EVALUATION BRIEF 7
Impact on the practice of open defecation
The levels of open defecation in the control group were significantly higher than in the CRAM villages by midline and endline. While we would have hoped for a reduction in open defecation in CRAM settle-ments, the reported collapse of many latrines two years after being constructed likely explains this re-sult. Concern has is now promoting a revised latrine design using local materials that is adapted to sandy soils. This should be a priority at the start of any similar programme, par-ticularly one relying on the Commu-nity–Led Total Sanitation (CLTS)
approach to trigger communities to build their own sanitation facilities. Future surveys will hopeful-ly be able to assess the effect of this new approach.
Figure 6: Percentage of households reporting they practice open defecation
Figure 7: Percentage of households with handwashing knowledge and practice
0%
10%
20%
30%
40%
50%
60%
70%
80%
Baseline Midline Endline
CRAM
Control
****
Figure 6: Percentage of households reporting they practice open defecation
Figure 7: Percentage of households with handwashing knowledge and practice
CRAM EVALUATION BRIEF 7
Impact on the practice of open defecation
The levels of open defecation in the control group were significantly higher than in the CRAM villages by midline and endline. While we would have hoped for a reduction in open defecation in CRAM settle-ments, the reported collapse of many latrines two years after being constructed likely explains this re-sult. Concern has is now promoting a revised latrine design using local materials that is adapted to sandy soils. This should be a priority at the start of any similar programme, par-ticularly one relying on the Commu-nity–Led Total Sanitation (CLTS)
approach to trigger communities to build their own sanitation facilities. Future surveys will hopeful-ly be able to assess the effect of this new approach.
Figure 6: Percentage of households reporting they practice open defecation
Figure 7: Percentage of households with handwashing knowledge and practice
0%
10%
20%
30%
40%
50%
60%
70%
80%
Baseline Midline Endline
CRAM
Control
****
IMPACT ON HANDWASHING PRACTICES
Knowledge of the two main times for handwashing (after defecation and before eating) was higher in the CRAM settlements by endline. However, evidence of improved practice - having an observable handwashing station with soap and water in the house, and demonstrating good technique to the survey team remained relatively static. This is a familiar problem in many programmes due to the multiple barriers to translating good knowledge into practice, including access to soap. The programme has adapted its messaging to focus on handwashing stations and promoting ash where soap is not available.
IMPACT ON HYGIENE OF WATER TRANSPORT AND STORAGE CONTAINERS
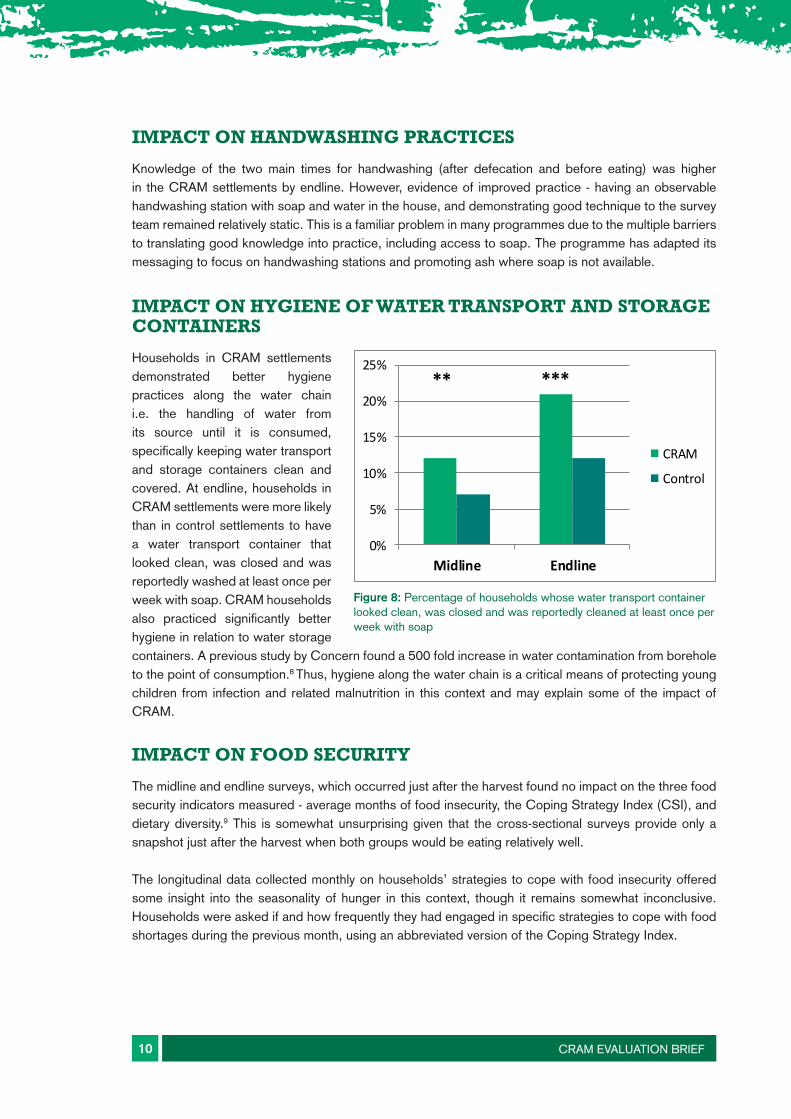
Households in CRAM settlements demonstrated better hygiene practices along the water chain i.e. the handling of water from its source until it is consumed, specifically keeping water transport and storage containers clean and covered. At endline, households in CRAM settlements were more likely than in control settlements to have a water transport container that looked clean, was closed and was reportedly washed at least once per week with soap. CRAM households also practiced significantly better hygiene in relation to water storage containers. A previous study by Concern found a 500 fold increase in water contamination from borehole to the point of consumption.8 Thus, hygiene along the water chain is a critical means of protecting young children from infection and related malnutrition in this context and may explain some of the impact of CRAM.
IMPACT ON FOOD SECURITY
The midline and endline surveys, which occurred just after the harvest found no impact on the three food security indicators measured - average months of food insecurity, the Coping Strategy Index (CSI), and dietary diversity.9 This is somewhat unsurprising given that the cross-sectional surveys provide only a snapshot just after the harvest when both groups would be eating relatively well.
The longitudinal data collected monthly on households’ strategies to cope with food insecurity offered some insight into the seasonality of hunger in this context, though it remains somewhat inconclusive. Households were asked if and how frequently they had engaged in specific strategies to cope with food shortages during the previous month, using an abbreviated version of the Coping Strategy Index.
CRAM EVALUATION BRIEF 10
CRAM EVALUATION BRIEF 8
Impact on handwashing practices
Knowledge of the two main times for handwashing (after defecation and before eating) was high-er in the CRAM settlements by endline. However, evidence of improved practice – having an observable handwashing station with soap and water in the house, and demonstrating good technique to the survey team remained relatively static. This is a familiar problem in many programmes due to the multiple barriers to translating good knowledge into practice, including access to soap. The programme has adapted its messaging to focus on handwashing stations and promoting ash where soap is not available.
Impact on hygiene of water transport and storage con-tainers
Households in CRAM settlements demonstrated better hygiene prac-tices along the water chain i.e. the handling of water from its source until it is consumed, specifically keeping water transport and stor-age containers clean and covered. At endline, households in CRAM settlements were more likely than in control settlements to have a wa-ter transport container that looked clean, was closed and was report-edly washed at least once per week with soap. CRAM households also practiced significantly better hy-giene in relation to water storage
containers. A previous study by Concern found a 500 fold increase in water contamination from borehole to the point of consumption.8Thus, hygiene along the water chain is a critical means of protecting young children from infection and related malnutrition in this context and may explain some of CRAM’s impact.
Impact on food security
The midline and endline surveys, which occurred just after the harvest found no impact on the three food security indicators measured – average months of food insecurity, the Coping Strategy Index (CSI), and dietary diversity.9 This is somewhat unsurprising given that the cross-sectional surveys provide only a snapshot just after the harvest when both groups would be eating relative-ly well.
The longitudinal data collected monthly on households’ strategies to cope with food insecurity of-fered some insight into the seasonality of hunger in this context, though it remains somewhat in-conclusive. Households were asked if and how frequently they had engaged in specific strategies to cope with food shortages during the previous month, using an abbreviated version of the Cop-ing Strategy Index.
Figure 8: Percentage of households whose water transport contain-er looked clean, was closed and was reportedly cleaned at least once per week with soap
0%
5%
10%
15%
20%
25%
Midline Endline
CRAM
Control
** ***
Figure 8: Percentage of households whose water transport container looked clean, was closed and was reportedly cleaned at least once per week with soap

CRAM EVALUATION BRIEF 11
In 2014 (blue lines), the longitudinal CSI data showed clearly that CRAM improved the capacity of households to cope with food shortages during the peak of the hunger gap between June and August. In other words, the households from CRAM settlements employed fewer and/or less severe strategies during those months than the control group, and that difference was statistically significant. In 2015 (orange lines), however, the monthly data showed a much less conclusive pattern: CRAM settlements were better off in August according to the CSI but worse off than the control in May. Longitudinal food security data will continue to be collected and analysed until at least 2018, providing an opportunity to observe longer term trends.
Figure 9: Monthly food insecurity according to the Coping Strategy Index from a sample of the same 60 households each month: 2014 and 2015
CRAM EVALUATION BRIEF 9
In 2014 (blue lines), the longitudinal CSI data showed clearly that CRAM improved the capacity of households to cope with food shortages during the peak of the hunger gap between June and Au-gust. In other words, the households from CRAM settlements employed fewer and/or less severe strategies during those months than the control group, and that difference was statistically signifi-cant. In 2015 (orange lines), however, the monthly data showed a much less conclusive pattern: CRAM settlements were better off in August according to the CSI but worse off than the control in May. Longitudinal food security data will continue to be collected and analysed until at least 2018, providing an opportunity to observe longer term trends.
Figure 9: Monthly food insecurity according to the Coping Strategy Index from a sample of the same 60 house-holds each month: 2014 and 2015
DISCUSSION AND CONCLUSIONS
The main conclusions that can be drawn from the findings of the impact evaluation and the broader regression analysis exploring the potential drivers of malnutrition are outlined below.
An integrated, multi-sectoral programme such as CRAM has the potential to positively impact acute malnutrition and stunting in children.
CRAM’s ability to prevent an increase in acute malnutrition in programme settlements, while levels increased significantly in control settlements during the same period is a considerable achievement. The impact on stunting is also a somewhat striking result and offers hope for similarly challenging contexts in the Sahel and beyond. Despite this preventative effect, however, the level of acute malnutrition (15 percent) and stunting (30 percent) were still unacceptably high in CRAM settlements at endline. Clearly, more work - including practical research - is needed to understand the shocks and stresses driving malnutrition in this context and to refine the CRAM programme model for wider impact.
Boreholes and maintaining good hygiene along the water chain are critical to reducing the risk of child acute malnutrition and may have been central to CRAM’s impact.
While the impact study was not designed to identify which programme elements contributed most to CRAM’s impact (there were only two arms - those who received the full, integrated CRAM package and those that did not), the impact findings combined with the further regression analysis, show a clear link between access to a borehole, hygiene along the water chain and acute malnutrition.
The regression analysis showed that children in households reporting their primary source of drinking water was a borehole, were less likely to suffer from acute malnutrition than those who reported relying on water from another source. This was true for CRAM and control settlements as a whole, but most of the positive impact of borehole use on child nutrition was driven by CRAM settlements. This leads to the question: what is CRAM doing to help households better reap the advantages of clean water while those in control settlements are not?
There are two possible explanations for the above scenario. The first is that the quality of the boreholes in the control settlements is substandard, and therefore having a borehole does not equate to having clean water, and does not reduce the risk of contamination and malnutrition. It is difficult to test this theory since the evaluation team did not systematically test borehole water quality in CRAM versus control settlements.
The second possible explanation is that households in the CRAM settlements are better at protecting their water as they transport it to and store it in their homes. Given that the impact evaluation showed clearly that households in CRAM settlements had better hygiene along the water chain (specifically, having water and storage containers that were visibly cleaner and more often covered and reportedly washed with soap) than control villages, this is likely to be one of the critical factors leading to improved nutrition in CRAM households.
CRAM EVALUATION BRIEF 12
Therefore having a borehole alone is not sufficient to prevent acute malnutrition, and the positive impact of the CRAM programme is likely due to either CRAM households starting out with better quality borehole water or to practicing better hygiene along the water chain that limits further contamination, or a combination of both. In other words, in the Goz Beida context, a household must start with clean water and through interventions as seen in the CRAM programme be supported to maintain good hygiene along the water chain in order to protect a child from acute malnutrition. While this seems a basic tenet of good health, the CRAM research underscores the importance of promoting these very specific hygiene behaviours, in addition to supporting communities to access clean water in the first place.
It is also important to note that handwashing, open defecation and food security do not seem to have contributed significantly to CRAM impact as they were not identified as a significant predictor of child wasting in the regression analysis. However, despite the extensive data collected there are likely to be many pathways and relationships that the study was not able to capture but could be explored in the future.
Livestock has both a positive and negative influence on child nutrition
The relationship between livestock and nutrition is complex. Obviously, livestock make an important contribution to livelihoods and, by extension, food security. However, they also might pose a significant risk of infection and subsequent malnutrition. This was seen in the regression analysis which showed that children in villages with an overall high concentration of cattle were at a higher risk of malnutrition.
However, there was one striking exception to this finding: children coming from the more pastoralist damrat communities which naturally have larger livestock holdings did not face the same elevated risk of acute malnutrition. In fact, households living in a damrat were significantly less likely to have a sick or stunted or wasted child than their settled farming neighbours. The key to this difference may lie in how damrat residents have traditionally managed their livestock. For example, damrat households tend to keep most of their cattle outside of their settlement - taking them much further, and for much longer periods of time to distant grazing areas and water sources. This practice may be reducing the actual risk of contamination within the settlement itself.
Further exploration is needed as there may be other characteristics of damrat, and the people who live there, that are driving this relationship. This finding suggests, however, that we may have much to learn from the livestock management practices undertaken in these pastoralist communities that could help further reduce malnutrition. One hypothesis, in particular, has emerged that is worth pursuing in future research. Cryptosporidium (the C. parvum type, specifically) is a relatively widespread water-borne pathogen and is one of the few than can affect both humans and cattle. Cryptosporidium can cause diarrhoeal disease and longer term environmental enteropathy (long term damage to the intestinal lining), both of which have been linked to child malnutrition. It is posited, therefore, that infection of children by the strain of Cryptosporidian common in cattle may in fact play a role in the links between cattle, water and malnutrition, but more research is needed.
CRAM EVALUATION BRIEF 13
The community level promotion of preventative health and nutrition practices may have played an important role in programme impact.
CRAM’s ability to reduce the prevalence of malaria and acute respiratory infections - two leading childhood killers - is extremely positive in its own right but also provides insight into how CRAM was able to prevent increases in malnutrition. The evaluation found no significant difference between CRAM and control settlements in the proportion of sick children brought for treatment or in terms of distance to a programme-supported health facility (according to distance on a map and reported travel time). This suggests that the lower prevalence of illness in CRAM settlements may be due more to improved preventative health and nutrition practices for children in CRAM households or a generally healthier environment in CRAM settlements. It is likely that CRAM’s community health component which promoted preventative health and nutrition practices through mothers support groups played an important role in this positive outcome, although this is difficult to confirm concretely.
As the CRAM programme model is refined and expanded, Concern and Tufts will share the lessons that emerge.
This brief captures the learning to date from the CRAM programme and the associated randomised control impact study that has now ended. However, Concern continues to expand and refine its CRAM programme model under its Building Resilience in Chad and Sudan (BRICS) programme supported by the UK government (2015 - 2017).10 Under the same programme, Tufts and Concern have continued their research partnership and have joined forces with the World Agroforesty Centre. As outlined above, the learning to date has led to some practical changes to the programme model. These include the testing and promotion of alternative latrine designs, as well as shifting the focus of handwashing campaigns to promote the practical installation of hand-washing stations. The findings have also underscored the importance of continued messaging on hygiene along the water chain and the value of the Mother Support Groups in promoting positive health and nutrition practices. Finally, Tufts and Concern will continue to explore the links between livestock and malnutrition, including practical methods to reduce the risk of infection along this pathway. Through the continued collection and analysis of longitudinal food security data, the programme hopes to better understand seasonal trends in this area. Concern and Tufts will continue to share learning from this work as it emerges, and we look forward to engaging with other actors working to promote resilience and nutrition in similar contexts.
CRAM EVALUATION BRIEF 14

ACKNOWLEDGEMENTS The CRAM programme was funded by Irish Aid and the European Union. It was also partially funded by the Department for International Development, under their support for the Building Resilience in Chad and Sudan programme. The views expressed do not necessarily reflect the funders’ official policies.
COVER IMAGE Yaya Maha Giriye with daughter Yassira Ousaman (2 years) who was diagnosed with severe malnutrition in Goz Beida Sub-prefecture, Sila region, Chad in 2014. Photo: Jennifer Nolan
FURTHER READING For those interested in reading more about Concern’s CRAM work in Chad, please see https:// www.concern.net/insights
REFERENCES AND CONTENT NOTES 1. Marshak, A., et al. 2016. Water, Livestock, Malnutrition: Findings from an Impact Assessment. http://
fic.tufts.edu/publication-item/water-livestock-and-malnutrition-findings-from-an-impact-assessment-of-community-resilience-to-acute-malnutrition-programming-in-the-dar-sila-region-of-eastern-chad- 2012/
2. Traditionally nomadic or pastoralist settlements, with a resident community that tends not to migrate with livestock (predominantly women, children, and older people), while other members of the community move seasonally with their herds. Damrat is plural.
3. Concern is currently exploring support to more nomadic pastoralists under its current programming.
4. CRAM baseline, midline, endline results (see graphs) and Concern/ UNICEF SMART Survey July 2012 for Sila: 16.3% GAM, 2.5% SAM and 36.4% stunted; DHS 2004: 13.5% GAM, 3.1% SAM and 40% stunted.
5. Originally 35 control settlements were randomly assigned, but one opted out at baseline
6. Acute malnutrition was defined as having a weight-for-height Z-score (WHZ) of < -2 and/or oedema, but there were no cases of oedema. Stunting was defined as having height-for-age Z-score (HAZ) of <-2.
7. A single asterisk (*) indicates a statistically significant difference at the 10% level, meaning there is a 10 % chance that the difference seen is due to error. ** is at the 5% level and *** is at the 1 % level.
8. See Bauby & Flachenberg. Achieving Sustainability: linking CLTS with other approaches. WEDC 2014. http://wedc.lboro.ac.uk/resources/conference/37/Bauby-1963.pdf
9. Maxwell D and Caldwell.2008. The Coping Strategy Index Field Methods Manual. CARE, Tango, et al.
10. This intervention is part of the wider Building Resilience and Adaptation to Climate Extremes (BRACED) programme. For more details see http://www.braced.org/
CRAM EVALUATION BRIEF 15

PUBLISHED BY CONCERN WORLDWIDE
© Concern Worldwide 2017
Concern Worldwide encourages printing or copying information exclusively for personal and non-commercial use provided that the source is clearly acknowledged.
CONCERN WORLDWIDE Working with the world’s poorest people to transform their lives
www.concern.net
www.concern.net
Republic of Ireland 52-55 Lower Camden Street, Dublin 2 00 353 1 417 77 00 [email protected]
Northern Ireland 47 Frederick Street Belfast, BT1 2LW 00 44 28 9033 1100 [email protected]
England and Wales 13/14 Calico House Clove Hitch Quay London, SW11 3TN 00 44 207 801 1850 [email protected]
Republic of Korea Chunji Building, 2F, 374 1 Seogyo-dong, Mapo-Gu Seoul, 121 894 T 00 82 324 3900 W www.concern.kr
USA 355 Lexington Avenue 19th Floor New York, NY 10017 00 1 212 5578 000 [email protected]
Related Documents