Draft Final Report April 2005 EVALUATING THICK LIFT LIMEROCK-BASE COURSE SR-826 MIAMI FLORIDA FDOT No: C-7984 UF No: 00030917 Research Team: Dr.Sastry Putcha, Project Manager, State Construction Office Robert Werner, P.E., Project Administrator, Ardaman and Associates, Inc Dr. Michael C. McVay, Principal Investigator, University of Florida Dr.David Horhota, State Geotechnical Materials Engineer Tim Ruelke, P.E., District-2 Construction Engineer Jack Banning, President, Florida Limerock&Aggregate Institute Ron Wettlaufer, Compaction Sales Consultant, Nortrax Equipment Company Report By: Dr. Michael C. McVay, Principal Investigator, University of Florida Jeongsoo Ko, Researcher, University of Florida

Welcome message from author
This document is posted to help you gain knowledge. Please leave a comment to let me know what you think about it! Share it to your friends and learn new things together.
Transcript
Draft Final Report April 2005
EVALUATING THICK LIFT LIMEROCK-BASE COURSE SR-826 MIAMI FLORIDA
FDOT No: C-7984 UF No: 00030917
Research Team:
Dr.Sastry Putcha, Project Manager, State Construction Office
Robert Werner, P.E., Project Administrator, Ardaman and Associates, Inc Dr. Michael C. McVay, Principal Investigator, University of Florida
Dr.David Horhota, State Geotechnical Materials Engineer Tim Ruelke, P.E., District-2 Construction Engineer
Jack Banning, President, Florida Limerock&Aggregate Institute Ron Wettlaufer, Compaction Sales Consultant, Nortrax Equipment Company
Report By:
Dr. Michael C. McVay, Principal Investigator, University of Florida Jeongsoo Ko, Researcher, University of Florida
TABLE OF CONTENTS page
LIST OF TABLES............................................................................................................. iv
LIST OF FIGURES .............................................................................................................v
SUMMARY...................................................................................................................... vii
CHAPTER
1 INTRODUCTION ........................................................................................................1
1.1. General...................................................................................................................1
1.2. Objective................................................................................................................2
1.3. Scope......................................................................................................................3
1.3.1. Task 1 ..........................................................................................................4
1.3.2. Task 2 ..........................................................................................................5
1.3.3. Task 3 ..........................................................................................................5
2 COMPACTION BACKGROUND...............................................................................6
2.1. Field Vibratory Compaction ..................................................................................6
2.2. Strength, Moisture Content and Compactive Effort ..............................................8
2.3. Intelligent Compaction ........................................................................................12
3 TEST SITE AND INSTRUMENTATION ................................................................15
3.1. Materials, Site Layout, and Equipment ...............................................................15
3.2. Embedded Instrumentation..................................................................................18
3.2.1. Accelerometers ..........................................................................................19
3.2.2. Strain Sensor LVDTs ................................................................................19
3.2.3. Stress Cells ................................................................................................19
4 RESULTS AND DISCUSSION.................................................................................23
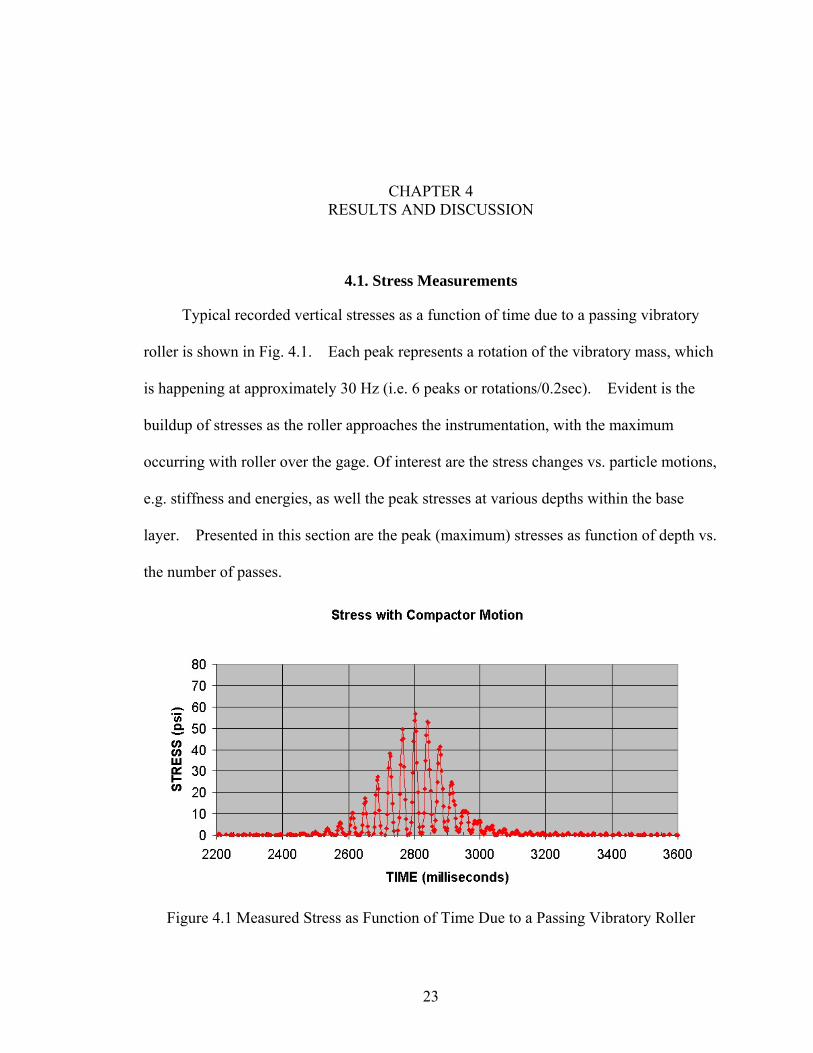
4.1. Stress Measurements ...........................................................................................23
4.2. Compactive Energy .............................................................................................26
4.3. Vertical Strains and Densities..............................................................................30
4.4. Dry Densities and Moisture Contents..................................................................36
4.5. Base Stiffness.......................................................................................................38
4.6. Base Strength .......................................................................................................44
ii

5 CONCLUSION AND RECOMMANDATIONS.......................................................49
5.1. Conclusions..........................................................................................................49
5.2. Recommendations for Future Testing .................................................................52
6 ACKNOWLEDGEMENT..........................................................................................53
APPENDIX
A SIEVE ANALYSES ...................................................................................................54
B MOISTURE CONTENTS FROM NUCLEAR DENSITY PROBE..........................65
C LAB OVEN-DRIED MOISTURE CONTENTS .......................................................69
D INSTRUMENTATION DATA REDUCTION..........................................................71
D.1. Calculation for reducing data..............................................................................72
D.1.1. Stress Cell .................................................................................................72
D.1.2. Strain Sensors ...........................................................................................72
D.1.3. Acceleration..............................................................................................73
D.1.4. Velocity & Displacement from Acceleration Data...................................73
D.1.5. Dynamic Stiffness.....................................................................................73
D.2. Using worksheet after 3 passes with vibratory padfoot roller in Section 2 ........74
D.2.1. Raw Data ..................................................................................................74
D.2.2. Reduced Data............................................................................................75
E SSG RESULTS...........................................................................................................79
F FWD RESULTS .........................................................................................................82
G ADCP RESULTS .......................................................................................................86
LIST OF REFERENCES...................................................................................................92
iii
LIST OF TABLES
Table page Table 4.1 Measured Dry Densities from Nuclear Density Probe (NDP) within Section
1................................................................................................................................33
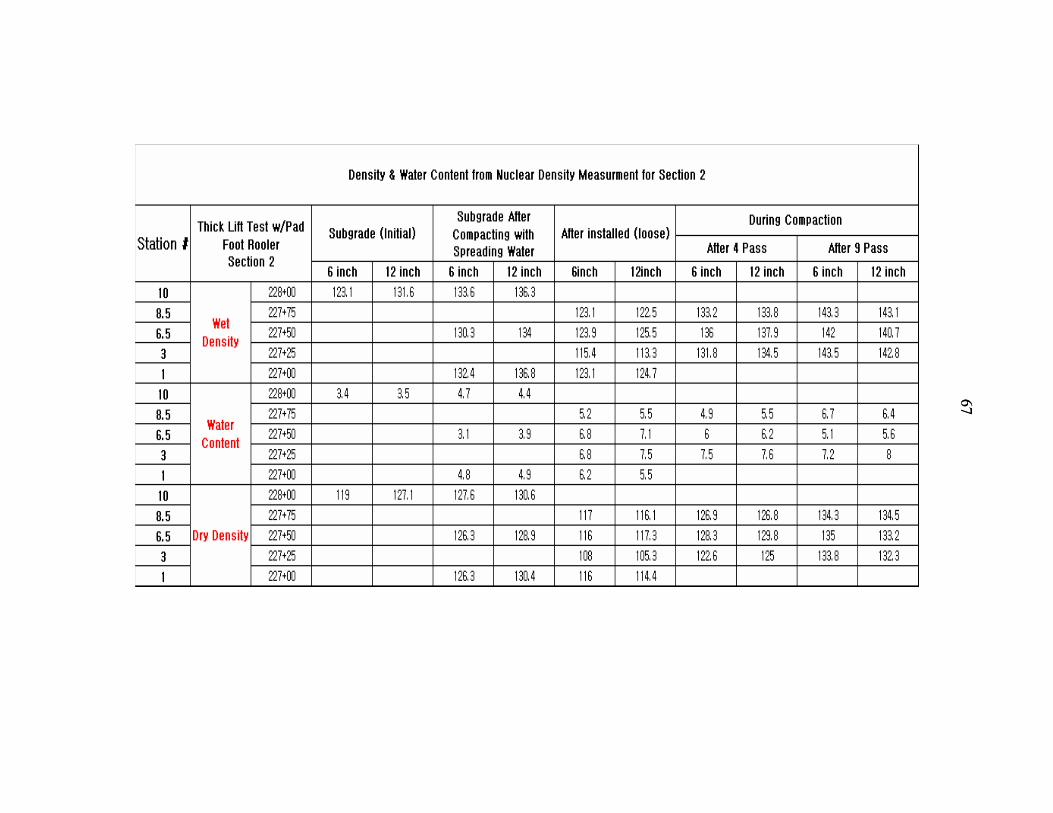
Table 4.2 Measured & Computed Dry Densities from Nuclear Density Probe (NDP) within Section 2........................................................................................................34
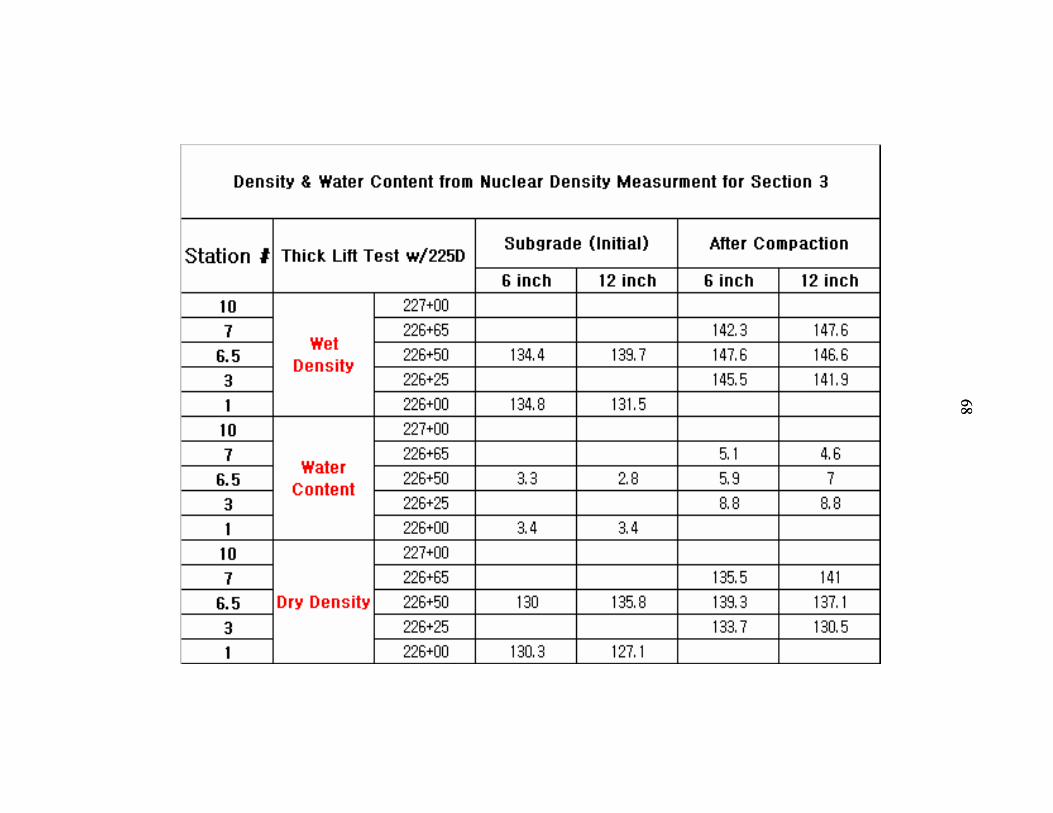
Table 4.3 Measured & Computed Dry Densities from Nuclear Density Probe (NDP) within Section 3........................................................................................................35
Table 4.4 FWD Mean and Standard Deviation on Each Section.......................................40
Table 4.5 SSG Mean and Standard Deviation on Each Section ........................................41
Table 4.6 Summary ADCP Results for Section 1..............................................................45
Table 4.7 Summary of ADCP Results for Section 2 .........................................................46
Table 4.8 Summary of ADCP Results for Section 3 .........................................................46
Table 5.1 Test Sections and Compactors...........................................................................50
iv

LIST OF FIGURES
Figure page Figure 2.1 Relationships between Density, Compaction Energy and Strength vs.
Moisture Content (Seed & Chan, 1959).....................................................................9
Figure 2.2 Relationships between Strength Parameter (CBR) vs. Moisture Content and Density vs. Various Compaction Energies (Turnbull & Foster, 1956) ....................10
Figure 2.3 LBR vs. Moisture Content – Compacted to Dry Density of 123pcf ................11
Figure 2.4 Conventional Vibratory Roller (Source:http://www.bomag.com/media/WM9703_0403_rdr.pdf, Last accessed Mar.18.2005). ...........................................................................................................12
Figure 2.5 Vario-control Vibratory Rollers (Source:http://www.bomag.com/media/WM9703_0403_rdr.pdf, Last accessed Mar.18.2005). ...........................................................................................................13
Figure 2.6 One Dimensional Model of Compactor and Subsoil........................................14
Figure 3.1 Limerock Grain Size Distribution ....................................................................15
Figure 3.2 Plan Views of Test Strips at SR-826 ................................................................17
Figure 3.3 Test Section Compactors..................................................................................18
Figure 3.4 Section 1 Instrumentation – Two 6-inch Lifts..................................................20
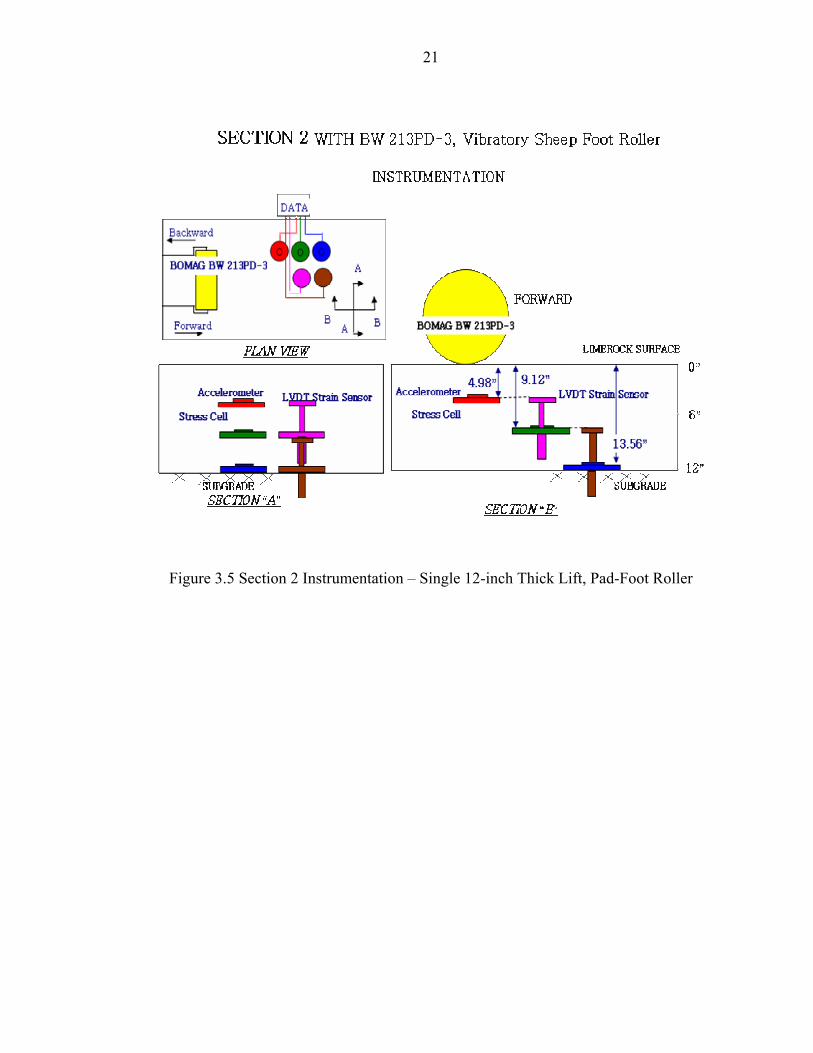
Figure 3.5 Section 2 Instrumentation – Single 12-inch Thick Lift, Pad-Foot Roller ........21
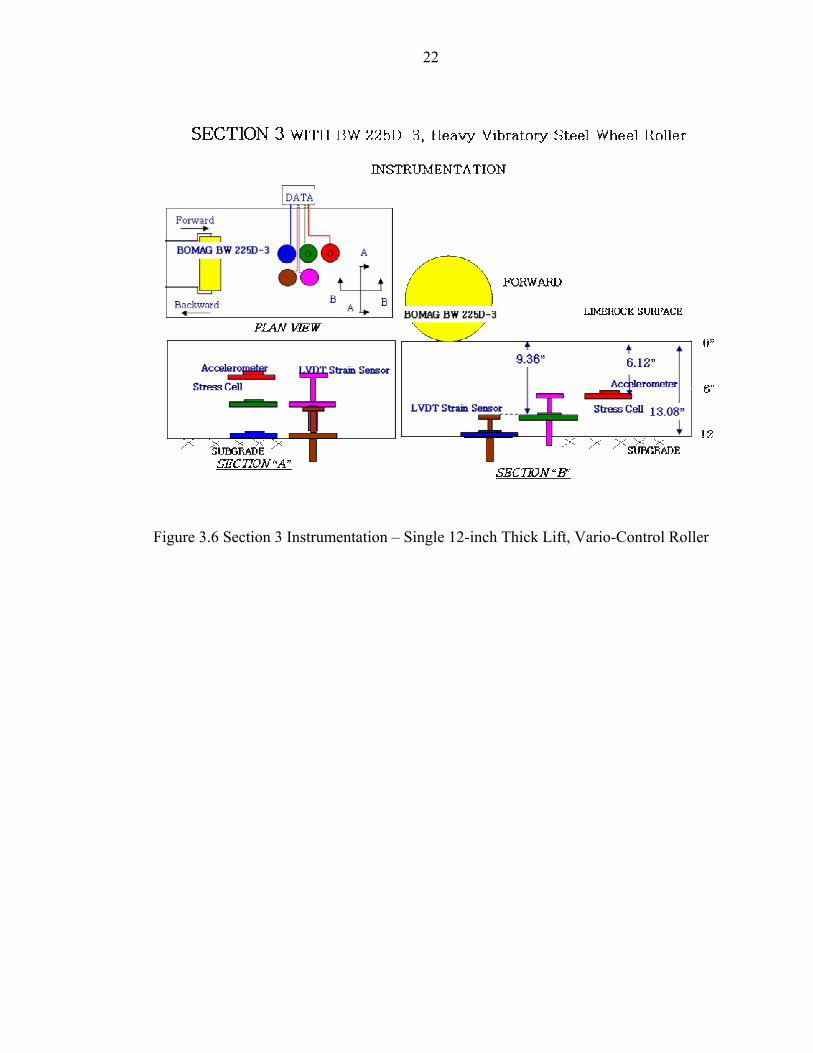
Figure 3.6 Section 3 Instrumentation – Single 12-inch Thick Lift, Vario-Control Roller 22
Figure 4.1 Measured Stress as Function of Time Due to a Passing Vibratory Roller .......23
Figure 4.2 Stress vs. Number of Passes in Two 6-inch Lifts on Section 1........................24
Figure 4.3 Stresses vs. Number of Passes in the Single 12-inch Lift of Section 2 ............26
Figure 4.4 Stresses vs. Number of Passes in the Single 12-inch Lift of Section 3 ............27
Figure 4.5 Stress vs. Particle Displacements at Bottom of Section 1 During 4th Pass ......28
v

Figure 4.6 Forces on the drum and associated loading loop (Source from Kloubert’s presentation at TRB 2004, BOMAG) ......................................................................28
Figure 4.7 Stress vs. Displacement after 5th Pass on Section 2 .........................................29
Figure 4.8 Stress vs. Displacement after 7th pass on section 3 .........................................30
Figure 4.9 Density Calculations with Depth......................................................................31
Figure 4.10 Strain from LVDT vs. Dry density from Nuclear Density Probe for Section 1...................................................................................................................32
Figure 4.11 Strain from LVDT vs. Dry density from Nuclear Density Probe for Section 2...................................................................................................................34
Figure 4.12 train from LVDT vs. Dry density from Nuclear Density Probe for Section ..35
Figure 4.13 Dry densities and Moisture Contents in Section 1 .........................................36
Figure 4.14 Dry Densities and Moisture Contents in Section 2 ........................................37
Figure 4.15 Dry Densities and Moisture Contents in Section 3 ........................................38
Figure 4.16 Stiffness Measured with FWD in All Sections ..............................................39
Figure 4.17 Stiffness measured by SSG in All Sections....................................................41
Figure 4.18 Stiffness from FWD & SSG vs. Dynamic Modulus from Vario-System.......42
Figure 4.19 Stiffness and Evib Moduli as Function of Depth and Number of Passes ........43
Figure 4.20 ADCP Data for Section 1 After 2nd Layer......................................................45
Figure 4.21 ACDP Data for Section 2 ...............................................................................46
Figure 4.22 ACDP Data for Section 3 ...............................................................................47
Figure 4.23 Comparison ADCP Data from Section 1 and 2..............................................47
Figure 4.24 Comparison ADCP Data from Section 1 and 3..............................................48
vi

SUMMARY
Based on the research results, to perform base thick lift compaction on select
projects, FDOT specification 200 has been developed as follows:
200-5.2 Number of Courses:
If, through field tests, the Contractor can demonstrate that the compaction
equipment can achieve the density required by 200-7.2.1 for the full depth of a thicker lift,
and if approved by the Engineer, the base may be constructed in successive courses of not
more than 12-inch [300 mm] compacted thickness, provided that the average LBR of the
subgrade material is not less than 120 with no individual LBR values less than 100 and
the thickness of the subgrade layer is not less than12 inches.
Prior to construction of the test sections, the contractor will submit a plan to
construct the single 12-inch thick lift section, including the equipment and procedures to
be used. Approval of the plan by the State Construction Office will be required prior to
construction of the test sections. Once the plan has been approved, the Engineer will base
final approval on results of density tests and stiffness measurements on two test sections
each of the length of one LOT. Notify the Engineer prior to beginning construction of the
two test sections.
Construct the first test section of 12-inch thick base in two lifts each 6-inch thick
using the Contractor’s specified compaction effort. Identify the test section with the
compaction effort and thickness in the Logbook. After compaction of the first lift,
perform five QC density tests at random locations within the test section. All QC tests
vii
and a Department Verification test performed on the first lift must meet the density
required by 200-7.2.1. After compaction of the second lift, perform QC density tests at
five random locations within the test section. At each location, test the top 6-inch
[150 mm] in addition to the entire course thickness. All QC tests and a Department
Verification test performed on the second lift must meet the density required by 200-7.2.1.
The Engineer will perform a series of at least ten Falling Weight Deflectometer (FWD)
tests at random locations within the test section. FWD testing will be conducted in
accordance with ASTM D4694.
Construct the second test section consisting of a single 12-inch thick lift using the
Contractor’s proposed compaction effort for thick lift construction (e.g., vibratory pad-
foot roller finished with a vibratory smooth drum roller). The maximum dynamic force of
the compaction equipment shall be not less than 60,000 lbf. Identify the test section with
the compaction effort and thickness in the Logbook. After compaction of the thick lift,
perform QC density tests at five random locations within the test section. At each
location, test the top 6 inches [150 mm] in addition to the entire 12-inch [300 mm] course
thickness. All QC tests and a Department Verification test must meet the density required
by 200-7.2.1.
The Engineer will perform a series of at least ten FWD tests per test section.
Engineer’s acceptance of the thick lift test section will require that the average FWD
impulse stiffness of the thick lift test section be equal to or greater than the average FWD
impulse stiffness of the two conventional 6-inch lifts and the required density for thick
lift construction must meet the density required by 200-7.2.1. If the average FWD
impulse stiffness of the thick lift test section is not greater than the average FWD impulse
viii
stiffness of the conventional two 6-inch lifts, the Contractor may increase the compaction
effort until the required average FWD value is achieved. f additional compaction effort is
applied to the test section, additional QC density tests and a Department Verification test
shall be performed, and the average of these density tests will be considered
representative of the test section for determining the required density for thick lift base
construction.
After construction of the test sections, approval of the thick lift base construction
will require 3 days to obtain the FWD test report.
If unable to achieve the required density and FWD impulse stiffness, remove and
replace or repair the test section to comply with the specifications at no additional
expense to the Department.
Once approved, a change in the source of base material will require the
construction of a new test sections. Do not change the compaction effort once the test
sections are approved. The Engineer will verify the density of the bottom 6-inch
[150 mm] during thick lift operations with one VT per every 16 LOTs. The Contractor
may elect to place material in 6-inch [150 mm] compacted thickness at any time. The
Engineer may terminate the use of thick lift construction and instruct the Contractor to
revert to the 6-inch [150 mm] maximum lift thickness if the Contractor fails to achieve
satisfactory results or meet applicable specifications including the minimum impulse
stiffness value determined from FWD tests.
200-6.2 Moisture Content:
Moisture content of the base material shall be 1 to 3% dry of the optimum moisture
content as determined by AASHTO FM 1-T 180, Method D. During the phase of test
ix
sections, microwave oven (ASTM D4643) shall be used to measure the initial moisture
content. Moisture contents will be obtained from five random locations within both test
sections. At each of these locations, two moisture contents will be obtained at depths of 0
to 6-inch and from 6 to 12-inch. After the moisture content results have been obtained, if
all of the results are 1 to 3% dry of the optimum moisture content, compaction of the test
sections will begin within 24 hours of sampling.
200-7.2.1 Density: Within the entire limits of the width and depth of 12-inch and 6-
inch thick base, obtain a minimum density in any LOT of 98% of maximum density as
determined by AASHTO FM 1-T 180, Method D. The difference between densities
measured in 12-inch and 6-inch tests shall not vary by more than 2 pcf.
The Engineer shall perform FWD testing, as needed, with frequency not exceeding
three tests per eight LOTS.
x

CHAPTER 1 INTRODUCTION
1.1. General
Mechanical compaction of earthen materials has been used for thousands of years.
In the US, static/dynamic smooth, pad, or sheep-foot rollers is common in construction of
roadway embankments, bases, dams, and so on. The level of effort required in field
compaction is typically controlled through comparison between dry densities achieved in
the field and dry density resulting from standard laboratory compaction test (e.g.,
Modified Proctor tests). In the latter, multiple layers of soil are compacted in a standard
mold using regulated and standardized compaction effort at different moisture contents to
determine the maximum dry density for a specific compactive effort and the
corresponding “optimum” moisture content for compaction. The higher the dry density of
given material, the higher the expected strength and stiffness of that material.
In the field, contractors have several means and methods that can be employed to
meet or exceed a specified minimum dry density for a given material, which include:
1. Compaction equipment selection (e.g., vibratory, static, smooth, pad, etc.)
2. Number of passes
3. Lift thickness
4. Moisture content
5. Stiffness of subgrade soil and base course materials
1
2
In Florida, most if not all limerock-base courses (FDOT Specification 200) have a
maximum particle size of 3 inches and minimum percentage of fines (i.e., passing 200
sieve) of 35%. Current FDOT practice (Specification 200) allows maximum lift thickness
of 6-inch. Specification allows up to maximum of 8-inch thick base lift, if through field
test, the contractor can demonstrate that the compaction equipment can achieve density
for the full depth of 8-inch and if approved by the engineer. Specification does not any
controls on moisture. Generally, moisture contents vary widely based on location (5% -
south Florida to 14% - central Florida and north) of mine material, humidity, seasonal
rainfall and so on. Most, if not all limerock base courses are compacted with either single
or dual steel rollers with vibratory dynamic forces less than 50,000 lbf.
Strong interest has developed in the feasibility of compacting thicker lifts, e.g., a
single 12-inch lift for roadway base courses for several reasons. 1) Typical limerock base
design thickness exceeds the currently specified lift thickness, thus requiring two lifts of
construction. 2) Industry in producing more compaction equipment capable of delivering
higher static and dynamic forces. Thicker lift base compaction, if feasible, could benefit
both the contractor and the State of Florida in terms of reduced construction cost and time.
Note for two conventional 6-inch lifts, the contractor must transport, spread, grade and
compact the material twice, and quality control (density, moisture, etc.) must be
undertaken twice vs. once with a 12-inch lift.
1.2. Objective
The focus of this research was the placement and compaction of a single 12-inch
limerock lift instead of two 6-inch lifts over competent subgrade using compaction
equipment readily available to contractors, as well as materials with no special gradation.
3
Successful placement was to be judged based on similarities of stiffness and strength
between the thick lift (12-inch) and two 6-inch lifts constructed using the same material,
conditions and subgrade conditions.
To evaluate the appropriate compaction equipment, number of passes, moisture
content, and so on, test sections were constructed rigorously monitored, using stress cells,
LVDT strain sensor, and accelerometers, tested for compliance with density
specifications, and tested for in-place strength and stiffness performance. The LVDTs
were used to validate densities measured with nuclear density probe (NDP), and the stress
cells and accelerometers were used to measure stiffness and energies within the
compacted fill.
Since thick lift limerock compaction has had minimal application within Florida, it
was decided to select a site, materials and equipment which had a high potential for
success. The following were selected: 1) vibratory pad foot roller or heavy smooth
wheel vibratory roller; 2) well graded limerock with limited fines at moisture content dry
of optimum (higher stiffness & strength) and 3) stiff/strong subgrade (LBR > 100).
1.3. Scope
The site selected for thick lift compaction study by the FDOT was SR 826 in
Miami Florida, District 4. Located near Miami International Airport, SR 826 has
Oolitic limestone near the surface (i.e., a strong subgrade, LBR>100) with ongoing
placement of two conventional 6-inch limerock lifts which were well graded, low fine
contents and moisture content varying from 5 to 9% from the source, i.e. dry of optimum.
After discussion with FDOT, Ardaman & Associates and UF personnel, it was
decided to compact three one hundred foot test sections. The first section was
4
constructed using conventional means, i.e. two 6-inch lifts, compacted with a typical
smooth wheel vibratory compactor. The second test section was constructed in a single
12-inch lift using a vibratory pad-foot roller (55,000 lbf). The third test section was also
constructed in a single 12-inch lift, but was compacted using a heavier smooth wheel
vibratory compactor equipped with “intelligent” compaction control devices. The latter
roller has the capability of measuring the soil stiffness, and varying the applied vertical
dynamic force depending on the preset target stiffness (modulus).
All three sections were to be instrumented to measure vertical stresses,
accelerations, and strains at different depths for each pass of the roller. Nuclear density
probe (NDP) and moisture content measurements using lab oven dried were taken prior
to, during and upon completion of test section construction. To measure strength and
stiffness, dynamic cone penetration, falling weight deflectometer, and soil stiffness gauge
test were to be performed at ten locations along each section. In addition, multiple bag
samples were collected both pre and post compaction from each section, and sieved to
identify particle breakage due to compaction.
The following tasks were completed by FDOT, Ardaman & Associates and
University of Florida to complete the scope of services.
1.3.1. Task 1
FDOT District CEI performed laboratory Modified Proctor compaction tests on
representative samples of the limerock material to identify optimum moisture contents
and maximum dry densities. The FDOT State Materials Office personnel performed the
Falling Weight Deflection (FWD) Testing, Automatic Dynamic Cone Penetrometer
Testing (ADCPT), Soil Stiffness Gage (SSG) Testing, bag sampling, and laboratory sieve
analyses of pre- and post-compacted limerock samples from the three test sections.
5
1.3.2. Task 2
Ardaman and Associates placed the instrumentation at multiple depths at in each
test section, recorded the data for each pass of the compactor, and performed nuclear
density probe (NDP) for measurements of density and moisture for each test section.
1.3.3. Task 3
University of Florida reduced and analyzed all of measured data (stresses, strains,
accelerations, FWD, ADCP, SSG, etc.) for each section, and evaluated the results
(stiffness, moduli, energies, etc.) from section to section (i.e. 6-inch lift vs. 12-inch).
This report summarized the analysis and comparisons, and provides
recommendations for implementation and further study. Based on the report, thick lift
specifications are developed to be used on select projects.

CHAPTER 2 COMPACTION BACKGROUND
This chapter reviews field vibratory compaction equipment, both conventional and
intelligent (feedback loop), as well as the influence of moisture content, and compaction
energy, on stiffness and strength of compacted backfill.
2.1. Field Vibratory Compaction
Typical vibratory compaction equipment includes hand held plates (i.e. tampers), as
well as single and multiple wheels drum rollers. For this project vibrating smooth and
pad- foot rollers were investigated.
The basic concept of vibratory roller is the use of unbalanced weights to develop
sinusoidal forces. In addition all vibratory rollers, i.e., towed, self-propelled, and/or
tandem have the static weight (motor, frame, etc.) separated from the vibratory mass
through shock absorbers. As identified by Koulbert (2004), the total force imparted to the
ground is given in Eq. 2.1. The first term is inertia (dynamic) force due to the static
weight of the drum. The second term is the varying dynamic force due to the rotating
masses within the drum, and the third term is the static weight of both the drum and the
rotating masses. Note the second term is a function of the frequency, f, of the rotating
masses.
..2 cos( ) ( )dB d u u f dF m x m r t m m g= − + Ω Ω + + (2.1)
Where, md = mass of the drum (kg) xd = vertical displacement of drum (m)
6
7
..
dx = acceleration of drum (m/s2) mf = mass of the frame (kg) mu = unbalanced mass (kg) ru = radial distance at which mu is attached (m) muru = static moment of the rotating shaft (kg.m) Ω = 2πf t = time elapsed (sec) g = acceleration due to gravity (m/sec2) f = frequency of the rotating shaft (Hz)
Generally, the second term is much less than the other terms (1st and 3rd)
contribution. For instance, Forssblad (1965) studied the effect of the vibratory masses on
a vibratory roller’s compaction. He found by adding 24% of the total roller weight to the
frame, a considerable increase in a soil’s compacted density occurred; however, a similar
change in the drum’s weight did not result in an analogous increases in soil density.
Parsons et al (1962) focused on the amplitude of the vibratory motion, i.e. ..
dx in Eq.
2.1. Besides increasing the dynamic force, Eq. 2.1, Parsons et al found little effect in
typical 6 to 9 inch thick lifts which couldn’t be accomplished with more passes of the
roller.
Yoo (1978) improved field instrumentation through the use of inductance coil
strain gages for field compaction studies. Their experiments also varied compactor
weight and layer thickness for gravel-sand mixtures compacted dry (4%) of optimum
moisture content. Both 12-inch and 36-inch thick fills were compacted under various
energies and moisture content. They concluded that the maximum compact layer
thickness should be limited to 12-inch (vs. 36-inch) from stiffness and densities
measurements with depth. Similarly, WES (USACE-WES, 1976) carried out

8
compaction on lean clay (PI=13) with various water contents using a sheep-foot roller.
Based on that study, they recommended a limitation of lift thickness of 7-inch.
2.2. Strength, Moisture Content and Compactive Effort
Even though field compaction is generally controlled by dry density and moisture
contents, the stiffness and strength of the placed backfill are the properties of interest.
For instance, deflection, rutting, and bearing failure of a base course control its design
(from AASHTO 2002). Since stiffness and strength measurements are difficult to
perform on a routine basis in field, they have been equated to a materials density and
moisture content.
Seed and Chan (1959) were one of the first to study the relationship between
material strength, compaction effort and moisture for fine-grained soils. Their
experiments were performed with Harvard Compaction setup (62.4 cm3 specimen, 0.5-
inch compacting rod with variable spring stiffness). Shown in Figure 2.1 is the change in
dry density (bottom), small strain stiffness (middle) and large strain stiffness (top figure)
vs. moisture content for different compaction energies. Evident from the figure, stiffness,
and density increase with compaction energy for a moisture content dry of optimum.
Note the significant reduction in stiffness for a given compactive effort as the moisture
content passes wet of optimum.
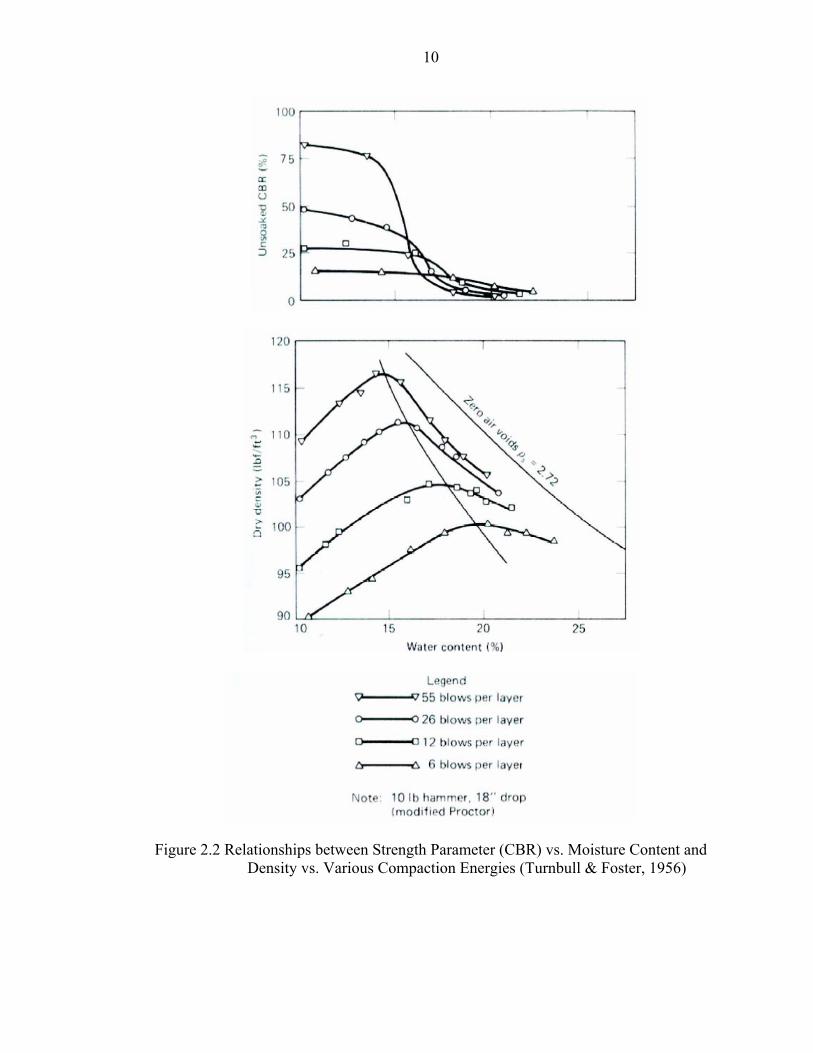
Turnbull and Foster (1956) studied the influence of moisture and compactive effort
on granular soils in Fig. 2.2. Instead of performing triaxial compression, they conducted
California Bearing Ratio (CBR). Similar results as shown in Fig. 2.1 are seen in Fig. 2.2.
Ping et al (1996) has suggested a correlation of 1.25 between the Florida Limerock
Bearing Ratio Test (LBR) and CBR results.

9
Figure 2.1 Relationships between Density, Compaction Energy and Strength vs. Moisture Content (Seed & Chan, 1959)
10
Figure 2.2 Relationships between Strength Parameter (CBR) vs. Moisture Content and Density vs. Various Compaction Energies (Turnbull & Foster, 1956)
11
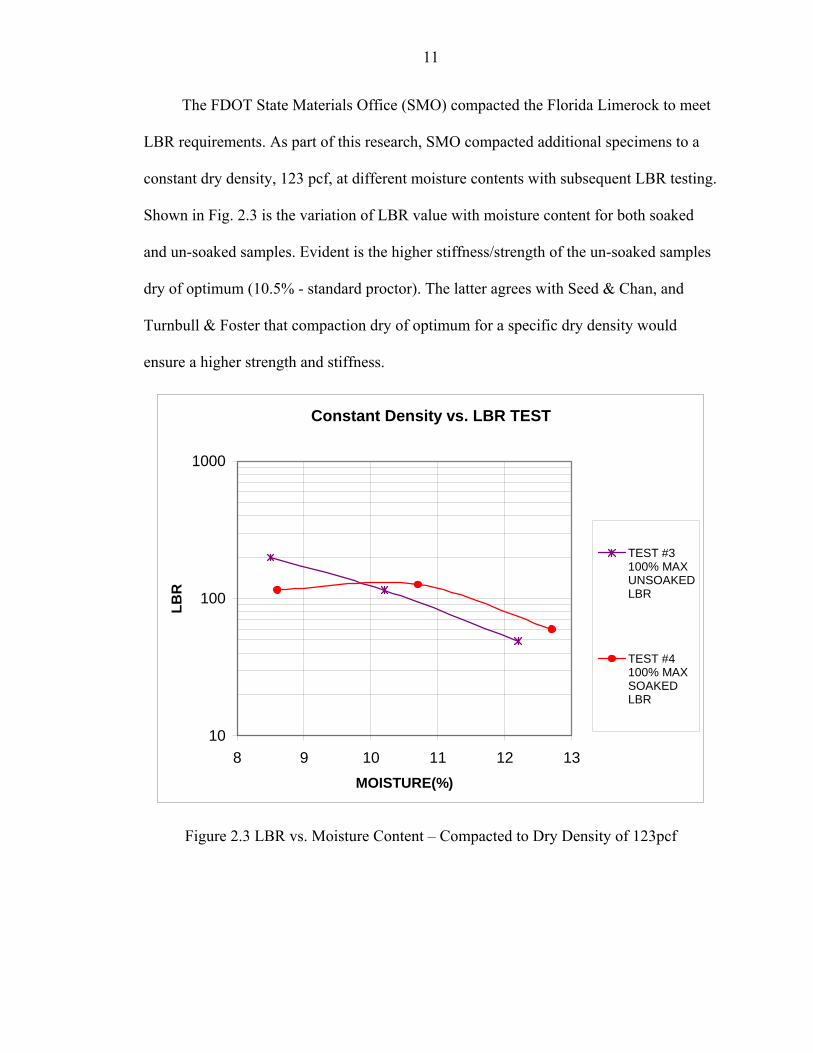
The FDOT State Materials Office (SMO) compacted the Florida Limerock to meet
LBR requirements. As part of this research, SMO compacted additional specimens to a
constant dry density, 123 pcf, at different moisture contents with subsequent LBR testing.
Shown in Fig. 2.3 is the variation of LBR value with moisture content for both soaked
and un-soaked samples. Evident is the higher stiffness/strength of the un-soaked samples
dry of optimum (10.5% - standard proctor). The latter agrees with Seed & Chan, and
Turnbull & Foster that compaction dry of optimum for a specific dry density would
ensure a higher strength and stiffness.
Constant Density vs. LBR TEST
10
100
1000
8 9 10 11 12 13MOISTURE(%)
LBR
TEST #3100% MAXUNSOAKEDLBR
TEST #4100% MAXSOAKEDLBR
Figure 2.3 LBR vs. Moisture Content – Compacted to Dry Density of 123pcf
12
2.3. Intelligent Compaction
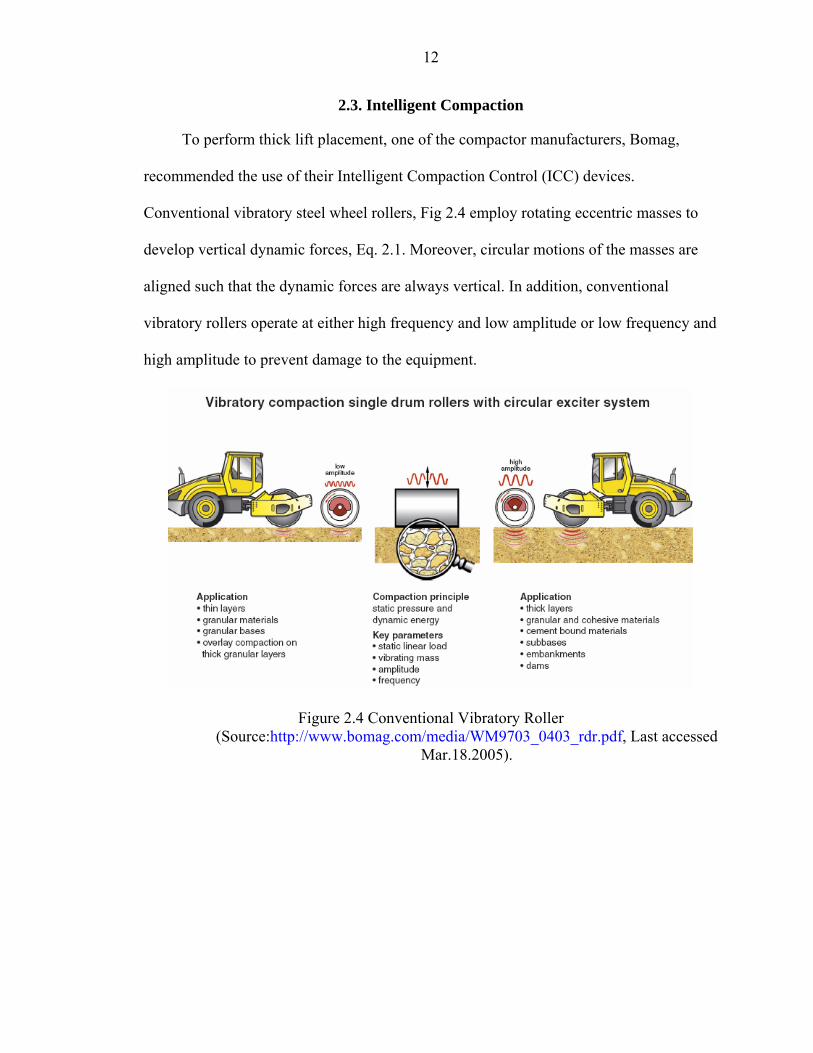
To perform thick lift placement, one of the compactor manufacturers, Bomag,
recommended the use of their Intelligent Compaction Control (ICC) devices.
Conventional vibratory steel wheel rollers, Fig 2.4 employ rotating eccentric masses to
develop vertical dynamic forces, Eq. 2.1. Moreover, circular motions of the masses are
aligned such that the dynamic forces are always vertical. In addition, conventional
vibratory rollers operate at either high frequency and low amplitude or low frequency and
high amplitude to prevent damage to the equipment.
Figure 2.4 Conventional Vibratory Roller (Source:http://www.bomag.com/media/WM9703_0403_rdr.pdf, Last accessed
Mar.18.2005).

13
Figure 2.5 Vario-control Vibratory Rollers (Source:http://www.bomag.com/media/WM9703_0403_rdr.pdf, Last accessed
Mar.18.2005).
Recently, a number of manufacturers have implemented more control or
feedback between the instrumentation (accelerometer) on the compactor’s drum, and the
force delivered to the ground. One such unit is Bomag’s vario-control Roller, shown in
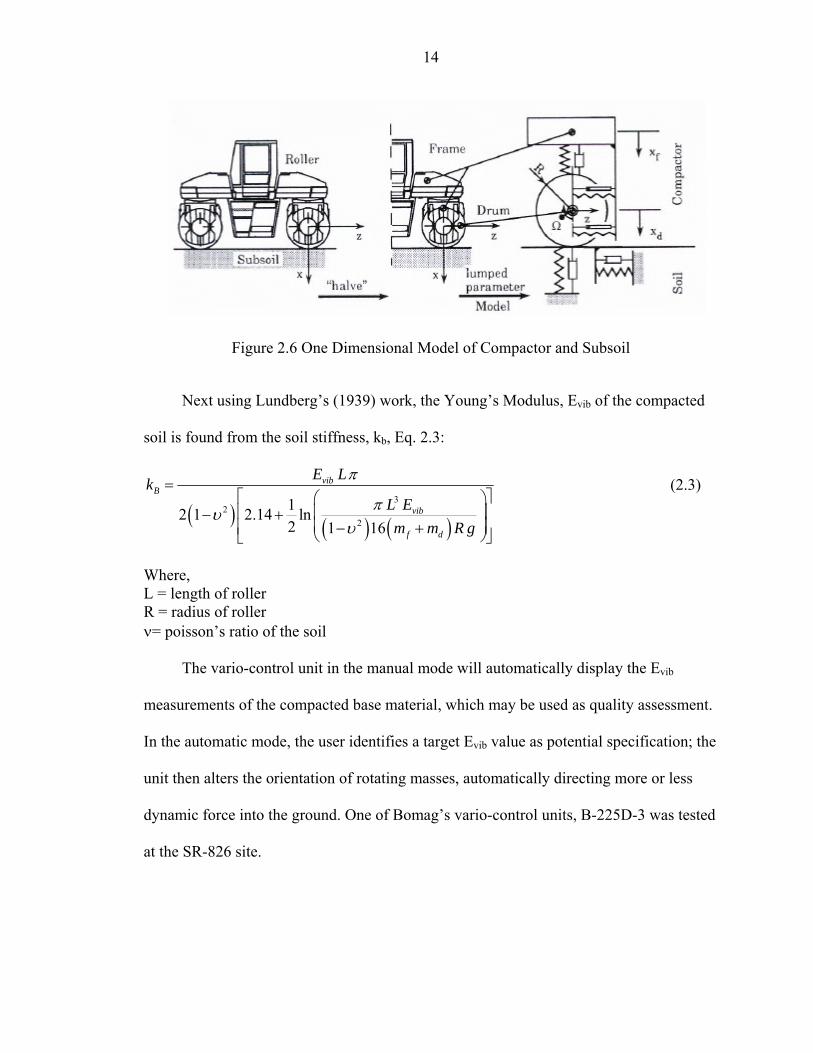
Fig. 2.5. Assuming a one-degree of freedom model for the compacted backfill, Fig. 2.6,
the static stiffness, kB, of the base is computed from:
.
B B d B dF k x d x= + (2.2)
Where, kB = stiffness of soil (F/L) xd = vertical displacement of soil dB = damping coefficient (value of 0.2 assumed)
.
dx = velocity of soil mass (measured at drum)
14
Figure 2.6 One Dimensional Model of Compactor and Subsoil
Next using Lundberg’s (1939) work, the Young’s Modulus, Evib of the compacted
soil is found from the soil stiffness, kb, Eq. 2.3:
( ) ( ) ( )3
22
12 1 2.14 ln2 1 16
vibB
vib
f d
E LkL Em m R g
π
πυυ
=⎡ ⎤⎛ ⎞⎢ ⎥⎜ ⎟− +
⎜ ⎟⎢ ⎥− +⎝ ⎠⎣ ⎦
(2.3)
Where, L = length of roller R = radius of roller ν= poisson’s ratio of the soil
The vario-control unit in the manual mode will automatically display the Evib
measurements of the compacted base material, which may be used as quality assessment.
In the automatic mode, the user identifies a target Evib value as potential specification; the
unit then alters the orientation of rotating masses, automatically directing more or less
dynamic force into the ground. One of Bomag’s vario-control units, B-225D-3 was tested
at the SR-826 site.

CHAPTER 3 TEST SITE AND INSTRUMENTATION
3.1. Materials, Site Layout, and Equipment
A typical grain size distribution curve for the compacted Florida limerock at SR-
826 is shown in Figure 3.1. AASHTO classification of the material is A-1-a, or GW
within the Unified Soil Classification System. Grain Size distributions for all of test
sections are given in Appendix A as reported by the State Materials Office. Laboratory
Modified Proctor analysis revealed a maximum dry density of 131 pcf and an optimum
moisture content of 9%. FDOT Standards Specification 200 required a final placed dry
density of 128.4 pcf (i.e. 98% of maximum dry density) for successful base construction.
0.10DIAMETER (mm)
% F
INER
0
10
20
30
40
50
60
70
80
90
100
0.01 1.0010.0100.0
S-3
S-4
Figure 3.1 Limerock Grain Size Distribution
15
16
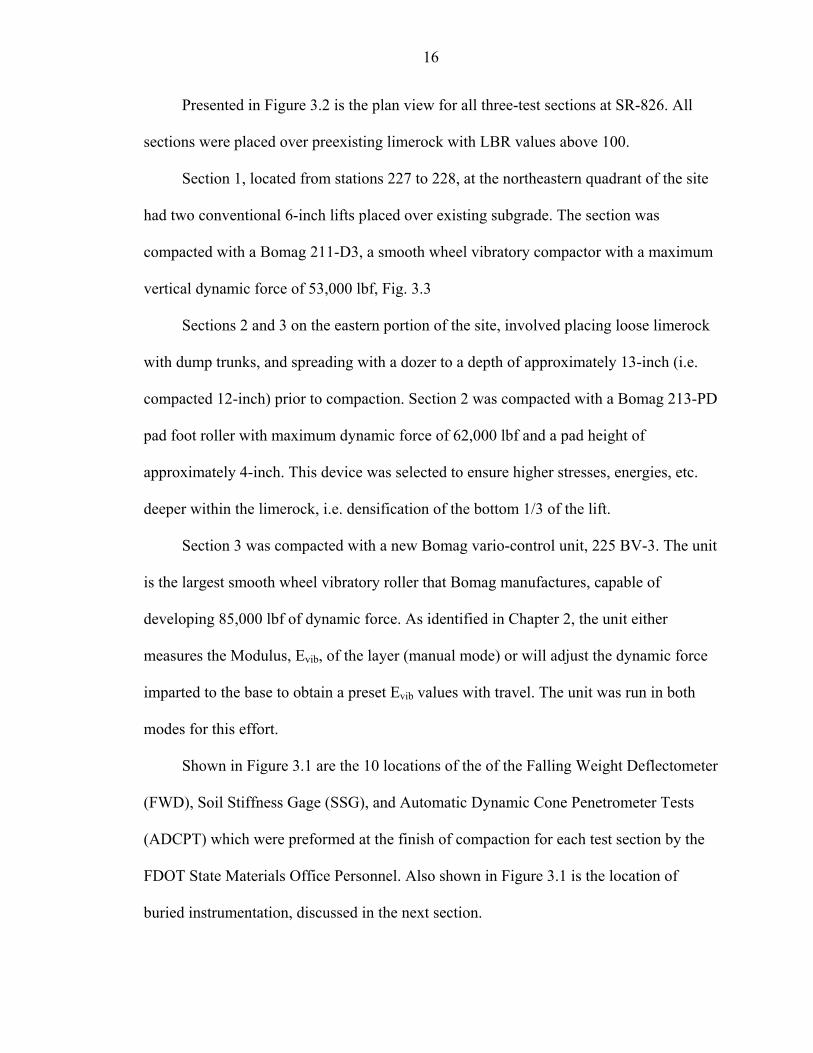
Presented in Figure 3.2 is the plan view for all three-test sections at SR-826. All
sections were placed over preexisting limerock with LBR values above 100.
Section 1, located from stations 227 to 228, at the northeastern quadrant of the site
had two conventional 6-inch lifts placed over existing subgrade. The section was
compacted with a Bomag 211-D3, a smooth wheel vibratory compactor with a maximum
vertical dynamic force of 53,000 lbf, Fig. 3.3
Sections 2 and 3 on the eastern portion of the site, involved placing loose limerock
with dump trunks, and spreading with a dozer to a depth of approximately 13-inch (i.e.
compacted 12-inch) prior to compaction. Section 2 was compacted with a Bomag 213-PD
pad foot roller with maximum dynamic force of 62,000 lbf and a pad height of
approximately 4-inch. This device was selected to ensure higher stresses, energies, etc.
deeper within the limerock, i.e. densification of the bottom 1/3 of the lift.
Section 3 was compacted with a new Bomag vario-control unit, 225 BV-3. The unit
is the largest smooth wheel vibratory roller that Bomag manufactures, capable of
developing 85,000 lbf of dynamic force. As identified in Chapter 2, the unit either
measures the Modulus, Evib, of the layer (manual mode) or will adjust the dynamic force
imparted to the base to obtain a preset Evib values with travel. The unit was run in both
modes for this effort.
Shown in Figure 3.1 are the 10 locations of the of the Falling Weight Deflectometer
(FWD), Soil Stiffness Gage (SSG), and Automatic Dynamic Cone Penetrometer Tests
(ADCPT) which were preformed at the finish of compaction for each test section by the
FDOT State Materials Office Personnel. Also shown in Figure 3.1 is the location of
buried instrumentation, discussed in the next section.
17
Figure 3.2 Plan Views of Test Strips at SR-826

18
211D-3 213PD-3 225D-3
Figure 3.3 Test Section Compactors
3.2. Embedded Instrumentation
To evaluate the compaction process with depth, instrumentation was placed at 1/3
points within the base layer. Since one of the compaction units was a pad foot roller with
the potential of damaging the instrumentation, it was decided to locate all the equipment
at the bottom of each 1/3 locations.
Of interest are the stresses, energies, stiffness, and strains with depth as compared
to the observed laboratory response (i.e. Proctor, LBR, etc.). For instance, it is expected
that dry densities found in the laboratory would be achievable in the field if similar
energies (compaction) were applied. In addition, comparisons of density at the bottom of
the thick lift computed from nuclear density probe (NDP) vs. measured strains are of
19
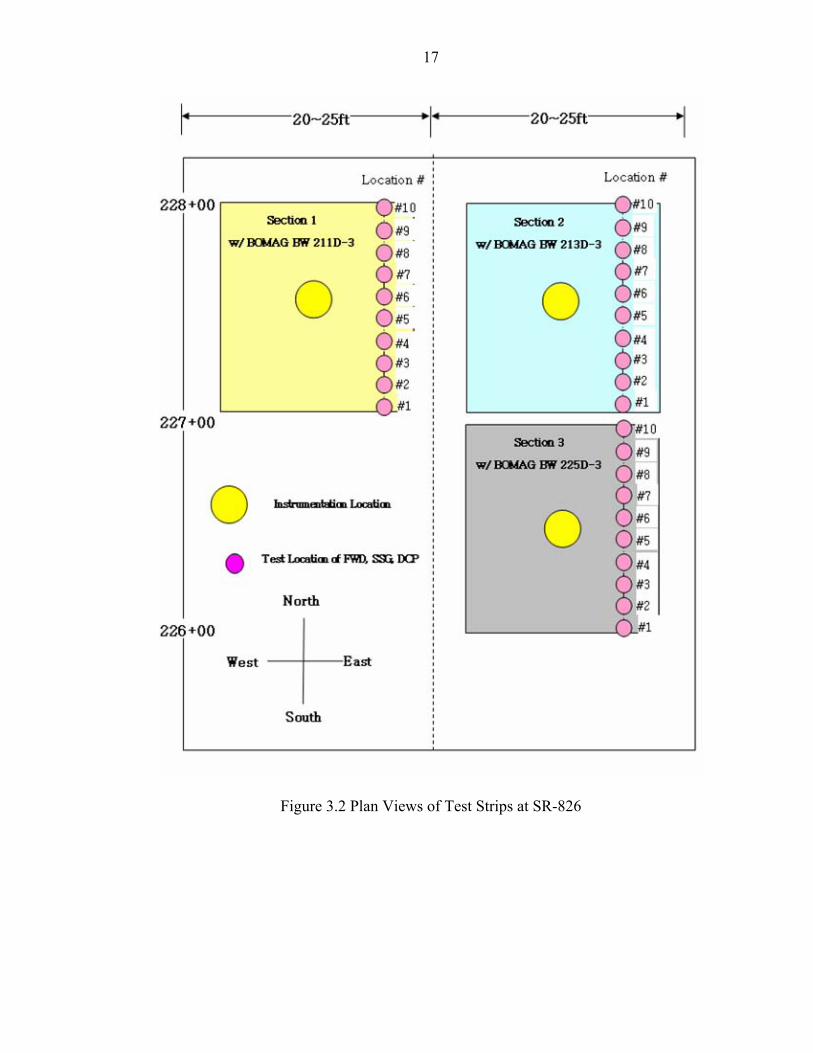
interest (i.e., verification). To accomplish the latter the following instrumentation was
installed:
3.2.1. Accelerometers
Of interest are displacements as a function of dynamic vibrations due to the roller.
Initial attempts used velocity sensors like those employed in seismic geophones.
Unfortunately, the latter generally do not provide the necessary response times.
Subsequently, it was decided to employ accelerometers and integrate the response to
obtain displacements. To provide accurate, repeatable information, DC accelerometers
of the capacitive resistance type were employed, i.e. capable of 0Hz or 1g response.
The devices were attached or placed in the vicinity of the stress cells.
3.2.2. Strain Sensor LVDTs
Initially, it was planned to read the LVDTs only after a pass of compactor.
However, from the analog nature of the device and with a sufficiently sampling
frequency with the data acquisition system, the relative displacements or strains may be
obtained during the compaction process. To maintain the location of the devices, as well
as their orientation, the LVDTs had 3-inch plastic plates attached to the top of the LVDT
housing as well end of sensing rod.
3.2.3. Stress Cells
To measure the vertical stress as a function of compactor motion, 0.375 by 12-
inch diameter stress cells were employed. The sensing face was filled with
incompressible fluid and the pore transducer was attached 18-inch from the sensor with
steel lines. Ardaman and Associates calibrated the devices using a fabricated laboratory
pressure chamber. Presented in Figures 3.4 –3.6 are the cross-sectional views of all the
20
embedded instrumentation at the three test sections at SR-826. Note all the
instrumentation was placed at similar depths for comparison purposes by Ardaman and
Associates.
Figure 3.4 Section 1 Instrumentation – Two 6-inch Lifts
21
Figure 3.5 Section 2 Instrumentation – Single 12-inch Thick Lift, Pad-Foot Roller
22
Figure 3.6 Section 3 Instrumentation – Single 12-inch Thick Lift, Vario-Control Roller
CHAPTER 4 RESULTS AND DISCUSSION
4.1. Stress Measurements
Typical recorded vertical stresses as a function of time due to a passing vibratory
roller is shown in Fig. 4.1. Each peak represents a rotation of the vibratory mass, which
is happening at approximately 30 Hz (i.e. 6 peaks or rotations/0.2sec). Evident is the
buildup of stresses as the roller approaches the instrumentation, with the maximum
occurring with roller over the gage. Of interest are the stress changes vs. particle motions,
e.g. stiffness and energies, as well the peak stresses at various depths within the base
layer. Presented in this section are the peak (maximum) stresses as function of depth vs.
the number of passes.
Figure 4.1 Measured Stress as Function of Time Due to a Passing Vibratory Roller
23
24
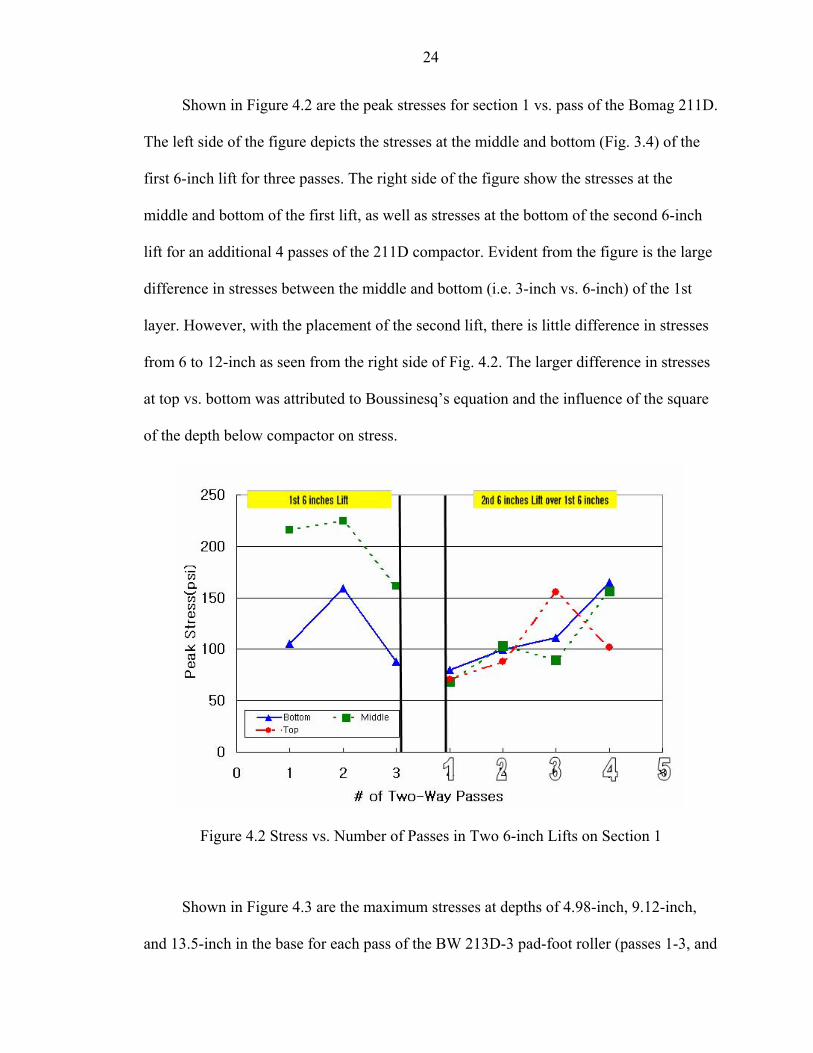
Shown in Figure 4.2 are the peak stresses for section 1 vs. pass of the Bomag 211D.
The left side of the figure depicts the stresses at the middle and bottom (Fig. 3.4) of the
first 6-inch lift for three passes. The right side of the figure show the stresses at the
middle and bottom of the first lift, as well as stresses at the bottom of the second 6-inch
lift for an additional 4 passes of the 211D compactor. Evident from the figure is the large
difference in stresses between the middle and bottom (i.e. 3-inch vs. 6-inch) of the 1st
layer. However, with the placement of the second lift, there is little difference in stresses
from 6 to 12-inch as seen from the right side of Fig. 4.2. The larger difference in stresses
at top vs. bottom was attributed to Boussinesq’s equation and the influence of the square
of the depth below compactor on stress.
Figure 4.2 Stress vs. Number of Passes in Two 6-inch Lifts on Section 1
Shown in Figure 4.3 are the maximum stresses at depths of 4.98-inch, 9.12-inch,
and 13.5-inch in the base for each pass of the BW 213D-3 pad-foot roller (passes 1-3, and
25
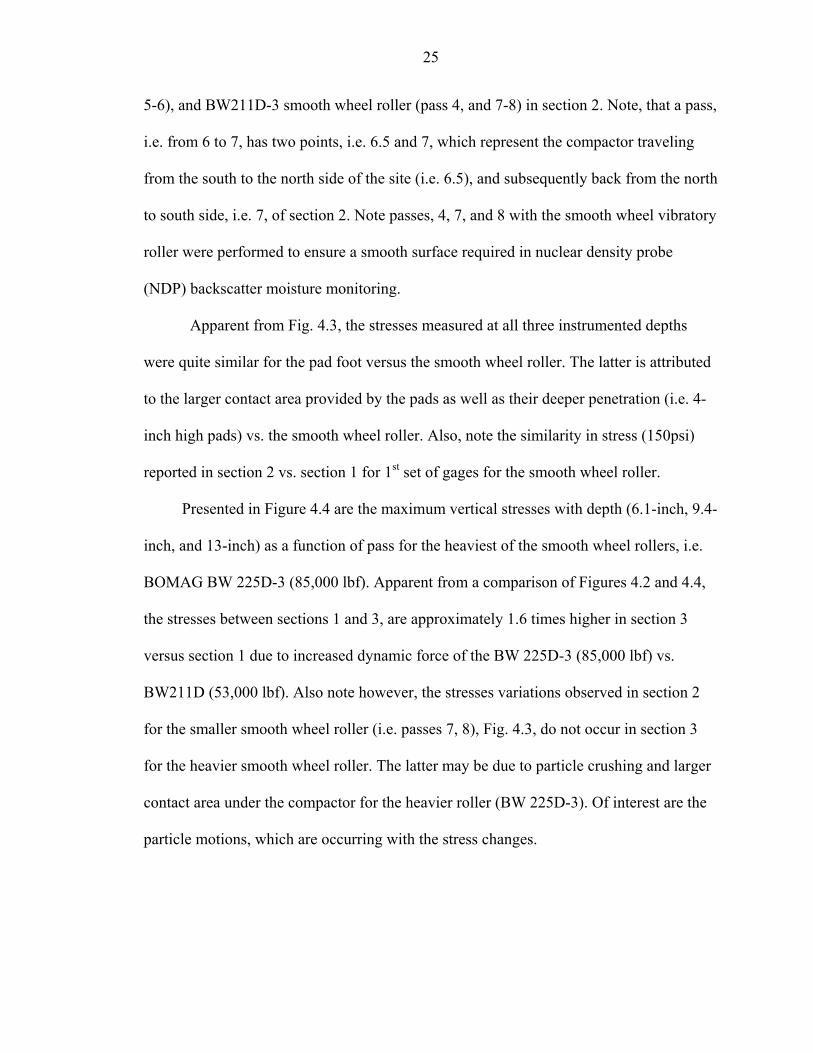
5-6), and BW211D-3 smooth wheel roller (pass 4, and 7-8) in section 2. Note, that a pass,
i.e. from 6 to 7, has two points, i.e. 6.5 and 7, which represent the compactor traveling
from the south to the north side of the site (i.e. 6.5), and subsequently back from the north
to south side, i.e. 7, of section 2. Note passes, 4, 7, and 8 with the smooth wheel vibratory
roller were performed to ensure a smooth surface required in nuclear density probe
(NDP) backscatter moisture monitoring.
Apparent from Fig. 4.3, the stresses measured at all three instrumented depths
were quite similar for the pad foot versus the smooth wheel roller. The latter is attributed
to the larger contact area provided by the pads as well as their deeper penetration (i.e. 4-
inch high pads) vs. the smooth wheel roller. Also, note the similarity in stress (150psi)
reported in section 2 vs. section 1 for 1st set of gages for the smooth wheel roller.
Presented in Figure 4.4 are the maximum vertical stresses with depth (6.1-inch, 9.4-
inch, and 13-inch) as a function of pass for the heaviest of the smooth wheel rollers, i.e.
BOMAG BW 225D-3 (85,000 lbf). Apparent from a comparison of Figures 4.2 and 4.4,
the stresses between sections 1 and 3, are approximately 1.6 times higher in section 3
versus section 1 due to increased dynamic force of the BW 225D-3 (85,000 lbf) vs.
BW211D (53,000 lbf). Also note however, the stresses variations observed in section 2
for the smaller smooth wheel roller (i.e. passes 7, 8), Fig. 4.3, do not occur in section 3
for the heavier smooth wheel roller. The latter may be due to particle crushing and larger
contact area under the compactor for the heavier roller (BW 225D-3). Of interest are the
particle motions, which are occurring with the stress changes.
26
Figure 4.3 Stresses vs. Number of Passes in the Single 12-inch Lift of Section 2
4.2. Compactive Energy
To identify soil particle movement, and subsequent energy transmissions,
accelerations were monitored with DC (0-100 Hz) piezo-capacitance instruments
attached to the tops of the stress cells at the three depth locations (Figs. 3.4, 3.5, and 3.6).
After integrating the accelerations twice, the particle displacements during a pass of a
compactor were obtained. Appendix D presents the data reduction process, as well as an
example of deformations as a function of time. Of interest is the relationship between
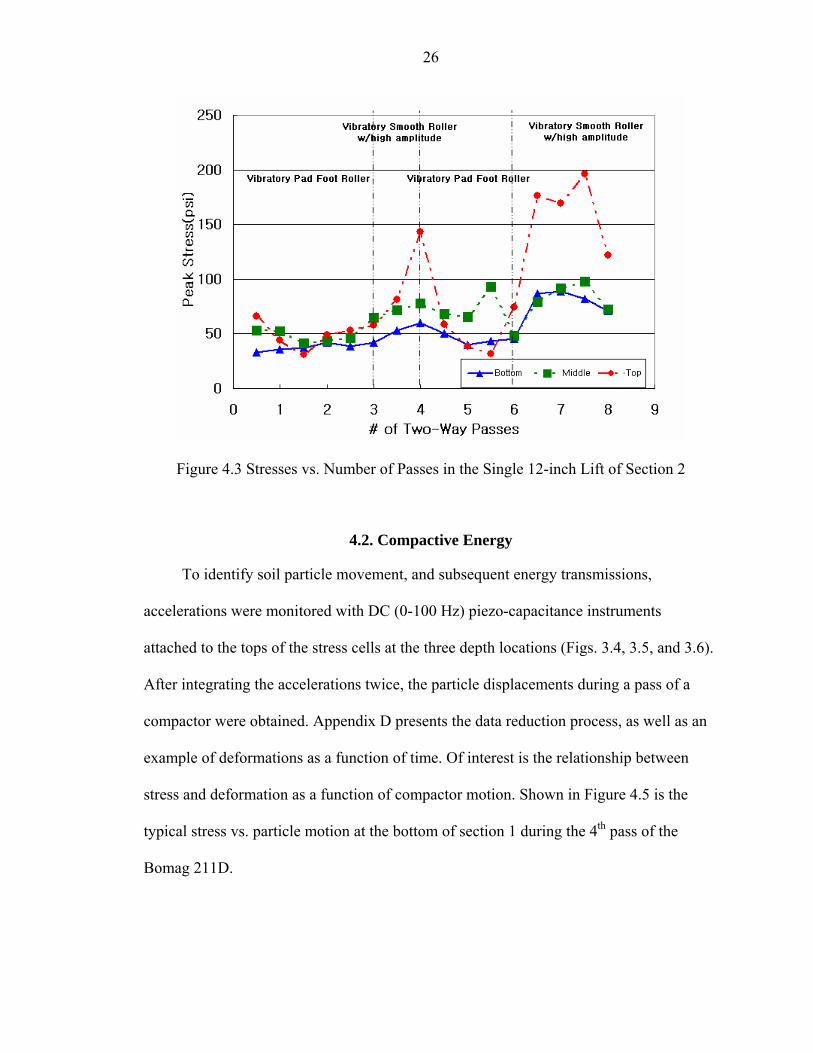
stress and deformation as a function of compactor motion. Shown in Figure 4.5 is the
typical stress vs. particle motion at the bottom of section 1 during the 4th pass of the
Bomag 211D.

27
Figure 4.4 Stresses vs. Number of Passes in the Single 12-inch Lift of Section 3
Each loop (ellipse) represents one complete rotation of the eccentric mass within
the roller (i.e. 30 Hz or 30cycles/sec). The multiple loops with varying peak stresses are a
result of the roller either approaching or moving away from the instrumentation. Note the
similarities of Figure 4.5 and Bomag’s force vs. displacement measurement of the drum
at the ground surface, Figure 4.6. As identified by Bomag, Figure 4.6, the compression is
a result of the compactor pressing down on the base, and the expansion (i.e. unloading) is
due to the drum unloading the base. In the unloading phase, the particle displacements are
negative, i.e. in an upward direction. The energy transmitted to the base for each rotation
of eccentric mass within the roller is the area within each loop, Fig. 4.6.
28
Figure 4.5 Stress vs. Particle Displacements at Bottom of Section 1 During 4th Pass
Figure 4.6 Forces on the drum and associated loading loop (Source from Kloubert’s presentation at TRB 2004, BOMAG)
Presented in Figure 4.7 are the stresses vs. displacements at the top, middle and
bottom of section 2 in the 5th pass of the Bomag 213PD pad-foot roller. Apparent is the

29
similarities of energies (i.e. areas) at the various depths within the 12” lift, with a slight
drop at the bottom. Interestingly, the slopes (i.e. stiffness) of the middle and bottom
depths of the lift are higher than the top. The latter may be attributed to the shape of the
compactor’s contact area, i.e. pad, vs. the smooth wheel.
Figure 4.7 Stress vs. Displacement after 5th Pass on Section 2
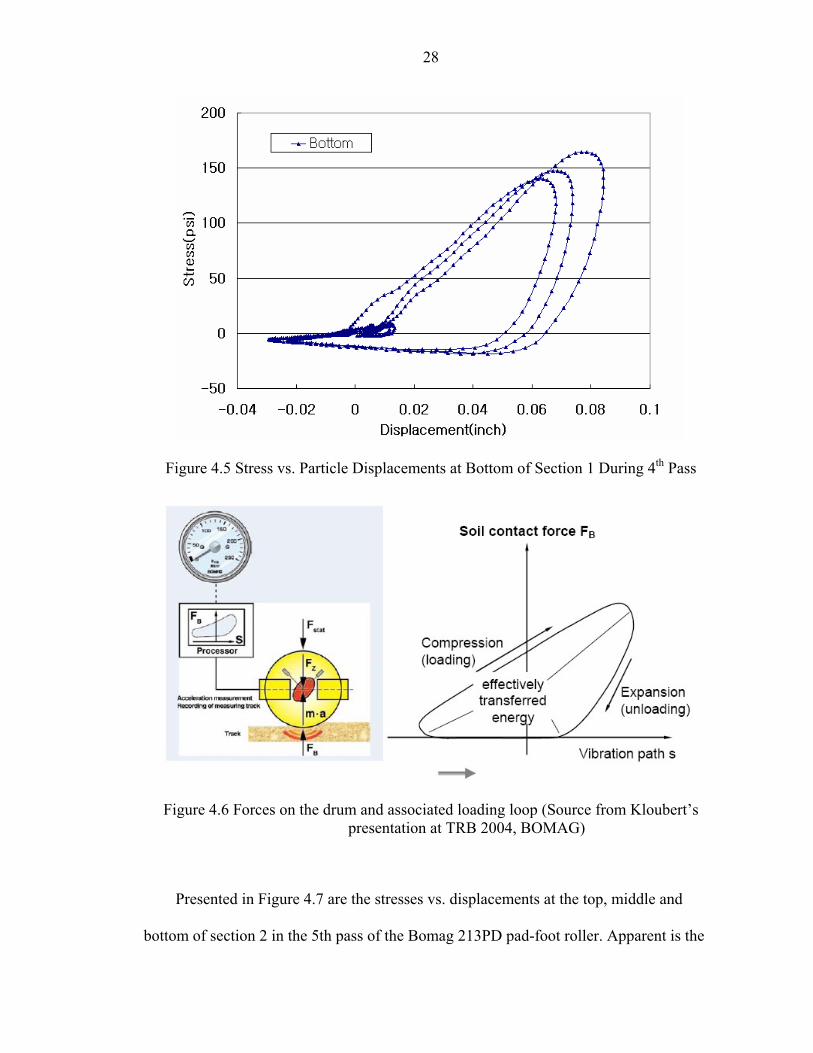
Shown in Figure 4.8 are the stresses vs. displacements at the top, middle and
bottom of section 3 in the 7th pass of the Bomag 225D-3 smooth wheel roller. Evident is
the similarities of energies (i.e. areas) at the top and bottom of 12-inch lift, suggesting
similar densities throughout the deposit. A comparison of energies (areas) between
section 1 (Fig. 4.5) and 3 (Fig. 4.7), suggest higher densities changes or compaction is
being performed with one pass of the Bomag 225 vs. 211. Also note that the stiffness (i.e.
slopes) of any loop is higher for the Bomag 225 (Fig. 4.8), than the slopes from the
30
section 1 (Fig. 4.5) with the passing of a Bomag 211. The latter should be evident from
Falling Weight Deflectometer (FWD) data discussed later.
Figure 4.8 Stress vs. Displacement after 7th pass on section 3
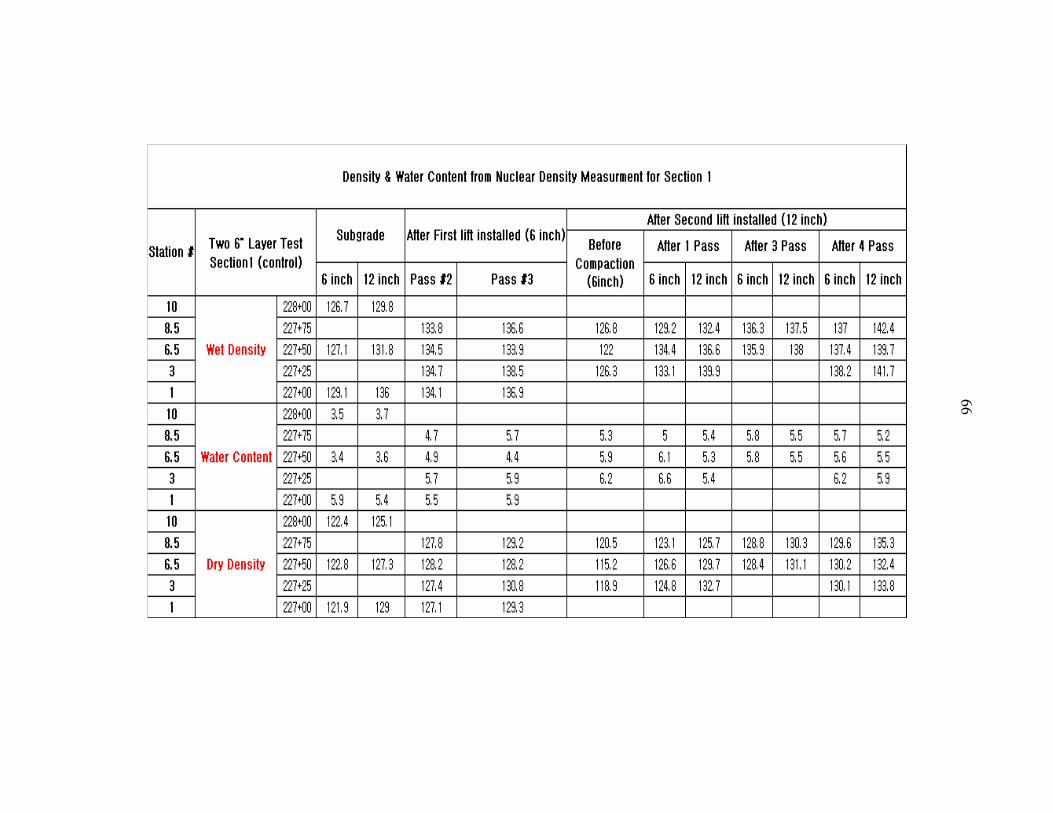
4.3. Vertical Strains and Densities
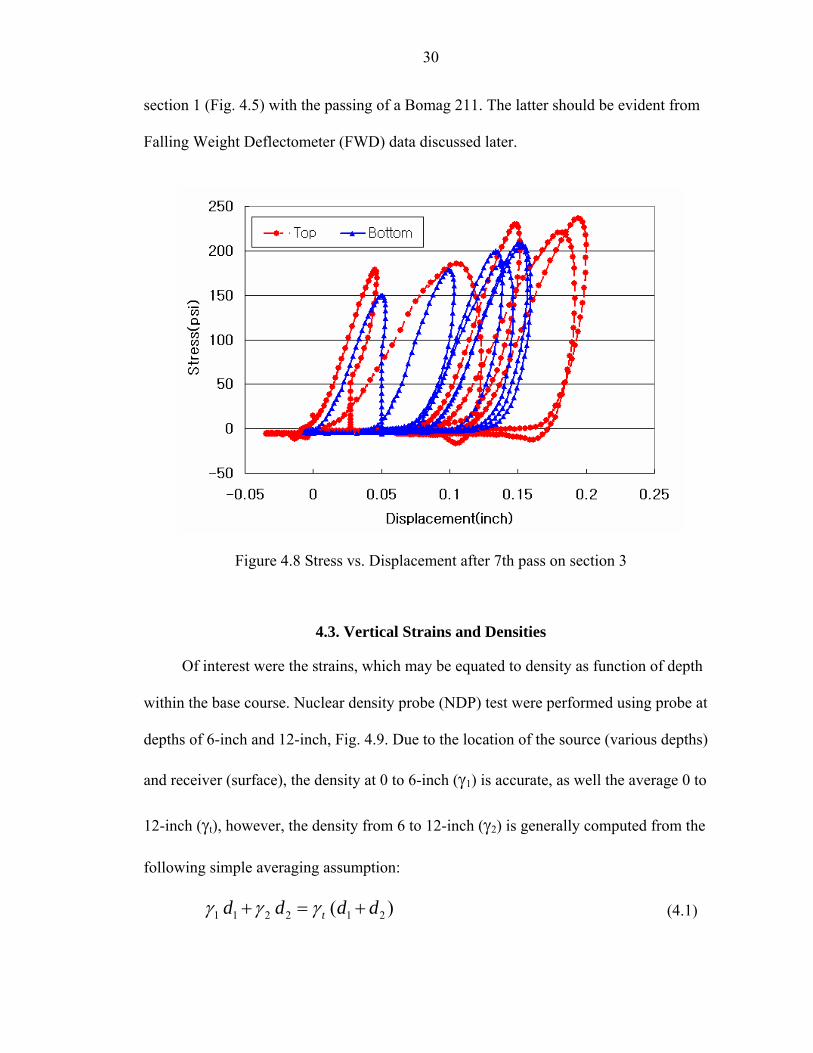
Of interest were the strains, which may be equated to density as function of depth
within the base course. Nuclear density probe (NDP) test were performed using probe at
depths of 6-inch and 12-inch, Fig. 4.9. Due to the location of the source (various depths)
and receiver (surface), the density at 0 to 6-inch (γ1) is accurate, as well the average 0 to
12-inch (γt), however, the density from 6 to 12-inch (γ2) is generally computed from the
following simple averaging assumption:
1 1 2 2 1 2(td d d d )γ γ γ+ = + (4.1)
31
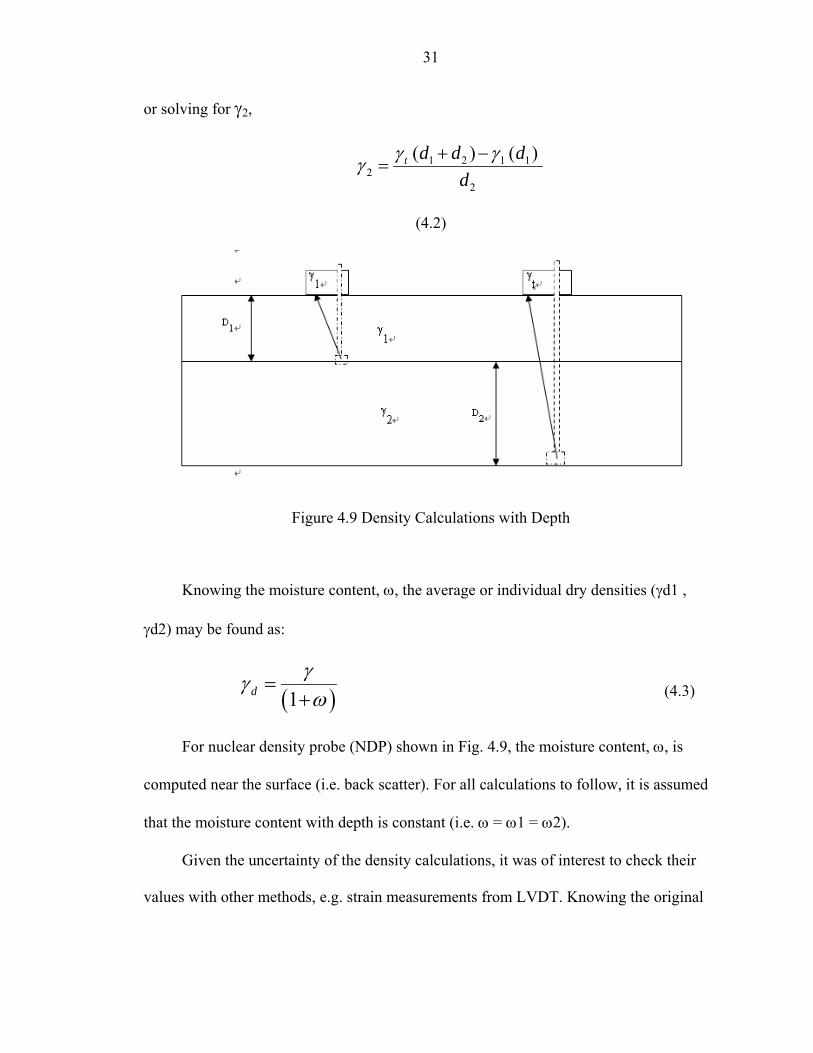
or solving for γ2,
1 2 1 12
2
( ) (t d d dd
)γ γγ + −=
(4.2)
Figure 4.9 Density Calculations with Depth
Knowing the moisture content, ω, the average or individual dry densities (γd1 ,
γd2) may be found as:
( )1dγγω
=+ (4.3)
For nuclear density probe (NDP) shown in Fig. 4.9, the moisture content, ω, is
computed near the surface (i.e. back scatter). For all calculations to follow, it is assumed
that the moisture content with depth is constant (i.e. ω = ω1 = ω2).
Given the uncertainty of the density calculations, it was of interest to check their
values with other methods, e.g. strain measurements from LVDT. Knowing the original
32
spacing between a pair of LVDT plates (i.e. Figs. 3.4 to 3.6), the strain as a function of
compactor pass may be found as,
( )( )v
changein spacingL original spacingδ
ε = (4.4)
Next, assuming that the initial dry density (γd_initial) of the placed base material
is uniform, the final dry density (γd_final) after a pass may be computed as,
__ 1
d initiald final
v
γγ
ε=
− (4.5)
Where εv is given by Eq. 4.4, and it is assumed that no horizontal strains develop
as the compactor passes over.
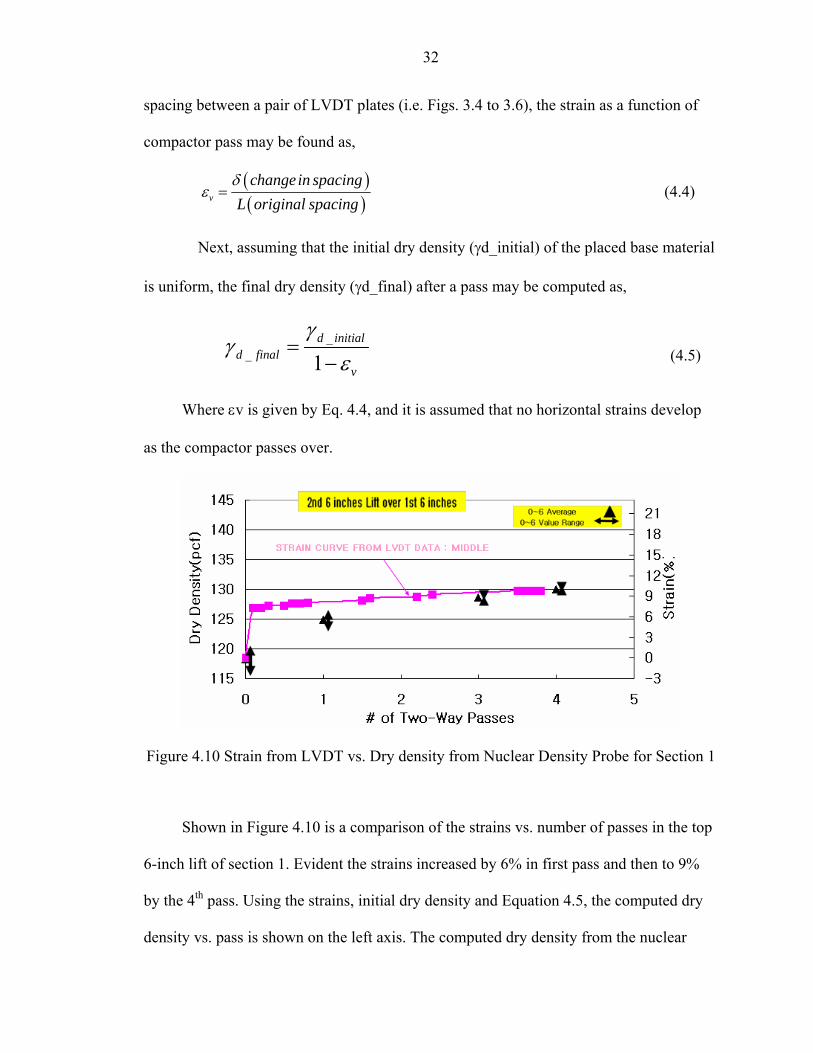
Figure 4.10 Strain from LVDT vs. Dry density from Nuclear Density Probe for Section 1
Shown in Figure 4.10 is a comparison of the strains vs. number of passes in the top
6-inch lift of section 1. Evident the strains increased by 6% in first pass and then to 9%
by the 4th pass. Using the strains, initial dry density and Equation 4.5, the computed dry
density vs. pass is shown on the left axis. The computed dry density from the nuclear
33
density probe (NDP) is given in Table 4.1, as well as depicted in Fig. 4.10. Note the
moisture and densities were measured at 3 locations within the section, and LVDT
occurred at one location. As expected, the measured density variability of the first pass,
3.5 pcf (126.6 to 123.1 pcf), is quite high and if added to the mean (124.8 pcf), covers the
density measured by the LVDT (127 pcf), which is at one point.
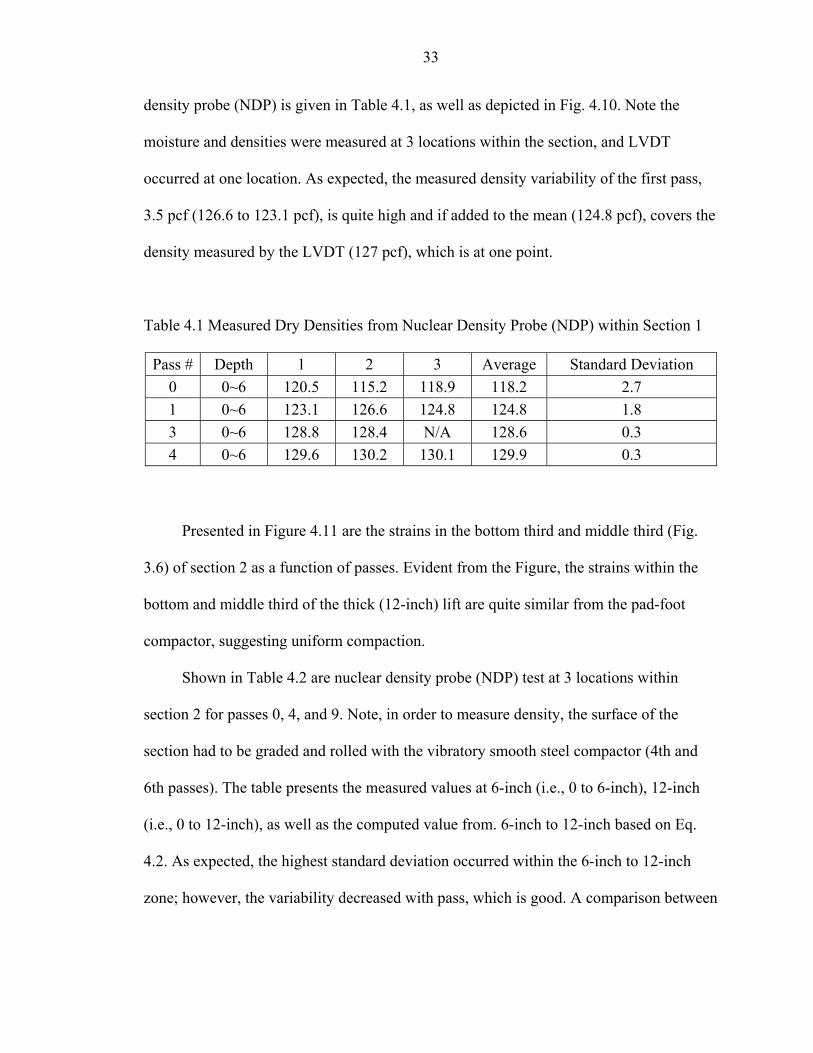
Table 4.1 Measured Dry Densities from Nuclear Density Probe (NDP) within Section 1
Pass # Depth 1 2 3 Average Standard Deviation 0 0~6 120.5 115.2 118.9 118.2 2.7 1 0~6 123.1 126.6 124.8 124.8 1.8 3 0~6 128.8 128.4 N/A 128.6 0.3 4 0~6 129.6 130.2 130.1 129.9 0.3
Presented in Figure 4.11 are the strains in the bottom third and middle third (Fig.
3.6) of section 2 as a function of passes. Evident from the Figure, the strains within the
bottom and middle third of the thick (12-inch) lift are quite similar from the pad-foot
compactor, suggesting uniform compaction.
Shown in Table 4.2 are nuclear density probe (NDP) test at 3 locations within
section 2 for passes 0, 4, and 9. Note, in order to measure density, the surface of the
section had to be graded and rolled with the vibratory smooth steel compactor (4th and
6th passes). The table presents the measured values at 6-inch (i.e., 0 to 6-inch), 12-inch
(i.e., 0 to 12-inch), as well as the computed value from. 6-inch to 12-inch based on Eq.
4.2. As expected, the highest standard deviation occurred within the 6-inch to 12-inch
zone; however, the variability decreased with pass, which is good. A comparison between
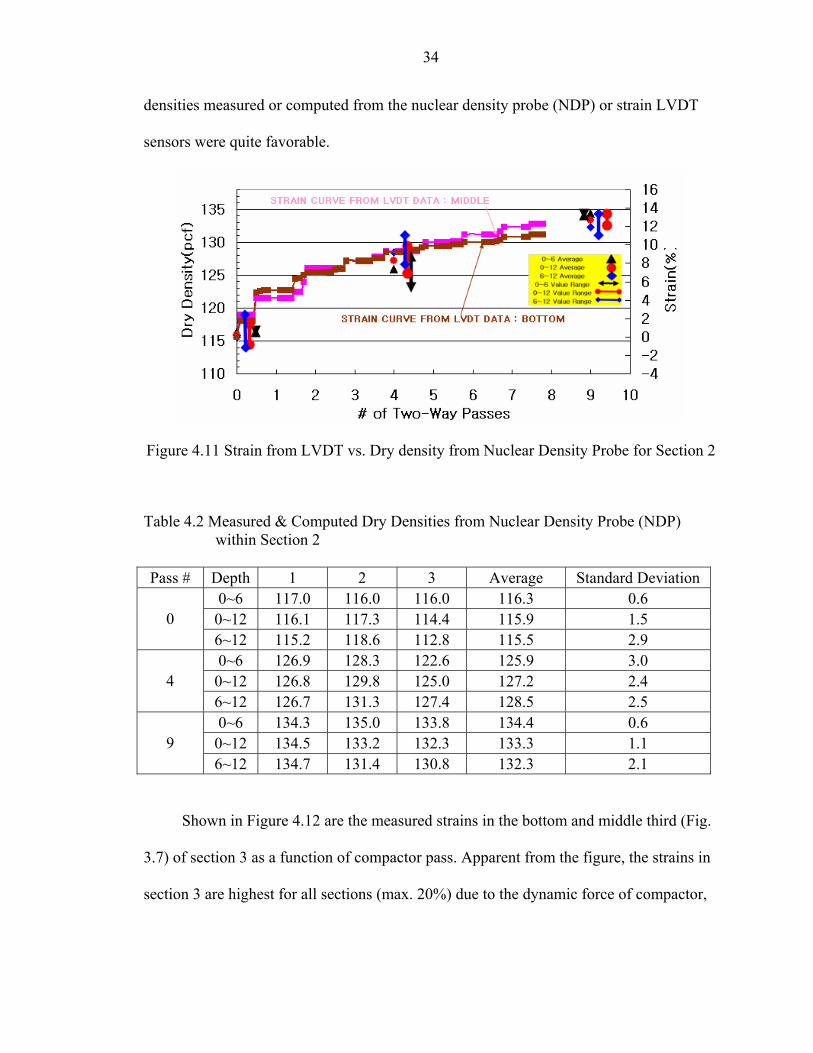
34
densities measured or computed from the nuclear density probe (NDP) or strain LVDT
sensors were quite favorable.
Figure 4.11 Strain from LVDT vs. Dry density from Nuclear Density Probe for Section 2
Table 4.2 Measured & Computed Dry Densities from Nuclear Density Probe (NDP) within Section 2
Pass # Depth 1 2 3 Average Standard Deviation
0~6 117.0 116.0 116.0 116.3 0.6 0~12 116.1 117.3 114.4 115.9 1.5 0 6~12 115.2 118.6 112.8 115.5 2.9 0~6 126.9 128.3 122.6 125.9 3.0
0~12 126.8 129.8 125.0 127.2 2.4 4 6~12 126.7 131.3 127.4 128.5 2.5 0~6 134.3 135.0 133.8 134.4 0.6
0~12 134.5 133.2 132.3 133.3 1.1 9 6~12 134.7 131.4 130.8 132.3 2.1
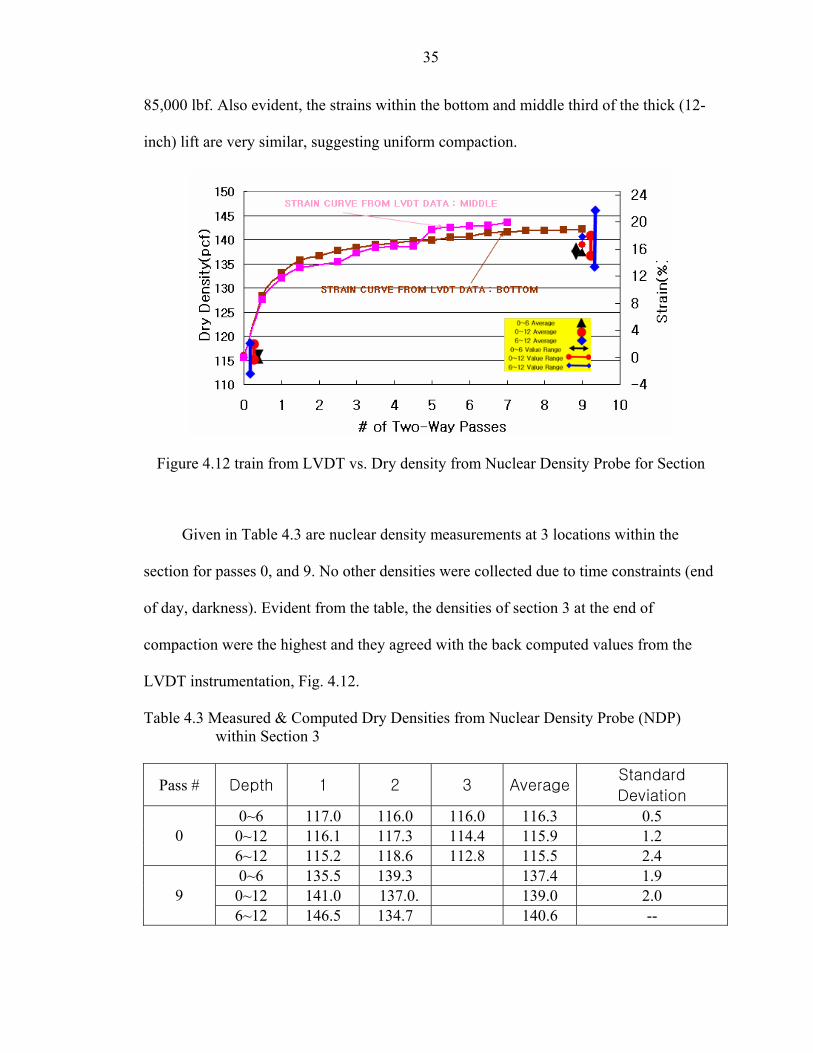
Shown in Figure 4.12 are the measured strains in the bottom and middle third (Fig.
3.7) of section 3 as a function of compactor pass. Apparent from the figure, the strains in
section 3 are highest for all sections (max. 20%) due to the dynamic force of compactor,
35
85,000 lbf. Also evident, the strains within the bottom and middle third of the thick (12-
inch) lift are very similar, suggesting uniform compaction.
Figure 4.12 train from LVDT vs. Dry density from Nuclear Density Probe for Section
Given in Table 4.3 are nuclear density measurements at 3 locations within the
section for passes 0, and 9. No other densities were collected due to time constraints (end
of day, darkness). Evident from the table, the densities of section 3 at the end of
compaction were the highest and they agreed with the back computed values from the
LVDT instrumentation, Fig. 4.12.
Table 4.3 Measured & Computed Dry Densities from Nuclear Density Probe (NDP) within Section 3
Pass # Depth 1 2 3 AverageStandard
Deviation
0~6 117.0 116.0 116.0 116.3 0.5 0~12 116.1 117.3 114.4 115.9 1.2 0 6~12 115.2 118.6 112.8 115.5 2.4 0~6 135.5 139.3 137.4 1.9
0~12 141.0 137.0. 139.0 2.0 9 6~12 146.5 134.7 140.6 --

36
4.4. Dry Densities and Moisture Contents
As identified in section 3.1, Modified Proctor (AASHTO T-180) laboratory
compaction tests were performed on the SR826 base materials. An optimum dry density
of 131 pcf and moisture content of 9% were found. FDOT specification 200 requires a
measured field compaction of 98% of T-180 or a dry density of 128.38 pcf.
Presented in Figure 4.13 are measured field dry densities from the nuclear density
probe (NDP) for the last passes of lifts 1 and 2 of section 1. Also shown in the figure are
the moisture contents measured from the nuclear density probe (NDP) as well as lab oven
dried samples recovered from the field. Apparent is the back scatter surface moisture
measurement acceptable measurements over the depth of the deposit.
Figure 4.13 Dry densities and Moisture Contents in Section 1
37
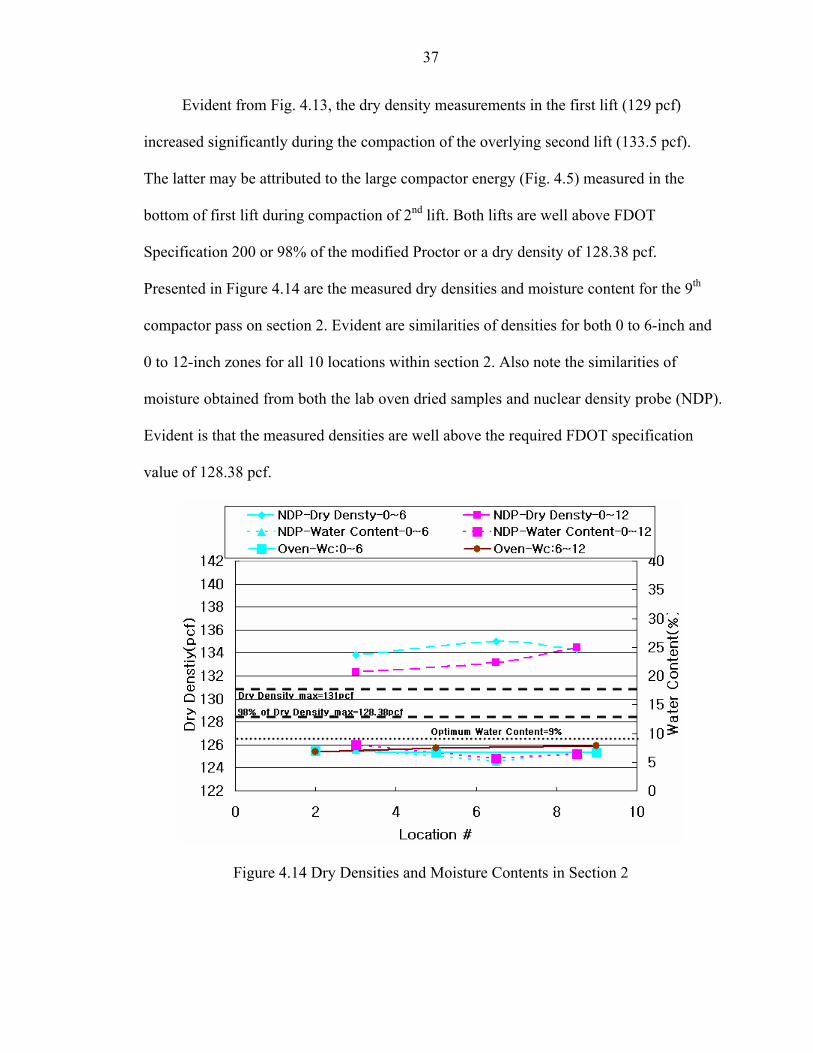
Evident from Fig. 4.13, the dry density measurements in the first lift (129 pcf)
increased significantly during the compaction of the overlying second lift (133.5 pcf).
The latter may be attributed to the large compactor energy (Fig. 4.5) measured in the
bottom of first lift during compaction of 2nd lift. Both lifts are well above FDOT
Specification 200 or 98% of the modified Proctor or a dry density of 128.38 pcf.
Presented in Figure 4.14 are the measured dry densities and moisture content for the 9th
compactor pass on section 2. Evident are similarities of densities for both 0 to 6-inch and
0 to 12-inch zones for all 10 locations within section 2. Also note the similarities of
moisture obtained from both the lab oven dried samples and nuclear density probe (NDP).
Evident is that the measured densities are well above the required FDOT specification
value of 128.38 pcf.
Figure 4.14 Dry Densities and Moisture Contents in Section 2

38
Presented in Figure 4.15 are measured dry densities and moistures in section 3 for
the 9th pass of the Bomag 225D. This section had the highest measured densities, as well
as variability along the section. However, the densities were well above FDOT’s
Specification 200 of 128.3 pcf.
Figure 4.15 Dry Densities and Moisture Contents in Section 3
4.5. Base Stiffness
As identified in section 2.2, the stiffness, and strength of compacted materials are
a function of moisture content and compactive effort (energy). Since, future roadway
base construction will be based on compacted stiffness, AASHTO (2002), the stiffness of
two conventional 6-inch lifts versus the 12-inch thick lift are of great interest. For the
stiffness measurements, Falling Weight Deflectometer (FWD), Soil Stiffness Gage (SSG),
as well as the Evib from the Bomag Varicontrol measurements on the drum (225D-3) were
measured and compared.
39
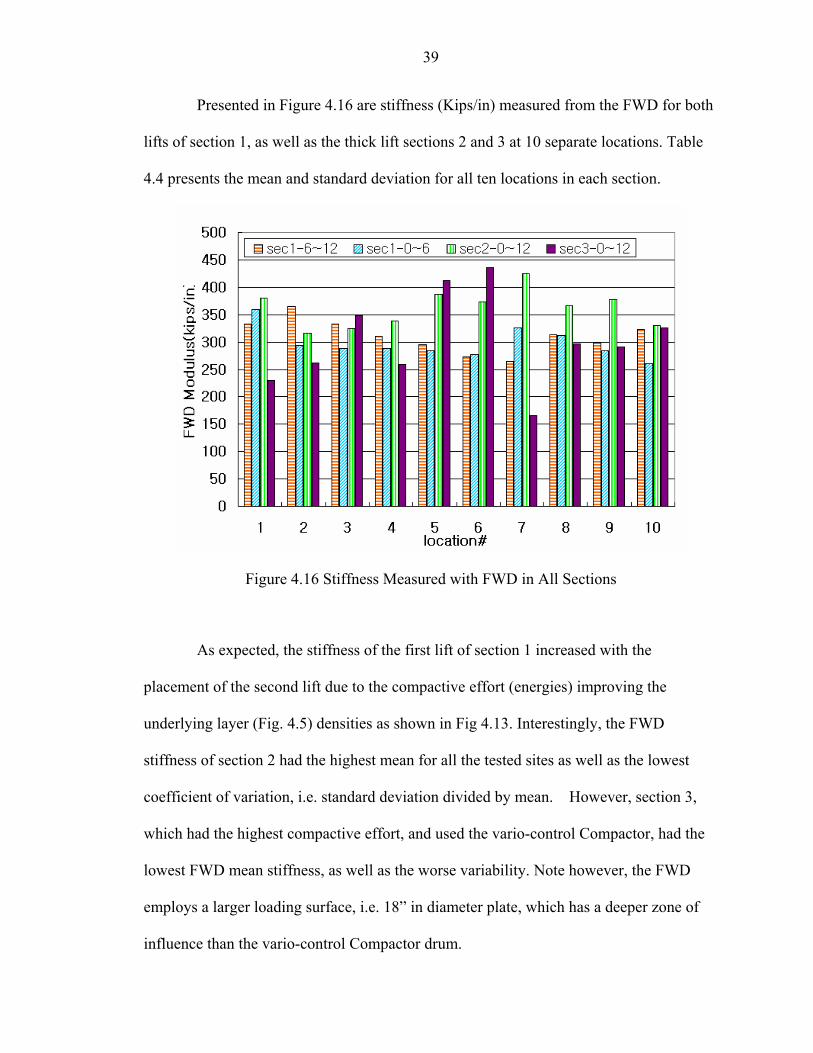
Presented in Figure 4.16 are stiffness (Kips/in) measured from the FWD for both
lifts of section 1, as well as the thick lift sections 2 and 3 at 10 separate locations. Table
4.4 presents the mean and standard deviation for all ten locations in each section.
Figure 4.16 Stiffness Measured with FWD in All Sections
As expected, the stiffness of the first lift of section 1 increased with the
placement of the second lift due to the compactive effort (energies) improving the
underlying layer (Fig. 4.5) densities as shown in Fig 4.13. Interestingly, the FWD
stiffness of section 2 had the highest mean for all the tested sites as well as the lowest
coefficient of variation, i.e. standard deviation divided by mean. However, section 3,
which had the highest compactive effort, and used the vario-control Compactor, had the
lowest FWD mean stiffness, as well as the worse variability. Note however, the FWD
employs a larger loading surface, i.e. 18” in diameter plate, which has a deeper zone of
influence than the vario-control Compactor drum.

40
Table 4.4 FWD Mean and Standard Deviation on Each Section
Section1 Average Standard Deviation 0~6inch 297 28.3
6~12inch 311 29.8 0~12inch 304 29.2 Section2 ---- ----- 0~12inch 362 34.1 Section3 ---- ---- 0~12inch 303 81.8
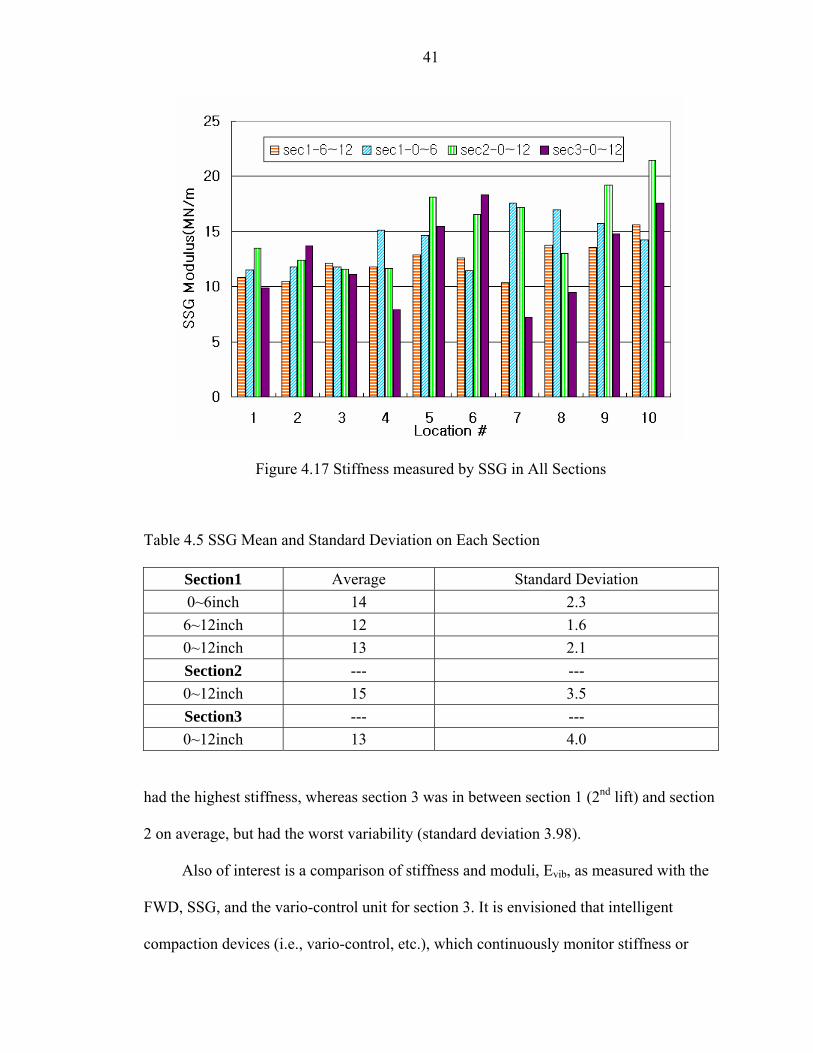
Presented in Figure 4.17 is the surface stiffness as measured by the soil stiffness
Gage (SSG) from Humbolt for each of the ten locations within the 3 sections. Again,
section 1 had SSG performed at the end of both the first and second 6-inch lift placement.
Shown in Table 4.5 are mean and standard deviation of the SSG data. Interestingly, the
mean stiffness for the first 6-inch was higher than the measured mean after compaction of
the second 6-inch lift for section 1. This quite different than the FWD results, Table 4.4,
suggesting the SSG is measuring a surface phenomenon, whereas, FWD is measuring a
depth phenomenon. Again section 2, 12-inch lift with the pad-foot compactor,
41
Figure 4.17 Stiffness measured by SSG in All Sections
Table 4.5 SSG Mean and Standard Deviation on Each Section
Section1 Average Standard Deviation 0~6inch 14 2.3
6~12inch 12 1.6 0~12inch 13 2.1 Section2 --- --- 0~12inch 15 3.5 Section3 --- --- 0~12inch 13 4.0
had the highest stiffness, whereas section 3 was in between section 1 (2nd lift) and section
2 on average, but had the worst variability (standard deviation 3.98).
Also of interest is a comparison of stiffness and moduli, Evib, as measured with the
FWD, SSG, and the vario-control unit for section 3. It is envisioned that intelligent
compaction devices (i.e., vario-control, etc.), which continuously monitor stiffness or

42
moduli, will replace nuclear density probe (NDP) test for quality assessment and control
in compaction.
Presented in Figure 4.18 are FWD and SSG stiffness (dashed lines – read on left
axis), versus the Evib measurements (read on the right side) as reported by the vario-
control unit as a function of location. Note the vario-control Unit was operated in
Figure 4.18 Stiffness from FWD & SSG vs. Dynamic Modulus from Vario-System
automatic (A, i.e., preset Evib), and manual (R, i.e., preset amplitude and frequency)
modes. Interestingly, after the first pass, all subsequent passes of the vario-control unit,
had smaller Evib. Moreover, the variability of the Evib values over the site (i.e. 1-10) is
much greater than the initial values (i.e. pass 1) or FWD data. All of the latter suggest
that the unit was possibly crushing the surface material in site 3. For instance, particle
crushing would result in larger surface deformations or a lower stiffness, k (Eq. 2.2), and
a lower Evib (Eq. 2.3) with subsequent pass.
43
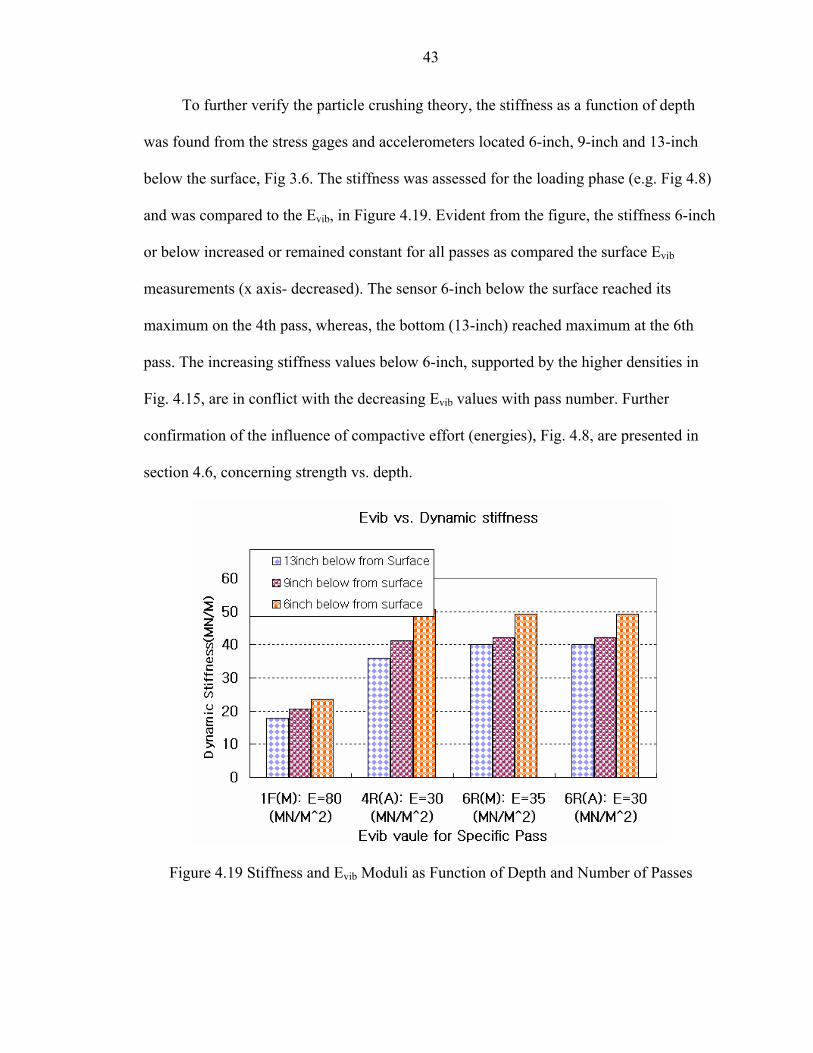
To further verify the particle crushing theory, the stiffness as a function of depth
was found from the stress gages and accelerometers located 6-inch, 9-inch and 13-inch
below the surface, Fig 3.6. The stiffness was assessed for the loading phase (e.g. Fig 4.8)
and was compared to the Evib, in Figure 4.19. Evident from the figure, the stiffness 6-inch
or below increased or remained constant for all passes as compared the surface Evib
measurements (x axis- decreased). The sensor 6-inch below the surface reached its
maximum on the 4th pass, whereas, the bottom (13-inch) reached maximum at the 6th
pass. The increasing stiffness values below 6-inch, supported by the higher densities in
Fig. 4.15, are in conflict with the decreasing Evib values with pass number. Further
confirmation of the influence of compactive effort (energies), Fig. 4.8, are presented in
section 4.6, concerning strength vs. depth.
Figure 4.19 Stiffness and Evib Moduli as Function of Depth and Number of Passes

44
4.6. Base Strength
Besides stiffness, the strength of base materials beneath the roadway is extremely
important. The latter controls maximum contact pressures (e.g. semi-truck tire pressures)
that the roadway may be exposed without undergoing a bearing failure. One means of
assessing strength in the field is with a static or dynamic cone penetration test. For this
study, an Automatic Dynamic Cone Penetrometer (ADCP) device owned and operated by
the State Materials Office (SMO) in Gainesville was used. SMO recommended the
automatic dynamic cone over the static due to its prior success on other base project
studies.
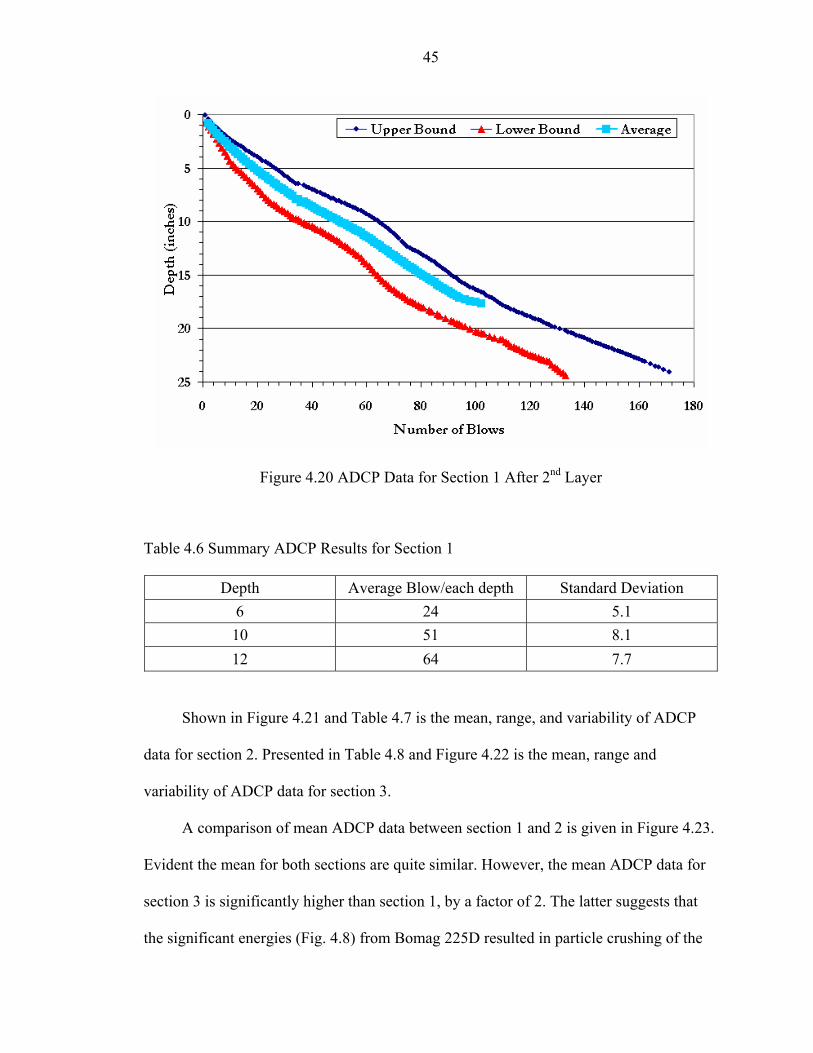
Presented in Figure 4.20 is the mean and maximum range of ADCP values as a
function of depth for section 1 after the placement of the second 6-inch lift. Appendix G
presents the data for all ten locations (Fig 3.5), and Table 4.6 reports the mean and
standard deviation of the ten values at depths of 6-inch, 10-inch and 12-inch below the
base surface. Of interest is the number of blows required to achieve a specific depth,
discontinuities (i.e., jumps due to impenetrable rocks – schist), as well as the slope
(blows/distance) over a given layer. Apparent from Fig. 4.20, section 1 after compaction
was very uniform with blow count/layer (strength) being similar for each 6-inch lift as
well as the subgrade (zone below the base).
45
Figure 4.20 ADCP Data for Section 1 After 2nd Layer
Table 4.6 Summary ADCP Results for Section 1
Depth Average Blow/each depth Standard Deviation 6 24 5.1
10 51 8.1 12 64 7.7
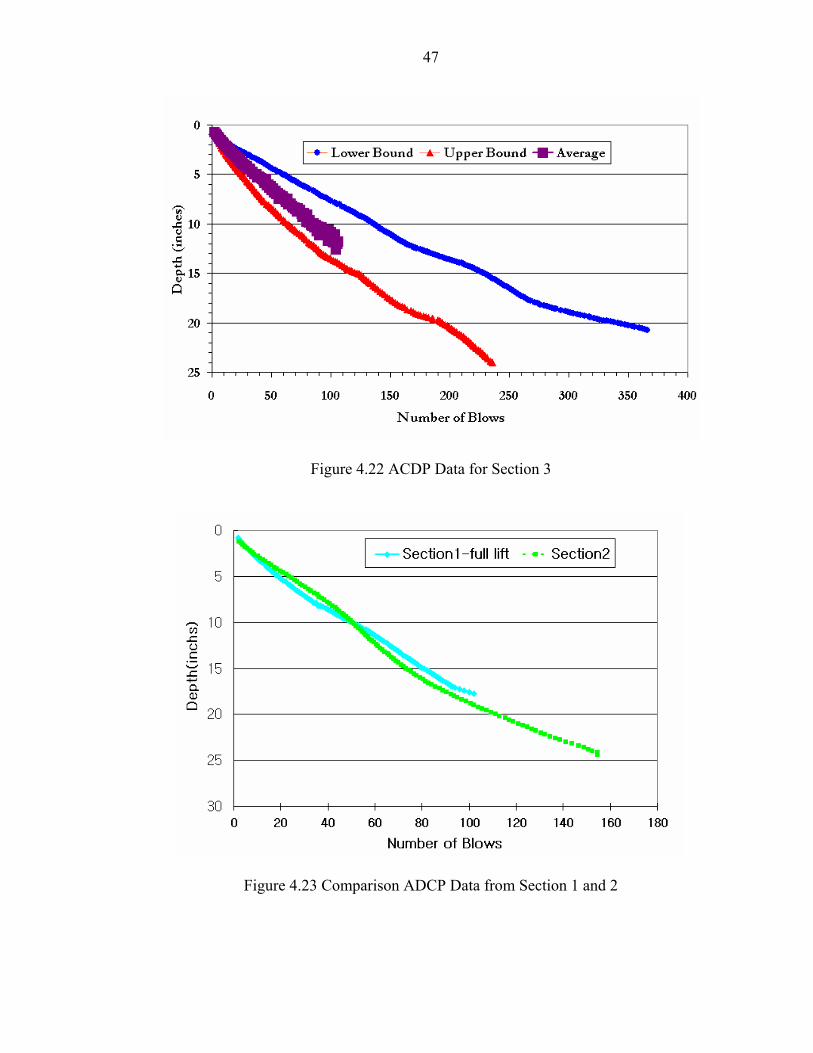
Shown in Figure 4.21 and Table 4.7 is the mean, range, and variability of ADCP
data for section 2. Presented in Table 4.8 and Figure 4.22 is the mean, range and
variability of ADCP data for section 3.
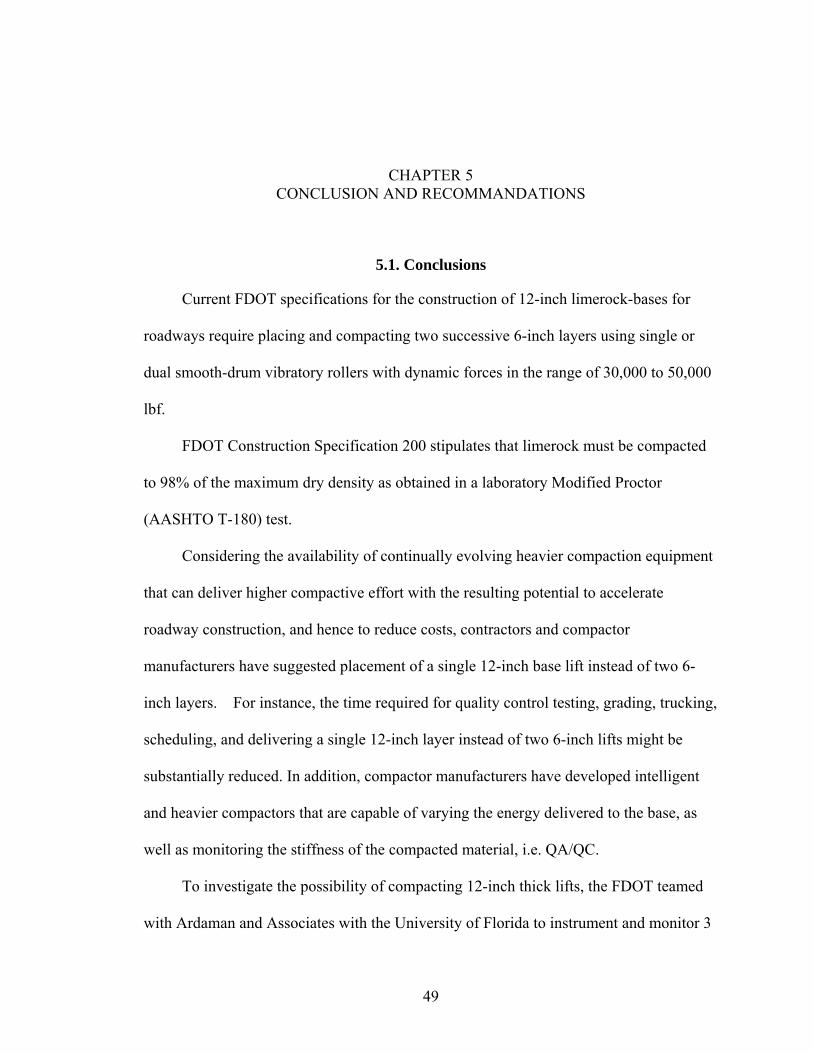
A comparison of mean ADCP data between section 1 and 2 is given in Figure 4.23.
Evident the mean for both sections are quite similar. However, the mean ADCP data for
section 3 is significantly higher than section 1, by a factor of 2. The latter suggests that
the significant energies (Fig. 4.8) from Bomag 225D resulted in particle crushing of the

46
surface (Fig 4.18), but higher strength (Fig 4.22) and stiffness (Fig 4.19) in the
underlying materials due to larger contact area and dynamic drum forces in section 3.
Figure 4.21 ACDP Data for Section 2
Table 4.7 Summary of ADCP Results for Section 2
Depth Average Blow/each depth Standard Deviation 6 29 6.7
10 50 9.3 12 59 10.5
Table 4.8 Summary of ADCP Results for Section 3
Depth Average Blow/each depth Standard Deviation 6 49 12.3
10 80 12.0 12 94 9.5
47
Figure 4.22 ACDP Data for Section 3
Figure 4.23 Comparison ADCP Data from Section 1 and 2

48
Figure 4.24 Comparison ADCP Data from Section 1 and 3
CHAPTER 5 CONCLUSION AND RECOMMANDATIONS
5.1. Conclusions
Current FDOT specifications for the construction of 12-inch limerock-bases for
roadways require placing and compacting two successive 6-inch layers using single or
dual smooth-drum vibratory rollers with dynamic forces in the range of 30,000 to 50,000
lbf.
FDOT Construction Specification 200 stipulates that limerock must be compacted
to 98% of the maximum dry density as obtained in a laboratory Modified Proctor
(AASHTO T-180) test.
Considering the availability of continually evolving heavier compaction equipment
that can deliver higher compactive effort with the resulting potential to accelerate
roadway construction, and hence to reduce costs, contractors and compactor
manufacturers have suggested placement of a single 12-inch base lift instead of two 6-
inch layers. For instance, the time required for quality control testing, grading, trucking,
scheduling, and delivering a single 12-inch layer instead of two 6-inch lifts might be
substantially reduced. In addition, compactor manufacturers have developed intelligent
and heavier compactors that are capable of varying the energy delivered to the base, as
well as monitoring the stiffness of the compacted material, i.e. QA/QC.
To investigate the possibility of compacting 12-inch thick lifts, the FDOT teamed
with Ardaman and Associates with the University of Florida to instrument and monitor 3
49
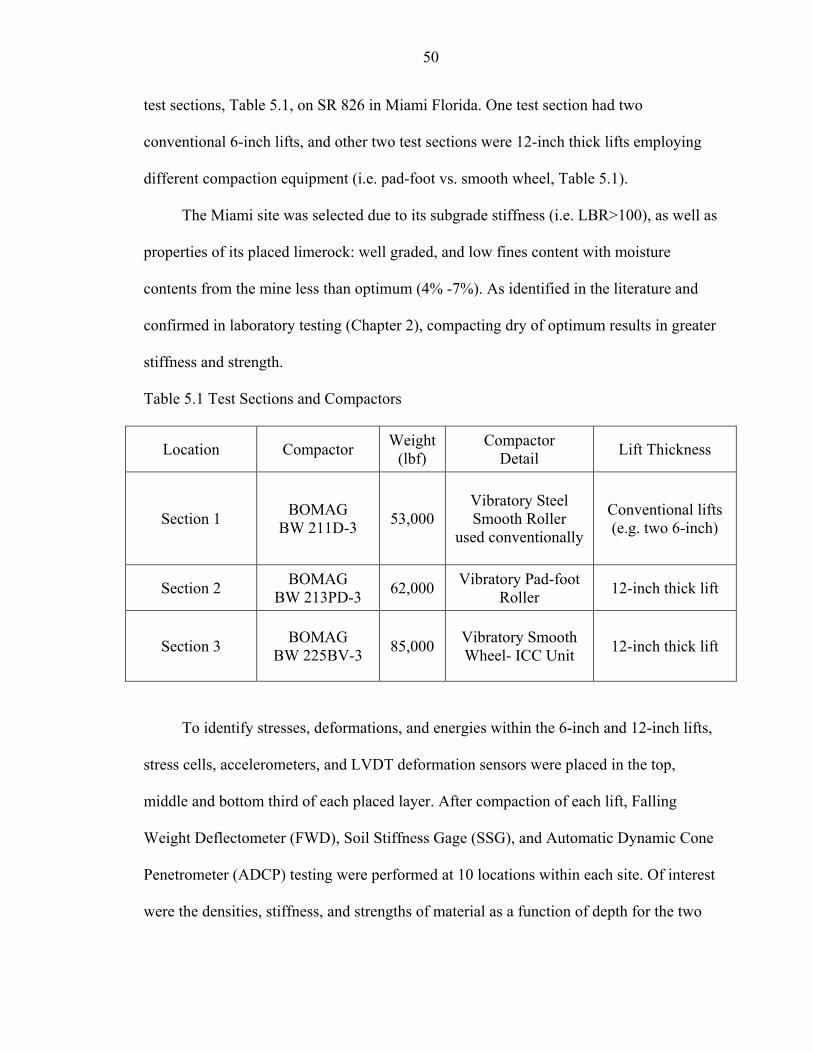
50
test sections, Table 5.1, on SR 826 in Miami Florida. One test section had two
conventional 6-inch lifts, and other two test sections were 12-inch thick lifts employing
different compaction equipment (i.e. pad-foot vs. smooth wheel, Table 5.1).
The Miami site was selected due to its subgrade stiffness (i.e. LBR>100), as well as
properties of its placed limerock: well graded, and low fines content with moisture
contents from the mine less than optimum (4% -7%). As identified in the literature and
confirmed in laboratory testing (Chapter 2), compacting dry of optimum results in greater
stiffness and strength.
Table 5.1 Test Sections and Compactors
Location Compactor Weight(lbf)
Compactor Detail Lift Thickness
Section 1 BOMAG BW 211D-3 53,000
Vibratory Steel Smooth Roller
used conventionally
Conventional lifts (e.g. two 6-inch)
Section 2 BOMAG BW 213PD-3 62,000 Vibratory Pad-foot
Roller 12-inch thick lift
Section 3 BOMAG BW 225BV-3 85,000 Vibratory Smooth
Wheel- ICC Unit 12-inch thick lift
To identify stresses, deformations, and energies within the 6-inch and 12-inch lifts,
stress cells, accelerometers, and LVDT deformation sensors were placed in the top,
middle and bottom third of each placed layer. After compaction of each lift, Falling
Weight Deflectometer (FWD), Soil Stiffness Gage (SSG), and Automatic Dynamic Cone
Penetrometer (ADCP) testing were performed at 10 locations within each site. Of interest
were the densities, stiffness, and strengths of material as a function of depth for the two
51
6-inch vs. 12-inch thick lifts. Also of importance was the Moduli, Evib, from Bomag’s
Intelligent Compaction Control (ICC) unit vs. field measured stiffness.
As expected, the two 6-inch lifts, Section 1, reached 98% of maximum dry
densities within 3 to 5 passes of the conventional smooth steel vibratory compactor.
Strains within the lifts were 6 to 9% with appreciable increase in density occurring within
the lower lift as the upper lift was compacted.
Compaction of Section 2, a 12-inch thick lift, occurred with alternating passes of
Bomag 213PD (5 passes), i.e., a vibratory a pad-foot roller, and a Bomag 211D-3,
vibratory smooth wheel roller to smooth the base surface in order obtain accurate
moisture and density measurements. From the field instrumentation, the strains and back
computed densities (nuclear density probe (NDP)) in the bottom and the middle of the
section 2 were quite similar. In addition, the energies and stiffness throughout the depth
compared quite favorably. Surface stiffness measured with either FWD or SSG were
similar or slightly higher with the thick lift, 12-inch section vs. the conventional section 1.
Strength measured by ADCP and its associated coefficient of variability were quite
similar for both section 1 and section 2.
Section 3 was a 12-inch thick lift base compacted with the smooth wheel Bomag
225 vario-conrol Compactor, which continuously monitor surface stiffness and varies
energies based on moduli, Evib. The compactor had the greatest dynamic force, 85,000 lbf,
of any of the tested units. The measured strains with depth were quite uniform with depth
and the highest of all the test sections, 20%. Similarly, the strength measured with depth
by the ADCP was also the highest of all the test sections, i.e. factor of 2. Unfortunately,
even though the vario-control unit was run in both the automatic and the manual mode,
52
the surface stiffness or moduli, Evib, decreased with pass number and was quite variable
over the section. The variability attributed to particle crushing of the surface particles,
since the measured stiffness, and strength, increased in depth with pass based on buried
instrumentation and ADCP results.
From the study, it was concluded that thick lift, 12-inch, compaction of limestone
base courses was achievable under the following conditions:
• Subgrade material of sufficient strength and stiffness, i.e., LBR value over 100.
• The compaction process should be conducted with moisture contents on dry part of optimum, i.e., 5~8% vs. 9% optimum moisture content.
• Vibratory padfoot roller with at least 60,000 lbf of dynamic force or vibratory heavy steel smooth roller above 85,000 lbf dynamic force.
5.2. Recommendations for Future Testing
With the successful compaction of thick lift limestone base course in south Florida,
the question of its use in central and north Florida remains. Miami was selected due to its
expected high potential for success considering characteristic well graded, low-fines
limerock materials, moisture content dry of optimum, and stiff subgrade conditions, i.e.,
typically having LBR values greater than 100.
The next potential test scenario of base thick lift are:
• Base thick lift will be placed on limerock subgrade with stiffness LBR>40.
• Limerock material with higher fine content and moisture content wet of optimum will be used as base material to be compacted with vibratory pad-foot roller with at least 60,000 lbf of dynamic force.
Also, the stiffness (FWD and SSG) and strengths (ADCP) devices should be the
minimum instrumentation used in the future study.

CHAPTER 6 ACKNOWLEDGEMENT
FDOT would like to thanks the following:
1. The Research Team for planning and execution of the project
2. State Construction Office, State Materials Office and D-6 Construction Office
3. Ardaman and Associates
4. University of Florida
5. Bomag America for providing both the 213 and 225 compactors.
53

APPENDIX A SIEVE ANALYSES
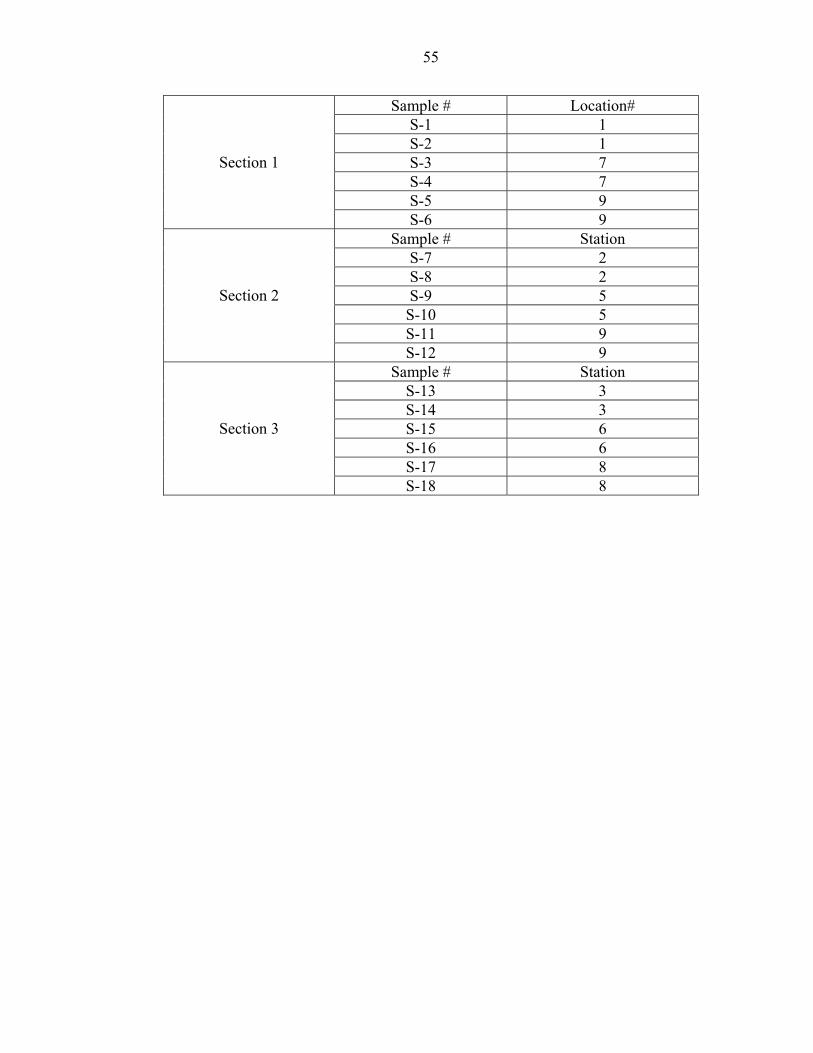
55
Sample # Location# S-1 1 S-2 1 S-3 7 S-4 7 S-5 9
Section 1
S-6 9 Sample # Station
S-7 2 S-8 2 S-9 5
S-10 5 S-11 9
Section 2
S-12 9 Sample # Station
S-13 3 S-14 3 S-15 6 S-16 6 S-17 8
Section 3
S-18 8
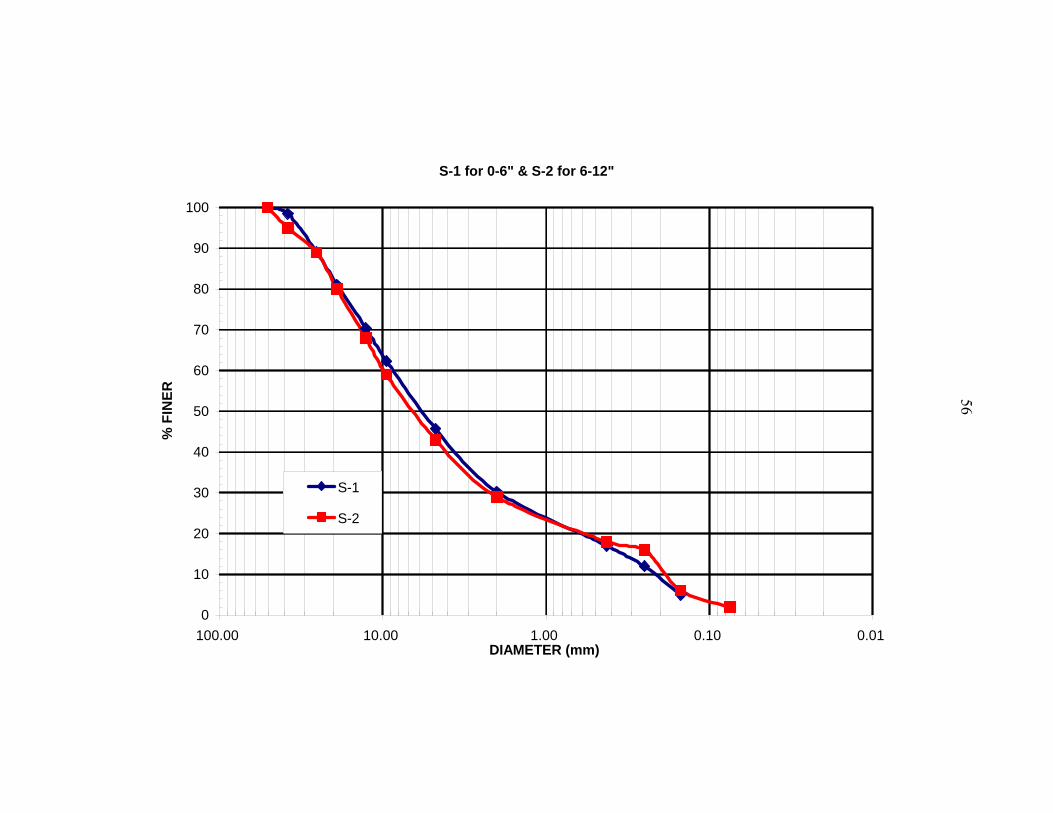
56
S-1 for 0-6" & S-2 for 6-12"
0
10
20
30
40
50
60
70
80
90
100
0.010.101.0010.00100.00DIAMETER (mm)
% F
INER
S-1
S-2

57
S-3 for 0-6" & S-4 for 6-12"
0
10
20
30
40
50
60
70
80
90
100
0.010.101.0010.00100.00DIAMETER (mm)
% F
INER
S-3
S-4
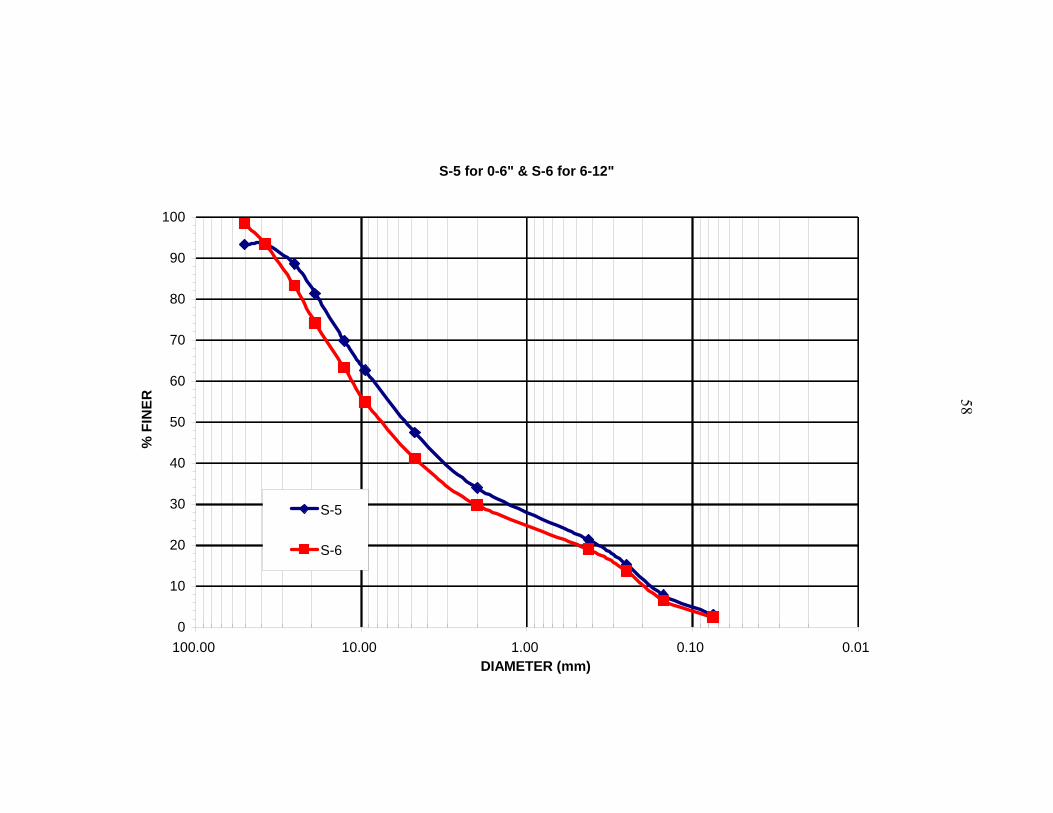
58
S-5 for 0-6" & S-6 for 6-12"
0
10
20
30
40
50
60
70
80
90
100
0.010.101.0010.00100.00DIAMETER (mm)
% F
INER
S-5
S-6
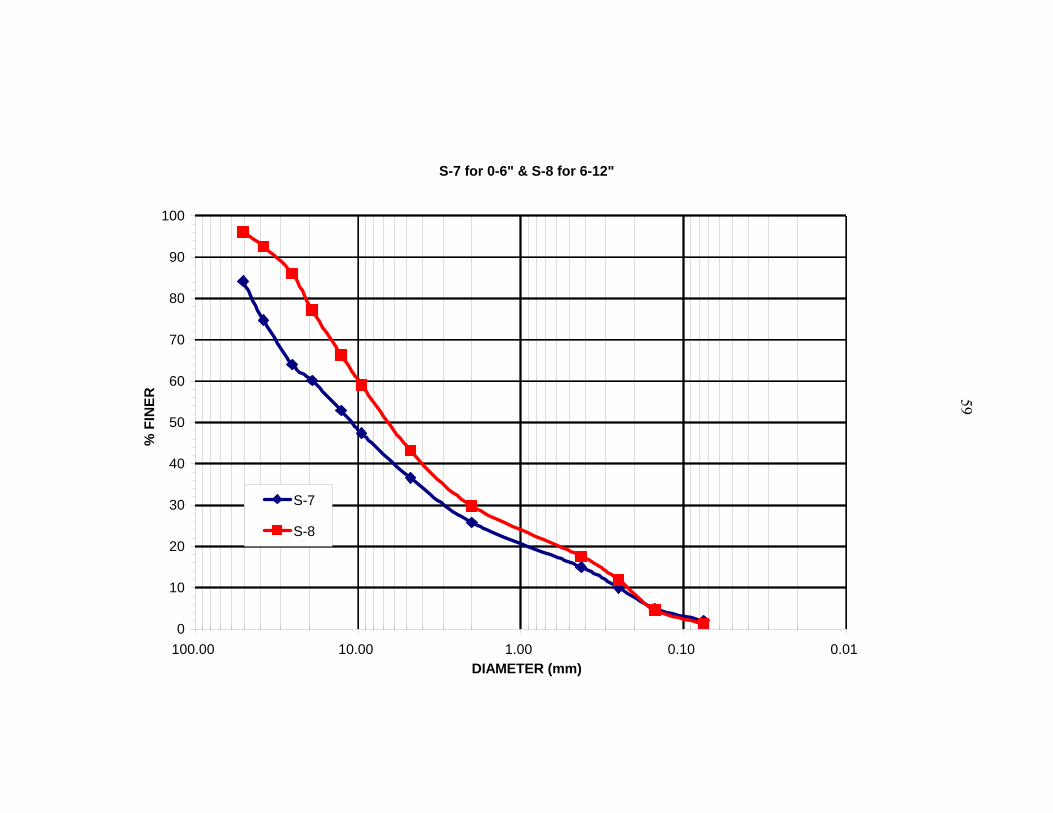
59
S-7 for 0-6" & S-8 for 6-12"
0
10
20
30
40
50
60
70
80
90
100
0.010.101.0010.00100.00DIAMETER (mm)
% F
INER
S-7
S-8
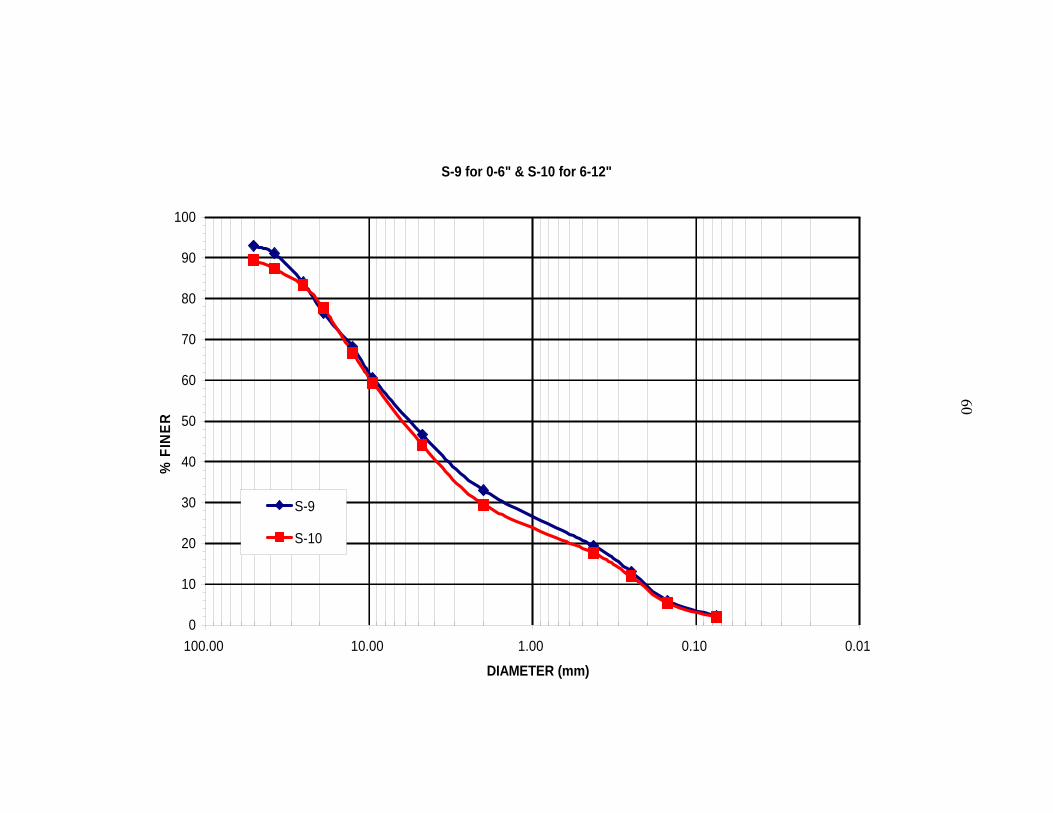
S-9 for 0-6" & S-10 for 6-12"
0
10
20
30
40
50
60
70
80
90
100
0.010.101.0010.00100.00
DIAMETER (mm)
% F
INER
S-9
S-10
60
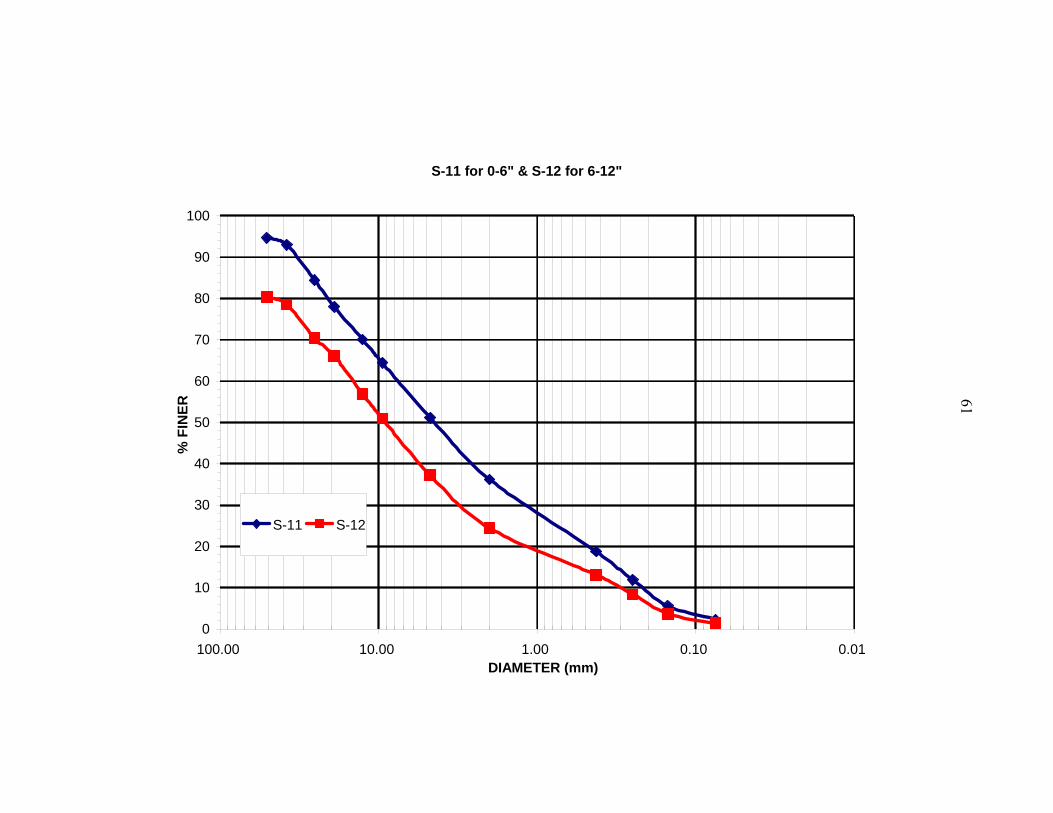
S-11 for 0-6" & S-12 for 6-12"
0
10
20
30
40
50
60
70
80
90
100
0.010.101.0010.00100.00DIAMETER (mm)
% F
INER
S-11 S-12
61
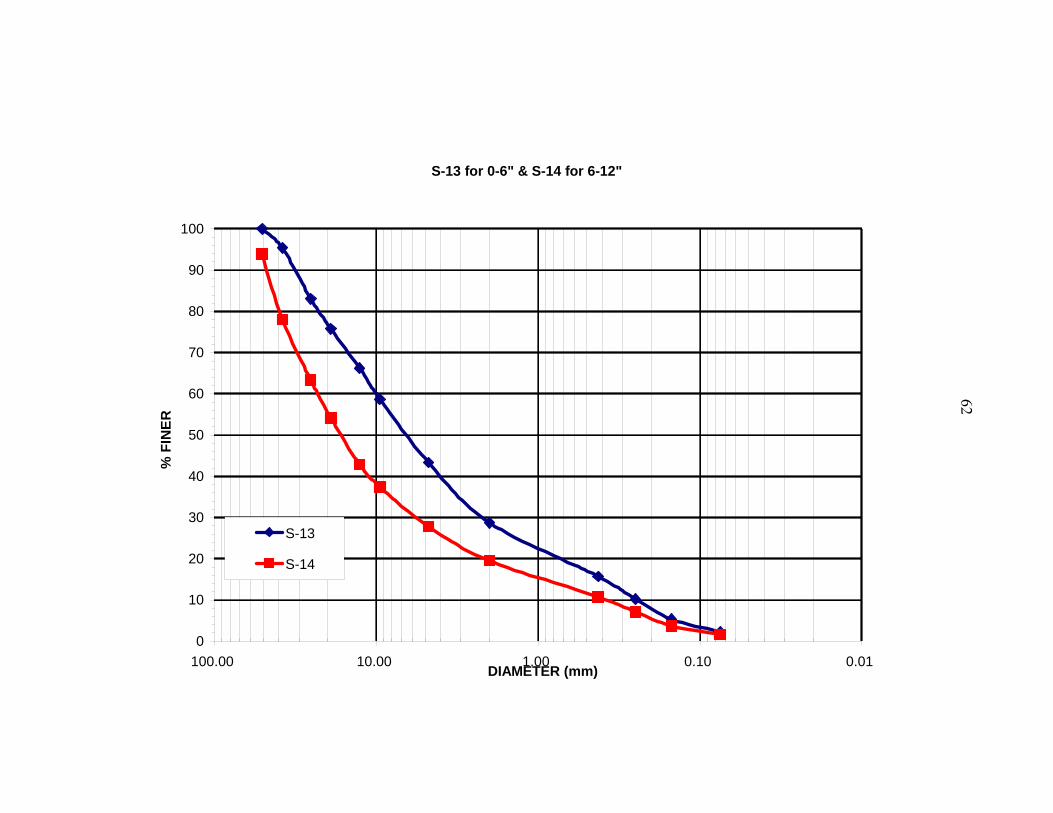
S-13 for 0-6" & S-14 for 6-12"
0
10
20
30
40
50
60
70
80
90
100
0.010.101.0010.00100.00DIAMETER (mm)
% F
INER
S-13
S-14
62
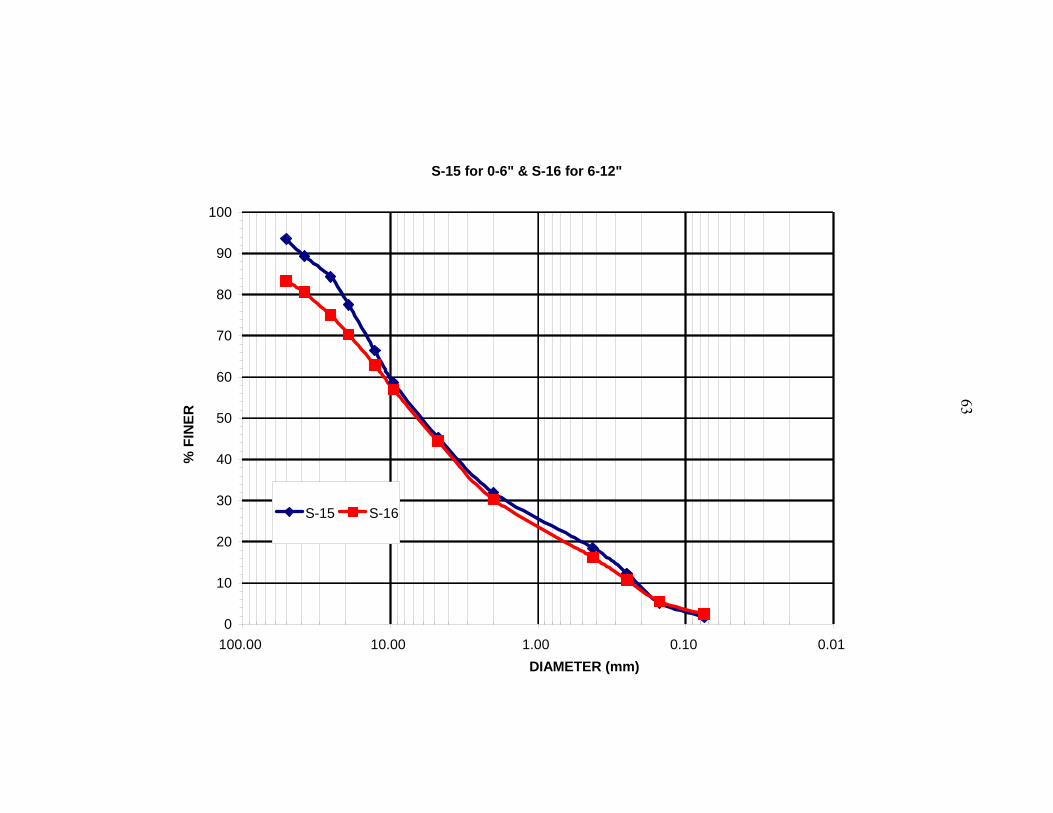
S-15 for 0-6" & S-16 for 6-12"
0
10
20
30
40
50
60
70
80
90
100
0.010.101.0010.00100.00DIAMETER (mm)
% F
INER
S-15 S-16
63

S-17 for 0-6" & S-18 for 6-12"
0
10
20
30
40
50
60
70
80
90
100
0.00.11.010.0100.0DIAMETER (mm)
% F
INER
S-17
S-18
64

APPENDIX B MOISTURE CONTENTS FROM NUCLEAR DENSITY PROBE
66
67
67
68
68

APPENDIX C LAB OVEN-DRIED MOISTURE CONTENTS
70
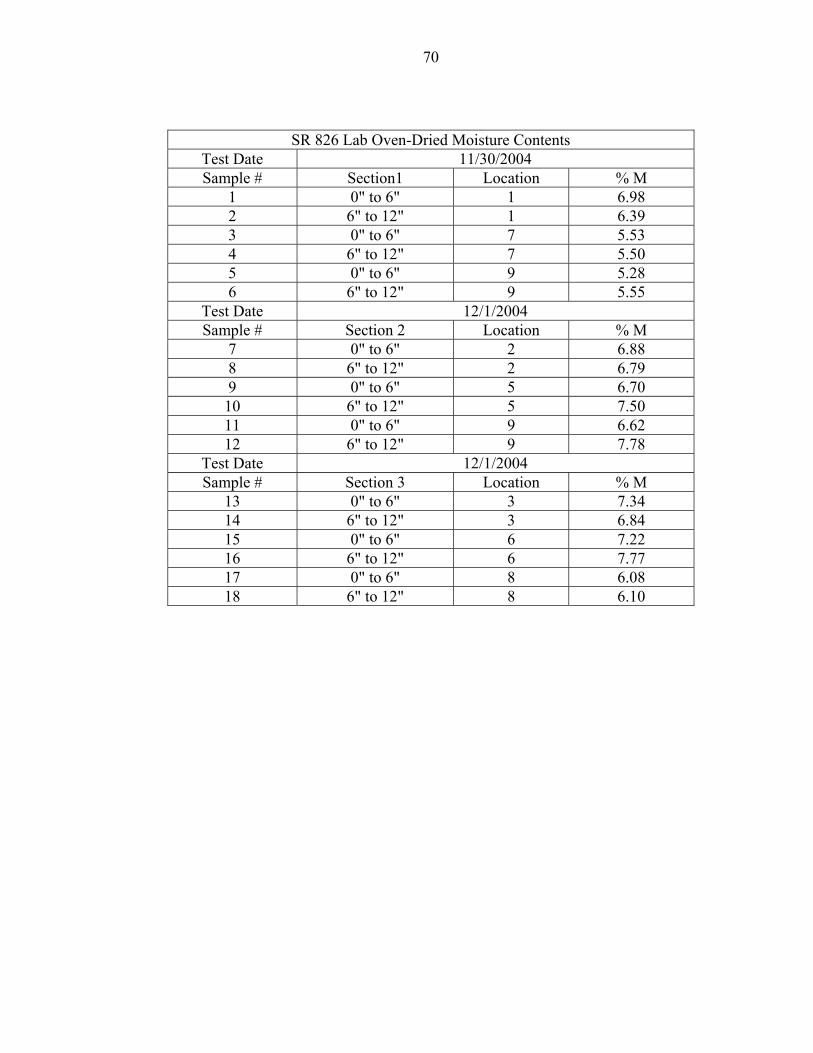
SR 826 Lab Oven-Dried Moisture Contents Test Date 11/30/2004 Sample # Section1 Location % M
1 0" to 6" 1 6.98 2 6" to 12" 1 6.39 3 0" to 6" 7 5.53 4 6" to 12" 7 5.50 5 0" to 6" 9 5.28 6 6" to 12" 9 5.55
Test Date 12/1/2004 Sample # Section 2 Location % M
7 0" to 6" 2 6.88 8 6" to 12" 2 6.79 9 0" to 6" 5 6.70
10 6" to 12" 5 7.50 11 0" to 6" 9 6.62 12 6" to 12" 9 7.78
Test Date 12/1/2004 Sample # Section 3 Location % M
13 0" to 6" 3 7.34 14 6" to 12" 3 6.84 15 0" to 6" 6 7.22 16 6" to 12" 6 7.77 17 0" to 6" 8 6.08 18 6" to 12" 8 6.10

APPENDIX D INSTRUMENTATION DATA REDUCTION

72
D.1. Calculation for reducing data
D.1.1. Stress Cell
Stress (psi) = (Raw Data-Initial Value) (Volts)*100(psi/Volts) (Initial Value is the average value of values measured during last 0.4 sec in whole measuring time, 10 sec) D.1.2. Strain Sensors
Strain= (Raw Data-Initial Value) (Volts)*Factor(in/Volts)/ Initial Gage Height (Initial Value is measured before test) Calibration Factors for reducing of Strain Sensors Section 1 Section 2 Section 3 CH 6 (Bottom 1/3) 0.4072 0.3966 0.4054 CH 7 (Middle 1/3) 0.4058 0.4054 0.3990 Calibration factors provided by LVDT manufacturer.

73
D.1.3. Acceleration
Acceleration (in/sec2) = (Raw Data-Initial Value) (Volts) *Factor (g/Volts) *32.17417*12 (Initial Value is the average value of values measured during last 0.4 sec in whole measuring time, 10 sec) Calibration Factor for Accelerometers Section 1 Section 2 Section 3 CH 1 (Bottom) 2.5497 2.5484 2.5259 CH 3 (Middle) 2.5484 2.5368 2.5510 CH 5 (Top) 2.5478 2.5336 2.5272 Calibration factors provided by accelerometer manufacturer. D.1.4. Velocity & Displacement from Acceleration Data
1 1
1 1
( ) / 2 ( )( ) / 2 ( )
i i i i i i
i i i i i i
V A A T T V 1
1D V V T T D− − −
− − −
= + × − +
= + × − +
Where, 1,i iA A − is acceleration of desired time and previous time of one step before desired time.
1,i iV V − is velocity of desired time and previous time of one step before desired time.
1,i iD D − is displacement of desired time and previous time of one step before desired time.
1,i iT T − is desired time and previous time of one step before desired time. D.1.5. Dynamic Stiffness
Stress-displacement curves were generated using displacements derived from accelerometers mounted on the stress cells which represent dynamic soil particle movement. Dynamic stiffness was evaluated using the stress-displacement for the vibratory impact that resulted in the peak measured stress, i.e., for the dynamic loading that occurred when the compactor was located directly above the instrumentation.
Data reduction for dynamic stiffness evaluation involved matching the displacement derived from accelerometer to the displacement measured by the corresponding LVDT. An iterative approach was used in which accelerometer reference values were adjusted to compensate for slight tilt-induced drift until derived velocity and displacement values were consistent with corresponding velocities and displacements measured with the LVDTs.
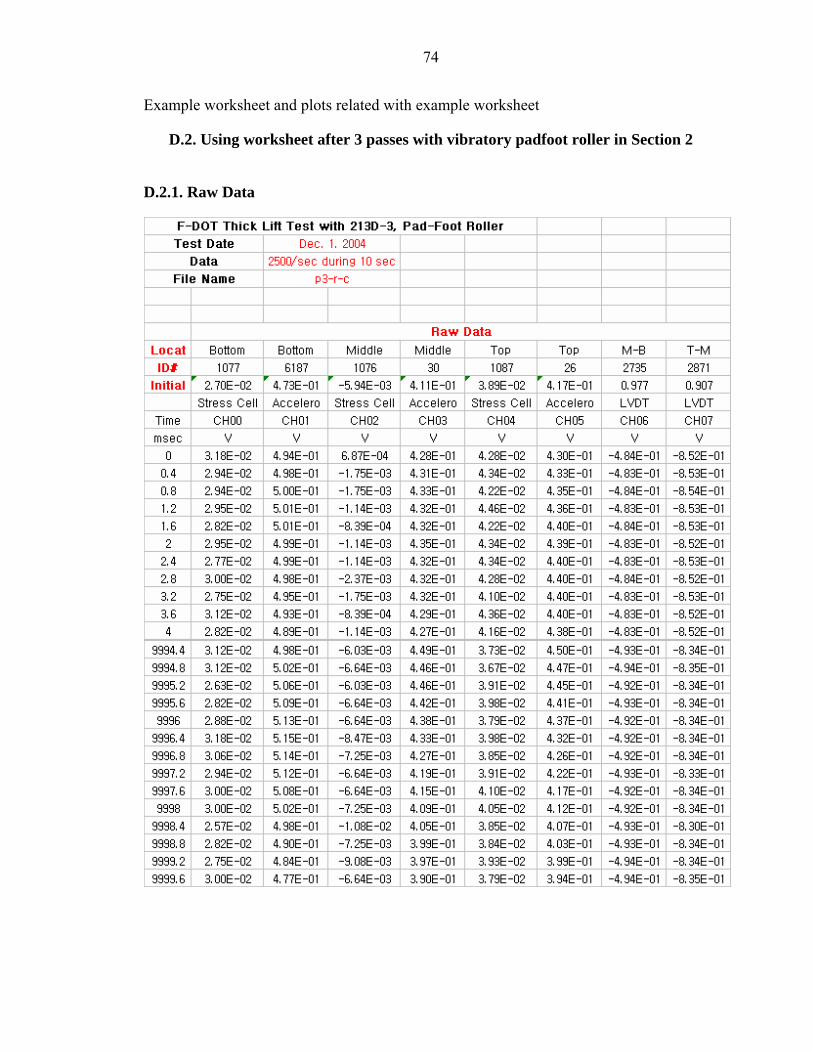
74
Example worksheet and plots related with example worksheet
D.2. Using worksheet after 3 passes with vibratory padfoot roller in Section 2
D.2.1. Raw Data
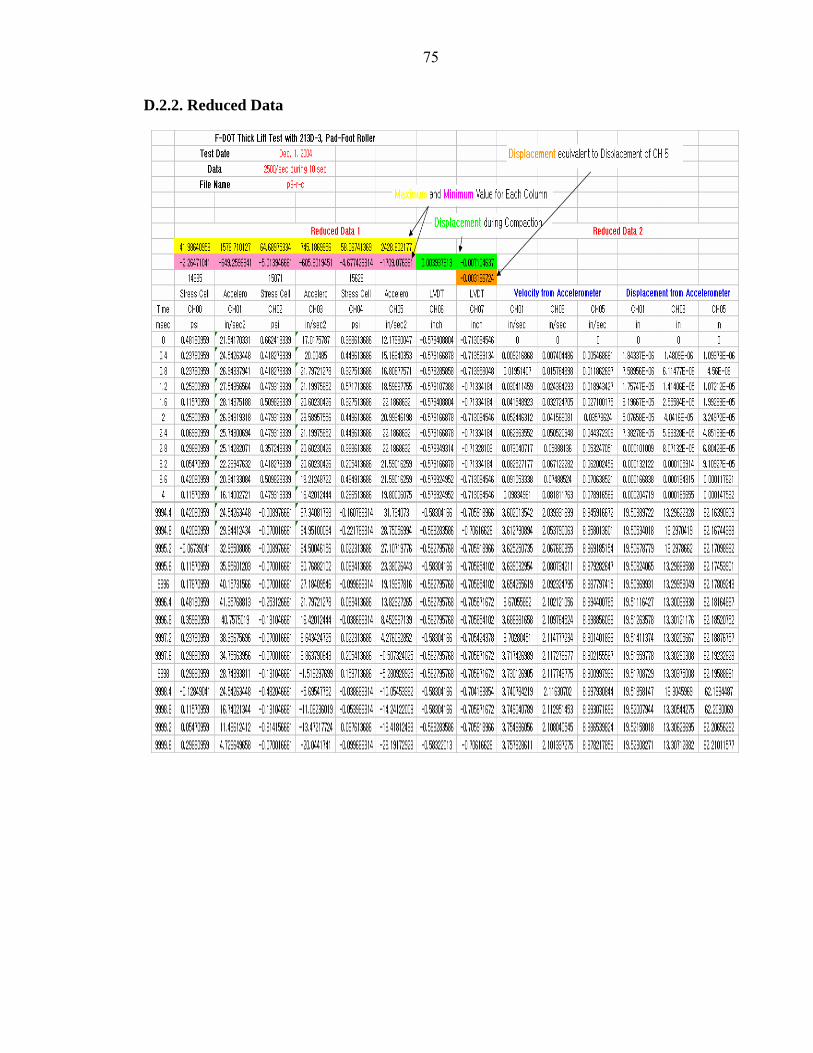
D.2.2. Reduced Data
75
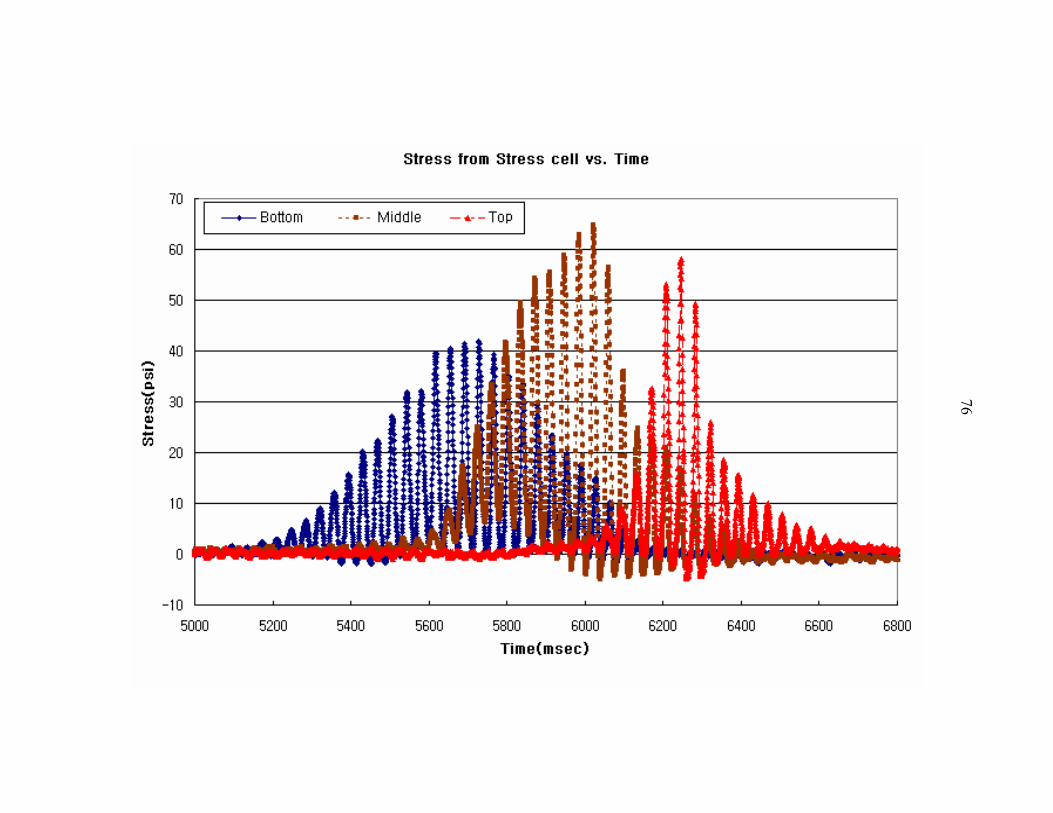
76

77
77
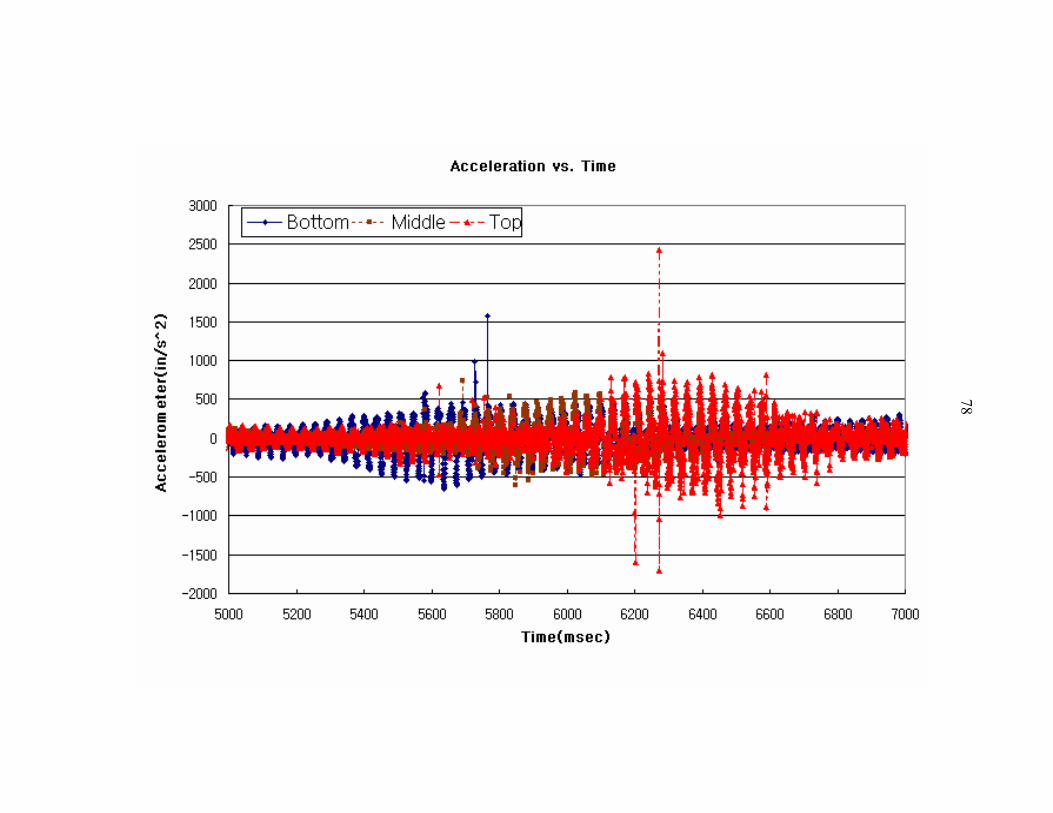
78

APPENDIX E SSG RESULTS

80
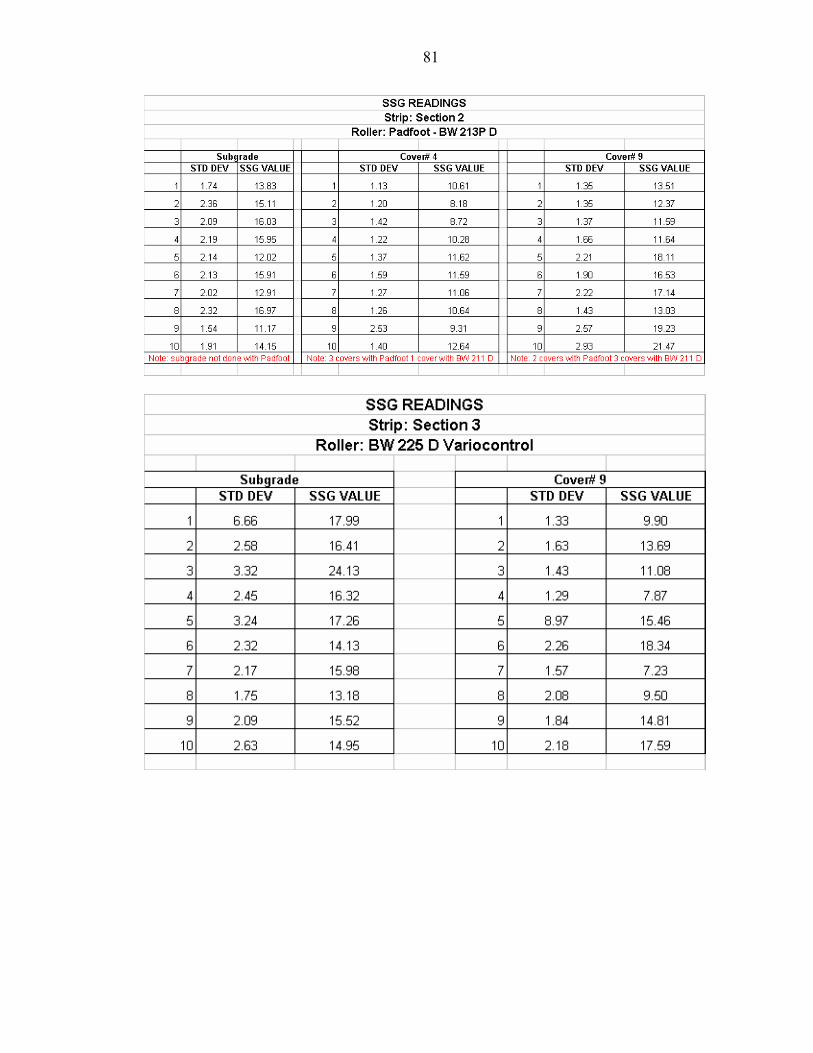
81

APPENDIX F FWD RESULTS
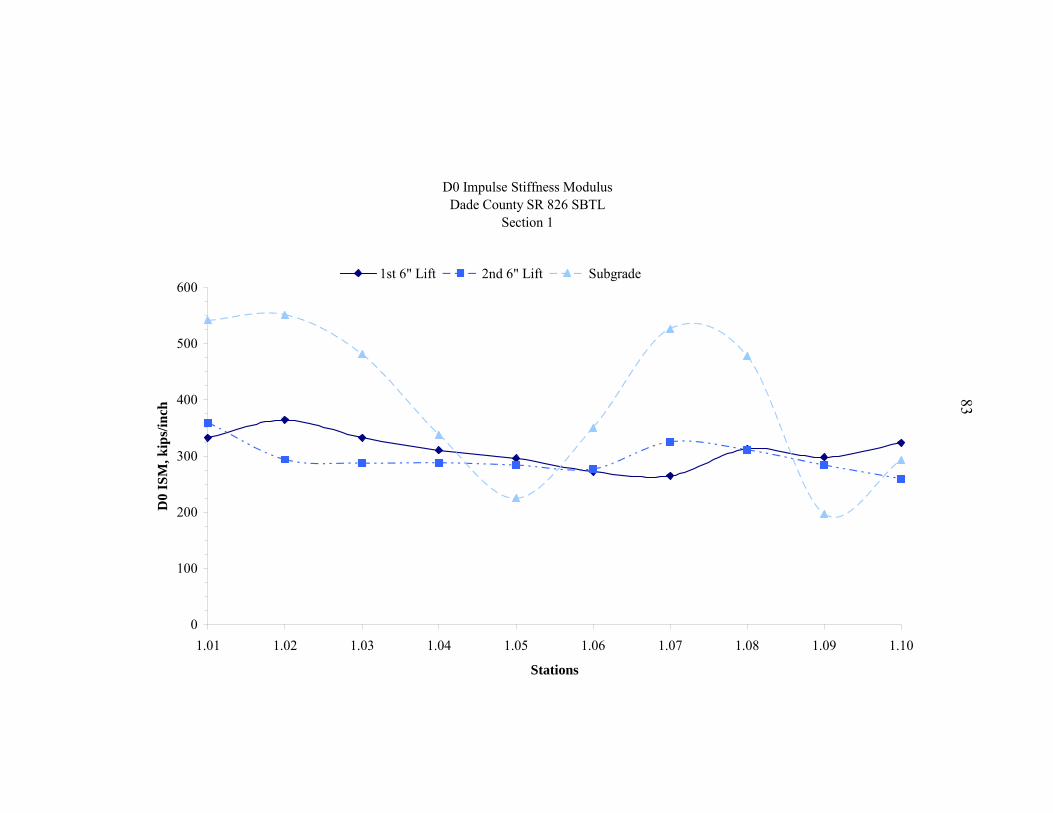
D0 Impulse Stiffness ModulusDade County SR 826 SBTL
Section 1
0
100
200
300
400
500
600
1.01 1.02 1.03 1.04 1.05 1.06 1.07 1.08 1.09 1.10
Stations
D0
ISM
, kip
s/in
ch
1st 6" Lift 2nd 6" Lift Subgrade
83
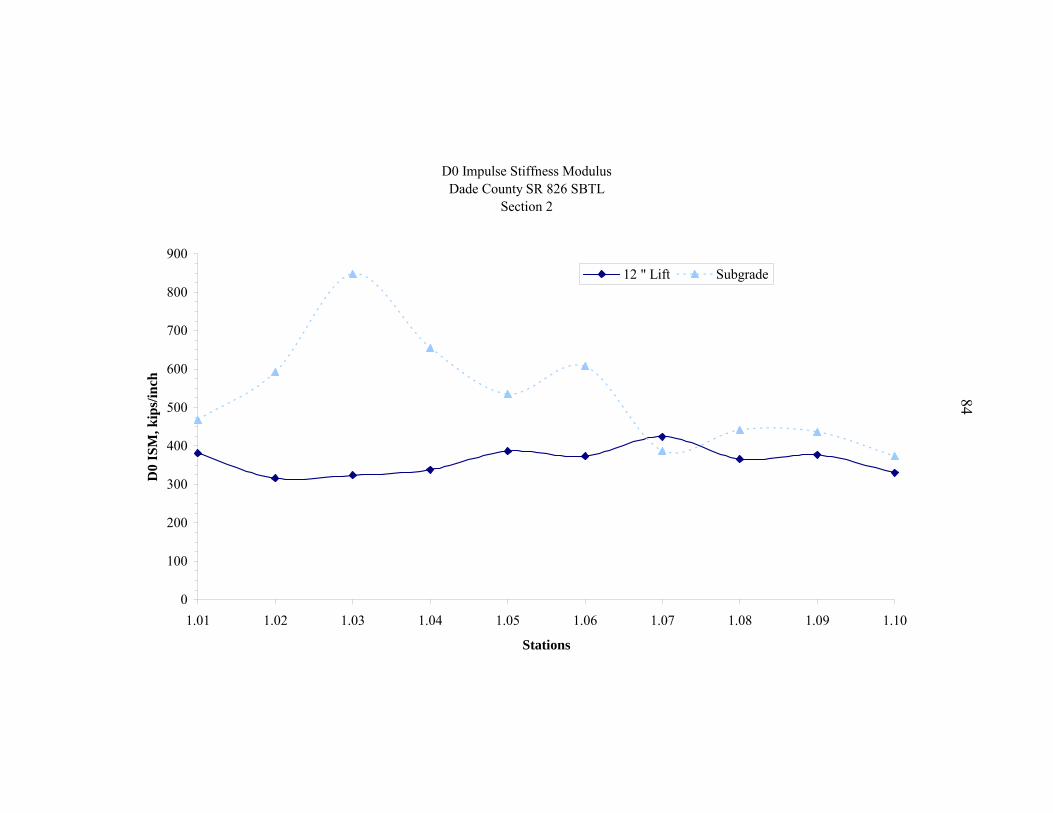
D0 Impulse Stiffness ModulusDade County SR 826 SBTL
Section 2
0
100
200
300
400
500
600
700
800
900
1.01 1.02 1.03 1.04 1.05 1.06 1.07 1.08 1.09 1.10
Stations
D0
ISM
, kip
s/in
ch
12 " Lift Subgrade
84

85
D0 Impulse Stiffness ModulusDade County SR 826 SBTL
Section 3
0
200
400
600
800
1000
1200
1.01 1.02 1.03 1.04 1.05 1.06 1.07 1.08 1.09 1.10
Stations
D0
ISM
, kip
s/in
ch
12 " Lift Subgrade

APPENDIX G ADCP RESULTS
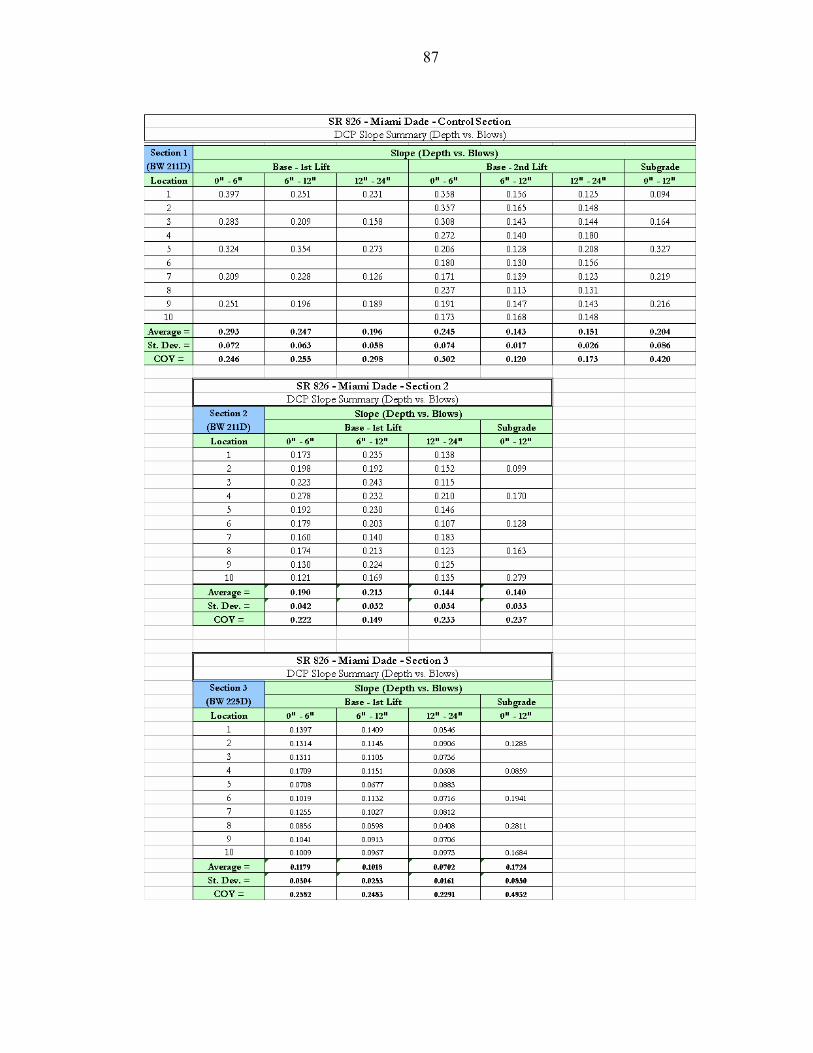
87

88
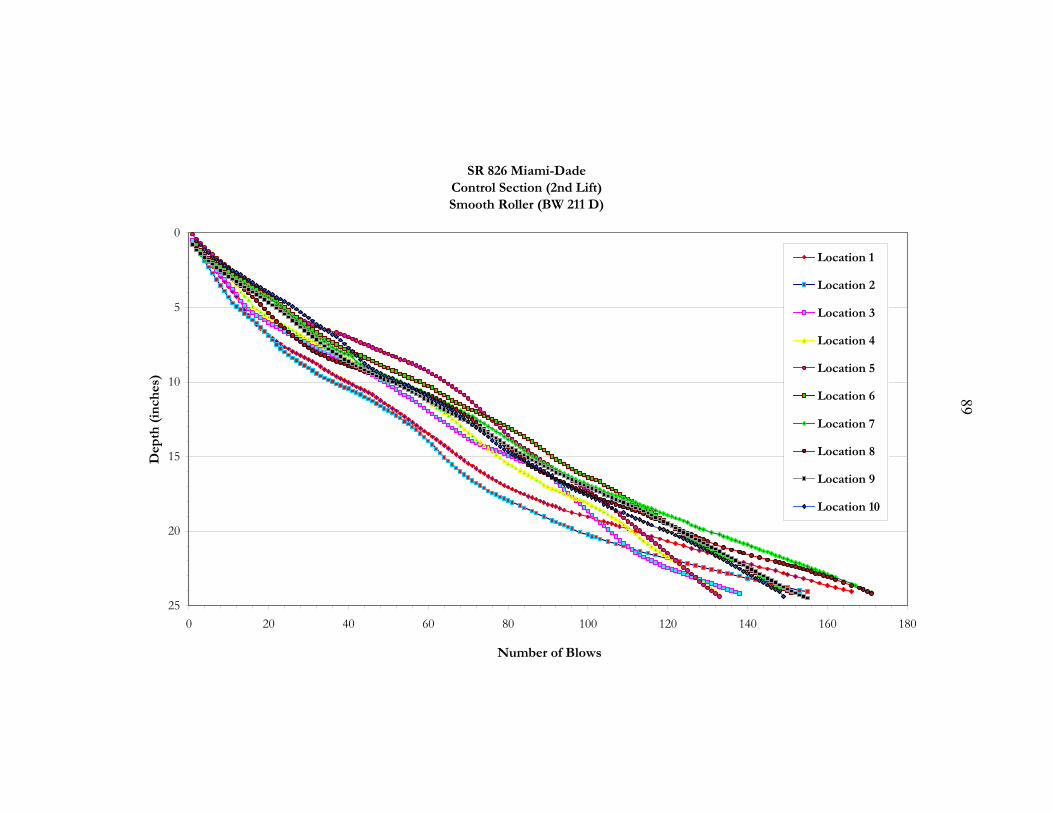
SR 826 Miami-DadeControl Section (2nd Lift)Smooth Roller (BW 211 D)
0
5
10
15
20
250 20 40 60 80 100 120 140 160 180
Number of Blows
Dep
th (
inch
es)
Location 1
Location 2
Location 3
Location 4
Location 5
Location 6
Location 7
Location 8
Location 9
Location 10
89
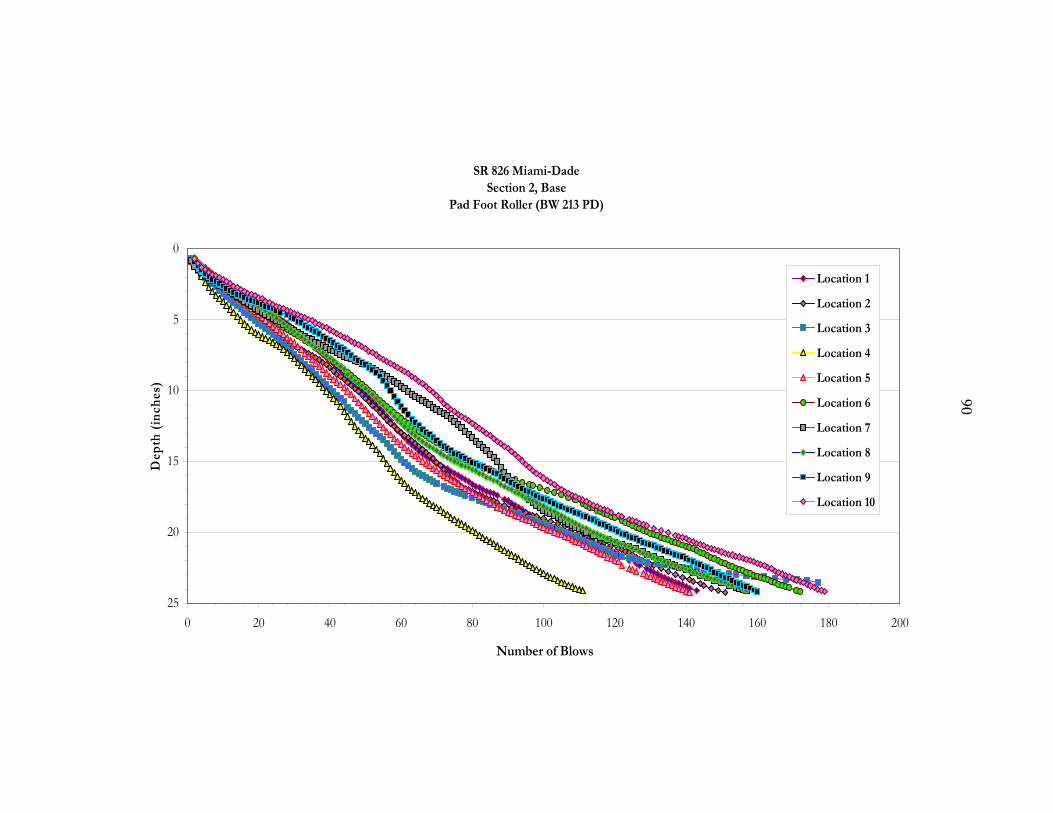
SR 826 Miami-DadeSection 2, Base
Pad Foot Roller (BW 213 PD)
0
5
10
15
20
250 20 40 60 80 100 120 140 160 180 200
Number of Blows
Dep
th (
inch
es)
Location 1
Location 2
Location 3
Location 4
Location 5
Location 6
Location 7
Location 8
Location 9
Location 10
90
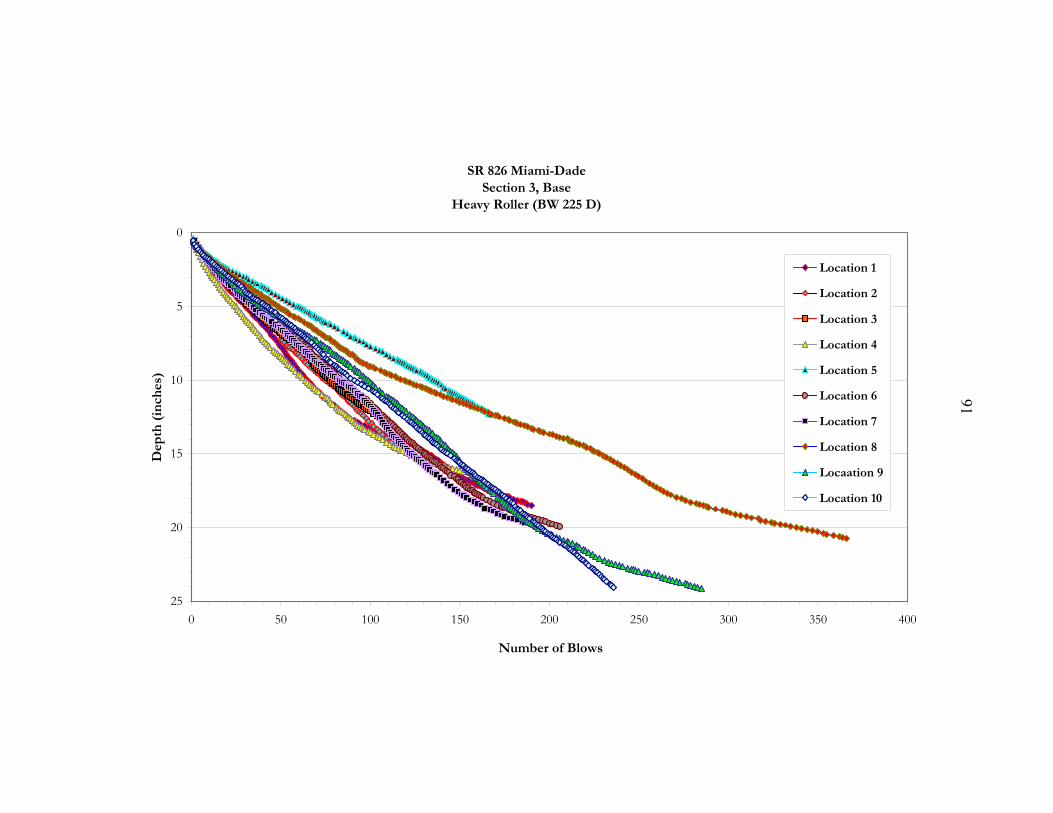
91
SR 826 Miami-DadeSection 3, Base
Heavy Roller (BW 225 D)
0
5
10
15
20
250 50 100 150 200 250 300 350 400
Number of Blows
Dep
th (
inch
es)
Location 1
Location 2
Location 3
Location 4
Location 5
Location 6
Location 7
Location 8
Locaation 9
Location 10
LIST OF REFERENCES
Forssblad, L.,1977, “Vibratory Compaction in the Construction of Roads, Airfields, Dams, and Other Projects,” Research Report No. 8222, Dynapac, S-171, No. 22, Solna, Sweden as referenced in Hausmannn(1990).
US Army Engineering Waterways Experiment Station COE, 1976, “Notes for Earthwork Construction Inspectors Course,” Vicksburg, MS.
Townsend, F.C. & Anderson, B., 2004, “A Compendium of Ground Modification Techniques,” Research Report BC-354, pp. 16~60. Florida Department of Transportation (FDOT).
Forssblad, L., 1965, “Investigations of Soil Compaction by Vibration” Acta Polytechnica Scandinavia, No. Ci-34, Stockholm.
Bernhard,R.K., 1952, “Static and Dynamic Soil Compaction,” Proc. HRB, Vol. 31, 1952, pp. 563~591.
Parsons, A.W., Krawczyk, J. and Cross, J.E., Mar.1962, “An Investigation of the performance of an 8.5 ton Vibrating Roller for the Compaction of Soil” Road Research Laboratory Note. LN/64/ AWP.JK.JEC.
Turnbull, W.J., and Foster, C.R., 1956, “Stabilization of Materials by Compaction”, Journal of the Soil Mechanics and Foundations Division, American Society of Civil Engineers, Vol. 82, No.SM2, pp.934-1~934-23.
Seed, H.B., and Chan, C.K., 1959, “Structure and Strength Characteristics of Compacted Clays”, Journal of the Soil Mechanics and Foundations Division, American Society of Civil Engineers, Vol.85, No. SM5, pp.87~128.
Kloubert, H.J, 2001, “New intelligent compaction system for vibratory rollers” Report for IRF in Paris.
Yoo, T.S., 1975, “A Theory for Vibratory Compaction of Soil”, The Dissertation for Degree of Doctor of Philosophy to University of New York at Buffalo
92
Related Documents