An-Najah National University Faculty of Graduate Studies Evaluating the Supply Chain Management System of Palestinian companies By Ahmed Bassam Abdullah Supervisor Dr. Husam Arman This Thesis is Submitted in Partial Fulfillment of the Requirements for the Degree of Master of Engineering Management, to The Faculty of Graduate Studies, at An-Najah National University, Nablus, Palestine 2011

Welcome message from author
This document is posted to help you gain knowledge. Please leave a comment to let me know what you think about it! Share it to your friends and learn new things together.
Transcript

An-Najah National University
Faculty of Graduate Studies
Evaluating the Supply Chain Management System of Palestinian companies
By Ahmed Bassam Abdullah
Supervisor
Dr. Husam Arman
This Thesis is Submitted in Partial Fulfillment of the Requirements for
the Degree of Master of Engineering Management, to The Faculty of
Graduate Studies, at An-Najah National University, Nablus, Palestine
2011


III
Acknowledgment
In the beginning I thank God and praise Him in a manner that
befits the (infinite) number of His creation, and as it pleases Him, for
supporting me in the completion of this work. I would like to express
my gratitude to my supervisor Dr. Husam Arman for being an
outstanding advisor and excellent professor. His constant
encouragement, support, and invaluable suggestions made this work
successful. He has been everything that one could want in an advisor.
Words fail me to express my appreciation to my wife Eng.
Ghadeer whose dedication, love and persistent confidence in me, has
taken the load off my shoulder. I owe her for being unselfishly let her
intelligence, passions, and ambitions collide with mine.
Finally, I would like to thank everybody who was important to
the successful realization of thesis, as well as expressing my apology
that I could not mention personally one by one.

V
الإقرار
:أنا الموقع أدناه مقدم الرسالة التي تحمل العنوان
Evaluating the Supply Chain Management System of Palestinian companies
باستثناء ما تمت الإشارة إليه حيثما , اقر بأن ما اشتملت عليه ھذه الرسالة إنما نتاج جھدي الخاص
ي جزء منھا لم يقدم من قبل لنيل أية درجة علمية أو بحث أو أ, و أن ھذه الرسالة ككل, ورد
.علمي أو بحثي لدى أية مؤسسة تعليمية أو بحثية أخرى
Declaration
The work provided in this thesis, unless otherwise referenced, is the researcher’s own work, and has not been submitted elsewhere for any other
degree or qualification.
Student Name : اسم الطالب :
Signature : التوقيع :
Date : التاريخ :

VI
Contents
Content Page Acknowledgment III Declaration V List of Figures VIII List of Tables IX APREVIATION X 1 Introduction 1
1.1 Overview 1 1.2 Research Questions 2 1.3 Research aim and objectives 2 1.4 Research design and methodology 3 1.5 Thesis Outline 4 2 Literature review 6
2.1 Introduction 6 2.2 Supply chain and Supply Chain Management 8 2.3 E-Supply chain 13 2.4 Global supply chain 15 2.5 The Objective of a Supply Chain 17 2.6 Logistics Network strategy 38 2.7 Supply Chain Management: Demand Planning 43 2.8 Supplier relationship 522.9 Supply Chain Management: Customer Relationship 54
2.10 Supply Chain drivers and Metrics 58 3 Methodology 71
3.1 Introduction 71 Theme1: Supply chain management concept and its impact on the
success of the firm 71
Theme 2: Competitive and supply chain strategies 72 Theme 3: Supplier relations 72 Theme 4: Customer relation 72
3.2 Research Background 73 3.3 Research Design and Methodology 74 3.4 Research Approach 80 3.5 Research methodology description 88 4 Data gathering and analysis 91
4.1 Introduction 914.2 Theme (1) Supply chain management on the firm 94 4.3 Theme (2) Competitive and supply chain strategies 100

VII
4.4 Theme (3) Supplier relations 104 4.5 Theme (4) Customer relation 115 4.6 Findings and conclusions 126 5 Framework 127
5.1 Introduction 1275.2 Palestine business environment constraints 130 5.3 Generic Supply chain Management Framework 136 6 Conclusions and Recommendations 173
6.1 Thesis conclusions summary 173 6.2 Contribution to knowledge and practice 175 6.3 Recommendations 175 6.4 Future works 176
References 178 Appendecies 183 ب الملخص

VIII
LIST OF FIGURE
Figure 2.1 Overview of supply chain management 12
Figure 2.2 Classification of forecasting techniques 45
Figure 3.1 The Qualitative versus the Quantitative Approach 83
Figure 4.1 Geographical distribution of the surveyed firms 92
Figure 4.2 The percent of each sectors forming the sample 93
Figure 4.3 Elements should be managed in the supply chain 95
Figure 4.4 Production process approach 97
Figure 4.5 Companies’ competitive advantage strategy 101
Figure 4.6 Strategic fit between supply chain strategy and
competitive advantage
102
Figure 4.7 Mechanism to achieve the strategic goals with
managing the relationship with customer
118
Figure 4.8 Delivery fulfillment performance 119
Figure 4.9 Company's using of customer desire information to
provide individual customer needs
121
Figure 4.10 Application of (postponement) 122
Figure 4.11 Used postponement form 123
Figure 5.1 Conceptual framework 141
Figure 5.2 Business strategy formulation 143
Figure 5.3 A model of competitive advantage 145
Figure 5.4 Source of competitive advantage 146
Figure 5.5 Uncertainty spectrum 155
Figure 5.6 The cost-responsiveness efficient frontier 156
Figure 5.7 Zone of strategic fit 159
Figure 5.8 Cross functional consistent strategies 160

IX
Figure 5.9 SCOR model 162
LIST OF TABLES
TABLE Content Page
1.1 Outline of the thesis 5
2.1 Types of operations strategies 27
2.2 Types of inventorieS 48
2.3 Facility metrics 61
2.4 Inventory metrics 62
2.5 Transportation metrics 63
2.6 Information metrics 65
2.7 Sourcing metrics 67
2.8 Pricing metrics 70
4.1 Chi Square to investigate the relation between the ackground 99
4.2 Ranking of the supplier selection criteria 105
4.3 Ranking of the supplier selection criteria 106
4.4 Chi Square to investigate the relation between
company/supplier
112
4.5 Chi Square to investigate the relation between
ompany/supplier
113
4.6 Company customer relationship management 115
4.7 Chi Square to investigate the relation between company’s
actions to establish long
117
4.8 Chi Square to investigate the relation between the percent 120
4.9 Chi Square to investigate the relation between production 124
4.10 Chi Square to investigate the relation between anufacturing
according
125
5.1 Comparison of efficient and responsiveness supply chains 166

X
APREVIATION
SCM Supply Chain Management
CLM Council of Logistic Management
PFI Palestine Federal Industries
PCBS Palestinian Central Bureau of Statistics
EDI Electronic Data Interchange
ERP Enterprise Resource Planning
RFID Radio Frequency Identification

XI
Evaluating the Supply Chain Management System of Palestinian companies
By Ahmed Bassam Abdullah
Supervisor Dr. Husam Arman
Abstract
Today, customers have the upper hand. The days where they had to take
what has been offered to them has gone. Customers now choose the right
products they want, when they want them, and at the right price. With the
advent of new communication networks, the world has become a smaller
place. Customers can now decide on products offered by suppliers around
the globe. Therefore, the competition is no longer regional; it is global. In
order for the enterprises to remain globally competitive they have to
rethink their strategy and manage things differently. One of today’s major
issues is managing the supply chain effectively.
The purpose of this research is to develop a generic framework for
Palestinian companies. The framework can be applicable in the research
environment and the special conditions of Palestine in order to align the
strategic fit area between supply chain strategy and the competitive
advantage. The current practices of the Palestinian companies suffer from
many problems and difficulties from supply chain perspective. Quantitative
and qualitative research methodology was used in this study. The
quantitative research data was gathered with the aid of online survey.
Seventy five surveys have been sent to six sectors of manufacturing

XII
industrials companies in Palestine, Plastic industry, Marble and stone
industry, Foodstuff industry, Pharmaceutical industry, Chemical industry,
Engineering and metal industry, forty responses were received. The
response rate was (53.3%) percent. The results of the interviews and survey
revealed a high level of weaknesses in the four key themes were studied
and analyzed through the survey results, supply chain management concept
and its impact on the success of the firm, competitive and supply chain
strategies, supplier relations, and customer relation
A Generic framework for the supply chain management was proposed. It
aims were to guide the company to structure a successful supply chain, and
does not assume any particular solution. The framework is comprised of
four major levels:
1. The business strategy level. This level involves formulating a
strategy and deciding what the objectives of the business are, i.e. to
sustain company advantage over its competitors.
2. The competitive advantage level. . In this level it is discussed
what a company should do to attain a competitive advantage, in
order to achieve successful supply chain management.
3. The supply chain strategy level. This level shows how supply
chain strategy aims to achieve business goals by using or
implementing the competitive advantage, and reveal hidden
interactions.

XIII
4. The strategy translation. This final level explains the role of the
physical infrastructure and the supply chain function process to
implement the supply chain strategy, effectively determining
responsiveness and efficiency.
The generic supply chain management framework presented a
process that helps in understanding, describing, measuring,
evaluating the supply chain activity, providing systematic process to
establish new project and enhance, and develop ongoing project.

1
Chapter 1
1 Introduction
1.1 Overview
For many decades, companies in Palestine have suffered hardship and
failure. This is due to many factors which include political unrest,
economic oppression and down fall, social incompatibility, and
geopolitical instability. The companies are facing internal and external
challenges, within the nature of the environment in which the
companies live…….multivariate, complex, and interrelated. On the
other hand the subjective obstacles are a result of the old paradigm and
traditional structure. Effective supply chain management has become a
key driver for enhancing the competitive advantage and improving
organizational performance. However, there is an urgent need to assess
the performance of the overall supply chain.
This study will evaluate the supply chain management (SCM) activities
in private companies in Palestine and will diagnose and analyze the
current situation of selected companies in different sectors. Companies
will be selected according to the predetermined criteria to represent
some sectors of the Palestinian companies. The evaluation of the (SCM)
system will be through developing a generic supply chain management
framework, which can be used to support the Palestinian organizations.
The framework will be structured by conducting the literature review of

2
(SCM) concept, issuing a comparative study between Palestinian
companies and the state of the art practices of (SCM). The expected
outcomes will be establishing a framework, increasing the awareness of
the importance of supply chain management, and finding better ways of
managing the supply chain among the local companies.
1.2 Research Questions
The research questions were raised based on the observed gap between
the current application of supply chain management in research
environment, and current global supply chain management illustrated in
literature review chapter. Based on that the research questions were
formulated as follows:
1. What are the gaps between applied supply chain management in
Palestinian companies, and the theoretical and practical global concepts
used in successful world companies?
2. What is the suitable supply chain management framework that can be
used to leverage company’s performance, taking into account the
condition of the research environment?
1.3 Research aim and objectives
The aim of this research study is to develop a generic supply chain
management framework that can be used to support Palestinian
organizations through integrating various supply chain activities.
Further objectives are listed below;

3
a. To investigate the role of supply chain management in providing
competitive advantage for companies
b. To explore and asses current practices and understandings of
Palestinian companies’ in relation to the supply chain
management concept.
c. To investigate the state of the art in the area of SCM.
d. To develop a generic framework that complements Palestinian
industry.
1.4 Research design and methodology
The Importance of the research stems from the fact that it looks at
things not addressed before in Palestine, the study evaluates the
performance of the companies and its extended relations on the
customer service and strategic goals achievements. The research
addresses the weaknesses of supply chain management taking in to
account the research environment, and suggests a framework for
designing best of supply chain management, which can tackle these
weaknesses and propose the solutions. The methodology preferred for
this research was a conceptual model, quantitative methodological
approach. The collected data shall be validated using different data
sources. Research hypotheses have been approved using quantitative
statistical tools. Based on parameters of the research‘s scope, associated
with time and resource constraints, it was supposed that the defined

4
Framework for supply chain would best satisfy the articulated
objectives and respond the research questions.
1.5 Thesis Outline
The thesis will be formed from six chapters as shown in Table 1.1. The
introductory chapter, which outlines the character of the study, Chapter 2
will review the related literature of the supply chain management concept
and related topics. Chapter 3 will present and defend the dissertation‘s
selected methodology. Chapters 4 will discuss data gathering, analysis
issues and research results. Chapter 5 will display the framework and its
implementation process. Finally, Chapter 6 will conclude the study through
an articulation of the research findings, and conclusions.

5
Table 1.1: Outline of the thesis
Cha
pter
1
Intro
duct
ion 1.1Overview 1.2 Research
Questions 1.3 Research
aim and objectives
1.4 Research design and methodology
1.5 Thesis Outline
Cha
pter
2 Li
tera
ture
R
evie
w
1.1Introduction 2.2 Supply chain and Supply Chain
Management
2.7 Demand Planning
2.8 Supplier Relationship
2.9 Customer Relationship
2.10 Drivers and Metrics
Cha
pter
3
Res
earc
h M
etho
dolo
gy 3.1Introduction 3.2 Research
background 3.3 Research design and
methodology 3.4Research approach 3.5 Research
methodology description
Cha
pter
4
Dat
a G
athe
ring
dl
i 4.1Introduction 4.2 Supply chain management
concept
4.3 Competitive and supply chain
strategy 4.4 Supplier relation 4.5 Customer
relation 4.6 Findings
Cha
pter
5 C
once
ptua
l Fr
amew
ork 5.1 Introduction 5.2 Palestine
business environment constraints
5.3 Generic Supply chain Management Framework
Cha
pter
6 C
oncl
usio
n 6.1 Conclusion summery 6.2 Contribution to knowledge
6.3Recommendations
6.4 Future work

6
Chapter 2
2 Literature review
2.1 Introduction
This research aims to evaluate the current practices of supply chain
management system in the manufacturing industry in Palestine. The
literature review provides a starting point for research, and an essential part
of the research process, since it helps to generate ideas for research and
summarizes existing research by identifying patterns, themes and issues.
The conducted literature review covers the four major four key themes
which are studied and analyzed through the survey results, and then some
conclusions are drawn and displayed.
The first part of the literature review transacts to the supply chain design
strategy, assured that the success of a supply chain correlated by the best fit
between the design and the management of the supply chain. The
principles and methods of supply chain design were reviewed. From the
conducted literature review it was found that the companies should practice
supply chain management activities that are most aligned with their
business strategies. The aforementioned concepts proceeded with supply
chain definition and supply chain discipline.
The second part of the literature review entails the supply chain demand
management, as the most important business decision in the course of
managing the supply chain. It starts with forecasting the customer demand

7
in order to handle the difficulties of demand vary from time to time. The
literature showed many technique used in forecasting that the companies
can use. Moreover, aggregate planning was found to be fundamental
concept in the supply chain demand management, where the aggregate plan
focus on general course of action, compliance with the company's strategic
goals and objectives, without going down in details. Level of demand
aggregation is important consideration in company’s decision with respect
to what to forecast and where the aggregated demand will be. The literature
showed the important role of the inventory in the supply chain, and how it
may be boom or bane on the companies.
The third part of the literature cleared the role of the supplier and customer
in the supply chain; the literature displayed the latest ideas of integrating
the customer and the supplier in the supply chain. This way of looking at
the business involves integrating the customer into all aspects of the
supplier's business, and vice versa. This implies a relationship that is
deeper and wider than the traditional 'arms-length' supplier-customer
relationship.
How to attain the utmost positive results from supply chain management
were addressed in the last part of the literature review, where the company
shall determine the factors and elements that contribute in its success and
drive supply chain to better performance. Finally, common measures and
metrics to evaluate company’s performance were presented.

8
2.2 Supply chain and Supply Chain Management
(Mentzer, 2001) defines the supply chain as "a set of three or more entities
(organization or individuals) directly involved in the upstream and
downstream flows of product, services, finance, and /or information from a
source to customer".
The supply chain according to (Handfield, 2002) may contain internal
division of the company as well as external suppliers that provide input to
the company. A supplier for the company has his own chain of suppliers
that provide raw input, which is called second tier suppliers. Supply chains
are essentially a series of linked suppliers and customers till product reach
the final customer.
Supply chain of a company forms from an upstream supplier’s network and
its downstream distribution channel. Depending on how complex the
supply chain is, (Mentzer, 2001)defines three types of supply chain:
1. Direct supply chain, which consist of a company, a supplier, and
customer.
2. Extended supply chain, which includes suppliers of the immediate
supplier, as well as customer of the immediate customer.
3. Ultimate supply chain, which includes all the organizations involved
in all the upstream and downstream flow.

9
2.2.1 Supply chain management
Through a historical narrative that was reviewed, it was found that with the
development of the companies and its expansion, the concept of supply
chain management has matured, where attention to the company’s
management as a separate entity has been shifted to the company and all
concerned, furthermore became a harmony between the company's
objectives and all parties in the chains.
( Chopra, et al, 2001) consider the supply chain as system that consist of all
parties involved, directly or indirectly, in fulfilling a customer request. The
supply chain does not only include the manufacturer and suppliers, but also
transporters, warehouses, retailers, and customers themselves within each
organization such as manufacturer. According to ( Chopra, et al, 2001) the
supply chain includes all functions involved in receiving and filling a
customer request. These functions include, but are not limited to, new
product development, marketing, operations, distribution, finance, and
customer service. (Terry, et al., 2004) define the supply chain as " … a set
of value-adding activities that connects a firm's suppliers to the firm's
customers. The basic unit of a supply chain activity is:
Receive input from supplier - Add value - Deliver to customer
According to (Terry, et al., 2004) definition, the objective is to determine
and identify the activities with the supply chain to be considerable in which
by add value to the product.

10
( Krajewski, et al) define the supply chain from the relegation ship between
the process involved in achieving the shared goals "Supply chain
management seeks to synchronize a firms processes and those of its
suppliers to match the flow of materials, services and information with
customer demand", while (Suhong Li, et al, 2005) mentioned that the
council of logistic management(CLM)(2000) considers clearly that the
supply chain management as the system ,strategic coordination of the
traditional business function and tactics across these businesses function
within a particular organization and across business within the supply chain
for the purpose of improving the long term performance of the individual
organization and the supply chain a whole. Other authors like Govil, et al,
2002, look at the supply chain from a networking perspective and consider
the supply chain a global network of organizations that cooperate to
improve the flow of materials and information between suppliers and
customers at the lowest cost and the highest speed. Govil, et al, 2002,
indicate that the supply chain is limited to logistic activities, while most
other authors emphasize the objective of a supply chain as achieving
customer satisfaction.
( Supply Chain Council, 1996) developed a framework called supply chain
operation reference model (SCOR). This process model is design for
effective communication among supply chain partners. The scope of the
SCOR model is defined as "from company's suppliers’ suppliers to
company's customers customer"(supply chain council). It is based on five
11
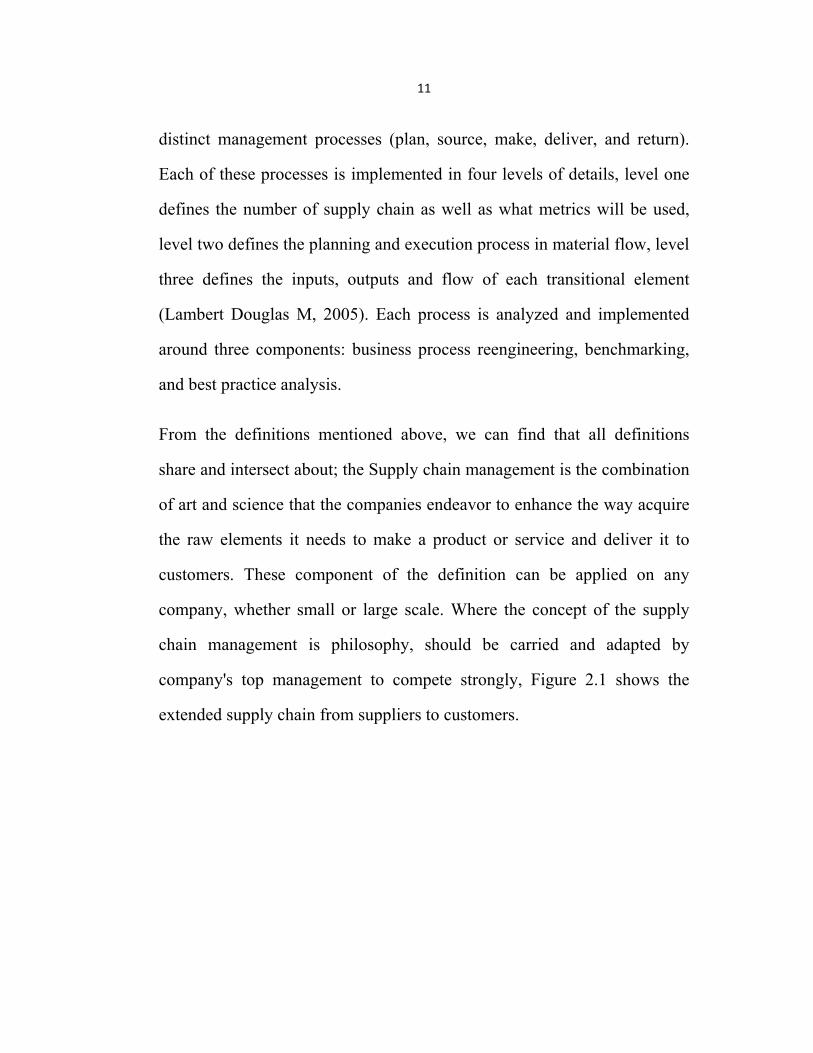
distinct management processes (plan, source, make, deliver, and return).
Each of these processes is implemented in four levels of details, level one
defines the number of supply chain as well as what metrics will be used,
level two defines the planning and execution process in material flow, level
three defines the inputs, outputs and flow of each transitional element
(Lambert Douglas M, 2005). Each process is analyzed and implemented
around three components: business process reengineering, benchmarking,
and best practice analysis.
From the definitions mentioned above, we can find that all definitions
share and intersect about; the Supply chain management is the combination
of art and science that the companies endeavor to enhance the way acquire
the raw elements it needs to make a product or service and deliver it to
customers. These component of the definition can be applied on any
company, whether small or large scale. Where the concept of the supply
chain management is philosophy, should be carried and adapted by
company's top management to compete strongly, Figure 2.1 shows the
extended supply chain from suppliers to customers.

12
Figure 2.1 : Overview of supply chain management (Ritzman, et al, 2002)
2.2.2 Supply chain Management as management philosophy
Supply chain management as a management philosophy takes a system
approach to viewing the supply chain as single entity; this means that the
partnership concept is extended into all company effort to manage the flow
of goods from suppliers to the final customer. Each company in the supply
chain directly or indirectly affects the performance of the other supply
chain component, as well as the overall performance of the supply chain
(CooperMartha, et al, 1997)
Supply chain management as a philosophy can be seen from the following
according (Lambert, et al , 1997)
• A systematic approach to viewing the supply chain as a whole and
managing the total flow from the supplier to the final customer.
• A strategic orientation toward cooperative efforts to aggregate and
converge internal and external capabilities.

13
• Customer focus, to create distinct, leading to the customer
satisfaction.
Supply chain typically consists of supplier, manufacturer, distributer,
retailer, and customer. A Palestinian company's manager shall be aware of
supply chain components and its role along the supply chain. However it is
not necessary for each supply chain to be designed according the typical
form of global supply chain such as Dell. Palestinian companies are
considered to be small companies relative to the international companies,
therefore the Palestinian companies should work to configure the most
effective chain to achieve its goals taking in to account Palestinian
environment.
2.3 E-Supply chain
The commercial companies more than any non profit companies are
affected by innovation and new technologies, where it employ the new
technology to keep its advancement in order to maximize the profits.
(Terry, et al., 2004) Assured that the supply chain management is
significantly affected by the huge growth of electronic commerce. Where
the developments in the communications made the conveying of
information very fast, manufacturing, warehousing, and distribution
technologies could not accelerate the movement of material to such levels
without using information revolution and the world web net. (Terry, et al.,
2004) added that the coordination of information and material flows will

14
increase the importance for profitable electronic commerce. While the
impact of the Internet on supply chain coordination has been rather
positive, some reservations remain regarding its impact on supply chain
design, such as incentive alignment, trust, and fair process required for
effective communication and collaboration.
The extended supply chain suffered from disturbed information whether
amplification the information or underestimation, therefore the growing in
the technology and information transmission reduced the side effects,
(Terry, et al., 2004) declared that the bullwhip phenomenon, the big
challenge in supply chain coordination, which cause delayed and distorted
information as well as by transaction. Web-based technologies have the
greatest impact on supply chain coordination through the elimination of
information delays and distortions, and through the reduction of business
costs. Creating sufficient information infrastructure to interface members
of a supply chain has always been challenging (Mason, et al, 2000). (Terry,
et al., 2004) Declared also that the infrastructure must satisfy the following
needs (Upton and McAfee 1996): first, it must be able to adapt members
with different levels of IT sophistication. Second, it must provide a wide
range of functionality ranging from simple data transmission to access to
applications on a remote computer. Finally, it must be able to adapt with
changing pool of suppliers and customers at varying stages of relationship.
According to (Terry, et al., 2004) the current technology on the design side
does not yet allow the mitigation of the trade-off between richness and
15
reach in the crucial area of supplier identification, certification, and
selection.
The Palestinian companies can use e-Business as an enabler to drive supply
chain to gain clear visibility across their extended network of trading
partners and help them respond quickly to changing customer demand
captured over the Internet. But in context of applying e-Business the
Palestinian companies shall face challenges, cultural and physical
infrastructure issues, where Palestinian environment suffering from lack of
information integration, synchronized planning, coordinated workflow, and
new business models. As a result, many of the core supply chain principles
and concepts cannot now be put into practice much more effectively using
e-business, and significant value cannot be created by e-business enabled
for Palestinian supply chain.
2.4 Global supply chain
With increased globalization phenomena and sourcing activities, global
supply chain management becomes an important issue for many
companies. Where one of the supply chain management endeavors to
reducing the costs of procurement and decreasing the risks related to
purchasing activities. The big difference is that global supply chain
management involves a company's worldwide interests and suppliers more
than simply a local or national. According to (Long, 2003)the global
supply chain management usually involves more than one country; it also

16
usually comes with many new difficulties that need to be coped. One of
these difficulties that companies should consider is the overall costs. While
local labor costs may be significantly lower, companies must also focus on
the costs, tariffs, and other expenses related to doing business out of
country. Additionally, companies need to review the exchange rate of the
money. Companies must do their research and give serious consideration to
all of these different elements as part of their global supply management
approach.
(Mary J, et al, 2005) added that the time is another big issue that should be
addressed when dealing with global supply chain management. The
productivity of the other country employees and the extended shipping
times can be positively or negatively affect on the company's lead time,
subsequently affect the customer satisfaction. Other factors can play
significant effect like the weather conditions on one side of the world often
vary greatly from those on the other and can impact production and
shipping process. Also, customs clearance time and other governmental red
tape can add further delays that need to be planned for and viewed into the
overall picture.
(Long, 2003)mentioned that the issue that must be addressed into a global
supply chain management strategy is supplier selection. Comparing
supplier’s bids in the company's home can be difficult, but comparing bids
for global suppliers can be more complex. The first decision companies
must make is to choose the qualified suppliers, which should be based on

17
research and previous experience. Many companies go to the lowest price
instead of taking the time evaluate all of the other elements. In addition to
money and time factors, companies must make decisions about the number
of suppliers to use. Few supplies may be easier to manage but may lead to
potential problems if one supplier is unable to deliver as requested or if one
supplier tries to leverage its supply power to obtain better price.
Palestinian companies as well as rest companies who choose to create
national relations and want to ship their manufacturing overseas may face
some additional considerations. Where many questions need to be
answered, regarding the number of plants that need to be established, as
well as the locations for those plants. This can create difficult logistical
problems for companies to examine these issues in terms of the global
supply chain. For example, if a business uses a number of vendors around
certain area, it should locate the manufacturing plant that would utilize
those supplies in or around the intended area. Not only will this provide
lower employee costs, but overall shipping and tariff expenses can be
reduced.
2.5 The Objective of a Supply Chain
The former sub titles in the beginning of the literature review, as well as
the definition of supply chains may put the basis of the supply chains
objectives, where the primary purpose from the existence of any supply
chain as stated by ( Lambert, et al , 1997) is to fulfill customer request, in

18
the process generating profits for itself. Supply chain activities begin with a
customer order and end when a satisfied customer has paid for his
purchase. The term supply chain bring up images of product or supply
moving from suppliers to manufacturers to distributors to retailers to
customers along a chain.
2.5.1 Supply chain design/strategy
Any project has life cycle, the utmost important stage of the project life
cycle is the design stage, the importance of the design stage stems from the
future implication and on the size of the efforts and resources spent. The
sensitivity and importance of the design stage will increase according to
the project scale, so when we talk about supply chain design ,the design
decision shall be rational and taken according cross functional study to all
parties concerned. (Terry, et al., 2004) describe the important
considerations of designing a supply chain, where they mentioned that the
Supply chain design has a large impact on various measures of
performance such as profitability, customer service, flexibility and
reliability, also It is a critical source of competitive advantage given that as
much as 80% of total product cost may be fixed by these decisions.
( Chopra, et al, 2001), declared that there is a close connection between
design and management of supply chain flows of the product, information,
and fund. They assured that the success of a supply chain correlated by the
best fit between the design and the management of the supply chain. The

19
authors has described in the narrative course the companies that succeed in
the supply chain design, Wal-Mart, Dell computer, and seven –eleven
Japan are examples of companies that have built their success on superior
design of their supply chain, in contrast the failure of many e-business such
as Webvan can be attributed to weaknesses in their supply chain design.
The successful of the mentioned companies can be attributed to its
beginning where the companies invested in transportation and information
infrastructure to facilitate the effective flow of goods and information
(Chopra, et al, 2001).
During the design phase the companies shall decide how to structure the
supply chain over the next several years, it decides what the chains form
will be, how resources will be attained, and what processes each stage will
execute. All decision during the design stage will have long term effect;
(Chopra, et al, 2001)stated that the firms must ensure that the supply chain
configuration supports its strategic objectives and increase supply chain
surplus during this phase (Terry, et al., 2004) stated that the Supply chain
design is the process of determining the supply chain infrastructure the
plants, distribution centers, transportation modes and lanes, production
processes, etc. that will be used to satisfy customer demands. These studies
are strategic in scope, use a time horizon of many months or years, and
typically assume little or uncertainty with the data. The framework
The decisions in the design stage are considered at the strategic level, its
draw the future form of the supply chain and how will supply chain

20
configuration operate supply chain management functions,
( Govil, et al , 2002) clarifies that The decisions at the strategic level of the
supply chain lay out the framework of how the supply chain operates, and
there are five major activities take place within supply chain at the strategic
level, buy, make, move, store, and sell.
2.5.2 Principles and methods of supply chain design
The principles and methods of supply chain design have been introduced
from a variety of viewpoints; some authors offered the supply chain design
from analysis perspective where supply chain design addresses a wide
range of strategic infrastructure issues for the firm, other authors offered
the supply chain design from major activities take place within a supply
chain, these decision will be taken at strategic level lay out the framework
of how the supply chain operates.
(Terry, et al., 2004) rely on asking questions to key infrastructure issues in
order to address the strategic firm concerns. The following are some key
issues and its analysis:
Manufacturing Strategy
• How many plants are needed
• Where should each plant be located
• What products should each plant make
• What process technologies should each employ, and how much of
each process is needed

21
• What markets should each plant serve
Supply Base Design
• Who are the suppliers should be determined for all parts within
commodity groups
• Who are the suppliers should be allocated to plants.
Distribution Strategy
• Should we ship direct or stock regionally
• How many DCs are needed and where should they be located
• Which DCs will server which customers
• What transportation modes will be used
Outsourcing
• What portions of the supply chain remain in-house versus
outsourced
• Cost tradeoffs versus service considerations
New Product and Process Design
• What infrastructure should be used when new products are added to
existing lines
• At what demand points are additional sources of supply needed and
where should they be located

22
(Terry, et al., 2004)concluded after extensive experience with a number of
supply chain design projects, that the benefits are tangible and executed
supply chain can be substantial. Some remarkable outcomes are:
• Decreased costs of 5-60%, with 10% typical
• Decreased service times of 25-75%, with 30% typical
• Foster cross functional teamwork and "out of the box" thinking
• Provide an objective assessment of alternatives in the politically
charged environment of strategic supply chain decision making
(Govil, et al , 2002) offered the supply chain design from the strategic
decisions taken with respect to the following activities:
• The buy activity includes the tasks of buying raw materials,
components, resources, and services.
• The make activity concerns creating products, maintenance and
repair of resources when needed and training workers, performing all
the tasks that are needed for production.
• The move activity concerns transportation of materials and personnel
inside and outside the supply chain.
• The store activity concerns the work-in-process (WIP) and raw
material when it is waiting for transportation or transformation as
well as the finished products waiting to be sent to customers.
• The sell activity concerns all the market activities, including
marketing and sales.

23
Each of these activities is linked with all other activities. In contrast to the
day-to-day decisions in each of these activities, which are covered at the
tactical level, the strategic level focuses on the long term. For example, the
buy activity at the strategic level focuses on developing long-term
relationships with suppliers. It is not short-term goal of buying from the
supplier submitted low price. It shall select suppliers whose strategic goals
are compatible with those of the supply chain. (Govil, et al , 2002)
determined These goals :
• Direction of technical innovation for the supplier
• Focus on quality
• Focus on reduction of cost
• Focus on reduction in response time
2.5.3 Supply chain strategy as part of Business Strategy
Companies shall practice supply chain management activities that are most
aligned with their business strategy. Effective business strategy begins with
the core strategic vision that lays down the framework for the business.
Business strategy defines what the company is, what it does, and what it
does not do (Cohen, et al, 2005). Company’s blind adaption of generic
supply chain may allow a company to compete with its competitors, but it
will not create basis for competitive advantage.
The question is how to develop supply chain capability and select the exact
best practice, those that will drive a company's strategic objective ahead.

24
Supply chain strategy designs a unique supply chain configuration that
drives strategic goals forward. A supply chain strategy consists of five
building blocks ( Cohen, et al, 2005)
• Operations strategy.
• Outsourcing strategy.
• Channel strategy.
• Customer service strategy.
• Asset network.
Our decisions with respect to the components mentioned above of
the supply chain strategy will play together to define the supply
chain strategy.
2.5.3.1 Operation strategy:
The decisions about how will we produce goods are forming our operations
strategy. ( Cohen, et al, 2005) asked question to enable us to determine the
operation strategy
• Will you choose make to stock, make to order, engineer to order, or
some combination?
• Will you outsource manufacturing?
• Will you pursue a low-cost offshore manufacturing strategy?
• Will you complete your final configuration outside the
manufacturing plant and closer to the customer?

25
The answers of the above questions are critical decisions, because they
influence and shape the whole supply chain and the investments.
Furthermore the operations strategy determines how we staff and run our
factories, warehouses, and how you design our processes and information
systems.
Make to stock is the best strategy for standardized products that sell in high
volume. Larger production batches keep manufacturing costs down, and
having these products in inventory means that customer demand can be
met quickly.
Make to order is the preferred strategy for customized products or products
with infrequent demand. Companies follow this strategy only when a
customer orders are in hand. This keeps inventory levels low while
allowing for a variety of product options.
Configure to order is a hybrid strategy in which a product is partially
completed to a generic level and then finished when an order is received.
This is the preferred strategy when there are many variations of the end
product and you want to achieve low finished-goods inventory and shorter
customer lead times than make to order can deliver.
Engineer to order, which shares many of the characteristics of make to
order, is used in industries where complex products and services are
created to unique customer specifications.

26
Changing your operations strategy can be a key source of performance
advantage see table 2.1. many companies after they be aware of the
operation strategies, found that moving from make to stock to configure to
order improved service levels while reducing inventory.

27
Table 2.1: Types of operations strategies. Source: ( Cohen, et al, 2005)
Strategy When to Choose This Strategy Benefits
Make to stock
For standardized products selling in high volume
Low manufacturing costs; meeting customer demands
quickly Configure to
order For products requiring many
variations Customization; reduced
inventory; improved service levels
Make to order
For customized products or products with infrequent demand
Low inventory levels; wide range of product options;
simplified planning Engineer to
order For complex products that meet
unique customer needs Enables response to specific
customer requirements
The operations strategy of the supply chain as all component strategy of
the supply chain, it is changeable. A key driver is the product life cycle
(Cohen, et al, 2005). As demand for products increases and then decreases,
companies can move from make to stock to make to order to reduce
inventory problems while still interesting with competitive price. Another
driver is the number of product kinds. It is not unusual to find that 80
percent of volume shipments comes from just 20 percent of your sales item
numbers (or possible configurations). In this circumstance, a hybrid make-
to-stock and make-to-order strategy may be more appropriate
(Cohen, et al, 2005)
2.5.3.2 Out sourcing strategy:
Outsourcing decisions started with an analysis of our company’s existing
supply chain capabilities. (Cohen, et al, 2005) ask questions to determine
the suitable out sourcing strategy.

28
• What is your company really good at?
• What areas of expertise are or have the potential to become strategic
differentiators?
• What are the activities you should keep in-house and make even
better.
• When to consider outsourcing activities are low strategic importance
or that a third party could do better, faster, or more cheaply.
Outsourcing allows companies to go up or down quickly, produce new
products, or change the position in the marketplace, all by leveraging the
capability and ability by other company's qualifications. The out sourcing
provides the company more flexibility which allows companies to focus on
their core competencies and enhance their competitive positioning.
Before going forward, the company shall be considering the risks and
strategic consequences of the company outsourcing decisions. The
company must be aware that, Introducing new products, managing
inventory levels, and relationship with customer by configuration supply
chain to support competitive customer lead times; these are strategic
activities that cannot be shifted to a third party.
(Cohen, et al, 2005)ask question to put limitation to the out sourcing
strategy
• Should outsourced skills also be maintained internally, or are they no
longer needed?

29
• Which existing skills should be strengthened?
• Will new tools or skills be needed, such as the ability to manage
inventory across the extended supply chain?
• Can it be done more cheaply outside?” is unlikely to provide a
strategic solution.
( Cohen, et al, 2005) Cleared that the outside partners can deliver three
potential advantages:
Scale: Third party provides often services more cheaply because he is
specialist in his aspect and there are large customers in additional to us.
The third party can provide needed product without having to invest in new
manufacturing capacity.
Scope: for companies that want to expand into new markets or geographies,
outsourcing partners can provide access to new locations.
Technology expertise: Outsourcing partners may have differentiated
product or process technology that the company needs to invest in new
project to produce such product internally, and may be not as well as the
third party quality.
Despite the benefits mentioned above, outsourcing isn’t always the right
decision. Before decide to attain services from external providers, the
company according ( Cohen, et al, 2005)shall consider four things:
differentiation source, operating scale, power position, and the uniqueness
of operations.

30
First, the company shall know what let it differentiated. What gives the
company competitive edge? If the product or process technology is a
source of differentiation, the company must not outsource that aspect of
your operations.
Second, the company shall compare between the sizes of the internal
processes against the requirements. If the operations at or near full capacity
utilization, with no plans to increase production, you will not gain any
benefit from the cost of outsourcing
Third, locate the uniqueness of your internal operations. The company shall
seek if it have unusual product characteristics that will not be accomplished
by outsider .If so, the company have little to gain by going outside, (
Cohen, et al, 2005)mentioned Wal-Mart as example, it has developed a
highly customized internal logistics operation that manages inbound
inventory flows from its central distribution centers to the shelves of its
retail locations. As the owner of one of the largest warehousing operations
in the world, Wal-Mart has nothing to gain and everything to lose by
outsourcing this aspect of its operations.
Fourth, the company shall compare its power with the outsourcing partner
power. Many providers of services, fulfillment services are already larger
than their customers. They’ll gain more power and be better than the
company.

31
The company to be able to choose the best decision regarding the out
sourcing, the company must go beyond technical criteria and consider the
overall business context. The company shall think about its volume against
the service provider’s, and then take the correct decisions.
2.5.3.3 Channel strategy.
The channel strategy of the company tackle the issues related to how the
company will get the products and services to buyers or end users. The
decisions deal with these issues as the company sell indirectly through
distributors or retailers or directly to customers through its show, should
take in to account the market segments and geographies the company is
target. Although since profit margins vary depending on which channels
are used, the company has to decide on the optimal channel and how will
the availability of products in shortage period or in the high demand.
2.5.3.4 Customer service strategy:
Customer service strategy is another key configuration component to draw
the supply chain strategy. The customer service strategy shall be based on
two things according to ( Cohen, et al, 2005): the overall volume and
profitability of your customer accounts and an understanding of what your
customers really want.
The two criteria, overall volume and profitability will contribute to form
the supply chain strategy because they help you to prioritize and focus your
capabilities.

32
• Should all customers get same-day delivery?
• Should you aim for different service levels depending on customer
importance?
• Should all products be equally available, or should some customers
have quicker, easier access?
The company should review its service strategy, to don’t provide more
costly levels of service than the customers need, or missing important
market opportunities. Where not all customers care about same level of
service, but it’s important to know who are the high-value customers.
The company shall rely on customer service strategy to deliver the best
cost and the best service tradeoff to the customer segment that can pay to
maximize company's revenue.
2.5.3.5 Asset Network
The final component of the supply chain configuration is the decisions that
the company makes regarding the company’s network, the factories,
warehouses, production equipment, order desks, and service centers that
backup up the supply chain. The location, size, have considerable impact
on supply chain performance. According to ( Cohen, et al, 2005) the
companies choose one of three network models based on some criteria like
business size, customer service requirements, tax advantages, supplier
base, local content rules, and labor costs:

33
Global model: Manufacturing of a certain product is executed in one
location for the global market; the need of such model is to control unit
manufacturing costs, or the need for highly specialized manufacturing
skills.
Regional model: Manufacturing is done in the region where the products
are sold, although some product manufactured in more than one region The
regional model is chosen based on a mix of factors, including customer
service levels, service levels, and the need to adapt products to specific
regional requirements.
Country model: Manufacturing is done primarily in the country where the
market is. This is the model for goods that are expensive to transport. Other
factors include duties and tariffs and market access that are conditional on
in country manufacturing.
2.5.4 Check list for effective supply chain strategy
The components of the supply chain strategy, operations strategy, channel
strategy, outsourcing strategy, customer service strategy, and asset
network, are the base of supply chain strategy. So the company shall
operate these components to drive the strategic business and achieve a
competitive advantage, ( Cohen, et al, 2005) mentioned that these
components and the choices the company makes about shall be:
• Aligned with your business strategy
• Aligned with your customers’ needs

34
• Aligned with your power position (your influence)
• Adaptive, because competitive advantage is temporary and market
conditions change.
2.5.4.1 Aligned with your business strategy
The supply chain strategy shall drive business strategy, and the business
strategy extracted from the core strategic vision where its answer very
important question like, what you are, what you’ll do, and what you are not
and what you won’t do. The core strategic vision clarifies the answers to
key business strategy questions such as:
• What are your overall strategic objectives?
• What value do you deliver to your customers?
• How does your company differentiate itself in the marketplace?
Without answering these key questions the supply chain strategy and
configuration, will be operating in a space.
2.5.4.2 Align with Your Customers’ Needs
The company shall capture customer needs to create a competitive
advantage and aligned their supply chains accordingly. The company shall
ask itself; do we really know what the customers want? Are there
opportunities that you’re not exploiting simply because you can’t predict
them?

35
2.5.4.3 Align with Your Power Position:
The supply chain strategy must be based in an understanding of the
company power and influence compared to customers and suppliers. Why
is this so important? Because by company power can really achieve its goal
and reconfigure the supply chain to meet strategic objective.
The company needs to understand how much its power is, and its influence
on the ground. And before practice supply chain power must understand
the effect on other. The supply chain control is a possibility but the
collaboration is better. Therefore the company shall analyze its position in
the supply chain to determine how can rethink your interactions to cut
costs.
2.5.4.4 Become Adaptive
The company shall be aware about the surrounded, where the change is a
given, market circumstances are shifted, business strategies evolve, and
new technologies emerge. The company must pay attention; otherwise the
supply chain will get out. The supply chain strategy, like the business
strategy, has to adapt. The change is constant, and will happen depend on
the industry aspect.
(Cohen, et al, 2005) declared that the components of the supply chain
strategy, operations strategy, channel strategy, outsourcing strategy,
customer service strategies, and asset network, are the base of supply chain
strategy. So the company shall operate these components and interact all

36
together to rely supply chain strategic aligned with the competitive
advantage, the a company's competitive strategy according to ( Chopra, et
al, 2001) is defined relative to its competitors, and the customer needs that
the company pursue to satisfy through its product and services, the
customer needs can be viewed from how the customer prioritize the
product cost, delivery time, variety, and quality. ( Chopra, et al, 2001) start
the relationship between the competitive advantage and supply chain
strategy from the value chain for any organization to analyze company
capability in term of responsiveness and efficiency, companies that focus
on cost leadership as a competitive advantage will tend to find the lowest
cost of overall functions in the supply chain and rely efficiency strategy; on
the other hand companies that focus on differentiation leadership will tend
to rely responsiveness as a supply chain strategy that consistent with
customer needs regardless of the cost.
2.5.5 Supply chain strategy Responsiveness versus Efficiency
The company business strategy lays down company's competitive
advantage, which allowing a company to compete with its competitors, and
the company reviewed all supply chain components in order to structure
supply chain strategy, the companies shall decide how to structure the
supply chain over the next several years, it decides what the chains form
will be, how resources will be attained, and what processes each stage will
execute. The company should take into consideration that all decision

37
during the design stage will have long term effect and must support its
strategic objectives and increase supply chain surplus.
company’s decision with respect to supply chain infrastructure the plants,
distribution centers, transportation modes and lanes, production processes,
etc.. These studies are strategic in scope, use a time horizon of many
months or years, and typically assume little or uncertainty with the data.
The supply chain strategy in designing the aforementioned components can
be categorized to the responsiveness and the efficiency. Responsiveness
comes at a cost, where to fulfill all quantities demand; the capacity should
be increased, which cause to increase the costs. In the other hand supply
chain efficiency is the inverse of the cost of producing and distributing a
product to the customer. Increasing cost to implement company function
activities will lower efficiency. For every strategic choice to increase
responsiveness, there are additional costs that lower efficiency.
Deciding the strategy of the supply chain whether to be responsive or
efficient will affect all design component of the supply chain design. The
supply chain strategy defines the processes within the company in
additional to the role played by each supply chain entity. To explain the
effect of these strategic decisions, the company should define the value
chain of the product produced by the company and introduced to the
customer.

38
Whether the companies rely on supply chain design from analysis
perspective to addresses a wide range of strategic infrastructure issues for
the firm, or rely on supply chain design from strategic decision perspective
to lay out the framework. The two perspectives have the same aim and can
be applied, The concern is to work on the design before proceeding in the
management, where there are those who think, they are working according
to the prior design but the truth may be otherwise, where each part in the
supply chain works around company boundary subsequently aligned goals
and supply chain surplus will be beyond what is at hand.
With respect to the study of Palestinian companies, there is no real design
of supply chains, according to study result (see chapter 4) for the following
reasons:
• There is no practical or theoretical researches that have addressed
management issues like supply chain concept or how the company
can design supply chain.
• The Size of the companies in Palestine are small comparing to global
companies
• The facts on the ground like economic situation or how companies
interact with research and development.
2.6 Logistics Network strategy
The company pursue to align all processes and decisions with the
company's objective and one of the most important decision is logistic

39
network design, where it has considerable short and long term effects.
Therefore the optimal configuration of a company’s product distribution
network can create a balance between the logistics and delivery costs
required to achieve desired level of customer services. An agile and
flexible distribution network can be a strategic competitive advantage,
where the distribution is main function in the value chain.
(Frazelle, 2001) mentioned that there are many factors that play a role
when the company want to configure the network logistic like, Security
requirements, new trade agreements, shifting labor rates, space costs,
supplier and customer locations, new carriers and products, lane
congestion, and fuel costs and he assured that optimum network design
tend to minimize the inventory, and transportation cost, but at the same
time satisfying customer needs.
(Chopra, et al, 2001) Supply chain network design decision include the
assignment of facility role, location of manufacturing storage or
transpiration related facility, and the allocation of capacity and market to
each facility.
2.6.1 Factors influencing network design decision
According to (Chopra, et al, 2001) the company's competitive strategy has
a significant impact on network design decision within the supply chain.
Where companies that focus on cost leadership tends to find the lowest cost
location of their manufacturing facilities, even if that means locating very

40
far from the market they serve. Firms that focus on responsiveness tend to
locate facilities closer to the market and may select a high cost location if
this choice allows the company to satisfy customer needs and be ready to
changed circumstances.
(Chopra, et al, 2001) added that the technological factors which
characteristics of available production technologies have a significant
impact on network design decision, if production technology reflects
significant economies of scale, a few high capacity locations are more
suitable like computer chip, but if facilities initial cost is low cost, many
local facilities may be established because this helps lower transportation.
in additional to the previous major factors that affect the network logistic
there are other factor according (Chopra, et al, 2001), macroeconomic
factors including tariffs and tax incentive exchange rate, demand risk
political factors, infrastructure factors, competitive factor, customer
response time, and logistic and facility cost
2.6.2 Network design
In order the companies to create an optimal network design/redesign,
(Frazelle, 2001) recommends a 10-step logistics network design process:
1. Assess/evaluate current network.
2. Design and populate network optimization database.

41
3. Create network design alternatives, such as more or fewer hierarchies,
multi-commodity flows, pooling opportunities, merge-in-transit, direct
shipping, cross docking, and supply-flow optimization concepts.
4. Develop network optimization model.
5. Choose network optimization tool.
6. Implement network model in chosen tool.
7. Evaluate alternative network designs.
8. “Practicalize” recommended network structure.
9. Compute reconfiguration cost.
10. Make go/no-go decision.
According ( Chopra, et al, 2001) the company should take the following
point to design its logistic network:
the companies shall define a supply chain strategy, where the objective of
the first stage of the logistic network design is to define firms supply chain
design, this includes determining the stages in the supply chain, and the
companies shall determine also the supply chain function if it will be in
house or outsource, ( Chopra, et al, 2001) divided the network design into
phases:

42
Phase 1 :starts with determining the firms competitive strategy as the set
of customer needs that the supply chain want to satisfy .the supply chain
strategy specifies the capabilities that the supply chain network must have
to support the competitive strategy, forecasting of evolution of global
competition and whether competitors in each market will be took place,
based on the competitive strategy of the firm, its resulting supply chain
strategy , an analysis of the competition, any economies of scale or scope,
and any constraints, managers must determine the supply chain design for
the firm.
Phase 2: define the regional configuration; the objective of the second
phase of network design is to identify regions where facilities will be
located, their potential roles, and capacity. the analysis starts with forecast
of the demand if the country including a measure of size demand, the next
step is to identify whether economies of scale or scope can play a
significant role in reducing cost, next the company must identify demand
risk, exchange rate, managers must identify competitors in each regions
and make a case for whether a facility needs to be located close to or far
from competitors facilities
Phase 3: select a set of desirable sites. The objectives of phase 3 is to select
a set of desirable site within each regions where facilities to be located, site
should be selected based on an analysis of infrastructure availability to
support the desired production

43
Phase 4: location choices, the objectives of phase 4 is to select a exact
location and capacity allocation for each facility, attention is paid to the
desirable potential sites selected in phase 3, the network is designed to
maximize total profits taking into account the expected margin and demand
in each market, various logistic and facility cost, and the taxes and tariffs at
each location
the Palestinian companies should be aware that the network design
decision have a significant impact on performance, and shall define its
competitive advantage to be able to determine the network design strategy,
where the determining of the supply chain network design will set
constraints within which the other supply drivers can be used either to
decrease supply chain cost or to increase responsiveness.
The Palestinian companies can take use of Chopra approach when taking
network design decision and its affect on each other, where decisions
concerning the role of each facility are significant because they determine
the amount of flexible the supply chain has in change the way it meets
demand
2.7 Supply Chain Management: Demand Planning
Demand planning is a vital aspect of managing flow of product along the
supply chain. Generally, the first step of demand planning is to forecast
product demand. The company can plan resource deployment in
accordance with the resulting forecasts in order manage the inventory, it

44
should provide as accurate as possible information to the operation process.
The company can enhance the forecasting and overcome the little and
uncertainty information by forecasting on aggregate planning. The sections
below shall introduce the demand planning function in details.
2.7.1 Forecasting:
One of the most important elements of supply chain success is effective
planning to determine customer demand, which begins with accurate
forecast. A forecast according ( Krajewski, et al) is "a prediction of future
events used for planning purposes". The important role of the forecasting
appears among situations like changing business condition as a result of
competition, rapid technological change, and rising environmental
concerns. Forecast is needed to assist in determine the resources,
scheduling existing resources and acquiring additional resources.
The most important business decision in course of managing the supply
chain which forming challenge to the company is to forecast the customer
demand, where it is a difficult task because the demand for product and
services vary from time to time, therefore forecasting demand in
changeable situations requires uncovering the underplaying patterns from
available information. ( Krajewski, et al)defined the pattern" is the repeated
observation of demand for product or service in their order of occurrence
such as horizontal, trend, seasonal, cyclical, and random". The company
must take in to account when it goes to forecast demand the pattern and all

45
factors demand affects by it. The company shall ask itself what factors
cause change in the demand for product and service over time. Generally
such factors can be divided in to two main categories: external and internal
factors.
The company can use more than one method to issue the forecasting
process, there are mathematical models using historical data, and
qualitative methods based on managerial experience, or combination of
both, but the company before starting forecasting according
(Krajewski, et al) must determine what to forecast, what type of forecasting
technique to use and what type of computer hardware or software to use.
Level of data aggregation and unit’s measure are important consideration
in course of company decision with respect to what to forecast.
( Krajewski, et al)Stated that the forecasting technique can be divided in to
two main categories, qualitative methods and quantitative methods, the
figure 2.2 shows the forecasting technique
Figure 2.2: Classification of forecasting techniques (Armstrong, 1986)

46
In the supply chain management the forecasting is very important for all
relied operation strategy, but (Terry, et al., 2004) stated that the forecasting
is more necessary for companies that manufacture items for inventory
make to stock strategy and that are not made to order. Manufacturers will
use material forecasting to ensure that they produce the level of material
that satisfies their customers without producing an overcapacity situation
where too much inventory is produced and remains on the shelf. At the
same time, the forecast must not fall short and the manufacturer finds them
without inventory to fulfill customer’s orders. The cost of failing to
maintain an accurate forecast can be financially catastrophic.
The Palestinian companies lack in terms of utilizing the appropriate
forecasting techniques in the supply chain management. Companies should
start adopting new ways of doing things with regard using forecasting and
the relevant software. Planners should review their decisions with respect
to the internal and external environment. They should adjust the calculation
to provide a more accurate forecast based on the current information they
have.
2.7.2 Inventory management
The basic purpose of supply chain management is to plan customer
demand and to fulfill his order as well as the least lead time, therefore the
company must control inventory by managing the flow of materials to
achieve the desired fulfillment, according ( Krajewski, et al) the inventory
is "a stock of material used to satisfy customer demand or support the

47
production of goods or services", the level of inventory is determined from
the rate of input materials and product and the outward flow represents the
demand for materials in inventory, like customer order or requirements for
suppliers
Inventory management is an important issue for the companies in all types
of business, for large scale business, the company can improve it profits
and maximize it surplus, for companies that operate on low profit margins,
the poor inventory management can destroy the business.
( Krajewski, et al)stated that the challenge is not to pare inventory to the
bone to reduce cost or to have plenty around to satisfy all demands, but to
have the right amount to achieve the competitive priorities for the business.
( Krajewski, et al)stated that the inventory can be found in three categories
with respect to the kind of material are stocked ,raw materials which are
needed for production of goods or services, the raw materials are
considered an input to the manufacturing process of the company, work in
process which are consisted from items such as component or assemblies
needed for final product in manufacturing, finished goods in manufacturing
plants, warehousing, and retail outlet are items sold to the company’s
customer, the finished goods of one company may be the raw materials for
other.

48
2.7.2.1 Types of inventory
The inventories can be classified according to how it is created, there are
four types of inventories according ( Krajewski, et al): cycle, safety,
anticipation, and pipe line each one of the four types comes into being in
different way.
Table 2.2: Types of inventories ( Krajewski, et al)
# Type of Inventory
Function
1. Cycle inventory the portion of total inventory that varies directly with lot size
2. Safety stock inventory
placing an order for delivery earlier than when the item is needed therefore the
replenishment order arrives ahead of time3. Anticipation
inventory used to absorb uneven rates of demand or
supply which company may face 4. Pipeline
inventory inventory moving from point to point in
the materials flow system
The aforementioned types cope with different situation, where safety stock
type of inventory can be created to avoid customer service problems and
hidden costs of unavailable components, on the other hand anticipation
inventory suit uneven demand which lead the company to stock
anticipation inventory during period of low demand to be used in peaks
demand period later on.

49
2.7.2.2 Inventory controls
The company must manage the inventory to achieve the objective and
reach maximum profit and maximum surplus, inventory control system is
the managerial function that should be practiced to attain the desirable
objectives, selecting an inventory control system for a particular
application, the nature of demand imposed on the inventory items is
crucial. ( Krajewski, et al) stated that there are two inventory control
system are, the continuo's review system, called Q system, and the periodic
review system, called P system.
Continues review system (Q):
Continues review system, sometimes called a reorder point system or fixed
order quantity system, tracks the remaining inventory of an item each time
a withdrawal is made to determine whether it is time to order or not. When
the inventory position reaches a predetermined minimum level, called the
reorder point, affixed quantity Q of the item is ordered.
Periodic review system (P):
the second inventory control system is periodic review system, some times
called fixed interval reorder system or periodic reorder system, where an
items inventory position is reviewed periodically rather than continuously,
a new order is always placed at the end of each review, and the time
between orders is fixed at P. in P system the lot size may change from one
order to the next, but the time between order is fixed.

50
The Palestinian companies shall be aware that the inventories are important
to all types and scale of companies and their employees. Inventories affect
everyday operation because must be counted, paid for, used in operation,
used to satisfy customer. Where the inventories can be managed in simple
technique rather to complicated technique, therefore the companies should
adapt managerial concept to manage the inventory. Inventory require an
investment of funds, they represent a drain on the cash flows of an
organization.
the Palestinian companies shall transform the inventory from a bane to
boon, by do not reduce profitability if there is too much inventory, and do
not damage customer confidence if there is too little inventory. The goal
should not to minimize inventory or to maximize service, but rather to have
the right amount to support the competitive priorities of the company,
2.7.3 Aggregate planning
the companies pursued to improve its performance by preparing the plans
and reduce the uncertainty as well as possible, so the companies used
forecasting technique to enhance its ability in this regard, but is the
forecasting enough and accurate? the company can enhance the forecasting
through shorten the time horizon or by forecasting families of products
whether for inventory level or for production plans, and many companies
practiced seasonal shift in demand for its product, the shifting of demand is
called an aggregate plan, ( Krajewski, et al)stated that the aggregate plan is

51
a statement of its production rates, workforce level, and inventory holding
based on estimates of customer requirements and capacity constraints. This
statement time phased, meaning that the plan is projected for several time
periods in to the future.
A manufacturing firms aggregate plan, called a production plan, focused on
production rate and inventory holding, whereas a service firms aggregate
plan called a staffing plan, centers on staffing and other labor related
factors. For both types of company the plan must balance conflicting
objectives involving services, workforce stability, cost, and profit.
The aggregate plan determines how the company will work for the next
year within existing resources and facilities capacity constraints.
( Krajewski, et al) stated that from the aggregate plan which is considered
medium term plans the companies prepare detailed operating plans. For
manufacturing companies the aggregate plan connect strategic objectives
with production plans for individual's products and the specific component
of them.
The companies can apply the aggregate plan to be aware about the future
without going into details, where the aggregate plan focus on general
course of action, compliance with the company's strategic goals and
objectives,. ( Krajewski, et al) stated that the aggregation allows company
to determine whether they can satisfy budgetary goals without going to
schedule each of the company’s products and employees, even if a planner

52
could prepare such a detailed plan, it will not be feasible to update it again,
for this reason production and staffing plans are prepared by grouping or
aggregating, similar products service, units of labor or units of time.
2.8 Supplier relationship
In spite the companies have unique character, but it have to deal with
others in many ways and forms. (Terry, et al., 2004) declared that the
forms of the relationship between the companies are five types of supplier
relationships: buy-the-market, ongoing relationships, partnerships, strategic
alliances, and backward integration. But he said that the backward
integration might not be considered a form of supplier relationship because
the components are produced internally, he added that the relationship style
should fit with the characteristics of the purchased component and of the
marketplace.
Buying from one firm today means no commitment to buy from same firm
anther time, and the interaction between firms is very limited, where there
is little need for face to face meetings. (Terry, et al., 2004) as firms move
toward ongoing relationships and partnerships, they are responding to a
need for interaction with the supplier. where some companies invest on
such relationship to improve cost, quality, and delivery ,on the other hand
Strategic alliances, involve even closer relationships, sharing the same
location of facilities or personnel, wide sharing of information and plans,
higher levels of trust,

53
2.8.1 How to Structure the Relationship
In the previous section the relationship styles have been presented, but how
should managers build their own supplier relationships? (Terry, et al.,
2004) declared that there are four fundamental factors that should drive a
firm toward closer relationships. These factors should be considered in
light of the operations objectives of the firm cost, quality, delivery, and
flexibility. Firms should focus on their critical objectives as they analyze
relationship styles for each component category. The first factor is the
strategic importance of the purchased component. If the component is
critical to competitive differentiation, it is best to manufacture it in-house.
If the firm cannot develop the capability to manufacture the component, it
should form a close alliance with available suppliers
The second factor is the number of suppliers that can provide the
component or service. If only one supplier is available, the firm may need
to maintain close relationships with it, the third factor is complexity of the
interfaces between the components procured and the rest of the final
product and the complexity of the supply chain itself, the fourth factor that
affects relationships is uncertainty,. If a sourcing relationship creates high
uncertainty, it should develop closer relationships.
The importance of the cases is that the Palestinian companies must
explicitly consider the operations objectives of cost, quality, delivery, and
flexibility, and that they must understand the concepts of strategic

54
importance, number of suppliers, complexity, and uncertainty in
determining how to structure their supplier relationships.
As the Palestinian companies are working and practicing its activities, like
outsource, selling, managing supplier relationships has become critical.
therefore companies shall not go to strategic alliances as the only style of
supplier relationships, and shall not take different way drastically, but
careful analysis of the operations objectives of the firm and the number of
available suppliers, in addition to examination of the uncertainty,
complexity and strategic importance of the component being purchased,
the companies can have clear image of how to structure supplier
relationships. Thus, within the same firm some components should be
purchased through strategic alliances while others purchased via a
partnership, on-going relationship or buy-the-market approach. on the
managing side of these relationships. Firms that decide to pursue strategic
alliances should strongly consider introducing competition into the
relationship, while firms that buy over the Internet should consider
building longer term relationships.
2.9 Supply Chain Management: Customer Relationship
Customer relationship management is a complementary process to the
previous operations process to achieve the organization goals, so that
efforts will be fruitful if all previous processes were coroneted of running a
sound relationship with the customer. (Ellen, 2009) declared that the
55
customer relationship is an essential part of modern business management.
And it concerns the relationship between the organization and its
customers. Where the customers are considered the lifeblood of any
organization.
The companies and the customers have special environment to consider
when building the relationship, (Ellen, 2009) declared that wants and needs
govern the relation of both parties; organizations need to make a profit to
survive and grow, customers want good service, a quality product and an
acceptable price, therefore good CRM can influence both sets of
conditions. In the company side the customer relationship management
affects the overall company, where, (Ellen Gifford ) declared that the
organization shifting the focus from product to customer, streamlining the
offer to what the customer requires, not want the organization can make,
and highlighting competencies required for an effective CRM process
2.9.1 Organization need to the CRM
The final goals of the customer relationship management is to maximize
supply chain surplus and earn customer loyalty to the company and let him
to be company's messenger, this is will not be achieved without submitting
better service more than any competitors else. the best customer
relationship capability will be reflected on the company itself, (Ellen
Gifford ) stated that CRM not only improves the service to customers
though; a good CRM capability will also reduce costs, wastage, and

56
complaints (although you may see some increase initially, simply because
you hear about things that without CRM would have stayed hidden). CRM
enables instant market research as well: opening the lines of
communications with your customers gives you direct constant market
reaction to your products, services and performance, far better than any
market survey. Good CRM also helps you grow your business: customers
stay with you longer
2.9.2 What do customers want?
Customer wants to get an equivalent to what he paid; (Ellen Gifford)
mentioned that the customers want cost-effective products that introduce
required benefits to them. But at the same time the same product or service
can submit different benefits to different customers. so It's important to
look at things from the customer's perspective to determine the satisfaction
of the customer, (Ellen Gifford) declared that the customers want to have
their needs satisfied, and will often include the buying-selling process, the
way that communications are handled, and the nature of the customer-
supplier relationship.
(Ellen Gifford) mentioned that the CRM theory refers to the idea of
'integrating the customer'. This way of looking at the business involves
integrating the customer into all aspects of the supplier's business, and vice
versa. This implies a relationship that is deeper and wider than the
traditional 'arms-length' supplier-customer relationship.

57
2.9.3 Managing customers
Why manage customers? the customers are the usual source benefit for the
company, as well as the source of the information which is important for
company success, therefore the customer relationship should be managed
carefully. (Ellen Gifford) stated that managing customer's relationship will
be by, knowing what customers want and need that let the company to
focus on production and service according customer desire, the company
also should know which products or customers have most growth which
enables it to focus on developing highest potential, knowing which
products or customers are most profitable which enables the company to
focus on maximizing profit, and the company should know which
customers will be supporters and loyal which enables it to provide
references, case studies, and to safely test new products and services
The company shall attain effective relationship with the customer through
right management of the relation, the company will achieve effective
customer relationship according (Ellen Gifford) by adopting a new
perspective.
• traditional customer service is something you 'do to' the customer
• modern Customer Relationship Management is 'done with' the
customer

58
The second statement is certain a big differences between traditional
customer service, and the modern customer service.
the Palestinian company should establish relationships with customers
ongoing, cooperative, and built for the long term, and they will be aware
that company who have many temporary relationships with customers have
to spend a lot of money on finding new customers, where the cost of
keeping existing customers is littlie bit of the cost of acquiring new
customers.
2.10 Supply Chain drivers and Metrics
The company shall support its competitive advantage by creating balance
between the responsiveness and efficiency, but to understand how
company can improve supply chain performance in terms of
responsiveness and efficiency. ( Chopra, et al, 2001)stated that the
company must review the logistical and cross functional drivers of supply
chain performance to determine the supply chain performance, the
logistical drivers are facilities, inventory, and transportation, the cross
functional drivers are information, sourcing, and pricing.
The fit between the competitive advantage and company supply chain
strategy is the right combination of the three logistical and three cross
functional drivers, where when the company takes decision with respect to
each driver, it must make tradeoff between efficiency and responsiveness
based on interaction with the other drivers.

59
The drivers are very important elements to enhance the supply chain
performance, but how we can measure these drivers, ( Cohen, et al, 2005)
stated that most people agree with the saying, “If you can’t measure it, you
can’t fix it.” ,therefore a set of measures or metrics should be prepared to
evaluate company performance with respect specific driver, ( Cohen, et al,
2005) stated also that yet few metrics programs actually provide a clear
picture of overall performance, identify the root of performance problems,
or identify improvement opportunities. The reason is simple: Establishing a
robust and useful performance measurement program is difficult where still
arguments to what to measure, how to define the chosen metrics, and how
often they should be measured.
The Merriam-Webster Dictionary defines a metric as “a basis or standard
of comparison.” where by this definition, a stand-alone number or value is
not a metric. A number or value only becomes a useful management tool
when compared with another number or value. This is the premise of an
effective performance measurement program. After explaining what the
drivers and metrics are, the following sections take it in detail.
2.10.1 Facilities:
The facilities are the location in the supply chain where product is stored,
assembled or manufactured; ( Chopra, et al, 2001)stated that the facilities
can be summarized into two major types, production and storage sites.
Decision with respect the role, location, capacity, and flexibility of

60
facilities have a considerable effect on supply chain performance; therefore
tendency to locate many warehouses closed to customer is expresses
adaption of responsiveness, in the other side adaption efficiency strategy
needs to locate fewer warehouses to increase efficiency despite the fact that
this practice will reduce responsiveness.
Decisions with respect facilities are very important part of supply chain,
( Chopra, et al, 2001)declared that the role of production facilities must be
determined whether it will be flexible, devoted, or a combination of the
two. Flexible capacity can be used for many types of product. On the other
hand decisions regarding the location of facilities are part of the design of a
supply chain, the company shall decide whether to centralize the facilities
in order to attain economies of scale or to decentralize to become more
responsive, facility capacity also is considered part of supply chain design
where the company shall decide a facility's capacity to perform its intended
functions.
2.10.1.1 Facility metrics:
According ( Chopra, et al, 2001) there are below some of the metrics that
the company can use to measure its performance.

61
Table 2.3: Facility metrics ( Chopra, et al, 2001)
2.10.2 Inventory:
The inventories include all raw materials, work in process, and finished
products within the supply chain. ( Chopra, et al, 2001)cleared that The
inventories exist in the supply chain to compensate the mismatch between
the supply and demand, therefore changing inventory polices alter the
supply chain efficiency and responsiveness, therefore inventories play a
considerable role in supply chain ability to reinforce a company strategy,
company's competitive strategy which is relying on responsiveness can be
achieved by locating large amounts of inventory close to the customer. On
Metrics clarification Capacity Measures the maximum amount a facility can process
Utilization
Measures the fraction of capacity that is currently being used in the facility. Utilization affects both the unit cost of processing and the associated delays. Unit cost tends
to decline and delays increase with increasing utilization.
Production cost per unit
Measures the average cost to produce a unit of output. These costs may be measured per unit, per case, or per
pound depending on the product.
Theoretical flow/cycle time of production
Measures the time required to process a unit if there are absolutely no delays at any stage.

62
the other hand a company can use inventory to become efficient by
decreasing inventory through centralized stocking.
2.10.2.1 Inventory metrics:
According ( Chopra, et al, 2001)the company shall track the following
inventory metrics that have significant influence on the supply chain
performance:
Table 2.4: Inventory metrics ( Chopra, et al, 2001)
2.10.3 Transportation:
Transportation conveys product between different points in the supply
chain, ( Chopra, et al, 2001)stated that the company can take more than one
Metrics Clarification Cash to
cash cycle time
Is a high level metrics that includes inventories, accounts payable, and receivables.
Average inventory
Measures the average amount of inventory carried. Average inventory should be measured in units, days of demand and
financial value Inventory
turns Measures the number of times inventory turns over in a year. it is the ratio of average inventory to either the cost of goods
sold or sales. products
with more than a
specified number of
days inventory
Identify the product for which the firms is carrying a high level inventory, this metrics can be used to identify products that are in oversupply or identify reasons that justify the high inventory, such as price discount or being very slow mover.

63
form or combinations of modes and routs.; the company can design its
transportation network which includes collection of modes, location and
routs to be close to the customer, and also can use faster modes of
transportation or different forms like air, truck, sea and pipe line, thus
transportation has a large impact on both responsiveness and efficiency
making the supply chain more responsiveness but in the same time less
efficient.
2.10.3.1 Transportation metrics:
According (Chopra, et al, 2001) the company should measure
transportation performance with respect to the following metrics.
Table 2.5: Transportation metrics ( Chopra, et al, 2001)
Metrics Clarification Average inbound transportation cost
Typically measures the cost of bringing product into a facility as a percentage of sales or cost of goods sold (COGS).Ideally, this cost should be measured per unit brought in, but this can be difficult. The inbound transportation cost is generally included in COGS. It is useful to separate this cost by supplier.
Average incoming shipment size
Measures the average number of units or dollars in each incoming shipment at a facility
Average inbound transportation cost per shipment
Measures the average transportation cost of each incoming delivery. Along with the incoming shipment size, this metric identifies opportunities for greater economies of scale in inbound transportation.
Average outbound transportation cost
Measures the cost of sending product out of facility to the customer. Ideally this cost should be measured per unit shipped, but it is often measured as a percentage of sales. It is useful to separate this metric by customer.

64
2.10.4 Information:
The information is considered across functional driver, where it affects
every part of the supply chain and impacts every other driver. ( Chopra, et
al, 2001)declared that the company can use information system to become
both more efficient and more responsiveness. The wide growth of
information technology is evidence to the impact of information on
improving company performance; the company must decide which
technologies to use and how to integrate these technologies into their
company and their partners, there are many enabling technologies to be
used to enhance information system among the company and its partners,
such as electronic data interchange (EDI), internet, enterprise resource
system(ERP), supply chain management software, and radio frequency
identification(RFID). Information like other drivers, the company must
make tradeoff between efficiency and responsiveness where at certain
point the marginal cost of investing in additional information increase,
whereas the marginal benefit from the additional information decrease.
The components of information decisions exceed coordination and
information sharing that occurs in all stages of supply chain to achieve
objectives, where the company must analyze the information to increase
efficiency and improve responsiveness. the companies that rely push
system in its designing process of the supply chain require information in
the form of elaborate material requirements planning(MRP), but companies
rely pull system require information on actual demand, on the other hand

65
the companies need the information to forecast the future demand and to
prepare the aggregate supply planning.
2.10.4.1 Information metric:
The company can measure its performance according ( Chopra, et al,
2001)by examining the following metrics.
Table 2.6: Information metrics ( Chopra, et al, 2001)
2.10.5 Sourcing:
Sourcing is the cluster of business processes required to acquire goods and
services. The crucial decision that company should take regarding
Metrics Clarification
Forecast
horizon
Identifies how far in advance of the actual events a forecast is made.
The forecast horizon must equal the lead time of the decision that is
driven by the forecast.
Frequen
cy of
update
Identifies how frequently each forecast is updated. The forecast should
be updated somewhat more frequently than a decision will be revisited,
so that large changes can be flagged and corrective action taken.
Forecast
error
Measures the difference between the forecast and actual demand. The
forecast error is measured of uncertainty and drives all responses to
uncertainty such as safety inventory or excess capacity
Seasona
l factors
Measures the extent to which the average demand in a season is above
or below the average in the year.

66
acquiring goods and services as declared ( Chopra, et al, 2001), which
tasks should be outsourced and those that will be performed within the
company, for the outsourcing process as mentioned in the section 2.6.2.2
the company should decide whether to source from a single supplier or a
portfolio of suppliers. Sourcing decisions are very important where affect
the level of efficiency and responsiveness the supply chain can achieve.

67
2.10.5.1 Sourcing metric:
The sourcing metrics as stated by ( Chopra, et al, 2001)as following.
Table 2.7: Sourcing metrics ( Chopra, et al, 2001)
2.10.6 Pricing:
Pricing is the process which a company decide how much the customer
will pay for its goods and services. Pricing affects customer groups that
choose to buy the product, subsequently affects the supply chain
responsiveness
2.10.6.1 Pricing metrics:
The company can follow up its performance with respect the pricing driver
by measuring the following metric as stated by ( Chopra, et al, 2001).
Metrics Clarification Day's
payable outstanding
Measures the number of days between when a supplier performed a supply chain task and when it was paid.
Average purchase
price
Measures the average price at which a good or service was purchased during the year. The average price should be weighted by the quantity purchased at each price.
Range of purchase
price
Measures the fluctuation in purchase price during a specified period. The goal is to identify if the quantity purchased correlated with the price.
Average purchase quantity
Measures the average amount purchased per order. the goal is to identify whether a sufficient level of aggregation is occurring across locations when placing an order
Fraction of on time
deliveries
Measures the fraction of deliveries from the suppliers that were on time

68
2.10.7 erformance evaluation of the Supply chain management
In the previous sections supply chain management drivers and metrics have
been
displayed, subsequently the supply chain performance can be evaluated
according specific drivers. ( Govil, et al , 2002)stated that performance
measures to evaluate a supply chain should cover the financial and
operational domains since the goal is to provide customer satisfaction at
low cost and to guarantee competitiveness over the long term. ( Govil, et al
, 2002)added that the performance measures should be valuable not only to
continuously improve the efficiency of the supply chain but also to help
applying a strategic policy. Performance measures should be easy to
define, simple to apply, and easy to understand in order to take action
accordingly.
( Govil, et al , 2002) stated that the financial performance reflects the
profitability of the system and its ability to be competitive in the long term.
The financial evaluation in the short term encompasses of measuring the
incremental cost per unit in each activity center and for each project, and
measuring the non-value-adding expenses. The company shall take in to
account to maximize the productivity of capital, which supports for
maximizing the capital turnover. They must also maintain flexibility of
their strategic decisions by maintaining a significant cash flow.

69
( Govil, et al , 2002) declared that the customer satisfaction is a goal
should that be reached, in order to magnetize and maintain customers. The
evaluation of the supply chain in achieving this goal will be measuring the
availability of the products and services and their adequacy to customer
expectations.

70
Table 2.8: Pricing metrics ( Chopra, et al, 2001)
71
Chapter 3
3 Methodology
3.1 Introduction
This chapter provides an overview of the methodological approaches, and
the research design to evaluate the applied supply chain management of the
Palestinian companies, through exploring and assessing current practices
and understandings of Palestinian companies’ in relation to the supply
chain management concept, in addition conducting a comparative study
between Palestinian and the state of the art practices of SCM is discussed.
The thesis investigates the gap between applied supply chain management
in Palestine and a similar, yet successful pattern of the supply chain
management, that appeared in the literature review. Based on the above
parameters, the special condition for the research environment will be
addressed through the development of the framework in chapter 5.
Furthermore the thesis provides focusing on four key themes are practiced
in coarse of supply chain implementation, the themes were studied and
analyzed through the survey results and some conclusions are drawn and
displayed.
Theme1: Supply chain management concept and its impact on the success
of the firm
• What is supply chain management?

72
• What are the various issues that need to be considered when
designing, planning, or operating the supply chain?
• What are the basic elements that must be managed within this
comprehensive understanding?
Theme 2: Competitive and supply chain strategies
• Determining supply chain strategy, responsive or efficient
strategy
• Possessing competitive advantage, low cost or differentiation.
• Strategic fit between the competitive advantage and the supply
chain strategy
Theme 3: Supplier relations
• Supplier selected criteria
• Reduction of the number of suppliers
• An evolution towards strategic partnership
Theme 4: Customer relation
• Customer delivery performance
• Relationship management
• Customer personalized services
Finally, a proposal for conceptual framework module be structured and the
proposal submitted through using suitable tools that required to identifying
deferent designing stages requirements, considerations or constraints.

73
3.2 Research Background
3.2.1 Research Hypotheses
The following are the hypotheses which raise the research question:
H1.there is weakness in supply chain management understanding among
the Palestinian companies.
H2. The applied supply chain management in Palestine suffers from
weakness in strategic design.
H3. There is not strategic fit between the applied supply chain and
companies competitive strategy?
H4. Company’s relationship with its supplier takes butterfly pattern.
H5.Customer relationship management suffers from weaknesses, which
reflected on the customer services.
3.2.2 Research Questions
1. What are the gaps between applied supply chain management in
Palestinian companies, and the theoretical and practical global concepts
used in successful world companies?
2. What is the suitable supply chain management framework that can be
used to leverage company’s performance, taking into account the condition
of the research environment.

74
3.2.3 Research Objectives
The aim of this research study is to develop a generic supply chain
management framework that can be used to support Palestinian
companies through integrating various supply chain activities. Further
objectives are listed below;
e. To investigate the role of supply chain management in providing
competitive advantage for companies
f. To explore and asses current practices and understandings of
Palestinian companies’ in relation to the supply chain
management concept.
g. To investigate the state of the art in the area of SCM.
h. To conduct a comparative study between Palestinian and the
state of the art practices of SCM.
i. To develop a generic framework that complements Palestinian
industry.
3.3 Research Design and Methodology
Research methodology is controls to conduct the search process within a
sound basis to ensure access to the desired outcome, where research
methodology provides the procedural rules for the evaluation of research
and the validation of the collected data, while research design role as the

75
research road map (Creswell, 2003). As (Sekaran, 2003)further clarifies,
research methodology is considered academic framework describes how to
collect and verify the parameters to get the results, and validating new
knowledge. (Cooper, et al, 2005)said that identification of the research
methodology of the important issues facing the researcher, where the
search process that were not subject to systematic and clear become a
deviation from the desired goal will be the resources consumptive search
process is not constructive, so it must be a clear methodology and
applicable.
Research methodology is an utmost importance to conduct the research. A
methodology does not simply structure a study but it identifies the research
tools and strategies (i.e. resources) that will be employed, and determine
the mechanisms of use to attain research objectives. As (Sekaran,
2003)suggests, The importance of the research methodology stems from
being a set of activities related to conducting research, methods and
strategies, in addition to providing criteria to ensure the success of research
and achieve the goals.
Falls within the context of the research methodology, each research should
raise a set of unique questions and determines a group of objectives need to
be achieved. The research design functions will articulate the strategies and
tools through which raw data will be collected and analyzed. It additionally
serves to connect the research questions to the data and articulate the
means by which the research hypothesis shall be tested and the research

76
objectives satisfied (Punch, 2000). For research design and preparation of
the correct methodology must answer the following questions related.
These are (1) the articulation and selection of the research questions; (2)
the identification of the relevant data; (3) determination of data collection
focus; and (4) the selection of the method by which the data will be
analyzed and verified (Punch, 2000). Although research methodology and
research design are distinct academic constructs, (Punch, 2000)maintains
the former to be more holistic than the latter and, in fact, inclusive of it.
3.3.1 Research Purpose
Research scholars have recognized three main purposes to the research
activity. These are the exploratory, the descriptive and the explanatory
purposes (Saundres, 2000). (Patton, 1990)Identifies a fourth purpose which
he added the prescriptive purpose. (Jackson, 1994)stated that the researcher
should name the purpose(s) by correlating the research questions to the
research objectives, this is exactly the strategy that the current research
shall take up.
3.3.1.1 Exploratory
Exploratory research revealed through focus group interviews, by
conducting structured or semi structured interviews with experts and a
search of the relevant literature (Saundres, 2000). Its key purpose is the
exploration of a complex research problem or phenomenon, to clarify the
complexities that have been identified and a gallery of the nature of the

77
underlying phenomenon selected. In other words, and as (Robson,
2002)explains, exploratory research investigates a specified
problem/phenomenon for taking it from different angles and putting it
under light, consequently, revealing new knowledge. The research
questions directly tie in with, and complement one another. They
additionally correlate to research objectives and are fundamentally
explorative in nature.
3.3.1.2 Descriptive
(Punch, 2000)explains the purpose of the descriptive research as the
gathering, organization and summarization of information about the
research problem and issues identified in it. The descriptive research, it
renders the complicated phenomenon and issues more understandable.
Descriptive research entails the thorough examination of the research
problem, for the specified purpose of describing the phenomenon, as in
defining, measuring and clarifying it (Dane, 1990) . (Jackson, 1994)
claimed that all research is partly descriptive in nature. The descriptive
aspect of a research is, simply stated, the (1) who, (2) what, (3) when, (4)
where, (5) why, and (6) how of the study. Proceeding from the above and
bearing in mind that the first research question is partly descriptive in
nature; the research adopts a descriptive purpose in parts. To answer the
research question, and test the proposed hypotheses, it is necessary to ask
(1) What are the gaps between applied supply chain management in
Palestinian companies, and the theoretical and practical global concepts

78
used in successful world companies?.(2) What is the suitable supply chain
management framework that can be used to leverage company’s
performance, taking into account the condition of the research
environment? These questions, immediately correlate to the research
objectives, are integral to the testing of the hypotheses and are essential for
the answering of the research questions. More importantly, these questions
are descriptive in nature, are answered through the literature review and, as
such, impose a descriptive purpose upon the research.
3.3.1.3 Explanatory
(Miles, et al, 1994)stated that the function of explanatory research is to
clarify the relationship between variables and the elements component of
the research problem. Explanatory research, in other words, functions to
show up the complex interrelationships existent within, and around, a
particular phenomenon and contained within the research problem (Miles,
et al, 1994). Explained this, (Punch, 2000)asserts that explanatory, or
causal research, determined upon the nature of the problem under
investigation, and explains the basis for the proposed solution. It is an
explanation of the complex net of interrelated variables identified and
follows directly from stated central research hypothesis and research
question. Where both research questions have descriptive component to
them, they appears a fundamentally explorative intent. Responding to these
questions necessitates the clarification of the variable relating to practiced
supply chain management. The research questions can only be

79
satisfactorily answered, and the requirements of research objectives can
only be adequately satisfied if the interrelated variables of the four themes
are explained. Accordingly, the research shall further adopt an explanatory
purpose.
3.3.1.4 Prescriptive
(Hair, 1992) defines prescriptive research as studies which aim to propose
well defined solutions to the investigated research problem. A prescriptive
research does not simply prescribe a set of solutions or recommendations
but sets a well-defined, comprehensively explained and implementable
blueprint for a specified solution. (Patton, 1990) contends that the
prescriptive research purpose builds upon the other purposes but extends
beyond them in one key aspect. Whereas the descriptive, exploratory and
explanatory purposes focus upon facts on ground, the prescriptive approach
focuses on what should be. Research scholars, concurring, have determined
that research which embraces the prescriptive purpose tend to be more
valuable than those which avoided it, as they add to a field and expand its
parameters ( (Patton, 1990); (Jackson, 1994); (Punch, 2000); (Cooper, et al,
2005); (Hair, 1992); (Ghauri, et al, 2005)). The second research question
and the main research objective impose a fundamentally prescriptive
purpose upon the study. Quite simply, the ultimate objective of the
research is the proposal of generic supply chain management framework
which includes a successful implementation to the research environment.

80
Consequently, while the research has undeniably descriptive, exploratory
and explanatory purposes, its ultimate purpose is prescriptive in nature.
3.4 Research Approach
The research approach selection should be in accordance with the
important decisions needed to be made. The research approach will not
influence the research design, but it will give the researcher the opportunity
to consider how each of the various approaches may contribute to the
research design. It may also limit the study, allowing satisfaction of the
articulated objectives and design to an approach which best satisfies the
research‘s requirements (Creswell, 2003).
The research approach embraces the quantitative versus the qualitative and
the deductive versus the inductive. Each set of approaches is commonly
perceived of as referring to polar opposites (Hair, 1992). (Jackson,
1994)takes issue with this perception and contends that a researcher should
not limit himself to a particular approach but, instead should use a variety
of approaches, if and when required by his study.
3.4.1 The Deductive versus the Inductive Approach
(Marcoulides, 1998)defines the deductive approach as a testing of theories.
The researcher starts with a set of theories and conceptual precepts in mind
and formulates the study‘s hypotheses on their basis, the research proceeds
to test the proposed hypotheses. The inductive approach, on the other hand,

81
follows from the collected empirical data and proceeds to formulae
concepts and theories in accordance with that data,
3.4.2 The Qualitative versus the Quantitative Approach
The quantitative tools for data analysis generally used in the physical
sciences, are structured in such a way to guarantee as much as possible,
objectivity, ability to generalize and reliability (Creswell, 2003). Here the
researcher is viewed as external to the research, and results are expected to
be constant if the study is repeated, regardless of the identity of the
researcher. Accordingly, the matrix of quantitative research techniques is
inclusive of random and unbiased selection of respondents. It is primarily
used for the production of data able to generalized for such purposes as
evaluation of outcomes, tending towards the near total decentralization of
human behavior. It is such decentralization that raises criticisms amongst
those who tend to exhibit preference for qualitative tools, arguing that these
offer insight into perceptions and interactions (Creswell, 2003).
Accordingly, whereas questionnaires are leading tools for the first,
qualitative methods include interviews, observations and focus groups, are
designed to clarify the underlying meaning/cause behind selected
phenomenon. In other words, while qualitative tools analyze the reasons
behind a particular phenomenon, quantitative tools analyze the
phenomenon itself, independent of human perceptions of reasons why
(Creswell, 2003).In contrast, quantitative tools are used for the production

82
of statistical data which proceeds from the availability of quantifiable data,
essentially out of the human factor effects. The first of these tools, means,
tandard deviations and frequency distribution is a cost efficient method of
reducing close-ended questionnaire data into straightforward statistics,
representing the average and variability of responses, with the frequency
distribution functioning as the graphical representation of the number of
times particular responses were given. This tool reduces data to
comprehensible, manageable and (ideally) objective numerical or graphical
representations (Creswell, 2003). The second tool, cross tabulation, scatter
diagram, and correlation coefficients, goes a step beyond the first in the
sense that it draws conclusions on the relationship between the variables.
The last tool, difference tests, measures one sample group against a
baseline for purpose of examining the differences between specific
variables over a time frame (Creswell, 2003). we can conclude that the
conditions necessitating the use of quantitative tools includes presence of
quantifiable research data and the goal of reducing that data into
straightforward statistical representations of basic facts regarding aspects in
the inputs, outputs or design components in any of the organization, group
and individual levels. The figure 3.1 summarizes the differences between
the two approaches.

83
Figure 3.1: The Qualitative versus the Quantitative Approach (knowledge-
communication. Site)
Quantitative research Qualitative research Objective is to test hypotheses
that the researcher created. Objective is to find out and encapsulate
meanings once the researcher becomes immersed in the data. Concepts are
in the form of distinct variables Concepts tend to be in the form of themes,
motifs, generalizations, and taxonomies. However, the objective is still to
generate concepts. Measures are systematically created before data
collection and are standardized as far as possible; e.g. measures of job
satisfaction. Measures are more specific and may be specific to the
individual setting or researcher; e.g. a specific scheme of values. Data are
in the form of numbers from precise measurement. Data are in the form of
words from documents, observations, and transcripts. However,
quantification is still used in qualitative research. Theory is largely causal
and is deductive. Theory can be causal or non-causal and is often inductive.
Procedures are standard and replication is assumed. Research procedures

84
are particular and replication is difficult. Analysis proceeds by using
statistics, tables, or charts and discussing how they relate to hypotheses.
Analysis proceeds by extracting themes or generalizations from evidence
and organizing data to present a coherent, consistent picture. These
generalizations can then be used to generate hypotheses. According to
(Punch, 2000) advice that a research‘s value is inevitably maximized
should it exploit both approaches, this research shall contain both
quantitative and qualitative approach. The questioner or the survey as long
as interviews approaches have been adapted in order to collect the data
required for this research.
3.4.3 Research Strategy
(Robson, 2002) identifies three research strategies, or plans to answer the
research question. These are the experimental, the survey and the case
study strategies. The researcher can select one, or even all three of these
strategies, depending on the requirements of the research itself and the
nature of the study. (Yin, 1989) Agrees, scientific researches exploit the
experimental strategy while the social sciences tend towards the survey and
the case study strategies.
Our research adopted survey model approach. The survey approach have
been chosen in this research in order to achieve research descriptive and
explanatory purposes, the survey looks at companies current situation
through answering questionnaire question, what, why, how. The

85
questionnaire constructed to address four key themes (section 3.1) are
practiced in coarse of supply chain implementation, however the
questionnaire was presented to the participants on four parts, each part
intended to measure and explore one key theme. Themes components
which have been reviewed in the literature formed the base of the
questionnaire questions, then the survey statistical analysis tools have been
used in order to measure the relation between survey questions. In addition
the exploratory purposes have been achieved by executing some direct
interviews, and meetings discussions. Finally, the exploratory, descriptive,
and explanatory purposes achievement led to achieve the main objective
generic framework.
3.4.3.1 Sampling criteria
The sample selection criteria to conduct a qualitative survey, is faced with
a different set of priorities need be considered. The qualitative survey is
almost similar to an individual scientific research. According to (Patton,
1990), The sample should be large enough to be credible, given the
purpose of evaluation, but small enough to permit adequate depth and
detail for each case or unit in the sample.
The research sample preparing passed through close coordination with the
Palestinian general federation, the federation recommended to form the
sample from the top vital sectors which having considerable weight in the
Palestinian industrial sector, which are six sectors, Plastic industry, Marble

86
and stone industry, Foodstuff industry, Pharmaceutical industry, Chemical
industry, Engineering and metal industry. The sample was formed from the
six sectors according to weight of each sector to be 75 companies.
The method relied upon in preparing the research sample is the Judgmental
sampling method. This sampling criteria has been chosen to attain the
maximum benefit of the Federation's deep knowledge of Palestinian
companies and all related concerns. In addition, we are dealing with
unprecedented research in Palestine regarding the supply chain
management.
The research sample has been prepared after reviewing relevant studies
conducted globally, irrespective of the sectors under study or the number of
the companies used to form the sample. Furthermore, the sample was
finally formed in light of the PCBS (Census, 2008).
3.4.3.2 Qualitative Data Collection
(Cooper, et al, 2005)advise researcher against putting specified data
collection method in mind. Instead, the researcher should first identify the
type and nature of the required data and then select those collection
methods which are best suitable to the collection of the identified data
types.
While (Ghauri, et al, 2005) largely agree with this advice, they nevertheless
assert that the researcher must limit his selection of data collection
methods, not to the type of data required, but to the collection methods

87
available to him. For example, it will not be feasible for the researcher to
collect the data across several countries, for example, even if the nature of
the required data has determined this to be the optimal collection method.
It is necessary for the researcher to make tradeoff between the available
data collection methods and the methods optimally required by the needed
type of data (Ghauri, et al, 2005). In our research three data collection
methods have been utilized. On line survey, personal observations of the
researcher through his work, meetings discussion, and interviews based
data collection method.
The on line survey have been used in order to reach all of the research
sample companies, and such type of survey may add more seriousness and
official to respondent, it is easier to fill, in additional, the online surveys
facilitate the work of analysis and they can give immediate results
3.4.4 Credibility and Quality of Research Findings
The data that is collected is used for reporting research results. If the data
cannot be verified, this means that the likely suspect in the results.
Accordingly, it is incumbent on the researcher to validate his findings
(Sekaran, 2003).
The Research data have been collected using four different ways.
1. On-line survey which was sent to the respondent by mails.
2. Direct interviews.

88
3. Previous related – local- researches.
4. Observations
The sample size was 75 enterprises. A period of two weeks was taken for
the completion of the surveys and their return back to the researcher. At the
end of the second week period, 40 surveys were returned; one was rejected
and excluded from the study because it was not completed. Therefore, only
39 have been approved. The average time to complete the online survey
was 17 minutes; the response rate was 53%. Pilot tests have been
conducted and the feedback was taken into consideration before sending
the final survey. Furthermore, some external experts have been asked to
review the survey and their feedback was also considered and utilized.
3.5 Research methodology description
The research question emerged from the company’s practice. The research
objective answers the question, through the development of a generic
framework meant to enhance the company’s abilities. The starting point
was from a literature review which forms the main base for the research.
Then six sectors have been chosen as a representative research sample in
order to investigate the current situation of supply chain management
practice in Palestine. Then electronic survey was developed in order to
gather the data, which have been analyzed using some statistical tools and
methodologies. The gap between the result of the analysis and related
researches and observations surmised in the literature, form the base of

89
developing a generic framework, which can be used as a benchmark for
measuring a company’s performance in a research environment.
The research methodology in points can be summarized as follows:
1. Conduct a literature review
This is largely designed to review existing literatures and publications
on the concept of supply chain management, and to review recent
significant supply chain studies and reports.
2. Identifying research objectives.
3. Data gathering
a. Selecting a group of companies according to the predetermined
criteria to represent Palestinian companies.
b. Developing an electronic survey.
c. Conducting a pilot test.
d. Conducting the actual surveys.
e. Interviews and meetings to be conducted with the executive
management of the selected companies. The expected outputs
are:
Information about the reality of the companies’ adherence to
the managerial concept of SCM
Evaluation of companies understanding of the SCM

90
Clarification, from companies’ viewpoint, the obstacles faced
when applying the SCM concept.
4. Data analysis
a. Conducting comparison between local companies performance
in practice to literature review.
b. Determine the gap between practice and theory.
c. Developing conceptual framework module in order to :
Standardize descriptions of management processes.
A framework of relationships among the standard processes.
Standard metrics to measure process performance.
Management practices that produce best-in-class
performance.
Standard alignment to features and functionality.
d. Testing companies practice compared with frame work module.

91
Chapter 4
4 Data gathering and analysis
4.1 Introduction
The data of this research were collected by using an electronic (online)
survey distributed to six sectors of manufacturing industries in Palestine,
they are Plastic industry, Marble and stone industry, Foodstuff industry,
Pharmaceutical industry, Chemical industry, Engineering and metal
industry. Some of the data came from Palestine Federal Industries (PFI)
and also from Palestinian Central Bureau of Statistics (PCBS).
The six sectors industries are considered as some of the oldest industries in
the West Bank and play a key role in the Palestinian economy. Developing
framework for such industries depend upon identifying the current
situation of the working firms in research environment. In order to do that
the researcher conducted an electronic survey; the respondents were asked
to answer the survey questions, see Appendix 1, 39 completed responses
constitutes the basis of the results of this chapter.
This chapter presents a discussion of the study’s results as related to the
statement of the problem, purpose of the research, and the research
questions, followed by results analysis, findings and conclusions.
As noted earlier, the electronic survey was distributed to the research
sample in Palestine. The researcher chose this sample of population in

92
order to achieve the research objectives which were generally the important
companies according PFI classification. The researcher exerted
considerable efforts to leverage the number of responses to be completed.
A period of two weeks was taken for the completion of the surveys and
their return back to the researcher. At the end of second week period, 40
surveys were returned; one was rejected and excluded from the study
because it was not complete. Therefore, only 39 had been approved. The
average time to complete the online survey was 17 minutes; the response
rate was 53% per cent.
The surveyed firms were selected according following a geographical
perspective to cover the different industrial zones within research
environment in Palestine, as shown in Figure 4.1
Figure 4.1: Geographical distribution of the surveyed firms

93
Meanwhile the responses included six manufacturing sectors categories:
Plastic industry, Marble and stone industry, Foodstuff industry,
Pharmaceutical industry, Chemical industry, Engineering and metal
industry, Figure 4.2 shows the percent of each sector forming the sample.
Figure 4.2: The percent of each sectors forming the sample
The average investment for the sample companies was $3,000,000. The
largest investment was $18,000,000 while the smallest one was $200,000.
Also the average number of senior employees and the plants’ workers was
40 and 22 respectively.
This research aims at assessing the application of supply chain
management system in the manufacturing industry in Palestine. The
evaluation presented is based on data and information collected through the
execution of questionnaire in 40 companies from six sectors of
manufacturing industries in Palestine. In this research four key themes are

94
studied and analyzed through the survey results and some conclusion are
drawn.
4.2 Theme (1) Supply chain management concept and its impact on
the success of the firm
The first objective of the survey was to investigate the surveyed sample
understanding of the supply chain management concept, the following
issues fall under this key theme
• What is supply chain management?
• What are the various issues that need to be considered when
designing, planning, or operating the supply chain?
• What are the basic elements that must be managed within this
comprehensive understanding?
The surveyed companies showed that the elements that are basic to each
stage and that must be managed through the supply chain management are
products, information and funds. Where the result was only 23%, the
surveyed companies indicated that the basic elements of products,
information and funds must be managed in the supply chain
simultaneously. However, the majority (77%) mentioned some elements in
need of management along with the above mentioned basic elements.
While 23% thought that the basic elements must be managed
simultaneously, 77% mentioned managing with them along with other
elements.

95
The survey findings with respect to the elements that should be managed
showed weakness in the understanding of the concept. As each stage in the
supply chain is connected through the flow of products, information, and
funds. These flows often occur in both directions and may be managed by
one of the stages or an intermediary. Figure 4.3 shows the results.
Figure 4.3: Elements should be managed in the supply chain
57% of the surveyed companies, showed that the objective of the supply
chain is to maximize the overall value generated, 43 % said that there are
other objectives else.
The objective of every supply chain should be to maximize the overall
benefit. The benefit also known as supply chain surplus, a supply chain
generates is the difference between what the final product is worth to the
customer and the cost the supply chain incurs in filling the customers
desire. Where 75% did not know the exact objective of the supply chain,

96
this indicates that there is a significant proportion not aware about the
supply chain objective
The surveyed companies showed clearly that the costumer is a part of the
supply chain and must be taken in to account, 93% illustrated that the
customer is an integral part of the supply chain, 7% said that the customer
is not part of the supply chain.
In fact, the primary purposes of any supply chain are to satisfy customer
needs and in the process generate profit. Supply chain moves the product in
the following order: expanded chain, supplier, manufacturers, distributors,
retailers and finally customers.
The results of the survey also showed that 53% of the companies executing
the order in response to anticipation of customer order, which is a push
approach to produce the production initiated and performed in anticipation
of customer orders.
At the same time, 47% of the surveyed companies showed that they are
executing the orders in response to customer orders, which is pull approach
to produce the production initiated and performed by customer order, the
chart 4.4 displayed the results:

97
Figure 4.4: Production process approach
Companies adaptation of the pull or push approach must be based on
studies, interoperations, and kind of product produced by the company.
Push approach shall be based on forecasting studies to achieve the desired
objective, subsequently satisfying the customer to attain the maximum
surplus. The survey results showed that 77% of the surveyed companies
rely on forecasting and previous studies.
When the surveyed companies were asked directly about the time frame of
making the decisions and its impact on company success, all of the
surveyed companies said that taking the decision into phases plays
significant role in the success or failure of a firm.
All the above concluded results have been attained from answers submitted
by the respondents. They were answered through direct questions, that
were presented on the questionnaire. In order to check the reliability of the

98
surveyors answers, the attained data will be analyzed statistically, with
hypothetically based data analysis. Furthermore, statistical analysis tools
will be used to analyze data used to formulate results.
The first tested hypothesis states that the production plans were not based
on forecasting studies to achieve the desired objective, subsequently will
not satisfy the customer to attain the maximum surplus. According to the
data from the questionnaire findings, the companies assured that they
prepare productions plan according to previous studies and forecasting, but
actual observations of the researcher; local companies do not prepare
production plans according previous studies and forecasting.
Chi Square analysis was used as a tool to check relations between two
different question or factors and distinguish whether it is dependent or
independent. the Chi Square analysis and results have been attained
directly from the used software (questionpro), the online survey software
facilitated the work of analysis and can give immediate results
After statistical analysis for two questions are supposed to be related, by
using a Chi Square test, Table 4.1 shows there is relationship between the
two question, which is mean that the two tested question dependent on
each other.

99
Table 4.1: Chi Square to investigate the relation between the
background of production plan and production approach
PEARSON'S CHI-SQUARE TEST
First Variable Are productions plans prepared according previous studies and forecasting?
Second Variables What are the bases that companies depend upon to prepare the production plan? Is it pull or push approach?
Null hypothesis Two variables are independent Adverse hypothesis Two variables are dependent
Criteria
If the pairs of variables are dependent, there is a relation to prove that the companies prepare its production plans according previous studies and forecasting. Where preparing plans according previous studies and forecasting is a prerequisite to rely push approach. If the pairs of variables are independent, there is a relation to demonstrate that the companies do not prepare production plans according previous studies and forecasting.
Alpha level of significance 5%
Degree of freedom 1 Critical Value for Alpha 3.841
Chi square 6.695
Conclusion
As chi square value (6.695) exceeds alpha critical value (3.841), then the null hypothesis can be rejected, so we can say that there is a dependency between the answers of two questions and that leads to say that the companies prepare its production plans according the previous studies and forecasting.
According to the results mentioned above, it was found that there is a
significant percent of the surveyed companies that are aware of the supply
chain management concept, but on the other hand there are results
indicated to weakness in understanding of the supply chain essence. The

100
conflict in the results can be attributed to the concept and details we are
asked about. When questioned about general issues the results reflected the
companies awareness, where management function was practiced for long
term. However when questioned about in depth issues, new concept, and
details like supply chain management objectives and elements that should
be managed through the supply chain and descriptive questions, the results
proved a weakness in supply chain management understanding.
4.3 Theme (2): Competitive Advantage and Supply Chain Strategies
The second key theme of the research is to explore the supply chain
management strategy of the surveyed companies and its competitive
strategy. Furthermore, to explore if there is strategic fit between the supply
chain and its competitive strategy,
Company's competitive strategy considered relative to its competitors, the
set of customer needs that it seeks to satisfy through its product, according
(Porter, 1985) companies will compete in low price, product differentiation
and focus group (segmentation strategy or niche). On the other hand, the
supply chain strategy includes design decisions regarding inventory,
transportation, operating facilities and information flow. Supply chain
capability will support a desired fit, when relying on responsiveness or
efficiency strategy.
The surveyed companies showed as presented in figure 4.5 that its
competitive strategy are mainly based on the product differentiation where

101
63% ascertain this, 30% of the companies said that the low price was their
competitive strategy and 7% said segmentation strategy or niche strategy.
But companies express an inclination to mixed strategy between product
differentiation and low price, wherein 30 % illustrated this conclusion
which can be interpreted from two perspectives, as companies seek to
target different sectors, or they produce different types of products.
Figure 4.5: Companies’ competitive advantage strategy
The survey results showed weak signs that there is a proper fit between a
companies supply chain strategy and their competitive strategy. This means
that both the competitive and supply chain strategies are not strategically
aligned. Figure 4.6 display the results, whilst 64% of the respondents had
said that the supply chain strategy at their companies is responsiveness said
that the product differentiation is the competitive strategy of their
companies in the market, 32% of those who had said that the efficiency is
their supply chain strategy said the low cost is their competitive strategy.
Moreover 58% of those who had said that the efficiency is their supply

102
chain strategy said the product differentiation is their competitive strategy,
at first glance this conflicting data can be attributed to the existence of
policies in the companies to produce some differentiated product, despite
their reliance on a strategy to reduce the resources in the management of
supply chain.
Figure 4.6: Strategic fit between supply chain strategy and competitive advantage
To exclude this possibility, the data above were searched in detail, the
respondents surveyed were classified to whom answer only one strategy
either responsiveness or efficiency, and to whom answer mixed strategy.
Then the researcher looked at the first category at those who chose a
unique strategy. It was apparent that the majority of the surveyed
companies showed inconsistency between the supply chain strategy and the
competitive advantage, and that they did not understand the required fit.
Other indication showed inclination to the strategic fit between the supply
chain strategy and competitive advantage, respondents’ answer on

103
question, “are customer needs taken in to account when making decision
regarding the inventory location?” 86% of the respondents answered yes
and only 24 % answered no.
The result attained that 86% take customer needs into consideration when
deciding about warehouse location is a high degree of importance, where
decision with respect to warehouse location considered strategic decision;
these decisions falls in to the design category depending on the frequency
of each decision and the time frame of decision impact. Warehouse
location play significant role in design of the supply chain, companies must
ensure that the chain configuration supports its strategic objectives and
increase the supply chain surplus. This refers to company’s attitude to
create consistency between customer priorities that the competitive strategy
hopes to satisfy and the supply capabilities that the supply chain strategy
aims to build, not a methodology along the extend supply chain.
The result above contributed to prove companies lack of understanding as
to the importance of alignment and consistency between the supply chain
management and it's competitive strategy. This result is exceeding the
company’s level, to reach the rest of the supply chain; suppliers,
distributors, retailers, and customer. This was determined by the responses
given to the question concerning supply chain circles being aware of
customers needs and how to work to satisfy those needs. It was found that
a significant percent, (63%) of the respondents said no and only 37% said
yes.

104
The former results indicate that the understanding of customer needs is not
a considerable issue along the extended supply chain.
This result indicates that there is an effort to satisfy the customer, but
inconsistency, adopting unclear vision among all circles of the supply
chain, and working asynchronously to achieve the aligned goals do not
reflect an overall understanding of the supply chain among all concern
parties.
4.4 Theme (3) Supplier relations
4.4.1 Supplier selected criteria
The ranking of the supplier selection criteria employed by the companies in
the surveyed companies are displayed in the Table 4.2 Conformance to
technical specifications appears to be a winning factor for the supplier
companies, where 61.0 % of the surveyed companies said that
conformance to the technical specification is the top priority and the
important criteria to select and deal with the supplier. A company relying
on the conformance to technical specification as a top priority is indicating
that respondents seek to produce good quality product in order to satisfy
customer needs.

105
Table 4.2: Ranking of the supplier selection criteria
Ranking
Selection Criteria
specification Price Lead time Quick
com.
ISO
A 60.71% 28.57% 3.57% 3.57% 3.85%
B 17.86% 46.43% 28.57% 3.57% 3.85%
C 10.71% 21.43% 35.71% 25.00% 7.69%
D 7.14% 3.57% 25.00% 64.29% 0.00%
E 3.57% 0.00% 7.14% 3.57% 84.62%
On the other hand when surveyed companies asked to state the second
most important criterion to select the supplier, 46% stated that price is the
second most important, 36% stated that the delivery lead time is the third
priority to select the suppliers, 64% stated that ease of communication the
supplier is the fourth priority to select the supplier, 84% stated that supplier
attaining to ISO certification is the fifth priority to select the supplier.
The aforementioned results regarding the supplier selection criteria
validated by other way, each rank (classification) was given
marks(weight), (A) classification was given 10 marks, (B) classification
was given 7 marks……etc. as in the Table 4.3 , for each criteria,
the classification is multiplied by its weight, the summation of the results
will be compared to rank the top priority. The biggest mark represents the
top priority that the supplier will be selected upon.

106
Table 4.3: Ranking of the supplier selection criteria
ranking ranking
weight
Price
Voting
Price
Marks
Spec
Voting
Spec
marks
Lead.T
Voting
Lead.T
marks
ease of
com.
Voting
ease
of
com.
marks
ISO
Voting
ISO
marks
A 10 8 80 17 170 1 10 1 10 1 10
B 7 13 91 5 35 8 56 1 7 1 7
C 4 6 24 3 12 10 40 7 28 2 8
D 2 1 2 2 4 7 14 18 36 0 0
E 1 0 0 1 1 2 2 1 1 22 22
197 222 122 82 47

107
The findings indicate evolution in the mentality of the surveyed companies,
where there is focus on considerable criteria to select the supplier
consistent with shared goals, customer satisfaction by offering good quality
product, where you can not submit good product without attaining raw
materials from suppliers with good quality, all of this will be reflected on
the supply chain as a whole and subsequently maximize the surplus.
There above findings are worth to reflect upon where it was found that
84% of the surveyed companies said that supplier attaining of ISO
certification is the fifth criterion to select the supplier. This indicates that
the surveyed companies do not require of suppliers comply with the
certifications issued by international institutions, which in turn may reduce
the networking opportunities with international companies and keep
abreast of development on this front.
Reduction of the number of suppliers
The previous results displayed the criteria that should be relied upon to
select the supplier, but what about the nature of the relation that must be
built and the number of supplier who must deal with them to achieve the
shared goals of all the supply chain circles.
The survey results show that 71.43% of the surveyed companies prefer to
deal with more than one supplier specially for critical items in order to
secure continues supply and to introduce price competition among these
suppliers.
108
The high percentage in the result above, indicates that surveyed companies,
for various reasons, have a strong tendency to deal with more than one
supplier. The reasons for this are related to the nature of the relationship
that is built between the companies and supplier, e.g. whether or not the
relationship is based on trust and mutual benefit. The researcher believes
that the relationship between companies and suppliers did not live up to the
level required. There are subjective and objective reasons related to
capabilities and abilities of the supplier in general, and the lack of
resources in the Palestinian areas in addition to the restrictions imposed by
occupation as will be explained in section 5.2.
The trend of the surveyed companies against a trend observed worldwide
which has been the reduction of the number of suppliers. (Rommel, et al,
1995)provide an example of this trend their study among the machinery
and component manufacturers has shown that successful companies have
half the number of suppliers as compared to the less successful companies.
This trend of reducing the number of suppliers was observed in Turkish
companies. These companies sought system suppliers more than individual
part and component suppliers. The trend towards system suppliers
represents another policy of the manufacturers for reducing their number of
suppliers. For suppliers to become a system supplier, they need to generate
the resources required and to develop their own product design capabilities.
Not every supplier of course is capable of becoming a system supplier. For
such companies a survival strategy is to partner with other companies to

109
form a network of companies acting as a system supplier each contributing
with its own capabilities.
4.4.2 An evolution towards strategic partnership
The results about the strategic relationship between the surveyed
companies and the suppliers show that, The majority of the surveyed
companies, around 86%, work to create strategic relationship with the
suppliers, and 87% from these who said they work to create strategic
partnership with supplier ensured they are planning and coordinating with
suppliers to avoid some problems in the future, especially with regard to
new product development.
The result which has been taken from another question, searching and
dealing with the same issue, the relationship strategy between the
companies and the suppliers was found to be drastically different. The 26%
that said they work to create strategic partnerships with suppliers, ensured
they are not providing the suppliers with information about the inventories
or about the volume of sales.
Previous results may be misleading if viewed superficially, but upon in-
depth inspection, it showed no conflict. The following reasons can
rationalize this. First, high percentage of these who said "they are planning
and coordinating with suppliers to avoid some problems in the future,
especially with regard to new product." can be attributed for the planning
and cooperation itself? Where any company desires to cooperate and seek

110
planning with partners? But when you go into details or what has been
accomplished like information about the inventories you will find that a
small percentage (26%) practice this activity which is fundamental to
establish strategic relationship, so this high ratio shows that there is a
desire to cooperation and joint planning.
The relationship between the companies and supplier has been taken from
a different angle, when the surveyed companies were asked "is the
company seeking to create a shared area and common understanding with
the supplier then consensus on shared vision?, only 43% said they are
aware of customer needs and work to fulfill it, and only 29% said they are
sharing supplier with information about the inventories and volume of
sales.
The results concluded above have been attained from the answers
submitted by the respondents; they answered them from direct question on
the questionnaire. In order to check surveyors answers reliability, the
attained data will be analyzed statistically, data analysis based on some
hypotheses; statistical analysis tools will be used to analyze data and
getting the results.
The company's answers reliability with respect to suppler relationship will
be checked through two hypotheses. The first tested hypothesis states that
the companies did not seek to create strategic relationship with the
suppliers, and companies did not work to create a common understanding

111
with the supplier then consensus on shared vision. According to the
questionnaire findings, the companies ensure they work to create strategic
relationship with suppliers, also the companies claim that they work to find
common understanding and shared area with suppliers. However, actual
observations of the researcher show that local companies do not work
seriously to build strategic relationships with the suppliers, nor do they
work towards common understanding and shared vision.
Chi Square analysis was used as a tool to check the two hypotheses; each
hypothesis was tested by checking the relations between two different
questions or factors and distinguishes whether it is dependent or
independent.
After testing the first hypothesis by using a Chi Square test, statistical
analysis for two questions that are supposed to be related, Table 4.5 shows
there is no relationship between the two questions, which means that the
two tested question are independent.

112
Table 4.4: Chi Square to investigate the relation between
company/supplier strategic relationships and their coordination to
avoid future problems:
PEARSON'S CHI-SQUARE TEST
First Variable Did the companies seek to create strategic relationship with the suppliers and go farther and farther in this relationship?
Second Variables Are the companies planning and coordinating with suppliers to avoid some problems in the future, especially with regard to new product?
Null hypothesis Two variables are independent Adverse hypothesis Two variables are dependent
Criteria
If the pairs of variables are dependent, there is a relation to prove that the companies work to create strategic relationship with the suppliers. Where planning and coordinating between the companies and suppliers are very important to build strategic relationship. If the pairs of variables are independent, there is a relation to demonstrate that the companies do not seek to build strategic relationship.
Alpha level of significance 5%
Degree of freedom 1 Critical Value for
Alpha 3.841
Chi square 0.386
Conclusion
As chi square value (0.386) did not exceed alpha critical value (3.841), then the null hypothesis cannot be rejected, so we can say that there is a independency between the answers of two questions and that leads to say that the companies did not work to create strategic relationship with suppliers.
The result of testing the second hypothesis by using a Chi Square test also,
statistical analysis for two questions are supposed to be related, , Table 4.5
shows there is no relationship between the two questions, which means that
the two tested questions are independent.

113
Table 4.5: Chi Square to investigate the relation between
company/supplier common understanding and provided information
to the supplier to keep him updated
PEARSON'S CHI-SQUARE TEST
First Variable Is the company seeking to create a shared area and common understanding with the supplier then consensus on shared vision?
Second Variables
Are the companies providing the suppliers with information about the inventories or about the volume of sales?
Null hypothesis Two variables are independent Adverse
hypothesis Two variables are dependent
Criteria
If the pairs of variables are dependent, there is a relation to prove that the companies work to find common understanding and shared area. Where the companies cannot claim they work to find common understanding or shared area without share the suppliers with information's. If the pairs of variables are independent, there is a relation to demonstrate that the companies do not seek to find shared area and establish common understanding.
Alpha level of significance 5%
Degree of freedom 1
Critical Value for Alpha 3.841
Chi square 0.798
Conclusion
As chi square value (0.798) did not exceed alpha critical value (3.841), then the null hypothesis cannot be rejected, so we can say that there is a independency between the answers of two questions and that leads to say that the companies did not work to find common understanding and establish shared area.

114
According to the results mentioned above, the researcher believes that
there is coordination at low level and limited on daily basis, but there is no
joint value generation aims at providing benefits to both the companies and
suppliers in short and long terms. It is based on the premise that
collaborating with the suppliers to improve their operation can reduce
purchasing cost. Purchasing cost includes not only the purchasing price but
all the other cost incurred due to uncertain deliveries and further due to
handling defective parts and component being supplied and even worse,
used in manufacturing process. As a result of joint value generation, the
purchasing cost is reduced for the manufacturer and manufacturing cost is
reduced for the supplier putting it into a more advantageous position than
before even if it's selling price is reduced.
A form of strategic partnership to be emphasized here is one where the
partnership is based on complementary knowledge and capabilities leading
to supply of system. It can answer the need of reducing the number of
suppliers and thus the complexity of the purchasing process for the
purchasing company. Such partnership aimed at the end product can lead to
increase in the added value and in the sales for such products,
Strategic partnership involves long term relation based on mutual trust.
Information sharing is essential for proper coordination of the supply
chain, particularly in reducing the uncertainties involved around order level
and schedules. Reduction in uncertainties leads to improvements in the
inventory positions of both parties and thus to cost savings for both parties.

115
4.5 Theme (4) Customer relation
Meeting customer requirements and expectation is a broad indicator of
customer satisfaction. Customer relationship encompasses the all practices
that are employed for the purpose of managing customer complaint,
building long term relationships with customer and improving customer
satisfaction.
4.5.1 Customer relationship management
The surveyed companies answered clearly that they are working to satisfy
the customer as shown in table 4.6.
Table 4.6: Company customer relationship management
# Question Yes %
No %
5. Does the company work to satisfy the customer even it requires modifying the products or change it?
85.71 14.29
6. Does the company measure customer satisfaction continuously?
89.29 10.71
7. Does the company service after the sale? 71.43 28.578. Is the company seeks to take the feedback regarding
products and a variety of sources? 96.30 3.7
9. Is there a specific mechanism to receive complaints? 78.57 21.4310. Does the company work to create long-term relationship
with customers and achieve customer loyalty for the products?
88.89 11.11
11. Is the product design and arrange production processes so as to achieve a quick response to customer and lower costs to the company?
96.3 3.7
The high ratios that have appeared in the results above indicate that high
attentions are paid to the customer needs and the customer is a top priority,

116
where the production according customer desire, customer opinion taken
into consideration during production process, and he is asked after the
service about his satisfaction. So this strong performance toward customer
needs must form tendency to aggregate efforts to create a straight line
towards the main goals, which is called the strategy
But is this the real situation, Chi Square test presented in Table 4.7 shows
there is no relationship between the two questions, which means that the
two tested questions independent.

117
Table 4.7: Chi Square to investigate the relation between company’s actions to establish long term relationship with the customer and
efforts to satisfy the customer
In addition to the result in Table 4.7, as indicated abstract ratios when the
question directly? .The surveyed companies have been asked the question
in different way by linking the mechanism to achieve the strategic goals
with managing the relationship with customer, the observations were as
displayed in the figure 4.7:
PEARSON'S CHI-SQUARE TEST
First Variable Do the companies work to establish long term relationship with the customer and seek for customer loyalty?
Second Variables Do the companies work to satisfy the customer desire even if they need to modify their products or change it?
Null hypothesis Two variables are independentAdverse
hypothesis Two variables are dependent
Criteria
If the pairs of variables are dependent, there is a relation to prove that the companies work to establish long term relationship with the customer and seek for customer loyalty. Where establishing long term relationship and achieving customer loyalty need serious effort in customer satisfaction and working according mass customization. If the pairs of variables are independent, there is a relation to demonstrate that the companies do not seek to build long term relationship.
Alpha level of significance 5%
Degree of freedom 1
Critical Value for Alpha 3.841
Chi square 0.422
Conclusion
As chi square value (0.422) did not exceed alpha critical value (3.841), then the null hypothesis cannot be rejected, so we can say that there is an independency between the answers of two questions and that leads to say that the companies did not work to establish long term relationship with the customer and seek for customer loyalty.

118
Figure 4.7: Mechanism to achieve the strategic goals with managing the relationship
with customer
Although, 29% of the surveyed companies declared that customer
satisfaction is the main priority for the company to achieve its strategic
goals. Customer satisfaction was ranked as the second priority to achieve
the strategic goals proceeded with expanding the company sales volume.
This result indicates that the surveyed companies pay medium attention to
the customer needs to achieve the strategic goals, which demonstrate that
there is awareness and knowledge of the payoff of customer satisfaction,
such as increasing the market share and maximizing the surplus, but not
relying customer satisfaction as a tool to drive companies strategic goals.
4.5.2 Delivery performance on time & in full
Delivery is the most widely used performance indicator in measuring
delivery performance. It is defined as the percentage of time a company
delivers the orders at the right quantities and the right time to its customer,

119
the observations in the chart below demonstrate that, nearly 40 % of the
surveyed companies declared that they failed to fulfill between25% to 5%
of the customer orders, and 50% failed to fulfill less than 5% of the
customer orders, 11 % failed to fulfill more than 25% of the customer
orders.
Figure 4.8: Delivery fulfillment performance
If we take abstract look to the result mentioned above, especially to the
extreme ratio, 50% failed to fulfill less than 5% of the customer orders,
which means that at least 95 % of the customer orders have been fulfilled;
it sounds an acceptable level of services being submitted by the Palestinian
companies compared with available abilities and condition of the
Palestinian companies.
In the same context the researcher investigated if the companies seek to
enhance its performance with respect the delivery fulfillment, Chi Square

120
test in Table 4.8 shows there is not relationship between the two question,
which is mean that the two tested question independent on each other.
Table 4.8: Chi Square to investigate the relation between the percent of orders that companies failed to meet and companies working to get
feedback PEARSON'S CHI-SQUARE TEST
First Variable What is the percent of orders that companies failed to meet regardless of cause?
Second Variables Do the companies work to get feedback about the products from different sources?
Null hypothesis Two variables are independent Adverse
hypothesis Two variables are dependent
Criteria
If the pairs of variables are dependent, there is a relation to prove that companies working to communicate others, and live among the audience to attain real quick feedback, useful feedback will be reflected on orders failed percent. Where companies active feedback will be better in meet customer orders, subsequently the percent of failed orders in lowest level. If the pairs of variables are independent, there is a relation to demonstrate that the companies do not work to get feedback in order to reduce failing in fulfilling customer orders.
Alpha level of significance 5%
Degree of freedom 2 Critical Value for
Alpha 5.991
Chi square 1.510
Conclusion
As chi square value (1.510) did not exceed alpha critical value (5.991), then the null hypothesis cannot be rejected, so we can say that there is an independency between the answers of two questions and that leads to say that the companies did not work to establish mechanism to get the useful feedback.

121
4.5.3 Customer personalized services
Customer personalized services or mass customization considered core
component of the customer relationship management, customer
relationship management is an important component of the supply chain
management practices. The results of the questions directed to the surveyed
companies showed growth of mass customization and personal services
which is leading to stage in which relationship management with customer
is becoming crucial for companies survival, the results displayed in
figure4.9.
Figure 4.9: Company's using of customer desire information to provide
individual customer needs
The ratios of the results above are considered high and indicate that there is
tendency to satisfy the customer and manufacturing according customers
desire, but when descriptive question directed to the surveyed companies,

122
the answers were divided into two main categories, part of the companies
which are formed 55% left the blanks without filling, and the second part
did not mention considerable action to manufacture according customers
desire. The weakness in understanding of mass customization which has
appeared in the previous ratio was supported by directing question about
postponement.
Where postponement is defined as the practice of moving forward one or
more operation or activities to much later point in the supply chain, the
postponement entails delaying activities that determine the form and
function of the product in the chain until customer orders have been
received like labeling, packaging, and assembling. The result displayed in
Figure 4.10, shows the percent of the survey companies that can apply the
postponement on their product.
Figure 4.10: Application of (postponement)

123
On the other hand when question about the form of postponement has been
directed to the surveyed companies, the result in Figure 4.11 reinforced the
pervious result, where 57% of the surveyed companies declared they did
not apply any form of the postponement on produced products.
Figure 4.11: Used postponement form
The postponement allows companies to execute customization effectively,
where the company can be flexible in developing different versions of the
product in order to meet changeable customer needs, and differentiate
product. Companies do not apply the postponement effectively, and even
not adopting this managerial tool will not keep materials undifferentiated
for long as possible to increase company's flexibility in responding to
uncertainties, so the companies will not submit personalized services that
incurred significant surplus, the two table Chi Square test, statistical
analysis for two questions are supposed to be related, Table 4.9 and 4.10,

124
show there is no relationship between, which means that the two tested
questions independent Therefore the company should work to use
postponement tool to enhance its services.
Table 4.9: Chi Square to investigate the relation between production
process arrangement and the effect of the postponement PEARSON'S CHI-SQUARE TEST
First Variable Are the product design and production process arrangement conducted so as to achieve a quick response to customer and lower costs to the company?
Second Variables
Can the application of postponement on any of the company product increase company's effectiveness?
Null hypothesis Two variables are independentAdverse
hypothesis Two variables are dependent
Criteria
If the pairs of variables are dependent, there is a relation to prove that companies work to design products and arrange the production process in order to achieve a quick response to customer and lower costs to the companies, where activation management tool as postponement certainly will enable the companies to arrange production process in to phases in order to achieve quick responses as well as lower costs to the companies. If the pairs of variables are independent, there is a relation to demonstrate that the companies do not work to design the products and arrange the production process to achieve quick response.
Alpha level of significance 5%
Degree of freedom 1
Critical Value for Alpha 3.841
Chi square 1.128
Conclusion
As chi square value (1.128) did not exceed alpha critical value (3.841), then the null hypothesis cannot be rejected, so we can say that there is an independency between the answers of two questions and that leads to say that the companies did not work to establish mechanism to get the useful feedback.

125
Table 4.10: Chi Square to investigate the relation between manufacturing according customer desire and the application of
postponement PEARSON'S CHI-SQUARE TEST
First Variable
Do the companies tend to manufacture according customer desire in any products, achieving personalized services and mass customization?
Second Variables
Can the application of postponement on any of the company product increase company's effectiveness?
Null hypothesis Two variables are independent
Adverse hypothesis Two variables are dependent
Criteria
If the pairs of variables are dependent, there is a relation to prove that companies work to fulfill customers needs according the customer personal perspective and his desire design in order to achieve mass customization, where activation management tool as postponement certainly will able the companies to produce products and submit services according customer personalized point view.
If the pairs of variables are independent, there is a relation to demonstrate that the companies do not work to produce products according customer desire to achieve mass customization.
Alpha level of
significance 5%
Degree of freedom 1
Critical Value for
Alpha
3.841
Chi square 0.520
Conclusion
As chi square value (0.520) did not exceed alpha critical value (3.841), then the null hypothesis cannot be rejected, so we can say that there is an independency between the answers of two questions and that leads to say that the companies do not work to produce products according customer desire to achieve mass customization.
126
4.6 Findings and conclusions
After analyzing the gathered data, the results of the analysis answered the
research question in section 3.2.2, “What are the gaps between applied
supply chain management in Palestinian companies, and the theoretical and
practical global concepts used in successful world companies?” The
research results were also congruent with the hypotheses in section 3.2.1,
which raised that research question. According to survey data, the key
findings and the gaps in practice were:
• There is weakness in supply chain management understanding
among the Palestinian companies.
• The supply chain management in the Palestine suffers from
weakness in strategic design.
• There is not strategic fit between the supply chain strategy and
company’s competitive strategy?
• Company’s relationship with its supplier needs to be developed.
• Customer relationship management suffers from weaknesses.
The findings above answered the first question of the research and
emphasized that the research hypotheses are valid, consequently, there is a
need to develop a conceptual framework for the Palestinian companies to
enhance its practice of the supply chain management system in order to
answer the second question of the research. The developed framework will
be discussed in chapter 5.

127
Chapter 5
5 Framework
5.1 Introduction
A supply chain is a network of facilities that procure raw materials,
transform them into intermediate goods and then final products, and deliver
the products to customers through a distribution system. All companies,
large and small scale, manufacturers and service providers, depend on
successful supply chain to help satisfy their customers. The performance of
the supply chain should be measured according metrics to assure
continuous improvement, reduce costs, and increase customer satisfaction.
Understanding the relationship between supply-chain management
practices and supply chain performance becomes increasingly important.
The Supply-Chain Operations Reference (SCOR) model developed by the
Supply Chain Council provides a framework for characterizing supply-
chain management practices and best processes performance. The SCOR
model investigates the relationship between supply-chain management
functions and supply chain performance based on the four decision areas
(PLAN, SOURCE, MAKE, DELIVER).

128
In 1996, the Supply Chain Council became an independent, not-for profit
professional association, and the SCOR model was attributed to it. ( Cohen,
et al, 2005)stated that Since launch of the SCC, the council has grown,
establishing international chapters in Europe, Japan, Australia/New
Zealand, Southeast Asia, and southern Africa, in addition to North
America. Members have continued to advance the SCOR model, adding
the return process in 2001 and periodically updating recommended
practices and metrics. We expect that the model will continue to evolve as
the “science” of supply chain management advances ( Cohen, et al, 2005)
added that the SCOR model is not the only framework of its kind for
developing a supply chain, other models have emerged that focus on
industry-specific practices and implementation level detail, such as data
standards. Two such initiatives that have been adopted widely in recent
years are Collaborative Planning, Forecasting, and Replenishment (CPFR)
and RosettaNet. improve the partnership between retailers and vendor
merchants through shared information.
the RosettaNet consortium Formed in 1998, is composed mainly of
companies in the electronics and telecommunications industries and is
managed by the Uniform Code Council, a leading commerce standards
organization. RosettaNet develops Internet-based business standards to
align processes through standard data definitions called partner-interface
processes (PIPs). Widely adopted by the technology sector, PIPs support
automated real-time information exchange between companies and cover a

129
broad range of transactions, including inventory management, order
management, and ship from stock.
The supply-chain operations reference model (SCOR) is the first cross-
industry framework for evaluating and improving enterprise-wide supply-
chain performance and management. The result of huge efforts by 70
world-class manufacturers, SCOR provides standard process definitions,
terminology and metrics. It will enable companies to benchmark
themselves against others, and influence future applications development
efforts to ensure fit with manufacturers’ needs. The process reference
model concept is the extension of business process re-engineering and
other process improvement efforts. SCOR, which is structured in four
levels, is based on a plan, source, make, deliver framework
The researcher will rely on concepts submitted by (Cooper, et al, 2005)and
on the SCOR model to develop the framework, focusing on the weaknesses
which appeared in the data analysis results. The research will investigate
the major issues that SCOR based on, business strategy, competitive
strategy and supply chain strategy These major concepts will be research
study and take more consideration through applying the SCOR model.
Before displaying the generic framework the following titles show what is
SCOR according supply chain council source.
The research generic framework designed to fit with the research business
environment which has some special constraints. Based upon Palestinian

130
business environment constraints, the research develop the framework
phases which developed based on supply chain operation reference
model(SCOR) established by supply chain council (SCC) 1996, and
(Chopra, et al, 2001) concept.
5.2 Palestine business environment constraints
According to a research reported by United Nations Conference on Trade
And Development (UNCTAD) in July 2004 (UNCTAD secretariat, 2004),
and according to observations and some formal meeting discussions in
PADICO, many factors may influencing Palestine enterprises growth, in
the same time those factors can be considered as a limitations which
affecting that enterprises' work, all of that limitations have to take into
account among managing the supply chain to be more effective and to
achieve the supply chain management systems. In this section the
researcher will entail the major factors as it was introduced by the
UNCTAD report.
5.2.1 Location
The political division of the Palestinian territory into Region A, Region B,
and Region C, is one of the most important factors that constitute an
obstacle when taking decisions to choose the right places for any industrial
enterprise that because of special regulations that controls each region,
these regulation mostly affecting the availability and accessibility of

131
infrastructure, water and sewage networks, electricity, roads, and
advertisements and signs.
In addition to that, proximity to the local markets considered as a major
factor that influencing location choosing decision. Also proximity to Israel
which is the Palestinian enterprises‘ main trading partner and source of
supply inputs, and the imposition of prohibitive transaction costs facing
Palestinian traders in view of the restrictive Israeli security measures and
the cumbersome customs and overland transport procedures at the main
borders seems to be one of the important factors that affecting location
choosing decision.
5.2.2 Subcontracting arrangements
Subcontracting arrangements, which are often relied upon to facilitate the
transfer of technology to enterprises in developing countries, have
generally been detrimental to the growth of Palestinian production
companies. As shown earlier, the majority of Palestinian production
enterprises are engaged in subcontracting arrangements with Israeli
enterprises, resulting in the diversion of their backward and forward
linkages towards Israel, which are the main source of input supplies,
machines and equipment, trade credit and outlets for products.
Furthermore, Israeli firms have been setting the limits for the development
of these enterprises' production capacity and experience in industrial
management, restricting their production processes to labor- intensive

132
activities. This has contributed to the impoverishment of those industrial
bases, especially these enterprises, which are supposed to spur
technological progress, are underdeveloped.
This contrasts with the experience of other developing countries, where
subcontracting arrangements have played an important role in improving
such enterprises performance. In particular, these arrangements have
provided enterprises with access to modern production technologies and
exposed them to international best practices, in addition to extending their
outreach by incorporating them into international networks of producers
and traders who form a complete marketing and production cycle for
particular products.
5.2.3 Source of finance
Most of Palestine production companies rely on personal savings to cover
their start-up and operating costs. Bank loans are the second source of
finance and it can’t be considered as an important source of finance for
Palestine production companies; that due to the uncertain condition which
not encourage bank lending. Moreover, in the absence of formal land
registration, most enterprises fail to meet banks‘ collateral requirements,
since these are based on real estate mortgages. The PA is yet to complete
the registration of the lands under its jurisdiction, making it difficult for
many enterprises to legally prove their ownership. Moreover, enterprises
find the application procedures complex and the interest rates are high.

133
Based on that, Palestine production enterprises may rely on other financing
sources, particularly moneylenders, leasing and suppliers‘ credit loans.
Some enterprises also make use of market finance (equity issues and
bonds), but this is organized through informal channels, since they are not
listed on the Palestinian stock market.
5.2.4 The legal framework
The absence of a comprehensive legal framework regulating economic
transactions can be considered as one of the special constrain in Palestine
business environment. Despite the considerable progress made in
developing it, the Palestinian legal framework remains weak, lacking the
key laws for ensuring a conducive business environment. The Palestinian
Legislative Council (PLC) is yet to issue such key laws as: Capital Markets
Authority Law, Income Tax Law amendments, Chambers of Commerce
Law, Insurance and Securities Law, Competition Law, Foreign Trade Act,
Intellectual Property Law, and Customs Law. At present, the legal
framework for economic activity consists of a combination of different
legal codes, including Israeli military orders, in addition to outdated
Ottoman, British, Jordanian and Egyptian laws. Moreover, the PA has yet
to institutionalize the separation of executive and judicial powers and
develop its court system, which lacks experienced judges.

134
5.2.5 Natural resources and power resources
The scarcity of natural resources available to the Palestinians under the
Oslo agreements stands as a major impediment to industrial development.
At present, the PA's jurisdiction is restricted to 80 per cent of the Gaza
Strip, the town of Jericho and 3 per cent of the rest of West Bank areas,
excluding Jerusalem. These areas are characterized by geographic
discontinuity, with the Gaza Strip totally isolated from the West Bank areas
by Israeli control of routes.
Water resources available to the Palestinians during the interim period have
been limited, notwithstanding a transitional agreement to increase water
quotas allocated to Palestinian areas. This is due in particular to the fact
that Israel has not fulfilled its commitment to allocate 28.6 million cubic
meters of water per year to the Palestinians during the interim period,
though the occupied Palestinian territory's water needs are estimated at 70-
80 million cubic meters per year. In the Gaza Strip, excessive tapping of
the aquifers has led to seawater leakage, rendering the water brackish.
Meanwhile, the process of desalination, which stands as the only option for
solving water shortages, is prohibitively expensive for most, if not all,
enterprises.
Moreover, the occupied Palestinian territory is not endowed with natural
gas, despite the recent discovery of commercially viable gas fields in the
Gaza Strip, and it has yet to develop an electrical grid of its own. It is

135
therefore heavily dependent on neighboring countries, particularly Israel, to
satisfy local demand. This has increased production costs for industries that
also lack three-phase electric power, which is important for the use of
heavy electrical equipment.
5.2.6Market limitations
In general, Palestine markets suffer from many weaknesses that have to be
taken into account, such as the local market size is small and limited, there
is a barrier between West Bank and Gaza strip markets, exports to
neighboring counters and foreign countries have many limitation, and
others.
The supply chain management concepts developed to satisfy customer
desire and to enable the company to carry out its duties perfectly,
supplying the raw materials from qualified suppliers, less manufacturing
defects, delivering the production at the right time and in the right place.
Palestinian companies in course of applying the supply chain endeavor to
achieve its goals. However, Palestinian environment, as mentioned in the
previous sections, imposes difficulties to select the supplier that companies
want, due to restriction inside Palestine (importing and exporting
restrictions due to the Israeli occupation).
The Palestinian business environment is not encouraging in terms of
investing in technology to enhance company’s capability in manufacturing
due to market limitation and changeable political situation. The research

136
aims to emphasize that to implement success supply chain in the
Palestinian environment, an in-depth look should transform the limitations
and alleviate the restriction in order to drive and apply supply chain
management system
5.3 Generic Supply chain Management Framework
5.3.1 Overview
The Palestine companies like all companies cannot be competitive if it
continues to operate randomly disorganized, as independent elements
without appropriate integration between its functions, and without clear
vision; the research will develop generic framework to overcome the gaps
appeared in the analysis results which are:
• There is weakness in supply chain management understanding
among the Palestinian companies.
• The supply chain management in the Palestine suffers from
weakness in strategic design.
• There is not strategic fit between the supply chain strategy and
company’s competitive strategy?
• Company’s relationship with its supplier needs to be developed.
• Customer relationship management suffers from weaknesses.
To guide the companies for successful supply chain management, and
based on supply chain operation reference model(SCOR), as mentioned in

137
section 5.1, the research will develop framework to over come the
addressed gaps.
The SCOR model has four levels, processes, sub processes, and activities
and operable processes, or level 4. level 4 is detailed workflow-level tasks
and is always customized to an organization’s specific strategy and
requirements, level 1 and ending with level 3, the content of the SCOR
model can be used to translate business strategy into a supply chain
architecture designed to achieve specific business objectives.
SCOR Level 1
At level 1, the company confirms how business processes will align with
the high level business structure (business units, regions, etc.) and supply
chain partners and refine the supply chain’s strategic objectives, the
business priorities that the supply chain must support. Level 1 focuses on
the five major supply chain processes (plan, source, make, deliver, and
return). Using these processes, the alignment between process and
organizational domains can be established to describe where processes
must be standardized across entities. Level 1 decisions also will determine
whether an organization will be able to implement certain business
practices.

138
SCOR Level 2
At level 2, the company refines the choice of supply chain processes and
confirms how supply chain processes align with company's infrastructure
(physical locations and information technology). For this, level 2 called
configuration level; level 2 involves developing and evaluating high-level
options for the supply chain process architecture by choosing the “flavors”
of plan, source, make, deliver, and return. This is done by selecting the
relevant sub processes, based on company supply chain strategy; the
selection of process categories will drive level 3 design where each
category requires very different detailed activities.
SCOR Level 3
SCOR level 3 is also called the process-element level; this is where the
company can complete its supply chain architecture by adding operational
detail to SCOR level 2 design. Within SCOR level 3 the company will find
specific business practices, associated metrics, the company will develop
maps illustrating the alignment between processes, locations, and
organizations. These maps will show where inventory is located, the lead
times between process elements, and the alignment between process
elements and supply chain information systems.
Based on the appeared gap, and the SCOR framework, the research
proposed framework to tackle the Palestinian state, taking in to account the
following points to customize the SCOR model:
139
• Simplifying the SCOR levels to be applied in the Palestinian
environment.
• Omitting the fourth level from the SCOR levels, because it is a
detailed workflow-level task and always customized to an
organization’s specific strategy and requirements.
• Adding competitive advantage level, which is extracted from the
level 1 to clear the link between the business strategies level (SCOR
level 1) and supply chain strategy (SCOR level 2).
• Adding level four to translate supply chain strategy, showing how
this will affect suppliers and customers, in order to overcome the
gaps appeared in the company relationships with suppliers and
customers.
From the analysis results, which indicate that the gap in Palestinian
companies understanding, deep, and reach to strategic matters as well as
details, the research intends to develop framework focusing on the key
concepts, and dealing with daily details. The proposed framework starting
from a point essential for the success of any business, start from strategic
issues to the tactics issues. The proposed framework deal with the
Palestinian state from macro level to micro level, consists of four major
levels, the business strategy level, competitive advantage level, supply
chain strategy level, and strategy translation level.
Level one is formulating a strategy and deciding what the objectives of the
business are, understanding where the business is now, externally and

140
internally, in terms of its resources and competencies, in this level the
company should set objectives for the business in terms of where it wants
to be, in order to continue towards the future. This level is top priority to
get start, and the company can not be successful in any aspect, with out
draw its future by set the strategy.
Level one stated what the company wants, but how to get there, the
research proposed Level two, to clear what should the company does to
attain competitive advantage, to achieve successful supply chain
management. The business strategy will help the company maintain an
advantage over its competitors. The company should work to attain
competitive advantage to achieve successful supply chain management.
Level three will set the strategies to maintain the competitive advantage,
and to make sure that the supply chain strategies aligned with the
competitive advantage, showing the interaction between the competitive
advantage and the supply chain strategy to achieve business goal. Level
three intends to structure the supply chain over the next several years, it
decides what the chains form will be, how resources will be attained, and
what processes each stage should execute.
Finally, level four explain the role of the physical infrastructure and supply
chain function process to implement the supply chain strategy whether
responsiveness or efficiency. In this stage, the company shall refine the
choice of supply chain processes and confirms how supply chain processes

141
align with infrastructure, reflecting this on the relation ship on the suppliers
and customers.
Figure 5.1: Conceptual framework This framework can be used by company’s executives and practitioners to
improve their capability to reduce costs, quick fulfillment, and customer
satisfaction. The framework can assist them in analyzing, designing, and
controlling their supply chain management. For educators and those
engaged in research, the framework identifies opportunities for greater
exploration and the discovery of additional foundations to develop the
comprehensive management system.
5.3.2 Business strategy:
The starting point of the framework is formulating a strategy, deciding
what the objectives of the business are, and developing an overall strategy
for how they should be achieved within the business environment. This

142
should be done by taking advantage of the company's resources and core
competencies, Strategy formulation then needs to follow a process that
includes, according Figure 5.2:
• Understanding where the business is now: externally - in terms of its
markets, customers, competitors and general business environment -
and internally, in terms of its resources and competencies (SWOT
Analysis).
• Setting objectives for the business in terms of where it wants to be -
in order to continue towards the future, the company should thrive
and grow according to its supply chain compass (Vision Statement
and Mission Statement).
• Developing strategies and tactics for the business as a whole - and
the different functions within it in order to achieve these objectives
(Planning Strategy).
A company’s business strategy is determined depending on answers to a
series of 'how' questions: How does management intend to grow the
business? How will a loyal clientele be built and compete rivals? How will
each function piece of the business operate, including research and
development, supply chain activities, production, sales and marketing,
distribution, finance and human resources? How will performance will be
boosted.

143
The idea of the business strategy is to make sure that the company
maintains organization in every aspect of the business and is prepared for
any and all situations whether they are positive or negative to the company.
It is also important to maintain the strategy so that the business is always
ready to compete with its competitors.
Figure 5.2: Business strategy formulation (business strategy fundamental 2008)
The starting with Preparing the business strategy will help the company
maintain an advantage over its competitors and become organized for any
unexpected situations and will maintain the supply chain directed.
5.3.3 Competitive advantage:
The business strategy will help the company maintain an advantage over its
competitors. The company should work to attain competitive advantage to
achieve successful supply chain management.

144
Competitive advantage occurs when an organization acquires or develops
an attribute or combination of attributes that allows it to outperform its
competitors. These attributes like natural resources, or skilled personnel
human resources, and information technology either to be product
produced by the company, or to assist making it.
The competitive advantage is formed from the attributes and resources,
which provide capabilities and abilities, make it superior to competitors in
the same area and industry (Porter, 1985). “A firm is said to have a
competitive advantage when it is implementing a value creating strategy
not simultaneously being implemented by any current or potential player”
(Barney, 1991). The successful implementation of the strategy will raise
the company's performance and excellence through the competitive
advantage to excel at cases, current competitors or even potential
competitors. (Passemard, 2000). To attain competitive advantage business
strategies of a firm use the various resources that it has control on it, and
these resources have the ability to create competitive advantage.
The aforementioned opinion, assured that the competitive advantage as the
ability to reserve outperforming on current or anticipated competition, thus
advanced performance reached through competitive advantage will ensure
market leadership. Also it provides the understanding that resources held
by a firm and the business strategy will have an impact on generating

145
competitive advantage., Figure 5.3 shows the competitive advantage
source.
Figure 5.3: A model of competitive advantage (Quickmba.com web site)
5.3.4 Ways of competing
The company should locate itself relative to its industry; determine whether
a company level is above or below the industry average. There are two
basic types of competitive advantage a company can possess according
(porter): low cost or differentiation. The two main types of competitive
advantage combined with segment intend the company to serve them, lead
to three strategies for achieving above average performance in an industry:
cost leadership, differentiation, and focus. The focus strategy has two
kinds, cost focus and differentiation focus.

146
Figure 5.4: Source of competitive advantage (Porter, 1985)
5.3.4.1 Cost Leadership
In cost leadership, the company decides to become the low cost producer in
its industry. The sources of cost advantage are varied and depend on the
structure of the industry. They may include the achieving of economies of
scale, advanced technology, access to raw materials and other factors. A
low cost producer must find and exploit all sources of cost advantage. The
company can achieve and sustain overall cost leadership, then it will be an
above average performer in its industry.
147
5.3.4.2 Differentiation
In a differentiation strategy the company tries to be distinguishing in its
industry along some dimensions that are valued by customers. It selects
one or more attributes that many customers in an industry find it important,
and positions it to meet those needs. It is rewarded for its differentiation
with a premium price.
5.3.4.3 Focus
The strategy of focus based on the choice of a narrow competitive scope
within an industry. The focuser selects a segment or group of segments in
the industry and generate its strategy to serving them to the exclusion of
others.
The focus strategy has two variants.
(a) In cost focus a firm seeks a cost advantage in its target
segment.
(b) Differentiation focus a firm seeks differentiation in its target
segment.
The competitive advantage is a key determinant of supply chain superior,
enhancing performance, and it will ensure survival and prominent placing
in the market. Superior performance being the ultimate desired goal of a
firm, competitive advantage becomes the foundation highlighting the
significant importance of development.

148
5.3.5 Supply chain design and strategy
At this stage the company had laid down company's competitive advantage
to allow a company to compete with its competitors. During the design
phase the companies should decide how to structure the supply chain over
the next several years, it decides what the chains form will be, how
resources will be attained, and what processes each stage should execute.
The company should take into consideration that all decisions during the
design stage will have long term effect and must support its strategic
objectives and increase supply chain surplus at the same time it should
strive to be agile.
The company should determine the supply chain infrastructure the plants,
distribution centers, transportation modes and lanes, production processes,
etc. that will be used to satisfy customer demands. These studies are
strategic in scope, use a time horizon of many months or years, and
typically assume little or uncertainty with the data.
The supply chain strategy in designing the aforementioned components can
be categorized to the responsiveness and the efficiency.
Responsiveness comes at a cost, where to fulfill all quantities demand; the
capacity should be increased, which cause to increase the costs. In the other
hand supply chain efficiency is the inverse of the cost of producing and
distributing a product to the customer. Increasing cost to implement
company function activities will lower efficiency. For every strategic

149
choice to increase responsiveness, there are additional costs that lower
efficiency.
5.3.5.1 Supply chain strategy Responsiveness versus efficiency decision
Deciding the strategy of the supply chain whether to be responsiveness or
efficiency will affect all design component of the supply chain design, the
supply chain strategy defines the processes within the company should do
well in additional to the role played by each supply chain entity is. To
explain the effect of these strategic decisions the company should define
the value chain of the product produced by the company and being
introduced o the customer.
The value chains for any product starting from product development,
which determines specifications for the product .Marketing and sales
generate demand by capturing the customer voice priorities that the
products and services will satisfy .Marketing also brings customer
feedback to new product development .Using new product specifications,
transformations process to convert the raw material inputs to output to
create the product .Distribution convey the product to the customer. These
are key processes or functions that must be performed for a successful
delivering. Finance, accounting, information technology, and human
resources backup and facilitate the functions of the value chain.

150
Value chain functions play a significant role in defining how the product
will be, therefore the company should develop strategy for each function
refers to what each process or function will try to do particularly well. This
strategy will be reflected on design decisions regarding inventory,
transportation, operating facilities, and information flows as will be shown
in the strategy translation section
The value chain highlight the close relationship between the functional
strategies within a company .Each function is crucial if a company is to
satisfy customer needs .Thus the various functional strategies cannot be
built in separate to other strategies .They are closely intertwined and must
fit support each other if a company is to succeed .
5.3.5.2 Aligning the competitive advantage and supply chain strategy
The Supply chain functions should be designed on light of the competitive
advantage that the company adapted, company adapting of differentiation
competitive advantage will lead it to have ability to provide a large variety
of products very quickly, assembly facilities are designed to be flexible and
easily handle the wide variety of configuration requested by customers. in
the other hand if the company adapted low cost as a competitive advantage,
therefore the distribution is targeting the lowest means of transportation
economies by grouping orders together or using inexpensive but slow
modes of transportation, carrying low levels of inventory, and selecting
suppliers based on their low price.

151
Where the company should define its competitive strategy based on how
the customer priorities product cost, delivery time, variety, and quality. A
company that focused on low cost and efficiency by producing large
volumes should adapt an efficient supply chain strategy in its entire supply
function component to achieve the strategic goals and provide low cost
product, while company that work to provide quality product in short lead
time should have responsive supply chain.
company’s success can be measured according the degree of achieved fit
between the supply chain strategy and competitive advantage, the concept
strategic fit invite the company to establish aligned goals between the
competitive and supply chain strategies. This fitting will match between
the customer priories that the competitive strategy intends to satisfy and the
supply chain capabilities that the supply chain strategy aims to build,
company successful also will not be achieved with out integration between
processes and function that are part of a company’s value chain, where all
function do not work in isolation manner. Company successful to perform
it duties linked to the following key issues:
• All functional strategies and the competitive strategy must fit
together to be a coordinated strategy in the overall company
disciplinary, which mean that each functional strategy must support
other functional strategies and help the company reach its
competitive strategy goal.

152
• All functions in the company must build their processes and
resources to be able to execute these strategies successfully.
• Supply chain architecture and the role of each stage must be aligned
to support the supply chain strategy.
5.3.5.3 Achieving Strategic fit between the competitive advantage and
the supply chain strategy
The company need to achieve an important strategic fit between the
supply chain and competitive strategic. A competitive strategy will
specify, implementing three basic steps to achieving this strategic fit:
1- identifying demand and supply uncertainty along the chain
A company must understand the customer needs for each targeted
segment and the uncertainty these needs impose on the supply chain,
these needs help the company define desired cost and service
requirements. The supply chain uncertainty helps the company identify
the level of the unpredictability of demand, disruption, and delay that
the supply chain must be prepared for.
In order the company to understand the customer, it must identify the
needs of the customer segment being served by capturing his voice,
customer demand from different segments ranges along several
attributes as follows:

153
• The quantity of the product needed in each lot: order in urgent
situation for material needed to repair a production line is likely
to be small. An order for material to construct a new production
line is likely to be large.
• The response time those customers are willing to tolerate: the
tolerate response time for the sensitive order will be short,
whereas the allowable response time for the construction order is
apt to be long.
• The variety of products needed: A customer may pay more for
all parts of an emergency repair order from a single supplier .this
may not be the case for the construction order.
• The service level Required: A customer placing an emergency
order expects a high level of product availability. This will not
happen in the case of the construction order for which a long
lead time is likely .
• The price of the products: The customer placing the immediate
and special order will be less sensitive to price than the customer
placing the ordinary order.
• The Desired Rate of Innovation in the Product: Customers at a
high margin expect a lot of innovation and new designs. Low
margin Customers may be less sensitive to new product
innovation.

154
By correlation the mentioned attributes above with customer segment to be
served, each customer segment will have similar needs .and customers in a
different segment can have very different needs. But the supply chain to be
able to do well toward the many attributes, our action is to identify one key
measure for combining all of these attributes. These attributes can be
combined by what calls demand uncertainty. It was appeared that raising
the customer service level and complexity of various customers needs,
these will increase the demand uncertainty.
Lee (2002) pointed out that, in additional to demand uncertainty, it is
important to consider uncertainty from the company to supply product to
the customer. When a new product is introduced, the production process
tends to be low and breakdowns are frequent. As a result, companies have
difficulty delivering according to a well defined schedule, resulting in high
supply uncertainty. Other factors may increase the supply uncertainty like
poor quality, limited supply capacity, inflexible supply capacity, and
evolving production process.
We can create a spectrum of uncertainty by combining the demand and
supply uncertainty. This uncertainty spectrum is shown in Figure 5.4

155
Figure 5.5: Uncertainty spectrum ( Chopra, et al, 2001)
The first step in course of achieving strategic fit between competitive and
supply chain strategies is to understand customers and supply chain
uncertainty. Uncertainty from the customer and the supply chain can be
combined and mapped on the uncertainty spectrum.
2-Understanding the supply chain capabilities:
The company should determine the type of supply chains and its
capabilities of the tasks that the supply chain designed to perform well. A
company must understand what its supply chain is designed to do well. The
company can understand its capabilities by identifying Supply chain
characteristics based on responsiveness and efficiency, responsiveness
includes a supply chains ability to do the following:
• Respond to wide ranges of quantities demanded.
• Meet short lead times.
• Handle a large variety of products.
• Build highly innovative products.

156
• Meet a high service levels.
• Handle supply uncertainty.
These abilities that the company interested with are similar to many of the
attributes of demand and supply that lead to high uncertainty, when the
company has more and more ability of the points mentioned above, more
responsive it is.
The company adaptation of responsive strategy will come back a higher
cost on the company, where readiness and providing wide range of
quantities are expensive, the relation between the supply chain strategy and
cost can be displayed in the figure 5.5.
Figure 5.6: The cost-responsiveness efficient frontier ( Chopra, et al, 2001)
The cost-responsiveness efficient relationship is showing the lowest
possible cost for a given level of responsiveness. Which mean how to
157
achieve responsiveness at low cost, where lowest cost for responsive is
defined based on existing technology and facilities that company cannot
working without it, not every company can operate on the efficient frontier.
The figure 5.5 is very useful for the company to decide how much it is
willing to invest for improving its performance, where by moving toward
the efficient frontier costs will be reduced, In contrast, a company on the
efficient frontier can improve its responsiveness only by increasing cost
and becoming less efficient. Such a firm must then make a trade-off
between efficiency and responsiveness.
Supply chain range from companies that focus on being responsive to those
that focus on producing and supplying at the lowest possible cost. If The
Company faces both supply and demand uncertainty; therefore, the supply
chain must be designed to deal effectively with both to provide customers
with a wide Variety products. In contrast an efficient supply chain lower
cost by eliminating some of its responsive capabilities and provide limited
variety of products in large package sizes. The supply chain is capable of
low costs and the focus of this supply chain is clearly on efficiency.
Achieving strategic fit between competitive and supply chain strategies is
to understand the supply chain and map it on the responsiveness spectrum.
Where the more capabilities constituting responsiveness a supply chains
has, the more responsive it is
3-Achieving strategic fit

158
After the company determined the level of uncertainty is facing and
understanding the supply chain capabilities in term of responsiveness. The
final step is to ensure that the degree of supply chain responsiveness is
consistent with the uncertainty. The company should target high
responsiveness for supply chain facing high uncertainty, and efficiency for
a supply chain facing low uncertainty.
The company that is relying on differentiation as competitive strategy
targeting customers who value having a large variety of products ,its
customers can be characterized as having high demand uncertainty. Then
the company is in front of many choices, it has the option of designing an
efficient or responsive supply chain. An efficient supply chain may carry
less inventory and maintain a level load on the warehouse to lower costs.
But this will cause difficulty supporting the customer’s desire for a wide
variety of products; the other option is carrying a high level of inventory
and picking capacity. Clearly, a responsive supply chain is better suited to
meet the needs of customers targeted by the company even if it results in
higher costs. The result is, when increasing uncertainty in term of demand
and supply; it is best served by increasing responsiveness from the supply
chain. This relationship is represented by the zone of strategic fit illustrated
in Figure 5.6

159
Figure 5.7: Zone of strategic fit ( Chopra, et al, 2001)
The first step to achieve the strategic fit is displayed in Figure 5.6,where it
shows that the company to assure high level of performance, companies
should move their competitive strategy and supply chain strategy toward
the zone of strategic fit. The projection of this moving can be translated by:
Whenever there was a tendency for distinguish in competitive advantage;
there will be an increase in the uncertainty, in the other hand moving
toward the strategy resulting responsiveness.
The second step in achieving strategic fit is to give roles to different stages
of the supply chain that ensure the appropriate level of responsiveness. It is
important to understand that the desired level of responsiveness required
across the supply chain can be attained by determining different levels of
responsiveness and efficiency for each stage of the supply chain. Which
mean that the company can achieve certain level of responsiveness by

160
modifying the roles of each stage of the supply chain. Making one stage
more responsive will allow the other stage to be efficient.
The third step to achieve complete strategic fit, the company must ensure
cross functional consistent strategies, as shown in figure 5.8 all functional
Strategies must support the goals of the competitive strategy, As well as all
sub strategies within the supply chain , like manufacturing, inventory, and
purchasing must also be consistent with the supply chain’s level of
responsiveness.
Figure 5.8: Cross functional consistent strategies ( Chopra, et al, 2001)
From submitted ideas above in order the company to fit the existence
mismatch between supply chain capabilities and the desired customer
needs, the company will need to restructure the supply chain to support the

161
competitive strategy or alter its competitive strategy, this lead us to
conclude:
• Right supply chain today, may not tomorrow.
• There is a supply chain strategy for a given competitive strategy.
5.3.6 Strategy translation:
In this stage, the company refines the choice of supply chain processes and
confirms how supply chain processes align with infrastructure (physical
locations and information technology). In this stage all functions along the
supply chain should be configured .This can be achieved by selecting the
relevant sub processes or process categories—based on company’s supply
chain strategy, The decisions at the strategic level of the supply chain
whether the company will rely responsiveness or efficient strategy, lay out
the frame of how the supply chain operates, and there are five major
activities take place within supply chain, these five major activities stated
by SCOR ,plan , source, make, deliver, and return as displayed in Figure
5.9.

162
Figure 5.9: SCOR model ( Supply Chain Council, 1996)
Before projecting the supply chain strategy on all functions of the supply
chain, the company should identify the scope of the module by defining the
dimension of the major five activities.
1. Demand/Supply Planning and Management
• Balance resources with requirements and establish/communicate
plans for the whole supply chain, including Return, and the
execution processes of Source, Make, and Deliver.
• Management of business rules, supply chain performance, data
collection, inventory, capital assets, transportation, planning
configuration, and regulatory requirements and compliance.
• Align the supply chain unit plan with the financial plan.
2. Sourcing Stocked, Make-to-Order, and Engineer-to-Order Product
• Schedule deliveries; receive, verify, and transfer product; and
authorize supplier payments.
163
• Identify and select supply sources when not predetermined, as for
engineer-to-order product.
• Manage business rules, assess supplier performance, and maintain
data.
• Manage inventory, capital assets, incoming product, supplier
network, import/export requirements, and supplier agreements.
Make-to-Stock, Make-to-Order, and Engineer-to-Order Production
Execution
• Schedule production activities, issue product, produce and test,
package, stage product, and release product to deliver.
• Finalize engineering for engineer-to-order product.
• Manage rules, performance, data, in-process products (WIP),
equipment and facilities, transportation, production network, and
regulatory compliance for production.
3. Order, Warehouse, Transportation, and Installation Management for
Stocked, Make-to-Order, and Engineer-to-Order Product
• All order management steps from processing customer inquiries and
quotes to routing shipments and selecting carriers.
• Warehouse management from receiving and picking product to load
and ship product.
• Receive and verify product at customer site and install, if necessary.
• Invoicing customer.

164
• Manage Deliver business rules, performance, information, finished
product inventories, capital assets, transportation, product life cycle,
and import/export requirements.
4. Return of Raw Materials and Receipt of Returns of Finished Goods
• All Return Defective Product steps from source – identify product
condition, disposition product, request product return authorization,
schedule product shipment, and return defective product – and
deliver – authorized product return, schedule return receipt, receive
product, and transfer defective product.
• All Return Maintenance, Repair, and Overhaul product steps from
source – identify product condition, disposition product, request
product return authorization, schedule product shipment, and return
MRO product – and deliver – authorize product return, schedule
return receipt, receive product, and transfer MRO product.
• All Return Excess Product steps from source – identify product
condition, disposition product, request product return authorization,
schedule product shipment, and return excess product – and deliver –
authorize product return, schedule return receipt, receive product,
and transfer excess product.
• Manage Return business rules, performance, data collection, return
inventory, capital assets, transportation, network configuration, and
regulatory requirements and compliance.
165
The five major activities will be translated in to functions processes and
physical layout to implement the supply chain activities, the translation
will comply the supply chain strategy whether responsiveness or
efficiency. Suppliers and customers are the start and the end edges of the
chain; therefore they will be affected by company’s decision to adapt
responsiveness or efficient strategy. Where company adaptation of
responsive strategy lead to manufacturing strategy establishing many
plants, many locations of the plants, and postponement manner in
production process, quality product, and lowest defect product. The
supplier will be selected according tight criteria based on quality,
reliability, flexibility, and trust. The distribution centers are spread to fulfill
needs rapidly by fast transportation modes to reduce the lead time as can as
possible. Customer satisfaction is the company’s goal, the responsive
strategy provides the customer with innovative product, varity, quality,
quantity, and customize product. Table 5.2 shows comparison between
efficient and responsiveness supply chain, these considerations should be
taken in to account during translation the supply chain strategy to sub
strategies.

166
Table 5.1: Comparison of efficient and responsiveness supply chains ( Chopra, et al, 2001)
Efficient supply chains Responsiveness supply chains
Primary goal supply demand at lowest cost
Response quickly to demand
Product design strategy
Maximize performance minimum product cost
Create modularity to allow postponement of product differentiation
Pricing strategy Lower margins because price is a prime customer driver
High margins because price is not a prime customer driver
Manufacturing strategy
Lower costs through high utilization
Maintain capacity flexibility to buffer against demand/supply uncertainty
Inventory strategy Minimize inventory to lower cost
Maintain buffer inventory to deal with demand/supply uncertainty
Lead time strategy Reduce, but not at the expense of costs
Reduce aggressively even if the costs are significant
Supplier strategy Select based on cost and quality
Select based on speed, flexibility, reliability, and quality
5.3.7 Framework Summary
The generic supply chain management framework is a visual framework.
It aims to guide the company to structure a successful supply chain, and
does not assume any particular solution. The framework consists of four
major levels:
1. The business strategy level. This level involves formulating a
strategy and deciding what the objectives of the business are.

167
2. The competitive advantage level. This level provides clarity as to
how the company should work to attain a competitive advantage in
order to achieve successful supply chain management.
3. The supply chain strategy level. This reveals the importance of the
supply chain strategy and how competitive advantage should be
aligned with it.
4. The strategy translation level. This level explains the role of the
physical infrastructure and supply chain function process, to
implement the supply chain strategy's responsiveness or efficiency
Each phase within the framework represents the necessary decision making
activities that should be occurring at that point in the design process. There
are also some key concept to be gained from studying supply chain
management framework. The integration of the framework across the
different functions and the inclusion of the high-level strategy formulation
body, show that supply chain management extends beyond logistic concept
and includes all functions of the corporation. The presence of the strategy
formulation body emphasizes that the key company functions are part of
this design process and the supply chain management should have a
strategy that supports the competitive advantage of the company. The
formulation of this strategy will have a considerable impact on the product,
service and customer satisfaction.

168
5.3.8 Propose Supply Chain Methodology
The generic supply chain methodology is presented below in points. The
display process not only offers a checklist to ensure all pertinent steps have
been followed, but it also helps in understanding the how to describe,
measure, and evaluate the supply chain activity. The following steps also
provide a quick way of understanding the framework itself. Since the
purpose of the process is to provide a way to think about each of the steps
involved, The process below is most useful in starting new project with
systematic process and for on going project to be enhanced and developed .
1. Business strategy formulation
• Identifying corporate stakeholders.
• Defining corporate stakeholder‘s needs.
• Developing corporate vision statement.
• Developing corporate mission statement.
• Identifying the corporate goals (long term objectives).
• Define the business objective and summarize business
background
• Identification of Products, Markets and Competitive Priorities.
• Identifying business unit internal strengths and weaknesses.
• Identifying business unit external forces (environmental or
industrial factors).
• Defining the future growth areas in the industry.

169
• Identifying business units core competencies.
2. Competitive advantage:
• Implementing a value creating strategy.
• Identifying Appropriate Value Chain Performance Metrics
• Manipulating the various resources over which the company has
direct control
• Defining capability.
• Locating relative to the related industry
• Assembling Appropriate Benchmark Comparisons
• Assessing and Prioritize Competitive Requirements
• Defining customer desire and needs.
• Possessing competitive advantage, low cost or differentiation or
combined with segment seek the company to serve.
• Defining product and competitive strategy.
3. Developing supply chain strategy
• Determining responsive or efficient strategy
• Establishing the sup strategies according the relied supply chain
strategy
Supplying strategy
Out sourcing strategy
Manufacturing strategy
Inventory strategy

170
Distribution strategy
Delivery strategy
4. Strategic fit between the competitive advantage and the supply
chain strategy
• Understanding the customer and supply chain uncertainty
• understanding the supply chain capabilities
• achieving strategic fit
5. Supply chain strategy translation
Supply Base Design strategy
• Determining supplier selection for all parts within commodity
groups
• Allocating suppliers to plants
Outsourcing strategy
• Determining the portions of the supply chain remain in-house versus
outsourced
• Determining the cost tradeoffs versus service considerations
Manufacturing Strategy
• Determining number of plants are needed
• Locating where should each plant be located
• Determining products should each plant make
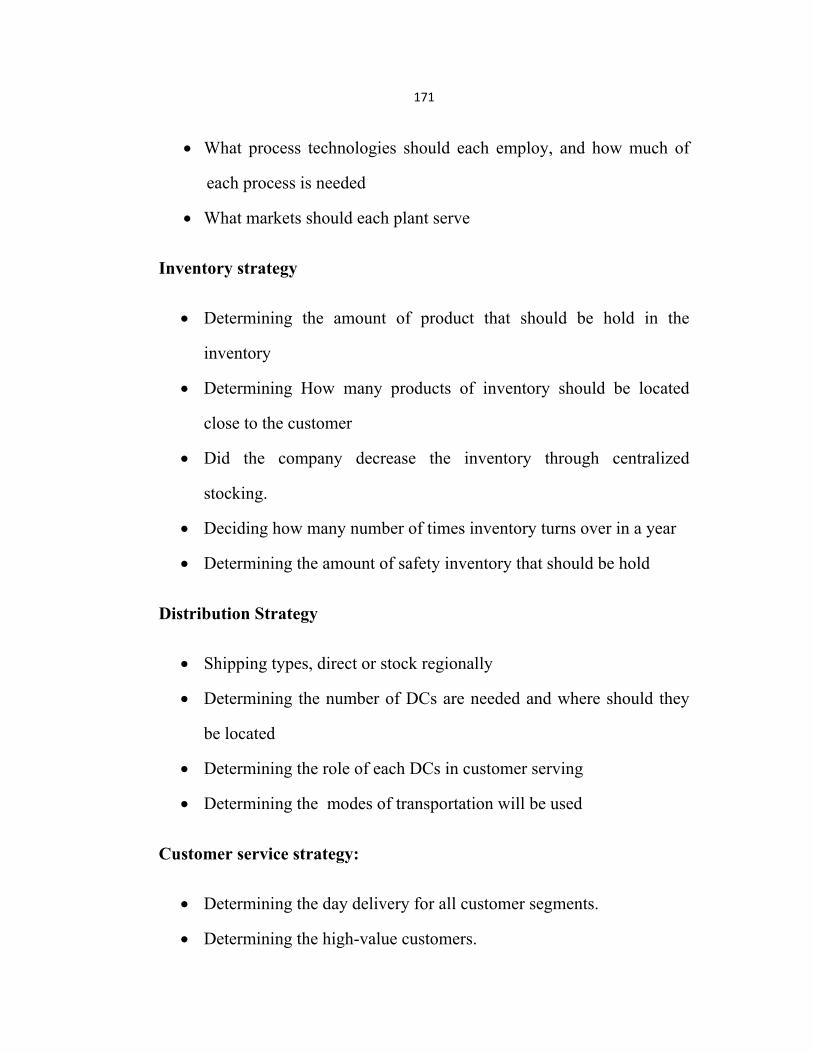
171
• What process technologies should each employ, and how much of
each process is needed
• What markets should each plant serve
Inventory strategy
• Determining the amount of product that should be hold in the
inventory
• Determining How many products of inventory should be located
close to the customer
• Did the company decrease the inventory through centralized
stocking.
• Deciding how many number of times inventory turns over in a year
• Determining the amount of safety inventory that should be hold
Distribution Strategy
• Shipping types, direct or stock regionally
• Determining the number of DCs are needed and where should they
be located
• Determining the role of each DCs in customer serving
• Determining the modes of transportation will be used
Customer service strategy:
• Determining the day delivery for all customer segments.
• Determining the high-value customers.

172
• Determining different service levels depending on customer
importance.
• Issuing tradeoff between the best cost and the best service to the
customer segment.
• Should all products be equally available, or should some customers
have quicker, easier access.
173
Chapter 6
6 Conclusions and Recommendations
6.1 Thesis conclusions summary
The generic framework of the supply chain management for Palestinian
companies was introduced as a result of this thesis research. The thesis was
started by introducing research objectives which can be summarized by
studying the Palestinian company’s practices of the supply chain. Based on
the gaps which were identified in the literature review and the survey
results, a conceptual SC framework was developed to address these gaps.
Quantitative researching approach has been used, data was collected using
an electronic survey, 75 companies have been surveyed and the responses
were 40. Additional data have been collected by other ways such as
interviews, local related researches, and personal observations. As a result
Palestinian company's application of the supply chain concept suffers from
some weaknesses such as: the lack of structuring supply chain strategy,
poor integration between strategic domain and strategy translation, relying
clear competitive advantage and miss fitting between supply chain strategy
and competitive strategy. Furthermore Palestine special conditions as an
occupied country extremely affecting its business environment by adding
more constrains and difficulties which have been taken into account among
framework formulation activities.

174
The proposed framework consists of four major levels, the business
strategy level, competitive advantage level, supply chain strategy level, and
strategy translation level. Level one is formulating a strategy and deciding
what the objectives of the business are, to maintain company an advantage
over its competitors, level two clears what should the company work to
attain competitive advantage to achieve successful supply chain
management. Supply chain strategy aims to achieve business goal by
use/implement the competitive advantage, level three show these
interactions. Finally level four explain the role of the physical
infrastructure and supply chain function process to implement the supply
chain strategy whether responsiveness or efficiency.
Each phase within the framework represents the time horizon of the
necessary decision making activities, the decisions that should be taken at
the strategic design process, planning, and operation stage, which ranged
between long and short time horizon. There are also some key concepts to
be gained from studying supply chain management framework, the
integration of the framework across the different functions and the
inclusion of the high-level strategy formulation body, show that supply
chain management extends beyond logistic concept and includes all
functions of the corporation. The presence of the strategy formulation
emphasizes that the key company functions are part of this design process
and the supply chain management should have a strategy that supports the
competitive advantage of the company. The formulation of this strategy

175
will have a considerable impact on the product, service and customer
satisfaction.
6.2 Contribution to knowledge and practice
This research makes several contributions to the topic. In summary, the
contribution can be summarized
• investigating the role of supply chain management in providing
competitive advantage for companies
• Clarifying the current situation of research environment in Palestine.
• Assessing current practices and understandings of Palestinian
companies’ in relation to the supply chain management concept.
• Conducting a comparative study between Palestinian and the state of
the art practices of SCM.
• Developing a generic framework for the Palestinian industry
companies taking in to account the state condition.
6.3 Recommendations
The research introduces the following recommendations that can be
implemented in course of company's development. The recommendations
can be summarized as the following:
1. More emphasis on strategic design phase prior engaging in planning
and operation.

176
2. Companies should rely upon their competitive advantage with
reference to their on-hand capabilities, resources, and customer
desire.
3. More attention should be paid when the company chooses the supply
chain management strategy whether responsiveness or efficiency.
4. More focus on the strategic fit between the supply chain strategy and
the competitive advantage which seem to be unavailable in the
current practice in Palestine.
5. More attention should be given to align the objectives between
extended supply chain functions.
6. companies still tend to consider supply chain management as being
the same as logistic or as supplier management, companies should
review the structure of its relationship on light of its strategy
7. More focus should be given to supply chain choosing and planning
because of the research environment special conditions.
6.4 Future works
• The framework should be approved and validated by implementing
it in a real and actual case in research environment – Palestine.
• The developed framework in this thesis can be of use to researchers
for further studies of supply chain management practices and their
relationships with other organizational processes and outcomes like
competitive advantage, supply chain performance, and organization
performance

177
• There are some sub topics under the research title which need in-
depth study due to their importance and to overcome its weaknesses
that have appeared during this research. That sub topics are agile
supply chain, technology affect on the supply chain and supply chain
performance metrics.
• The topic supply chain management is a new topic in the Palestinian
environment, more studies and research shall be exerted in this
regard.

178
References
Armstrong Michael Hand book of management techniques [Book]. -
London : Britsh Library Cataloguing in publication data, 1986.
Barney jay Firm Resources and Sustained Competitive Advantage
[Journal]. - [s.l.] : Journal of Management, 1991. - 1 : Vol. 17.
(CSCMP). Council of Supply Chain Management Professionals
Fundamentals of Supply Chain Management [Report]. - Lombard, Illinois :
[s.n.], 2007.
Census establishment Population,Housing and Establishment
Census2007, Economic Establishment [Report]. - Rammallah- Palestine :
[s.n.], 2008.
Cohen, et al Strategic Supply Chain Management:the Five Disciplines for
Top Performance [Book]. - New York : McGraw-Hill, 2005.
Cooper, et al Business Research Methods [Book]. - London : McGraw-
Hill, 2005.
Creswell J Research Design: Qualitative,quantitative and Mixed method
Approaches [Book]. - calefornia : sage Publications, 2003.
Dane F Research Methods [Report]. - Cambridge : Thomas Brooks, 1990.

179
E.Porter Michael Competitive Advantage:Creating and sustaining
Superior Performance [Book]. - New York : Simon andSchuster Inc, 1985.
Ellen Gifford Customer relationship management principles. - [s.l.] :
Businessballs, 2009.
Frazelle Edward Supply Chain Strategy: The Logistics of Supply Chain
Management [Book]. - New York : MCGraw-Hill, 2001.
Ghauri, et al Research Methods in Business Studies [Book]. - London :
Prentice-Hall, 2005.
Govil, et al Supply Chain Design and Management Strategic and Tactical
Perspectives [Book]. - San Diego, California : Academic Press, 2002.
Hair J.J Multivariate Data Analysis with Readings [Book]. - New York :
Macmillan Publishing Company, 1992.
Handfield Rebert Supply Chain Redesign:Converting Your Supply Chain
into an Integrated Value stream [Book]. - New York : Financial Prentice
Hall, 2002.
Jackson P Desk Research [Report]. - London : Kegan-Paul, 1994.
Krajewski, et al Operations Management Strategy and Analysis [Book]. -
[s.l.] : Prentice Hall. - Vol. 6.

180
Lambert Douglas M et al An Evaluation of Process-oriented Supply
Chain [Book]. - [s.l.] : The International Journal of Business Logistic,
2005. - Vol. 26.
Lambert, et al Supply Chain Management : More Than a New Name for
Logistic [Journal]. - [s.l.] : the International Journal of Logistic
Mnagement, 1997. - Vol. 8.
Long Douglas International Logistic :Global Supply chain Management
[Book]. - Norwell : Kluwer Acadimic Publisher, 2003.
Marcoulides G.A Modern Methods for business Research [Book]. - New
York : Lawrence Erlbaum associates, 1998.
Mary J, et al Global supply chain design: A literature review and critique
[Article] // Transportation research Part. - North Carolina : Elsevier, 2005.
Mason, et al Lean, Agile or Leagile?Matching Your Supply Chain to the
Marketplace [Report]. - [s.l.] : International Journal of Production
Research, 2000.
Mentzer John Defining Supply Chain Management [Journal]. - [s.l.] :
Journal of bussiness Logistic, 2001. - 2 : Vol. 22.
Miles, et al qualitative Data Analysis: asource Book of New Methods
[Book]. - London : sage Publications, 1994.

181
Passemard D Competitive advantage in Global Industries [Journal]. -
[s.l.] : Management Research News, 2000. - 7 : Vol. 23.
Patton M Qualitative Evaluation and Research Methods [Book]. -
London : Sage Publications, 1990.
Punch K Developing Effective Research oroposals [Book]. - London :
sage Publications, 2000.
Robson Colin Real World Research: A Resource for Social Scientists and
Practitioner-Researchers [Book]. - Malden : Blackwell Publishers, 2002.
Rommel, et al Simplicity Wins:How Germanys Mid-Sized Industrial
Companies Succeed [Book]. - Boston : Harvard Business School Press,
1995.
Saundres M.e. research Methods for Business Students [Book]. - London :
Prentice-Hall, 2000.
Sekaran U research Methods for Business- Askill Building Approach
[Book]. - NewYork : John Wiley, 2003.
Suhong Li, et al Development and Validation of a management instrument
for studying supply chain management practices [Article] // Journal of
Operation Management. - Toledo : Elseier, 2005.

182
Suhong Li, et al Development and Validation of a Measurement
Instrument for Studying Supply Chain Management Practices [Journal]. -
[s.l.] : Journal of Operation Management, 2005. - Vol. 1.
Sunil Chopra, et al Supply Chain Management strategy,planning,and
operation [Book]. - New Jersey : Prentice Hall, 2001. - Vol. Fourth
Edition.
Supply Chain Council www.supply- chain .org [Report]. - 1996.
Terry, et al. The practice of Supply Chain Management: Where Theory
and Application Converge [Book]. - New York : Springer
Science&Business Media, Inc. (hardcover), 2004.
Ulusoy Gunduz An assessment of supply chain and innovation
management practices in the manufacturing industries in Turkey
[Article] // international Journal of production Economics. - Istanbul :
Elsevier, 2003.
Yin Robert K. Case Study Research: Design and Methods, Applied Social
Research Methods Series [Book]. - London : sage Publications, 1989.

183
Appendices
Appendix 1
The collected data had been treated using column charts as it is appear
below:

184

185

186

187

188

189
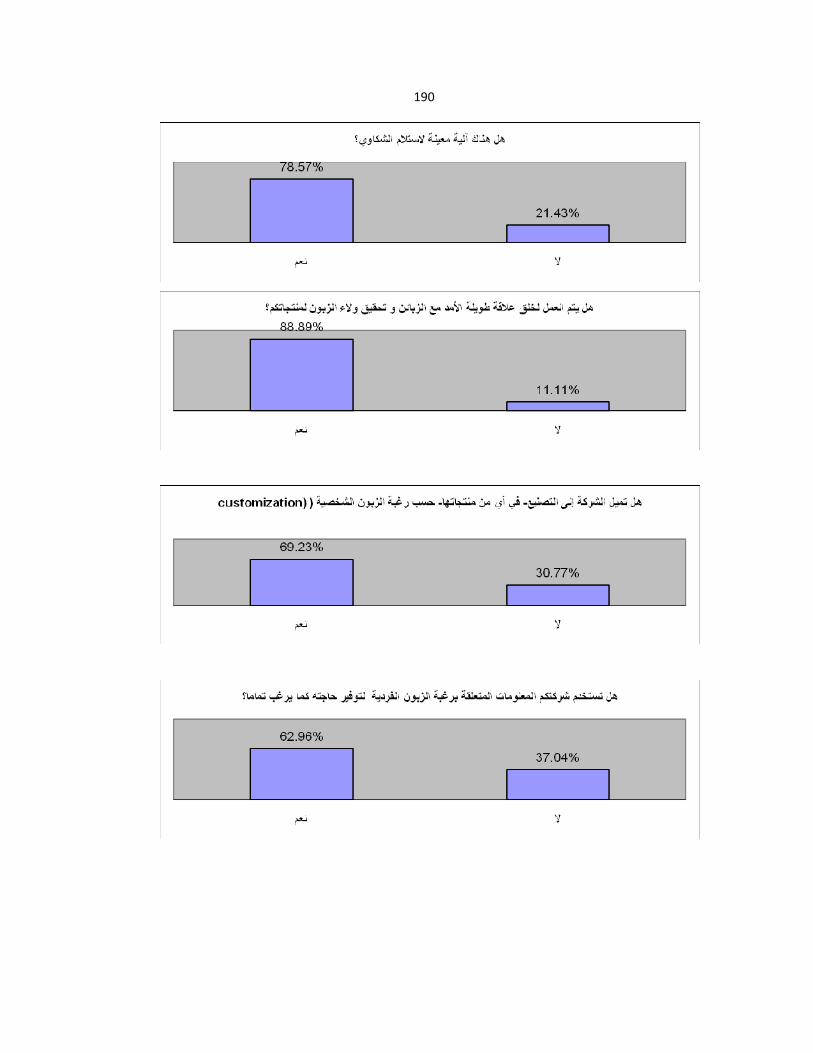
190

191

192

جامعة النجاح الوطنية
كلية الدراسات العليا
تقييم ادارة سلاسل الامداد لدى الشركات في فلسطين
إعداد
احمد بسام عبداالله
اشراف
حسام عرمان. د
بكلية الدراسات الادارة الهندسيةاستكمالاً لمتطلبات درجة الماجستير في قدمت هذه الأطروحة
.العليا في جامعة النجاح الوطنية في نابلس، فلسطين
2011

ب
تقييم ادارة سلاسل الامداد لدى الشركات في فلسطين
إعداد
بسام عبداهللاحمد
إشراف
حسام عرمان. د
ملخصال
لقى ما يعرض عليه قد ولت ، فهو ألان يختار ما يريد وما إن العهود التي كان فيها الزبون يت
يناسبه وفي الوقت الذي يريد حتى أن الأمر تعدى ذلك ليصبح الزبون يحدد السعر الذي
فمع تقدم الاتصالات والشبكات العالمية أصبح العالم أشبه بالقرية الصغيرة مما أثر . يناسبه
فالمنافسة . تتأثر بشكل مباشر بالزبون ورغباته على التجارة العالمية وعلى المنافسة التي
تعدت الحدود الإقليمية لتكن عالمية، والمنافسة العالمية تتطلب إعادة التفكير بالإستراتيجيات
المتبعة وإدارة الأمور والمشاريع بطريقة مختلفة غير تقليدية، وأحد أهم هذه الأدوات في وقتنا
.ل فعالالحاضر هي إدارة سلاسل الإمداد بشك
والغرض من هذا البحث هو وضع إطار عام للشركات الفلسطينية، يمكن أن تكون قابلة
للتطبيق في إطار البيئة البحثية والظروف الخاصة لفلسطين، وذلك من أجل خلق تناغم فيما
بين الميزة التنافسية التي تتمتع بها الشركة وإستراتيجية سلاسل المداد التي تسعى الشركة
وقد تبين أن إدارة سلاسل الإمداد لدى الشركات الفلسطينية تعاني من العديد من . التبنيه
المشاكل والصعوبات من منظور سلسلة التوريد، حيث تم جمع المعلومات التي تتعلق
بالشركات عبر استبانه أرسلت بالبريد الألكتوني لتمثل منهجية البحث الكمي والنوعي، فقد
نه لستة قطاعات من شركات الصناعات التحويلية في فلسطين ، أرسل خمسة وسبعون استبا
ناعة الأدوية، وهي صناعة البلاستيك ، صناعة الحجر والرخام، الصناعات الغذائية، وص
وصناعة الكيماويات، والصناعات الهندسية والمعدنية، وقد تم تلقي أربعون استبيانه مكتملة أي
وكشفت نتائج الدراسة أن هناك مستوى . لتمثل مادة البحث والدراسة) ٪ 53.3(ما نسبه
وهي عال من الضعف في المواضيع الأربعة الأساسية التي شكلت محاور الدراسة الرئيسية،

ج
مفهوم وإدارة سلاسل التوريد وأثرها على نجاح الشركة، و الميزة التنافسية واستراتيجيات
.سلسلة التوريد ، والعلاقات مع الموردين ، والعلاقات مع الزبون
وبناءا على المعطيات التي خلص إليها البحث تم اقتراح إطار عام لإدارة سلاسل الإمداد لدى
إن الإطار . هدف إلى توجيه الشركات لهيكلة سلاسل إمداد ناجحةالشركات الفلسطينية، ي
المقترح يتكون من أربع مستويات رئيسية، المستوى العام للشركة وما يتضمنه من علاقات
وقرارات مصيرية تتعلق بمبررات وجود الشركة وأهدافها ورؤيتها للمستقبل وكيف يمكن
عيش فيه، والمستوى الثاني يتطرق للميزة المحافظة على ميزة تنافسية في الوسط الذي ت
التنافسية التي ينبغي للشركة اعتمادها والعمل على تطويرها وضمان ديمومتها، والمستوى
الثالث يتعلق بإستراتيجية سلاسل الإمداد التي يجب تبنيها لتدعم وتحقق الميزة التنافسية
راتجية المتبعة لإدارة سلاسل الإمداد، وتكشف التفاعل الهام فيما بين الميزة التنافسية والإست
وأخيرا المستوى الرابع والذي يسعى لترجمة الاستراتيجيات إلى عمليات تتسق وتتناغم مع
.الهدف العام للشركة ورؤيتها
إن الإطار العام لإدارة سلاسل الإمداد يقدم عملية تساعد على فهم ووصف وقياس وتقييم
ي توفير بيئة نظامية للتأسيس لمشروعات جديدة وتحسين نشاطات سلسلة التوريد، ويساهم ف
.وتطوير المشاريع الجارية والقائمة
Related Documents