Evaluating the spectral distinction between sibilant fricatives through a speaker-centered approach Katarina L. Haley a , Elizabeth Seelinger a,c , Kerry Callahan Mandulak a,d , and David J. Zajac b a Department of Allied Health Sciences, Division of Speech and Hearing Sciences, University of North Carolina at Chapel Hill, 3124 Bondurant Hall, CB #7190, Chapel Hill, North Carolina 27599-7190, USA b School of Dentistry, University of North Carolina at Chapel Hill, CB #7450, Chapel Hill, North Carolina, 27599-7450, USA c Currently at the Speech-Language Pathology Department, St. Joseph’s Hospital, 5665 Peachtree Dunwoody Road, Atlanta, Georgia, 30342 USA d Currently at the Department of Speech and Hearing Sciences, Portland State University, 724 SW Harrison, 85-A Neuberger Hall, Portland, Oregon, 27207-0751 Abstract This study was designed to examine the feasibility of using the spectral mean and/or spectral skewness to distinguish between alveolar and palato-alveolar fricatives produced by individual adult speakers of English. Five male and five female speaker participants produced 100 CVC words with an initial consonant /s/ or /ʃ/. The spectral mean and skewness were derived every 10 milliseconds throughout the fricative segments and plotted for all productions. Distinctions were examined for each speaker through visual inspection of these time history plots and statistical comparisons were completed for analysis windows centered 50 ms after the onset of the fricative segment. The results showed significant differences between the alveolar and palato-alveolar fricatives for both the mean and skewness values. However, there was considerable inter-speaker overlap, limiting the utility of the measures to evaluate the adequacy of the phonetic distinction. When the focus shifted to individual speakers rather than average group performance, only the spectral mean distinguished consistently between the two phonetic categories. The robustness of the distinction suggests that intra-speaker overlap in spectral mean between prevocalic /s/ and /ʃ/ targets may be indicative of abnormal fricative production and a useful measure for clinical applications. Keywords spectral moment analysis; fricative consonants; speech acoustics © 2010 Elsevier Ltd. All rights reserved. Address Editorial Correspondence to: Katarina L. Haley, Ph.D., Division of Speech and Hearing Sciences, University of North Carolina at Chapel Hill, 3124 Bondurant Hall, CB #7190, Chapel Hill, NC 27599-7190, USA, [email protected]. Telephone: 919-966-9460, FAX: 919-966-0100. Publisher's Disclaimer: This is a PDF file of an unedited manuscript that has been accepted for publication. As a service to our customers we are providing this early version of the manuscript. The manuscript will undergo copyediting, typesetting, and review of the resulting proof before it is published in its final citable form. Please note that during the production process errors may be discovered which could affect the content, and all legal disclaimers that apply to the journal pertain. NIH Public Access Author Manuscript J Phon. Author manuscript; available in PMC 2011 October 1. Published in final edited form as: J Phon. 2010 October 1; 38(4): 548–554. doi:10.1016/j.wocn.2010.07.006. NIH-PA Author Manuscript NIH-PA Author Manuscript NIH-PA Author Manuscript

Welcome message from author
This document is posted to help you gain knowledge. Please leave a comment to let me know what you think about it! Share it to your friends and learn new things together.
Transcript
Evaluating the spectral distinction between sibilant fricativesthrough a speaker-centered approach
Katarina L. Haleya, Elizabeth Seelingera,c, Kerry Callahan Mandulaka,d, and David J.ZajacbaDepartment of Allied Health Sciences, Division of Speech and Hearing Sciences, University ofNorth Carolina at Chapel Hill, 3124 Bondurant Hall, CB #7190, Chapel Hill, North Carolina27599-7190, USAbSchool of Dentistry, University of North Carolina at Chapel Hill, CB #7450, Chapel Hill, NorthCarolina, 27599-7450, USAcCurrently at the Speech-Language Pathology Department, St. Joseph’s Hospital, 5665Peachtree Dunwoody Road, Atlanta, Georgia, 30342 USAdCurrently at the Department of Speech and Hearing Sciences, Portland State University, 724SW Harrison, 85-A Neuberger Hall, Portland, Oregon, 27207-0751
AbstractThis study was designed to examine the feasibility of using the spectral mean and/or spectralskewness to distinguish between alveolar and palato-alveolar fricatives produced by individualadult speakers of English. Five male and five female speaker participants produced 100 CVCwords with an initial consonant /s/ or /ʃ/. The spectral mean and skewness were derived every 10milliseconds throughout the fricative segments and plotted for all productions. Distinctions wereexamined for each speaker through visual inspection of these time history plots and statisticalcomparisons were completed for analysis windows centered 50 ms after the onset of the fricativesegment. The results showed significant differences between the alveolar and palato-alveolarfricatives for both the mean and skewness values. However, there was considerable inter-speakeroverlap, limiting the utility of the measures to evaluate the adequacy of the phonetic distinction.When the focus shifted to individual speakers rather than average group performance, only thespectral mean distinguished consistently between the two phonetic categories. The robustness ofthe distinction suggests that intra-speaker overlap in spectral mean between prevocalic /s/ and /ʃ/targets may be indicative of abnormal fricative production and a useful measure for clinicalapplications.
Keywordsspectral moment analysis; fricative consonants; speech acoustics
© 2010 Elsevier Ltd. All rights reserved.Address Editorial Correspondence to: Katarina L. Haley, Ph.D., Division of Speech and Hearing Sciences, University of NorthCarolina at Chapel Hill, 3124 Bondurant Hall, CB #7190, Chapel Hill, NC 27599-7190, USA, [email protected]: 919-966-9460, FAX: 919-966-0100.Publisher's Disclaimer: This is a PDF file of an unedited manuscript that has been accepted for publication. As a service to ourcustomers we are providing this early version of the manuscript. The manuscript will undergo copyediting, typesetting, and review ofthe resulting proof before it is published in its final citable form. Please note that during the production process errors may bediscovered which could affect the content, and all legal disclaimers that apply to the journal pertain.
NIH Public AccessAuthor ManuscriptJ Phon. Author manuscript; available in PMC 2011 October 1.
Published in final edited form as:J Phon. 2010 October 1; 38(4): 548–554. doi:10.1016/j.wocn.2010.07.006.
NIH
-PA Author Manuscript
NIH
-PA Author Manuscript
NIH
-PA Author Manuscript
1. IntroductionSpeech disorders related to abnormal phonological organization, motor planning andexecution, and dental and palatal morphology are often associated with errors in the place ofarticulation for sibilant fricative production. The study and management of these disordersare contingent upon accurate detection and documentation of the nature and magnitude ofproduction deviation. However, because production errors often do not conform neatly toexisting phonemic boundaries in a given language, quantification of distortions via auditoryperception is not always valid or reliable. By augmenting perceptual judgments withacoustic measures that correspond with normal and impaired production variations, moreobjective documentation may be possible.
The sibilant fricative consonants /s/ and /ʃ/ are produced with high-intensity and spectrallydistinct aperiodic energy that is sensitive to the shape, placement, and movement of oralstructures. Spectral analyses invariably show relative prominence in higher frequencyregions for /s/ than for /ʃ/ due to the smaller resonating cavity in front of the constriction, themore precise direction of the air-stream toward the incisors, and the narrower central tonguegroove constriction (Stevens, 1988).
Despite the well known relationship between spectral distribution and place of articulationfor sibiliant fricatives, no single acoustic measure has been found to distinguish consistentlybetween /s/ and /ʃ/ in a speaker-invariant manner. Spectral moments are among thecandidate measures that have gained most empirical support in group studies and they areattractive candidates for clinical applications because they can be derived conveniently andobjectively. Moment analysis involves application of statistical moment algorithms to FastFourier Transforms (FFT) derived from the fricative segment. The spectrum is treated as arandom probability distribution and the central tendency, dispersion, asymmetry, and shapeof this distribution are derived (Forrest, Weismer, Milenkovic, & Dougall, 1988). The firstfour spectral moments; mean, variance, skewness, and kurtosis have all been considered inefforts to discriminate among fricative consonants, but none has been shown to distinguishplace of articulation in a speaker-invariant manner. Whereas statistically significant groupdifferences have been demonstrated between /s/ and /ʃ/ for both spectral mean and spectralskewness (Fox & Nissen, 2005; Jongman, Wayland, & Wong, 2000; Nissen & Fox, 2005;Nittrouer, 1995), examination of individual utterances show substantial inter-speakeroverlap such that acoustic measures for some speakers’ /s/ productions are indistinguishablefrom other speakers’ /ʃ/ productions (Jongman et al., 2000; Nissen & Fox, 2005). Toachieve more complete characterization of the spectrum, two or more spectral moments havebeen combined in some studies and have yielded satisfactory distinction between the sibilantfricatives, particularly when both the spectral mean and the spectral skewness have beenincluded (Forrest et al., 1988; Fox & Nissen, 2005; Jongman et al., 2000).
Although such synthesis of spectral measures may reduce inter-speaker variability andprovide a more complete representation of the spectrum, it may not be necessary oradvantageous for the study of disordered speech. When applying acoustic measures toclinical appraisal of individual speakers, it is more critical to consider the range of normalperformance than the average population performance, and to recognize invariant patternsthat signal normal speech production within a language community over distinctions thatmay be discernable in groups of speakers. For example, if acoustic measures can beidentified that show consistent intra-speaker target discrimination, then the observation ofinconsistent phonetic distinction for that measure would signal abnormal speech production,regardless of how absolute or relative acoustic values may compare to population means.
Haley et al. Page 2
J Phon. Author manuscript; available in PMC 2011 October 1.
NIH
-PA Author Manuscript
NIH
-PA Author Manuscript
NIH
-PA Author Manuscript
Indeed, qualitative analyses of individual speaker performance have shown differences inthe consistency and/or magnitude of the phonetic distinction between /s/ and /ʃ/ for typicalspeakers and for speakers with impaired motor control for speech. Tjaden and Turner (1997)examined seven individuals with amyotrophic lateral sclerosis (ALS) and seven healthycontrols, matched for age and gender. Word initial fricatives were extracted from a passageread by each participant and spectral moments were derived from the first 40 ms of thefricative segment in 16 words. For each speaker, measures were averaged across utterancestargeting the same fricative. All healthy control speakers showed distinct and non-overlapping spectral mean distributions for /s/ and /ʃ/ and the three female speakers alsoshowed non-overlapping distributions for skewness. In contrast, the spectral mean for someALS speakers did not distinguish at all between the two fricative targets. When performancewas averaged across speakers in each group, the magnitude of the /s/ - /ʃ/ spectral meandifference was smaller for speakers with ALS than for the healthy controls. Due to thelimited number of utterances that were examined and because information about intra-speaker consistency was not provided, it is not possible to determine the extent to whichindividual control speakers showed distinct and non-overlapping spectral momentdistributions and/or whether individual ALS speakers did not distinguish consistentlybetween the fricative targets.
In an investigation of fricative production in stroke survivors with aphasia and apraxia ofspeech (AOS; Haley, Ohde, & Wertz, 2000), a qualitative analysis approach of multipletarget repetitions was selected to replicate methodology in earlier studies of inter-articulatorcoordination. Twenty aphasic speakers with and without AOS and ten healthy older adultsproduced 48 words with an initial sibilant fricative /s/ or /ʃ/ followed by a high front vowel /i/ or /I/. Spectral means were derived at the midpoint of the fricative segment and theconsistency of the distinction was examined for each speaker. Although the absolute valuesand magnitude of distinction varied across speakers, intra-speaker distribution overlap wasnot found for any of the typical speakers. In contrast, there was considerable intra-speakeroverlap between /s/ and /ʃ/ for the aphasic and apraxic speakers.
In a follow-up study, using the same speech recordings, the spectral mean time historieswere derived throughout the fricative segments to allow qualitative examination of dynamicspectral change (Haley, 2002). For many typical speakers, there was a gradual increase inthe spectral mean distinction between /s/ and /ʃ/ from the onset to the midpoint of thesegment, with spectral overlap at the onset but not at the midpoint. Similar dynamic changeshave been reported in other spectral investigations of sibilant fricatives (Flipsen, Shriberg,Weismer, Karlsson, & McSweeny, 1999; Jongman et al., 2000; Munson, 2004) andchallenge previous views that spectral content is stable throughout the fricative segment(Behrens & Blumstein, 1988; Hughes & Halle, 1956).
The purpose of this study was to examine the feasibility of the two spectral moments thathave shown the strongest empirical support in group studies, the spectral mean and thespectral skewness, for distinguishing between /s/ and /ʃ/ in typical adult speakers of English.To this end, the robustness of the intra-speaker consistency previously observed in controlspeakers (Haley, 2002; Haley et al., 2000) was explored by using a different speaker group,a larger and more variable speech sample, and a more comprehensive moment analysis.
2. Methodology2.1 Speakers
Five males and five females ranging in age from 23 to 54 years (mean = 34, SD = 12.3)participated. They were native speakers of American English, passed an audiometricscreening at 25 dB HL for the octave frequencies between 500 and 8000 Hz, and reported no
Haley et al. Page 3
J Phon. Author manuscript; available in PMC 2011 October 1.
NIH
-PA Author Manuscript
NIH
-PA Author Manuscript
NIH
-PA Author Manuscript
history of speech or hearing problems and no active involvement in orthodontic treatment.Through interview, each speaker reported the region and state from which he/she identifiedhis or her own dialect. Five speakers were from the Southeast, three were from the Midwest,and one was from New York. One speaker grew up in Florida, but characterized his dialectas “general.”
2.2 Procedures2.2.1. Speech sample—Audio recordings were made in a sound-treated IAC booth,using a digital tape recorder (TASCAM DA-30 MKII) and a head-mounted microphone(AKG C410) with a constant microphone-to-mouth distance. Carrier phrases with targetwords were printed on white index cards (5” × 8”). An experimenter held each card in frontof the speaker. The speaker was instructed to read the phrases printed on the cards withnormal voice and loudness. This elicitation method was chosen to maximize accurateperception of the production target and encourage a consistent rate of production. The twovoiceless sibilant fricatives /s/ and /ʃ/ were produced in five vowel contexts /i æ ɔ u ∧/within the words seat/sheet, sack/shack, saw/shaw, sue/shoe, sun/shun and the carrier phrase“I can say-again.” Each target word was repeated 10 times, so there was a total of 100utterances per speaker (2 fricatives × 5 vowels × 10 repetitions). The order of presentationwas randomized with the only exception that an exact repetition of an utterance was notallowed on two consecutive productions. All speakers produced the words in the samerandom order.
The productions were digitized at a sampling rate of 22 kHz and a 12 bit quantization, andlow-pass filtered at 10 kHz. Of the 1,000 total utterances, seven utterances were notanalyzed. These utterances were excluded because the speaker started pronouncing thewrong fricative and immediately self-corrected, so that both the palato-alveolar and alveolarfricatives were included in the production (e.g. /sʃæk/ or /ʃsæk/).
2.2.2. Acoustic analysis—The CSpeech software (Milenkovic, 1996) was used toanalyze the fricative segments acoustically. Each utterance was examined initially with awaveform analysis and a wide-band (300 Hz), full-scale spectrogram. Segmentation pointswere determined based on visual inspection of both displays.
The onset and offset of voiceless fricative segments were determined visually based oncontinuous aperiodic energy in the wide-band spectrographic analysis as well as onset andoffset of periodicity in the surrounding vowel segments. When both aperiodic and periodicenergy occurred, the fricative segment boundaries were set so that any region of periodicitywas avoided. The duration of the fricative segment was defined as the difference inmilliseconds between the second and the first segmentation point.
The initial spectral moment analysis window was centered 10 ms into the fricative onset andsubsequent windows were positioned at 10 ms intervals throughout the segment, with thelast window centered 10 ms prior to fricative offset. The window size was 20 ms, so therewas 50% overlap between adjacent analysis windows. Spectral moments were derived forthe marked segment in each of the 993 utterances by executing the spectral momentcommand in CSpeech according to the procedures described by Forrest and colleagues(Forrest et al., 1988).
2.2.3. Reliability—Inter-observer agreement was estimated through re-analysis of fricativesegmentation and the spectral mean at the fifth analysis window (50 ms into the fricative). Asecond rater independently measured segment duration and derived the spectral mean for20% of the productions. A pseudo-random approach was used to select these utterances byensuring equal distribution across speakers and fricative targets. Segmentation reliability
Haley et al. Page 4
J Phon. Author manuscript; available in PMC 2011 October 1.
NIH
-PA Author Manuscript
NIH
-PA Author Manuscript
NIH
-PA Author Manuscript
was evaluated based on fricative segment duration. The Pearson product moment correlationbetween the two observers was .97 and the mean absolute inter-observer difference was 7.9ms. For the spectral mean measures, the Pearson product moment correlation was .99 andthe mean absolute inter-observer difference was .08 kHz. Because the skewness was basedon identical segmentation and derived through the same CSpeech command, reliabilityestimation is not reported separately for this measure.
3. Results3.1 Spectral mean analyses
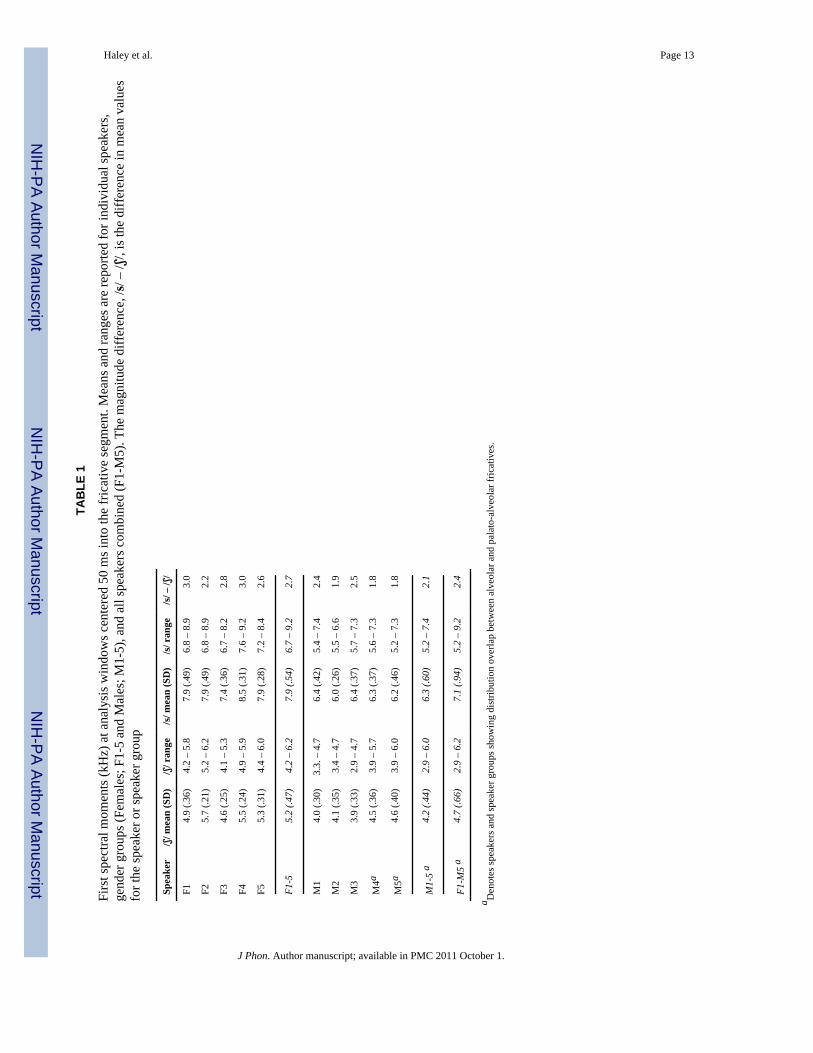
Both quantitative and qualitative comparisons were used to determine whether the spectralmean analyses distinguished between the two fricative targets. The analysis was first limitedto a single 20-ms window centered 50 ms after fricative onset (Table 1). This windowposition was selected based on indications in previous work that adult speakers achieve aclear distinction at this point (Haley, 2002;Haley et al., 2000).
For the quantitative comparisons, we elected to use hierarchical linear modeling (HLM).The data had a hierarchical structure with repeated productions nested within word and wordnested within speaker. Word was not nested within fricative target, but rather wascompletely collinear because the two fricatives each had a unique set of words associatedwith them. The structure of these data leads to a violation of the independence assumption ingeneral linear models such as regression and ANOVA. To manage this violation, the datawere analyzed using HLM. The approach is particularly powerful for analyzing longitudinaland clustered data. In situations such as this, the dependence between observations ismodeled through the inclusion of random effects (Bryk & Raudenbusch, 1992; Burchinal &Appelbaum, 1991). These models are 3-level HLMs with repeated productions at level one,target word at level two and speaker at level three. We included random intercepts at levelstwo and three. Fixed effects were included for target word and repeated productions, withword treated as a categorical variable and repeated productions as a continuous variable.
There was significant variance in the intercepts at both level two (z = 6.11, p < .001) and atlevel three (z = 2.00, p = .02) for the spectral mean values, indicating significant betweensubject variability in scores at each of those levels. Of greater interest is that there was asignificant fixed effect for word, F (9, 81) = 47.92, p < .001, although the effect of repeatedproductions was nonsignificant. To test the differences between the two fricatives, wecontrasted /ʃ/ with /s/. The difference was statistically significant (t = 20.73, p < .001),supporting the observation that the spectral mean, averaged across speakers, was lower forthe palato-alveolar place of articulation (4.7 kHz) than for the alveolar place of articulation(7.1 kHz).
As expected, segments produced by female speakers had higher spectral means thansegments produced by male speakers. Exemplifying a classic lack of acoustic invariance,there was considerable distribution overlap between palato-alveolar fricatives produced byfemale speakers (4.2 – 6.2 kHz) and alveolar fricatives produced by male speakers (5.2 – 7.4kHz).
In contrast, there was no or minimal overlap within individual speakers and even withineach gender for the spectral mean analyses. The spectral means for the five female speakerswere consistently lower than 6.3 kHz for /ʃ/ and consistently higher than 6.6 kHz for /s/.Similarly, among the male speakers, the spectral mean was consistently lower than 4.8 kHzfor /ʃ/ and consistently higher than 5.1 kHz for /s/. The only occurrences of distributionoverlap were for speakers M4 and M5 and it affected only three utterances where thereappeared to have been intermittent external noise.
Haley et al. Page 5
J Phon. Author manuscript; available in PMC 2011 October 1.
NIH
-PA Author Manuscript
NIH
-PA Author Manuscript
NIH
-PA Author Manuscript
Consistent with previous investigations that have presented individual speaker data (e.g.Haley et al., 2000; Newman, Clouse, & Burnham, 2001; Perkell, Matthies, Tiede, Lane,Zandipour, Marrone et al., 2004; Tjaden & Turner, 1997), the magnitude of the /s/ - /ʃ/difference varied across our ten typical speakers, even within gender. The reason for thisvariability is unknown, but may be linked to a host of factors, including dialectal,anatomical, or auditory-perceptual inter-speaker differences (Flipsen et al., 1999; Perkell etal., 2004; Stuart-Smith, 2007). Increased attention to such variations is necessary not only toestablish norms for the clinical evaluation of disordered speech, but also for thedevelopment of plausible models of normal speech production.
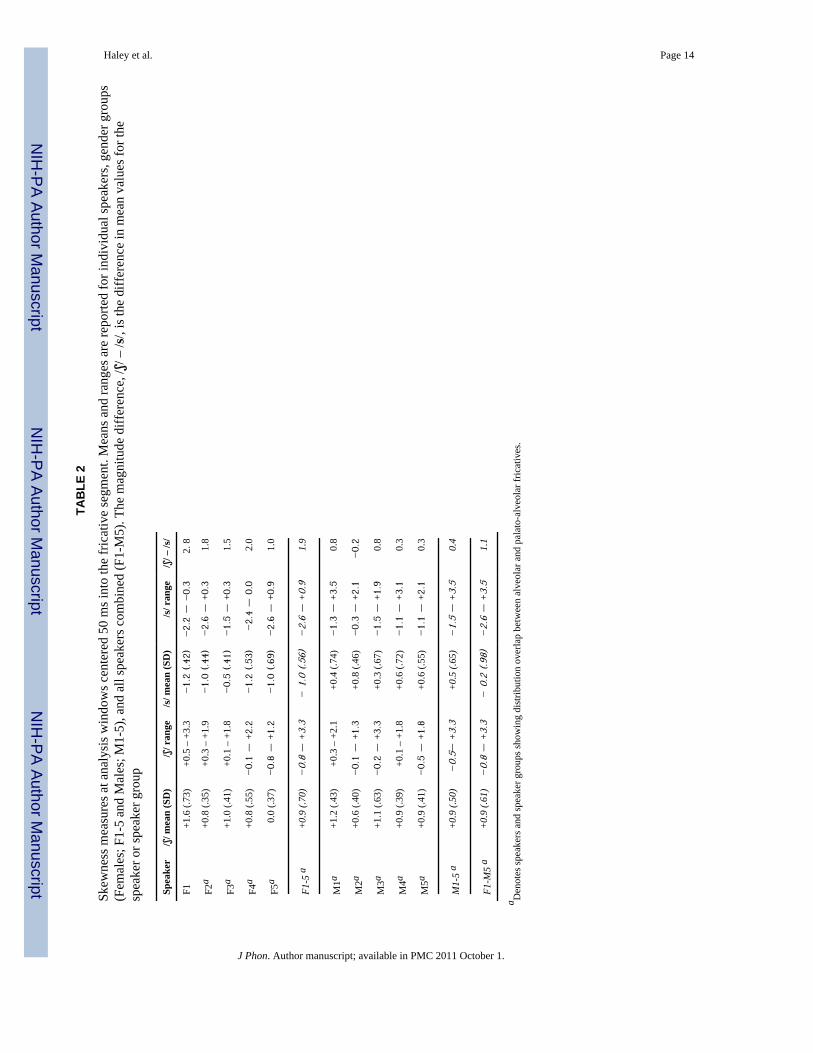
3.2 Skewness analysesThe results of the single window skewness analyses are presented in Table 2. Theseskewness measures include both positive values (concentration of energy in the lowerfrequencies with energy tailing off toward higher frequencies), negative values(concentration of energy in the higher frequencies with energy tailing off toward lowerfrequencies), and zero values (symmetric distribution of higher and lower frequencies). Forthe group of ten speakers as a whole, /ʃ/ was associated with positive skew and /s/ wasassociated with negative skew.
Similar to the quantitative analysis of the spectral mean results, we used hierarchical linearmodeling to examine the results statistically. Once again, both of the random intercepts weresignificant (level two: z = 5.80, p < .001, level three: z = 1.84, p = .03). Also similar to thespectral mean, there was no significant effect for repeated productions, but word wassignificant, F (9, 81) = 10.82, p < .001; and when we contrasted /ʃ/ with /s/, this differencewas also significant, t = 9.74, p < .001. Thus, there was strong statistical support for theconclusion that the group as a whole distinguished between the two fricative targets.
Like for the spectral mean, there were gender differences. Specifically, the mean skew wasnegative for all female speakers’ /s/ productions (−1.2 to −0.5) and moderately positive forall male speakers’ /s/ productions (0.3 to 0.8). Given the concentration of spectral meanvalues for the female speakers’ alveolar productions near the 10 kHz low-pass filter cutoff,the greater negative skew is expected and has been reported in other studies (Flipsen et al.,1999; Fox & Nissen, 2005; Jongman et al., 2000; Newman et al., 2001; Tjaden & Turner,1997).
Unlike the results for the spectral mean, the average difference in skewness between /ʃ/ and /s/ did not correspond to non-overlapping distributions at the level of the individual speakers.As shown in Table 2, there was considerable intra-speaker overlap in spectral skewnessbetween the alveolar and palato-alveolar places of articulation. Only speaker F1 produced aconsistent distinction between the two fricatives. The overlap was particularly extensive forthe male speakers, with more or less completely overlapping distributions for four and onlya slightly bimodal distribution for the fifth speaker, M3. Statistical support for thisqualitative dissimilarity between the two moment analyses can be gleaned from acomparison of effect sizes for the /ʃ/ - /s/ difference. By standard criteria, the effect sizes forboth the spectral mean (Cohen’s d = 2.96) and the spectral skewness (Cohen’s d = 1.35)were extremely large, but it was notably larger for spectral mean than for spectral skewness.
3.3 Time history plotsAlthough measures derived within a single analysis window were informative relative to thecategorical distinction for individual speakers, a more complete picture emerged whenspectral moment time histories were examined from the beginning to the end of the fricativesegment. By overlaying plots of repeated /s/ and /ʃ/ productions from the same speaker, it
Haley et al. Page 6
J Phon. Author manuscript; available in PMC 2011 October 1.
NIH
-PA Author Manuscript
NIH
-PA Author Manuscript
NIH
-PA Author Manuscript
was possible to estimate qualitatively the degree of distribution overlap, the magnitude ofthe distinction, and the production consistency for all 100 utterances throughout the entire120-200 ms fricative segment. Figure 1 shows these time history plots for the spectral mean.Note the lack of overlap for individual speakers, despite considerable inter-speakervariations in absolute values, magnitude of distinction between the two fricative targets, andconsistency across repeated utterances (compare, for example, speakers F2 and F4). Aspredicted, there was a gradual change for many speakers from the first analysis window overthe next several tens of milliseconds, and this change typically resulted in an increasedmagnitude of the distinction.
Consistent with the data displayed in Table 2, time-history plots for the spectral skewnessshowed substantial spectral overlap, with only two speakers (F1 and F2) distinguishingconsistently between the targets and with four of the male speakers showing a unimodaldistribution.
4. Discussion4.1. Intra-speaker invariance
The purpose of this investigation was to determine whether the spectral mean and/or thespectral skewness distinguish consistently between voiceless alveolar and palato-alveolarfricative consonants in individual adult speakers. Comparisons for analyses completed 50ms after syllable onset and visual inspection of time history plots throughout the fricativesegment yielded the same conclusion. From the perspective of individual speakers andconsidering each of the 993 utterances examined, the spectral mean distinguishedconsistently between the two fricative targets, but the spectral skewness did not.
The consistency with which non-overlapping spectral mean distributions were observedacross all ten speakers and in preliminary work with older participants (Haley, 2002; Haleyet al., 2000) indicates that the absence of this pattern in adult speakers of English may be aclinically useful measure of disordered speech, as was seen in our previous work withapraxic and aphasic speakers (Haley et al., 2002). Mandulak recently conducted a similarinvestigation of fricative production in typically developing 7-year-old and 11-year-oldchildren (Mandulak, 2009; Mandulak, Haley, Zajac, & Ohde, 2009), and found acomparable pattern of minimally or non-overlapping spectral mean distributions for /s/ and /ʃ/ in individual children. In the same work, the clinical utility of evaluating spectral meanoverlap was further supported by the observation that four of five children with cleft lip andpalate showed substantially overlapping spectral mean distributions that differed markedlyfrom those of the typically developing children (Mandulak, 2009). Continued work isnecessary to determine whether these preliminary observations are supported in larger andmore varied samples of adult and child speakers with and without impaired fricativeproduction. In this work, careful attention should be given to the relationship between themoment analysis and listeners’ auditory perceptual evaluation of the fricative quality to helpdetermine for what kind of distortions such an evaluation approach would be mostinformative. In our previous investigation of adults with aphasia and AOS, we found that theoverall proportion of utterances perceived as the target fricative by phonetically trainedlisteners corresponded well with the proportion of spectral mean time history plots inpredicted frequency regions (Haley 2002; Haley et al., 2000). Similarly, Mandulak (2009)noted a qualitative relationship between the spectral mean distributions and the perceivedproduction accuracy for the children with cleft lip and palate, but did not explore thisrelationship quantitatively. Continued investigation of the link between fricative spectra andauditory perceptual judgments for individual utterances is necessary to validate thesepreliminary impressions.
Haley et al. Page 7
J Phon. Author manuscript; available in PMC 2011 October 1.
NIH
-PA Author Manuscript
NIH
-PA Author Manuscript
NIH
-PA Author Manuscript
The proposed speaker-centered analyses require attention to stability across repeatedproductions of a given phonetic contrast and availability of data for individual speakers,neither of which is typically present in published reports of speech production. Oneexception is work published by Newman and colleagues, in which data on intra-speakervariability were examined qualitatively and in comparison to perceptual effects for the sameutterances (Newman et al., 2001). Twenty typical speakers produced 28 repetitions of thesibilant fricatives /s/ and /ʃ/ in several vowel contexts. The average spectral mean wascomputed across the initial 110 ms of the fricative segment, and data pertinent to thecategorical distinction were provided for four of the speakers. For three, the spectral meanfor /s/ and /ʃ/ was clearly and consistently distinguished, but for one speaker there wascategorical overlap. At first glance, these results appear inconsistent with the consistentintra-speaker categorical distinction in the present investigation. However, given thedynamic change at segment onset that has been observed in many speakers (Flipsen et al.,1999; Haley, 2002; Iskarous, Shadle, & Proctor, 2009; Jongman et al., 2000; Munson,2004), it is possible that the integration of values across the 110 ms time window may haveexaggerated, or even artificially generated, spectral overlap in comparison to time historyplots allowing for dynamic variations. The possibility that the speaker with overlappingspectral mean distributions may have only gradually achieved a distinction between /s/ and /ʃ/ is partially supported by a perceptual experiment using the same productions, whichindicated that listener response time during perceptual identification was 20-70 ms slowerfor the speaker with overlapping /s/ and /ʃ/ distributions than for a speaker withoutdistribution overlap (Newman et al., 2001). If the acoustic distinction was ambiguousseveral tens of milliseconds into the fricative segment, clear perceptual distinction maysimilarly have been delayed, resulting in a slower response time (measured from the onset ofthe fricative segment).
It is important to recognize that the spectral mean and skewness were derived from the sameFourier spectrum and, therefore, inter-dependent. For the skewness, the lowest and mostnegative values were observed in female speakers’ /s/ productions, which also had thehighest spectral means. There was a strong negative correlation (r=−.98; p<.001) betweenthe spectral mean and the spectral skewness for /s/, and a nonsignificant correlation betweenthe spectral mean and the spectral skewness for /ʃ/ (r=.−30; p>.05). Again, the observationof greater negative skewness in alveolar spectra generated from female than from maleproductions is likely related to the frequency limitations imposed by the 10 kHz low-passfilter (Newman et al., 2001; Tjaden & Turner, 1997). Without this artificial cutoff in spectralcontent for the female speakers’ alveolar productions, even the limited skewness distinctionbetween /s/ and /ʃ/ may not have been present. Future work should employ a highersampling rate to examine this possibility and to obtain more precise values for the normalrange of absolute spectral moment values in a large sample of typical adult speakers.Fricative consonant spectra are complex, and any single acoustic measure is by necessity asimplification with varying utility from application to application (e.g., Li, Edwards, &Beckman, 2008).
4.2 Dynamic changes within the fricative segmentVisual inspection of time history plots for the spectral mean analyses showed substantialdynamic change for some speakers, particularly for the alveolar fricative. For most speakers,there was a gradual change from segment midpoint to offset, most likely reflecting right-to-left co-articulation with the following vowel. More importantly, alveolar fricatives oftendisplayed gradually rising or arching time history plots, with energy concentration in higherfrequency regions at the middle of the segment than at the onset, so the categoricaldistinction between /s/ and /ʃ/ was maximized several tens of milliseconds into the fricative
Haley et al. Page 8
J Phon. Author manuscript; available in PMC 2011 October 1.
NIH
-PA Author Manuscript
NIH
-PA Author Manuscript
NIH
-PA Author Manuscript
segment. Such dynamic changes may have substantial impact on the evaluation of thedistinction and should be considered in future research.
X-ray microbeam studies of jaw movement and tongue position during the production ofword-initial /s/ provide evidence for individual strategies in achieving adequate constriction(Shadle, Iskarous, & Proctor, 2004). Logically, this observation should translate to inter-speaker differences in absolute spectral means and in the magnitude of the /s/ - /ʃ/distinction. Moreover, there is evidence of jaw elevation from the onset to approximately themiddle of the fricative segment (Iskarous et al., 2009). This pattern parallels the dynamicincrease in spectral mean during the same period and may provide at least a partialexplanation for it. The regulation of airflow through the vocal tract is also likely tocontribute to the dynamic acoustic changes at frication onset. The process of changing soundsource from the vocal folds for the vowel to the oral cavity for the fricative consonantrequires rapid adjustments that may be implemented slightly differently from one speaker tothe next. Some individuals may be slower or may require more salient sensory feedback toestablish the amount of pressure required for correct sibilant fricative production. Moreover,the gradual increase in airflow and acoustic amplitude that characterize fricative production(Behrens & Blumstein, 1988) may affect higher frequencies more than lower frequencies(Shadle, 1990), and contribute to the observation of greater dynamic changes for the alveolarthan for the palato-alveolar fricative segments.
Visual inspection of dynamic time history plots of repeated productions by individualspeakers is not only useful for identifying movement patterns and points of maximumdistinction in typical speakers, but can also help test and develop hypotheses aboutdisordered speech production (Liss & Weismer, 1992). Although the non-disorderedspeakers in this investigation displayed different patterns and magnitude of spectral change,the dynamic changes were consistently within a limited production range. In contrast, large,variable, and unusual spectral change trajectories have been associated with impairedfricative production (Haley, 2002; Mandulak, 2009; Mandulak et al., 2009).
4.3. ConclusionsA speaker-centered analysis showed invariance across individuals for the distinctionbetween /s/ and /ʃ/ in spectral mean, but not spectral skewness. These results differed fromgroup comparisons of the same data, indicating that analysis of individual speech patterns iscritical in both theoretically and clinically motivated research. Inspection of time historyplots across repeated productions appears to be one promising speaker-centered analysisapproach, due to its sensitivity to dynamic change and its representation of both distinctionconsistency and magnitude.
AcknowledgmentsWe would like to thank Dr. John Sideris at the FPG Child Development Institute for his help with the statisticalanalyses and two anonymous reviewers for their thoughtful input on an earlier version of this paper.
ReferencesBehrens SJ, Blumstein SE. Acoustic characteristics of English voiceless fricatives: a descriptive
analysis. Journal of Phonetics 1988;16:295–298.Bryk, AS.; Raudenbush, SW. Hierarchical Linear Models for Social and Behavioural Research:
Applications and Data Analysis Methods. Sage Publications; Newbury Park, CA: 1992.Burchinal MR, Appelbaum M. Estimating individual developmental functions: Methods and their
assumptions. Child Development 1991;62:23–43.
Haley et al. Page 9
J Phon. Author manuscript; available in PMC 2011 October 1.
NIH
-PA Author Manuscript
NIH
-PA Author Manuscript
NIH
-PA Author Manuscript
Flipsen P, Shriberg L, Weismer G, Karlsson H, McSweeny J. Acoustic characteristics of /s/ inadolescents. Journal of Speech, Language, and Hearing Research 1999;42:663–677.
Forrest K, Weismer G, Milenkovic P, Dougall RN. Statistical analysis of word-initial voicelessobstruents: preliminary data. Journal of the Acoustical Society of America 1988;84:115–123.[PubMed: 3411039]
Fox RA, Nissen SL. Sex-related acoustic changes in voiceless English fricatives. Journal of Speech,Language, and Hearing Research 2005;48:753–765.
Haley KL. Temporal and spectral properties of voiceless fricatives in aphasia and apraxia of speech.Aphasiology 2002;16:595–607.
Haley KL, Ohde RN, Wertz RT. Precision of fricative production in aphasia and apraxia of speech: aperceptual and acoustic study. Aphasiology 2000;14:619–634.
Hughes GW, Halle M. Spectral properties of fricative consonants. Journal of the Acoustical Society ofAmerica 1956;28:303–310.
Iskarous, K.; Shadle, CH.; Proctor, M. Evidence for the Dynamic Nature of Fricative Production:American English /s/; Paper presented at the 8th International Seminar on Speech Production;2009; Strabourg, France:
Jongman A, Wayland R, Wong S. Acoustic characteristics of English fricatives. Journal of theAcoustical Society of America 2000;108:1252–1263. [PubMed: 11008825]
Li F, Edwards J, Beckman ME. Contrast and covert contrast: The phonetic development of voicelesssibilant fricatives in English and Japanese toddlers. Journal of Phonetics 2008;37:111–124.[PubMed: 19672472]
Liss J, Weismer G. Qualitative acoustic analysis in the study of motor speech disorders. Journal of theAcoustical Society of America 1992;92:2984–2987. [PubMed: 1479132]
Mandulak, KC. Unpublished doctoral dissertation. University of North Carolina at Chapel Hill; 2009.Production and perception of the voiceless sibilant fricatives in typically developing children withapplications for children with cleft palate.
Mandulak, KC.; Haley, KL.; Zajac, D.; Ohde, RN. Distinction in production of voiceless sibilantfricatives in child speakers; Paper presented at the Annual Convention of the American SpeechLanguage Hearing Association; New Orleans. 2009;
Milenkovic, PM. CSpeech (Computer Program). University of Wisconsin-Madison, Department ofElectrical Engineering; Madison, WI: 1996.
Munson B. Variability in /s/ production in children and adults: Evidence from dynamic measures ofspectral mean. Journal of Speech, Language, and Hearing Research 2004;47:58–69.
Newman RS, Clouse SA, Burnham JL. The perceptual consequences of within-talker variability infricative production. Journal of the Acoustical Society of America 2001;109:1181–1196.[PubMed: 11303932]
Nissen SL, Fox RA. Acoustic and spectral characteristics of young children’s fricative productions: adevelopmental perspective. Journal of the Acoustical Society of America 2005;118:2570–2578.[PubMed: 16266177]
Nittrouer S. Children learn separate aspects of speech production at different rates: evidence fromspectral moments. Journal of the Acoustical Society of America 1995;97:520–530. [PubMed:7860830]
Perkell JS, Matthies ML, Tiede M, Lane H, Zandipour M, Marrone N, Stockman E, Guenther F. Thedistinctness of speakers’ /s/ -/ʃ/ contrast is related to their auditory discrimination and use of anarticulatory saturation effect. Journal of Speech Language and Hearing Research 2004;47:1259–1269.
Shadle, CH. Articulatory-acoustic relationships in fricative consonants. In: Hardcastle, WJ.; Marchal,A., editors. Speech Production and Speech Modeling. Kluwer; The Netherlands: 1990. p. 187-209.
Shadle CH, Iskarous K, Proctor M. Articulation of fricatives: evidence from X-ray microbeam data.Journal of the Acoustical Society of America 2004;119:3301.
Stevens, KN. Acoustic Phonetics. MIT Press; Cambridge, MA: 1988.Stuart-Smith, J. Empirical evidence for gendered speech production: /s/ in Glaswegian. In: Cole, J.;
Hualde, JI., editors. Laboratory Phonology. Vol. 9. Mouton de Gruyter; Berlin: 2007. p. 65-86.
Haley et al. Page 10
J Phon. Author manuscript; available in PMC 2011 October 1.
NIH
-PA Author Manuscript
NIH
-PA Author Manuscript
NIH
-PA Author Manuscript
Tjaden K, Turner GS. Spectral properties of fricatives in amyotrophic lateral sclerosis. Journal ofSpeech, Language, and Hearing Research 1997;40:1358–1371.
Haley et al. Page 11
J Phon. Author manuscript; available in PMC 2011 October 1.
NIH
-PA Author Manuscript
NIH
-PA Author Manuscript
NIH
-PA Author Manuscript
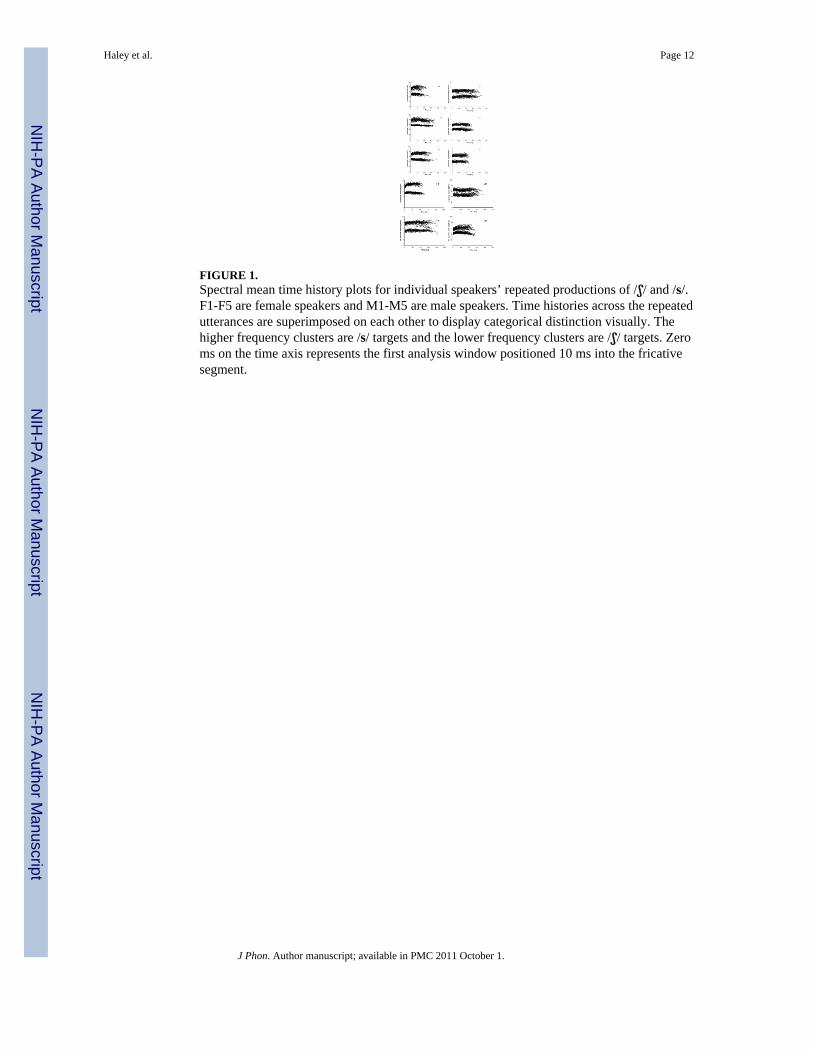
FIGURE 1.Spectral mean time history plots for individual speakers’ repeated productions of /ʃ/ and /s/.F1-F5 are female speakers and M1-M5 are male speakers. Time histories across the repeatedutterances are superimposed on each other to display categorical distinction visually. Thehigher frequency clusters are /s/ targets and the lower frequency clusters are /ʃ/ targets. Zeroms on the time axis represents the first analysis window positioned 10 ms into the fricativesegment.
Haley et al. Page 12
J Phon. Author manuscript; available in PMC 2011 October 1.
NIH
-PA Author Manuscript
NIH
-PA Author Manuscript
NIH
-PA Author Manuscript
NIH
-PA Author Manuscript
NIH
-PA Author Manuscript
NIH
-PA Author Manuscript
Haley et al. Page 13
TAB
LE 1
Firs
t spe
ctra
l mom
ents
(kH
z) a
t ana
lysi
s win
dow
s cen
tere
d 50
ms i
nto
the
fric
ativ
e se
gmen
t. M
eans
and
rang
es a
re re
porte
d fo
r ind
ivid
ual s
peak
ers,
gend
er g
roup
s (Fe
mal
es; F
1-5
and
Mal
es; M
1-5)
, and
all
spea
kers
com
bine
d (F
1-M
5). T
he m
agni
tude
diff
eren
ce, /
s/ –
/ʃ/,
is th
e di
ffer
ence
in m
ean
valu
esfo
r the
spea
ker o
r spe
aker
gro
up
Spea
ker
/ʃ/ m
ean
(SD
)/ʃ
/ ran
ge/s
/ mea
n (S
D)
/s/ r
ange
/s/ –
/ʃ/
F14.
9 (.3
6)4.
2 –
5.8
7.9
(.49)
6.8
– 8.
93.
0
F25.
7 (.2
1)5.
2 –
6.2
7.9
(.49)
6.8
– 8.
92.
2
F34.
6 (.2
5)4.
1 –
5.3
7.4
(.36)
6.7
– 8.
22.
8
F45.
5 (.2
4)4.
9 –
5.9
8.5
(.31)
7.6
– 9.
23.
0
F55.
3 (.3
1)4.
4 –
6.0
7.9
(.28)
7.2
– 8.
42.
6
F1-5
5.2
(.47)
4.2
– 6.
27.
9 (.5
4)6.
7 –
9.2
2.7
M1
4.0
(.30)
3.3.
– 4
.76.
4 (.4
2)5.
4 –
7.4
2.4
M2
4.1
(.35)
3.4
– 4.
76.
0 (.2
6)5.
5 –
6.6
1.9
M3
3.9
(.33)
2.9
– 4.
76.
4 (.3
7)5.
7 –
7.3
2.5
M4a
4.5
(.36)
3.9
– 5.
76.
3 (.3
7)5.
6 –
7.3
1.8
M5a
4.6
(.40)
3.9
– 6.
06.
2 (.4
6)5.
2 –
7.3
1.8
M1-
5 a
4.2
(.44)
2.9
– 6.
06.
3 (.6
0)5.
2 –
7.4
2.1
F1-M
5 a
4.7
(.66)
2.9
– 6.
27.
1 (.9
4)5.
2 –
9.2
2.4
a Den
otes
spea
kers
and
spea
ker g
roup
s sho
win
g di
strib
utio
n ov
erla
p be
twee
n al
veol
ar a
nd p
alat
o-al
veol
ar fr
icat
ives
.
J Phon. Author manuscript; available in PMC 2011 October 1.
NIH
-PA Author Manuscript
NIH
-PA Author Manuscript
NIH
-PA Author Manuscript
Haley et al. Page 14
TAB
LE 2
Skew
ness
mea
sure
s at a
naly
sis w
indo
ws c
ente
red
50 m
s int
o th
e fr
icat
ive
segm
ent.
Mea
ns a
nd ra
nges
are
repo
rted
for i
ndiv
idua
l spe
aker
s, ge
nder
gro
ups
(Fem
ales
; F1-
5 an
d M
ales
; M1-
5), a
nd a
ll sp
eake
rs c
ombi
ned
(F1-
M5)
. The
mag
nitu
de d
iffer
ence
, /ʃ/
– /s
/, is
the
diff
eren
ce in
mea
n va
lues
for t
hesp
eake
r or s
peak
er g
roup
Spea
ker
/ʃ/ m
ean
(SD
)/ʃ
/ ran
ge/s
/ mea
n (S
D)
/s/ r
ange
/ʃ/ –
/s/
F1+1
.6 (.
73)
+0.5
– +
3.3
−1.
2 (.4
2)−2.
2 –
−0.
32.
8
F2a
+0.8
(.35
)+0
.3 –
+1.
9−1.
0 (.4
4)−2.
6 –
+0.
31.
8
F3a
+1.0
(.41
)+0
.1 –
+1.
8−0.
5 (.4
1)−1.
5 –
+0.
31.
5
F4a
+0.8
(.55
)−0.
1 –
+2.
2−1.
2 (.5
3)−2.
4 –
0.0
2.0
F5a
0.0
(.37)
−0.
8 –
+1.
2−1.
0 (.6
9)−2.
6 –
+0.
91.
0
F1-5
a+0
.9 (.
70)
−0.
8 –
+3.
3− 1
.0 (.5
6)−2.
6 –
+0.
91.
9
M1a
+1.2
(.43
)+0
.3 –
+2.
1+0
.4 (.
74)
−1.
3 –
+3.
50.
8
M2a
+0.6
(.40
)−0.
1 –
+1.
3+0
.8 (.
46)
−0.
3 –
+2.
1−0.
2
M3a
+1.1
(.63
)−0.
2 –
+3.
3+0
.3 (.
67)
−1.
5 –
+1.
90.
8
M4a
+0.9
(.39
)+0
.1 –
+1.
8+0
.6 (.
72)
−1.
1 –
+3.
10.
3
M5a
+0.9
(.41
)−0.
5 –
+1.
8+0
.6 (.
55)
−1.
1 –
+2.
10.
3
M1-
5 a
+0.9
(.50
)−0.
5– +
3.3
+0.5
(.65
)−1.
5 –
+3.
50.
4
F1-M
5 a
+0.9
(.61
)−0.
8 –
+3.
3− 0
.2 (.9
8)−2.
6 –
+3.
51.
1
a Den
otes
spea
kers
and
spea
ker g
roup
s sho
win
g di
strib
utio
n ov
erla
p be
twee
n al
veol
ar a
nd p
alat
o-al
veol
ar fr
icat
ives
.
J Phon. Author manuscript; available in PMC 2011 October 1.
Related Documents