Evaluating the reliability of neurocognitive biomarkers of neurodegenerative diseases across countries: A machine learning approach M. Belen Bachli a, 1 , Lucas Sede~ no b, c, *, 1 , Jeremi K. Ochab d, 1 , Olivier Piguet e, f , Fiona Kumfor e, f , Pablo Reyes g, h , Teresa Torralva b , María Roca b , Juan Felipe Cardona j , Cecilia Gonzalez Campo b, c , Eduar Herrera i , Andrea Slachevsky k, l, m, n , Diana Matallana o , Facundo Manes b, c, e , Adolfo M. García b, c, p , Agustín Ib a~ nez b, c, e, q, r , Dante R. Chialvo a, c a Center for Complex Systems & Brain Sciences (CEMSC 3 ), Escuela de Ciencia y Tecnologia (ECyT), Universidad Nacional de San Martín, 25 de Mayo 1169, San Martín, (1650), Buenos Aires, Argentina b Institute of Cognitive and Translational Neuroscience (INCYyT), INECO Foundation, Favaloro University, Buenos Aires, Argentina c Consejo Nacional de Investigaciones Científicas y Tecnol ogicas (CONICET), Godoy Cruz 2290, Buenos Aires, Argentina d Marian Smoluchowski Institute of Physics, Mark Kac Complex Systems Research Center Jagiellonian University, Ul. Lojasiewicza 11, PL30-348, Krak ow, Poland e ARC Centre of Excellence in Cognition and Its Disorders, Sydney, Australia f The University of Sydney, Brain and Mind Centre and School of Psychology, Sydney, Australia g Radiology, Hospital Universitario San Ignacio (HUSI), Bogot a, Colombia h Medical School, Physiology Sciences, Psychiatry and Mental Health Pontificia Universidad Javeriana (PUJ) – Centro de Memoria y Cognici on Intellectus, Hospital Universitario San Ignacio (HUSI), Bogot a, Colombia i Departamento de Estudios Psicol ogicos, Universidad Icesi, Cali, Colombia j Instituto de Psicología, Universidad del Valle, Cali, Colombia k Gerosciences Center for Brain Health and Metabolism, Santiago, Chile l Neuropsychology and Clinical Neuroscience Laboratory (LANNEC), Physiopathology Department, ICBM, Neurosciences Department, East Neuroscience Department, Faculty of Medicine, University of Chile, Avenida Salvador 486, Providencia, Santiago, Chile m Memory and Neuropsychiatric Clinic (CMYN) Neurology Department- Hospital del Salvador & University of Chile, Av. Salvador 364, Providencia, Santiago, Chile n Servicio de Neurología, Departamento de Medicina, Clínica Alemana-Universidad del Desarrollo, Chile o Medical School, Aging Institute, Psychiatry and Mental Health, Pontificia Universidad Javeriana (PUJ) – Centro de Memoria y Cognici on Intellectus. Hospital Universitario San Ignacio (HUSI), Bogot a, Colombia p Faculty of Education, National University of Cuyo (UNCuyo), Sobremonte 74, C5500, Mendoza, Argentina q Universidad Aut onoma del Caribe, Calle 90, No 46-112, C2754, Barranquilla, Colombia r Center for Social and Cognitive Neuroscience (CSCN), School of Psychology, Universidad Adolfo Ib a~ nez, Diagonal Las Torres, 2640, Santiago, Chile ARTICLE INFO Keywords: Alzheimer’s disease Frontotemporal dementia Machine-learning Executive functions Voxel-based morphometry Classification ABSTRACT Accurate early diagnosis of neurodegenerative diseases represents a growing challenge for current clinical practice. Promisingly, current tools can be complemented by computational decision-support methods to objec- tively analyze multidimensional measures and increase diagnostic confidence. Yet, widespread application of these tools cannot be recommended unless they are proven to perform consistently and reproducibly across samples from different countries. We implemented machine-learning algorithms to evaluate the prediction power of neurocognitive biomarkers (behavioral and imaging measures) for classifying two neurodegenerative condi- tions –Alzheimer Disease (AD) and behavioral variant frontotemporal dementia (bvFTD)– across three different countries (>200 participants). We use machine-learning tools integrating multimodal measures such as cognitive scores (executive functions and cognitive screening) and brain atrophy volume (voxel based morphometry from fronto-temporo-insular regions in bvFTD, and temporo-parietal regions in AD) to identify the most relevant features in predicting the incidence of the diseases. In the Country-1 cohort, predictions of AD and bvFTD became maximally improved upon inclusion of cognitive screenings outcomes combined with atrophy levels. Multimodal training data from this cohort allowed predicting both AD and bvFTD in the other two novel datasets from other countries with high accuracy (>90%), demonstrating the robustness of the approach as well as the differential specificity and reliability of behavioral and neural markers for each condition. In sum, this is the first study, across * Corresponding author. Institute of Cognitive and Translational Neuroscience (INCYyT), INECO Foundation, Favaloro University, Buenos Aires, Argentina. E-mail address: [email protected] (L. Sede~ no). 1 First Authors. Contents lists available at ScienceDirect NeuroImage journal homepage: www.elsevier.com/locate/neuroimage https://doi.org/10.1016/j.neuroimage.2019.116456 Received 26 February 2019; Received in revised form 29 October 2019; Accepted 9 December 2019 Available online 10 December 2019 1053-8119/© 2019 The Authors. Published by Elsevier Inc. This is an open access article under the CC BY-NC-ND license (http://creativecommons.org/licenses/by- nc-nd/4.0/). NeuroImage 208 (2020) 116456

Welcome message from author
This document is posted to help you gain knowledge. Please leave a comment to let me know what you think about it! Share it to your friends and learn new things together.
Transcript
NeuroImage 208 (2020) 116456
Contents lists available at ScienceDirect
NeuroImage
journal homepage: www.elsevier.com/locate/neuroimage
Evaluating the reliability of neurocognitive biomarkers ofneurodegenerative diseases across countries: A machine learning approach
M. Belen Bachli a,1, Lucas Sede~no b,c,*,1, Jeremi K. Ochab d,1, Olivier Piguet e,f, Fiona Kumfor e,f,Pablo Reyes g,h, Teresa Torralva b, María Roca b, Juan Felipe Cardona j,Cecilia Gonzalez Campo b,c, Eduar Herrera i, Andrea Slachevsky k,l,m,n, Diana Matallana o,Facundo Manes b,c,e, Adolfo M. García b,c,p, Agustín Ib�a~nez b,c,e,q,r, Dante R. Chialvo a,c
a Center for Complex Systems & Brain Sciences (CEMSC3), Escuela de Ciencia y Tecnologia (ECyT), Universidad Nacional de San Martín, 25 de Mayo 1169, San Martín,(1650), Buenos Aires, Argentinab Institute of Cognitive and Translational Neuroscience (INCYyT), INECO Foundation, Favaloro University, Buenos Aires, Argentinac Consejo Nacional de Investigaciones Científicas y Tecnol�ogicas (CONICET), Godoy Cruz 2290, Buenos Aires, Argentinad Marian Smoluchowski Institute of Physics, Mark Kac Complex Systems Research Center Jagiellonian University, Ul. Łojasiewicza 11, PL30-348, Krak�ow, Polande ARC Centre of Excellence in Cognition and Its Disorders, Sydney, Australiaf The University of Sydney, Brain and Mind Centre and School of Psychology, Sydney, Australiag Radiology, Hospital Universitario San Ignacio (HUSI), Bogot�a, Colombiah Medical School, Physiology Sciences, Psychiatry and Mental Health Pontificia Universidad Javeriana (PUJ) – Centro de Memoria y Cognici�on Intellectus, HospitalUniversitario San Ignacio (HUSI), Bogot�a, Colombiai Departamento de Estudios Psicol�ogicos, Universidad Icesi, Cali, Colombiaj Instituto de Psicología, Universidad del Valle, Cali, Colombiak Gerosciences Center for Brain Health and Metabolism, Santiago, Chilel Neuropsychology and Clinical Neuroscience Laboratory (LANNEC), Physiopathology Department, ICBM, Neurosciences Department, East Neuroscience Department,Faculty of Medicine, University of Chile, Avenida Salvador 486, Providencia, Santiago, Chilem Memory and Neuropsychiatric Clinic (CMYN) Neurology Department- Hospital del Salvador & University of Chile, Av. Salvador 364, Providencia, Santiago, Chilen Servicio de Neurología, Departamento de Medicina, Clínica Alemana-Universidad del Desarrollo, Chileo Medical School, Aging Institute, Psychiatry and Mental Health, Pontificia Universidad Javeriana (PUJ) – Centro de Memoria y Cognici�on Intellectus. HospitalUniversitario San Ignacio (HUSI), Bogot�a, Colombiap Faculty of Education, National University of Cuyo (UNCuyo), Sobremonte 74, C5500, Mendoza, Argentinaq Universidad Aut�onoma del Caribe, Calle 90, No 46-112, C2754, Barranquilla, Colombiar Center for Social and Cognitive Neuroscience (CSCN), School of Psychology, Universidad Adolfo Ib�a~nez, Diagonal Las Torres, 2640, Santiago, Chile
A R T I C L E I N F O
Keywords:Alzheimer’s diseaseFrontotemporal dementiaMachine-learningExecutive functionsVoxel-based morphometryClassification
* Corresponding author. Institute of Cognitive anE-mail address: [email protected] (L. Sed
1 First Authors.
https://doi.org/10.1016/j.neuroimage.2019.11645Received 26 February 2019; Received in revised foAvailable online 10 December 20191053-8119/© 2019 The Authors. Published by Elsenc-nd/4.0/).
A B S T R A C T
Accurate early diagnosis of neurodegenerative diseases represents a growing challenge for current clinicalpractice. Promisingly, current tools can be complemented by computational decision-support methods to objec-tively analyze multidimensional measures and increase diagnostic confidence. Yet, widespread application ofthese tools cannot be recommended unless they are proven to perform consistently and reproducibly acrosssamples from different countries. We implemented machine-learning algorithms to evaluate the prediction powerof neurocognitive biomarkers (behavioral and imaging measures) for classifying two neurodegenerative condi-tions –Alzheimer Disease (AD) and behavioral variant frontotemporal dementia (bvFTD)– across three differentcountries (>200 participants). We use machine-learning tools integrating multimodal measures such as cognitivescores (executive functions and cognitive screening) and brain atrophy volume (voxel based morphometry fromfronto-temporo-insular regions in bvFTD, and temporo-parietal regions in AD) to identify the most relevantfeatures in predicting the incidence of the diseases. In the Country-1 cohort, predictions of AD and bvFTD becamemaximally improved upon inclusion of cognitive screenings outcomes combined with atrophy levels. Multimodaltraining data from this cohort allowed predicting both AD and bvFTD in the other two novel datasets from othercountries with high accuracy (>90%), demonstrating the robustness of the approach as well as the differentialspecificity and reliability of behavioral and neural markers for each condition. In sum, this is the first study, across
d Translational Neuroscience (INCYyT), INECO Foundation, Favaloro University, Buenos Aires, Argentina.e~no).
6rm 29 October 2019; Accepted 9 December 2019
vier Inc. This is an open access article under the CC BY-NC-ND license (http://creativecommons.org/licenses/by-
M.B. Bachli et al. NeuroImage 208 (2020) 116456
Abbreviations
AD Alzheimer DiseasebvFTD behavioral variant FrontotemporaACE Addenbrooke’s cognitive examinaIFS INECO Frontal ScreeningHC Healthy controlsTR repetition timeVBM voxel-based morphometrySPM12 Statistical Parametric Mapping soWM white matterGM grey matterCSF cerebrospinal fluidACC anterior cingulate cortexAAL-atlas Automated Anatomical Labeling
centers and countries, to validate the predictive power of cognitive signatures combined with atrophy levels forcontrastive neurodegenerative conditions, validating a benchmark for future assessments of reliability andreproducibility.
l Dementiation
ftware
(AAL)-Atlas
1. Introduction
Neurodegenerative diseases are a world-wide epidemic (Shah et al.,2016; Shaw et al., 2007). According to the World Alzheimer Report 2015from the Alzheimer’s Disease International, more than 130 million peo-ple above age 60 will be diagnosed with dementia in 2050 (InternationalAsD, 2015). Accurate early diagnosis across different neurodegenerativeconditions is important for establishing prognosis and accessing adequatetreatment. Diagnosis and differential diagnosis represents a clinicalchallenge due to the complexity of neurodegenerative processes, whichdisturb the patients’ brain structures and functions, as well as theircognition and behavior (Oxtoby et al., 2017; Palop et al., 2006). Indeed,current guidelines require the identification of a clinical phenotype andthe recognition of specific patterns of atrophy or hypoperfusion in neu-roimaging, which are frequently combined with neuropsychologicalevaluation (Forman et al., 2006a; Tong et al., 2017). Accordingly, ac-curate and timely diagnosis depends on the clinical expertise to recognizethe co-occurrence of clinical phenotype and neuroimaging data. Thisfrequently leads to misdiagnosis in non-specialized dementia centers,even among the most common forms of dementia (Johnson et al., 1999;Padovani et al., 2013). This is especially true for developing countries,given their minimal mental-health infrastructure, the lack of regionallyorganized research, and reliance on non-local (mostly Anglo-Saxon)reference data (Parra et al., 2018). The development of objective, auto-mated, and multidimensional decision-support methods for dementiacould critically enhance the current clinical toolkit by increasing diag-nostic accuracy and confidence (Arbabshirani et al., 2017; Huys et al.,2016). Computational approaches prove most promising in this context,given their potential to detect consistent, reproducible markers acrosssamples from different countries (Henley et al., 2005; Humpel, 2011).Capitalizing on this novel approach, here we implementmachine-learning algorithms to evaluate the performance of well-definedcognitive/behavioral and neural markers of neurodegeneration for clas-sifying patients with Alzheimer’s disease (AD) and behavioral variantfrontotemporal dementia (bvFTD) across three different countries.
Neurodegenerative disorders are characterized by abnormalities atmolecular, synaptic, neuroanatomical, network-level, cognitive, andbehavioral levels (Palop et al., 2006; Piguet et al., 2011a; Seelaar et al.,2011; Sperling et al., 2011). Although specific disturbances across theselevels are generally associated with different types of dementia, patients
2
present more heterogeneous profiles than would be expected accordingto diagnostic criteria (Palop et al., 2006; Piguet et al., 2011a; Seelaaret al., 2011; Sperling et al., 2011). For example, executive function def-icits, which are characteristic of bvFTD, may nevertheless be absent insome patients. Similarly, such deficits may be observed in AD (Seelaaret al., 2011). This is also true for atrophy patterns. For example, a pre-vious cluster-based analysis in bvFTD revealed four distinct patterns,with patients showing temporal-dominant, temporo-frontoparietal,frontal-dominant, or frontotemporal atrophy patterns (Whitwell et al.,2009). Given this variability, computational decision-support methodshave been proposed as a powerful novel approach due to their capacity tojointly assess relevant heterogeneous features (Arbabshirani et al., 2017;Dottori et al., 2017).
In the study of dementia, both cognitive and structural MRI data havearisen as potential candidates to establish effective, affordable, andmassive markers of specific diseases (Fox and Schott, 2004; Kloppel et al.,2008a; Larner and Mitchell, 2014; Moreira et al., 2017). Valuable in-formation of the patients’ cognitive status can be quickly obtained viacognitive screening instrument (Crawford et al., 2012; Galton et al.,2005; Velayudhan et al., 2014), such as the Addenbrooke’s cognitiveexamination (ACE) and the INECO Frontal Screening (IFS), which can bereadily administered in general clinical settings. The ACE is a quick toolto evaluate general cognitive domains (e.g., memory, attention) withgreat sensitivity for AD and dementia in general (Larner and Mitchell,2014; Crawford et al., 2012; Galton et al., 2005; Hsieh et al., 2013), whilethe IFS focuses on executive functions (Moreira et al., 2014, 2017; Tor-ralva et al., 2009a; Bahia et al., 2018; Custodio et al., 2016) –a domainpoorly evaluated by the ACE (Hsieh et al., 2013) – with the aim toidentify characteristic deficits in bvFTD patients who have relativepreservation of other cognitive domains (Piguet et al., 2011a). These twowidely used screening tools (Hsieh et al., 2013; Torralva et al., 2009a), inparticular, have yielded good accuracy rates to discriminate dementiapatients from healthy controls (with scores from 83 to 96%) (Larner andMitchell, 2014; Moreira et al., 2017; Hsieh et al., 2013; Torralva et al.,2009a). On the other hand, structural MRI is a non-invasive method,generally included in routine assessments of dementia, characterized bylower costs than other candidate biological biomarkers (Mueller et al.,2006). Of note, though anatomical images are only visually inspected forclinical evaluation, they offer automatically derivable metrics of atrophy,which can reveal subtle neural alterations untraceable to the naked eye(Orru et al., 2012). Furthermore, several studies applying computationaldecision-methods on anatomical neuroimages have yielded good accu-racy rates (from 80 to 100%) to discriminate AD and bvFTD patients fromhealthy controls (Zheng et al., 2016; Bron et al., 2017; Zhang et al., 2013;Dukart et al., 2011; Kuceyeski et al., 2012; Tahmasian et al., 2016; Zhouet al., 2010).
Although this evidence underscores the potential role of cognitivescreenings and neuroimaging as feasible and effective markers for de-mentia, several limitations undermine their reliability and potentialgeneralizability. First, works testing the classification properties of theACE and the IFS rely on simple statistical methods to establish cut-offs formaximizing true positives and minimizing false positives, but nomachine-learning approaches have yet been applied to evaluate theperformance of these screenings, alone or in combination with neuralmeasures (Larner and Mitchell, 2014; Moreira et al., 2017; Hsieh et al.,2013; Torralva et al., 2009a). Second, although a few neuroimagingstudies have obtained high classification rates via sophisticatedmachine-learning approaches (such as support-vector machines), none ofthem has assessed the generalizability of their findings to new datasets(Zheng et al., 2016; Bron et al., 2017; Zhang et al., 2013; Dukart et al.,2011; Kuceyeski et al., 2012; Tahmasian et al., 2016; Zhou et al., 2010),
M.B. Bachli et al. NeuroImage 208 (2020) 116456
casting doubts on their potential overfitting confounds and widespreadtranslational relevance. Third, no previous study has assessed the com-bined sensitivity of neuropsychological screenings and atrophy measureswith computational-decision methods, despite the evidence underscoringthe potential of this approach to tackle behavioral and anatomical het-erogeneity (Palop et al., 2006; Piguet et al., 2011a; Seelaar et al., 2011;Sperling et al., 2011). Finally, most previous research is based only onsamples from one clinic (typically, from Anglo-Saxon populations), sothat their results might not be robust against the variability introduced bycross-center differences in recording parameters, diagnostic criteria, andthe patients’ socio-demographic profiles.
In sum, computational-decision methods combining cognitivescreenings and atrophy measures to detect dementia patient profilesprove promising, but key tests of their robustness remain to be deter-mined. Here, we implemented machine-learning algorithms to evaluatethe power of cognitive parameters and brain atrophy measures for clas-sifying AD and bvFTD patients across three countries, including Latin-American and Anglo-Saxon samples. In addition, we applied a leave-two-out cross-validation approach to test the accuracy rates within areference dataset (within-country analysis), and then performed a cross-country validation to further evaluate the generalization of our findings.We predicted that the ACE, given its target domains, would contributemore than the IFS for the classification of AD. The IFS, given its emphasison frontal executive functions, was hypothesized to be more sensitive tobvFTD. Moreover, we expected that cognitive measures would generalizebetter than atrophy features, as the latter present higher variability dueto differences in MRI scanner and acquisition parameters among centers(Abdulkadir et al., 2011). Finally, we anticipated that the combination ofcognitive and atrophy features would yield higher classification scoresfor both within-country analysis and cross-country generalization.
2. Materials and methods
2.1. Participants
The data analyzed here partially belong to a previously reportedmulticenter protocol study (Sede~no et al., 2017), and comprised 202participants from three countries. Fifty-seven patients fulfilling revisedconsensus criteria for probable bvFTD (Rascovsky et al., 2011) and 29patients who satisfied international criteria for AD (McKhann et al.,2011) were recruited from three international clinics: INECO Founda-tion, Argentina (Country-1, C_1); San Ignacio University Hospital,Colombia (Country-2, C_2); and FRONTIER, the Frontotemporal De-mentia Research Group, based in Sydney (Country-3, C_3); further detailsof the origin of each sample are in Table 1.
As described in previous reports (Baez et al., 2014a; Piguet et al.,2011b; Torralva et al., 2009b) the clinical diagnosis in each center wasestablished by a standard examination –involving extensive neurological,neuropsychiatric, and neuropsychological assessments–, and each casewas discussed by a multidisciplinary clinical meeting of AD and bvFTDexperts. All patients were in early/mild disease stages, and they did notfulfil criteria for specific psychiatric disorders. Patients presenting pri-marily with language deficits were excluded (further details about theclinical evaluation are reported in (Sede~no et al., 2017)). Each patientsample was matched on sex, age, and education with its own controlgroup from the same scanning center (see Table 1). Healthy controls (HC,116 in total) presented no history of psychiatric or neurological disease.
Participants (or their Person Responsible) provided signed informedconsent in accordance with the Declaration of Helsinki. The study pro-tocol was approved by the institutional Ethics Committee of each center.
2.2. Cognitive assessment
Participants completed a general cognitive screening, the ACE(Mathuranath et al., 2000), and an executive function brief cognitive test,IFS (Torralva et al., 2009b). The IFS (Torralva et al., 2009b) is a sensitive
3
tool to detect executive dysfunction in patients with dementia (Dottoriet al., 2017; Baez et al., 2014a, 2014b, 2016a, 2016b, 2019; Melloniet al., 2016; Santamaria-Garcia et al., 2016, 2017; Sedeno et al., 2016;Gleichgerrcht et al., 2011). This test includes eight subtests that evaluateresponse inhibition and set shifting, abstraction skills, and workingmemory. The global score of the IFS (the sum of the subtests, with amaximum value of 30) was considered here, as in previous works (Ibanezet al., 2012). The ACE (Mathuranath et al., 2000) is a sensitive tool todetect early stages of dementia and, more particularly, to distinguishbetween AD and FTD patients (Hsieh et al., 2013). This test evaluatesorientation, attention, memory, verbal fluency, language, and visuospa-tial ability (with a maximum total score of 100).
2.3. Structural imaging
2.3.1. Image acquisitionWe followed the guidelines from the Organization for Human Brain
Mapping (Nichols et al., 2017) to report the acquisition and pre-processing steps. Structural images were obtained from Country-1 par-ticipants through whole-brain T1-weighted spin echo sequences in a 1.5TPhillips Intera scanner, and were acquired parallel to the plane con-necting the anterior and posterior commissures with the following pa-rameters: matrix size ¼ 256 � 240, 120 slices, approx. 1x1x1 mm(1x0.97 � 0.97 mm); repetition time (TR) ¼ 7489 ms; echo time (TE) ¼3420 ms; flip angle ¼ 8�, acquisition time ¼ 7 min. Country-2 partici-pants were scanned in a 3T Philips Achieva scanner. Whole-brain struc-tural T1-rapid gradient-echo (MP RAGE) anatomical 3D scans wereacquired with the following parameters: matrix size ¼ 256x256, 160slices, 1x1x1 mm isotropic; TR¼ 8521 ms; TE¼ 4130 ms; flip angle¼ 9�
ms, acquisition time ¼ 8 min. In Country-3, whole-brain structuralT1-weighted spin echo sequences were acquired through a 3T PhilipsMRI scanner with a standard head coil (matrix size ¼ 256x200, 256slices, 1x1x1 mm isotropic; TR¼ 5903ms: TE¼ 2660 ms; flip angle¼ 8�;acquisition time ¼ 7.42 min).
2.3.2. Voxel-based morphometryStructural images from each center were analyzed via voxel-based
morphometry (VBM) with the DARTEL Toolbox of the Statistical Para-metric Mapping software (SPM12), following validated procedures(Sede~no et al., 2017). Images were segmented into white matter (WM),grey matter (GM), and cerebrospinal fluid (CSF). Then, based on thesegmented GM andWM images, we created a template from each center’scomplete data set with the “DARTEL (create template)”module. Next, thefinal template from the previous step was affine-registered into the MNIspace with the “Normalize to MNI Space” module from DARTEL Tools,and then this transformation was applied to all segmented GM scans totranslate them into standard space (images were modulated by Jacobiandeterminants). Finally, an isotropic Gaussian kernel of 12-mm full widthat half maximum (FWHM) was applied to all images.
Following previous procedures (Dukart et al., 2013), we used a maskresembling the characteristic atrophy pattern of AD and bvFTD, respec-tively, to extract the GM volume for each participant. Given that we aimto test cognitive and atrophy features with a cross-center validationstrategy, we used this ‘a priori’ feature selection to avoid the potentialbias of a data-driven approach, which might find optimum classificationfeatures for an specific dataset that do not necessarily enable high clas-sification rates in another one (Dukart et al., 2013). As in a previouswork, the general bvFTD atrophy mask was defined using the AutomatedAnatomical Labeling (AAL)-Atlas (Tzourio-Mazoyer et al., 2002), andinvolves the main fronto-insulo-temporal areas of early degeneration,including (Piguet et al., 2011a; Rascovsky et al., 2011; Ibanez andManes,2012; Schroeter et al., 2007): the anterior cingulate cortex (ACC), theorbitofrontal cortex, the gyrus rectus, the inferior frontal gyrus, thefrontal middle gyrus, the amygdala, the basal ganglia (caudate nucleus,putamen and pallidum), the insular cortex, the hippocampus and para-hippocampus (see Supp. Fig. 1). For AD, the general mask was also based

Table 1Summary of demographic data for each group.
Country-1
C_1-FTD HC F-value p-value
Age [years] 66.72�9.56
68.73�8.48
0.57 .452
Education [years] 15.05�2.97
15.86�2.92
0.85 .360
IFS 16.30�7.01
25.37�1.84
46.46 <.001
ACE 76.72�15.39
93.76�4.25
33.02 <.001
Chi-square p-valueGender [M/F] F ¼ 11 (16)
M ¼ 7 (13)F ¼ 21 (24)M ¼ 9 (10)
0.40 .527
C_1-AD HC F-value p-value
Age [years] 75.37�8.72
71.54�6.00
2.57 .117
Education [years] 12.94�4.97
15.13�3.10
2.81 .102
IFS 16.59�4.46
25.07�1.87
64.34 <.001
ACE 69.50�14.11
93.90�4.28
58.89 <.001
Chi-square p-valueSex [M/F] F ¼ 13 (13)
M ¼ 3 (3)F ¼ 17 (18)M ¼ 5 (6)
0.08 .766
Country-2C_2-FTD HC F-value p-value
Age [years] 66.55�9.37
61.18�7.74
2.72 .109
Education [years] 15.89�2.31
14.73�5.41
0.38 0.542
IFS 12.78�6.21
22.87�2.97
38.13 <.001
ACE – – – –
Chi-square p-valueSex [M/F] F ¼ 7 (12)
M ¼ 2 (4)F ¼ 11 (16)M ¼ 11 (12)
2.03 .155
Country-3C_3-FTD HC F-value p-value
Age [years] 64.90�9.44
69.50�6.43
1.88 .184
Education [years] 12.20�3.47
14.27�2.77
2.50 .128
IFS – – – –
ACE 75.36�14.99
96.25�2.42
22.73 <.001
Chi-square p-valueSex [M/F] F ¼ 4 (4)
M ¼ 7 (8)F ¼ 5 (7)M ¼ 7 (8)
0.06 .794
C_3-AD HC F-value p-value
Age [years] 64.00�5.83
69.50�6.43
4.34 .051
Education [years] 12.80�2.89
14.27�2.77
1.47 .238
IFS – – – –
ACE 62.10�11.58
96.25�2.41
100.09 <.001
Chi-square p-valueSex [M/F] F ¼ 3 (5)
M ¼ 7 (8)F ¼ 7 (8)M ¼ 5 (7)
1.76 .183
Table 1. Subject groups for the two diseases and the three countries. Because ofoccasional missing data, we indicate for each gender and country, first thenumber of subjects actually used in the current study and then in parentheses thetotal of recruited subjects. Note also that different cognitive tests were useddepending on the country. Age, education, IFS and ACE scores are given with themean� SD. C_1 ¼ Country-1; C_2 ¼ Country-2; C_3 ¼ Country-3.
Fig. 1. Standardize (grey box): data were standardized by converting them to z-scores, so that each feature in the control group had a zero mean and standarddeviation of one. Data exploration (light orange boxes): these procedures wereused only to explore and obtain knowledge about the behavior of the data.Clustering: we used a k-means algorithm with k ¼ 2 to separate groups in twoclusters to explore data distribution, and evaluate the presence of potential sub-groups of participants (details in section 2.4.1). Visualization and inspection: thehypothetically most informative features (cognitive screenings and atrophy)were inspected by graphing pairs of dimensions for the reference dataset(Country-1) (details in section 2.4). Principal component analysis (PCA): Weused MATLAB’s default implementation of PCA to explore the most informativecombination of features as measured by the explained variance of the data.Classification (light green boxes): Within-country classification: we imple-mented a logistic regression classifier with cognitive and brain atrophy featureswithin the Country-1 dataset, given that it was the largest one with fullcompletion of cognitive screenings. To evaluate the performance of this model,we used a leave-two-out cross-validation scheme. Cross-country classification:this was performed to further validate the generalization and prediction powerof our findings. The logistic regression classifier was trained with Country-1subjects and tested on participants from Country-2 or Country-3. Finally, toevaluate the relevance of each feature, after performing the classification withthe whole feature set, the procedure was repeated but one-by-one each of thefeatures was omitted in the classification (details in sections 2.4.2 and 2.4.3).
M.B. Bachli et al. NeuroImage 208 (2020) 116456
4
on the AAL-atlas including the most common atrophy areas for this de-mentia such as the posterior cingulate cortex, the hippocampus, theparahippocampus, the amygdala, the angular gyrus, the precuneus, andthe temporal superior and middle gyrus (Whitwell et al., 2009; Du et al.,2007) (see Supp. Fig. 1). Regions for both masks were selectedbilaterally.
2.4. Classification analysis
To test the power of cognitive and brain atrophy features for classi-fying AD and bvFTD patients, we first implemented machine-learningalgorithms within a reference dataset. For this analysis (from now onreferred to as “within-country” approach), we selected the largest datasetavailable with full completion of cognitive screenings, namely, the onefrom Country-1. Then, we performed a cross-country classificationanalysis to further validate the generalization and prediction power ofour findings with the within-country approach. In short, the classifier wastrained with Country-1 subjects, and tested on participants from Country-2 or Country-3.
For both classification approaches, six features of interest wereincluded in the analysis: IFS and ACE scores, the volume of atrophy, anddemographic data including sex, age and number of years of formal ed-ucation. Participants missing any of these parameters were excludedfrom further study. The general processing and analysis steps (conductedseparately for the two diseases) are presented in Fig. 1. First the data wasstandardized by converting to z-scores, so that each feature in the control

M.B. Bachli et al. NeuroImage 208 (2020) 116456
group had a zero mean and standard deviation of one (see Fig. 1; thedetails of z-scoring depend on the chosen cross-validation scheme, andare described in Sections 2.4.2 and 2.4.3). This also transforms the dis-tances between data points to be on the same scale. In this way, this stepis preferred for some clustering and classification methods in order toimprove their convergence and to avoid bias merely due to differentfeature ranges. The only categorical variable, sex, was not standardizedbut was given values�1, since otherwise the values would be different ineach group due to different proportions of females and males. Next, thehypothetically most informative features were inspected by graphingpairs of dimensions for Country-1 –the reference dataset (see 2.4.1Clustering, below). This exploration was completed by principalcomponent analysis (PCA), an exploratory technique that finds the mostinformative combination of features as measured by the explained vari-ance of the data. We used MATLAB’s default implementation of PCAwitha singular value decomposition of feature correlation matrix. Indeed, thePCA showed that for Country-1 AD (C_1-AD) [vs Country-1 FTD (C_1-FTD)] the first principal component explains 46% (43%) of variance (ofthe standardized data), and 82% of this component (97%, calculated asthe norm of the coefficient vector) comprises roughly equal shares of IFS,ACE, and atrophy scores. Due to the small number of features, dimen-sionality reduction was not needed, and so the clustering and classifi-cation analyses were not performed on the principal components, butonly on the z-scored parameters.
2.4.1. ClusteringClustering is an exploratory technique used when the actual groups
(like disease and HC, here) are not known. The objective was to assesswhether the subjects from the reference dataset (Country-1) could beclustered into two separate groups, without any knowledge about themeaning of the features. Such an exploration might provide additionalinsights into the distribution of the data, and help predict difficulties atthe classification stage, and also show potential errors in the diagnosticlabel or the presence of potential sub-groups of participants. Given thatthe clustering analysis was conducted solely for exploratory purposes andthat its results were not used in any form for the classification analyses(see sections 2.4.2 and 2.4.3), we used the classic k-means algorithm(see, e.g. (Duda et al., 2001),) implemented in Matlab, with k ¼ 2 (seeSupp. Data 1). To evaluate differences in the expected geometries, we usethe Euclidean distance. Although there are many other more sophisti-cated clustering methods, k-means provided us with just enough baselineinformation (i.e., that the data can be reasonably divided into twomeaningful groups) to proceed to classification.
2.4.2. Within-country classificationWe used a default logistic regression classifier (Hastie et al., 2009)
implemented in Matlab, (see Supp. Data 1) to discriminate patients fromHC for Country-1, our reference data-set. Logistic regression is a type ofregression specifically designed to model probabilities –in this case, theprobability of a subject belonging to a condition group (AD or bvFTD).Since probability is always limited to the interval from 0 to 1, predictionsof linear regression are ill-defined, because they may lie outside of thisinterval. On the other hand, logistic regression uses a logistic function,which is a smooth step function whose values range exactly from 0 to 1,and is thus well fitted to the classification problems. This scheme wasused, since the sample of this country was the largest one compared to theother ones. Also, only participants from this country have completed allthe cognitive screening assessments (IFS and ACE). These characteristicsare fundamental to train data both for classification within the country aswell as for cross-country validation.
To evaluate the classifier’s performance, we used a leave-two-outcross-validation that is computationally more demanding but allows abetter sampling than either leave-one-out or 10-fold cross-validation(Kearns and Ron, 1999; Wang et al., 2019). In each run, two partici-pants were held out from the training set: one from the condition group
5
(of size ncn) and one from the control group (of size ncl); the classifier wastrained on the remaining ncn þ ncl � 2 subjects and tested on the twohold-out subjects. In this cross-validation scheme, all z-scores were basedon the mean and standard deviation of the ncl � 1 training controls. Theidea is to use only what we know about the training set for classification.Any transformation of the test set must be performed using only thatknowledge, including the values of training means and standarddeviations.
The true/false positive/negative scores were accumulated over allruns. Due to the small size of the data set, the cross-validation wasexhaustive, i.e., all ncn∙ncl pairs of condition-control subjects were tested.From the accumulated scores, the sensitivity, TP/(TP þ FN), and speci-ficity, TN/(TN þ FP), values were obtained.
To evaluate a classifier’s performance the receiver-operating char-acteristic (ROC) curves (Fawcett, 2006) were calculated, see Fig. 3. Thecurves depict sensitivity (true positive rate) plotted versus 1-specificity(false positive rate). They are calculated by shifting the probabilitythreshold (a moving vertical decision line in the histograms of Figs. 3 and4) by means of which subjects are assigned to groups. The probabilityrange was from 0 to 1 in steps of 0.05. The area under the ROC curve(AUC) and the accuracy classification rates were used as metrics of theclassifier’s performance. These were also used to evaluate the relativeimportance of a given feature for prediction results: first, the classifica-tion was performed on the whole feature set (denoted “All” in the ROCplots), and then, one by one, each of the six (or five for Country-2 andCountry-3 data sets) features was omitted in the classification. If theresulting AUC or accuracy score decreased without a given feature, thefeature can be considered relevant, conversely if these values increased,the feature can be considered to introduce unwanted noise or correla-tions. The statistical significance of differences between the AUCinvolving all features and each of the AUC when one feature wasremoved, was estimated with the Mann-Whitney statistic (DeLong et al.,1988) (p-values are expressed after Bonferroni correction). Typically thistest would use as input ncn þ ncl classification scores, which in this casegives a small sample size (i.e. the expected confidence intervals andcoverage probability in (Gengsheng and Hotilovac, 2008)). As a rule ofthumb to obtain 90% power for distinguishing AUC 0.96 and 0.95 at 0.05significance level one needs a sample size over 6000, which means in ourcase the tests for ROC differences are severely underpowered (Zhou et al.,2010). Since we perform the leave-two-out procedure, we decided tobootstrap the sample to 2∙ncn∙ncl scores (of the order of 1000). How-ever, such a resampling leads to a stronger bias and produces under-estimated p-values. We nevertheless provide these p-values in theSupplementary Data 2 to accompany AUC reported in Table 2.
2.4.3. Cross-country classificationFor cross-country classification, the classifier was trained on Country-
1 subjects and tested on either Country-2 or Country-3, given thatCountry-1 was the largest one and included data from both the IFS andACE for all the participants. As above, the z-scores were computed basedon the mean and standard deviation of the control group of the trainingset (Country-1). Again, this is to avoid so called data leakage: if we intendto standardize the data based on the control group, then we must not useany knowledge from the test set. Z-scoring based on the control group ofthe test set already introduces some knowledge (via mean and standarddeviation) about how the set is divided. We circumvented this issue byusing only the training set for that purpose. Note that instead of z-scoresthe classifiers can also take as input PCA components – again, with PCAloadings computed only on the training set. Although the performance ofthose classifiers is comparable or only slightly better, for simplicity andinterpretability of features, we report on the logistic regression classifierusing z-scored features only (See Supp. Table 3 for results with PCAcomponents).
Thanks to having separate training and test subjects, leave-two-outcross-validation was no longer necessary to estimate the out-of-sample
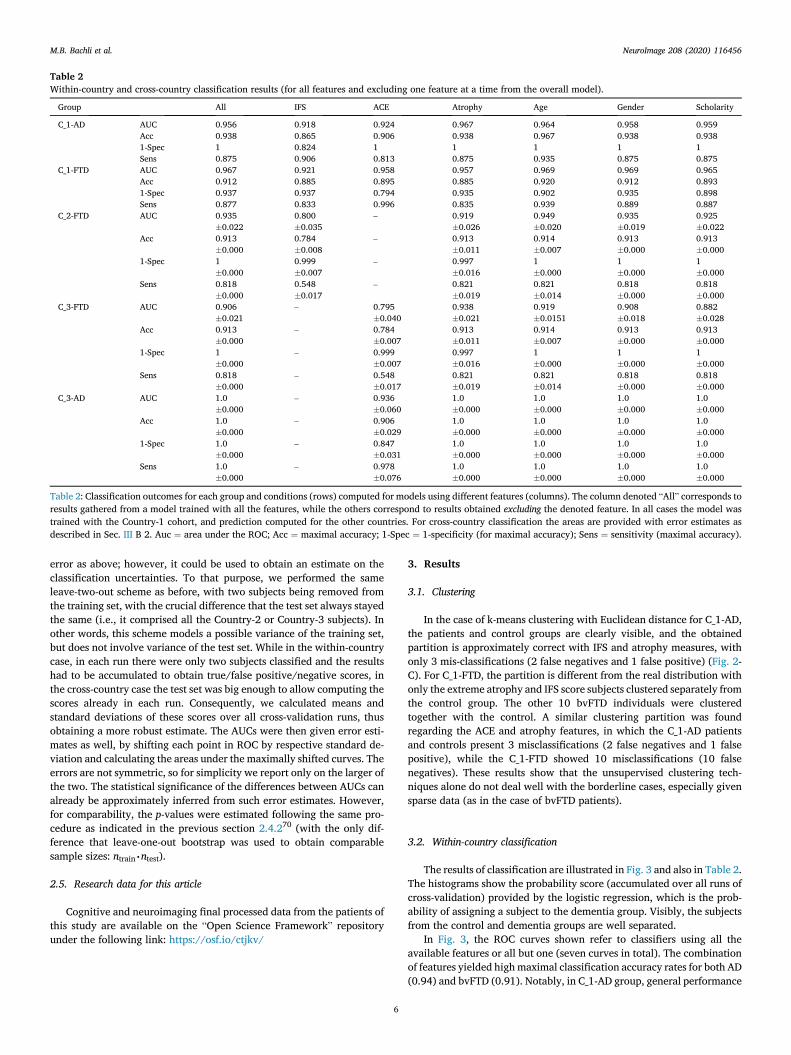
Table 2Within-country and cross-country classification results (for all features and excluding one feature at a time from the overall model).
Group All IFS ACE Atrophy Age Gender Scholarity
C_1-AD AUC 0.956 0.918 0.924 0.967 0.964 0.958 0.959Acc 0.938 0.865 0.906 0.938 0.967 0.938 0.9381-Spec 1 0.824 1 1 1 1 1Sens 0.875 0.906 0.813 0.875 0.935 0.875 0.875
C_1-FTD AUC 0.967 0.921 0.958 0.957 0.969 0.969 0.965Acc 0.912 0.885 0.895 0.885 0.920 0.912 0.8931-Spec 0.937 0.937 0.794 0.935 0.902 0.935 0.898Sens 0.877 0.833 0.996 0.835 0.939 0.889 0.887
C_2-FTD AUC 0.935�0.022
0.800�0.035
– 0.919�0.026
0.949�0.020
0.935�0.019
0.925�0.022
Acc 0.913�0.000
0.784�0.008
– 0.913�0.011
0.914�0.007
0.913�0.000
0.913�0.000
1-Spec 1�0.000
0.999�0.007
– 0.997�0.016
1�0.000
1�0.000
1�0.000
Sens 0.818�0.000
0.548�0.017
– 0.821�0.019
0.821�0.014
0.818�0.000
0.818�0.000
C_3-FTD AUC 0.906�0.021
– 0.795�0.040
0.938�0.021
0.919�0.0151
0.908�0.018
0.882�0.028
Acc 0.913�0.000
– 0.784�0.007
0.913�0.011
0.914�0.007
0.913�0.000
0.913�0.000
1-Spec 1�0.000
– 0.999�0.007
0.997�0.016
1�0.000
1�0.000
1�0.000
Sens 0.818�0.000
– 0.548�0.017
0.821�0.019
0.821�0.014
0.818�0.000
0.818�0.000
C_3-AD AUC 1.0�0.000
– 0.936�0.060
1.0�0.000
1.0�0.000
1.0�0.000
1.0�0.000
Acc 1.0�0.000
– 0.906�0.029
1.0�0.000
1.0�0.000
1.0�0.000
1.0�0.000
1-Spec 1.0�0.000
– 0.847�0.031
1.0�0.000
1.0�0.000
1.0�0.000
1.0�0.000
Sens 1.0�0.000
– 0.978�0.076
1.0�0.000
1.0�0.000
1.0�0.000
1.0�0.000
Table 2: Classification outcomes for each group and conditions (rows) computed for models using different features (columns). The column denoted “All” corresponds toresults gathered from a model trained with all the features, while the others correspond to results obtained excluding the denoted feature. In all cases the model wastrained with the Country-1 cohort, and prediction computed for the other countries. For cross-country classification the areas are provided with error estimates asdescribed in Sec. III B 2. Auc ¼ area under the ROC; Acc ¼ maximal accuracy; 1-Spec ¼ 1-specificity (for maximal accuracy); Sens ¼ sensitivity (maximal accuracy).
M.B. Bachli et al. NeuroImage 208 (2020) 116456
error as above; however, it could be used to obtain an estimate on theclassification uncertainties. To that purpose, we performed the sameleave-two-out scheme as before, with two subjects being removed fromthe training set, with the crucial difference that the test set always stayedthe same (i.e., it comprised all the Country-2 or Country-3 subjects). Inother words, this scheme models a possible variance of the training set,but does not involve variance of the test set. While in the within-countrycase, in each run there were only two subjects classified and the resultshad to be accumulated to obtain true/false positive/negative scores, inthe cross-country case the test set was big enough to allow computing thescores already in each run. Consequently, we calculated means andstandard deviations of these scores over all cross-validation runs, thusobtaining a more robust estimate. The AUCs were then given error esti-mates as well, by shifting each point in ROC by respective standard de-viation and calculating the areas under the maximally shifted curves. Theerrors are not symmetric, so for simplicity we report only on the larger ofthe two. The statistical significance of the differences between AUCs canalready be approximately inferred from such error estimates. However,for comparability, the p-values were estimated following the same pro-cedure as indicated in the previous section 2.4.270 (with the only dif-ference that leave-one-out bootstrap was used to obtain comparablesample sizes: ntrain∙ntest).
2.5. Research data for this article
Cognitive and neuroimaging final processed data from the patients ofthis study are available on the “Open Science Framework” repositoryunder the following link: https://osf.io/ctjkv/
6
3. Results
3.1. Clustering
In the case of k-means clustering with Euclidean distance for C_1-AD,the patients and control groups are clearly visible, and the obtainedpartition is approximately correct with IFS and atrophy measures, withonly 3 mis-classifications (2 false negatives and 1 false positive) (Fig. 2-C). For C_1-FTD, the partition is different from the real distribution withonly the extreme atrophy and IFS score subjects clustered separately fromthe control group. The other 10 bvFTD individuals were clusteredtogether with the control. A similar clustering partition was foundregarding the ACE and atrophy features, in which the C_1-AD patientsand controls present 3 misclassifications (2 false negatives and 1 falsepositive), while the C_1-FTD showed 10 misclassifications (10 falsenegatives). These results show that the unsupervised clustering tech-niques alone do not deal well with the borderline cases, especially givensparse data (as in the case of bvFTD patients).
3.2. Within-country classification
The results of classification are illustrated in Fig. 3 and also in Table 2.The histograms show the probability score (accumulated over all runs ofcross-validation) provided by the logistic regression, which is the prob-ability of assigning a subject to the dementia group. Visibly, the subjectsfrom the control and dementia groups are well separated.
In Fig. 3, the ROC curves shown refer to classifiers using all theavailable features or all but one (seven curves in total). The combinationof features yielded highmaximal classification accuracy rates for both AD(0.94) and bvFTD (0.91). Notably, in C_1-AD group, general performance
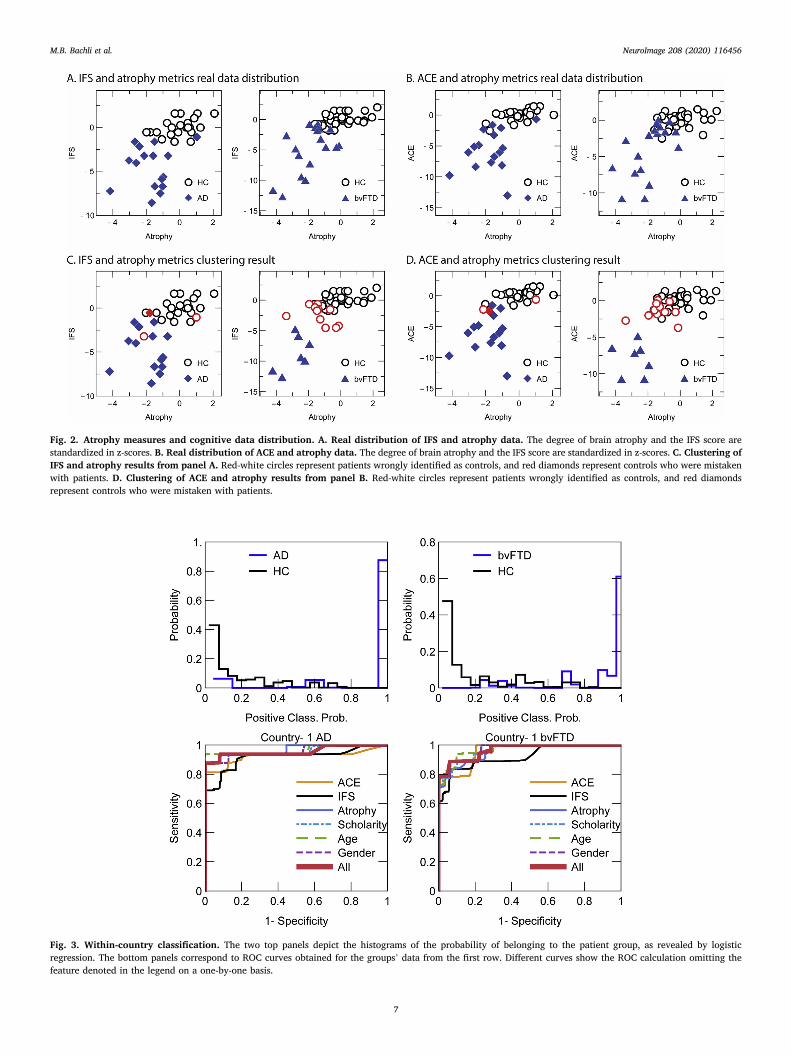
Fig. 2. Atrophy measures and cognitive data distribution. A. Real distribution of IFS and atrophy data. The degree of brain atrophy and the IFS score arestandardized in z-scores. B. Real distribution of ACE and atrophy data. The degree of brain atrophy and the IFS score are standardized in z-scores. C. Clustering ofIFS and atrophy results from panel A. Red-white circles represent patients wrongly identified as controls, and red diamonds represent controls who were mistakenwith patients. D. Clustering of ACE and atrophy results from panel B. Red-white circles represent patients wrongly identified as controls, and red diamondsrepresent controls who were mistaken with patients.
Fig. 3. Within-country classification. The two top panels depict the histograms of the probability of belonging to the patient group, as revealed by logisticregression. The bottom panels correspond to ROC curves obtained for the groups’ data from the first row. Different curves show the ROC calculation omitting thefeature denoted in the legend on a one-by-one basis.
M.B. Bachli et al. NeuroImage 208 (2020) 116456
7
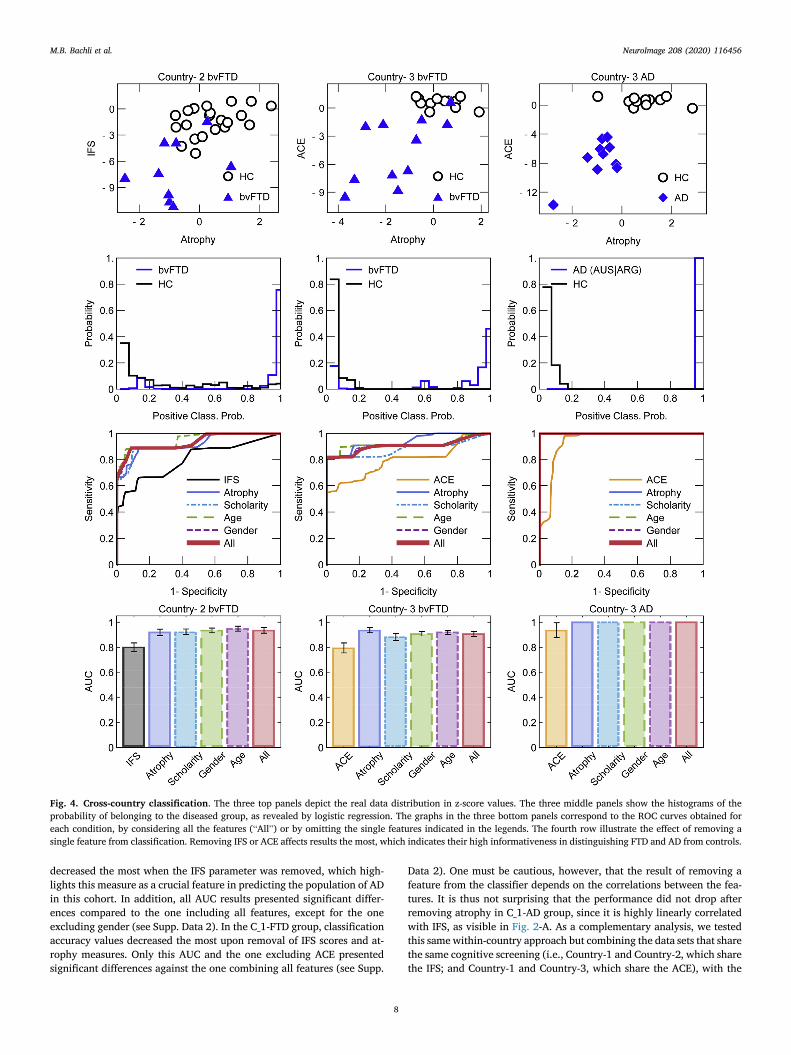
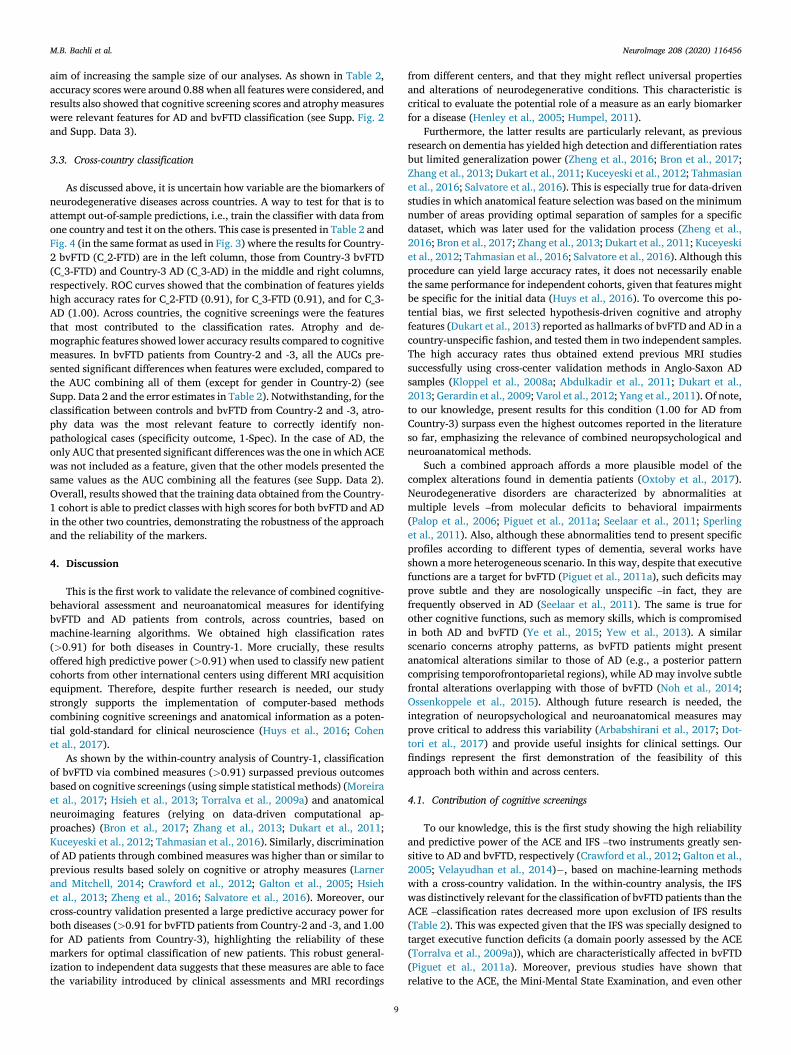
Fig. 4. Cross-country classification. The three top panels depict the real data distribution in z-score values. The three middle panels show the histograms of theprobability of belonging to the diseased group, as revealed by logistic regression. The graphs in the three bottom panels correspond to the ROC curves obtained foreach condition, by considering all the features (“All”) or by omitting the single features indicated in the legends. The fourth row illustrate the effect of removing asingle feature from classification. Removing IFS or ACE affects results the most, which indicates their high informativeness in distinguishing FTD and AD from controls.
M.B. Bachli et al. NeuroImage 208 (2020) 116456
decreased the most when the IFS parameter was removed, which high-lights this measure as a crucial feature in predicting the population of ADin this cohort. In addition, all AUC results presented significant differ-ences compared to the one including all features, except for the oneexcluding gender (see Supp. Data 2). In the C_1-FTD group, classificationaccuracy values decreased the most upon removal of IFS scores and at-rophy measures. Only this AUC and the one excluding ACE presentedsignificant differences against the one combining all features (see Supp.
8
Data 2). One must be cautious, however, that the result of removing afeature from the classifier depends on the correlations between the fea-tures. It is thus not surprising that the performance did not drop afterremoving atrophy in C_1-AD group, since it is highly linearly correlatedwith IFS, as visible in Fig. 2-A. As a complementary analysis, we testedthis same within-country approach but combining the data sets that sharethe same cognitive screening (i.e., Country-1 and Country-2, which sharethe IFS; and Country-1 and Country-3, which share the ACE), with the
M.B. Bachli et al. NeuroImage 208 (2020) 116456
aim of increasing the sample size of our analyses. As shown in Table 2,accuracy scores were around 0.88 when all features were considered, andresults also showed that cognitive screening scores and atrophy measureswere relevant features for AD and bvFTD classification (see Supp. Fig. 2and Supp. Data 3).
3.3. Cross-country classification
As discussed above, it is uncertain how variable are the biomarkers ofneurodegenerative diseases across countries. A way to test for that is toattempt out-of-sample predictions, i.e., train the classifier with data fromone country and test it on the others. This case is presented in Table 2 andFig. 4 (in the same format as used in Fig. 3) where the results for Country-2 bvFTD (C_2-FTD) are in the left column, those from Country-3 bvFTD(C_3-FTD) and Country-3 AD (C_3-AD) in the middle and right columns,respectively. ROC curves showed that the combination of features yieldshigh accuracy rates for C_2-FTD (0.91), for C_3-FTD (0.91), and for C_3-AD (1.00). Across countries, the cognitive screenings were the featuresthat most contributed to the classification rates. Atrophy and de-mographic features showed lower accuracy results compared to cognitivemeasures. In bvFTD patients from Country-2 and -3, all the AUCs pre-sented significant differences when features were excluded, compared tothe AUC combining all of them (except for gender in Country-2) (seeSupp. Data 2 and the error estimates in Table 2). Notwithstanding, for theclassification between controls and bvFTD from Country-2 and -3, atro-phy data was the most relevant feature to correctly identify non-pathological cases (specificity outcome, 1-Spec). In the case of AD, theonly AUC that presented significant differences was the one in which ACEwas not included as a feature, given that the other models presented thesame values as the AUC combining all the features (see Supp. Data 2).Overall, results showed that the training data obtained from the Country-1 cohort is able to predict classes with high scores for both bvFTD and ADin the other two countries, demonstrating the robustness of the approachand the reliability of the markers.
4. Discussion
This is the first work to validate the relevance of combined cognitive-behavioral assessment and neuroanatomical measures for identifyingbvFTD and AD patients from controls, across countries, based onmachine-learning algorithms. We obtained high classification rates(>0.91) for both diseases in Country-1. More crucially, these resultsoffered high predictive power (>0.91) when used to classify new patientcohorts from other international centers using different MRI acquisitionequipment. Therefore, despite further research is needed, our studystrongly supports the implementation of computer-based methodscombining cognitive screenings and anatomical information as a poten-tial gold-standard for clinical neuroscience (Huys et al., 2016; Cohenet al., 2017).
As shown by the within-country analysis of Country-1, classificationof bvFTD via combined measures (>0.91) surpassed previous outcomesbased on cognitive screenings (using simple statistical methods) (Moreiraet al., 2017; Hsieh et al., 2013; Torralva et al., 2009a) and anatomicalneuroimaging features (relying on data-driven computational ap-proaches) (Bron et al., 2017; Zhang et al., 2013; Dukart et al., 2011;Kuceyeski et al., 2012; Tahmasian et al., 2016). Similarly, discriminationof AD patients through combined measures was higher than or similar toprevious results based solely on cognitive or atrophy measures (Larnerand Mitchell, 2014; Crawford et al., 2012; Galton et al., 2005; Hsiehet al., 2013; Zheng et al., 2016; Salvatore et al., 2016). Moreover, ourcross-country validation presented a large predictive accuracy power forboth diseases (>0.91 for bvFTD patients from Country-2 and -3, and 1.00for AD patients from Country-3), highlighting the reliability of thesemarkers for optimal classification of new patients. This robust general-ization to independent data suggests that these measures are able to facethe variability introduced by clinical assessments and MRI recordings
9
from different centers, and that they might reflect universal propertiesand alterations of neurodegenerative conditions. This characteristic iscritical to evaluate the potential role of a measure as an early biomarkerfor a disease (Henley et al., 2005; Humpel, 2011).
Furthermore, the latter results are particularly relevant, as previousresearch on dementia has yielded high detection and differentiation ratesbut limited generalization power (Zheng et al., 2016; Bron et al., 2017;Zhang et al., 2013; Dukart et al., 2011; Kuceyeski et al., 2012; Tahmasianet al., 2016; Salvatore et al., 2016). This is especially true for data-drivenstudies in which anatomical feature selection was based on the minimumnumber of areas providing optimal separation of samples for a specificdataset, which was later used for the validation process (Zheng et al.,2016; Bron et al., 2017; Zhang et al., 2013; Dukart et al., 2011; Kuceyeskiet al., 2012; Tahmasian et al., 2016; Salvatore et al., 2016). Although thisprocedure can yield large accuracy rates, it does not necessarily enablethe same performance for independent cohorts, given that features mightbe specific for the initial data (Huys et al., 2016). To overcome this po-tential bias, we first selected hypothesis-driven cognitive and atrophyfeatures (Dukart et al., 2013) reported as hallmarks of bvFTD and AD in acountry-unspecific fashion, and tested them in two independent samples.The high accuracy rates thus obtained extend previous MRI studiessuccessfully using cross-center validation methods in Anglo-Saxon ADsamples (Kloppel et al., 2008a; Abdulkadir et al., 2011; Dukart et al.,2013; Gerardin et al., 2009; Varol et al., 2012; Yang et al., 2011). Of note,to our knowledge, present results for this condition (1.00 for AD fromCountry-3) surpass even the highest outcomes reported in the literatureso far, emphasizing the relevance of combined neuropsychological andneuroanatomical methods.
Such a combined approach affords a more plausible model of thecomplex alterations found in dementia patients (Oxtoby et al., 2017).Neurodegenerative disorders are characterized by abnormalities atmultiple levels –from molecular deficits to behavioral impairments(Palop et al., 2006; Piguet et al., 2011a; Seelaar et al., 2011; Sperlinget al., 2011). Also, although these abnormalities tend to present specificprofiles according to different types of dementia, several works haveshown a more heterogeneous scenario. In this way, despite that executivefunctions are a target for bvFTD (Piguet et al., 2011a), such deficits mayprove subtle and they are nosologically unspecific –in fact, they arefrequently observed in AD (Seelaar et al., 2011). The same is true forother cognitive functions, such as memory skills, which is compromisedin both AD and bvFTD (Ye et al., 2015; Yew et al., 2013). A similarscenario concerns atrophy patterns, as bvFTD patients might presentanatomical alterations similar to those of AD (e.g., a posterior patterncomprising temporofrontoparietal regions), while AD may involve subtlefrontal alterations overlapping with those of bvFTD (Noh et al., 2014;Ossenkoppele et al., 2015). Although future research is needed, theintegration of neuropsychological and neuroanatomical measures mayprove critical to address this variability (Arbabshirani et al., 2017; Dot-tori et al., 2017) and provide useful insights for clinical settings. Ourfindings represent the first demonstration of the feasibility of thisapproach both within and across centers.
4.1. Contribution of cognitive screenings
To our knowledge, this is the first study showing the high reliabilityand predictive power of the ACE and IFS –two instruments greatly sen-sitive to AD and bvFTD, respectively (Crawford et al., 2012; Galton et al.,2005; Velayudhan et al., 2014)�, based on machine-learning methodswith a cross-country validation. In the within-country analysis, the IFSwas distinctively relevant for the classification of bvFTD patients than theACE –classification rates decreased more upon exclusion of IFS results(Table 2). This was expected given that the IFS was specially designed totarget executive function deficits (a domain poorly assessed by the ACE(Torralva et al., 2009a)), which are characteristically affected in bvFTD(Piguet et al., 2011a). Moreover, previous studies have shown thatrelative to the ACE, the Mini-Mental State Examination, and even other
M.B. Bachli et al. NeuroImage 208 (2020) 116456
frontal screenings such as the Frontal Assessment Battery, the IFS provesbetter to discriminate bvFTD patients from controls and other pathol-ogies (Moreira et al., 2017; Torralva et al., 2009a; Gleichgerrcht et al.,2011). Regarding AD, although we expected a greater contribution fromthe ACE given its proven sensitivity for this condition (Larner andMitchell, 2014; Crawford et al., 2012; Galton et al., 2005; Hsieh et al.,2013), it was again the IFS that afforded the greatest discriminatorycontribution. This might partially reflect the heterogeneity in cognitiveand atrophy profiles of dementias, as discussed above (Palop et al., 2006;Piguet et al., 2011a; Seelaar et al., 2011; Sperling et al., 2011). Indeed,AD patients can also present with deficits in executive function (Seelaaret al., 2011) (even in early stages and previous to global cognition al-terations (Amieva et al., 2004; Sgaramella et al., 2001)), as well as frontalatrophy (Noh et al., 2014; Ossenkoppele et al., 2015) (which is morecommon with disease progression (Noh et al., 2014)). Furthermore, theIFS has systematically differentiated and discriminated AD patients fromhealthy controls (Torralva et al., 2009a; Bahia et al., 2018; Custodioet al., 2016; Moreira et al., 2014; Gleichgerrcht et al., 2011). Thus,though unexpected, the relevance of this instrument for identifying ADpatients aligns with previous evidence. Moreover, the classification ratesobtained when the ACE was considered with other features but not theIFS were high (0.86), and similar to previous studies that tested its(isolated) discriminative power (Larner and Mitchell, 2014; Crawfordet al., 2012; Galton et al., 2005; Hsieh et al., 2013).
Despite the partial missing data of these cognitive measures in thetwo independent cohorts, the cross-country validation approach showedthat classification of bvFTD from Country-2 was mainly driven by the IFS,whereas classification of both bvFTD and AD from Country-3 was mainlyinformed by the ACE. These findings constitute the first demonstration ofthe reliability and predictive power of these cognitive screenings to noveland unseen data from socio-culturally diverse contexts. Since cognitivescreenings are standardized instruments, they rely on predefined pro-cedures, norms, and scoring rules that help reducing bias and discrep-ancies in administration and interpretation (Hsieh et al., 2013; Torralvaet al., 2009a). This may explain the consistency of our results with bothtools across countries. Additionally, these instruments were speciallydesigned to target specific cognitive domains affected in each disease andprovide useful information in clinical settings. Moreover, their psycho-metric properties have been further evaluated and validated in severalworks (Larner and Mitchell, 2014; Crawford et al., 2012; Galton et al.,2005; Hsieh et al., 2013; Torralva et al., 2009a). Finally, these screeningshave yielded large differences between dementia patients and controlsfrom different origins (including both Anglo-Saxon and Latin Americaparticipants) (Hsieh et al., 2013; Bahia et al., 2018; Custodio et al., 2016;Jory et al., 2013), which underscores their reliability and consistency inthe face of socio-cultural diversity.
Briefly, our findings validated for the first time the application of theACE and IFS as robust and reliable markers to discriminate both bvFTDand AD patients from healthy controls based on machine-learning algo-rithms. Their combination allows covering, in a very short time, a largenumber of cognitive domains, even despite the complexity and vari-ability found across dementia subtypes.
4.2. Contribution of anatomical metrics
The contribution of brain atrophy measures to patient discriminationproved inconsistent. Although they were not as informative as cognitivescreenings in the within-country analyses, classification of bvFTDreached its peak upon their inclusion as a feature (0.92, when age was notconsidered). The same was true for these patients from Country-2 in thecross-country analysis, in which the combination of atrophy values andIFS scores yielded the highest discrimination accuracy (0.91). However,these data proved mostly irrelevant in every other analysis, especially foridentifying AD patients in the within-country analysis and both patho-logical groups in the cross-country analyses. In all of these, exclusion ofatrophy values did not affect the discrimination of patients from controls.
10
In the case of the within-country analysis, this may be due to the largeassociation found between atrophy values and the cognitive screeningscores in AD (see Fig. 2), which is in line with previous findings in thesepatients (Canu et al., 2017; Sorensen et al., 2016). Thus, given theirco-linear association, the novel information afforded by atrophy valuesmight, in some cases, prove marginal for classification compared to thecognitive tools.
Even though this explanation might also apply to the cross-countryfindings, inter-center variability in MRI equipment and acquisition pa-rameters needs to be considered, too. Between the training (Country-1)and the testing (Country-2, and -3) samples, there are several differencesregarding scanner models of the equipment (Philip Intera in Country-1,and Philip Achieva in Country �2 and �3), magnetic field intensity(1.5 T for Country-1, and 3 T for Country-2 and -3), and the parametersused in each center for the 3D T1 sequence. As previously shown, thesedifferences may affect the consistency of MRI sequences across centersfor classification analysis (Abdulkadir et al., 2011) –however, there arestudies showing that variability across centers is relatively low andcomparable (Sede~no et al., 2017; Biswal et al., 2010). Thus, the highervariance of neuroimaging data compared to cognitive screenings mayhave undermined its predictive power for independent and unseen co-horts. Hence, the standardized nature of cognitive instruments (Hsiehet al., 2013; Torralva et al., 2009a) may thus represent a clear advantagefor cross-country validation protocols. Yet, despite the mixed neuroan-atomical results, these features yielded discrimination values similar toprevious reports based on MRI images when cognitive values were notincluded in the cross-country analysis (Kloppel et al., 2008a; Abdulkadiret al., 2011; Dukart et al., 2013; Gerardin et al., 2009; Varol et al., 2012;Yang et al., 2011). Moreover, the contribution of atrophy results washighlighted by specificity outcomes, which showed that its removal af-fects these values the most, especially for bvFTD patients from thecross-country analysis. Therefore, this highlights the relevance ofneuroanatomical features for discriminating dementia patients, under-scoring the inclusion of neuroimaging automatized methods as potentialcomplementary tools for clinical settings.
4.3. Relevance of multimodal machine-learning approach
Although further studies comparing our machine-learning approachwith other data-driven and automatic strategies are needed, our findingsrepresent a potential milestone regarding the clinical implementation ofmachine-learning algorithms. Currently, timely detection of bvFTD andAD involves several challenges: varying levels of expertise and trainingfrom clinicians, non-systematic confirmation from clinical routine-MRIvia visual inspection (Kloppel et al., 2008b, 2012; Koikkalainen et al.,2016), variability of clinical and atrophy patterns, a certain degree ofsubjective interpretation and evaluation of signs and symptoms (Parraet al., 2018; Forman et al., 2006b), and strong variability of these factorsacross countries and centers. Against this framework, our approach un-derscores the reliability and predictive power of cognitive screenings andquantitative anatomical measures. Their combination yielded high clas-sification rates for both conditions (bvFTD and AD). In addition, thesemeasures showed great generalization power, indicating that they wereable to precisely identify whether a new and unseen participant belongsto a given pathological group. Given the complexity and multi-level na-ture of alterations on the neurodegenerative process (Palop et al., 2006;Piguet et al., 2011a; Seelaar et al., 2011; Sperling et al., 2011), it is notexpected that only one type of biomarker could be enough to highlydiscriminate patients (Dukart et al., 2013; McMillan et al., 2014). Ourfindings support this view, as they testify to the relevance of combiningcognitive screening and atrophy measures for the discrimination of thesedementias.
On the other hand, these features also showed consistency to facewithin- and cross-country variability. The socio-cultural heterogeneity ofour Latin American and Anglo-Saxon participants was further marked bydivergences in equipment and acquisition parameters. Thus, our high
M.B. Bachli et al. NeuroImage 208 (2020) 116456
classification results suggest that cognitive screening and atrophy mea-sures are robust against the variability that characterized individualizedclinical assessments. This is an essential characteristic of a potential earlybiomarker (Henley et al., 2005; Humpel, 2011), as it might reflectsensitivity to potentially universal properties of each condition.
Regarding the machine-learning algorithm applied, we used a verysimple but powerful one (namely, logistic regression) to test the validityof the cognitive screenings and MRI information, which yielded highdiscrimination rates (>90) that were consistent and reliable in thecontext of a cross-center validation approach. We did not attempt anyregularization procedure (we used the default parameters of the model)because we did not face any overfitting problem. Moreover, given ourfindings, we did not perform a direct comparison with other machine-learning algorithms because using a simple and fast one with itsdefault parameters helps to promote its generalization and highlight itspotential scalability. Further studies might compare the performance ofdifferent algorithms, and test their generalization power but consideringa trade-off between the cost and benefit of each model.
Biomarkers should be low-cost, affordable, and massively applicable(Henley et al., 2005; Humpel, 2011), which is especially relevant fordeveloping countries given their minimal mental health infrastructure,and lack of standardized diagnostic procedures (Parra et al., 2018).Against this background, cognitive screenings emerge as potential can-didates given that they are cost-effective, quick (they are completed in10–15 min), easy to implement and learn for clinicians, and, hence,broadly applicable in primary care levels (Crawford et al., 2012; Galtonet al., 2005; Hsieh et al., 2013; Torralva et al., 2009a). Moreover, theapplication of similar digital version of these tasks, such as the Cam-bridge Neuropsychological Test Automated Battery (CANTAB, https://www.cambridgecognition.com/cantab) (Barnett et al., 2016; Gie-draitiene and Kaubrys, 2019; Janssen et al., 2014; Smith et al., 2013)(offering an automatized platform for administration and scoring) wouldallow for more efficient and faster transferring of clinical data to amachine-learning model already implemented, leading to a comprehen-sive report with the results of the model. Also, structural MRI is anon-invasive method, usually included as a routine exam for dementias,and it proves less time-consuming than other neuroimaging modalities(such as positron emission tomography, functional, anddiffusion-weighted MR imaging (Kloppel et al., 2008a; Dukart et al.,2011; Dukart et al., 2013; McMillan et al., 2014; Moller et al., 2016)).Although its availability in developing countries is limited compared tohigh-income countries (Parra et al., 2018), the implementation ofquantitative analysis of MRI data can be beneficial for patients who haveaccess to a more complete medical coverage, and especially for thosewhose cognitive screenings and clinical evaluation yield inconclusiveresults.
Finally, our study showed the potential translational relevance ofautomatic image quantification methods that are sensitive to subtle brainalterations which escape the naked eye or even traditional univariatemethods (Orru et al., 2012). In addition, our results also underscore thepotential clinical implementation of computerized decision-support ap-proaches (such as machine-learning algorithms) given that they allowcharacterizations at the individual level, which could be useful fordiagnosis and treatment decisions (Orru et al., 2012).
4.4. Limitations and future directions
First, each sample had a moderate size; yet, similar (and smaller) sizeshave been used in previous works (Crawford et al., 2012; Sede~no et al.,2017; Salvatore et al., 2016), and the consistency of our results suggeststhat they were not biased by power issues. Second, the patients’ diagnosiswas based on clinical evaluations without pathological/genetic confir-mation. However, this approach is similar to previous studies (Bron et al.,2017; Zhang et al., 2013; Dukart et al., 2011; Kuceyeski et al., 2012;Tahmasian et al., 2016; Zhou et al., 2010; Salvatore et al., 2016) yieldingcompatible results. Moreover, the research centers from this work are
11
specialized in the diagnosis, treatment and study of dementia, and theyfollowed validated protocols and diagnostic guidelines (combining clin-ical information, neuroimaging data, and neuropsychological assess-ments). Third, from a technical viewpoint, our hypothesis-drivenapproach for estimating atrophy metrics could miss relevant informationthat is outside the predefined mask –especially compared to awhole-brain data driven approach. Yet, atrophy regions were selectedbased on robust evidence (Piguet et al., 2011a; Rascovsky et al., 2011;Ibanez and Manes, 2012; Schroeter et al., 2007; Du et al., 2007; Whitwellet al., 2011; Pini et al., 2016), and our procedure avoids bias regardingfeature selection and allows testing the generalization power of atrophylevels in independent cohorts (Dukart et al., 2013). Future studies shouldcompare the performance of our machine-learning pipeline with oneemploying a data-driven feature selection strategy. Fourth, given theabsence of AD patients from Country-2, we were not able to perform across-validation analysis between dementia subtypes. However, giventhat our study was based on cognitive screenings and main atrophy areasof AD and bvFTD, our goal was to test their generalization power todiscriminate patients from healthy controls given its feasibility to beimplemented in different contexts (for example, both high- orlow-income countries). Nevertheless, future research should test whetherthis and similar features could be used to discriminate different dementiasubtypes based on a cross-center validation approach. In this sense,regarding the potential clinical application of our approach, futurestudies should: (i) check for inter-relations between classification resultsand each patient’s functional severity, progression, and response torehabilitation therapy; (ii) include functional connectivity measures,which have been proposed as potential biomarkers for dementia (Pievaniet al., 2011, 2014); (iii) evaluate whether digital cognitive tasks (such asthe CANTAB) also afford robust and reliable markers that generalize tonew and unseen data given their advantages over traditionalpen-and-paper screening tasks (automatization of administration andscoring); and (iv) be tested in pre-symptomatic patients to search formarkers in prodromal disease stages, and also in the comparison betweendifferent subtypes of dementias.
5. Conclusion
Our study is the first to use machine-learning algorithms to show thehigh classification rates (>0.91) obtained from the combination ofcognitive screenings and quantitative neuroanatomical measures foridentifying bvFTD and AD patients across three countries. Moreover, ourresults presented a robust generalization power (>0.91), validated withtwo independent samples from different countries, which underscoresthe reliability of these measures to new, unseen data from heterogeneouscontexts. Therefore, although further research is needed, our work sup-ports the implementation of computer-based methods combining thesemeasures as a potential affordable and complementary tool with clinicalvalue for individual diagnosis and treatment decisions.
Funding sources
This work was supported by the Jagellonian University-UNSAMCooperation Agreement, as well as the CEUNIM-INCYT-CEMSC3
Collaboration Agreement. JKO was supported by the Grant DEC-2015/17/D/ST2/03492 of the National Science Centre (Poland). DRC wassupported in part by CONICET (Argentina) and Escuela de Ciencia yTecnología, UNSAM. AI is supported by grants from CONICET; CON-ICYT/FONDECYT Regular (1170010); FONDAP 15150012; the Inter-American Development Bank (IDB); PICT, Grant/Award Number: 2017-1818 and 2017-1820; the INECO Foundation, by the National InstituteOn Aging of the National Institutes of Health under Award NumberR01AG057234, and by GBHI ALZ UK-20-639295. PR and DM are sup-ported by COLCIENCIAS grant 697-2014. JF is supported by COLCIEN-CIAS grant 110674455314. This work was also supported in part byfunding to Forefront, a collaborative research group specialized in the
M.B. Bachli et al. NeuroImage 208 (2020) 116456
study of frontotemporal dementia and motor neurone disease, from theNational Health and Medical Research Council (NHMRC) of Australiaprogram grant (APP1037746) and the Australian Research Council(ARC) Centre of Excellence in Cognition and its Disorders Memory Pro-gram (CE110001021). FK is supported by an NHMRC-ARC DementiaResearch Development Fellowship (APP1097026). OP is supported by anNHMRC Senior Research Fellowship (APP1103258). AS is supported byFONDAP Program Grant 15150012
Declarations of competing interest
None.
Acknowledgments
JKO thanks Valeria Pattacini from the Office of International Re-lations of Universidad de SanMartín, UNSAM, (Argentina) for facilitatinghis visit and the UNSAM’s hospitality. The authors are grateful to MarcinOchab for valuable discussions. We thank the participants and theirfamilies for being involved in this research.
Appendix A. Supplementary data
Supplementary data to this article can be found online at https://doi.org/10.1016/j.neuroimage.2019.116456.
References
Abdulkadir, A., Mortamet, B., Vemuri, P., et al., 2011. Effects of hardware heterogeneityon the performance of SVM Alzheimer’s disease classifier. Neuroimage 58 (3),785–792.
Amieva, H., Lafont, S., Rouch-Leroyer, I., et al., 2004. Evidencing inhibitory deficits inAlzheimer’s disease through interference effects and shifting disabilities in the Strooptest. Arch. Clin. Neuropsychol. : Off. J. Natl. Acad. Neuropsychologists 19 (6),791–803.
Arbabshirani, M.R., Plis, S., Sui, J., Calhoun, V.D., 2017. Single subject prediction of braindisorders in neuroimaging: promises and pitfalls. Neuroimage 145 (Pt B), 137–165.
Baez, S., Couto, B., Torralva, T., et al., 2014. Comparing moral judgments of patients withfrontotemporal dementia and frontal stroke. JAMA neurology 71 (9), 1172–1176.
Baez, S., Manes, F., Huepe, D., et al., 2014. Primary empathy deficits in frontotemporaldementia. Front. Aging Neurosci. 6, 262.
Baez, S., Kanske, P., Matallana, D., et al., 2016. Integration of intention and outcome formoral judgment in frontotemporal dementia: brain structural signatures.Neurodegener. Dis. 16 (3–4), 206–217.
Baez, S., Morales, J.P., Slachevsky, A., et al., 2016. Orbitofrontal and limbic signatures ofempathic concern and intentional harm in the behavioral variant frontotemporaldementia. Cortex. J. Devoted. Stud. Nerv. Syst. Behav. 75, 20–32.
Baez, S., Pinasco, C., Roca, M., et al., 2019. Brain structural correlates of executive andsocial cognition profiles in behavioral variant frontotemporal dementia and elderlybipolar disorder. Neuropsychologia 18 (126), 159–169. https://doi.org/10.1016/j.neuropsychologia.2017.02.012.
Bahia, V.S., Cecchini, M.A., Cassimiro, L., et al., 2018. The Accuracy of INECO FrontalScreening in the Diagnosis of Executive Dysfunction in Frontotemporal Dementia andAlzheimer Disease. Alzheimer Disease and Associated Disorders.
Barnett, J.H., Blackwell, A.D., Sahakian, B.J., Robbins, T.W., 2016. The paired associateslearning (PAL) test: 30 Years of CANTAB translational neuroscience from laboratoryto bedside in dementia research. Curr. Top. Behav. Neurosci. 28, 449–474.
Biswal, B.B., Mennes, M., Zuo, X.N., et al., 2010. Toward discovery science of humanbrain function. Proc. Natl. Acad. Sci. U. S. A 107 (10), 4734–4739.
Bron, E.E., Smits, M., Papma, J.M., et al., 2017. Multiparametric computer-aideddifferential diagnosis of Alzheimer’s disease and frontotemporal dementia usingstructural and advanced MRI. Eur. Radiol. 27 (8), 3372–3382.
Canu, E., Agosta, F., Mandic-Stojmenovic, G., et al., 2017. Multiparametric MRI todistinguish early onset Alzheimer’s disease and behavioural variant offrontotemporal dementia. Neuroimage. Clin. 15, 428–438.
Cohen, J.D., Daw, N., Engelhardt, B., et al., 2017. Computational approaches to fMRIanalysis. Nat. Neurosci. 20 (3), 304–313.
Crawford, S., Whitnall, L., Robertson, J., Evans, J.J., 2012. A systematic review of theaccuracy and clinical utility of the Addenbrooke’s Cognitive Examination and theAddenbrooke’s Cognitive Examination-Revised in the diagnosis of dementia. Int. J.Geriatr. Psychiatry 27 (7), 659–669.
Custodio, N., Herrera-Perez, E., Lira, D., et al., 2016. Evaluation of the INECO frontalscreening and the frontal assessment battery in Peruvian patients with alzheimer’sdisease and behavioral variant frontotemporal dementia. eNeurologicalSci 5, 25–29.
DeLong, E.R., DeLong, D.M., Clarke-Pearson, D.L., 1988. Comparing the areas under twoor more correlated receiver operating characteristic curves: a nonparametricapproach. Biometrics 44 (3), 837–845.
12
Dottori, M., Sedeno, L., Martorell Caro, M., et al., 2017. Towards affordable biomarkers offrontotemporal dementia: a classification study via network’s information sharing.Sci. Rep. 7 (1), 3822.
Du, A.T., Schuff, N., Kramer, J.H., et al., 2007. Different regional patterns of corticalthinning in Alzheimer’s disease and frontotemporal dementia. Brain. J. Neurol. 130(Pt 4), 1159–1166.
Duda RO, Hart PE, Stork DG. Pattern Classification. Wiley, editor2001.Dukart, J., Mueller, K., Horstmann, A., et al., 2011. Combined evaluation of FDG-PET and
MRI improves detection and differentiation of dementia. PLoS One 6 (3) e18111.Dukart, J., Mueller, K., Barthel, H., et al., 2013. Meta-analysis based SVM classification
enables accurate detection of Alzheimer’s disease across different clinical centersusing FDG-PET and MRI. Psychiatry Res. 212 (3), 230–236.
Fawcett, T., 2006. An introduction to ROC analysis. Pattern Recognit. Lett. 27, 861–874.Forman, M.S., Farmer, J., Johnson, J.K., et al., 2006. Frontotemporal dementia:
clinicopathological correlations. Ann. Neurol. 59 (6), 952–962.Forman, M.S., Farmer, J., Johnson, J.K., et al., 2006. Frontotemporal dementia:
clinicopathological correlations. Ann. Neurol. 59 (6), 952–962.Fox, N.C., Schott, J.M., 2004. Imaging cerebral atrophy: normal ageing to Alzheimer’s
disease. Lancet 363 (9406), 392–394.Galton, C.J., Erzinclioglu, S., Sahakian, B.J., et al., 2005. A comparison of the
Addenbrooke’s Cognitive Examination (ACE), conventional neuropsychologicalassessment, and simple MRI-based medial temporal lobe evaluation in the earlydiagnosis of Alzheimer’s disease. Cogn. Behav. Neurol. : official journal of the Societyfor Behavioral and Cognitive Neurology 18 (3), 144–150.
Gengsheng, Q., Hotilovac, L., 2008. Comparison of non-parametric confidence intervalsfor the area under the ROC curve of a continuous-scale diagnostic test. Stat. MethodsMed. Res. 17 (2), 207–221.
Gerardin, E., Chetelat, G., Chupin, M., et al., 2009. Multidimensional classification ofhippocampal shape features discriminates Alzheimer’s disease and mild cognitiveimpairment from normal aging. Neuroimage 47 (4), 1476–1486.
Giedraitiene, N., Kaubrys, G., 2019. Distinctive pattern of cognitive disorders duringmultiple sclerosis relapse and recovery based on computerized CANTAB tests. Front.Neurol. 10, 572.
Gleichgerrcht, E., Roca, M., Manes, F., Torralva, T., 2011. Comparing the clinicalusefulness of the Institute of cognitive neurology (INECO) frontal screening (IFS) andthe frontal assessment battery (FAB) in frontotemporal dementia. J. Clin. Exp.Neuropsychol. 33 (9), 997–1004.
Hastie, T., Tibshirani, R., Friedman, J., 2009. An Introduction to Statistical Learning,second ed. Springer-Verlag, New York.
Henley, S.M., Bates, G.P., Tabrizi, S.J., 2005. Biomarkers for neurodegenerative diseases.Curr. Opin. Neurol. 18 (6), 698–705.
Hsieh, S., Schubert, S., Hoon, C., et al., 2013. Validation of the Addenbrooke’s CognitiveExamination III in frontotemporal dementia and Alzheimer’s disease. Dement.Geriatr. Cognit. Disord. 36 (3–4), 242–250.
Humpel, C., 2011. Identifying and validating biomarkers for Alzheimer’s disease. TrendsBiotechnol. 29 (1), 26–32.
Huys, Q.J., Maia, T.V., Frank, M.J., 2016. Computational psychiatry as a bridge fromneuroscience to clinical applications. Nat. Neurosci. 19 (3), 404–413.
Ibanez, A., Manes, F., 2012. Contextual social cognition and the behavioral variant offrontotemporal dementia. Neurology 78 (17), 1354–1362.
Ibanez, A., Cetkovich, M., Petroni, A., et al., 2012. The neural basis of decision-makingand reward processing in adults with euthymic bipolar disorder or attention-deficit/hyperactivity disorder (ADHD). PLoS One 7 (5) e37306.
International AsD, 2015. World Alzheimer Report 2015: the Global Impact of Dementia.Janssen, G., van Aken, L., De Mey, H., et al., 2014. Decline of executive function in a
clinical population: age, psychopathology, and test performance on the CambridgeNeuropsychological Test Automated Battery (CANTAB). Appl. Neuropsychol. Adult.21 (3), 210–219.
Johnson, J.K., Head, E., Kim, R., et al., 1999. Clinical and pathological evidence for afrontal variant of Alzheimer disease. Arch. Neurol. 56 (10), 1233–1239.
Jory, J.I., Bruna, A.A., Munoz-Neira, C., Chonchol, A.S., 2013. Chilean version of theINECO Frontal Screening (IFS-Ch): psychometric properties and diagnostic accuracy.Dementia. Neuropsychologia 7 (1), 40–47.
Kearns, M., Ron, D., 1999. Algorithmic stability and sanity-check bounds for leave-one-out cross-validation. Neural Comput. 11 (6), 1427–1453.
Kloppel, S., Stonnington, C.M., Chu, C., et al., 2008. Automatic classification of MR scansin Alzheimer’s disease. Brain : J. Neurol. 131 (Pt 3), 681–689.
Kloppel, S., Stonnington, C.M., Barnes, J., et al., 2008. Accuracy of dementia diagnosis: adirect comparison between radiologists and a computerized method. Brain : J.Neurol. 131 (Pt 11), 2969–2974.
Kloppel, S., Abdulkadir, A., Jack Jr., C.R., et al., 2012. Diagnostic neuroimaging acrossdiseases. Neuroimage 61 (2), 457–463.
Koikkalainen, J., Rhodius-Meester, H., Tolonen, A., et al., 2016. Differential diagnosis ofneurodegenerative diseases using structural MRI data. Neuroimage. Clin. 11,435–449.
Kuceyeski, A., Zhang, Y., Raj, A., 2012. Linking white matter integrity loss to associatedcortical regions using structural connectivity information in Alzheimer’s disease andfronto-temporal dementia: the Loss in Connectivity (LoCo) score. Neuroimage 61 (4),1311–1323.
Larner, A.J., Mitchell, A.J., 2014. A meta-analysis of the accuracy of the Addenbrooke’sCognitive Examination (ACE) and the Addenbrooke’s Cognitive Examination-Revised(ACE-R) in the detection of dementia. Int. Psychogeriatr. 26 (4), 555–563.
Mathuranath, P.S., Nestor, P.J., Berrios, G.E., et al., 2000. A brief cognitive test battery todifferentiate Alzheimer’s disease and frontotemporal dementia. Neurology 55 (11),1613–1620.

M.B. Bachli et al. NeuroImage 208 (2020) 116456
McKhann, G.M., Knopman, D.S., Chertkow, H., et al., 2011. The diagnosis of dementiadue to Alzheimer’s disease: recommendations from the National Institute on Aging-Alzheimer’s Association workgroups on diagnostic guidelines for Alzheimer’sdisease. Alzheimer’s & dementia. J. Alzheimers. Assoc. 7 (3), 263–269.
McMillan, C.T., Avants, B.B., Cook, P., et al., 2014. The power of neuroimagingbiomarkers for screening frontotemporal dementia. Hum. Brain Mapp. 35 (9),4827–4840.
Melloni, M., Billeke, P., Baez, S., et al., 2016. Your perspective and my benefit: multiplelesion models of self-other integration strategies during social bargaining. Brain : J.Neurol. 139 (11), 3022–3040.
Moller, C., Pijnenburg, Y.A., van der Flier, W.M., et al., 2016. Alzheimer disease andbehavioral variant frontotemporal dementia: automatic classification based oncortical atrophy for single-subject diagnosis. Radiology 279 (3), 838–848.
Moreira, H.S., Lima, C.F., Vicente, S.G., 2014. Examining executive dysfunction with theInstitute of cognitive neurology (INECO) frontal screening (IFS): normative valuesfrom a healthy sample and clinical utility in alzheimer’s disease. J. Alzheimer’s Dis. :JAD. 42 (1), 261–273.
Moreira, H.S., Costa, A.S., Castro, S.L., et al., 2017. Assessing executive dysfunction inneurodegenerative disorders: a critical review of brief neuropsychological tools.Front. Aging Neurosci. 9, 369.
Mueller, S.G., Schuff, N., Weiner, M.W., 2006. Evaluation of treatment effects inAlzheimer’s and other neurodegenerative diseases by MRI and MRS. NMR Biomed.19 (6), 655–668.
Nichols, T.E., Das, S., Eickhoff, S.B., et al., 2017. Best practices in data analysis andsharing in neuroimaging using MRI. Nat. Neurosci. 20 (3), 299–303.
Noh, Y., Jeon, S., Lee, J.M., et al., 2014. Anatomical heterogeneity of Alzheimer disease:based on cortical thickness on MRIs. Neurology 83 (21), 1936–1944.
Orru, G., Pettersson-Yeo, W., Marquand, A.F., et al., 2012. Using Support Vector Machineto identify imaging biomarkers of neurological and psychiatric disease: a criticalreview. Neurosci. Biobehav. Rev. 36 (4), 1140–1152.
Ossenkoppele, R., Pijnenburg, Y.A., Perry, D.C., et al., 2015. The behavioural/dysexecutive variant of Alzheimer’s disease: clinical, neuroimaging and pathologicalfeatures. Brain : J. Neurol. 138 (Pt 9), 2732–2749.
Oxtoby, N.P., Alexander, D.C., Euro, P.C., 2017. Imaging plus X: multimodal models ofneurodegenerative disease. Curr. Opin. Neurol. 30 (4), 371–379.
Padovani, A., Premi, E., Pilotto, A., et al., 2013. Overlap between frontotemporaldementia and Alzheimer’s disease: cerebrospinal fluid pattern and neuroimagingstudy. J. Alzheimer’s Dis. : JAD. 36 (1), 49–55.
Palop, J.J., Chin, J., Mucke, L., 2006. A network dysfunction perspective onneurodegenerative diseases. Nature 443 (7113), 768–773.
Parra, M.A., Baez, S., Allegri, R., et al., 2018. Dementia in Latin America: assessing thepresent and envisioning the future. Neurology 90 (5), 222–231.
Pievani, M., de Haan, W., Wu, T., et al., 2011. Functional network disruption in thedegenerative dementias. Lancet Neurol. 10 (9), 829–843.
Pievani, M., Filippini, N., van den Heuvel, M.P., et al., 2014. Brain connectivity inneurodegenerative diseases–from phenotype to proteinopathy. Nat. Rev. Neurol. 10(11), 620–633.
Piguet, O., Hornberger, M., Mioshi, E., Hodges, J.R., 2011. Behavioural-variantfrontotemporal dementia: diagnosis, clinical staging, and management. LancetNeurol. 10 (2), 162–172.
Piguet, O., Petersen, A., Yin Ka Lam, B., et al., 2011. Eating and hypothalamus changes inbehavioral-variant frontotemporal dementia. Ann. Neurol. 69 (2), 312–319.
Pini, L., Pievani, M., Bocchetta, M., et al., 2016. Brain atrophy in Alzheimer’s Disease andaging. Ageing Res. Rev. 30, 25–48.
Rascovsky, K., Hodges, J.R., Knopman, D., et al., 2011. Sensitivity of revised diagnosticcriteria for the behavioural variant of frontotemporal dementia. Brain : J. Neurol. 134(Pt 9), 2456–2477.
Salvatore, C., Battista, P., Castiglioni, I., 2016. Frontiers for the early diagnosis of AD bymeans of MRI brain imaging and support vector machines. Curr. Alzheimer Res. 13(5), 509–533.
Santamaria-Garcia, H., Reyes, P., Garcia, A., et al., 2016. First symptoms andneurocognitive correlates of behavioral variant frontotemporal dementia.J. Alzheimer’s Dis. : JAD. 54 (3), 957–970.
Santamaria-Garcia, H., Baez, S., Reyes, P., et al., 2017. A lesion model of envy andSchadenfreude: legal, deservingness and moral dimensions as revealed byneurodegeneration. Brain : J. Neurol. 140 (12), 3357–3377.
Schroeter, M.L., Raczka, K., Neumann, J., Yves von Cramon, D., 2007. Towards anosology for frontotemporal lobar degenerations-a meta-analysis involving 267subjects. Neuroimage 36 (3), 497–510.
13
Sedeno, L., Couto, B., Garcia-Cordero, I., et al., 2016. Brain network organization andsocial executive performance in frontotemporal dementia. J. Int. Neuropsychol. Soc. :JINS 22 (2), 250–262.
Sede~no, L., Piguet, O., Abrevaya, S., a, et al., 2017. Tackling variability: a multicenterstudy to provide a gold-standard network approach for frontotemporal dementia.Hum. Brain Mapp. 38 (8), 3804–3822. https://doi.org/10.1002/hbm.23627.
Seelaar, H., Rohrer, J.D., Pijnenburg, Y.A., et al., 2011. Clinical, genetic and pathologicalheterogeneity of frontotemporal dementia: a review. J. Neurol. Neurosurg. Psychiatry82 (5), 476–486.
Sgaramella, T.M., Borgo, F., Mondini, S., et al., 2001. Executive deficits appearing in theinitial stage of Alzheimer’s disease. Brain Cogn. 46 (1–2), 264–268.
Shah, H., Albanese, E., Duggan, C., et al., 2016. Research priorities to reduce the globalburden of dementia by 2025. Lancet Neurol. 15 (12), 1285–1294.
Shaw, L.M., Korecka, M., Clark, C.M., et al., 2007. Biomarkers of neurodegeneration fordiagnosis and monitoring therapeutics. Nat. Rev. Drug Discov. 6 (4), 295–303.
Smith, P.J., Need, A.C., Cirulli, E.T., et al., 2013. A comparison of the CambridgeAutomated Neuropsychological Test Battery (CANTAB) with "traditional"neuropsychological testing instruments. J. Clin. Exp. Neuropsychol. 35 (3), 319–328.
Sorensen, L., Igel, C., Liv Hansen, N., et al., 2016. Early detection of Alzheimer’s diseaseusing MRI hippocampal texture. Hum. Brain Mapp. 37 (3), 1148–1161.
Sperling, R.A., Aisen, P.S., Beckett, L.A., et al., 2011. Toward defining the preclinicalstages of Alzheimer’s disease: recommendations from the National Institute on Aging-Alzheimer’s Association workgroups on diagnostic guidelines for Alzheimer’sdisease. Alzheimer’s & dementia. J. Alzheimers. Assoc. 7 (3), 280–292.
Tahmasian, M., Shao, J., Meng, C., et al., 2016. Based on the network degenerationhypothesis: separating individual patients with different neurodegenerativesyndromes in a preliminary hybrid PET/MR study. J. Nucl. Med. 57 (3), 410–415.
Tong, T., Ledig, C., Guerrero, R., et al., 2017. Five-class differential diagnostics ofneurodegenerative diseases using random undersampling boosting. Neuroimage.Clin. 15, 613–624.
Torralva, T., Roca, M., Gleichgerrcht, E., et al., 2009. INECO Frontal Screening (IFS): abrief, sensitive, and specific tool to assess executive functions in dementia. J. Int.Neuropsychol. Soc. : JINS. 15 (5), 777–786.
Torralva, T., Roca, M., Gleichgerrcht, E., et al., 2009. A neuropsychological battery todetect specific executive and social cognitive impairments in early frontotemporaldementia. Brain : J. Neurol. 132 (Pt 5), 1299–1309.
Tzourio-Mazoyer, N., Landeau, B., Papathanassiou, D., et al., 2002. Automatedanatomical labeling of activations in SPM using a macroscopic anatomicalparcellation of the MNI MRI single-subject brain. Neuroimage 15 (1), 273–289.
Varol, E., Gaonkar, B., Erus, G., et al., 2012. Feature ranking based nested support vectormachine ensemble for medical image classification. In: Proceedings IEEEInternational Symposium on Biomedical Imaging, pp. 146–149.
Velayudhan, L., Ryu, S.H., Raczek, M., et al., 2014. Review of brief cognitive tests forpatients with suspected dementia. Int. Psychogeriatr. 26 (8), 1247–1262.
Wang, X., Ren, P., Mapstone, M., et al., 2019. Identify a shared neural circuit linkingmultiple neuropsychiatric symptoms with Alzheimer’s pathology. Brain. Imag.Behav. 13 (1), 53–64. https://doi.org/10.1007/s11682-017-9767-y.
Whitwell, J.L., Przybelski, S.A., Weigand, S.D., et al., 2009. Distinct anatomical subtypesof the behavioural variant of frontotemporal dementia: a cluster analysis study. Brain: J. Neurol. 132 (Pt 11), 2932–2946.
Whitwell, J.L., Jack Jr., C.R., Przybelski, S.A., et al., 2011. Temporoparietal atrophy: amarker of AD pathology independent of clinical diagnosis. Neurobiol. Aging 32 (9),1531–1541.
Yang, W., Lui, R.L., Gao, J.H., et al., 2011. Independent component analysis-basedclassification of Alzheimer’s disease MRI data. J. Alzheimer’s Dis. : JAD. 24 (4),775–783.
Ye, B.S., Choi, S.H., Han, S.H., et al., 2015. Clinical and neuropsychological comparisonsof early-onset versus late-onset frontotemporal dementia: a CREDOS-FTD study.J. Alzheimer’s Dis. : JAD. 45 (2), 599–608.
Yew, B., Alladi, S., Shailaja, M., et al., 2013. Lost and forgotten? Orientation versusmemory in Alzheimer’s disease and frontotemporal dementia. J. Alzheimer’s Dis. :JAD. 33 (2), 473–481.
Zhang, Y., Schuff, N., Camacho, M., et al., 2013. MRI markers for mild cognitiveimpairment: comparisons between white matter integrity and gray matter volumemeasurements. PLoS One 8 (6) e66367.
Zheng, C., Xia, Y., Pan, Y., Chen, J., 2016. Automated identification of dementia usingmedical imaging: a survey from a pattern classification perspective. Brain. Inf 3 (1),17–27.
Zhou, J., Greicius, M.D., Gennatas, E.D., et al., 2010. Divergent network connectivitychanges in behavioural variant frontotemporal dementia and Alzheimer’s disease.Brain : J. Neurol. 133 (5), 1352–1367.
Related Documents