EVALUATING THE PRIVATIZATION OF THE PORTUGUESE NATIONAL AIRLINE - TAP Jorge Miguel Valério e Cunha PROJECT REPORT Project submitted as partial requirement for the conferral of MSc in Finance Supervisor: Prof. Pedro Manuel de Sousa Leite Inácio, ISCTE Business School, Finance Department September 2015

Welcome message from author
This document is posted to help you gain knowledge. Please leave a comment to let me know what you think about it! Share it to your friends and learn new things together.
Transcript
EVALUATING THE PRIVATIZATION OF THE
PORTUGUESE NATIONAL AIRLINE - TAP
Jorge Miguel Valério e Cunha
PROJECT REPORT
Project submitted as partial requirement for the conferral of
MSc in Finance
Supervisor:
Prof. Pedro Manuel de Sousa Leite Inácio, ISCTE Business School, Finance
Department
September 2015

Evaluating the Privatization of the
Portuguese National Airline - TAP
i
Abstract
Portugal’s deficit economy during several years and the high levels of Public Debt
culminated with the need of an External Financial Assistance Program. Regarding this
program a privatization plan of several state-owned companies was developed, in
which TAP Group was included.
The main activity of TAP Group is air passenger and cargo transport. It also provides
services to third party customers in areas related to the Group’s core activities, such as
Maintenance and Engineering services.
The Letter of Intent sent by Portuguese Government to International Monetary Fund
(IMF), concerning the Portugal’s Financial Assistance Program, and the State Budget
for 2015 refer the need to restart the process of TAP privatization. On November 13th
of 2014, the Council of Ministers approved the re-privatization process of TAP.
Consequently, in order to sell TAP Group at its fair value, it is essential to perform a
financial corporate valuation. This way, in the next pages, it will be developed a
valuation of TAP, using three corporate valuation methods: Multiples (or Relative)
Analysis, Discounted Cash Flow method, using the Free Cash Flow for the Firm
approach and the Free Cash Flow for the Equity approach, and a valuation method
used to valuing firms with regular negative earnings, which is the case of TAP Group.
Considering the negative TAP’s fair value estimated in all methods, Portuguese
Government should simply transfer its capital and inherent obligations to the
investors. However, TAP is valuable if it becomes more efficient, which is expected
to occur in a privatization process.
JEL Classification: G32, L33
Keywords: Privatization, Corporate Valuation, Multiples Analysis, Discount Cash
Flow
Evaluating the Privatization of the
Portuguese National Airline - TAP
ii
Resumo
Portugal perante uma situação de endividamento excessivo e de uma economia
deficitária que perdurava há vários anos, solicitou um pedido de ajuda financeira
externa. Neste pedido de ajuda externa foi estabelecido um programa de alienação de
participações do Estado em empresas nacionais, sendo a TAP uma dessas empresas.
O Grupo TAP tem como principal atividade o transporte aéreo de passageiros e de
carga, bem como um conjunto de serviços prestados a entidades terceiras em áreas
ligadas aos negócios principais do Grupo.
Em novembro de 2014, foi deliberado em Conselho de Ministros o relançamento do
processo de privatização do Grupo TAP.
De modo a que o Grupo TAP seja vendido pelo seu justo valor, é imprescindível
realizar uma avaliação económico-financeira. Nas próximas páginas será realizada
uma avaliação ao Grupo, utilizando três métodos: análise pelos Múltiplos, o método
dos Fluxos de Caixa Descontados, quer na ótica dos Fluxos de Caixa Livres para a
Empresa, quer na ótica dos Fluxos de Caixa Livres para os Acionistas, e, por último,
um modelo de avaliação para empresas que apresentam sistematicamente resultados
negativos, como é o caso da TAP.
O justo valor estimado nos três métodos de avaliação para o Grupo TAP é negativo.
Assim, o Governo não deverá registar um encaixe financeiro com a operação,
cedendo apenas aos investidores a sua posição no capital social e as respetivas
obrigações do Grupo. Contudo, o Governo deve ter em conta que a TAP tem valor ao
tornar-se uma empresa mais eficiente, algo que é expectável numa privatização.
Classificação JEL: G32, L33
Palavras-chave: Privatização, Avaliação de Empresas, Múltiplos, Método dos Fluxos
de Caixa Descontados

Evaluating the Privatization of the
Portuguese National Airline - TAP
iii
Acknowledgements
I would like to thank all those who contributed to the achievement of this master
project.
First of all, my Supervisor, Professor Pedro Inácio who provided his time, knowledge
and support which was extremely important to conclude this project.
Finally, I would like to thank my family, girlfriend and friends for their support
because without them none of this would have been possible.
Evaluating the Privatization of the
Portuguese National Airline - TAP
iv
Table of Contents
Abstract ……………………………………...……………………………………..... i
Resumo ……………………………………...…………………………………….… ii
Acknowledgements ………………………………...………………………...…….. iii
Table of Contents …………………………..…………………………...…….....… iv
Index of Tables and Figures ………….………….………………………..……….. v
List of Acronyms ……..………………………..………………………...…...….... vii
Sumário Executivo ………………………………………………………...……... viii
1. Introduction ……………………………..……………………………………..… 1
2. Review of Literature ……………..……………………………………………..... 3
2.1 Corporate Valuation …………………………………………………………….. 3
2.2 Discounted Cash Flow Valuation ………………………………………………. 6
2.3 Multiples (or Relative) Valuation ………………………….................................. 9
2.4 Other Valuation Models ……………………………………………………… 10
3. Industry Overview ……………..………….........……….....…...………………. 13
4. TAP Group Description ……………………………………………...…….…... 17
5. TAP Group Valuation ………..……………………………...……………….… 20
5.1 Multiples Valuation Method …………………………….……………...……… 20
5.1.1 EV/EBITDA ……………………..………………………………….. 21
5.1.2 EV/EBITDAR ……………………..……………………..………….. 24
5.2 Discounted Cash Flow …………………………….……………...……….…… 27
5.2.1 Free Cash Flow for the Firm Approach ……………………………... 41
5.2.2 Free Cash Flow for the Equity Approach ………………………..….. 44
5.3 Valuation of Firms with negative earnings …………………………………..… 49
6. So, why Investors want TAP Group? ……………………………………….… 51
7. Conclusions …………………………………………………………………...… 57
7.1 The Proposals ………………...………………………….……………...……… 59
8. Bibliography ……………………………………….………………………...….. 63
9. Annexes …………………………………………………………………...……... 68
Evaluating the Privatization of the
Portuguese National Airline - TAP
v
Index of Tables and Figures
Table 1 – Main Differences between the Traditional Airlines and the LCCs …….... 15
Table 2 – EV/EBITDA and Enterprise Value …………………………………….... 21
Table 3 – TAP Enterprise Value ………………………………………………….... 22
Table 4 – TAP Group Non-Operating Assets ……………………………………..... 23
Table 5 – TAP Group Market Value of Debt ………………………………………. 23
Table 6 – TAP Group Equity Value using EV/EBITDA …………………………... 24
Table 7 – Comparables EV/EBITDAR …………………………………………….. 25
Table 8 – TAP Group Equity Value using EV/EBITDAR …………………………. 26
Table 9 – TAP Group Historical Revenue …………………………………………. 28
Table 10 – TAP Group Historical Revenue Growth .................................................. 29
Table 11 – System-wide Global commercial airlines revenue growth ....................... 29
Table 12 – System-wide Global commercial airlines RPK growth – Forecast .......... 29
Table 13 – TAP Group vs System-wide Global commercial airlines – Annual
Revenue Growth ......................................................................................................... 29
Table 14 – TAP Group estimated Revenues .............................................................. 31
Table 15 – TAP Group historical operational ratios .................................................. 32
Table 16 – TAP Group operational ratios – Forecast ................................................. 32
Table 17 – TAP Group historical implied Tax Rate ................................................... 33
Table 18 – TAP Group EBIT × (1-T) – Forecast …………………………………... 33
Table 19 – TAP Group NWCN .................................................................................. 34
Table 20 – TAP Group Net Fixed Assets ................................................................... 34
Table 21 – TAP Group Net Fixed Assets/Revenue and NWCN/Revenue ratios ....... 35
Table 22 – TAP Group Forecasted Net Fixed Assets and NWCN ............................. 35
Table 23 – Research: What do you use for the risk-free rate? ................................... 37
Table 24 – Beta’s Inputs ............................................................................................. 39
Table 25 – TAP Group Cost of Equity ……………………………………………... 40
Table 26 – TAP Group Cost of Debt …………………………………………..…… 40
Table 27 – TAP Group WACC …………………………………………………..… 41
Table 28 – TAP Group FCFF …………………………………………………….… 42
Table 29 – Average Yearly Inflation rate …...…………………………………….... 43
Table 30 – TAP Group Terminal Value (FCFF approach) ……………………….... 43
Evaluating the Privatization of the
Portuguese National Airline - TAP
vi
Table 31 – TAP Group Equity Value (FCFF approach) ………………………….... 44
Table 32 – TAP Group Historical Debt …………………………………………….. 45
Table 33 – TAP Group Debt/Sales Ratio ………………………………………...… 45
Table 34 – TAP Group Debt – Forecast ………………………………………….… 46
Table 35 – TAP Group Interest Expense – Forecast ……………………………….. 46
Table 36 – TAP Group estimated FCFE …………………………………………… 46
Table 37 – TAP Group Terminal Value (FCFE approach) ………………………… 47
Table 38 – TAP Group Equity Value (FCFE approach) ………………………….... 47
Table 39 – TAP Group Historical ROIC …………………………………………… 50
Table 40 - TAP Group Fair Value (Valuing companies with negative earnings
method) …………………………………………………………………………...… 50
Table 41 – Summary: TAP Group Fair Value ……………………………………… 51
Table 42 – Sensitivity Analysis: Revenues ……………………………………….... 53
Table 43 – Sensitivity Analysis: EBITDA/Revenues …………………………….... 54
Table 44 – Operating Margin of Comparable Companies ……………………….… 55
Table 45 - TAP Group Fair value …………………………………………………... 57
Table 46 - TAP Group Balance Sheet …………………………………………….... 68
Table 47 - TAP Group Profit and Loss Statement …………………………………. 69
Table 48 – Historical Growth Rates – Air Transport industry …………………...… 70
Table 49 – Unlevered beta in Europe – Air Transport industry ……………………. 70
Table 50 – Market debt to equity – Air Transport industry ………………………... 71
Table 51 – Historical evolution of TAP’s EBITDAR ………………………….…... 73
Figure 1 – Airline Industry Expansion in the past 40 years ……………………...… 13
Figure 2 – Different stages of development of Travel markets ………………….…. 14
Figure 3 – Change in intra-European passenger market shares, 2000-2010 ……….. 15
Figure 4 – % of Private and Government-owned Airlines by Region ……………... 16
Figure 5 – TAP Group Structure ………………………………………………….... 18
Figure 6 – Germany Generic Government 10 year yield …………………………... 71
Figure 7 – EUR-USD exchange rate ……………….……………………………..... 71
Figure 8 – Inflation rate – Portugal ……………………………………………….... 72
Figure 9 – Comparables EV/EBITDA ……………………………………………... 72
Evaluating the Privatization of the
Portuguese National Airline - TAP
vii
List of Acronyms
ACMI – Aircraft, Crew, Maintenance and Insurance
APV – Adjusted Present Value
BRIC – Brazil, Russia, India and China
CAPM – Capital Asset Pricing Model
CF – Cash Flow
DCF – Discounted Cash Flow
EC – European Commission
ECB – European Central Bank
EBIT – Earnings Before Interest and Taxes
EBITDA – Earnings Before Interest, Taxes, Depreciation and Amortization
EBITDAR – Earnings Before Interest, Taxes, Depreciation, Amortization and Rent
EUR – Euro
EV – Enterprise Value
FCFE – Free Cash Flow for the Equity
FCFF – Free Cash Flow for the Firm
GDP – Gross Domestic Product
ICAO – International Civil Aviation Organization
IMF – International Monetary Fund
IAG – International Airlines Group
IATA – International Air Transport Association
JEL – Journal of Economic Literature
LCCs – Low-Cost Carriers
MoU – Memorandum of Understanding
NWCN – Net Working Capital Needs
OECD – Organisation for Economic Co-operation and Development
PER – Price Earnings Ratio
P/L – Profit and Loss Statement
ROIC – Return on Invested Capital
RPK – Revenue Passenger Kilometers
TAP – Transportes Aéreos Portugueses
TV – Terminal Value
USD – United States Dollar
WACC – Weighted Average Cost of Capital
Evaluating the Privatization of the
Portuguese National Airline - TAP
viii
Sumário Executivo
O MoU assinado, em maio de 2011, pelo Governo Português com o FMI, a Comissão
Europeia e o Banco Central Europeu, no âmbito do Programa de Assistência
Financeira, foi o ponto de partida para um conjunto de privatizações de empresas
públicas, bem como, para a venda de determinadas participações minoritárias em
outras empresas. Este memorando resulta de uma economia deficitária que já
perdurava há demasiados anos em Portugal e de uma situação de endividamento
excessivo.
Assim, nos últimos três anos, algumas empresas públicas iniciaram um processo de
privatização, como foi o caso da Energias de Portugal, S.A. e os CTT – Correios de
Portugal, S.A. Por outro lado, havia um conjunto de empresas públicas que vinham
sendo constantemente mencionadas pelo Governo Português e pelos media, que
brevemente iriam seguir o mesmo caminho, como foi o caso do Grupo TAP.
O Grupo TAP tem como principal atividade o transporte aéreo de passageiros e de
carga, bem como um conjunto de serviços prestados a entidades terceiras em áreas
ligadas aos negócios principais do Grupo, tais como serviços de Manutenção e
Engenharia. O Grupo TAP era detido a 100% pela Parpública Participações Públicas,
SGPS, S.A., uma sociedade gestora de participações sociais de capitais
exclusivamente públicos.
Desta forma, considerando o impacto que o Grupo TAP tem na economia portuguesa
e na vida dos portugueses e, uma vez que, nos últimos anos, o processo de
privatização do Grupo TAP tem sido discutido frequentemente, o objetivo deste
projeto de mestrado é calcular o valor do Grupo TAP, de forma apurar qual é o valor
do Grupo, para que se possa vender o Grupo TAP por um preço que seja bom para
todos os stakeholders envolvidos neste processo. Assim, para determinar o valor do
Grupo TAP serão utilizados três métodos de avaliação de empresas: a avaliação pelos
múltiplos, o método dos Fluxos de Caixa Descontados, quer na ótica dos Fluxos de
Caixa Livres para a Empresa, quer na ótica dos Fluxos de Caixa Livres para os
Acionistas, e, por último, um modelo de avaliação para empresas que apresentam, de
forma sistemática, resultados negativos, como tem sido o caso do Grupo TAP. A
Evaluating the Privatization of the
Portuguese National Airline - TAP
ix
avaliação pelos múltiplos, tem como base determinados rácios de empresas
concorrentes, enquanto, os outros dois modelos têm em atenção a situação económica
e financeira da empresa sob avaliação, tendo, no caso específico do DCF, uma
especial atenção à capacidade de a empresa gerar fluxos de caixa positivos no futuro.
Em 2012, o Grupo Synergy, detido pelo empresário German Efromovich, através da
sua subsidiária, a Synergy Aerospace, formalizou uma proposta para aquisição da
TAP. Esta proposta foi rejeitada pelo Governo Português. Mais recentemente, em
novembro de 2014, o Conselho de Ministros aprovou a reprivatização do Grupo TAP,
através da privatização de 66% do capital social do Grupo, onde 61% do capital é
afeto a investidores nacionais ou estrangeiros e os restantes 5% do capital é alocado
para os trabalhadores do Grupo que pretendam adquirir uma participação na empresa.
Numa fase avançada deste novo processo de privatização do Grupo TAP participaram
três grupos de investidores: o Grupo Synergy do empresário German Efromovich, a
Quifel Holdings, detida pelo empresário português Pais do Amaral e o consórcio
Gateway, detido em 50,1% pelo português Humberto Pedrosa, dono da Barraqueiro, e
por David Neeleman, fundador da empresa de aviação Azul e JetBlue.
Na fase de ofertas vinculativas, apenas as propostas do Grupo Synergy e do consórcio
Gateway foram consideradas, com a decisão do Governo a pender para a proposta do
consórcio Gateway como grande vencedora na corrida à privatização de 61% do
capital do Grupo TAP.
A importância deste projeto está extremamente relacionada com o valor que a TAP
tem para a economia portuguesa. As Exportações foram um dos pilares para a
pequena retoma económica que o país apresentou em especial no último ano. Num
Mundo global, a TAP é um instrumento vital para a internacionalização da economia
portuguesa. De uma forma direta, a TAP, ano após ano, tem reforçado as vendas nos
mercados externos, contribuindo para o aumento do valor das exportações. Por outro
lado, através da sua atividade, a TAP tem a capacidade de influenciar as exportações
de todos os outros agentes económicos presentes no país.
De salientar que este projeto de mestrado apresenta uma limitação de âmbito que está
correlacionada exatamente com a capacidade que o Grupo TAP tem de influenciar as
exportações de outros agentes económicos. Através da sua operação a TAP acaba por
Evaluating the Privatization of the
Portuguese National Airline - TAP
x
gerar riqueza para o País. E o valor desta riqueza é certamente um fator que o
Governo Português deve ter em conta no momento de avaliação das propostas dos
investidores, de forma a perceber se está disposto a perder parte desse valor com esta
operação. Uma vez que, é extremamente difícil precisar qual é o valor da geração de
riqueza indireta pela TAP para o País, este valor não foi considerado no projeto, tendo
o mesmo sido restringido apenas a uma análise económico-financeira do Grupo.
O justo valor estimado nos três métodos de avaliação para o Grupo TAP é negativo.
Os valores estão compreendidos num intervalo que vai de – 102,287 milhares de
euros a – 133,615 milhares de euros. Considerando o intervalo de valores estimado
para o justo valor da TAP conclui-se que o Governo Português deve apenas transferir
aos investidores a sua posição no capital social da empresa e as respetivas obrigações
do Grupo, sem receber qualquer contrapartida financeira pela operação.
Contudo, importa realçar que o Grupo TAP tem valor caso, no futuro, se torne um
Grupo mais eficiente. Aliás, esta é uma expectativa que frequentemente está implícita
a um cenário de privatização.
Evaluating the Privatization of the
Portuguese National Airline - TAP
1
1. Introduction
Portuguese Council of Ministers approved the re-privatization process of TAP Group.
TAP Group was totally owned by Parpública Participações Públicas, SGPS, S.A., a
state asset management entity that manages several positions that Portugal State has in
its portfolio and supports the privatization process of state-owned companies.
Concerning the impact that TAP has in Portuguese economy and in life of Portuguese
people and, since in the last three years the privatization of TAP has been frequently
discussed, the aim of this Master Project is calculate TAP’s fair value, in order to sell
it at the right price, a price that can be good to all the stakeholders involved.
To achieve our purpose it will be used three of most known corporate valuation
methods: Multiples (or Relative) Analysis, Discounted Cash Flow method, using the
Free Cash Flow for the Firm approach and the Free Cash Flow for the Equity
approach, and a valuation method used to valuing firms with regular negative
earnings, which is the case of TAP Group.
First of all, it is going to be used Multiples Valuation method. In this approach TAP’s
fair value will be obtained by looking at market ratios of similar firms and the sector.
The methodology consists by analyzing the ratios of similar companies/sector and
then compares this information with some TAP’s items reflected in company’s annual
report (Balance Sheet and Profit and Loss Statement).
However, in order to get a better understatement of what can be TAP’s fair value it
will be used the DCF valuation method, which is the most common and, for many
experts and corporate valuation professionals, the best method to determine a
company fair value. The DCF method is focused in the company’s ability to generate
future cash flows, by considering the company’s past behavior in order to understand
what can be its future. The DCF method will be performed by using two different
approaches: Free Cash Flow for the Firm and Free Cash Flow for the Equity.
In the specific case of many privatizations, we are looking to value companies with
long negative financial results, which is the case of TAP Group. Therefore, in order to
get a better understanding of TAP’s fair value, it will be used another valuation
Evaluating the Privatization of the
Portuguese National Airline - TAP
2
method that can be extremely useful to apply when valuing companies with negative
earnings facing a privatization process.
Nevertheless, it is important to refer that valuing a company, like valuing anything
else, is an individual process that depends on subjective factors.
In the next subject, a review of literature on what corporate valuation is and its
usefulness is presented, as well as, the valuation methods that are going to be used
throughout the valuation of TAP. Then, an industry overview and a brief description
of TAP Group, to understand the actual context of the industry and the company, are
presented. This is extremely important for the company valuation process that will be
performed after. The final section culminates with the presentation of TAP’s valuation
main conclusions.
Evaluating the Privatization of the
Portuguese National Airline - TAP
3
2. Review of Literature
2.1 Corporate Valuation
Corporate valuation subject has always fascinated many academic students and
professional people. Just looking at the purpose of corporate valuation it’s easily to
understand the interest of many people on this matter given that it plays a decisive
role in defining the fair value of a company.
However, before entering in the vast world of valuation it is important to understand
one specific topic which is one of the main philosophical basis for valuation: the
difference between price and value.
First of all, the concept of price and value is not only limited just to corporate
valuation. This topic is and was present through the years in all human beings life’s,
independent of its social, academic or professional situation. Oscar Wilde, a famous
Irish writer and poet who lived in the 19th
century, once described as “an individual
who knows the price of everything, but the value of nothing” (Damodaran, 2002: 1).
Recently, Buffet (2014: 20), the American business magnate and one of the most
successful investors of the 20th
and 21st century, in his letter to Shareholders of
Berkshire Hathaway Inc., refers that “Price is what you pay. Value is what you get”.
So, it’s clearly a big difference between price and value which is important to
understand. Price is what people pay for a specific asset, can be a given product, a
service, a company share, etc. Is the amount paid for that asset. On the other hand,
value is what that asset worth. Value could be measured in financial terms, emotional
terms, or in any number of ways.
A company value, according to Fama and Perez (2004) is a reflection of its utility to
the evaluator and since utility and preferences are not clearly measurable, the
calculation of company’s fair value will reflect those levels of individual subjectivity.
Conversely, they define price as being the exact amount of money involved in the
financial transaction of the company.
Evaluating the Privatization of the
Portuguese National Airline - TAP
4
Koller, Goedhart and Wessels (2010: 3) refer that:
“Value is the defining dimension of measurement in a market economy. People invest
in the expectation that when they sell, the value of each investment will have grown by
a sufficient amount above its cost to compensate them for the risk they took”.
For them, value is extremely important because it takes into account the long-term
interests of all the stakeholders in a company, and not just the shareholders. When
companies maximize the value for their shareholders in the long term, and not only
for the accounting earnings reflected in the short-term performance, they create more
employment, treat better the employees and give more satisfaction to their customers
than the competitors. Every company should follow the principle of value creation.
Companies create value by investing capital they raise from investors to generate
future cash flows at a higher rate of return than the cost of capital which is the rate
that investors demand to be paid for using their money.
Valuation, like other subjects, developed several myths over time. In order to
understand valuation and its process Damodaran (2002) clarifies the main myths.
Firstly, valuation is not an objective process only. The models used can be
quantitative, however some of the inputs necessary to implement the model are based
in subjective judgments. So, given the exposure to external information about a
company, the majority of valuations will have bias.
Secondly, the process of a company valuation is continuous. Given the constant new
information about the company and other economic indicators, a valuation of a firm
has to be updated to reflect the recent information. Like Lord Keynes once said
“When the facts change, I change my mind. And what you do, sir?” (Damodaran,
2002: 4).
Finally, some people believe that a good valuation provides a precise estimate value.
Since, company valuation has in its foundations assumptions made about the future of
the company and economy, it is unfeasible to expect a precise and absolute estimate to
company value. A reasonable margin for error has to be taken into account when
measuring company’s value by any of valuation methods. The problems are not the
valuation methods used but the difficulty in making assumptions for the future. The
firms under analysis, the industry, the company life cycle or the economy wealth are
Evaluating the Privatization of the
Portuguese National Airline - TAP
5
all factors that influence the precision of valuation. For instance, mature companies
with a long financial history tend to be easier to value than growth companies, young
start-up companies or even companies that are facing a privatization process.
Like was explained before, the study of corporate valuation is vast and has several
ramifications. Some researchers dedicate their work to some particular aspects that
may influence the value of the company. In particular, it is important to refer the study
of Modigliani and Miller (1961) which focus their attention on the effect of certain
policies on the value of the company. Their examined the impact of dividend policy
on the shares prices. Firstly, Modigliani and Miller conclude that in the presence of
perfect markets, where there are no transaction costs and taxes, and all the economic
agents have the same financing conditions, the dividend policy and the capital
structure is irrelevant to value creation. They show that there is no additional value to
the company by using equity or debt funds to finance its activity. The value of the
company only depends on the return of assets. Secondly, after a few years, Modigliani
and Miller reviewed their initial study, by taking into account the existence of taxes.
The fundamental point is that the interest paid by the company when using external
financing can be deductable, resulting in a lower cost for the company in comparison
with the equity cost. Therefore, in this situation the company profits increase and its
value too. It is important to refer that in the real world this theory is difficult to
implement. Here, Mota, Barroso, Nunes and Ferreira (2006) conclude that the costs of
financial distress that may aware to the company by having a higher level of debt will
destroy its value. The costs of financial distress can be direct costs, such legal costs
occurred in a bankruptcy process, or indirect costs, like decrease of clients confidence
in company products/services or agency costs that are costs originated by the conflict
of interests between shareholders and debt holders.
Valuation is useful in an extensive sort of tasks. Damodaran (2002: 6) refers that:
“The role it plays, however is different in different arenas”.
For the author valuation can be extremely useful in portfolio management, corporate
finance and acquisition analysis.
In portfolio management, valuation is vital to fundamental analysts since the basis is
the same. However, even for technical analysts, which believes that prices movements
Evaluating the Privatization of the
Portuguese National Airline - TAP
6
depend on investor psychology or financial variables, valuation can be particularly
useful. For instance, valuation can be used to calculate the support and resistance lines
on a stock price, tools that are extremely important for the chartists’ analysts.
The useful of valuation in corporate finance is extremely related with the purpose of
corporate finance itself. The objective of corporate finance is the maximization of
company value through a continuous process of value creation. According to Koller et
al (2010) this is one of the basis of valuation.
In an acquisition analysis or privatization process, the bid part, before making its
proposal, need to compute and measure what is the fair value of the target company.
Similarly, the target company through valuation method needs to determine the value
of the company in order to analyze the offer. The fair value of the company is, in the
end, the initial price that will be the starting point for negotiation between the buyer
and the seller company.
Now that is already understood what is and the purpose of corporate valuation, it is
crucial to refer that exist several models to measure the fair value of a company.
Damodaran (2002: 11) refers that:
“Analysts use a wide spectrum of models, ranging from the simple to the
sophisticated. These models often make very different assumptions about the
fundamentals that determine value, but they do share some common characteristics
and can be classified in broader terms.”
The author argues that, in general terms, there are several models: Discounted Cash
Flow (DCF), Multiples or Relative valuation, Contingent Claim Valuation (Options)
and Asset Based Valuation.
2.2 Discounted Cash Flow Valuation
“[…] it is the foundation on which all the other valuation approaches are built”
Damodaran (2002: 11)
The value of a company in DCF valuation is related with the present value of
expected future cash flows generated by the company.
Evaluating the Privatization of the
Portuguese National Airline - TAP
7
According to Mota et al (2006), DCF valuation estimates the value of the company in
a dynamic perspective. The company value does not depend on its historical and
actual situation, even if it was and is extremely positive, but for its capacity to
generate positive cash flows in the future.
DCF is the most known method to measure the value of an asset or a company.
Moreover, according to Damodaran (2002), anyone who understands the basis of DCF
will be able to use and analyze other different approaches. For instance, the option
pricing models used to value any asset, financial or real, frequently have its starting
point in a DCF valuation.
In generically terms, the DCF method is calculated as follows:
Present Value =
(1)
Where,
n = Life of the asset
CFt = Cash Flow in period t
r = Appropriate discount rate
It is important to refer that exist many variations of DCF models.
Depending on the purpose of the appraiser and what he wants to value, Damodaran
(2002) argues that exist three ways to apply the DCF model: value the entire
company, value only the equity position in the business and value the company in
pieces, which is called APV. The concept is similarly in the three approaches, which
is discount the expected future cash flows for the present time. However, the
calculation of cash flows and the discount rate will be different under each. We only
will focus our attention in the first two approaches, which are the models that will be
used in this work to value the company.
When valuing the entire company the appraiser pays attention to the FCFF which is
the amount of cash that is available to the company after paying all the expenses,
reinvestment needs and taxes. On the other hand, when evaluating the equity stake in
the business the appraiser focuses on the FCFE, amount of cash available to be
distributed to the shareholders, after paying all expenses, tax, reinvestment needs and
net debt payments (interest, principal payments and new debt issuance). This way:
Evaluating the Privatization of the
Portuguese National Airline - TAP
8
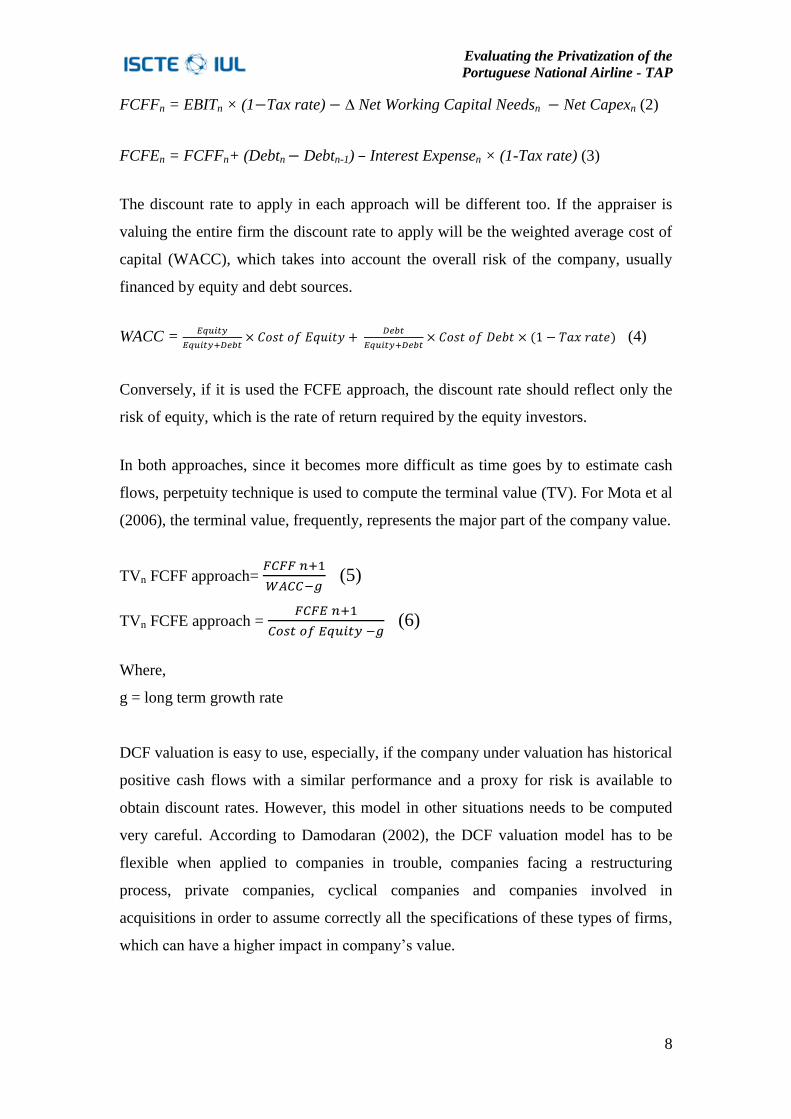
FCFFn = EBITn × (1 Tax rate) ∆ Net Working Capital Needsn Net Capexn (2)
FCFEn = FCFFn+ (Debtn Debtn-1) – Interest Expensen × (1-Tax rate) (3)
The discount rate to apply in each approach will be different too. If the appraiser is
valuing the entire firm the discount rate to apply will be the weighted average cost of
capital (WACC), which takes into account the overall risk of the company, usually
financed by equity and debt sources.
WACC =
(4)
Conversely, if it is used the FCFE approach, the discount rate should reflect only the
risk of equity, which is the rate of return required by the equity investors.
In both approaches, since it becomes more difficult as time goes by to estimate cash
flows, perpetuity technique is used to compute the terminal value (TV). For Mota et al
(2006), the terminal value, frequently, represents the major part of the company value.
TVn FCFF approach=
(5)
TVn FCFE approach =
(6)
Where,
g = long term growth rate
DCF valuation is easy to use, especially, if the company under valuation has historical
positive cash flows with a similar performance and a proxy for risk is available to
obtain discount rates. However, this model in other situations needs to be computed
very careful. According to Damodaran (2002), the DCF valuation model has to be
flexible when applied to companies in trouble, companies facing a restructuring
process, private companies, cyclical companies and companies involved in
acquisitions in order to assume correctly all the specifications of these types of firms,
which can have a higher impact in company’s value.
Evaluating the Privatization of the
Portuguese National Airline - TAP
9
2.3 Relative (or Multiple) Valuation
“[…] the reality is that most valuations are relative valuations”
Damodaran (2002: 18)
For Mota and Custódio (2006) the purpose of relative valuation is confront the value
of the company with other companies that are similar to it, or with the average of the
industry by using a range of multiples ratios.
Damodaran (2002) refers that in the real life relative valuation is the most used
valuation. He (2002: 18) argues that “in relative valuation, the value of an asset is
derived from the pricing of comparable assets, standardized using the common
variable such as earnings, cash flows, book value or revenues”.
There are a lot of different multiples that can be used, such the Price to Sales ratio, the
Price to Book Value and the PER – Price earnings ratio. Other multiple that is
frequently used by the appraisers, and will be the multiple used to perform the
valuation of TAP’s fair value is the EV/EBITDA.
The EV/EBITDA takes into account the debt being used by a company, an item which
is not included, for instance, in the PER multiple. It is particularly interesting to
analyze this ratio in a privatization scenario since the acquirer part would like to take
into account the Debt amount of the company which is reflected in the Enterprise
Value.
Moreover, the EV/EBITDA ratio ignores the effects of countries tax policy, extremely
useful when we are comparing with other companies based in different countries.
Depending on the industry being analyzed, some multiples are more appropriate than
others.
According to Massari, Visciano, Lagreca, Mele, Bellavita, Cera, Rippa, Peschiera,
Spaltro and Papa (2004) exist other multiple that is extremely useful to value air
transport companies, the EV/EBITDAR. This specific multiple is able to represent
some specific characteristics of the airline industry, reason why it will be used too to
measure TAP Group fair value. EBITDAR represents the gross operating margin
before aircraft leasing costs. This allows a comparison between the airline companies,
Evaluating the Privatization of the
Portuguese National Airline - TAP
10
regardless of the decision to own or lease the fleet. In fact, this multiple gives to the
appraiser another perspective of the company value when we compare with the
EV/EBITDA because, for instance, for companies that own the aircraft, the amount of
debt repayment and the amount of interest expense are not included in the gross
margin (EBITDA). Therefore, a comparison between airline companies that have
leasing costs is not possible.
The DCF method, when applied to airline companies, is impacted by the cyclical
nature of the business, which represents a limitation in projecting the future cash
flows of the company under analysis. Moreover, in the specific case of the company
that owns the aircraft, the allocation timing of the investments relative to new aircrafts
will certainly lead to distortions in projecting the future cash flows.
The multiples analysis is very simple and easy to work. Nevertheless, they can be
tricky, since the definition of comparable companies, used to compute the valuation,
is subjective. A bad comparable company’s choice can misuse all the valuation
conclusions. Mota and Custódio (2006) conclude that multiples analysis needs to be
seen as DCF complementary method and not like a DCF substitute method.
Damodaran (2002: 20) goes further and enhances that “while this potential bias exists
with the discounted cash flow valuation as well, the analyst in the DCF valuation is
forced to be much more explicit about the assumptions which determine the final
value. With multiples, these assumptions are often left unstated”.
2.4 Other Valuation Models
Damodaran (2002) defends that there are, in general terms, two more different
approaches that can be used in valuation: the Contingent Claim Valuation (Options)
and the Asset Based Valuation.
The Option pricing models are the foundations of Contingent Claim Valuation.
Options pricing models, such the Binomial model or the Black and Scholes model, are
commonly used in valuation of financial assets. However, these models have been
adapted to value real assets, projects, companies and equity stakes. The usage of real
options models are very useful to value businesses when the company is facing an
Evaluating the Privatization of the
Portuguese National Airline - TAP
11
uncertainty context, since these models take into account the flexibility that the
company has in the future on the occurrence of a certain event. By using real options
analysis the appraiser values this flexibility, which is going to increase the value of
the project.
According to Damodaran (2002) the fundamental principle to use option pricing
models is that DCF models tend to minimize the value of assets that, on the
occurrence of a certain event, provide different payoffs.
Myers (1976), one of the first authors to argue the importance of the real options
models in corporate valuation, goes further than Damodaran, by assuming that real
options are intrinsic assets of a company. In his working paper, The Determinants of
Corporate Borrowing (1976), he picked in the theory of Modigliani and Miller (1961)
and defends that a company at certain period in time is a collection of tangible assets,
which are units of productive capacity, and intangible assets, options which give the
right to the company to purchase additional units in the future.
It is important to refer that some limitations may aware in using the option pricing
models, especially, if the underlying asset is not traded. In this situation, the inputs for
the value of the underlying asset have to be predictable. Therefore, in this case, the
final value will have a higher level of error than the final value calculated using
information extracted from financial reports.
Some analysts use the Asset Based Valuation to measure the value of an asset. About
this subject, Damodaran (2002) argues that this approach needs to be seen as an
integrated part of the other three methods since some values obtained through the
application of the Asset Based Valuation are calculated using at least one of that three
approaches. The Asset Based Valuation models take into account the individual assets
owned by a company and use that information to estimate the value of the company.
There are several variants on the Asset Based Valuation models. One approach looks
for the liquidation value, which is computed by adding and aggregating the estimated
sale proceeds of the assets owned by the company under analysis. On the other hand,
in the replacement cost approach, the appraiser is focus in what will be the cost to
replace all the assets that company has in that period of time.
Finally, is extremely important to mention that, in most valuation methods presented
until now, we have looked for companies that have positive earnings. It cannot be said
Evaluating the Privatization of the
Portuguese National Airline - TAP
12
that these methods cannot be applied to firms that have negative earnings. However,
Damodaran (2004) refers that when we are analyzing companies in this financial
situation, these valuation methods need to be applied carefully in order to be adapted
and reflect the underlying reasons that generate these negative earnings. A firm with
negative earnings is more difficult to value than a firm with positive earnings because:
exist in these companies the real possibility that these firms will go bankrupt if
earnings continue negative, the estimation of taxes becomes more difficult to obtain
and estimate the earnings growth rate is difficult because when current earnings are
negative, applying a growth rate will just make it even more negative.
Damodaran (2004) refers that there is not a specific way to deal with negative
earnings because this will depend upon why the company has negative earnings in
first place. In his book, Damodaran (2004) explores the alternatives that he considers
available to value companies with negative earnings. In the specific case of many
privatizations, we are looking to value companies with a long negative financial
record, like it will be shown upfront, was the case of TAP Group. Therefore, in order
to get a better understanding of TAP’s fair value, it will be used another valuation
method that, Damodaran (2004) defends that can be extremely useful to apply when
valuing companies with negative earnings facing a privatization process:
Value of the Firm =
(7)
Where,
Reinvestment Rate =
(8)
Evaluating the Privatization of the
Portuguese National Airline - TAP
13
3. Industry Overview
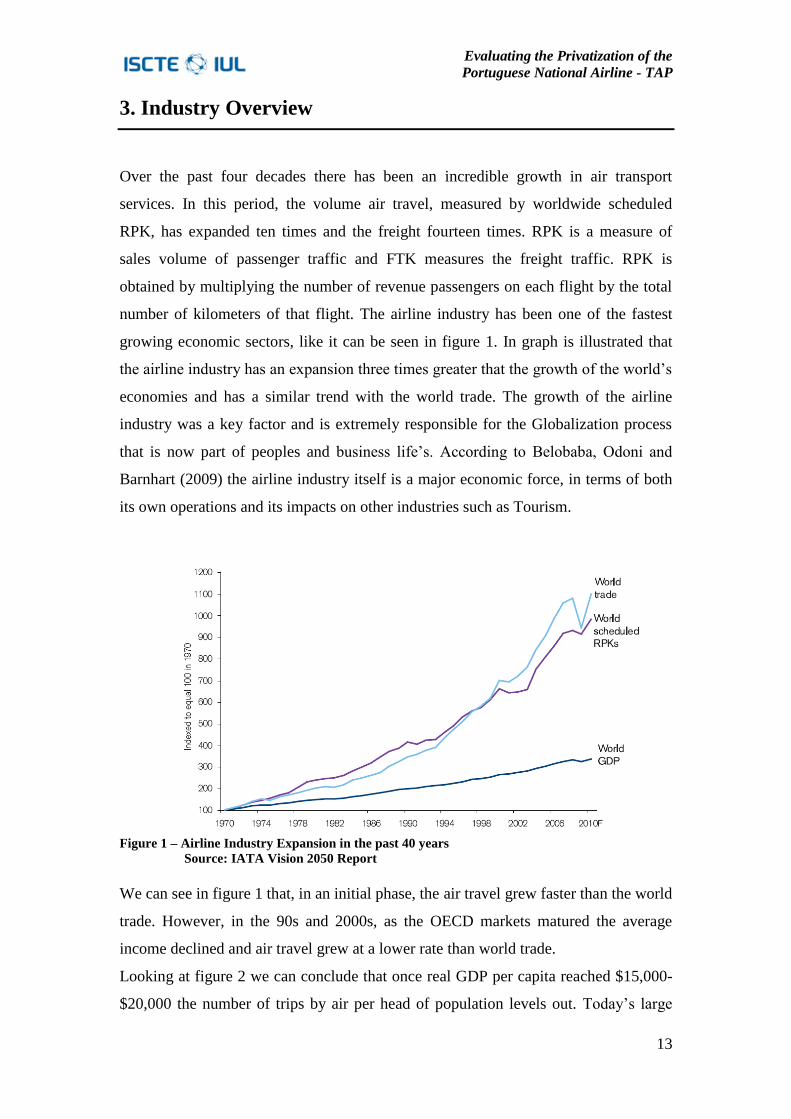
Over the past four decades there has been an incredible growth in air transport
services. In this period, the volume air travel, measured by worldwide scheduled
RPK, has expanded ten times and the freight fourteen times. RPK is a measure of
sales volume of passenger traffic and FTK measures the freight traffic. RPK is
obtained by multiplying the number of revenue passengers on each flight by the total
number of kilometers of that flight. The airline industry has been one of the fastest
growing economic sectors, like it can be seen in figure 1. In graph is illustrated that
the airline industry has an expansion three times greater that the growth of the world’s
economies and has a similar trend with the world trade. The growth of the airline
industry was a key factor and is extremely responsible for the Globalization process
that is now part of peoples and business life’s. According to Belobaba, Odoni and
Barnhart (2009) the airline industry itself is a major economic force, in terms of both
its own operations and its impacts on other industries such as Tourism.
Figure 1 – Airline Industry Expansion in the past 40 years
Source: IATA Vision 2050 Report
We can see in figure 1 that, in an initial phase, the air travel grew faster than the world
trade. However, in the 90s and 2000s, as the OECD markets matured the average
income declined and air travel grew at a lower rate than world trade.
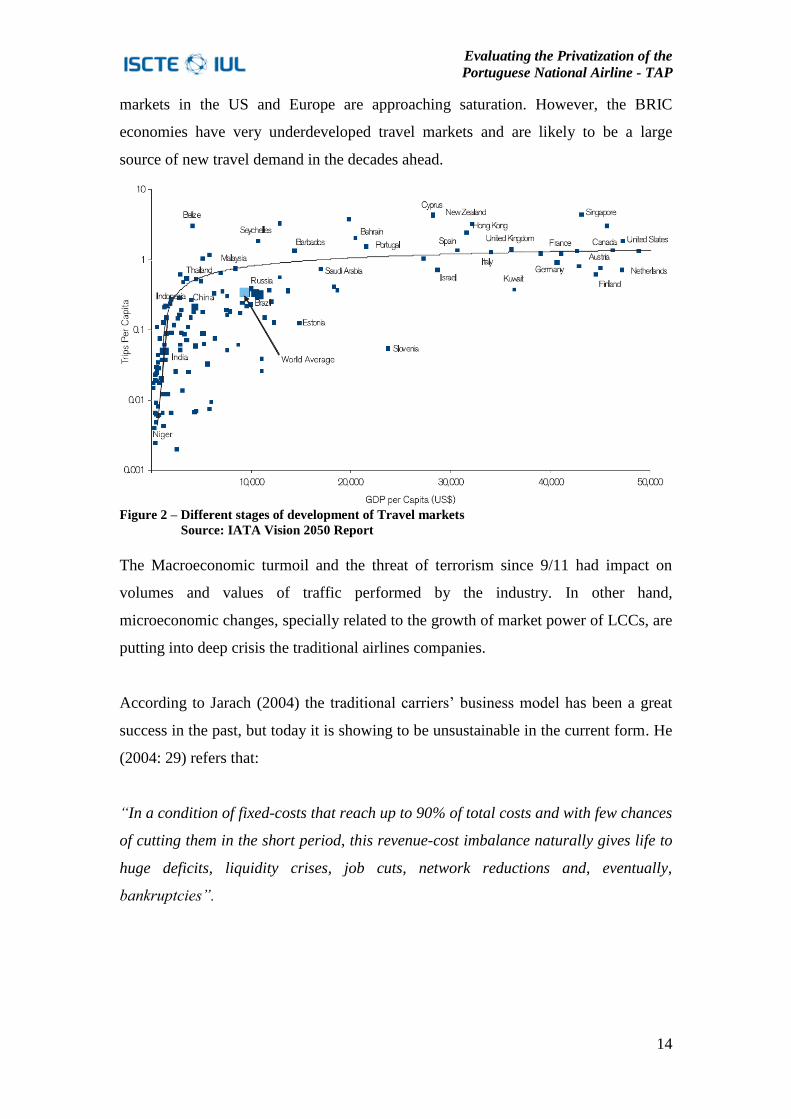
Looking at figure 2 we can conclude that once real GDP per capita reached $15,000-
$20,000 the number of trips by air per head of population levels out. Today’s large
Evaluating the Privatization of the
Portuguese National Airline - TAP
14
markets in the US and Europe are approaching saturation. However, the BRIC
economies have very underdeveloped travel markets and are likely to be a large
source of new travel demand in the decades ahead.
Figure 2 – Different stages of development of Travel markets
Source: IATA Vision 2050 Report
The Macroeconomic turmoil and the threat of terrorism since 9/11 had impact on
volumes and values of traffic performed by the industry. In other hand,
microeconomic changes, specially related to the growth of market power of LCCs, are
putting into deep crisis the traditional airlines companies.
According to Jarach (2004) the traditional carriers’ business model has been a great
success in the past, but today it is showing to be unsustainable in the current form. He
(2004: 29) refers that:
“In a condition of fixed-costs that reach up to 90% of total costs and with few chances
of cutting them in the short period, this revenue-cost imbalance naturally gives life to
huge deficits, liquidity crises, job cuts, network reductions and, eventually,
bankruptcies”.
Evaluating the Privatization of the
Portuguese National Airline - TAP
15
Based on Jarach (2004) analysis the main differences between the Traditional airlines
and the LCCs are:
Traditional Airlines LCCs
Massive marketing expenses (advertising,
Frequent Flier Programs, travel agents’
overrides, network analysis)
Minimal marketing expenses (word-of-
mouth on comparative advertising,
airports’ supports)
Expensive fragmented and complex
services (classes of tariffs and service,
catering, lounges, ground services, etc.)
Personal, convenient and pleasant
service (reengineering around core
benefits, easy price discrimination)
Massive use of technology (hard
technology: aircraft tailored for each route
and prescription; soft technology: CRS
legacy systems)
Judicious use of technology (hard
technology: fleet standardization; soft
technology: Internet and CRS avoidance)
Ancient-regime financial targets (in contrast
with macroeconomic shockwaves and
lifestyle changes)
Realistic financial targets (based on their
own business model)
Structural efficiencies (no overstaffing,
high productivity, no hubbing costs)
Table 1 – Main Differences between the Traditional Airlines and the LCCs
Source: Future Scenarios for the European Airline Industry analysis by Jarach
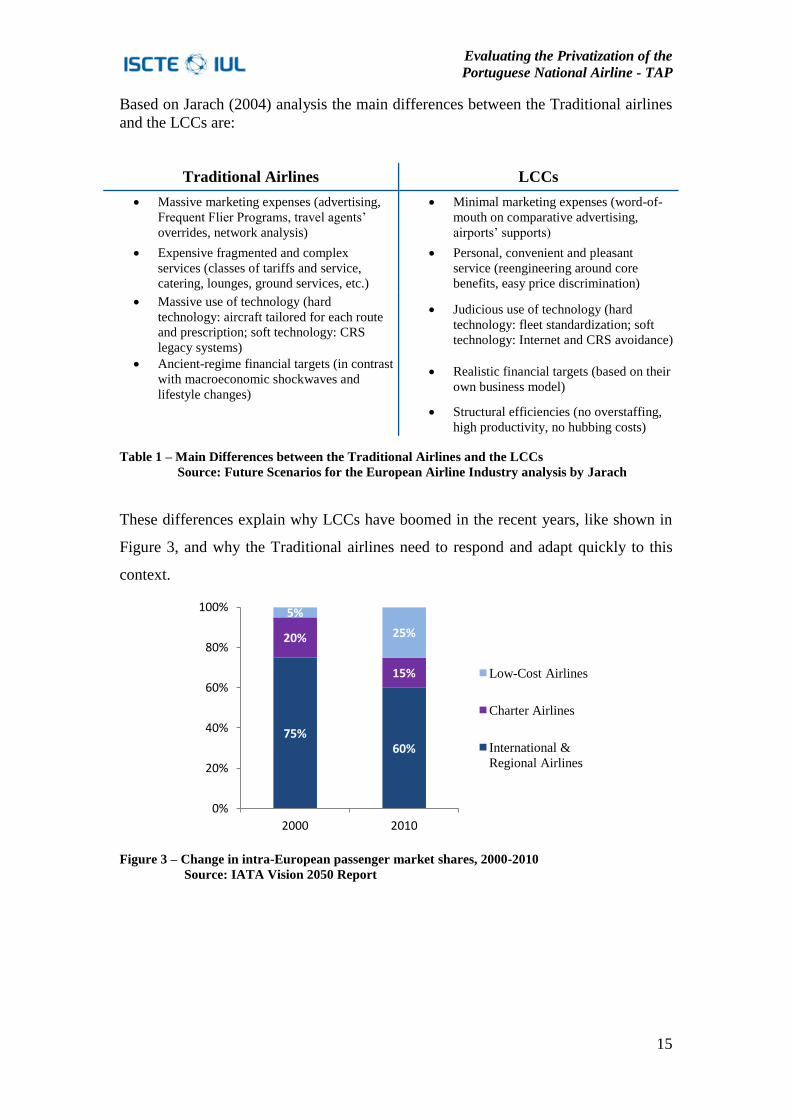
These differences explain why LCCs have boomed in the recent years, like shown in
Figure 3, and why the Traditional airlines need to respond and adapt quickly to this
context.
Figure 3 – Change in intra-European passenger market shares, 2000-2010
Source: IATA Vision 2050 Report
75% 60%
20%
15%
5%
25%
0%
20%
40%
60%
80%
100%
2000 2010
Low-Cost Airlines
Charter Airlines
International &
Regional Airlines
Evaluating the Privatization of the
Portuguese National Airline - TAP
16
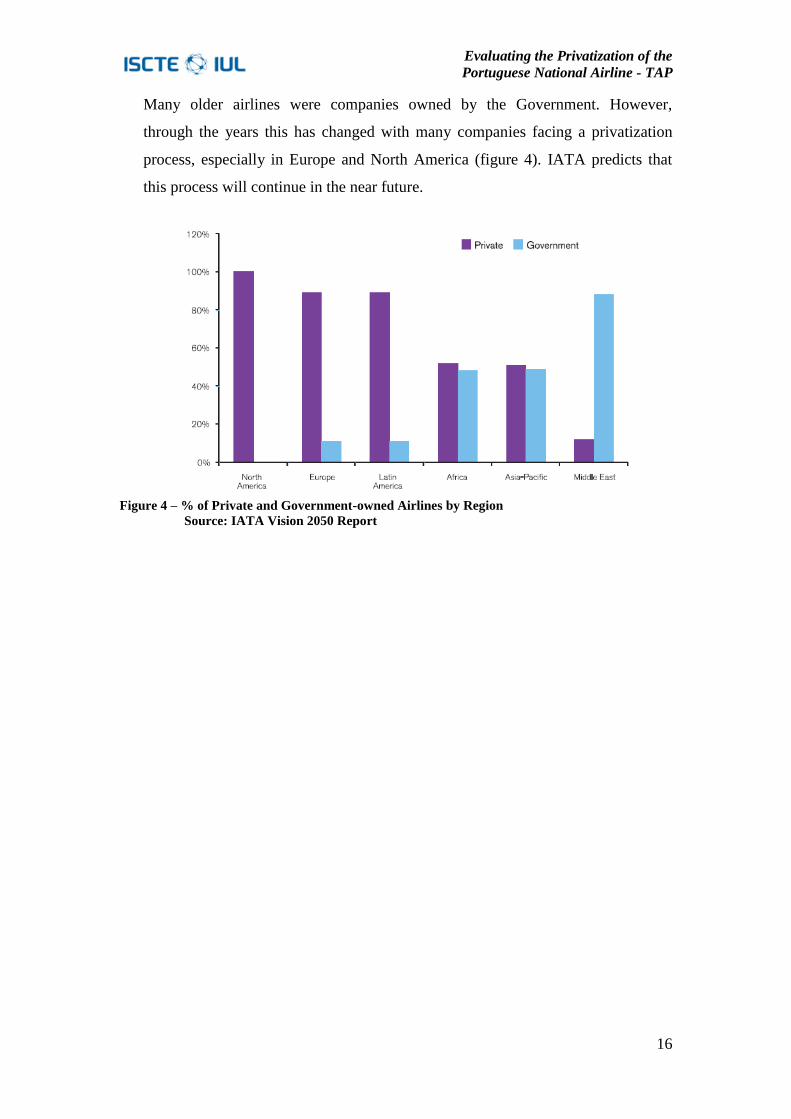
Many older airlines were companies owned by the Government. However,
through the years this has changed with many companies facing a privatization
process, especially in Europe and North America (figure 4). IATA predicts that
this process will continue in the near future.
Figure 4 – % of Private and Government-owned Airlines by Region
Source: IATA Vision 2050 Report
Evaluating the Privatization of the
Portuguese National Airline - TAP
17
4. TAP Group Description
“With Arms Wide Open”
TAP Group Slogan
The main activity of TAP Group is air passenger and cargo transport. It also provides
services to third party customers in areas related to the Group’s core activities, such as
Maintenance and Engineering services. TAP starts its activity in 1945 and is the
leading Portuguese airline. Currently, TAP has connections to 88 destinations in 38
countries all around the world and has a fleet of 77 aircraft (61 airbuses and 16
Portugália aircrafts).
The mission of TAP is based in three pillars:
- develop the international airline business, ensuring that is the best option for
passengers and in cargo air transport services;
- be one of the best companies to work;
- be recognized as a company that provides its investors with appropriate levels
of return.
TAP Group was totally owned by Parpública Participações Públicas, SGPS, S.A., a
State Asset Management Entity. This entity manages several positions that Portugal
State has in its portfolio and supports the privatization process of state-owned
companies.
Recently, TAP has dedicated more its attention to some of its main markets, such as
Brazil and other South American countries and some countries in Africa, particularly
Angola and Mozambique. By following this expansion strategy, TAP was considered
the number one airline between Europe and Brazil and in 2014 won the Leading
European Airline to Africa and South America award from the World Travel Awards.
Evaluating the Privatization of the
Portuguese National Airline - TAP
18
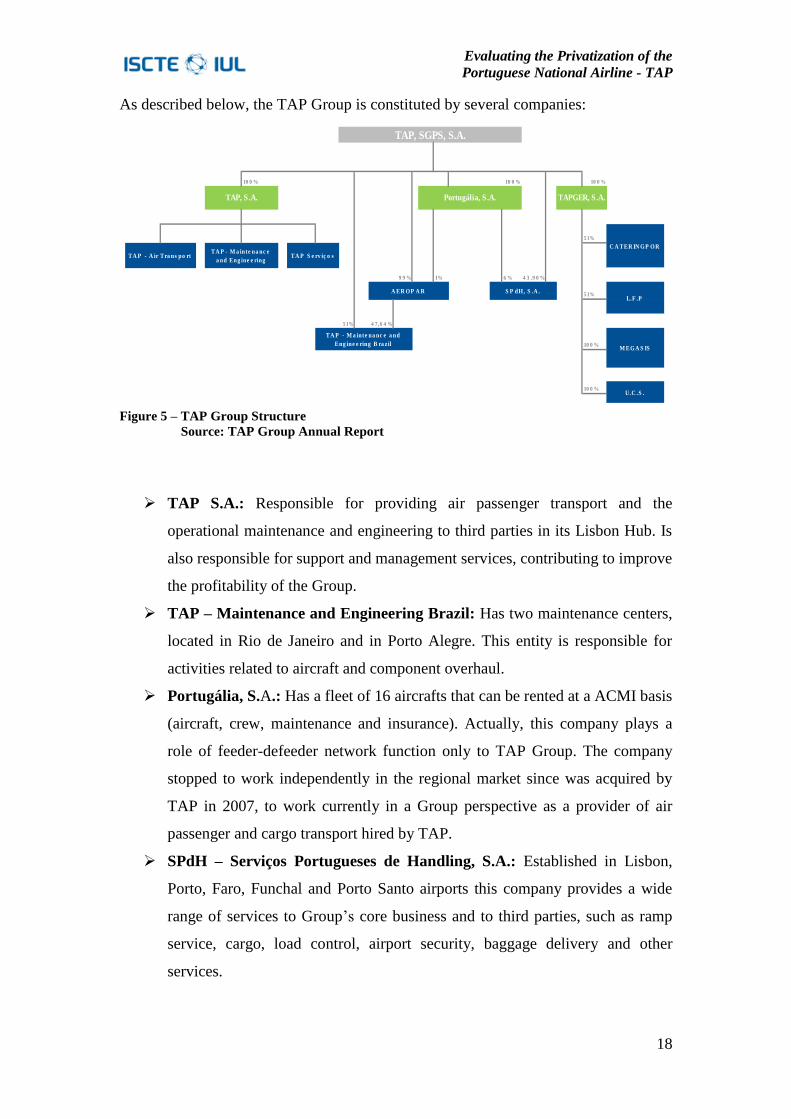
As described below, the TAP Group is constituted by several companies:
Figure 5 – TAP Group Structure
Source: TAP Group Annual Report
TAP S.A.: Responsible for providing air passenger transport and the
operational maintenance and engineering to third parties in its Lisbon Hub. Is
also responsible for support and management services, contributing to improve
the profitability of the Group.
TAP – Maintenance and Engineering Brazil: Has two maintenance centers,
located in Rio de Janeiro and in Porto Alegre. This entity is responsible for
activities related to aircraft and component overhaul.
Portugália, S.A.: Has a fleet of 16 aircrafts that can be rented at a ACMI basis
(aircraft, crew, maintenance and insurance). Actually, this company plays a
role of feeder-defeeder network function only to TAP Group. The company
stopped to work independently in the regional market since was acquired by
TAP in 2007, to work currently in a Group perspective as a provider of air
passenger and cargo transport hired by TAP.
SPdH – Serviços Portugueses de Handling, S.A.: Established in Lisbon,
Porto, Faro, Funchal and Porto Santo airports this company provides a wide
range of services to Group’s core business and to third parties, such as ramp
service, cargo, load control, airport security, baggage delivery and other
services.
10 0 % 10 0 % 10 0 %
51%
9 9 % 1% 6 % 4 3 ,9 0 %
51%
51% 4 7,6 4 %
10 0 %
10 0 %
L.F .P
M EGA S IS
U.C .S .
TAP, SGPS, S.A.
TA P - A ir Tra ns po rt
TA P - M a inte na nc e a nd
Eng ine e ring B ra zil
C A TER IN GP OR
A ER OP A R S P dH, S .A .
TA P - M a inte na nc e
a nd Eng ine e ringTA P S e rv iç o s
TAP, S .A. TAPGER, S.A.Portugália, S .A.
Evaluating the Privatization of the
Portuguese National Airline - TAP
19
TAPGER, S.A.: Company based in Lisbon that provides complementary
services to Group’s core business. The objective of this entity is supervise the
management of its participated companies and give the necessary assistance to
the companies Lojas Francas de Portugal, S.A. and CateringPor – Catering de
Portugal, S.A.. Megasis is a Group entity specialized in IT technology and
U.C.S. – Cuidados Integrados de Saúde, S.A. provides a range of healthcare
services to the Group.
Evaluating the Privatization of the
Portuguese National Airline - TAP
20
5. TAP Group Valuation
As explained in the previous sections, it will be used three different approaches in
order to get a better understanding of what can be TAP’s fair value: Multiples
Analysis, DCF method, using the FCFF and the FCFE approaches, and a valuation
method used to valuing companies with regular negative earnings.
5.1 Multiples Valuation Method
Multiples (or Relative) valuation method is one of the most common approaches used
to estimate company’s fair value. There are a lot of different multiples that can be
used in Corporate Valuation, such as PER, Price/Book Value, EV/EBITDA, etc.
Depending on the industry being analyzed, certain multiples are more appropriate
than others. Thus, when we are looking at the specific case of the airline industry and
valuing airlines companies, the commonly multiples used are EV/EBITDA and
EV/EBITDAR. In addition, PER ratio cannot be used to value unprofitable
companies. Therefore, in order to estimate TAP’s fair value it will be used these two
multiples.
As discussed before, it is important to refer that the choice of comparable companies
is fundamental in this valuation. A bad comparable company’s choice can misuse all
the valuation conclusions.
For the purpose of valuing TAP the comparable companies chosen were: Air France-
KLM, Lufthansa and IAG. These three European airlines, like TAP, provide
international and domestic air passenger and cargo transportation services.
Furthermore, the final report produced in 2012 by the special committee for
monitoring the privatization of TAP Group, refer that, in an initial phase of the
privatization process, these three airlines have shown interest in acquiring the
Portuguese Government stake in TAP.
Evaluating the Privatization of the
Portuguese National Airline - TAP
21
Finally, after choosing the multiples and the comparable companies, is extremely
important to get reliable data to compute the method. For both methods, InFinancials
information will be the source to get the data needed. InFinancials gives access to
market multiples, as well as company data, in a single click. Some of the most known
companies of the financial world, such as KPMG and Crédit Agricole Corporate &
Investment Bank., used InFinancials information on a daily basis. Therefore, this
gives us confidence to believe that this information is consistent to perform TAP’s
valuation.
5.1.1 EV/EBITDA
In a privatization scenario, this multiple is extremely useful to analyze since the
Enterprise Value takes into account the debt which the acquirer will have to assume.
In this case, Enterprise Value is a better metric than market capitalization, which is
used, for instance, in PER multiple. Additionally, this multiple is extremely valuable
in this specific case of the airline industry because it ignores the effects of individual
countries tax policies that can distort the valuation process.
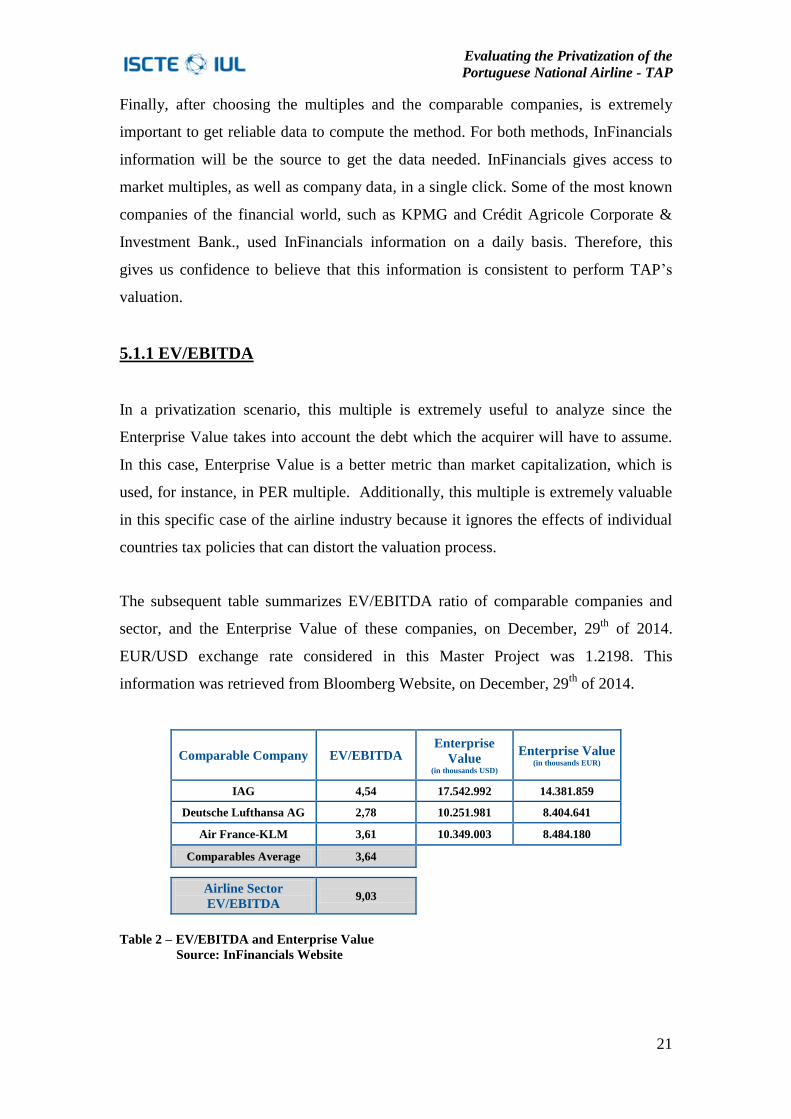
The subsequent table summarizes EV/EBITDA ratio of comparable companies and
sector, and the Enterprise Value of these companies, on December, 29th
of 2014.
EUR/USD exchange rate considered in this Master Project was 1.2198. This
information was retrieved from Bloomberg Website, on December, 29th
of 2014.
Comparable Company EV/EBITDA Enterprise
Value (in thousands USD)
Enterprise Value (in thousands EUR)
IAG 4,54 17.542.992 14.381.859
Deutsche Lufthansa AG 2,78 10.251.981 8.404.641
Air France-KLM 3,61 10.349.003 8.484.180
Comparables Average 3,64
Airline Sector
EV/EBITDA 9,03
Table 2 – EV/EBITDA and Enterprise Value
Source: InFinancials Website
Evaluating the Privatization of the
Portuguese National Airline - TAP
22
EV/EBITDA of the airline sector is 9.03, which means, that, on average, an airline
company that operates in this industry has a EV that is 9.03 times its EBITDA. On the
other hand, the average of EV/EBITDA of comparable airlines is 3.64, a number that
is lower than the sector.
As explained before, valuation is a subjective process and we need to take into
account some particular aspects to achieve a better understanding. Thus, we need to
examine why there is a significant difference between the two ratios. Analyzing the
data and the composition of the airline sector1 we conclude that LCCs airlines (such
as Ryanair or Easyjet) are increasing the value of the sector. The business model of
these LCCs airlines is different from “traditional” airlines, such as TAP or the
comparable companies chosen. Therefore, in order to get a better understanding of
what can be TAP’s fair value it will be used the average of EV/EBITDA of
comparable airlines, instead of the airline sector.
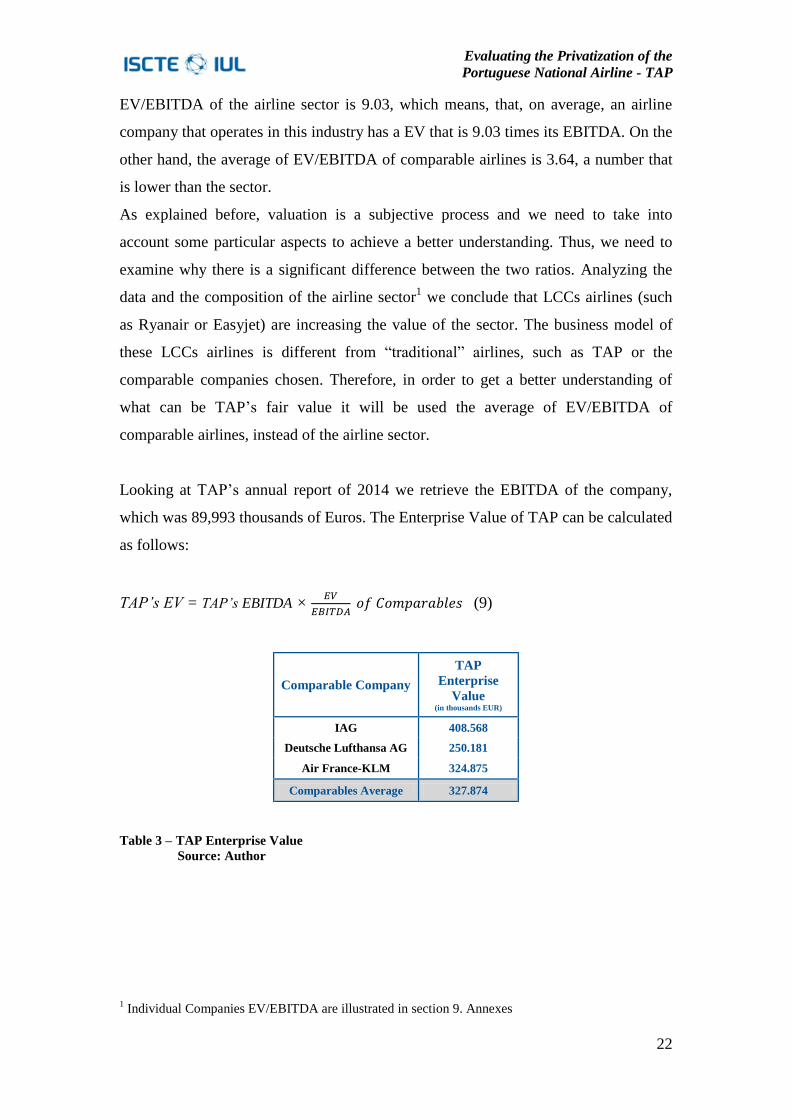
Looking at TAP’s annual report of 2014 we retrieve the EBITDA of the company,
which was 89,993 thousands of Euros. The Enterprise Value of TAP can be calculated
as follows:
TAP’s EV = TAP’s EBITDA ×
(9)
Comparable Company
TAP
Enterprise
Value (in thousands EUR)
IAG 408.568
Deutsche Lufthansa AG 250.181
Air France-KLM 324.875
Comparables Average 327.874
Table 3 – TAP Enterprise Value
Source: Author
1 Individual Companies EV/EBITDA are illustrated in section 9. Annexes
Evaluating the Privatization of the
Portuguese National Airline - TAP
23
However, the purpose of this project is not to measure TAP’s Enterprise Value but
TAP’s Equity Value. Moreover, in order to compare TAP’s value obtained in
Multiples with other methods, such as DCF, we need to calculate the Equity Value of
the company as follows:
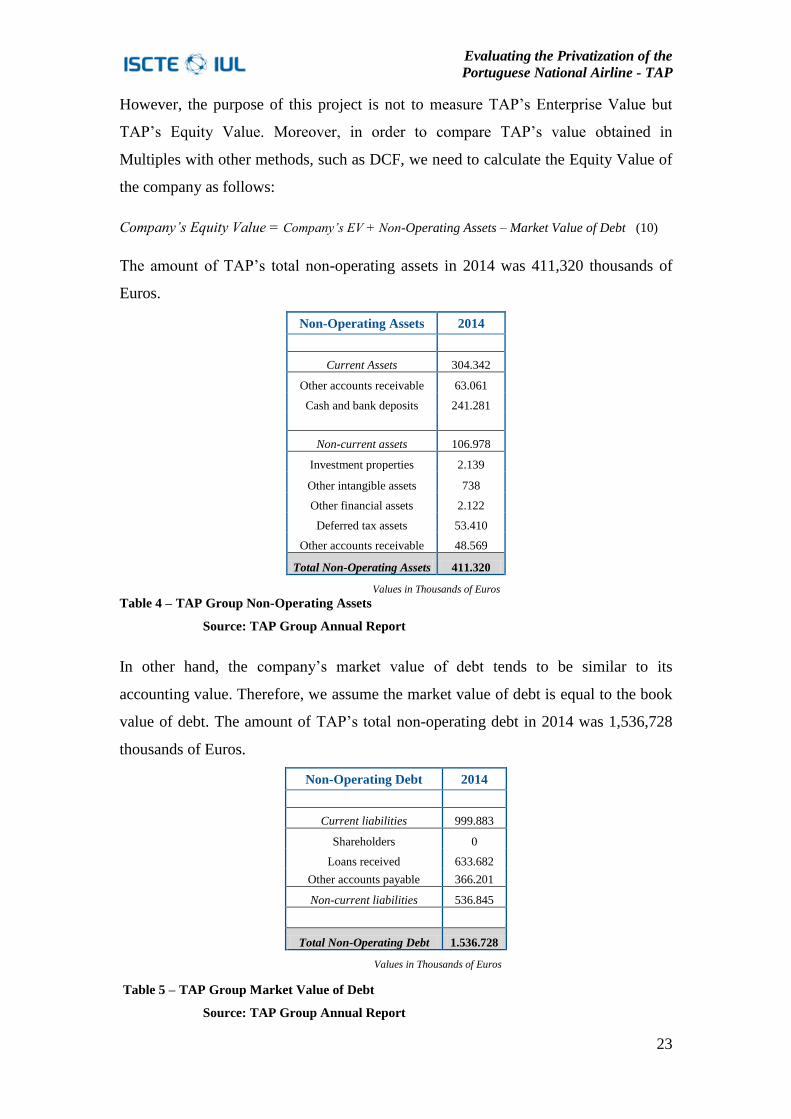
Company’s Equity Value = Company’s EV + Non-Operating Assets – Market Value of Debt (10)
The amount of TAP’s total non-operating assets in 2014 was 411,320 thousands of
Euros.
Non-Operating Assets 2014
Current Assets 304.342
Other accounts receivable 63.061
Cash and bank deposits 241.281
Non-current assets 106.978
Investment properties 2.139
Other intangible assets 738
Other financial assets 2.122
Deferred tax assets 53.410
Other accounts receivable 48.569
Total Non-Operating Assets 411.320
Values in Thousands of Euros
Table 4 – TAP Group Non-Operating Assets
Source: TAP Group Annual Report
In other hand, the company’s market value of debt tends to be similar to its
accounting value. Therefore, we assume the market value of debt is equal to the book
value of debt. The amount of TAP’s total non-operating debt in 2014 was 1,536,728
thousands of Euros.
Non-Operating Debt 2014
Current liabilities 999.883
Shareholders 0
Loans received 633.682
Other accounts payable 366.201
Non-current liabilities 536.845
Total Non-Operating Debt 1.536.728
Values in Thousands of Euros
Table 5 – TAP Group Market Value of Debt
Source: TAP Group Annual Report
Evaluating the Privatization of the
Portuguese National Airline - TAP
24
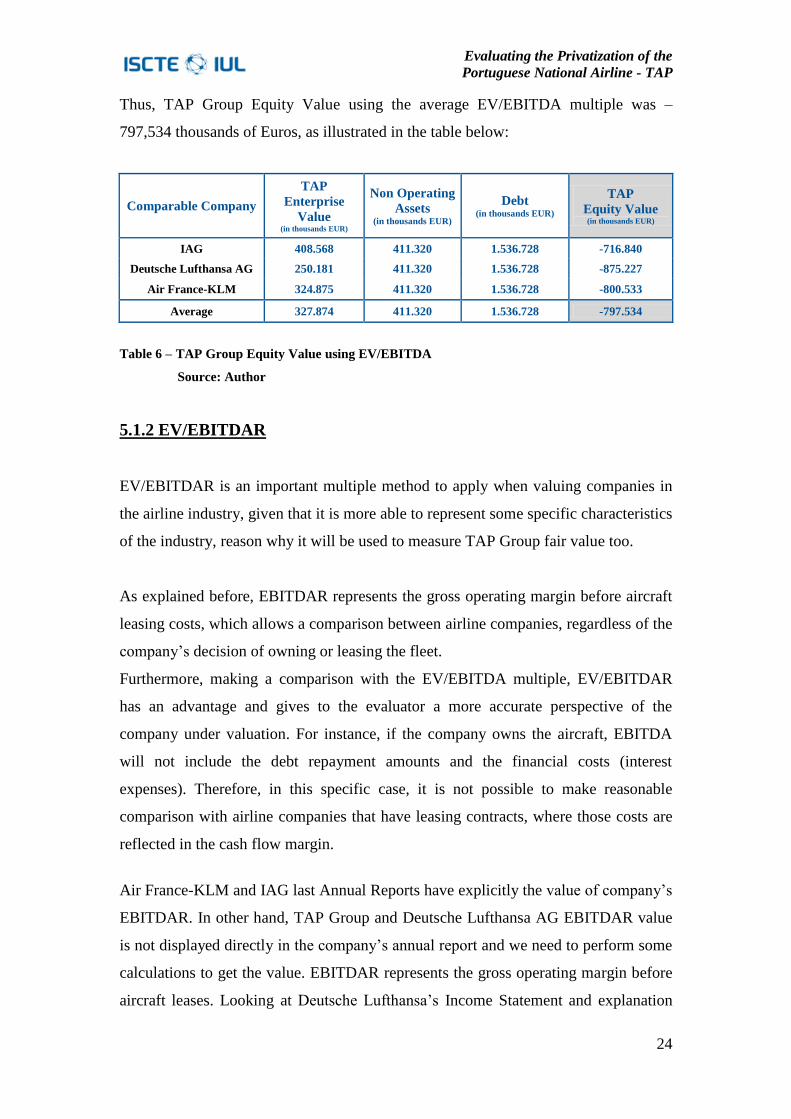
Thus, TAP Group Equity Value using the average EV/EBITDA multiple was –
797,534 thousands of Euros, as illustrated in the table below:
Comparable Company
TAP
Enterprise
Value (in thousands EUR)
Non Operating
Assets (in thousands EUR)
Debt (in thousands EUR)
TAP
Equity Value (in thousands EUR)
IAG 408.568 411.320 1.536.728 -716.840
Deutsche Lufthansa AG 250.181 411.320 1.536.728 -875.227
Air France-KLM 324.875 411.320 1.536.728 -800.533
Average 327.874 411.320 1.536.728 -797.534
Table 6 – TAP Group Equity Value using EV/EBITDA
Source: Author
5.1.2 EV/EBITDAR
EV/EBITDAR is an important multiple method to apply when valuing companies in
the airline industry, given that it is more able to represent some specific characteristics
of the industry, reason why it will be used to measure TAP Group fair value too.
As explained before, EBITDAR represents the gross operating margin before aircraft
leasing costs, which allows a comparison between airline companies, regardless of the
company’s decision of owning or leasing the fleet.
Furthermore, making a comparison with the EV/EBITDA multiple, EV/EBITDAR
has an advantage and gives to the evaluator a more accurate perspective of the
company under valuation. For instance, if the company owns the aircraft, EBITDA
will not include the debt repayment amounts and the financial costs (interest
expenses). Therefore, in this specific case, it is not possible to make reasonable
comparison with airline companies that have leasing contracts, where those costs are
reflected in the cash flow margin.
Air France-KLM and IAG last Annual Reports have explicitly the value of company’s
EBITDAR. In other hand, TAP Group and Deutsche Lufthansa AG EBITDAR value
is not displayed directly in the company’s annual report and we need to perform some
calculations to get the value. EBITDAR represents the gross operating margin before
aircraft leases. Looking at Deutsche Lufthansa’s Income Statement and explanation
Evaluating the Privatization of the
Portuguese National Airline - TAP
25
note number 7 we can get the EBITDA and the aircraft leases costs of the company.
We use the same procedure to measure TAP’s EBITDAR. The only difference is that
lease costs are reflected in explanation note number 41 in company’s annual report.
Finally, to obtain the EBITDAR of the company we just need to add to company’s
EBITDA the aircraft leases costs.
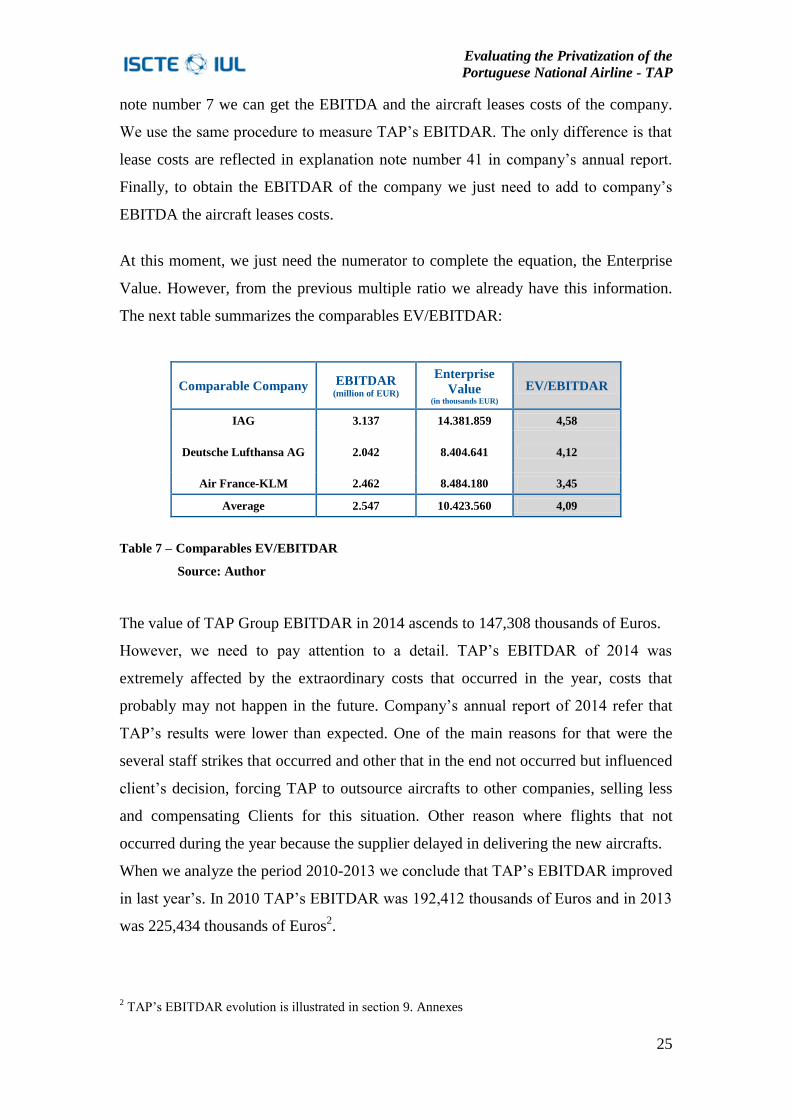
At this moment, we just need the numerator to complete the equation, the Enterprise
Value. However, from the previous multiple ratio we already have this information.
The next table summarizes the comparables EV/EBITDAR:
Comparable Company EBITDAR (million of EUR)
Enterprise
Value (in thousands EUR)
EV/EBITDAR
IAG 3.137 14.381.859 4,58
Deutsche Lufthansa AG 2.042 8.404.641 4,12
Air France-KLM 2.462 8.484.180 3,45
Average 2.547 10.423.560 4,09
Table 7 – Comparables EV/EBITDAR
Source: Author
The value of TAP Group EBITDAR in 2014 ascends to 147,308 thousands of Euros.
However, we need to pay attention to a detail. TAP’s EBITDAR of 2014 was
extremely affected by the extraordinary costs that occurred in the year, costs that
probably may not happen in the future. Company’s annual report of 2014 refer that
TAP’s results were lower than expected. One of the main reasons for that were the
several staff strikes that occurred and other that in the end not occurred but influenced
client’s decision, forcing TAP to outsource aircrafts to other companies, selling less
and compensating Clients for this situation. Other reason where flights that not
occurred during the year because the supplier delayed in delivering the new aircrafts.
When we analyze the period 2010-2013 we conclude that TAP’s EBITDAR improved
in last year’s. In 2010 TAP’s EBITDAR was 192,412 thousands of Euros and in 2013
was 225,434 thousands of Euros2.
2 TAP’s EBITDAR evolution is illustrated in section 9. Annexes
Evaluating the Privatization of the
Portuguese National Airline - TAP
26
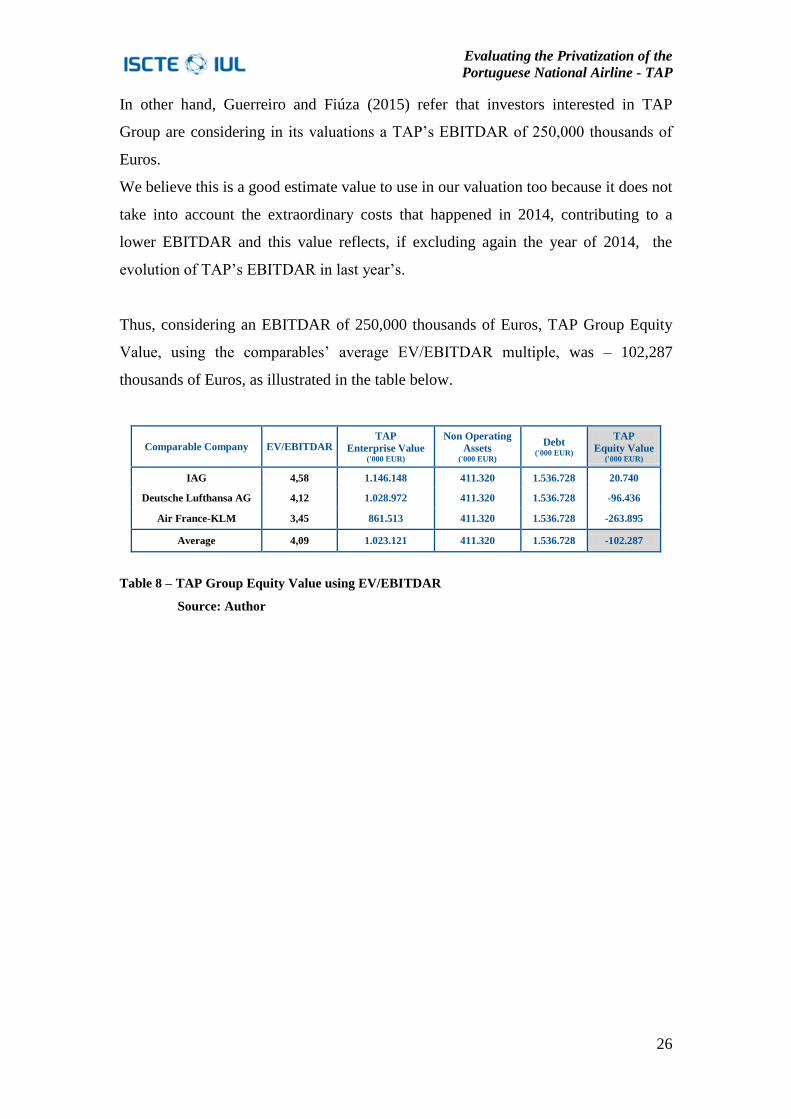
In other hand, Guerreiro and Fiúza (2015) refer that investors interested in TAP
Group are considering in its valuations a TAP’s EBITDAR of 250,000 thousands of
Euros.
We believe this is a good estimate value to use in our valuation too because it does not
take into account the extraordinary costs that happened in 2014, contributing to a
lower EBITDAR and this value reflects, if excluding again the year of 2014, the
evolution of TAP’s EBITDAR in last year’s.
Thus, considering an EBITDAR of 250,000 thousands of Euros, TAP Group Equity
Value, using the comparables’ average EV/EBITDAR multiple, was – 102,287
thousands of Euros, as illustrated in the table below.
Comparable Company EV/EBITDAR TAP
Enterprise Value ('000 EUR)
Non Operating
Assets ('000 EUR)
Debt ('000 EUR)
TAP
Equity Value ('000 EUR)
IAG 4,58 1.146.148 411.320 1.536.728 20.740
Deutsche Lufthansa AG 4,12 1.028.972 411.320 1.536.728 -96.436
Air France-KLM 3,45 861.513 411.320 1.536.728 -263.895
Average 4,09 1.023.121 411.320 1.536.728 -102.287
Table 8 – TAP Group Equity Value using EV/EBITDAR
Source: Author
Evaluating the Privatization of the
Portuguese National Airline - TAP
27
5.2 Discounted Cash Flow
DCF is the most known method used to measure a company’s value. The value of a
company is related with the present value of expected future cash flows generated by
the company. In DCF valuation, the evaluator has to estimate the future free cash
flows during the valuation horizon and the terminal value of the business at the
horizon, and discount them at a rate that reflects their risk.
It is important to refer that we are interested in calculating the fair value of TAP
Group, not only the holding company or a specific enterprise within the group.
Therefore, we will only use values from TAP’s consolidated financial statements.
As explained before, it will be used two different approaches to calculate the fair
value of TAP: FCFF and FCFE.
First of all, before develop any model, based in TAP Group historical information and
some future indicators of the airline industry, it will be calculated a specific data that
is necessary to both approaches, such as TAP Group future revenues, the discount
rate, etc. Only after getting this information it will be performed the two models. The
first approach to apply will be the FCFF, which reflects the amount of cash that is
available for the company after paying all the expenses and reinvestment needs. After
that it will be performed the FCFE approach. The main reason to follow this order is
because FCFF is used as an input to calculate the FCFE value.
Finally, is important to refer what will be the explicit forecast period. Looking at other
airline companies’ valuation we assume a forecast period of 5 years, from 2015 to
2019. Another forecast period could be assumed. However, in spite of the values
obtained could be slightly different by using a different forecast period (3, 4 or 5 years
are the most common periods used), is the Terminal Value, the perpetuity technique
that represents the major part of the company value. So, in the end, our conclusions
will be similar, independent of the forecast period chosen.
The financial projections are mainly based on the previous 5 years of financial
performance (2010-2014) and economic conditions within the airline industry.
Evaluating the Privatization of the
Portuguese National Airline - TAP
28
Revenue Forecast
One of the first steps we need to do in order to estimate the future cash flows
necessary to compute the DCF model and calculate the company’s fair value is
forecasting what will be the company’s revenue for the future. Forecasting a
company's revenues is possibly the most important assumption we can make about its
future cash flows and it can also be, in some cases, the most difficult assumption to
make because we need to consider a wide range of factors. We need to pay attention if
the company's market is expanding or contracting and think carefully about what the
industry and the company could look in the future.
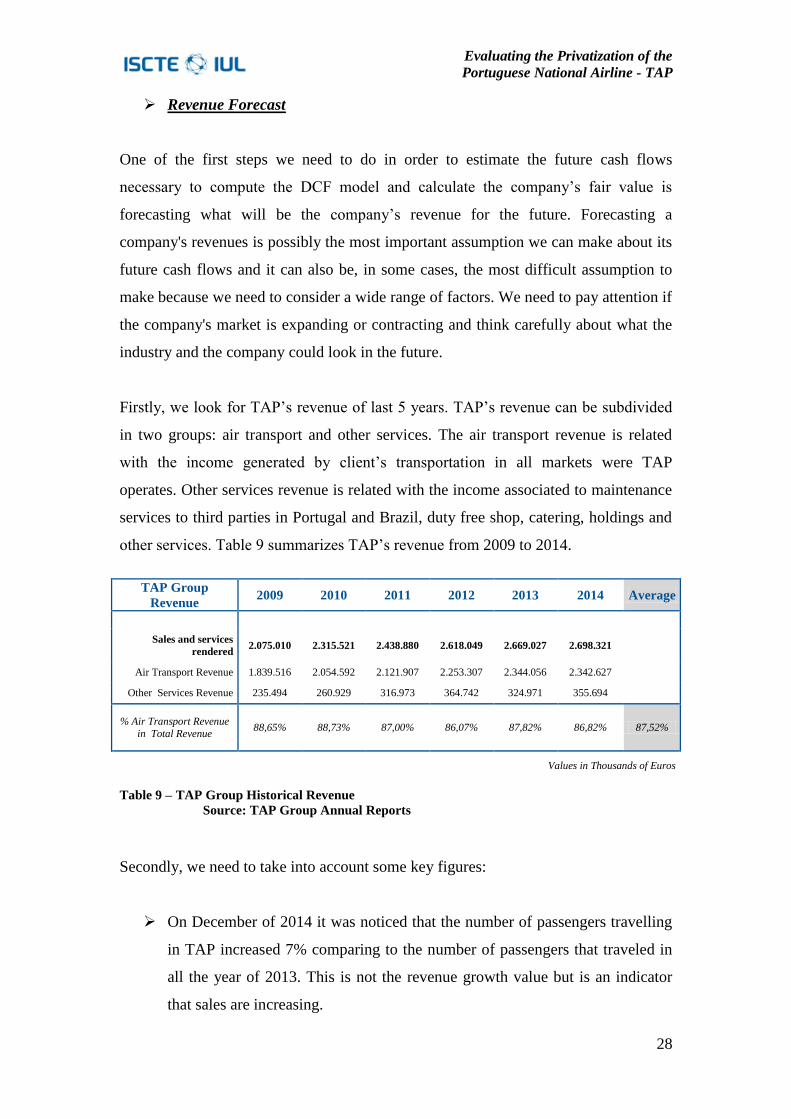
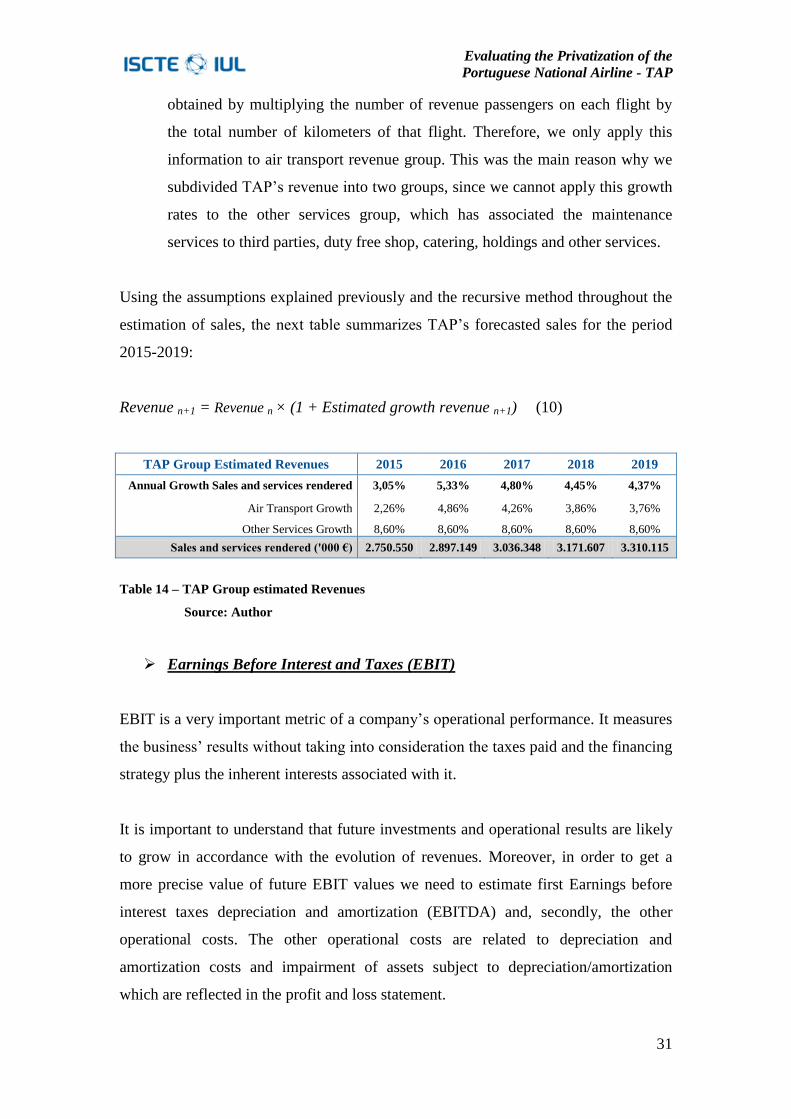
Firstly, we look for TAP’s revenue of last 5 years. TAP’s revenue can be subdivided
in two groups: air transport and other services. The air transport revenue is related
with the income generated by client’s transportation in all markets were TAP
operates. Other services revenue is related with the income associated to maintenance
services to third parties in Portugal and Brazil, duty free shop, catering, holdings and
other services. Table 9 summarizes TAP’s revenue from 2009 to 2014.
TAP Group
Revenue 2009 2010 2011 2012 2013 2014 Average
Sales and services
rendered 2.075.010 2.315.521 2.438.880 2.618.049 2.669.027 2.698.321
Air Transport Revenue 1.839.516 2.054.592 2.121.907 2.253.307 2.344.056 2.342.627
Other Services Revenue 235.494 260.929 316.973 364.742 324.971 355.694
% Air Transport Revenue
in Total Revenue 88,65% 88,73% 87,00% 86,07% 87,82% 86,82% 87,52%
Values in Thousands of Euros
Table 9 – TAP Group Historical Revenue
Source: TAP Group Annual Reports
Secondly, we need to take into account some key figures:
On December of 2014 it was noticed that the number of passengers travelling
in TAP increased 7% comparing to the number of passengers that traveled in
all the year of 2013. This is not the revenue growth value but is an indicator
that sales are increasing.
Evaluating the Privatization of the
Portuguese National Airline - TAP
29
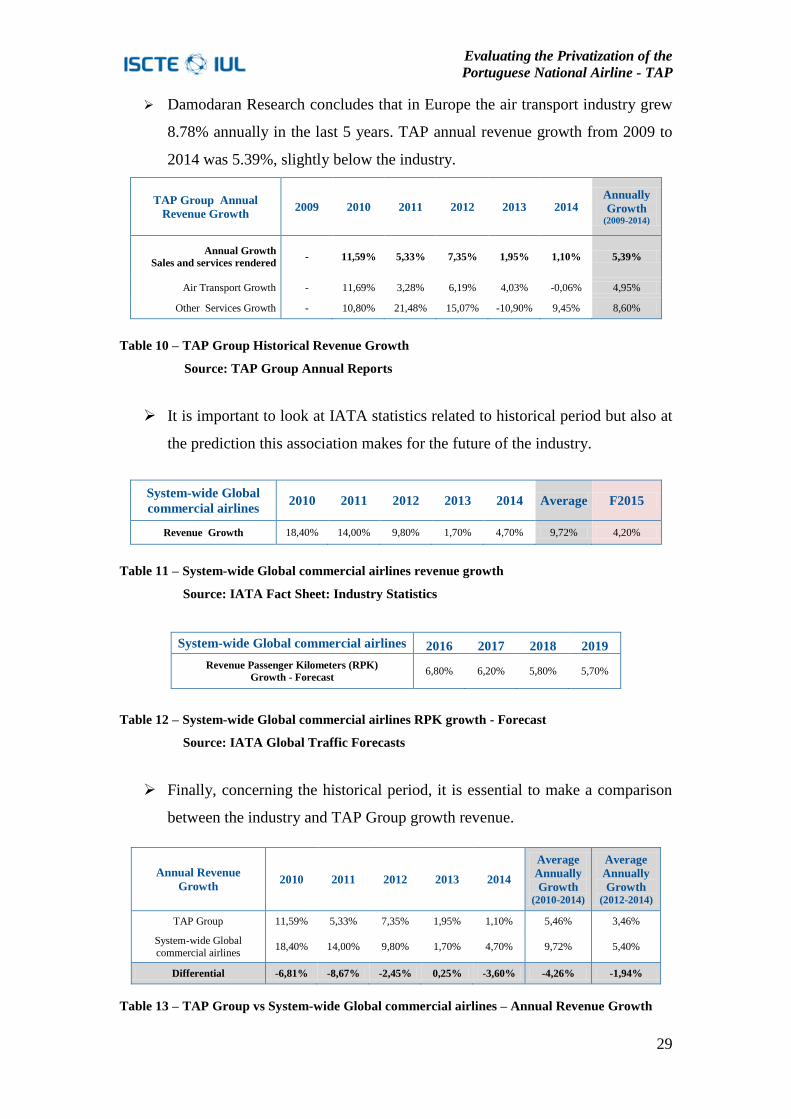
Damodaran Research concludes that in Europe the air transport industry grew
8.78% annually in the last 5 years. TAP annual revenue growth from 2009 to
2014 was 5.39%, slightly below the industry.
TAP Group Annual
Revenue Growth 2009 2010 2011 2012 2013 2014
Annually
Growth (2009-2014)
Annual Growth
Sales and services rendered - 11,59% 5,33% 7,35% 1,95% 1,10% 5,39%
Air Transport Growth - 11,69% 3,28% 6,19% 4,03% -0,06% 4,95%
Other Services Growth - 10,80% 21,48% 15,07% -10,90% 9,45% 8,60%
Table 10 – TAP Group Historical Revenue Growth
Source: TAP Group Annual Reports
It is important to look at IATA statistics related to historical period but also at
the prediction this association makes for the future of the industry.
System-wide Global
commercial airlines 2010 2011 2012 2013 2014 Average F2015
Revenue Growth 18,40% 14,00% 9,80% 1,70% 4,70% 9,72% 4,20%
Table 11 – System-wide Global commercial airlines revenue growth
Source: IATA Fact Sheet: Industry Statistics
System-wide Global commercial airlines 2016 2017 2018 2019
Revenue Passenger Kilometers (RPK)
Growth - Forecast 6,80% 6,20% 5,80% 5,70%
Table 12 – System-wide Global commercial airlines RPK growth - Forecast
Source: IATA Global Traffic Forecasts
Finally, concerning the historical period, it is essential to make a comparison
between the industry and TAP Group growth revenue.
Annual Revenue
Growth 2010 2011 2012 2013 2014
Average
Annually
Growth (2010-2014)
Average
Annually
Growth (2012-2014)
TAP Group 11,59% 5,33% 7,35% 1,95% 1,10% 5,46% 3,46%
System-wide Global
commercial airlines 18,40% 14,00% 9,80% 1,70% 4,70% 9,72% 5,40%
Differential -6,81% -8,67% -2,45% 0,25% -3,60% -4,26% -1,94%
Table 13 – TAP Group vs System-wide Global commercial airlines – Annual Revenue Growth
Evaluating the Privatization of the
Portuguese National Airline - TAP
30
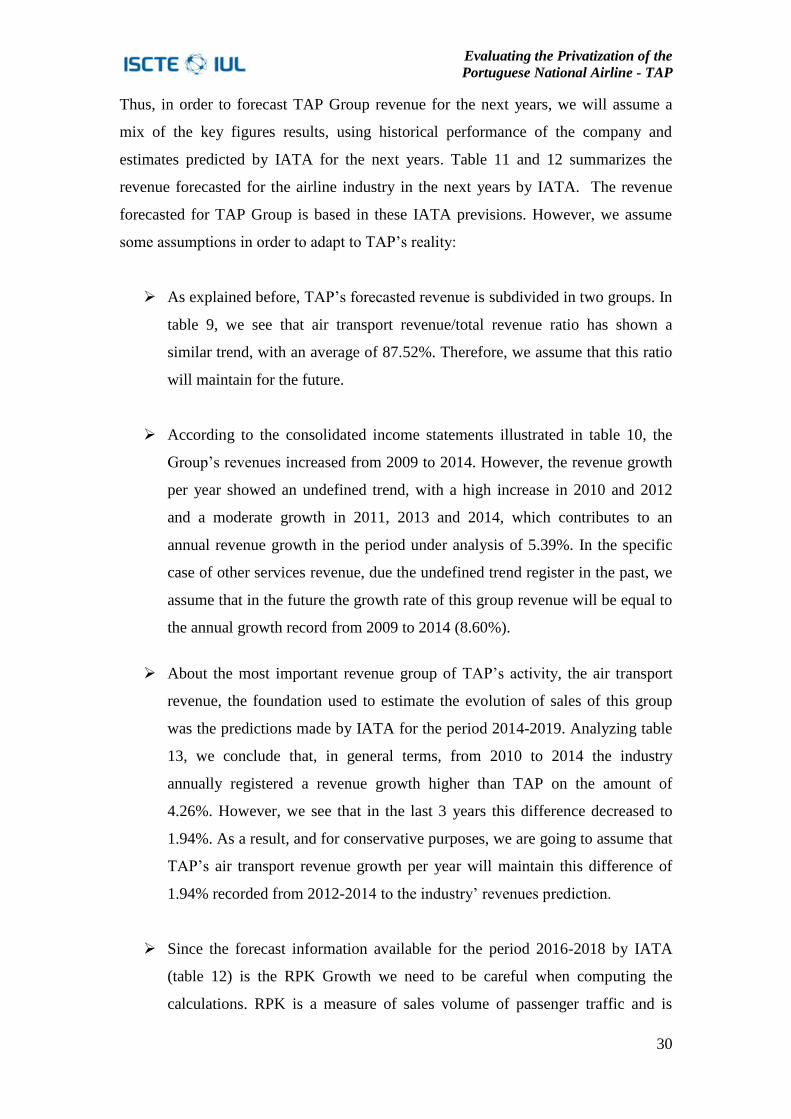
Thus, in order to forecast TAP Group revenue for the next years, we will assume a
mix of the key figures results, using historical performance of the company and
estimates predicted by IATA for the next years. Table 11 and 12 summarizes the
revenue forecasted for the airline industry in the next years by IATA. The revenue
forecasted for TAP Group is based in these IATA previsions. However, we assume
some assumptions in order to adapt to TAP’s reality:
As explained before, TAP’s forecasted revenue is subdivided in two groups. In
table 9, we see that air transport revenue/total revenue ratio has shown a
similar trend, with an average of 87.52%. Therefore, we assume that this ratio
will maintain for the future.
According to the consolidated income statements illustrated in table 10, the
Group’s revenues increased from 2009 to 2014. However, the revenue growth
per year showed an undefined trend, with a high increase in 2010 and 2012
and a moderate growth in 2011, 2013 and 2014, which contributes to an
annual revenue growth in the period under analysis of 5.39%. In the specific
case of other services revenue, due the undefined trend register in the past, we
assume that in the future the growth rate of this group revenue will be equal to
the annual growth record from 2009 to 2014 (8.60%).
About the most important revenue group of TAP’s activity, the air transport
revenue, the foundation used to estimate the evolution of sales of this group
was the predictions made by IATA for the period 2014-2019. Analyzing table
13, we conclude that, in general terms, from 2010 to 2014 the industry
annually registered a revenue growth higher than TAP on the amount of
4.26%. However, we see that in the last 3 years this difference decreased to
1.94%. As a result, and for conservative purposes, we are going to assume that
TAP’s air transport revenue growth per year will maintain this difference of
1.94% recorded from 2012-2014 to the industry’ revenues prediction.
Since the forecast information available for the period 2016-2018 by IATA
(table 12) is the RPK Growth we need to be careful when computing the
calculations. RPK is a measure of sales volume of passenger traffic and is
Evaluating the Privatization of the
Portuguese National Airline - TAP
31
obtained by multiplying the number of revenue passengers on each flight by
the total number of kilometers of that flight. Therefore, we only apply this
information to air transport revenue group. This was the main reason why we
subdivided TAP’s revenue into two groups, since we cannot apply this growth
rates to the other services group, which has associated the maintenance
services to third parties, duty free shop, catering, holdings and other services.
Using the assumptions explained previously and the recursive method throughout the
estimation of sales, the next table summarizes TAP’s forecasted sales for the period
2015-2019:
Revenue n+1 = Revenue n × (1 + Estimated growth revenue n+1) (10)
TAP Group Estimated Revenues 2015 2016 2017 2018 2019
Annual Growth Sales and services rendered 3,05% 5,33% 4,80% 4,45% 4,37%
Air Transport Growth 2,26% 4,86% 4,26% 3,86% 3,76%
Other Services Growth 8,60% 8,60% 8,60% 8,60% 8,60%
Sales and services rendered ('000 €) 2.750.550 2.897.149 3.036.348 3.171.607 3.310.115
Table 14 – TAP Group estimated Revenues
Source: Author
Earnings Before Interest and Taxes (EBIT)
EBIT is a very important metric of a company’s operational performance. It measures
the business’ results without taking into consideration the taxes paid and the financing
strategy plus the inherent interests associated with it.
It is important to understand that future investments and operational results are likely
to grow in accordance with the evolution of revenues. Moreover, in order to get a
more precise value of future EBIT values we need to estimate first Earnings before
interest taxes depreciation and amortization (EBITDA) and, secondly, the other
operational costs. The other operational costs are related to depreciation and
amortization costs and impairment of assets subject to depreciation/amortization
which are reflected in the profit and loss statement.
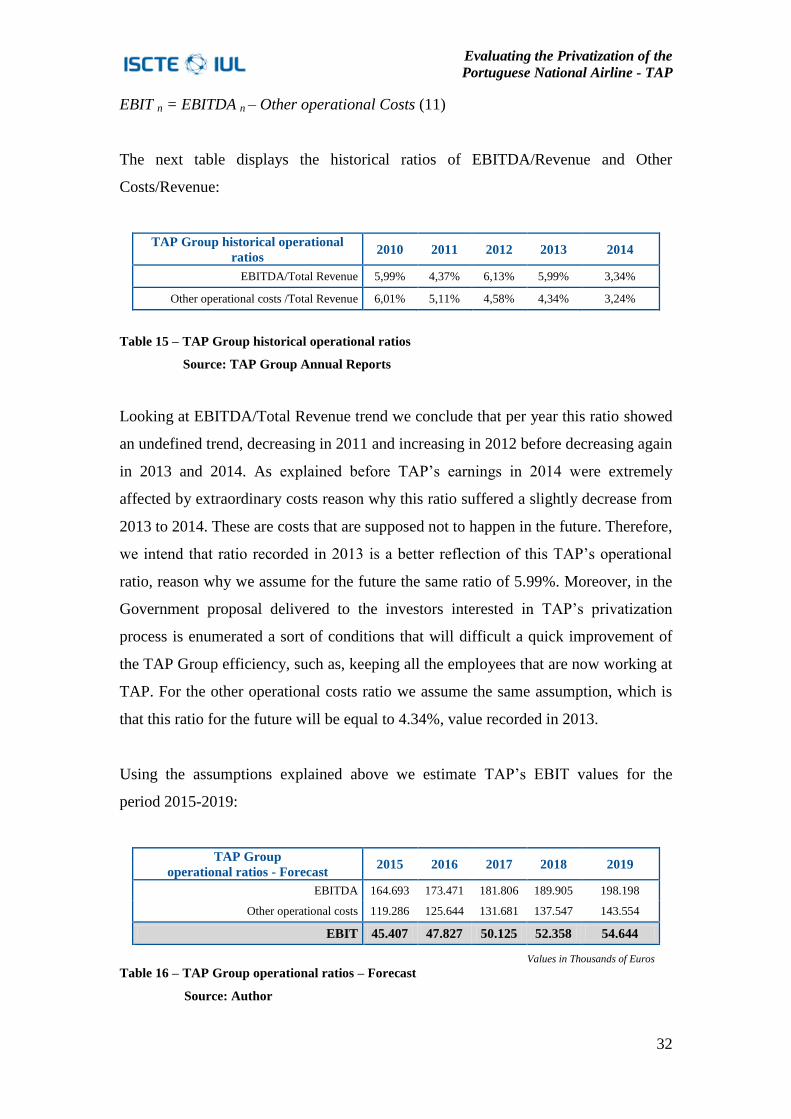
Evaluating the Privatization of the
Portuguese National Airline - TAP
32
EBIT n = EBITDA n – Other operational Costs (11)
The next table displays the historical ratios of EBITDA/Revenue and Other
Costs/Revenue:
TAP Group historical operational
ratios 2010 2011 2012 2013 2014
EBITDA/Total Revenue 5,99% 4,37% 6,13% 5,99% 3,34%
Other operational costs /Total Revenue 6,01% 5,11% 4,58% 4,34% 3,24%
Table 15 – TAP Group historical operational ratios
Source: TAP Group Annual Reports
Looking at EBITDA/Total Revenue trend we conclude that per year this ratio showed
an undefined trend, decreasing in 2011 and increasing in 2012 before decreasing again
in 2013 and 2014. As explained before TAP’s earnings in 2014 were extremely
affected by extraordinary costs reason why this ratio suffered a slightly decrease from
2013 to 2014. These are costs that are supposed not to happen in the future. Therefore,
we intend that ratio recorded in 2013 is a better reflection of this TAP’s operational
ratio, reason why we assume for the future the same ratio of 5.99%. Moreover, in the
Government proposal delivered to the investors interested in TAP’s privatization
process is enumerated a sort of conditions that will difficult a quick improvement of
the TAP Group efficiency, such as, keeping all the employees that are now working at
TAP. For the other operational costs ratio we assume the same assumption, which is
that this ratio for the future will be equal to 4.34%, value recorded in 2013.
Using the assumptions explained above we estimate TAP’s EBIT values for the
period 2015-2019:
TAP Group
operational ratios - Forecast 2015 2016 2017 2018 2019
EBITDA 164.693 173.471 181.806 189.905 198.198
Other operational costs 119.286 125.644 131.681 137.547 143.554
EBIT 45.407 47.827 50.125 52.358 54.644
Values in Thousands of Euros
Table 16 – TAP Group operational ratios – Forecast
Source: Author
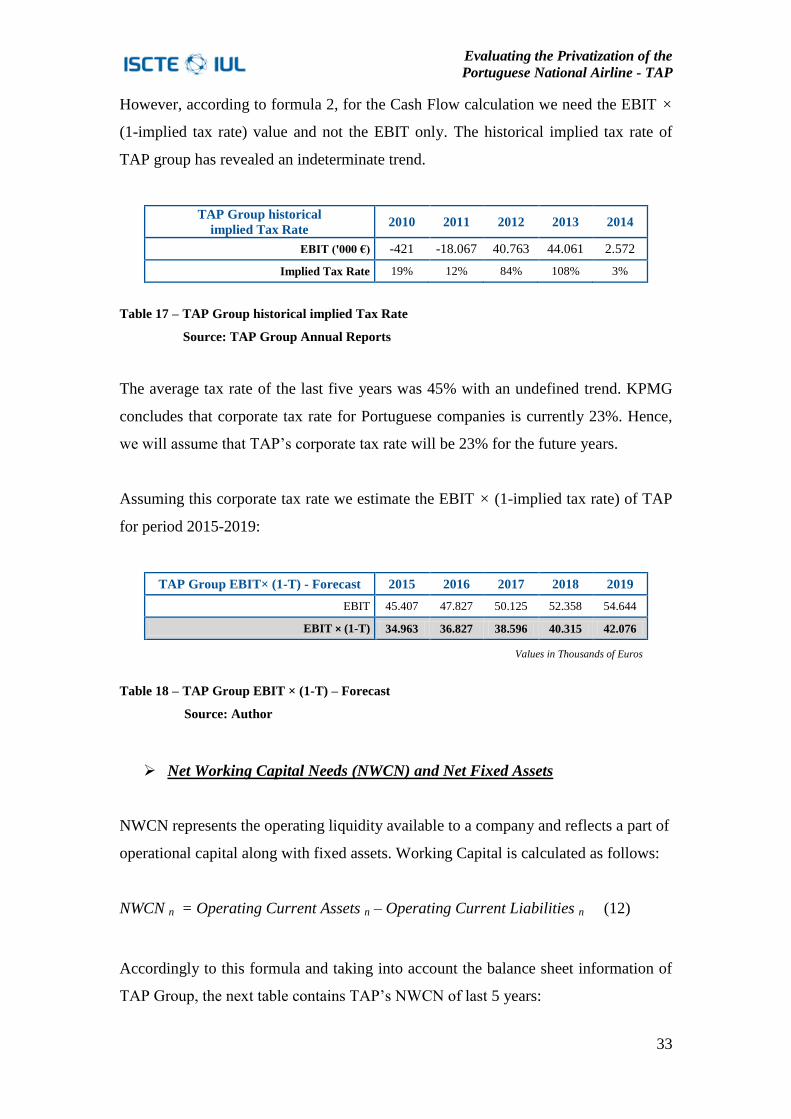
Evaluating the Privatization of the
Portuguese National Airline - TAP
33
However, according to formula 2, for the Cash Flow calculation we need the EBIT ×
(1-implied tax rate) value and not the EBIT only. The historical implied tax rate of
TAP group has revealed an indeterminate trend.
TAP Group historical
implied Tax Rate 2010 2011 2012 2013 2014
EBIT ('000 €) -421 -18.067 40.763 44.061 2.572
Implied Tax Rate 19% 12% 84% 108% 3%
Table 17 – TAP Group historical implied Tax Rate
Source: TAP Group Annual Reports
The average tax rate of the last five years was 45% with an undefined trend. KPMG
concludes that corporate tax rate for Portuguese companies is currently 23%. Hence,
we will assume that TAP’s corporate tax rate will be 23% for the future years.
Assuming this corporate tax rate we estimate the EBIT × (1-implied tax rate) of TAP
for period 2015-2019:
TAP Group EBIT× (1-T) - Forecast 2015 2016 2017 2018 2019
EBIT 45.407 47.827 50.125 52.358 54.644
EBIT × (1-T) 34.963 36.827 38.596 40.315 42.076
Values in Thousands of Euros
Table 18 – TAP Group EBIT × (1-T) – Forecast
Source: Author
Net Working Capital Needs (NWCN) and Net Fixed Assets
NWCN represents the operating liquidity available to a company and reflects a part of
operational capital along with fixed assets. Working Capital is calculated as follows:
NWCN n = Operating Current Assets n – Operating Current Liabilities n (12)
Accordingly to this formula and taking into account the balance sheet information of
TAP Group, the next table contains TAP’s NWCN of last 5 years:
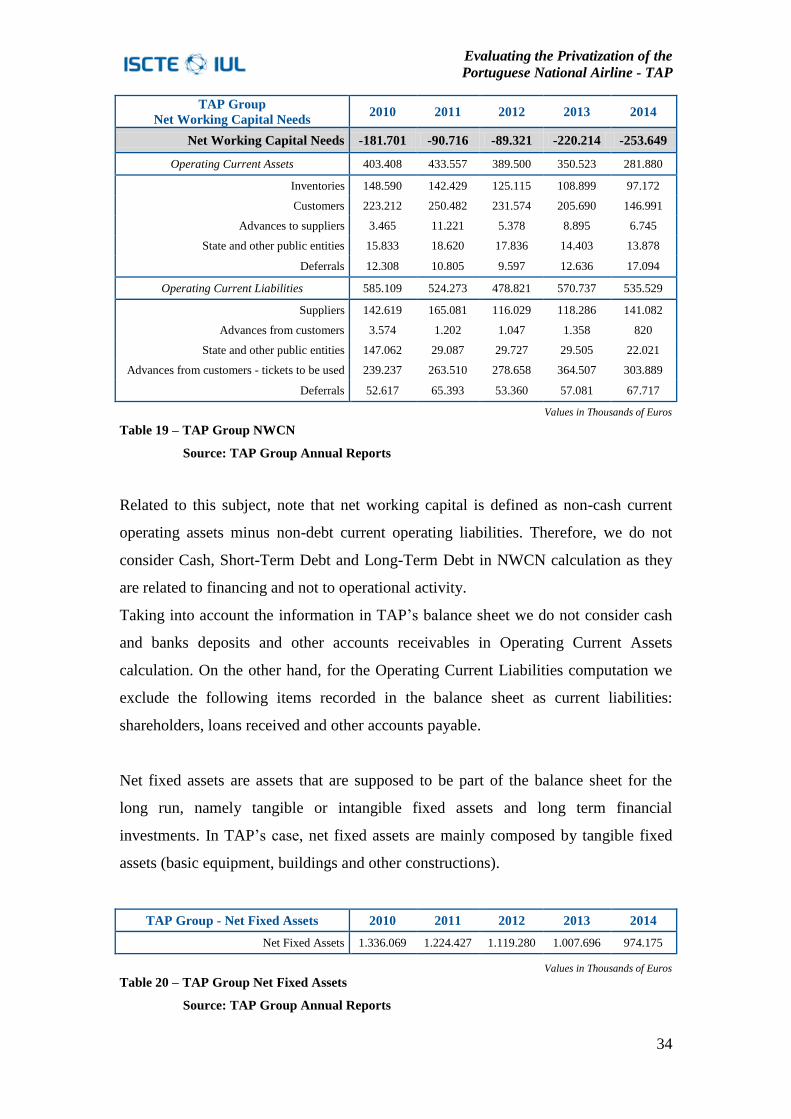
Evaluating the Privatization of the
Portuguese National Airline - TAP
34
TAP Group
Net Working Capital Needs 2010 2011 2012 2013 2014
Net Working Capital Needs -181.701 -90.716 -89.321 -220.214 -253.649
Operating Current Assets 403.408 433.557 389.500 350.523 281.880
Inventories 148.590 142.429 125.115 108.899 97.172
Customers 223.212 250.482 231.574 205.690 146.991
Advances to suppliers 3.465 11.221 5.378 8.895 6.745
State and other public entities 15.833 18.620 17.836 14.403 13.878
Deferrals 12.308 10.805 9.597 12.636 17.094
Operating Current Liabilities 585.109 524.273 478.821 570.737 535.529
Suppliers 142.619 165.081 116.029 118.286 141.082
Advances from customers 3.574 1.202 1.047 1.358 820
State and other public entities 147.062 29.087 29.727 29.505 22.021
Advances from customers - tickets to be used 239.237 263.510 278.658 364.507 303.889
Deferrals 52.617 65.393 53.360 57.081 67.717
Values in Thousands of Euros
Table 19 – TAP Group NWCN
Source: TAP Group Annual Reports
Related to this subject, note that net working capital is defined as non-cash current
operating assets minus non-debt current operating liabilities. Therefore, we do not
consider Cash, Short-Term Debt and Long-Term Debt in NWCN calculation as they
are related to financing and not to operational activity.
Taking into account the information in TAP’s balance sheet we do not consider cash
and banks deposits and other accounts receivables in Operating Current Assets
calculation. On the other hand, for the Operating Current Liabilities computation we
exclude the following items recorded in the balance sheet as current liabilities:
shareholders, loans received and other accounts payable.
Net fixed assets are assets that are supposed to be part of the balance sheet for the
long run, namely tangible or intangible fixed assets and long term financial
investments. In TAP’s case, net fixed assets are mainly composed by tangible fixed
assets (basic equipment, buildings and other constructions).
TAP Group - Net Fixed Assets 2010 2011 2012 2013 2014
Net Fixed Assets 1.336.069 1.224.427 1.119.280 1.007.696 974.175
Values in Thousands of Euros
Table 20 – TAP Group Net Fixed Assets
Source: TAP Group Annual Reports
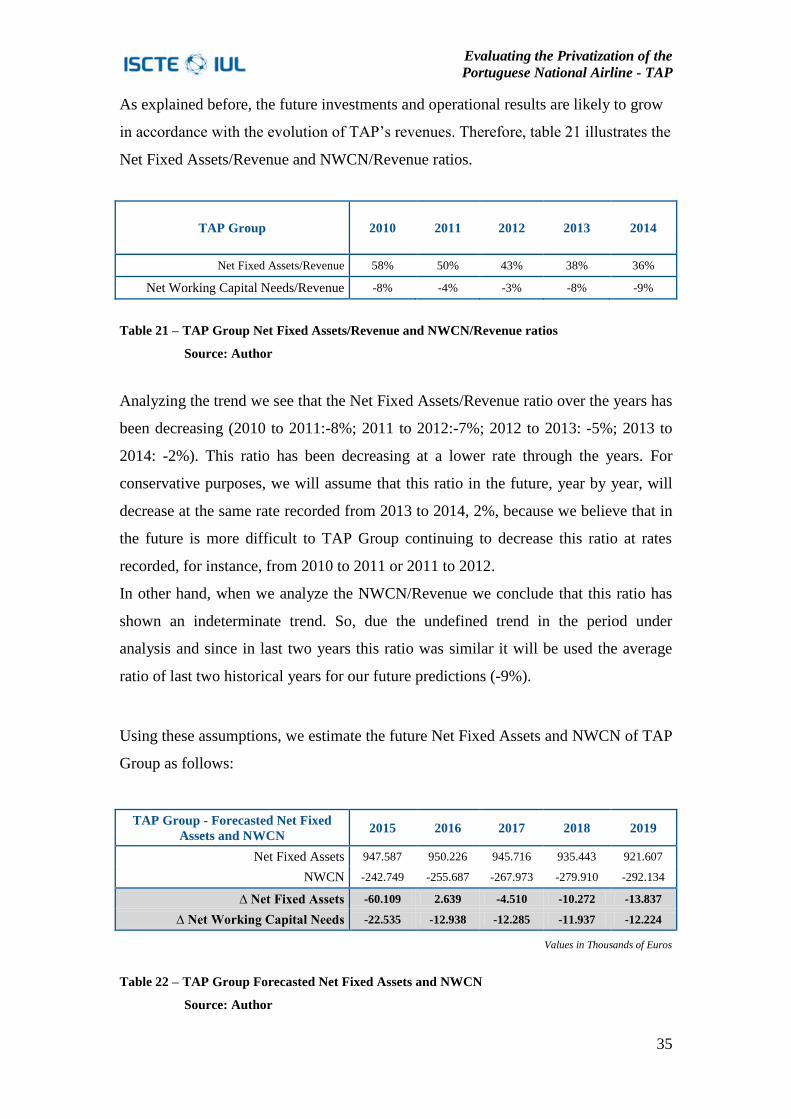
Evaluating the Privatization of the
Portuguese National Airline - TAP
35
As explained before, the future investments and operational results are likely to grow
in accordance with the evolution of TAP’s revenues. Therefore, table 21 illustrates the
Net Fixed Assets/Revenue and NWCN/Revenue ratios.
TAP Group 2010 2011 2012 2013 2014
Net Fixed Assets/Revenue 58% 50% 43% 38% 36%
Net Working Capital Needs/Revenue -8% -4% -3% -8% -9%
Table 21 – TAP Group Net Fixed Assets/Revenue and NWCN/Revenue ratios
Source: Author
Analyzing the trend we see that the Net Fixed Assets/Revenue ratio over the years has
been decreasing (2010 to 2011:-8%; 2011 to 2012:-7%; 2012 to 2013: -5%; 2013 to
2014: -2%). This ratio has been decreasing at a lower rate through the years. For
conservative purposes, we will assume that this ratio in the future, year by year, will
decrease at the same rate recorded from 2013 to 2014, 2%, because we believe that in
the future is more difficult to TAP Group continuing to decrease this ratio at rates
recorded, for instance, from 2010 to 2011 or 2011 to 2012.
In other hand, when we analyze the NWCN/Revenue we conclude that this ratio has
shown an indeterminate trend. So, due the undefined trend in the period under
analysis and since in last two years this ratio was similar it will be used the average
ratio of last two historical years for our future predictions (-9%).
Using these assumptions, we estimate the future Net Fixed Assets and NWCN of TAP
Group as follows:
TAP Group - Forecasted Net Fixed
Assets and NWCN 2015 2016 2017 2018 2019
Net Fixed Assets 947.587 950.226 945.716 935.443 921.607
NWCN -242.749 -255.687 -267.973 -279.910 -292.134
∆ Net Fixed Assets -60.109 2.639 -4.510 -10.272 -13.837
∆ Net Working Capital Needs -22.535 -12.938 -12.285 -11.937 -12.224
Values in Thousands of Euros
Table 22 – TAP Group Forecasted Net Fixed Assets and NWCN
Source: Author
Evaluating the Privatization of the
Portuguese National Airline - TAP
36
Discount Rate
The value of a company in DCF valuation is related with the present value of future
expected cash flows generated by the company. The company value does not depend
on its historical and actual situation, even if it was and is extremely positive, but for
its capacity to generate positive cash flows in the future. Consequently, in order to
measure today the value of the company we need to discount future cash flows
generated for the actual period. So, the next step is to get the appropriate discounting
rate, which will vary according to the DCF approach used to calculate the fair value of
the company: for the case of FCFF has to be a rate that reflects the overall company’s
cost of capital and for FCFE should reflect only the risk of equity, which is the rate of
return required by the equity investors.
At this point and looking, firstly, at the FCFF approach we need to determine what
will be the appropriate company’s cost of capital and the way we will use to get this
value. Bierman (1993) surveyed 74 companies listed on “Fortune 100 companies” and
93% of them said that they use the weighted-average cost of capital (WACC) as a
discounting rate for capital budgeting purposes. As consequence and as explained
before, for the case of FCFF, this will be the rate used to discount future cash flows
since it reflects the overall company’s cost of capital. WACC reflects the average
return expected by all investors in the enterprise, such as debt creditors and
stockholders. The formula to calculate WACC’s value is:
WACC =
(4)
At this point we have to subdivide the WACC’s formula in several components.
Firstly, let us look at the Cost of Equity. It can be assumed that the Cost of Equity is
the most complicated component to estimate in WACC’s formula since it depends on
some assumptions and there are many ways of calculating it. According to Bruner,
Eades, Harris and Higgins (1998) research, 81% of corporations, 80% of financial
advisers and 100% of best sellers interviewed used the capital asset pricing model
(CAPM) to estimate the Cost of Equity. So, we will use CAPM model to compute
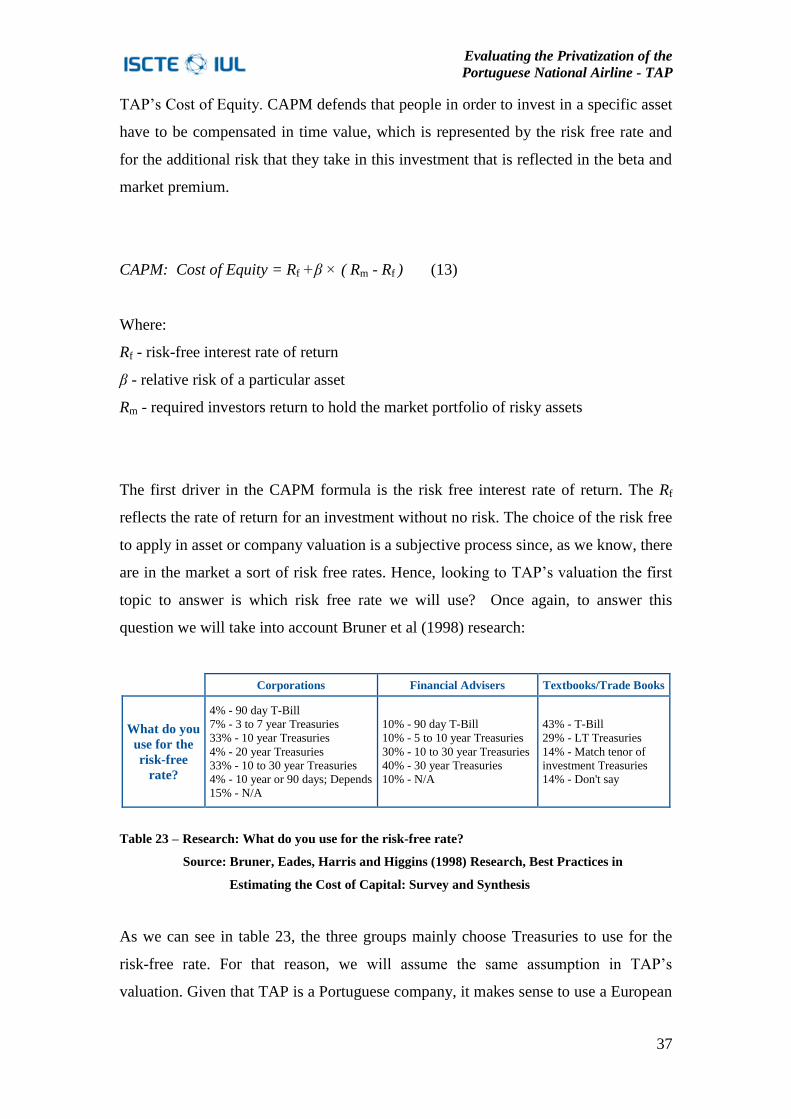
Evaluating the Privatization of the
Portuguese National Airline - TAP
37
TAP’s Cost of Equity. CAPM defends that people in order to invest in a specific asset
have to be compensated in time value, which is represented by the risk free rate and
for the additional risk that they take in this investment that is reflected in the beta and
market premium.
CAPM: Cost of Equity = Rf +β × ( Rm - Rf ) (13)
Where:
Rf - risk-free interest rate of return
β - relative risk of a particular asset
Rm - required investors return to hold the market portfolio of risky assets
The first driver in the CAPM formula is the risk free interest rate of return. The Rf
reflects the rate of return for an investment without no risk. The choice of the risk free
to apply in asset or company valuation is a subjective process since, as we know, there
are in the market a sort of risk free rates. Hence, looking to TAP’s valuation the first
topic to answer is which risk free rate we will use? Once again, to answer this
question we will take into account Bruner et al (1998) research:
Corporations Financial Advisers Textbooks/Trade Books
What do you
use for the
risk-free
rate?
4% - 90 day T-Bill
7% - 3 to 7 year Treasuries
33% - 10 year Treasuries
4% - 20 year Treasuries
33% - 10 to 30 year Treasuries
4% - 10 year or 90 days; Depends
15% - N/A
10% - 90 day T-Bill
10% - 5 to 10 year Treasuries
30% - 10 to 30 year Treasuries
40% - 30 year Treasuries
10% - N/A
43% - T-Bill
29% - LT Treasuries
14% - Match tenor of
investment Treasuries
14% - Don't say
Table 23 – Research: What do you use for the risk-free rate?
Source: Bruner, Eades, Harris and Higgins (1998) Research, Best Practices in
Estimating the Cost of Capital: Survey and Synthesis
As we can see in table 23, the three groups mainly choose Treasuries to use for the
risk-free rate. For that reason, we will assume the same assumption in TAP’s
valuation. Given that TAP is a Portuguese company, it makes sense to use a European
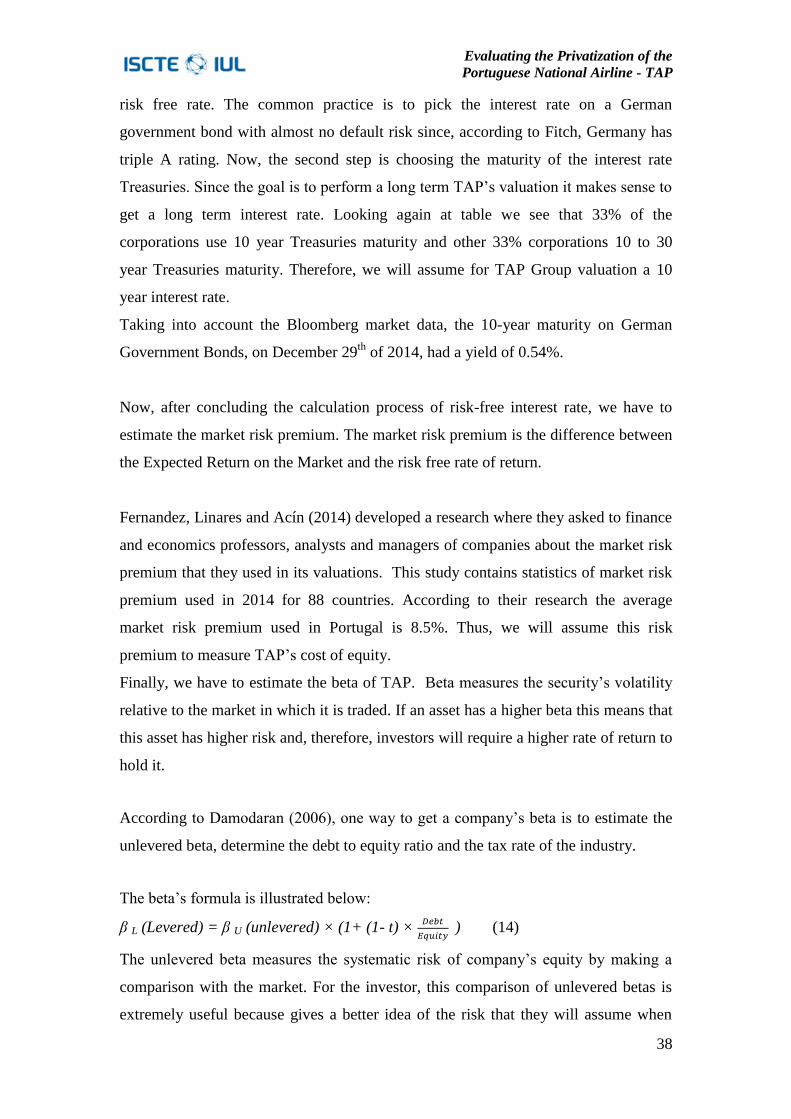
Evaluating the Privatization of the
Portuguese National Airline - TAP
38
risk free rate. The common practice is to pick the interest rate on a German
government bond with almost no default risk since, according to Fitch, Germany has
triple A rating. Now, the second step is choosing the maturity of the interest rate
Treasuries. Since the goal is to perform a long term TAP’s valuation it makes sense to
get a long term interest rate. Looking again at table we see that 33% of the
corporations use 10 year Treasuries maturity and other 33% corporations 10 to 30
year Treasuries maturity. Therefore, we will assume for TAP Group valuation a 10
year interest rate.
Taking into account the Bloomberg market data, the 10-year maturity on German
Government Bonds, on December 29th
of 2014, had a yield of 0.54%.
Now, after concluding the calculation process of risk-free interest rate, we have to
estimate the market risk premium. The market risk premium is the difference between
the Expected Return on the Market and the risk free rate of return.
Fernandez, Linares and Acín (2014) developed a research where they asked to finance
and economics professors, analysts and managers of companies about the market risk
premium that they used in its valuations. This study contains statistics of market risk
premium used in 2014 for 88 countries. According to their research the average
market risk premium used in Portugal is 8.5%. Thus, we will assume this risk
premium to measure TAP’s cost of equity.
Finally, we have to estimate the beta of TAP. Beta measures the security’s volatility
relative to the market in which it is traded. If an asset has a higher beta this means that
this asset has higher risk and, therefore, investors will require a higher rate of return to
hold it.
According to Damodaran (2006), one way to get a company’s beta is to estimate the
unlevered beta, determine the debt to equity ratio and the tax rate of the industry.
The beta’s formula is illustrated below:
β L (Levered) = β U (unlevered) × (1+ (1- t) ×
) (14)
The unlevered beta measures the systematic risk of company’s equity by making a
comparison with the market. For the investor, this comparison of unlevered betas is
extremely useful because gives a better idea of the risk that they will assume when
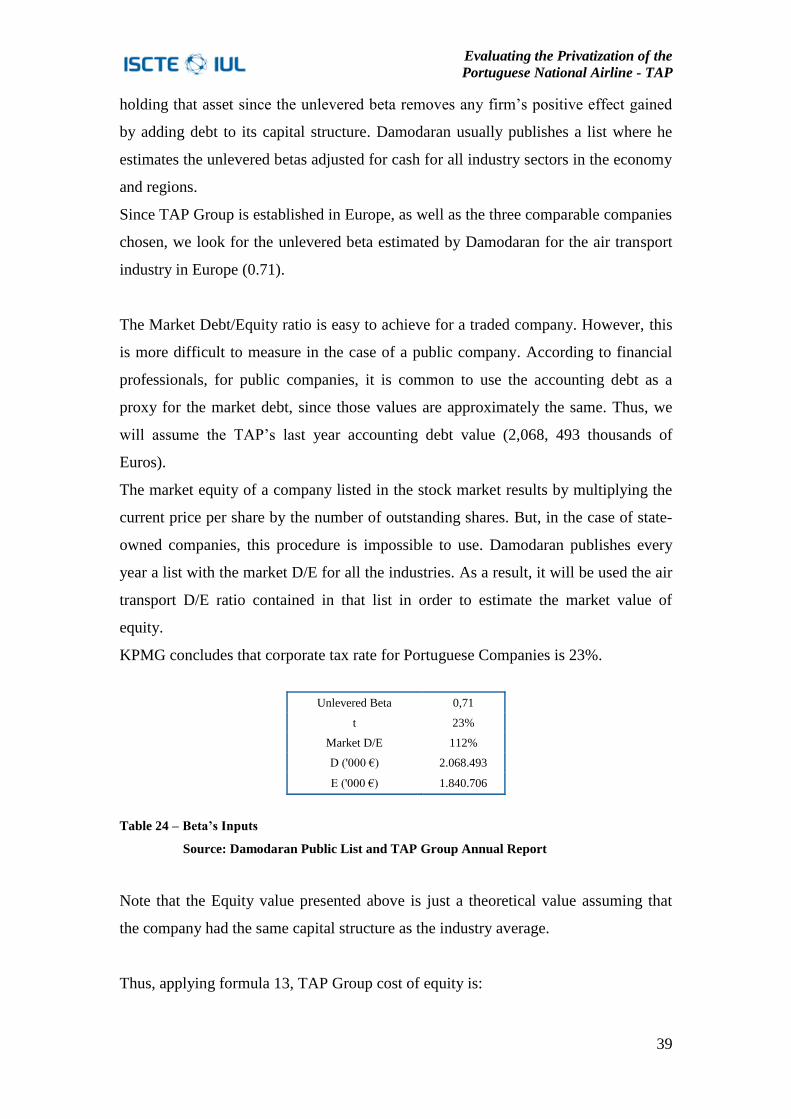
Evaluating the Privatization of the
Portuguese National Airline - TAP
39
holding that asset since the unlevered beta removes any firm’s positive effect gained
by adding debt to its capital structure. Damodaran usually publishes a list where he
estimates the unlevered betas adjusted for cash for all industry sectors in the economy
and regions.
Since TAP Group is established in Europe, as well as the three comparable companies
chosen, we look for the unlevered beta estimated by Damodaran for the air transport
industry in Europe (0.71).
The Market Debt/Equity ratio is easy to achieve for a traded company. However, this
is more difficult to measure in the case of a public company. According to financial
professionals, for public companies, it is common to use the accounting debt as a
proxy for the market debt, since those values are approximately the same. Thus, we
will assume the TAP’s last year accounting debt value (2,068, 493 thousands of
Euros).
The market equity of a company listed in the stock market results by multiplying the
current price per share by the number of outstanding shares. But, in the case of state-
owned companies, this procedure is impossible to use. Damodaran publishes every
year a list with the market D/E for all the industries. As a result, it will be used the air
transport D/E ratio contained in that list in order to estimate the market value of
equity.
KPMG concludes that corporate tax rate for Portuguese Companies is 23%.
Unlevered Beta 0,71
t 23%
Market D/E 112%
D ('000 €) 2.068.493
E ('000 €) 1.840.706
Table 24 – Beta’s Inputs
Source: Damodaran Public List and TAP Group Annual Report
Note that the Equity value presented above is just a theoretical value assuming that
the company had the same capital structure as the industry average.
Thus, applying formula 13, TAP Group cost of equity is:
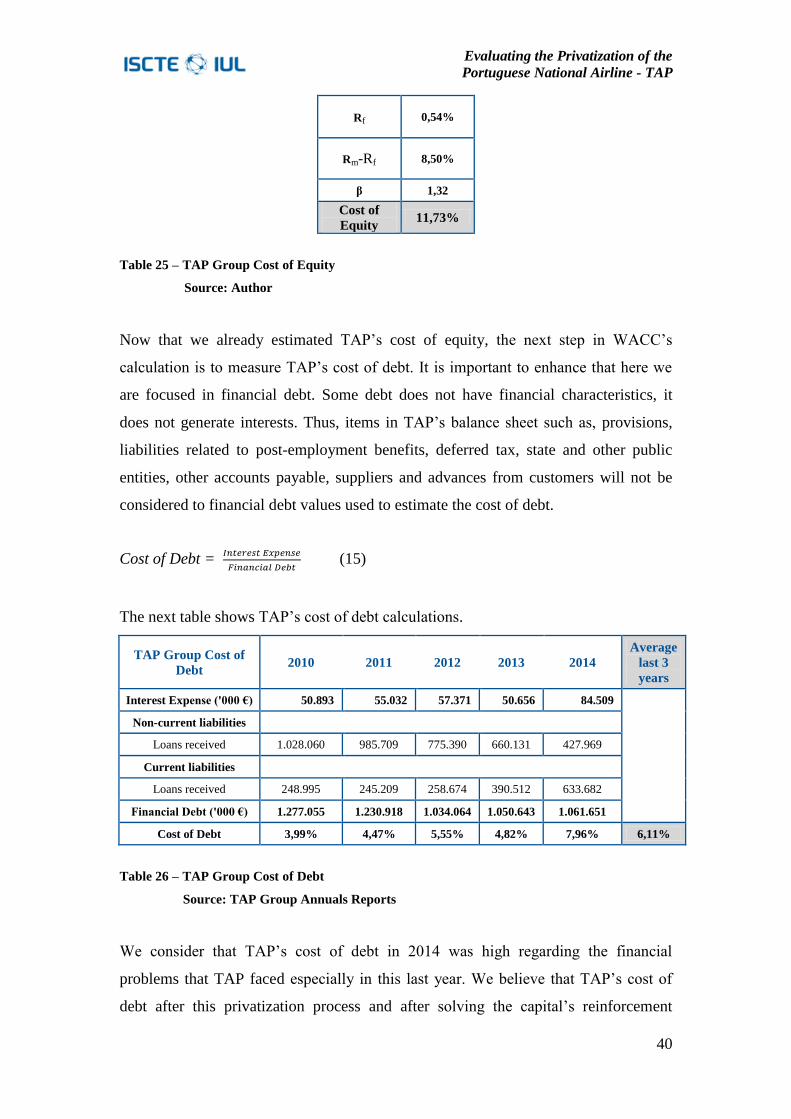
Evaluating the Privatization of the
Portuguese National Airline - TAP
40
Rf 0,54%
Rm-Rf 8,50%
β 1,32
Cost of
Equity 11,73%
Table 25 – TAP Group Cost of Equity
Source: Author
Now that we already estimated TAP’s cost of equity, the next step in WACC’s
calculation is to measure TAP’s cost of debt. It is important to enhance that here we
are focused in financial debt. Some debt does not have financial characteristics, it
does not generate interests. Thus, items in TAP’s balance sheet such as, provisions,
liabilities related to post-employment benefits, deferred tax, state and other public
entities, other accounts payable, suppliers and advances from customers will not be
considered to financial debt values used to estimate the cost of debt.
Cost of Debt =
(15)
The next table shows TAP’s cost of debt calculations.
TAP Group Cost of
Debt 2010 2011 2012 2013 2014
Average
last 3
years
Interest Expense ('000 €) 50.893 55.032 57.371 50.656 84.509
Non-current liabilities
Loans received 1.028.060 985.709 775.390 660.131 427.969
Current liabilities
Loans received 248.995 245.209 258.674 390.512 633.682
Financial Debt ('000 €) 1.277.055 1.230.918 1.034.064 1.050.643 1.061.651
Cost of Debt 3,99% 4,47% 5,55% 4,82% 7,96% 6,11%
Table 26 – TAP Group Cost of Debt
Source: TAP Group Annuals Reports
We consider that TAP’s cost of debt in 2014 was high regarding the financial
problems that TAP faced especially in this last year. We believe that TAP’s cost of
debt after this privatization process and after solving the capital’s reinforcement
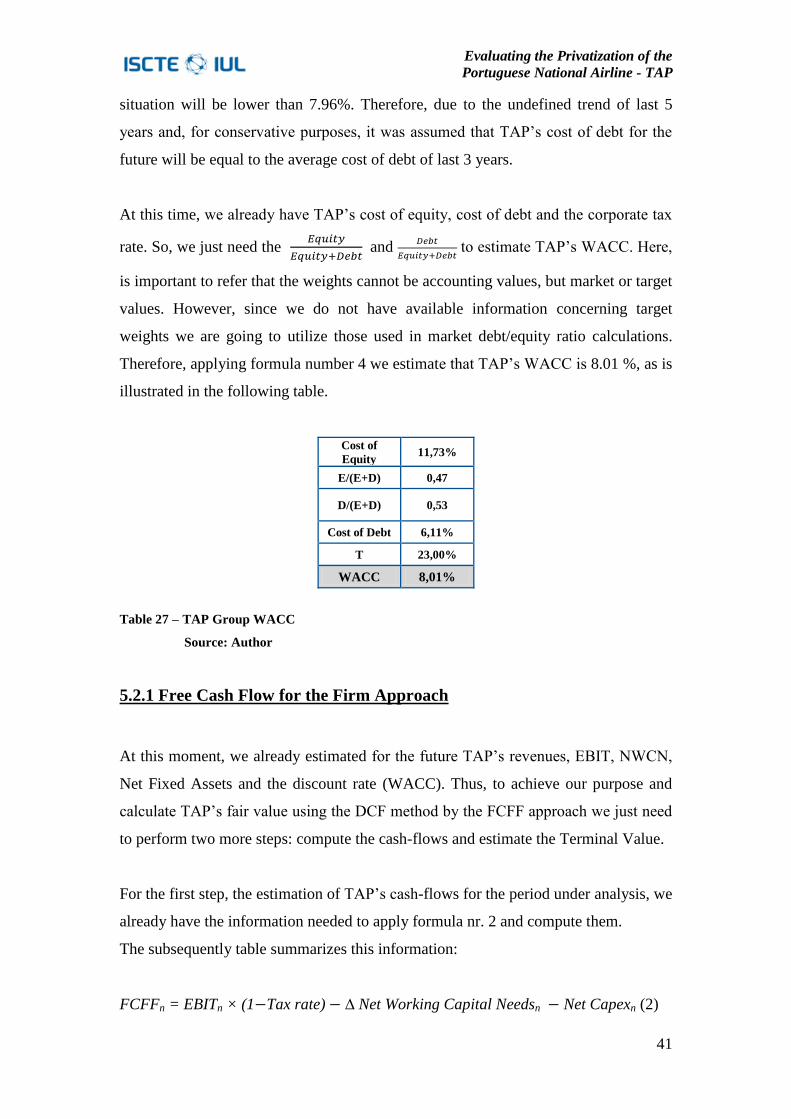
Evaluating the Privatization of the
Portuguese National Airline - TAP
41
situation will be lower than 7.96%. Therefore, due to the undefined trend of last 5
years and, for conservative purposes, it was assumed that TAP’s cost of debt for the
future will be equal to the average cost of debt of last 3 years.
At this time, we already have TAP’s cost of equity, cost of debt and the corporate tax
rate. So, we just need the
and
to estimate TAP’s WACC. Here,
is important to refer that the weights cannot be accounting values, but market or target
values. However, since we do not have available information concerning target
weights we are going to utilize those used in market debt/equity ratio calculations.
Therefore, applying formula number 4 we estimate that TAP’s WACC is 8.01 %, as is
illustrated in the following table.
Cost of
Equity 11,73%
E/(E+D) 0,47
D/(E+D) 0,53
Cost of Debt 6,11%
T 23,00%
WACC 8,01%
Table 27 – TAP Group WACC
Source: Author
5.2.1 Free Cash Flow for the Firm Approach
At this moment, we already estimated for the future TAP’s revenues, EBIT, NWCN,
Net Fixed Assets and the discount rate (WACC). Thus, to achieve our purpose and
calculate TAP’s fair value using the DCF method by the FCFF approach we just need
to perform two more steps: compute the cash-flows and estimate the Terminal Value.
For the first step, the estimation of TAP’s cash-flows for the period under analysis, we
already have the information needed to apply formula nr. 2 and compute them.
The subsequently table summarizes this information:
FCFFn = EBITn × (1 Tax rate) ∆ Net Working Capital Needsn Net Capexn (2)
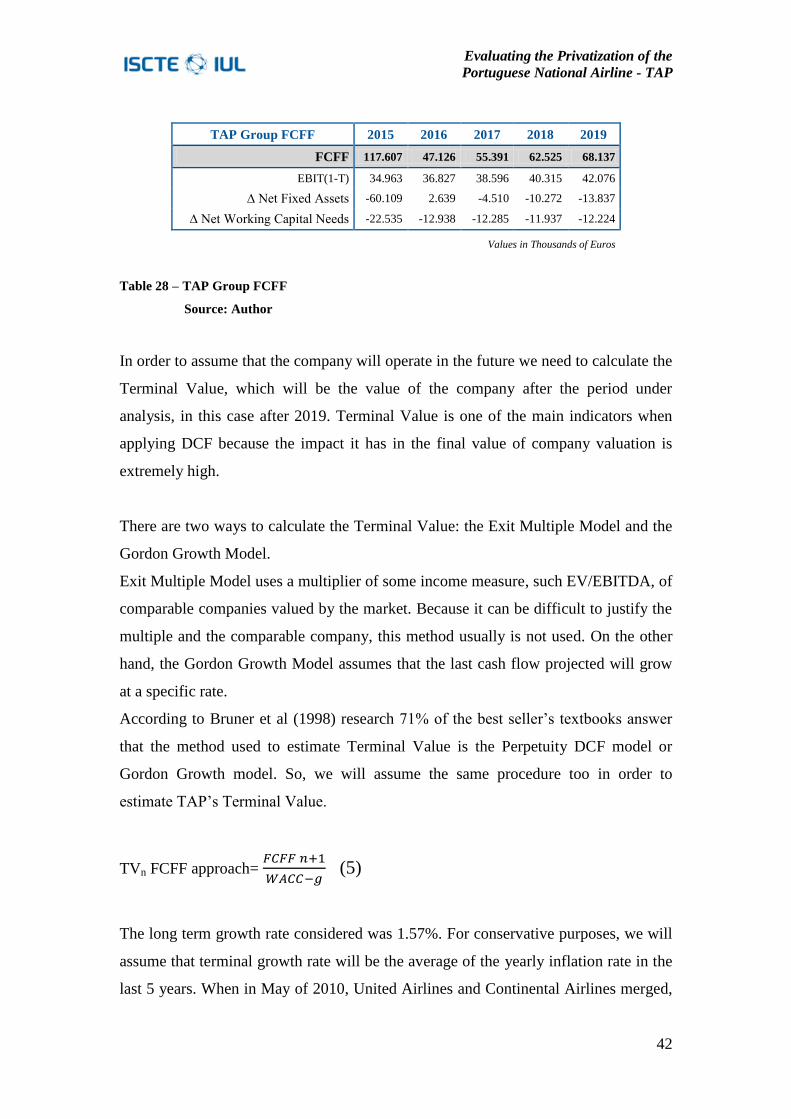
Evaluating the Privatization of the
Portuguese National Airline - TAP
42
TAP Group FCFF 2015 2016 2017 2018 2019
FCFF 117.607 47.126 55.391 62.525 68.137
EBIT(1-T) 34.963 36.827 38.596 40.315 42.076
∆ Net Fixed Assets -60.109 2.639 -4.510 -10.272 -13.837
∆ Net Working Capital Needs -22.535 -12.938 -12.285 -11.937 -12.224
Values in Thousands of Euros
Table 28 – TAP Group FCFF
Source: Author
In order to assume that the company will operate in the future we need to calculate the
Terminal Value, which will be the value of the company after the period under
analysis, in this case after 2019. Terminal Value is one of the main indicators when
applying DCF because the impact it has in the final value of company valuation is
extremely high.
There are two ways to calculate the Terminal Value: the Exit Multiple Model and the
Gordon Growth Model.
Exit Multiple Model uses a multiplier of some income measure, such EV/EBITDA, of
comparable companies valued by the market. Because it can be difficult to justify the
multiple and the comparable company, this method usually is not used. On the other
hand, the Gordon Growth Model assumes that the last cash flow projected will grow
at a specific rate.
According to Bruner et al (1998) research 71% of the best seller’s textbooks answer
that the method used to estimate Terminal Value is the Perpetuity DCF model or
Gordon Growth model. So, we will assume the same procedure too in order to
estimate TAP’s Terminal Value.
TVn FCFF approach=
(5)
The long term growth rate considered was 1.57%. For conservative purposes, we will
assume that terminal growth rate will be the average of the yearly inflation rate in the
last 5 years. When in May of 2010, United Airlines and Continental Airlines merged,
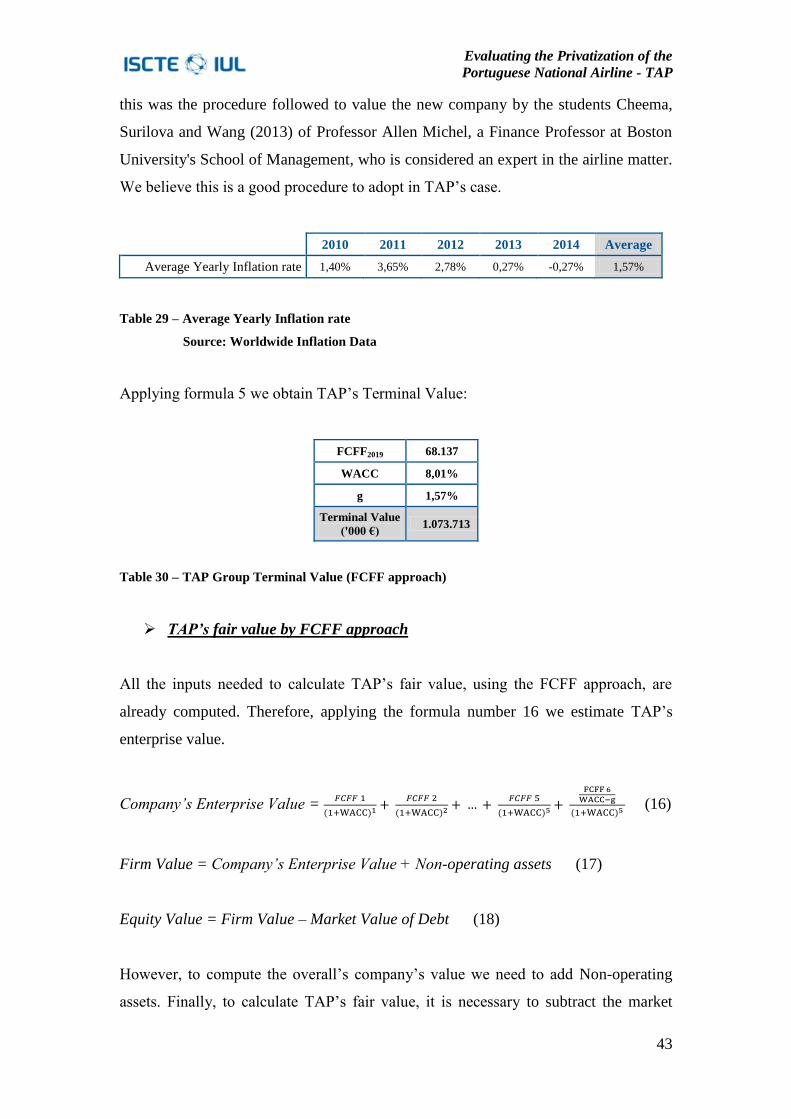
Evaluating the Privatization of the
Portuguese National Airline - TAP
43
this was the procedure followed to value the new company by the students Cheema,
Surilova and Wang (2013) of Professor Allen Michel, a Finance Professor at Boston
University's School of Management, who is considered an expert in the airline matter.
We believe this is a good procedure to adopt in TAP’s case.
2010 2011 2012 2013 2014 Average
Average Yearly Inflation rate 1,40% 3,65% 2,78% 0,27% -0,27% 1,57%
Table 29 – Average Yearly Inflation rate
Source: Worldwide Inflation Data
Applying formula 5 we obtain TAP’s Terminal Value:
FCFF2019 68.137
WACC 8,01%
g 1,57%
Terminal Value
('000 €) 1.073.713
Table 30 – TAP Group Terminal Value (FCFF approach)
TAP’s fair value by FCFF approach
All the inputs needed to calculate TAP’s fair value, using the FCFF approach, are
already computed. Therefore, applying the formula number 16 we estimate TAP’s
enterprise value.
Company’s Enterprise Value =
(16)
Firm Value = Company’s Enterprise Value + Non-operating assets (17)
Equity Value = Firm Value – Market Value of Debt (18)
However, to compute the overall’s company’s value we need to add Non-operating
assets. Finally, to calculate TAP’s fair value, it is necessary to subtract the market
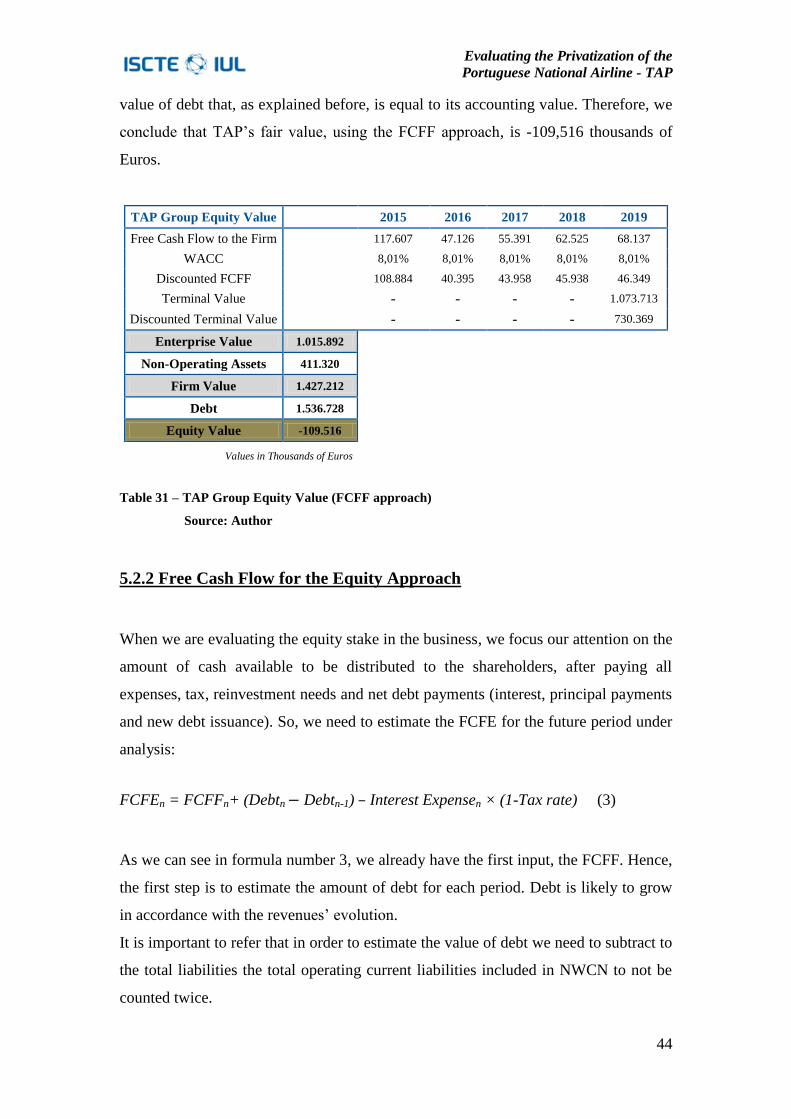
Evaluating the Privatization of the
Portuguese National Airline - TAP
44
value of debt that, as explained before, is equal to its accounting value. Therefore, we
conclude that TAP’s fair value, using the FCFF approach, is -109,516 thousands of
Euros.
TAP Group Equity Value 2015 2015 2016 2017 2018 2019
Free Cash Flow to the Firm
117.607 47.126 55.391 62.525 68.137
WACC
8,01% 8,01% 8,01% 8,01% 8,01%
Discounted FCFF
108.884 40.395 43.958 45.938 46.349
Terminal Value
- - - - 1.073.713
Discounted Terminal Value
- - - - 730.369
Enterprise Value 1.015.892
Non-Operating Assets 411.320
Firm Value 1.427.212
Debt 1.536.728
Equity Value -109.516
Values in Thousands of Euros
Table 31 – TAP Group Equity Value (FCFF approach)
Source: Author
5.2.2 Free Cash Flow for the Equity Approach
When we are evaluating the equity stake in the business, we focus our attention on the
amount of cash available to be distributed to the shareholders, after paying all
expenses, tax, reinvestment needs and net debt payments (interest, principal payments
and new debt issuance). So, we need to estimate the FCFE for the future period under
analysis:
FCFEn = FCFFn+ (Debtn Debtn-1) – Interest Expensen × (1-Tax rate) (3)
As we can see in formula number 3, we already have the first input, the FCFF. Hence,
the first step is to estimate the amount of debt for each period. Debt is likely to grow
in accordance with the revenues’ evolution.
It is important to refer that in order to estimate the value of debt we need to subtract to
the total liabilities the total operating current liabilities included in NWCN to not be
counted twice.
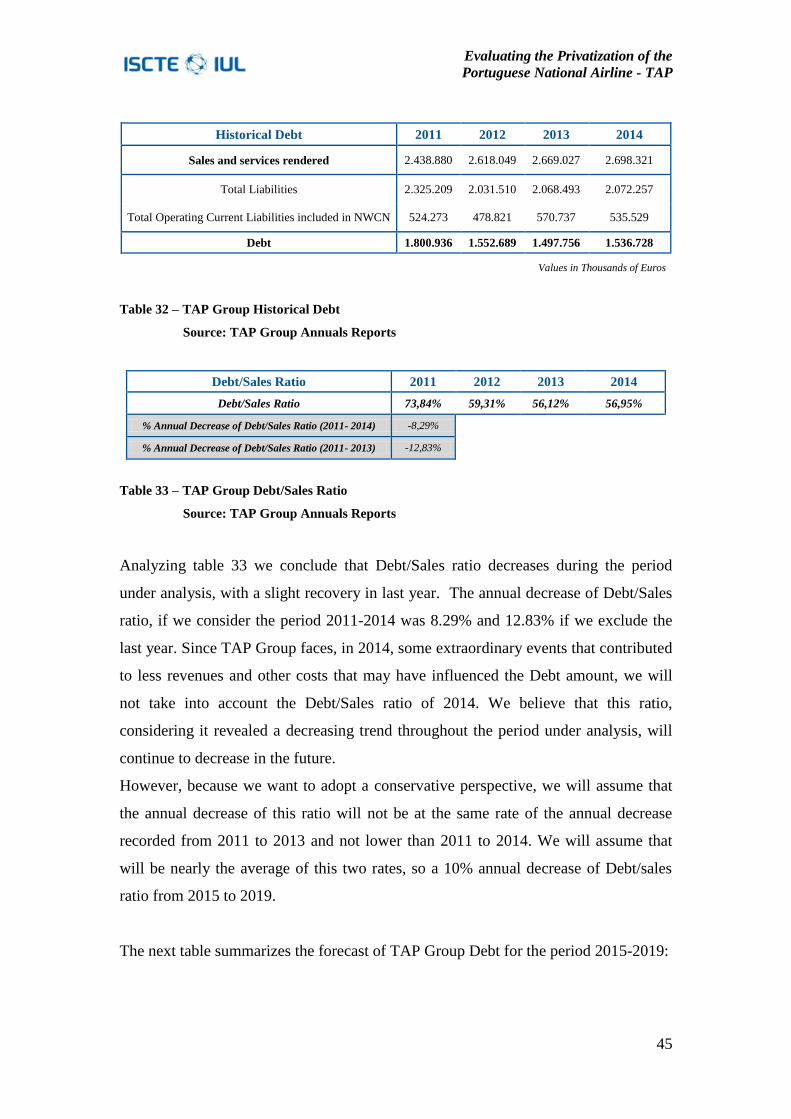
Evaluating the Privatization of the
Portuguese National Airline - TAP
45
Historical Debt 2011 2012 2013 2014
Sales and services rendered 2.438.880 2.618.049 2.669.027 2.698.321
Total Liabilities 2.325.209 2.031.510 2.068.493 2.072.257
Total Operating Current Liabilities included in NWCN 524.273 478.821 570.737 535.529
Debt 1.800.936 1.552.689 1.497.756 1.536.728
Values in Thousands of Euros
Table 32 – TAP Group Historical Debt
Source: TAP Group Annuals Reports
Debt/Sales Ratio 2011 2012 2013 2014
Debt/Sales Ratio 73,84% 59,31% 56,12% 56,95%
% Annual Decrease of Debt/Sales Ratio (2011- 2014) -8,29%
% Annual Decrease of Debt/Sales Ratio (2011- 2013) -12,83%
Table 33 – TAP Group Debt/Sales Ratio
Source: TAP Group Annuals Reports
Analyzing table 33 we conclude that Debt/Sales ratio decreases during the period
under analysis, with a slight recovery in last year. The annual decrease of Debt/Sales
ratio, if we consider the period 2011-2014 was 8.29% and 12.83% if we exclude the
last year. Since TAP Group faces, in 2014, some extraordinary events that contributed
to less revenues and other costs that may have influenced the Debt amount, we will
not take into account the Debt/Sales ratio of 2014. We believe that this ratio,
considering it revealed a decreasing trend throughout the period under analysis, will
continue to decrease in the future.
However, because we want to adopt a conservative perspective, we will assume that
the annual decrease of this ratio will not be at the same rate of the annual decrease
recorded from 2011 to 2013 and not lower than 2011 to 2014. We will assume that
will be nearly the average of this two rates, so a 10% annual decrease of Debt/sales
ratio from 2015 to 2019.
The next table summarizes the forecast of TAP Group Debt for the period 2015-2019:
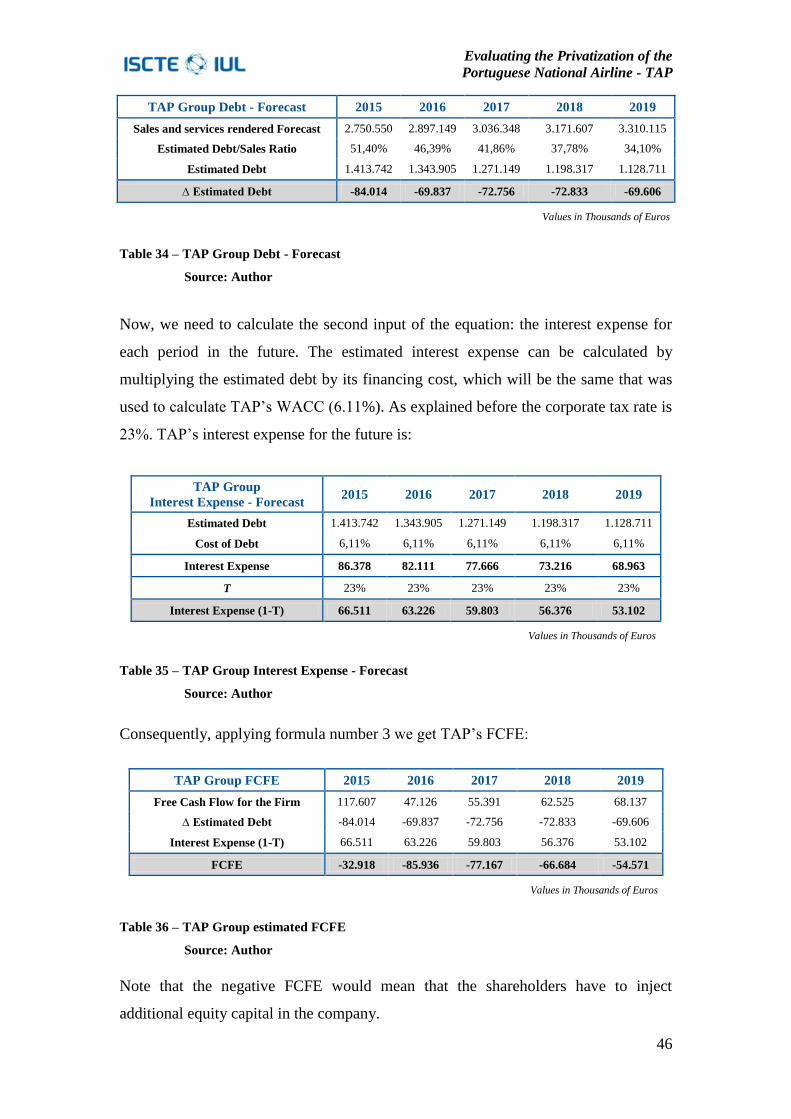
Evaluating the Privatization of the
Portuguese National Airline - TAP
46
TAP Group Debt - Forecast 2015 2016 2017 2018 2019
Sales and services rendered Forecast 2.750.550 2.897.149 3.036.348 3.171.607 3.310.115
Estimated Debt/Sales Ratio 51,40% 46,39% 41,86% 37,78% 34,10%
Estimated Debt 1.413.742 1.343.905 1.271.149 1.198.317 1.128.711
∆ Estimated Debt -84.014 -69.837 -72.756 -72.833 -69.606
Values in Thousands of Euros
Table 34 – TAP Group Debt - Forecast
Source: Author
Now, we need to calculate the second input of the equation: the interest expense for
each period in the future. The estimated interest expense can be calculated by
multiplying the estimated debt by its financing cost, which will be the same that was
used to calculate TAP’s WACC (6.11%). As explained before the corporate tax rate is
23%. TAP’s interest expense for the future is:
TAP Group
Interest Expense - Forecast 2015 2016 2017 2018 2019
Estimated Debt 1.413.742 1.343.905 1.271.149 1.198.317 1.128.711
Cost of Debt 6,11% 6,11% 6,11% 6,11% 6,11%
Interest Expense 86.378 82.111 77.666 73.216 68.963
T 23% 23% 23% 23% 23%
Interest Expense (1-T) 66.511 63.226 59.803 56.376 53.102
Values in Thousands of Euros
Table 35 – TAP Group Interest Expense - Forecast
Source: Author
Consequently, applying formula number 3 we get TAP’s FCFE:
TAP Group FCFE 2015 2016 2017 2018 2019
Free Cash Flow for the Firm 117.607 47.126 55.391 62.525 68.137
∆ Estimated Debt -84.014 -69.837 -72.756 -72.833 -69.606
Interest Expense (1-T) 66.511 63.226 59.803 56.376 53.102
FCFE -32.918 -85.936 -77.167 -66.684 -54.571
Values in Thousands of Euros
Table 36 – TAP Group estimated FCFE
Source: Author
Note that the negative FCFE would mean that the shareholders have to inject
additional equity capital in the company.
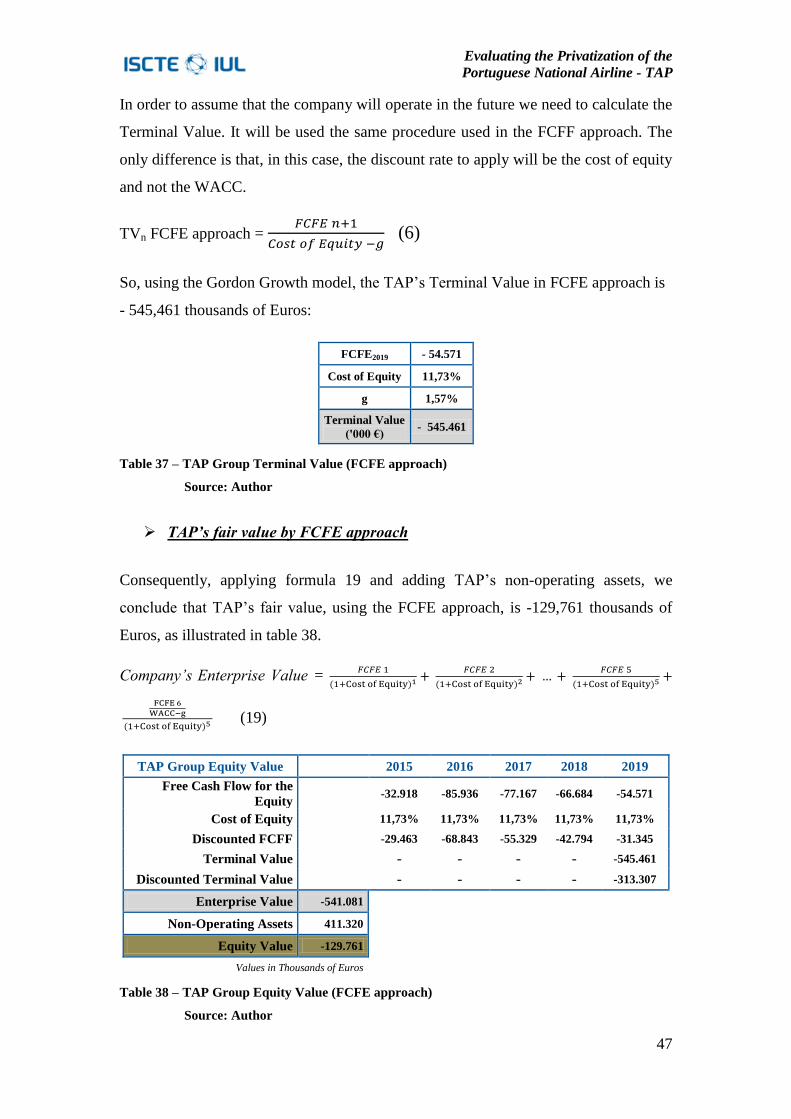
Evaluating the Privatization of the
Portuguese National Airline - TAP
47
In order to assume that the company will operate in the future we need to calculate the
Terminal Value. It will be used the same procedure used in the FCFF approach. The
only difference is that, in this case, the discount rate to apply will be the cost of equity
and not the WACC.
TVn FCFE approach =
(6)
So, using the Gordon Growth model, the TAP’s Terminal Value in FCFE approach is
- 545,461 thousands of Euros:
FCFE2019 - 54.571
Cost of Equity 11,73%
g 1,57%
Terminal Value
('000 €) - 545.461
Table 37 – TAP Group Terminal Value (FCFE approach)
Source: Author
TAP’s fair value by FCFE approach
Consequently, applying formula 19 and adding TAP’s non-operating assets, we
conclude that TAP’s fair value, using the FCFE approach, is -129,761 thousands of
Euros, as illustrated in table 38.
Company’s Enterprise Value =
(19)
TAP Group Equity Value 2015 2015 2016 2017 2018 2019
Free Cash Flow for the
Equity -32.918 -85.936 -77.167 -66.684 -54.571
Cost of Equity
11,73% 11,73% 11,73% 11,73% 11,73%
Discounted FCFF
-29.463 -68.843 -55.329 -42.794 -31.345
Terminal Value
- - - - -545.461
Discounted Terminal Value
- - - - -313.307
Enterprise Value -541.081
Non-Operating Assets 411.320
Equity Value -129.761
Values in Thousands of Euros
Table 38 – TAP Group Equity Value (FCFE approach)
Source: Author
Evaluating the Privatization of the
Portuguese National Airline - TAP
48
Note that the negative values that were obtained in this case are not very realistic. The
shareholders would not be interested in investing additional money in the company.
The required rate of return should be lower due to the reduction of debt, but as we
would get a negative equity value we would not be able to determine a suitable D/E
ratio, that is why we decided to keep the cost of equity constant. This is just a way of
showing that the equity value of the company under this set of assumptions is
negative!
Evaluating the Privatization of the
Portuguese National Airline - TAP
49
5.3 Valuation of Firms with negative earnings
As explained before, a company with negative earnings is more difficult to value than
companies with positive earnings because: there is the real possibility that these
companies will go bankrupt if earnings continue negative, the taxes prediction
becomes more difficult to obtain and estimating the earnings growth rate is difficult
because when current earnings are negative, applying a growth rate will just make it
even worse.
Typically in most valuation methods we have looked for companies that have positive
earnings. It cannot be said that these methods cannot be applied to firms that have
negative earnings. However, they need to be applied carefully in order to adapt and
reflect the underlying reasons that generate these negative earnings.
Damodaran (2004) explores the alternatives that he considers available to value
companies with negative earnings. In the case of TAP Group, a company with long
negative financial record, which is facing a privatization process, Damodaran (2004)
defends that there is a valuation method that can be extremely useful to apply when
valuing companies in this situation. Therefore, in order to get a better understanding
of what can be TAP’s fair value we will perform this valuation method too, as is
illustrated below:
Value of the Firm =
(7)
Where,
Reinvestment Rate =
(8)
At this moment, we already have almost inputs needed to estimate TAP’s fair value,
since they were calculated in the DCF valuation method. Yet, we need to perform
another step, which is estimate what can be TAP’s ROIC.
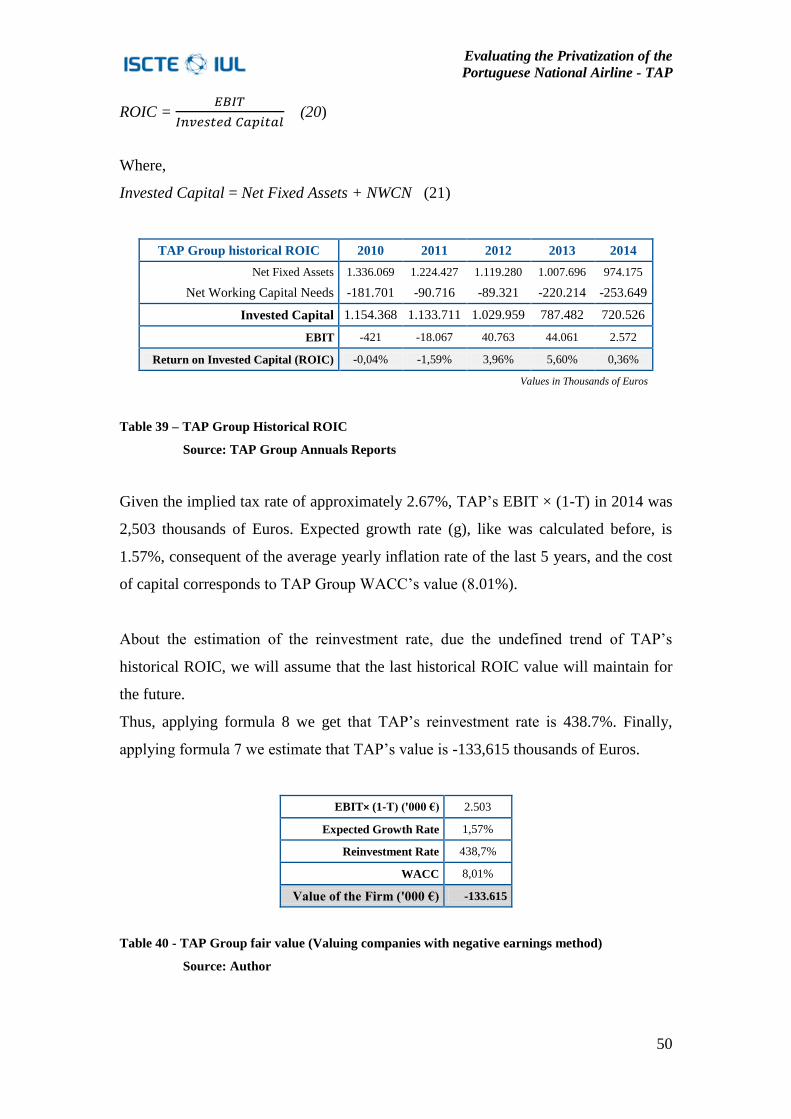
Evaluating the Privatization of the
Portuguese National Airline - TAP
50
ROIC =
(20)
Where,
Invested Capital = Net Fixed Assets + NWCN (21)
TAP Group historical ROIC 2010 2011 2012 2013 2014
Net Fixed Assets 1.336.069 1.224.427 1.119.280 1.007.696 974.175
Net Working Capital Needs -181.701 -90.716 -89.321 -220.214 -253.649
Invested Capital 1.154.368 1.133.711 1.029.959 787.482 720.526
EBIT -421 -18.067 40.763 44.061 2.572
Return on Invested Capital (ROIC) -0,04% -1,59% 3,96% 5,60% 0,36%
Values in Thousands of Euros
Table 39 – TAP Group Historical ROIC
Source: TAP Group Annuals Reports
Given the implied tax rate of approximately 2.67%, TAP’s EBIT × (1-T) in 2014 was
2,503 thousands of Euros. Expected growth rate (g), like was calculated before, is
1.57%, consequent of the average yearly inflation rate of the last 5 years, and the cost
of capital corresponds to TAP Group WACC’s value (8.01%).
About the estimation of the reinvestment rate, due the undefined trend of TAP’s
historical ROIC, we will assume that the last historical ROIC value will maintain for
the future.
Thus, applying formula 8 we get that TAP’s reinvestment rate is 438.7%. Finally,
applying formula 7 we estimate that TAP’s value is -133,615 thousands of Euros.
EBIT× (1-T) ('000 €) 2.503
Expected Growth Rate 1,57%
Reinvestment Rate 438,7%
WACC 8,01%
Value of the Firm ('000 €) -133.615
Table 40 - TAP Group fair value (Valuing companies with negative earnings method)
Source: Author
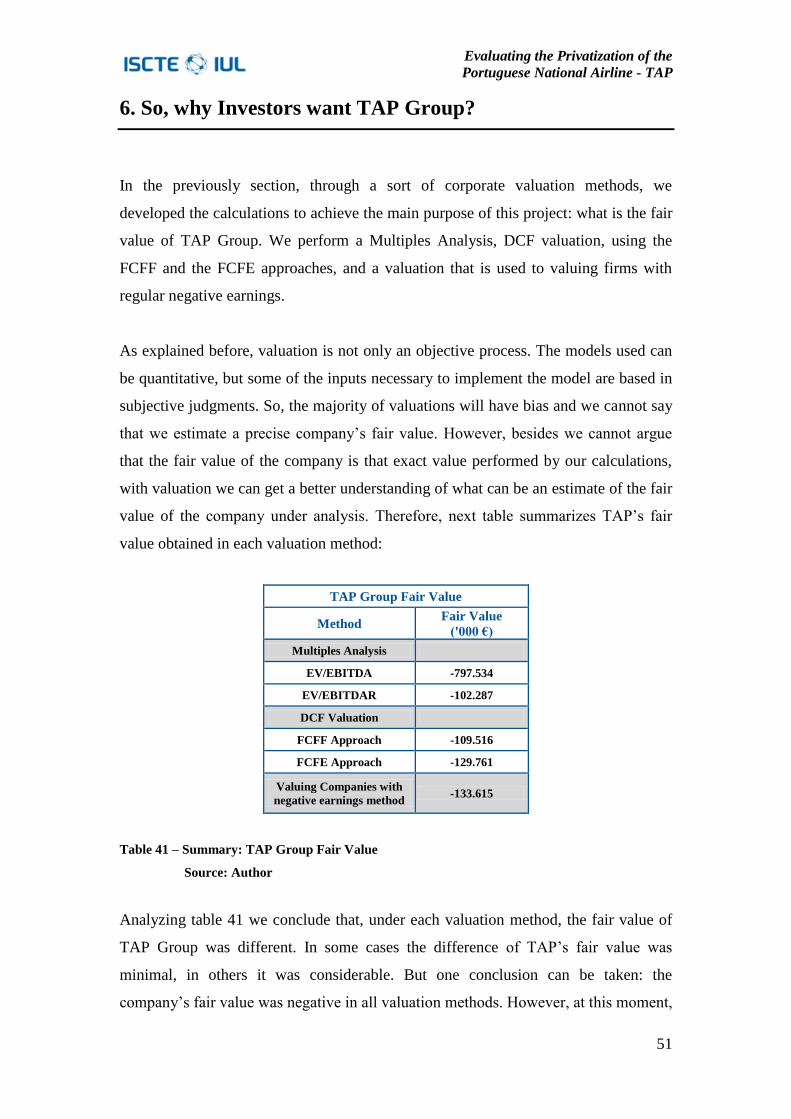
Evaluating the Privatization of the
Portuguese National Airline - TAP
51
6. So, why Investors want TAP Group?
In the previously section, through a sort of corporate valuation methods, we
developed the calculations to achieve the main purpose of this project: what is the fair
value of TAP Group. We perform a Multiples Analysis, DCF valuation, using the
FCFF and the FCFE approaches, and a valuation that is used to valuing firms with
regular negative earnings.
As explained before, valuation is not only an objective process. The models used can
be quantitative, but some of the inputs necessary to implement the model are based in
subjective judgments. So, the majority of valuations will have bias and we cannot say
that we estimate a precise company’s fair value. However, besides we cannot argue
that the fair value of the company is that exact value performed by our calculations,
with valuation we can get a better understanding of what can be an estimate of the fair
value of the company under analysis. Therefore, next table summarizes TAP’s fair
value obtained in each valuation method:
TAP Group Fair Value
Method Fair Value
('000 €)
Multiples Analysis
EV/EBITDA -797.534
EV/EBITDAR -102.287
DCF Valuation
FCFF Approach -109.516
FCFE Approach -129.761
Valuing Companies with
negative earnings method -133.615
Table 41 – Summary: TAP Group Fair Value
Source: Author
Analyzing table 41 we conclude that, under each valuation method, the fair value of
TAP Group was different. In some cases the difference of TAP’s fair value was
minimal, in others it was considerable. But one conclusion can be taken: the
company’s fair value was negative in all valuation methods. However, at this moment,
Evaluating the Privatization of the
Portuguese National Airline - TAP
52
we will not focus our attention in what is the approximately TAP’s fair value. This
will be a reflection for the Conclusions’ section. Instead, and taking into account the
first and general conclusion (TAP’s fair value was negative in all methods) we will try
to answer the following questions: Since TAP Group fair value is negative, why are
there investors interested in the company? Moreover, they know that actually TAP
Group is facing several financial problems and yet they want to invest? Are they
unconscious?
In order to answer these questions we will develop a sensitivity analysis to TAP’s
valuation because we believe that in the end it is the company’s fair value that
influences the investment decision. If the investor believes a company has value then
we will invest on it.
In the actual group’s financial situation we believe that the value of the company is
negative since it has negative equity, a high level of debt and consistently generates
negative net incomes. There is no sense to apply a sensitivity analysis to valuation
methods that look only at the historical performance. Basically, the concept is that
TAP can create value if it becomes a better company in the future. Therefore, we will
perform a sensitivity analysis using only DCF valuation since the value of a company
is related with the present value of expected future cash flows generated by the
company. The sensitivity analysis will focus in the key factors that influence, in
general, all the companies in the world: Revenues and Efficiency.
Analyzing the income part, we will perform two scenarios against the standard
valuation. Firstly, we will assume a worst scenario, assuming that the annual growth
rate for revenues will be lower 2% against the standard valuation. There is this
possibility since it depends on many factors, some of them related with economic
conditions that can influence a company’s income. On the other hand, it will be
performed a better scenario, assuming that in the future revenues will grow in line
with the industry. Remember that, for conservative purposes, in our valuation we
assumed TAP’s air transport revenues would be in the future 1.94% lower than the
industry behavior, exactly the average difference recorded from 2011 to 2014. The
following tables summarize the results obtained:
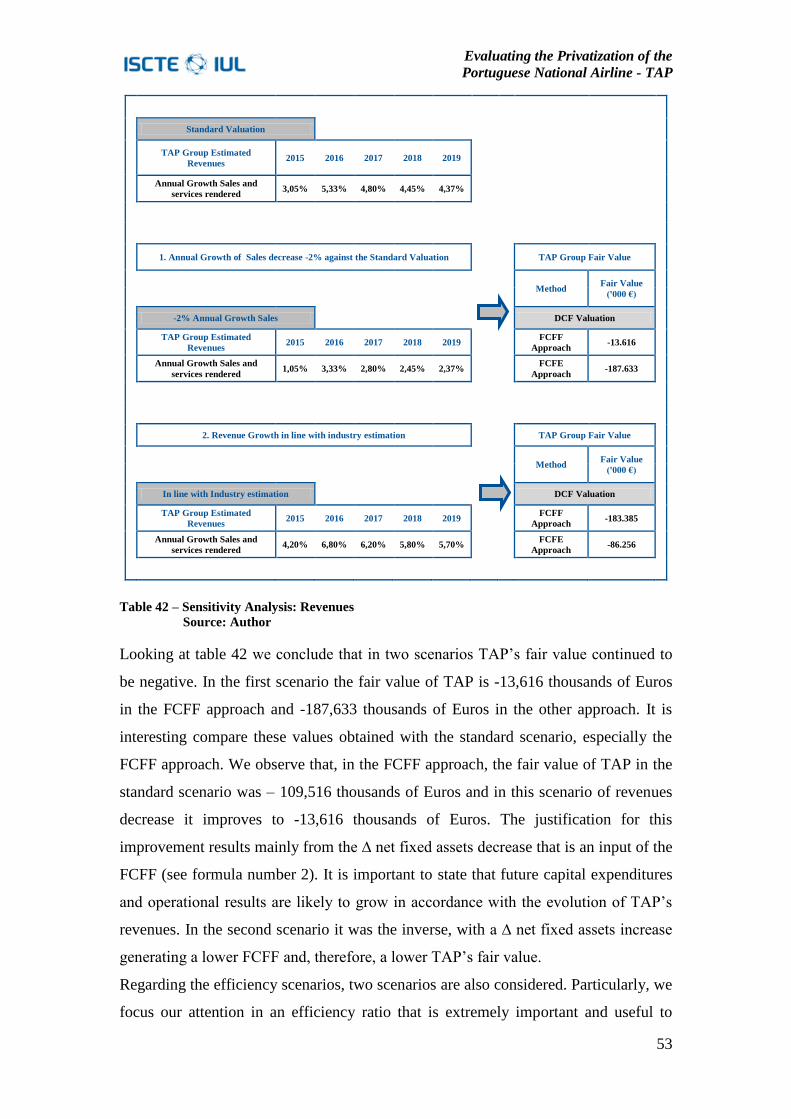
Evaluating the Privatization of the
Portuguese National Airline - TAP
53
Standard Valuation
TAP Group Estimated
Revenues 2015 2016 2017 2018 2019
Annual Growth Sales and
services rendered 3,05% 5,33% 4,80% 4,45% 4,37%
1. Annual Growth of Sales decrease -2% against the Standard Valuation
TAP Group Fair Value
Method Fair Value
('000 €)
-2% Annual Growth Sales
DCF Valuation
TAP Group Estimated
Revenues 2015 2016 2017 2018 2019
FCFF
Approach -13.616
Annual Growth Sales and
services rendered 1,05% 3,33% 2,80% 2,45% 2,37%
FCFE
Approach -187.633
2. Revenue Growth in line with industry estimation
TAP Group Fair Value
Method Fair Value
('000 €)
In line with Industry estimation
DCF Valuation
TAP Group Estimated
Revenues 2015 2016 2017 2018 2019
FCFF
Approach -183.385
Annual Growth Sales and
services rendered 4,20% 6,80% 6,20% 5,80% 5,70%
FCFE
Approach -86.256
Table 42 – Sensitivity Analysis: Revenues
Source: Author
Looking at table 42 we conclude that in two scenarios TAP’s fair value continued to
be negative. In the first scenario the fair value of TAP is -13,616 thousands of Euros
in the FCFF approach and -187,633 thousands of Euros in the other approach. It is
interesting compare these values obtained with the standard scenario, especially the
FCFF approach. We observe that, in the FCFF approach, the fair value of TAP in the
standard scenario was – 109,516 thousands of Euros and in this scenario of revenues
decrease it improves to -13,616 thousands of Euros. The justification for this
improvement results mainly from the ∆ net fixed assets decrease that is an input of the
FCFF (see formula number 2). It is important to state that future capital expenditures
and operational results are likely to grow in accordance with the evolution of TAP’s
revenues. In the second scenario it was the inverse, with a ∆ net fixed assets increase
generating a lower FCFF and, therefore, a lower TAP’s fair value.
Regarding the efficiency scenarios, two scenarios are also considered. Particularly, we
focus our attention in an efficiency ratio that is extremely important and useful to
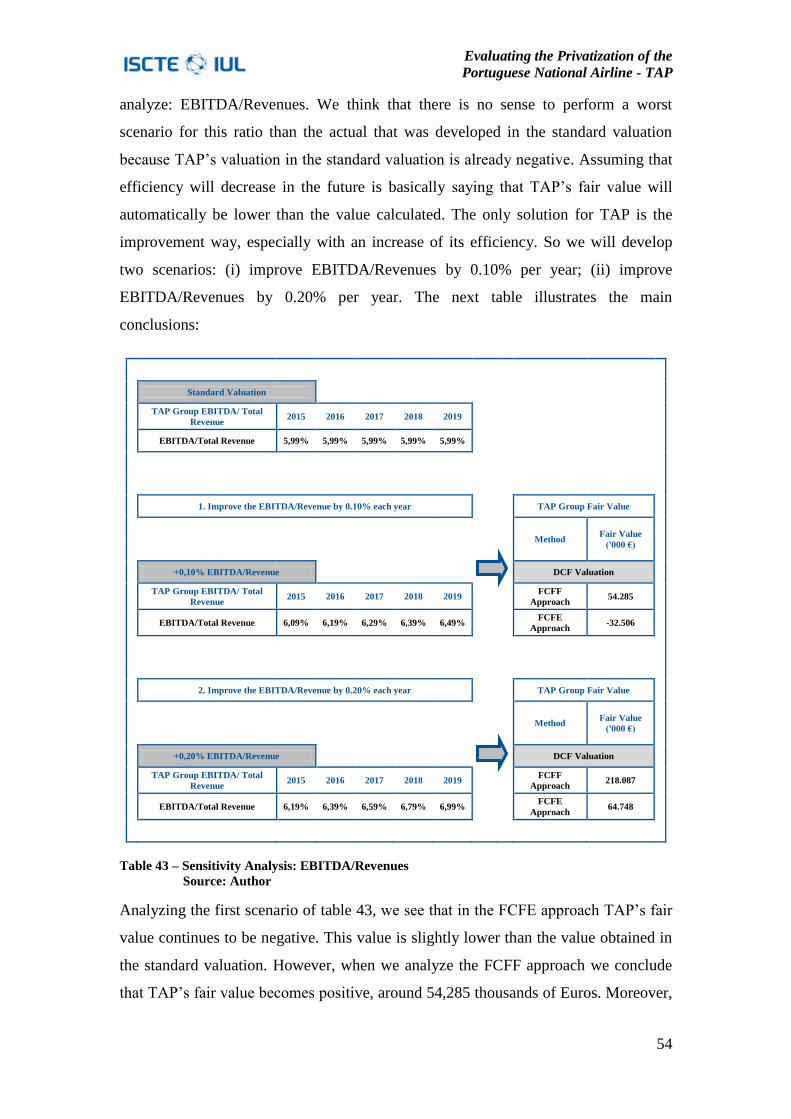
Evaluating the Privatization of the
Portuguese National Airline - TAP
54
analyze: EBITDA/Revenues. We think that there is no sense to perform a worst
scenario for this ratio than the actual that was developed in the standard valuation
because TAP’s valuation in the standard valuation is already negative. Assuming that
efficiency will decrease in the future is basically saying that TAP’s fair value will
automatically be lower than the value calculated. The only solution for TAP is the
improvement way, especially with an increase of its efficiency. So we will develop
two scenarios: (i) improve EBITDA/Revenues by 0.10% per year; (ii) improve
EBITDA/Revenues by 0.20% per year. The next table illustrates the main
conclusions:
Standard Valuation
TAP Group EBITDA/ Total
Revenue 2015 2016 2017 2018 2019
EBITDA/Total Revenue 5,99% 5,99% 5,99% 5,99% 5,99%
1. Improve the EBITDA/Revenue by 0.10% each year
TAP Group Fair Value
Method Fair Value
('000 €)
+0,10% EBITDA/Revenue
DCF Valuation
TAP Group EBITDA/ Total
Revenue 2015 2016 2017 2018 2019
FCFF
Approach 54.285
EBITDA/Total Revenue 6,09% 6,19% 6,29% 6,39% 6,49%
FCFE
Approach -32.506
2. Improve the EBITDA/Revenue by 0.20% each year
TAP Group Fair Value
Method Fair Value
('000 €)
+0,20% EBITDA/Revenue
DCF Valuation
TAP Group EBITDA/ Total
Revenue 2015 2016 2017 2018 2019
FCFF
Approach 218.087
EBITDA/Total Revenue 6,19% 6,39% 6,59% 6,79% 6,99%
FCFE
Approach 64.748
Table 43 – Sensitivity Analysis: EBITDA/Revenues
Source: Author
Analyzing the first scenario of table 43, we see that in the FCFE approach TAP’s fair
value continues to be negative. This value is slightly lower than the value obtained in
the standard valuation. However, when we analyze the FCFF approach we conclude
that TAP’s fair value becomes positive, around 54,285 thousands of Euros. Moreover,
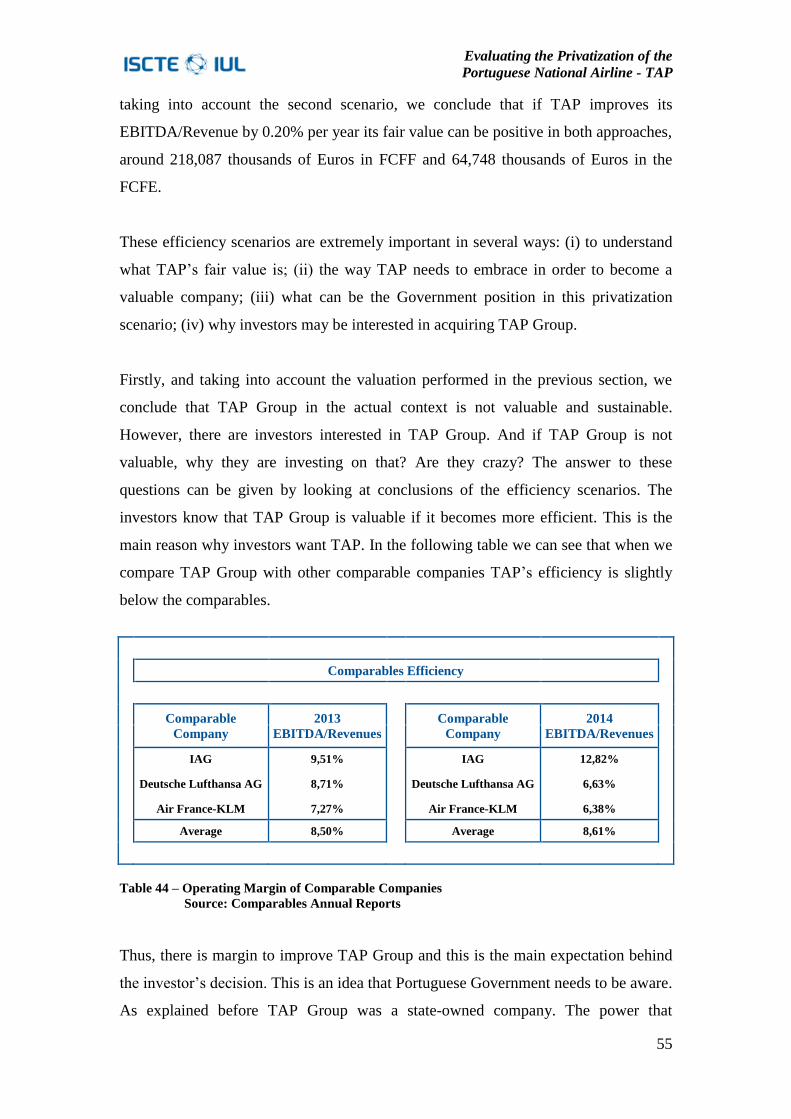
Evaluating the Privatization of the
Portuguese National Airline - TAP
55
taking into account the second scenario, we conclude that if TAP improves its
EBITDA/Revenue by 0.20% per year its fair value can be positive in both approaches,
around 218,087 thousands of Euros in FCFF and 64,748 thousands of Euros in the
FCFE.
These efficiency scenarios are extremely important in several ways: (i) to understand
what TAP’s fair value is; (ii) the way TAP needs to embrace in order to become a
valuable company; (iii) what can be the Government position in this privatization
scenario; (iv) why investors may be interested in acquiring TAP Group.
Firstly, and taking into account the valuation performed in the previous section, we
conclude that TAP Group in the actual context is not valuable and sustainable.
However, there are investors interested in TAP Group. And if TAP Group is not
valuable, why they are investing on that? Are they crazy? The answer to these
questions can be given by looking at conclusions of the efficiency scenarios. The
investors know that TAP Group is valuable if it becomes more efficient. This is the
main reason why investors want TAP. In the following table we can see that when we
compare TAP Group with other comparable companies TAP’s efficiency is slightly
below the comparables.
Comparables Efficiency
Comparable
Company
2013
EBITDA/Revenues Comparable
Company
2014
EBITDA/Revenues
IAG 9,51%
IAG 12,82%
Deutsche Lufthansa AG 8,71%
Deutsche Lufthansa AG 6,63%
Air France-KLM 7,27%
Air France-KLM 6,38%
Average 8,50%
Average 8,61%
Table 44 – Operating Margin of Comparable Companies
Source: Comparables Annual Reports
Thus, there is margin to improve TAP Group and this is the main expectation behind
the investor’s decision. This is an idea that Portuguese Government needs to be aware.
As explained before TAP Group was a state-owned company. The power that
Evaluating the Privatization of the
Portuguese National Airline - TAP
56
Governments continue to have on how they are run and the sheer size of these
companies makes change slow. Thus, generally, it is expected that adjustments are
much quicker if a company becomes private and therefore, becomes more efficient.
In other hand, the power of unions to preserve existing jobs is extremely higher,
especially in public companies. We assist in last year’s to several staff strikes that cost
thousands of Euros to TAP. In a privatization scenario it is expected that this
extraordinary costs will decrease.
Finally, it is important to look at the actual structure of the Group, and analyze if it
can be more profitable and if make sense maintain some assets. For instance, when we
analyze TAP’s annual reports we conclude that companies such Portugália, S.A. or
TAPGER were profitable in the past. On the other hand, when we look for TAP –
Maintenance and Engineering Brazil we conclude that this company has consistently
negative net incomes, besides the entity continued its process of development, aimed
at improving its operating performance, in what was the third of a five years
restructuring plan. Analyzing the segmental reporting of TAP’s 2014 annual report we
see that the operating maintenance in Brazil generates a loss of - 22,603 thousands of
Euros during the year and in 2013 was - 40,351 thousands of Euros. In spite of the
improvement occurred for the third consecutive year, the results still extremely
negative and we assume that is not expected to change too much and become positive
until the end of the restructuring plan. Currently, TAP Group is facing several
financial problems: the recurrent lack of profitability, a level of debt extremely high
which contributes to a high financing cost, and the need to reinforce its capital
through a recapitalization process. Therefore, we realize that TAP – Maintenance
and Engineering Brazil is not a valuable asset at this moment and the Group should
think in selling this asset. The main problem here is finding someone who wants to
buy it.
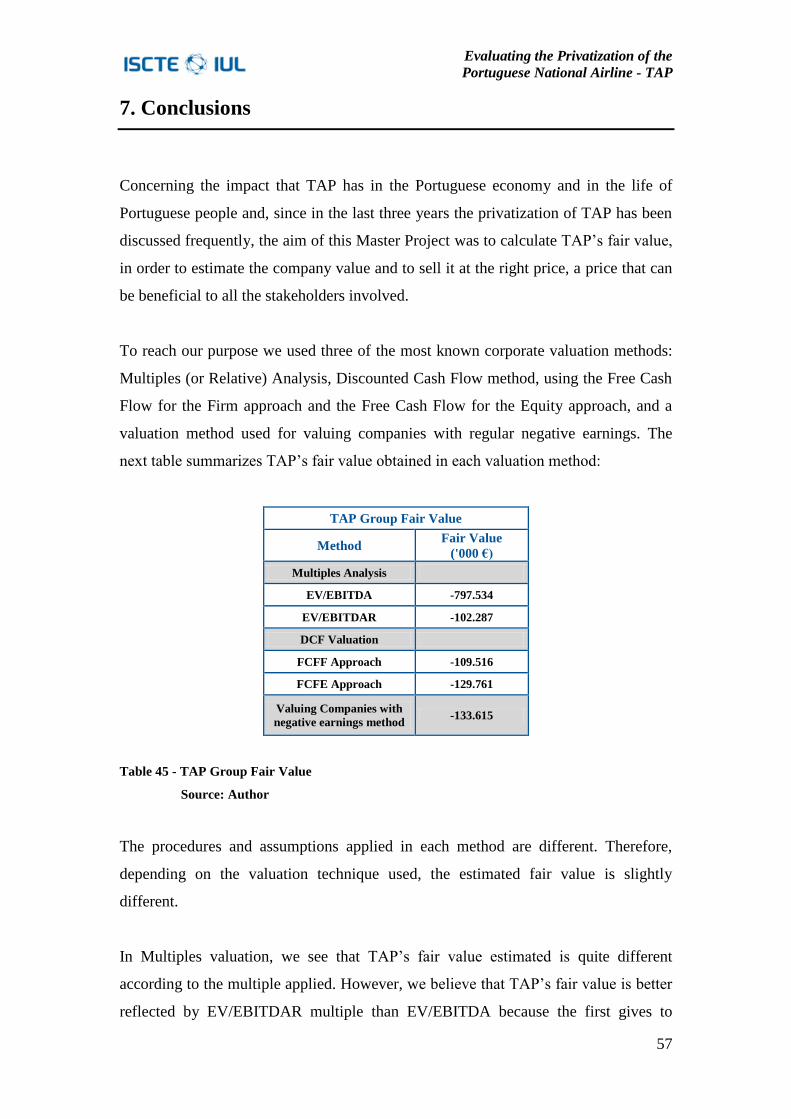
Evaluating the Privatization of the
Portuguese National Airline - TAP
57
7. Conclusions
Concerning the impact that TAP has in the Portuguese economy and in the life of
Portuguese people and, since in the last three years the privatization of TAP has been
discussed frequently, the aim of this Master Project was to calculate TAP’s fair value,
in order to estimate the company value and to sell it at the right price, a price that can
be beneficial to all the stakeholders involved.
To reach our purpose we used three of the most known corporate valuation methods:
Multiples (or Relative) Analysis, Discounted Cash Flow method, using the Free Cash
Flow for the Firm approach and the Free Cash Flow for the Equity approach, and a
valuation method used for valuing companies with regular negative earnings. The
next table summarizes TAP’s fair value obtained in each valuation method:
TAP Group Fair Value
Method Fair Value
('000 €)
Multiples Analysis
EV/EBITDA -797.534
EV/EBITDAR -102.287
DCF Valuation
FCFF Approach -109.516
FCFE Approach -129.761
Valuing Companies with
negative earnings method -133.615
Table 45 - TAP Group Fair Value
Source: Author
The procedures and assumptions applied in each method are different. Therefore,
depending on the valuation technique used, the estimated fair value is slightly
different.
In Multiples valuation, we see that TAP’s fair value estimated is quite different
according to the multiple applied. However, we believe that TAP’s fair value is better
reflected by EV/EBITDAR multiple than EV/EBITDA because the first gives to
Evaluating the Privatization of the
Portuguese National Airline - TAP
58
evaluator a more accurate perspective of the company and is able to represent some
specific characteristics of the airline industry (company owns vs. leases the aircraft).
On the DCF valuation, besides the differences between the two approaches, we get an
approximate company’s fair value. TAP’s fair value estimated on the third method
was slightly higher than DCF valuation and EV/EBITDAR multiple.
The more consistent and reliable method is a subjective process. Some analysts prefer
one method and other prefer others. For instance, DCF looks at the company’s
behavior in the past in order to predict its intrinsic growth in the future and relative
valuation looks to similar companies traded in financial markets. Valuation is not only
an objective process and the majority of valuations will have bias, so we cannot say
that we estimate a precise company’s fair value.
We believe and conclude that TAP’s fair value should be somewhere between -
102,287 thousands of Euros, value estimated using the EV/EBITDAR multiple, and -
133,615 thousands of Euros, value obtained by using the valuation method used to
valuing companies with regular negative earnings.
The values estimated in our valuation were slightly different from the independent
valuation. According to Sérgio Monteiro, the Secretary of State for Transports, the
independent evaluations pointed to a TAP’s value between -274 million Euros and -
512 million Euros and, even with the reinforcement of TAP’s capital required in the
offer, TAP Group would have a negative economic value between -36 million Euros
and -140 million Euros.
Here, we consider that it is not relevant to understand who is right or wrong. Once
again, it is essential to point out that valuation is a subjective process, and depending
on the assumptions assumed by the different evaluators (where sometimes a small
change in a specific input can produce a big change in the final result) and the
methods used to value the company the final values can be different.
However, it is important to refer that, besides the differences in TAP’s fair value, the
main conclusions obtained by the different evaluators were similar: in the actual
context TAP Group fair value is negative.
Considering the range of negative TAP’s fair value estimated and transposing this to
the privatization process of 66 % of company’s capital, we consider that it is
Evaluating the Privatization of the
Portuguese National Airline - TAP
59
reasonable for the Portuguese Government to transfer its capital and the inherent
obligations to the investors without receiving any money for the transaction.
Still, it is extremely important to keep in mind that TAP Group is valuable, if it
becomes more efficiently. It is expected that a private company could perform
adjustments much quicker than a state-owned company. Moreover, it is important to
remember one limitation of this project: the value of the indirect exports wealth
generated by TAP for the country. This value is extremely difficult to measure, reason
why it was not assumed in the valuation. But, Portuguese Government should also
take this into account.
However, we cannot be unrealistic and we assume this is a position that is extremely
difficult to implement considering the long negative financial record that TAP
evidenced in the past.
7.1 The Proposals:
In 2012, Synergy Aerospace, owned by German Efromovich, formally proposal the
acquisition of Portuguese Government stake in TAP, which was refused. The proposal
consists in:
Pay to Portuguese Government 35 million Euros;
Recapitalization of TAP Group in two phases: the first in the amount of 166
million Euros and the second phase, 18 months after acquiring TAP, in the
amount of 150 million Euros;
Assume all the liabilities of TAP Group.
There is a difference of time valuation between our valuation and the Synergy
Aerospace proposal. But, given the results obtained in our valuation and since TAP
Group in 2013 and 2014 continued to have negative net income’s we can assume that
Synergy Aerospace proposal, in financial terms, was a good proposal for Portuguese
Government. According to Secretary of Portuguese State this proposal was refused
due the failure of appropriate bank guarantees by the acquirer part.
Evaluating the Privatization of the
Portuguese National Airline - TAP
60
At the end of the first semester of 2015, the Portuguese Government selected two
group investors to submit binding offers for the acquisition of 61% TAP Group’s
share capital: the Synergy Group and the Gateway consortium, owned by the
Portuguese Humberto Pedrosa and David Neeleman, founder of airline companies
such as Azul and JetBlue.
Below are presented the two proposals made to Portuguese Government:
1) Synergy Group
Capital injection of 350 million Euros in TAP Group: 250 million Euros are in
Cash and 100 million Euros are in 50 new aircrafts, which would be delivered
in different periods of time since the privatization conclusion until 2017;
Reinforcement of the airline connections to Latin America and North
America;
Distribute by all the employees between 10% to 20% of the dividends;
Maintenance of headquarters and board in Portugal, maintenance of the key
airlines connections and the fulfillment of the public service for a minimum of
10 years after the privatization;
Keep the Hub in Portugal for a period minimum of 30 years;
Collective redundancies are not possible during the first 36 months after the
privatization process;
Creation of a cargo Hub in Beja for TAP and Avianca operations across
Europe.
2) Gateway Consortium
Portuguese Government receive 10 million Euros for transfer 61% of TAP
Group’s share capital and 6 million Euros for transferring the remaining stake
in the future;
Capital injection of 338 million Euros in the Group: 269 million Euros are
injected immediately after the conclusion of the process and the remaining is
delivered during the year of 2016, on the amount of 17 million Euros per
quarter;
Evaluating the Privatization of the
Portuguese National Airline - TAP
61
Depending on the financial performance and hypothetical initial public offer
in the future, the Portuguese Government may receive up to 140 million
Euros;
Debt remains in TAP Group’s balance sheet;
Fleet Renewal with 53 new aircraft;
Maintenance of headquarters and board in Portugal, maintenance of the key
airlines connections and the fulfillment of the public service for a minimum of
10 years after the privatization;
Keep the Hub in Portugal for a period minimum of 30 years;
Collective redundancies are not possible during the first 36 months after the
privatization process;
Reinforcement of the airline connections to Latin America and United States
of America;
Distribute by all the employees 10% of the dividends.
The Portuguese Government has decided in favor of the Gateway consortium
proposal.
Considering a financial perspective only, given also that it is difficult to quantify other
non-monetary aspects regarding the conditions presented by the two proposals, and
finally, assuming that the amount of debt in Synergy Group proposal also remain on
the balance sheet of the TAP Group, we believe that, effectively, the proposal
presented by Gateway consortium, in financial terms, was better than the competing.
The current financial situation and treasury requirements of TAP Group were the key
factors for our choice. Gateway offers a greater amount of money to recapitalize TAP
Group. On the other hand, the fact that Gateway proposal consider a payment of 10
million Euros to Portuguese Government for the transfer of Group's capital is seen as
positive for us, given the values obtained in our valuation, where the excessive
amount of debt is a major problem for TAP Group and, taking into account that, the
long negative TAP's financial record does not allow an increase in the negotiable
power.
Therefore, taking into account the value estimated for the current context of TAP
Group and the fact that Gateway considers a payment of 10 million Euros to
Evaluating the Privatization of the
Portuguese National Airline - TAP
62
Portuguese Government for share’s capital acquisition, a capital injection of 338
million Euros until the end of 2016 and, above all, since it becomes the main
shareholder of a company, assuming an integral part of the Group’s debt that remains
in the balance sheet, we believe that, in a financial perspective, the Gateway proposal
meets the requirements for the Portuguese Government to accept the deal. Finally, the
acceptable proposal contains a positive point by including a clause, that was one of
the conclusions obtained with this thesis project, i.e., that TAP Group has value in the
future if it transforms in a more competitive group. Depending on the future TAP’s
financial performance Portuguese Government can receive up to 140 million Euros.
Evaluating the Privatization of the
Portuguese National Airline - TAP
63
8. Bibliography
Batista, A. 2015. TAP vai receber 338 milhões do novo accionista em
prestações.http://economico.sapo.pt/noticias/tap -vai-receber-338-
milhoes-do-novo-accionista-em-prestacoes_220846.html . 12 June 2015.
Belobaba, P., Odoni, A., & Barnhart , C. 2009. The global airline
industry . Chichester: Wiley.
Bierman, H. 1993. Capital budgeting in 1992: a survey. Financial Management, 22
(3): 24.
Bisignani, G. 2011. IATA – Vision 2050 . Report presented in the f irst
Vision 2050 meeting attended by strategic thinkers from around the
world, Singapore.
Bruner, R., Eades, K., Harris, R., & Higgins, R. 1998. Best practices in
estimating the cost of capital: survey and synthesis.
https:/ /www3.nd.edu/~scorwin/fin70610/CostofCap_Bruner_FPE1 998.p
df. 29 December 2014.
Buffett, W. 2014. Berkshire Hathaway Inc. chairman’s letter .
http://www.berkshirehathaway.com/letters/2013ltr.pdf. 22 September 2014.
Cheema, Z., Surilova, I., & Wang, Y. 2013. Continental airlines: valuation model &
expected synergies. http://pt.slideshare.net/zcheema/continental-airlines-valuation. 30
December 2014.
Damodaran, A. 2002. Investment valuation (2nd
edition). New York: Wiley.
Damodaran, A. 2014.Corporate valuation Inputs. http://people.stern.nyu.edu/adamodar/.
30 December 2014.
Evaluating the Privatization of the
Portuguese National Airline - TAP
64
EUR - US dollar exchange rate. 2014. Bloomberg EUR-USD dollar exchange rate.
http://www.bloomberg.com/quote/EURUSD:CUR. 29 December 2014.
Fama, R., & Perez, M. 2004. Métodos de avaliação de empresas e o balanço da
determinação. Administração em Diálogo, 6: 101-112.
Fernandez, P., Linares, P., & Acín, I. 2014. Market risk premium used in 88
countries in 2014: a survey with 8,228 answers.
http://papers.ssrn.com/sol3/papers.cfm?abstract_id=2450452. 30 December 2014.
Finance report Air France KLM. 2013. Registration document 2013.
http://www.airfranceklm.com/sites/default/files/publications/2013_registration_docu
ment.pdf. 29 December 2014.
Finance report Air France KLM. 2014. Annual financial report 2014.
http://www.airfranceklm.com/sites/default/files/publications/annual_financial_report_
2014_-_air_france-klm.pdf. 11 April 2015.
Germany generic government 10 year yield. 2014. Bloomberg Germany generic
government 10 year yield. http://www.bloomberg.com/quote/GDBR10:IND. 29
December 2014.
Guerreiro, P., & Fiúza, A. 2015. Venda da TAP pode render pouco mais que zero.
http://expresso.sapo.pt/venda-da-tap-pode-render-pouco-mais-que-zero=f919289. 11
April 2015.
IATA. 2014. Fact sheet: industry statistics.
https://www.iata.org/pressroom/facts_figures/fact_sheets/Documents/industry-
facts.pdf. 29 December 2014.
Infinancials ratios. 2014. Easyjet PLC EV/EBITDA ratio.
http://www.infinancials.com/en/financial%20ratio,Easyjet%20PLC,31815EX.html. 29
December 2014.
Evaluating the Privatization of the
Portuguese National Airline - TAP
65
Infinancials ratios. 2014. International Consolidated Airlines Grp EV/EBITDA
ratio.http://www.infinancials.com/en/financial%20ratio,International%20Consolidate
d%20Airlines%20Grp,30339EE.html. 29 December 2014.
International Airlines Group Annual Report. 2013. 2013 annual report and accounts
2013. http://phx.corporate-
ir.net/External.File?item=UGFyZW50SUQ9NTM1NTY0fENoaWxkSUQ9MjIzNzIzf
FR5cGU9MQ==&t=1. 29 December 2014.
International Airlines Group Annual Report. 2014. 2014 annual report and accounts
2014. http://phx.corporate-
ir.net/External.File?item=UGFyZW50SUQ9NTcxMDk5fENoaWxkSUQ9MjczODky
fFR5cGU9MQ==&t=1. 11 April 2015.
Jarach, D. 2004. Future scenarios for the european airline industry: a marketing-based
perspective. Journal of Air Transportation, 9 (2): 24-39.
KPMG corporate tax rates between 2006 and 2014. 2014. Corporate tax rates table.
http://www.kpmg.com/global/en/services/tax/tax-tools-and-
resources/pages/corporate-tax-rates-table.aspx. 29 December 2014.
Koller, T., Goedhart, M., & Wessels, D. 2010. Valuation: measuring and managing
the value of companies (5th
edition). New York: Wiley.
Lufhtansa Group Annual Report. 2013. Annual report 2013. http://investor-
relations.lufthansagroup.com/fileadmin/downloads/en/financial-reports/annual-
reports/LH-AR-2013-e.pdf. 29 December 2014.
Lufhtansa Group Annual Report. 2014. Annual report 2014. http://investor-
relations.lufthansagroup.com/fileadmin/downloads/en/financial-reports/annual-
reports/LH-AR-2014-e.pdf. 11 April 2015.
Evaluating the Privatization of the
Portuguese National Airline - TAP
66
Massari, M., Visciano, N., Lagreca, M., Mele, F., Bellavita, S., Cera, S., Rippa, D.,
Peschiera, F., Spaltro, E., & Papa, F. 2004. Valuation guide.
http://www.lseg.com/sites/default/files/content/documents/03%20Valuation%20Guid
e%20-%20ENG%20-%20Jul14.pdf. 28 January 2015.
Miller, M., & Modigliani, F. 1961. Dividend policy, growth, and the valuation of
shares. The Journal of Business, 34 (4): 411-433.
Mota, A., Barroso, C., Nunes, J., & Ferreira, M. 2006. Finanças empresariais: teoria
e prática (2ª edição). Lisbon: Publisher Team.
Mota, A., & Custódio, C. 2006. Finanças da empresa. Lisbon: Booknomics.
Myers, S. 1976. Determinants of corporate borrowing. Sloan School of Management
- Massachusetts Institute of Technology: 875-876.
Pereira, A., Guerreiro, P., Gaspar, E., & Marques, A. 2012. Governo decide não
vender TAP a Efromovich mas mantém privatização na agenda.
http://www.jornaldenegocios.pt/empresas/detalhe/governo_chumba_venda_da_tap.ht
ml. 27 March 2015.
Pereira, J., & Fiúza, M. 2015. Aviões de Efromovich para a TAP parados em
Espanha.http://expresso.sapo.pt/economia/2015 -05-23-Avioes-de-
Efromovich-para-a-TAP-parados-em-Espanha. 12 June 2015.
Pinheiro, A. 2014. TAP bate recorde de passageiros em vésperas de privatização.
http://m.dn.pt/m/newsArticle?contentId=4281092&page=1. 6 December 2014.
Portas, P., Albuquerque, M., & Costa, C. 2014. Portugal: Letter of intent.
http://www.portugal.gov.pt/media/1452387/LoI%2012R%20PT.pdf. 22 September
2014.
Evaluating the Privatization of the
Portuguese National Airline - TAP
67
Portugal Council of Ministers. 2014. Comunicado do conselho de ministros de 13 de
novembro de 2014. http://www.portugal.gov.pt/pt/os-ministerios/ministro-da-
presidencia-e-dos-assuntos-parlamentares/documentos-oficiais/20141113-cm-
comunicado.aspx . 13 November 2014.
Portuguese Ministry of Finance. 2014. Orçamento do estado para 2015.
http://www.jn.pt/infos/pdf/relOE2015.pdf . 16 October 2014.
Portuguese Republic Diary. 2012. Diário da república 1ª Série. nº 251 - 28 de
dezembro de 2012: Resolução do conselho de ministros nº111-
B/2012.http://www.base.gov.pt/base2/downloads/Resolu%C3%A7%C3%A3oCM-
111-C-2012.pdf. 5 November 2014.
Rádio e Televisão de Portugal. 2015. Neeleman promete partilha de dividendos com
os trabalhadores da TAP.
http://www.rtp.pt/noticias/index.php?article=835865&tm=6&layout=12
2&visual=61 . 12 June 2015.
Salvado, S. 2015. Para o Governo, processo de privatização da TAP chegou ao fim.
http://www.rtp.pt/noticias/index.php?article=835978&tm=6&layout=12
1&visual=49 . 11 June 2015.
Silva, J., Sousa, A., & Mendes, E. 2012. Relatório final da comissão especial para o
acompanhamento da privatização da TAP – SGPS, SA.
http://www.portugal.gov.pt/media/994504/Privatizacao%20TAP%20relatorio%20fina
l.pdf . 23 September 2014.
Worldwide Inflation data. 2014. Historic inflation Portugal – CPI inflation.
http://www.inflation.eu/inflation-rates/portugal/historic-inflation/cpi-inflation-
portugal.aspx. 30 December 2014.
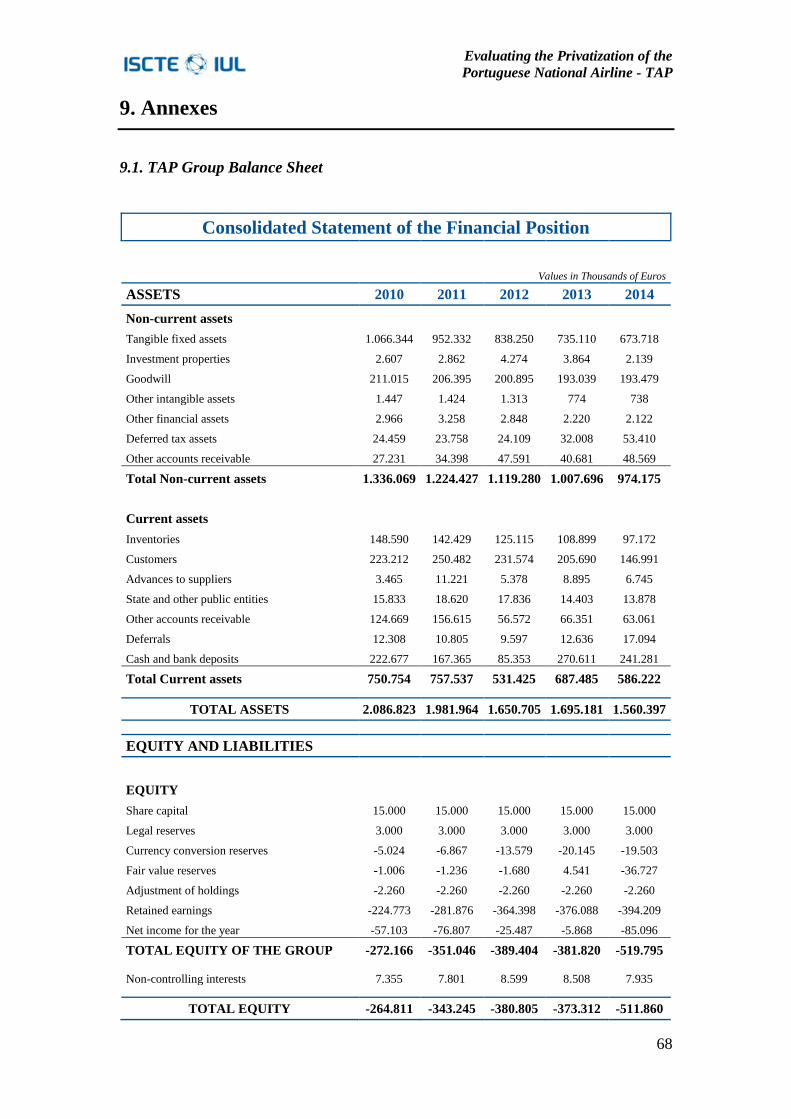
Evaluating the Privatization of the
Portuguese National Airline - TAP
68
9. Annexes
9.1. TAP Group Balance Sheet
Consolidated Statement of the Financial Position
Values in Thousands of Euros
ASSETS 2010 2011 2012 2013 2014
Non-current assets Tangible fixed assets 1.066.344 952.332 838.250 735.110 673.718
Investment properties 2.607 2.862 4.274 3.864 2.139
Goodwill 211.015 206.395 200.895 193.039 193.479
Other intangible assets 1.447 1.424 1.313 774 738
Other financial assets 2.966 3.258 2.848 2.220 2.122
Deferred tax assets 24.459 23.758 24.109 32.008 53.410
Other accounts receivable 27.231 34.398 47.591 40.681 48.569
Total Non-current assets 1.336.069 1.224.427 1.119.280 1.007.696 974.175
Current assets
Inventories 148.590 142.429 125.115 108.899 97.172
Customers 223.212 250.482 231.574 205.690 146.991
Advances to suppliers 3.465 11.221 5.378 8.895 6.745
State and other public entities 15.833 18.620 17.836 14.403 13.878
Other accounts receivable 124.669 156.615 56.572 66.351 63.061
Deferrals 12.308 10.805 9.597 12.636 17.094
Cash and bank deposits 222.677 167.365 85.353 270.611 241.281
Total Current assets 750.754 757.537 531.425 687.485 586.222
TOTAL ASSETS 2.086.823 1.981.964 1.650.705 1.695.181 1.560.397
EQUITY AND LIABILITIES
EQUITY
Share capital 15.000 15.000 15.000 15.000 15.000
Legal reserves 3.000 3.000 3.000 3.000 3.000
Currency conversion reserves -5.024 -6.867 -13.579 -20.145 -19.503
Fair value reserves -1.006 -1.236 -1.680 4.541 -36.727
Adjustment of holdings -2.260 -2.260 -2.260 -2.260 -2.260
Retained earnings -224.773 -281.876 -364.398 -376.088 -394.209
Net income for the year -57.103 -76.807 -25.487 -5.868 -85.096
TOTAL EQUITY OF THE GROUP -272.166 -351.046 -389.404 -381.820 -519.795
Non-controlling interests 7.355 7.801 8.599 8.508 7.935
TOTAL EQUITY -264.811 -343.245 -380.805 -373.312 -511.860
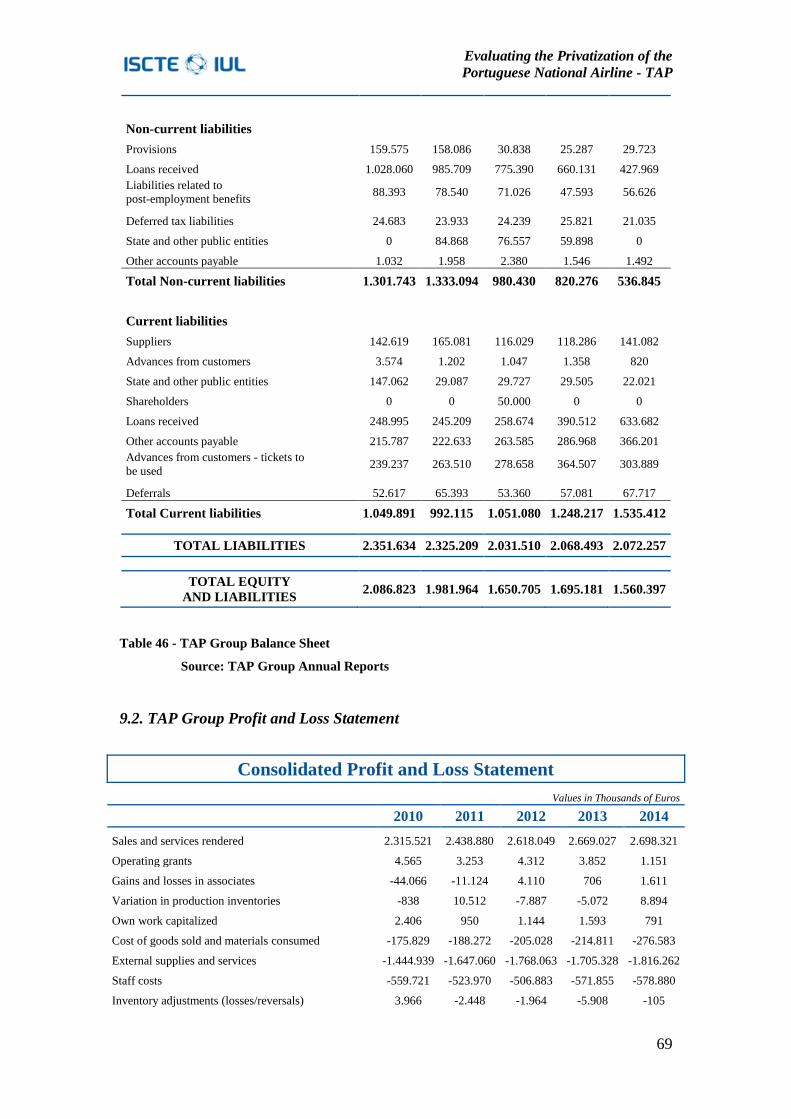
Evaluating the Privatization of the
Portuguese National Airline - TAP
69
Non-current liabilities
Provisions 159.575 158.086 30.838 25.287 29.723
Loans received 1.028.060 985.709 775.390 660.131 427.969
Liabilities related to
post-employment benefits 88.393 78.540 71.026 47.593 56.626
Deferred tax liabilities 24.683 23.933 24.239 25.821 21.035
State and other public entities 0 84.868 76.557 59.898 0
Other accounts payable 1.032 1.958 2.380 1.546 1.492
Total Non-current liabilities 1.301.743 1.333.094 980.430 820.276 536.845
Current liabilities
Suppliers 142.619 165.081 116.029 118.286 141.082
Advances from customers 3.574 1.202 1.047 1.358 820
State and other public entities 147.062 29.087 29.727 29.505 22.021
Shareholders 0 0 50.000 0 0
Loans received 248.995 245.209 258.674 390.512 633.682
Other accounts payable 215.787 222.633 263.585 286.968 366.201
Advances from customers - tickets to
be used 239.237 263.510 278.658 364.507 303.889
Deferrals 52.617 65.393 53.360 57.081 67.717
Total Current liabilities 1.049.891 992.115 1.051.080 1.248.217 1.535.412
TOTAL LIABILITIES 2.351.634 2.325.209 2.031.510 2.068.493 2.072.257
TOTAL EQUITY
AND LIABILITIES 2.086.823 1.981.964 1.650.705 1.695.181 1.560.397
Table 46 - TAP Group Balance Sheet
Source: TAP Group Annual Reports
9.2. TAP Group Profit and Loss Statement
Consolidated Profit and Loss Statement
Values in Thousands of Euros
2010 2011 2012 2013 2014
Sales and services rendered 2.315.521 2.438.880 2.618.049 2.669.027 2.698.321
Operating grants 4.565 3.253 4.312 3.852 1.151
Gains and losses in associates -44.066 -11.124 4.110 706 1.611
Variation in production inventories -838 10.512 -7.887 -5.072 8.894
Own work capitalized 2.406 950 1.144 1.593 791
Cost of goods sold and materials consumed -175.829 -188.272 -205.028 -214.811 -276.583
External supplies and services -1.444.939 -1.647.060 -1.768.063 -1.705.328 -1.816.262
Staff costs -559.721 -523.970 -506.883 -571.855 -578.880
Inventory adjustments (losses/reversals) 3.966 -2.448 -1.964 -5.908 -105
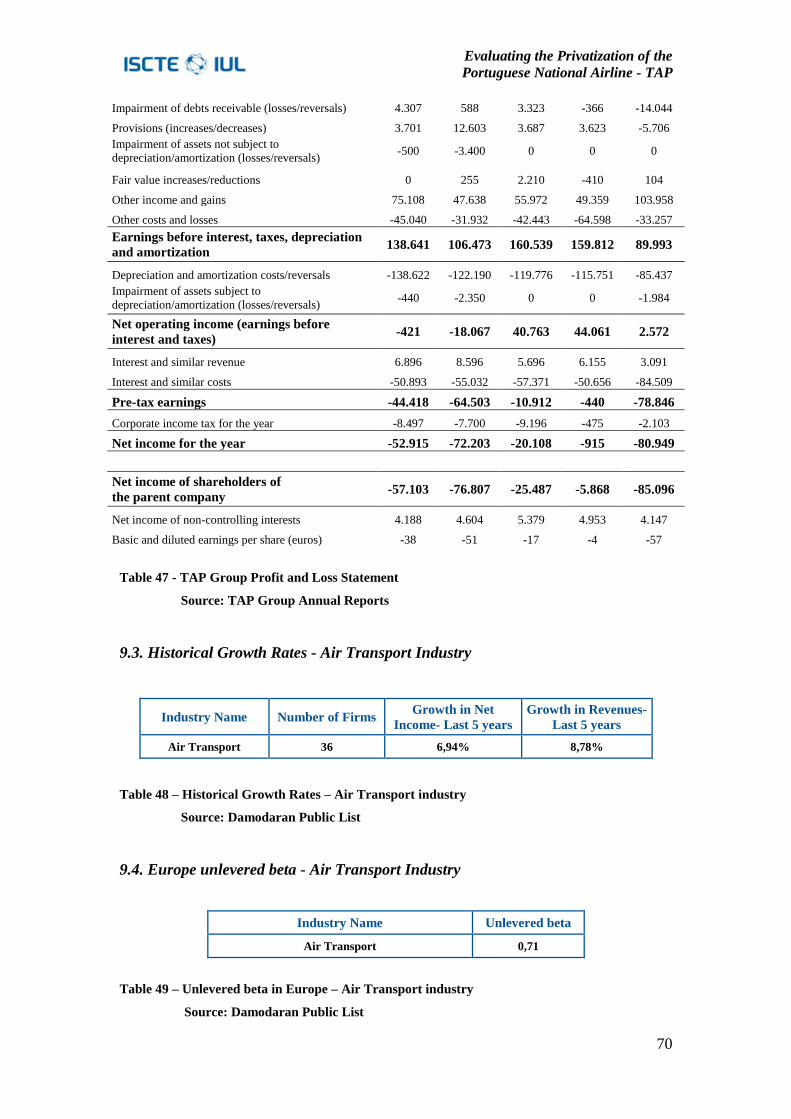
Evaluating the Privatization of the
Portuguese National Airline - TAP
70
Impairment of debts receivable (losses/reversals) 4.307 588 3.323 -366 -14.044
Provisions (increases/decreases) 3.701 12.603 3.687 3.623 -5.706
Impairment of assets not subject to
depreciation/amortization (losses/reversals) -500 -3.400 0 0 0
Fair value increases/reductions 0 255 2.210 -410 104
Other income and gains 75.108 47.638 55.972 49.359 103.958
Other costs and losses -45.040 -31.932 -42.443 -64.598 -33.257
Earnings before interest, taxes, depreciation
and amortization 138.641 106.473 160.539 159.812 89.993
Depreciation and amortization costs/reversals -138.622 -122.190 -119.776 -115.751 -85.437
Impairment of assets subject to
depreciation/amortization (losses/reversals) -440 -2.350 0 0 -1.984
Net operating income (earnings before
interest and taxes) -421 -18.067 40.763 44.061 2.572
Interest and similar revenue 6.896 8.596 5.696 6.155 3.091
Interest and similar costs -50.893 -55.032 -57.371 -50.656 -84.509
Pre-tax earnings -44.418 -64.503 -10.912 -440 -78.846
Corporate income tax for the year -8.497 -7.700 -9.196 -475 -2.103
Net income for the year -52.915 -72.203 -20.108 -915 -80.949
Net income of shareholders of
the parent company -57.103 -76.807 -25.487 -5.868 -85.096
Net income of non-controlling interests 4.188 4.604 5.379 4.953 4.147
Basic and diluted earnings per share (euros) -38 -51 -17 -4 -57
Table 47 - TAP Group Profit and Loss Statement
Source: TAP Group Annual Reports
9.3. Historical Growth Rates - Air Transport Industry
Industry Name Number of Firms Growth in Net
Income- Last 5 years
Growth in Revenues-
Last 5 years
Air Transport 36 6,94% 8,78%
Table 48 – Historical Growth Rates – Air Transport industry
Source: Damodaran Public List
9.4. Europe unlevered beta - Air Transport Industry
Industry Name Unlevered beta
Air Transport 0,71
Table 49 – Unlevered beta in Europe – Air Transport industry
Source: Damodaran Public List
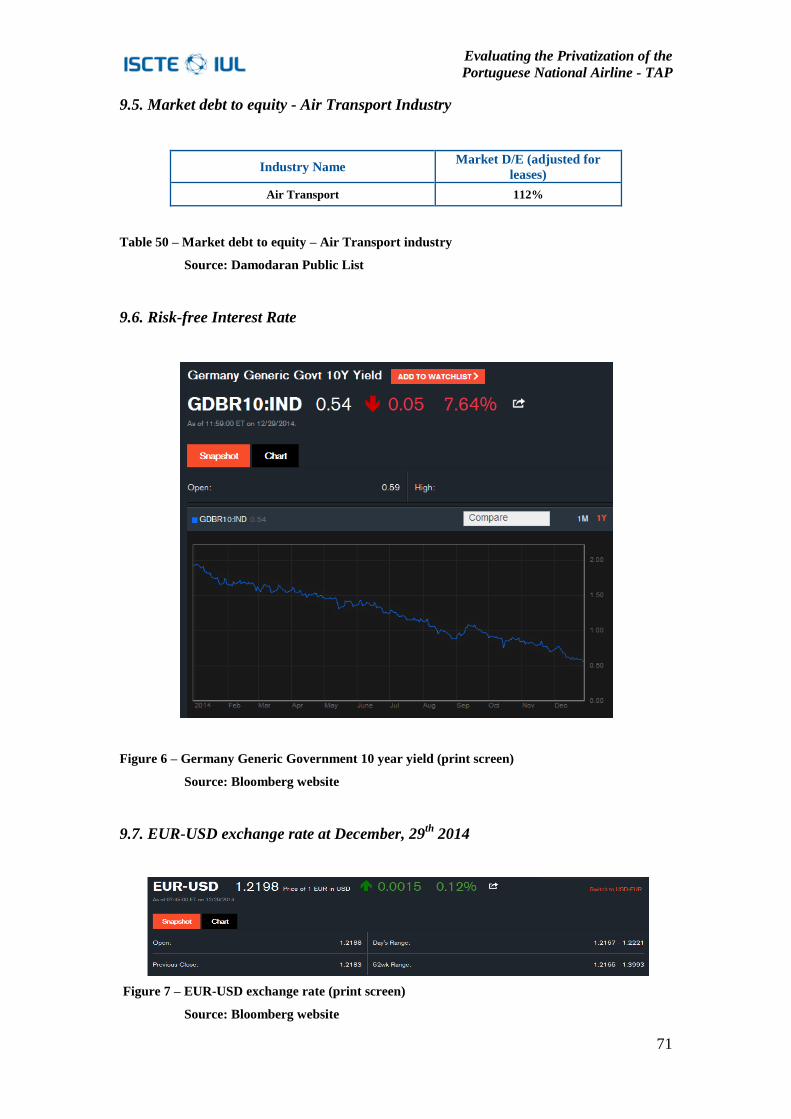
Evaluating the Privatization of the
Portuguese National Airline - TAP
71
9.5. Market debt to equity - Air Transport Industry
Industry Name Market D/E (adjusted for
leases)
Air Transport 112%
Table 50 – Market debt to equity – Air Transport industry
Source: Damodaran Public List
9.6. Risk-free Interest Rate
Figure 6 – Germany Generic Government 10 year yield (print screen)
Source: Bloomberg website
9.7. EUR-USD exchange rate at December, 29th
2014
Figure 7 – EUR-USD exchange rate (print screen)
Source: Bloomberg website
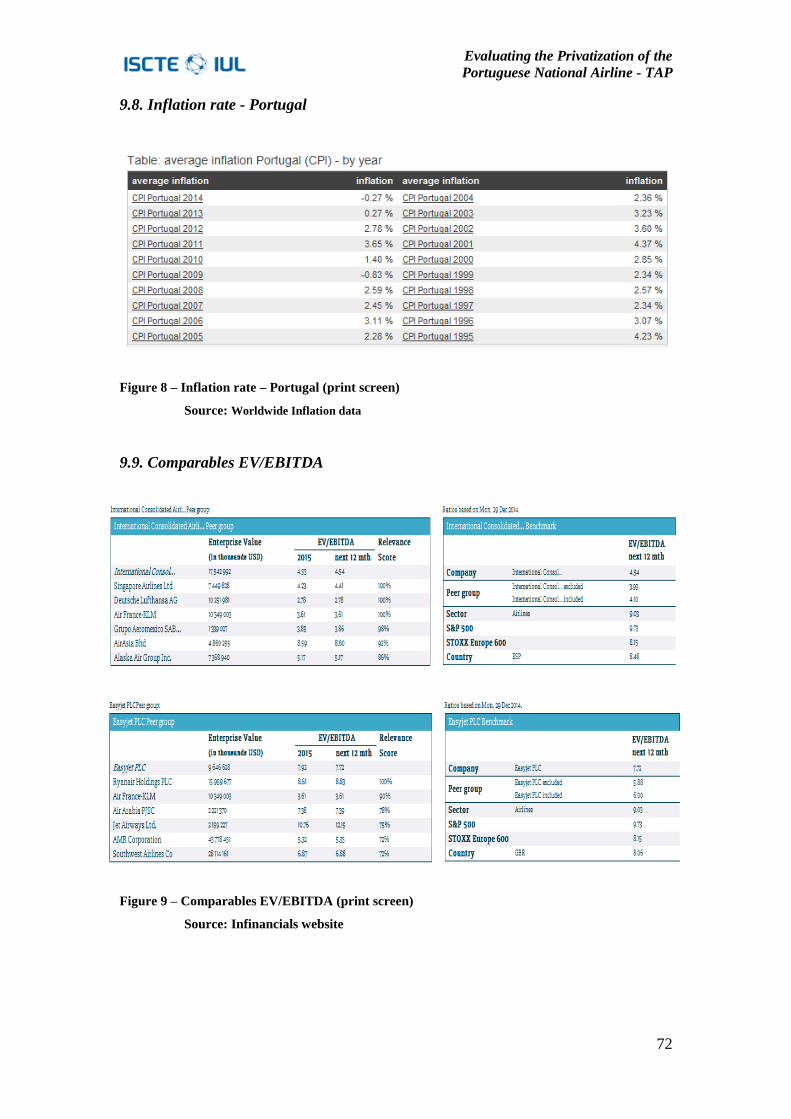
Evaluating the Privatization of the
Portuguese National Airline - TAP
72
9.8. Inflation rate - Portugal
Figure 8 – Inflation rate – Portugal (print screen)
Source: Worldwide Inflation data
9.9. Comparables EV/EBITDA
Figure 9 – Comparables EV/EBITDA (print screen)
Source: Infinancials website

Evaluating the Privatization of the
Portuguese National Airline - TAP
73
9.10. Historical evolution of TAP’s EBITDAR
2010 2011 2012 2013 2014
TAP's EBITDAR 192.412 158.237 214.505 225.434 147.308
Values in Thousands of Euros
Table 51 – Historical evolution of TAP’s EBITDAR
Source: TAP Group Annual Reports
Related Documents