Page 1/14 Evaluating the inequality of medical resources allocation based on spatial and non-spatial accessibility: A case study of Wenzhou, China Miao Du Wenzhou Medical University Yuhua Zhao Wenzhou Medical University Tao Fang Wenzhou Medical University Linyu Fan Wenzhou Medical University Minghua Zhang Wenzhou Medical University Hong Huang Wenzhou Medical University Kun Mei ( [email protected] ) Wenzhou Medical University Research Article Keywords: Spatial accessibility, Disparities, Medical resources, Resource allocation, Hierarchical two-step oating catchment area method(H2SFCA) Posted Date: April 21st, 2022 DOI: https://doi.org/10.21203/rs.3.rs-1568011/v1 License: This work is licensed under a Creative Commons Attribution 4.0 International License. Read Full License

Welcome message from author
This document is posted to help you gain knowledge. Please leave a comment to let me know what you think about it! Share it to your friends and learn new things together.
Transcript

Page 1/14
Evaluating the inequality of medical resources allocation based on spatial andnon-spatial accessibility: A case study of Wenzhou, ChinaMiao Du
Wenzhou Medical UniversityYuhua Zhao
Wenzhou Medical UniversityTao Fang
Wenzhou Medical UniversityLinyu Fan
Wenzhou Medical UniversityMinghua Zhang
Wenzhou Medical UniversityHong Huang
Wenzhou Medical UniversityKun Mei ( [email protected] )
Wenzhou Medical University
Research Article
Keywords: Spatial accessibility, Disparities, Medical resources, Resource allocation, Hierarchical two-step �oating catchment area method(H2SFCA)
Posted Date: April 21st, 2022
DOI: https://doi.org/10.21203/rs.3.rs-1568011/v1
License: This work is licensed under a Creative Commons Attribution 4.0 International License. Read Full License

Page 2/14
AbstractBackground: Environmental and social factors that impact resource allocation in rural, developing regions are key social determinants of health that requiremulti-sector collaboration to improve health opportunities. Thus, we sought to evaluate the spatial distribution and accessibility of medical resources toassess current disparities, determine best practices for resource allocation, and inform policies to improve regional health planning.
Methods: We used the Gini coe�cient and agglomeration degree to measure inequality among the frequency distribution of medical resources in Wenzhou,China. We applied the modi�ed hierarchical two-step �oating catchment area (H2SFCA) method to evaluate the spatial accessibility of medical institutionsacross the city. Finally, we explored the in�uencing factors of accessibility differences using the spearman correlation analysis.
Results: The distribution of medical resources in Wenzhou is inequitable according to population and geographical distribution. The overall spatialaccessibility of Wenzhou is poor, the accessibility of east region is higher than west region, and the accessibility of different levels of medical institutionsvaries greatly. Accessibility is positively correlated with the number of institutions (ρ=0.585), the number of doctors (ρ=0.670), population density (ρ=0.769),road density (ρ=0.792), and GDP (ρ=0.310).
Conclusions: There are disparities in the spatial and unbalanced distribution of medical resources in Wenzhou. Policies and initiatives to improve thegeographical distribution of resources, construct connected road networks, and enhance resident access to medical resources are needed.
BackgroundOne of the United Nation’s 2030 global strategic goals is ensuring healthy lives and promoting well-being for all individuals, which includes access to qualityhealthcare services [1]. However, with the acceleration of urbanization and increased population density in urban regions facilitated by migration, challengesfor equitable and effective allocation of medical resources have arisen. The unequal distribution of medical resources has compromised public health andsafety and intensi�ed social con�icts[2]. The emergence of the COVID-19 pandemic has further contributed to resource scarcity with strains on existingmedical infrastructure[3]. Since reform and opening up, with the improvement of the market-oriented economy in China, the existing medical resources andservices are di�cult to meet the needs of rapid economic growth and the aging population [4]. Currently, the supply of medical resources in China presents an"inverted triangle " mode, that is, high-quality medical resources are mainly concentrated in metropolis and large hospitals, while grassroots medicalinstitutions have few high-quality talents and poor service ability. Most medical resources and patients are concentrated in tertiary hospitals which account for8% of the total number of medical institutions, and tertiary hospitals are mainly distributed in urban regions [5]. Moreover, the income gap between regionswas widening, which led to the unbalanced development of regional medical and health infrastructure and the unbalanced distribution and allocation ofmedical resources. Although many efforts have been made to rationalize the allocation of medical resources, problems such as imbalance distribution,regional sharing and poor mobility of medical resources still exist[6].
Medical resources are allocated in the same way as public facilities. The main idea �rst proposing by Teitz was to allocate public facilities according to therules of maximizing e�ciency and fairness, taking into account their location, accessibility, distribution pattern, impact on the city and its externalities[7].Among them, accessibility is a decisive factor affecting the level of equalization of medical services. The accessibility of medical institutions not only re�ectsthe public's access and convenience to medical services, but also affects the improvement of residents' quality of life [8]. Accessibility is affected by bothspatial and non-spatial factors: spatial factors mainly include the distance or the time cost from the residential areas to hospitals; non-spatial factors includethe attribute characteristics of medical institutions (such as scale, grade, quantity), as well as the residents' own attributes (economic income, medicalpreference, transportation vehicle, and number of residents) [9].The methods to measure spatial accessibility mainly include the ratio method [10], the nearestdistance method [11], the gravity model [12], the Huff model [13] and the two-step �oating catchment area (2SFCA) method [14].
Among all the mentioned methods, the 2SFCA method is widely used in recent studies to show accessibility to health care facilities [15–19]. Itcomprehensively considers the effects of the supply, the demand and their distance and it is more intuitive to interpret and easier to calculate. However, the2SFCA has received sharp criticism because of distance decay which represents the attraction of medical institutions to residents has decreased with distanceincrease [20]. To overcome this shortcoming, a number of researchers have tried to improve the 2SFCA methods. Luo and Qi [21] presented an enhanced two-step �oating catchment area (E2SFCA) method which assigns different weights associated with different travel time zones. Dai [22] added a Gaussianfunction to model the distance decay effect. Wang et al. [23] investigated the difference in medical treatment between minority areas and non-ethnic minorityareas in Sichuan Province based on the modi�ed 2SFCA method. On the other hand, some studies have tried to improve the 2SFCA method by integrating non-spatial factors. Wang et al. [24] showed accessibility to primary care facilities by integrating spatial and non-spatial factors when de�ning health professionalshortage areas. McGrail et al. [25] proposed an index of rural access to primary care by integrating health needs and mobility within the 2SFCA algorithm. Jinet al. [26] proposed a hierarchical two-step �oating catchment area (H2SFCA) method to evaluate the spatial accessibility of public medical resourcesconsidering the factors at different levels of medical resources. In this study, we aim to evaluate the accessibility and equality of medical institutions atdifferent levels, so modi�ed H2SFCA methodology with both spatial and non-spatial impact factors is used.
Wenzhou, an economically developed city in eastern coastal of China, is chosen as a case study area. Wenzhou’s geography is mostly mountainous andislands surrounded by water. This unique geomorphic features lead to uneven urban development and regional differences in medical resource allocation.Therefore, the study objectives include: the traditional health economics method is applied to identify whether medical resources are distributed equally acrossthe population and the regions, and then we used the accessibility analysis method to investigate whether medical institutions at all levels (especially primaryhealth care centers) can meet the medical needs of local residents. Thus, the study results and understandings can be helpful to guide the reasonabledistribution and �ow of medical resources in Wenzhou, and then provide theoretical guidance for improving living standards and promoting the equality ofmedical resource allocations in that region.

Page 3/14
MethodsStudy Area
Wenzhou municipal region is selected as the study area, and it located in the southeast of Zhejiang Province, China, and is the economic center of southernZhejiang (Fig. 1). The total area of the municipal region is 12,109 km2. By the end of 2019, Wenzhou had a permanent population of 9.30 million, registeredpopulation of 8.32 million, per capita GDP of 71,225 yuan. There are 12 administrative districts in Wenzhou, including 4 central urban districts: LuchengDistrict (LC), Longwan District (LW), Ouhai District (OH), Dongtou District (DT), 5 counties: Yongjia County (YJ), Pingyang County (PY), Cangnan County (CN),Wencheng County (WC), Taishun County (TS) and 3 county-level cities: Ruian City (RA), Yueqing City (YQ), Longgang City(LG). Moreover, 185 subdistricts aredivided up based on the current urban districts and counties, including 67 urban subdistricts and 118 towns.
In order to meet the medical and health needs of residents, Wenzhou has continuously improved the level of medical infrastructure and optimized the layoutof medical resources in recent decades. From 1978 to 2019, the number of medical institutions increased from 877 to 5,794, the number of beds increasedfrom 5,826 to 44,038, the number of doctors increased from 4,551 to 30,136, and the number of nurses increased from 1,306 to 29,219 according to theWenzhou Statistical Yearbook and Wenzhou Local Chronicles Healthcare Development Statistical Bulletin.
Data SourcesDemographic and economic data
The population data used in this study was obtained from the Wenzhou Statistical Yearbook 2020. The geometric central point of the subdistrict/town shapewas used as the population centroid. The population data coordinate was referenced as CGS2000. The GDP data was derived from the Resources andEnvironment Science and Data Center and Wenzhou Statistics Bureau[27].Medical Institutions data
The medical institution data used in this research was from the National Health Commission of the People's Republic of China and the corresponding o�cialwebsites, mainly including level categories and doctor numbers; The total number of beds and health personnel in each district and county were obtained fromthe Wenzhou Health Commission. The location information of medical institutions was obtained through manual search in Tianditu Map ofWenzhou(website). The medical institutions included general hospitals and community health centers in Wenzhou. In addition, considering that thespecialized hospitals were highly irreplaceable, and their spatial layout had little impact on residents’ medical treatment, so the specialized hospitals wereexcluded in this study. In the end, we selected 90 general hospitals and 200 community health centers. From a hierarchical perspective, the medicalinstitutions in China were divided into four levels: tertiary hospitals, secondary hospitals, primary hospitals and community health centers according to theirdifferent service scopes. The distribution of medical institutions is shown in Fig. 1.
Road Network
The road network data was collected from the Land and Resources Bureau, and its coordinate system reference was WGS-1984. Based on the TechnicalStandard of Highway Engineering (JTG B01-2014) [28] and the local actual situation in Wenzhou, the average speed of different types of roads were set asfollows: highways 100km/h, fast -speed roads 80 km/h, national and provincial roads 70 km/h, urban �rst class roads 50 km/h, county roads, town roads,urban second and third class roads 40 km/h, urban fourth class roads 30km/h. The distribution of road networks is shown in Fig. 1.
Statistical Analysis
Gini Coe�cient
In economics, the Gini coe�cient was an internationally common indicator that illustrate income gap of residents in a country or region. In recent decades, itwas widely used to measure the equality of medical resource allocation in terms of demographic and geographical aspects [29]. We used it to examine theequality of institutions, beds, doctors and nurses by population and geographical distribution in this study. The following formula is employed to calculate theGini coe�cient:
G = ∑ ni=1WiYi + 2∑ n
i=1Wi(1 − Vi) − 1
1In formula (1), Gis the Gini coe�cient;Wi is the cumulative proportion of i population or geographic area; Yi is the corresponding cumulative proportion of themedical resources;Vi = Y1 + Y2 + …Yn; i is the fractional rank in terms of per capita medical resources from the lowest number to the highest number.
The Gini coe�cient ranges from 0 to 1; a value of 0 indicates equitable distribution of resources or services [30]; a value of less than 0.2 means absolutely fair;a value of 0.2–0.3 means fair; a value of 0.3– 0.4 means basic fair; a value of greater than 0.4 triggers an alert of inequality, and above 0.6 re�ects highinequality [31].Agglomeration degree
The Gini coe�cient can only measure the equality of the overall resource allocation, and cannot analyze the speci�c situation within region. Thus, We furtherused agglomeration degree to measure the equality and existing differences of medical resource allocation in each district and county of Wenzhou, so as tomake up for the de�ciency of the Gini coe�cient [32]. Health resource agglomeration degree, it showed the proportion of health resources in a certain regionthat occupied 1% of the land area of the country. The calculation formula is as follows:

Page 4/14
HRADi =(HRi/HRn) × 100%
(A i/An) × 100% =HRi/A iHRn/An
2In formula (2),HRADi is the health resource agglomeration degree in the i region,HRi is the number of health resources in the i region, A i is the land area inthe i region,An is the land area of country,HRn is the total number of health resources in country.
Population agglomeration degree, it was de�ned as the proportion of population in a certain region that occupied1% of the land area of country, and thecalculation formula is as follows:
PADi =(Pi/Pn) × 100%
(A i/An) × 100% =Pi/A iPn/An
3In formula (3),PADi is the population agglomeration degree in the i region,A i and An have the same meaning as above. Pi is the number of population in the iregion,Pn is the total population in the country.
Evaluation criteria: When the agglomeration degree of health resources is greater than 1, indicating that health resources are relatively more equitable in termsof geographical distribution. When the ratio of HARD and PAD is close to 1, the health resources in this region meet the medical needs of the population, andthe residents have better access to health services. If the ratio is greater than 1, it indicates that the health resources in this region are overpopulated; if theratio is less than 1, it indicates that the resources are insu�cient [33].
Network Analysis
In order to assess spatial accessibility, we utilized the origin and destination (OD) cost matrix in network analysis toolbox of ArcGIS 9.3 (ESRI Inc.) to calculatethe travel time costs from each residential area to all medical institutions. Also, the shortest path analysis in the network analysis module was applied toestimate the travel time costs from residential areas to the nearest community health center and general hospital, respectively.
Assessing Accessibility Using the modi�ed H2SFCA method
The two-step �oating catchment area (2SFCA) method, �rst proposed by Radke and Mu[14], it considers both the demand side and the supply side. Themethod starts from the supply and demand points respectively and moves the search twice. In the �rst step, for each supply location j, we search all demandlocations k within the search radius d0, and calculate the supply-demand ratio Rj.
The formula is:
Rj =Sj
∑ k ∈ dkj≤ d0Dk
4In Formula (4), Sj represents the capacity of supply at location j. dkj is the travel time between demand k and supply j.Dk is the population at the demandlocation.
In the second step, for each demand location i, we search all supply locations j within the search radius d0 and sum up the supply-to-demand ratios Rj.
The formula is:
AFi = ∑
j∈ dij ≤ d0
Rj =Sj
∑ k ∈ dkj≤ d0Dk
5
In Formula (5),AFi is the accessibility score of the demand location i,dijis the travel time between demand i and supply j.
The limitation of the traditional 2SFCA method is that they adopt a dichotomous distance decay function supposing that all people with a catchment size useservice equally. To address the de�ciency, this paper adopted the modi�ed H2SFCA method of determining catchment size according to different levels ofmedical institutions, which comprehensively considers non-spatial factors such as grade and number of doctors. The model expression is as follows:
A i = ∑l
∑j dij≤Dl
Sljf dij
∑k dkj≤Dl Pkf(dkj )
6
{ }
{ } { }
{ }( )
{ }

Page 5/14
where A iis the accessibility at demand location i in a hierarchical system; l is the level of medical institutions in the system; Slj is the doctors of institution j at
level l; Dl is the catchment size for institutions at level l, and other variates have the same meaning as Formula (4) and (5). The distance decay function
f dij take the gravity power function form as follows:
f dij =d −β
ij dij ≤ Dl
0, dij > Dl , (7)
Where β is the distance-decay parameter. Most of the values of β in the existing studies lies between 0.9 and 2.29[34], Wang and Zhang conducted a sensitiveanalysis on β, setting β as 1 or 2 respectively. In conclusion, they thought that β = 2 could be better measure the accessibility of medical services [35].Therefore, this study set β to 2. Considering the abundant medical resources and advanced medical technology in tertiary hospitals, Dl for tertiary hospitalswas set to 190min which is the maximum distance between each tertiary hospital and residential area. The Dl was set as 45min for secondary hospitals, and15min for primary hospitals and community health centers.
According to the distribution of the accessibility scores, we disposed accessibility scores by means of Natural Breaks Classi�cation, dividing it into sevenlevels, respectively, Worst, Worse, Bad, General, Good, Better and Best.
ResultsGeneral description of medical institutions
In 2019, there were 5794 medical institutions in Wenzhou, with 4.74 beds per thousand people, 3.24 doctors per thousand people and 3.14 nurses perthousand people. The number of beds, doctors and nurses per thousand people in LC is higher than the average level of Wenzhou, while other districts andcounties are lower than the average level of the city.
It can be seen from Table 1 that there are great differences in the distribution of medical resources in Wenzhou. Medical institutions (especially tertiaryhospitals) are mainly clustered in LC, followed by RA, YQ and PY. DT and LG have the least number of medical institutions. Separately, the number of generalhospitals in WC, TS and DT is the fewest, and the number of health centers in LG, DT and LW is the least. According to the outline of China's medical andhealth service system planning (http://www.gov.cn), by 2020, there will be 6 beds per thousand resident population, 2.5 doctors per thousand residentpopulation, and 3.14 nurses per thousand resident population. By comparing with national standard, the number of beds per thousand people in Wenzhou islower than the national standard, the number of doctors per thousand people is higher than the national standard, and the number of nurses per thousandpeople is close to the national standard.
Table 1Summary of administrative districts, areas, population, transportations, GDP and medical resources in Wenzhou, 2019.
Town NumberofCounties
Area(km2) Population(thousands) Roadlength(km)
GDP
(billionyuan)
Number of Medical institutions Numberof beds
NumbeofdoctorTertiary
hospitalsSecondaryhospitals
Primaryhospitals
Healthcenters
LC
LW
OH
DT
YJ
PY
CN
WC
TS
RA
YQ
LG
14
10
13
7
22
16
18
17
19
23
25
1
293
319
466
254
2677
1042
1069.01
1296
1768
1350
1391
183.99
785.503
340.465
463.236
154.905
987.881
884.456
969.668
410.794
372.968
1258.202
1314.915
380.654
1360947.26
1046656.15
1670972.66
393669.05
3150959.59
2271744.88
2433606.67
1891943.46
2403271.97
2994816.06
3026750.25
502226.54
1137.13
704.52
661.12
107.84
444.52
510.29
351.7
104.91
110.6
1003.96
1209.93
300.51
6
1
3
0
1
1
1
0
0
2
1
0
3
3
2
1
1
2
2
2
2
3
5
2
9
4
2
2
4
4
5
1
0
4
6
5
23
9
11
7
14
25
18
17
19
29
24
4
16966
1031
1520
378
3153
3842
5819
890
1144
4759
5036
951
8703
1496
1620
323
2507
2509
2886
826
870
4244
4152
879
Equality in the distribution of medical resources
As shown in Table 2, from the distribution of population, the G of medical institutions is far below 0.2, meaning absolute fair; the G of doctors is between 0.2and 0.3, meaning fair; the G of beds is between 0.3–0.4, meaning basic fair; the G of nurse exceeds 0.6, meaning high inequality. It illustrates that thedistribution of medical institutions by population is the best, and the distribution of nurses by population is the worst. In addition, except for medical
( )
( ) {
Page 6/14
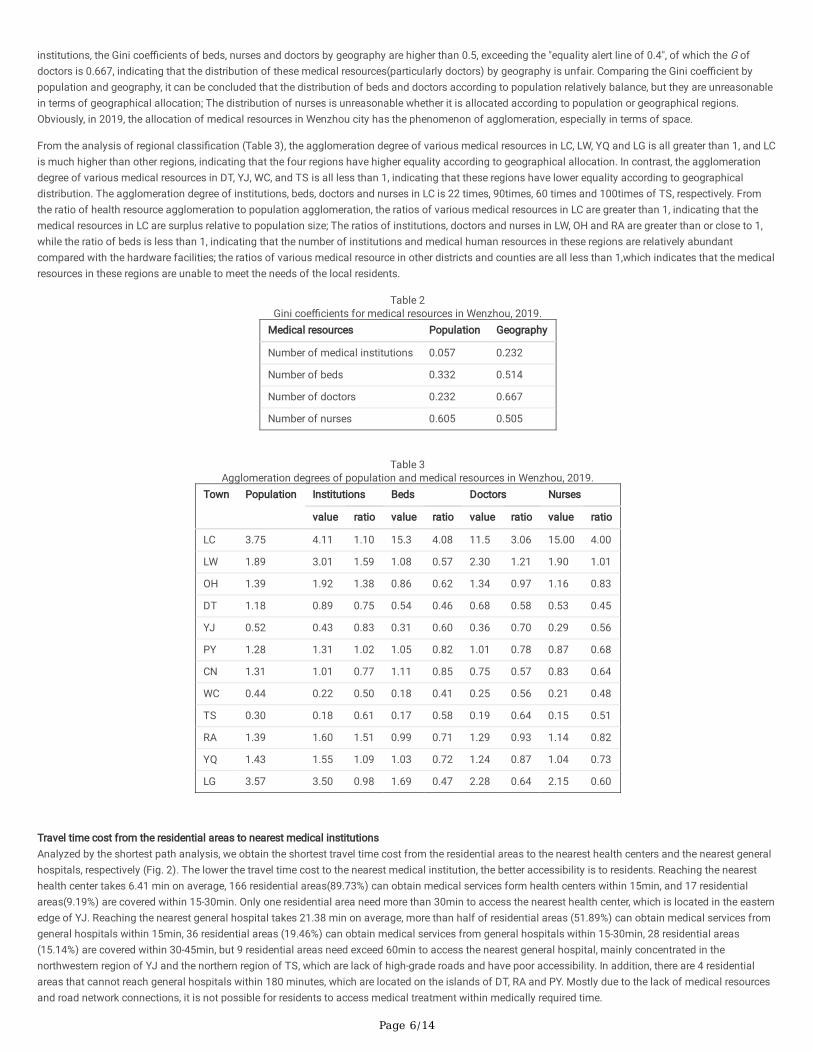
institutions, the Gini coe�cients of beds, nurses and doctors by geography are higher than 0.5, exceeding the "equality alert line of 0.4", of which the G ofdoctors is 0.667, indicating that the distribution of these medical resources(particularly doctors) by geography is unfair. Comparing the Gini coe�cient bypopulation and geography, it can be concluded that the distribution of beds and doctors according to population relatively balance, but they are unreasonablein terms of geographical allocation; The distribution of nurses is unreasonable whether it is allocated according to population or geographical regions.Obviously, in 2019, the allocation of medical resources in Wenzhou city has the phenomenon of agglomeration, especially in terms of space.
From the analysis of regional classi�cation (Table 3), the agglomeration degree of various medical resources in LC, LW, YQ and LG is all greater than 1, and LCis much higher than other regions, indicating that the four regions have higher equality according to geographical allocation. In contrast, the agglomerationdegree of various medical resources in DT, YJ, WC, and TS is all less than 1, indicating that these regions have lower equality according to geographicaldistribution. The agglomeration degree of institutions, beds, doctors and nurses in LC is 22 times, 90times, 60 times and 100times of TS, respectively. Fromthe ratio of health resource agglomeration to population agglomeration, the ratios of various medical resources in LC are greater than 1, indicating that themedical resources in LC are surplus relative to population size; The ratios of institutions, doctors and nurses in LW, OH and RA are greater than or close to 1,while the ratio of beds is less than 1, indicating that the number of institutions and medical human resources in these regions are relatively abundantcompared with the hardware facilities; the ratios of various medical resource in other districts and counties are all less than 1,which indicates that the medicalresources in these regions are unable to meet the needs of the local residents.
Table 2Gini coe�cients for medical resources in Wenzhou, 2019.
Medical resources Population Geography
Number of medical institutions 0.057 0.232
Number of beds 0.332 0.514
Number of doctors 0.232 0.667
Number of nurses 0.605 0.505
Table 3
Agglomeration degrees of population and medical resources in Wenzhou, 2019.Town Population Institutions Beds Doctors Nurses
value ratio value ratio value ratio value ratio
LC 3.75 4.11 1.10 15.3 4.08 11.5 3.06 15.00 4.00
LW 1.89 3.01 1.59 1.08 0.57 2.30 1.21 1.90 1.01
OH 1.39 1.92 1.38 0.86 0.62 1.34 0.97 1.16 0.83
DT 1.18 0.89 0.75 0.54 0.46 0.68 0.58 0.53 0.45
YJ 0.52 0.43 0.83 0.31 0.60 0.36 0.70 0.29 0.56
PY 1.28 1.31 1.02 1.05 0.82 1.01 0.78 0.87 0.68
CN 1.31 1.01 0.77 1.11 0.85 0.75 0.57 0.83 0.64
WC 0.44 0.22 0.50 0.18 0.41 0.25 0.56 0.21 0.48
TS 0.30 0.18 0.61 0.17 0.58 0.19 0.64 0.15 0.51
RA 1.39 1.60 1.51 0.99 0.71 1.29 0.93 1.14 0.82
YQ 1.43 1.55 1.09 1.03 0.72 1.24 0.87 1.04 0.73
LG 3.57 3.50 0.98 1.69 0.47 2.28 0.64 2.15 0.60
Travel time cost from the residential areas to nearest medical institutions Analyzed by the shortest path analysis, we obtain the shortest travel time cost from the residential areas to the nearest health centers and the nearest generalhospitals, respectively (Fig. 2). The lower the travel time cost to the nearest medical institution, the better accessibility is to residents. Reaching the nearesthealth center takes 6.41 min on average, 166 residential areas(89.73%) can obtain medical services form health centers within 15min, and 17 residentialareas(9.19%) are covered within 15-30min. Only one residential area need more than 30min to access the nearest health center, which is located in the easternedge of YJ. Reaching the nearest general hospital takes 21.38 min on average, more than half of residential areas (51.89%) can obtain medical services fromgeneral hospitals within 15min, 36 residential areas (19.46%) can obtain medical services from general hospitals within 15-30min, 28 residential areas(15.14%) are covered within 30-45min, but 9 residential areas need exceed 60min to access the nearest general hospital, mainly concentrated in thenorthwestern region of YJ and the northern region of TS, which are lack of high-grade roads and have poor accessibility. In addition, there are 4 residentialareas that cannot reach general hospitals within 180 minutes, which are located on the islands of DT, RA and PY. Mostly due to the lack of medical resourcesand road network connections, it is not possible for residents to access medical treatment within medically required time.

Page 7/14
Spatial Accessibility of Medical Institutions at all levels
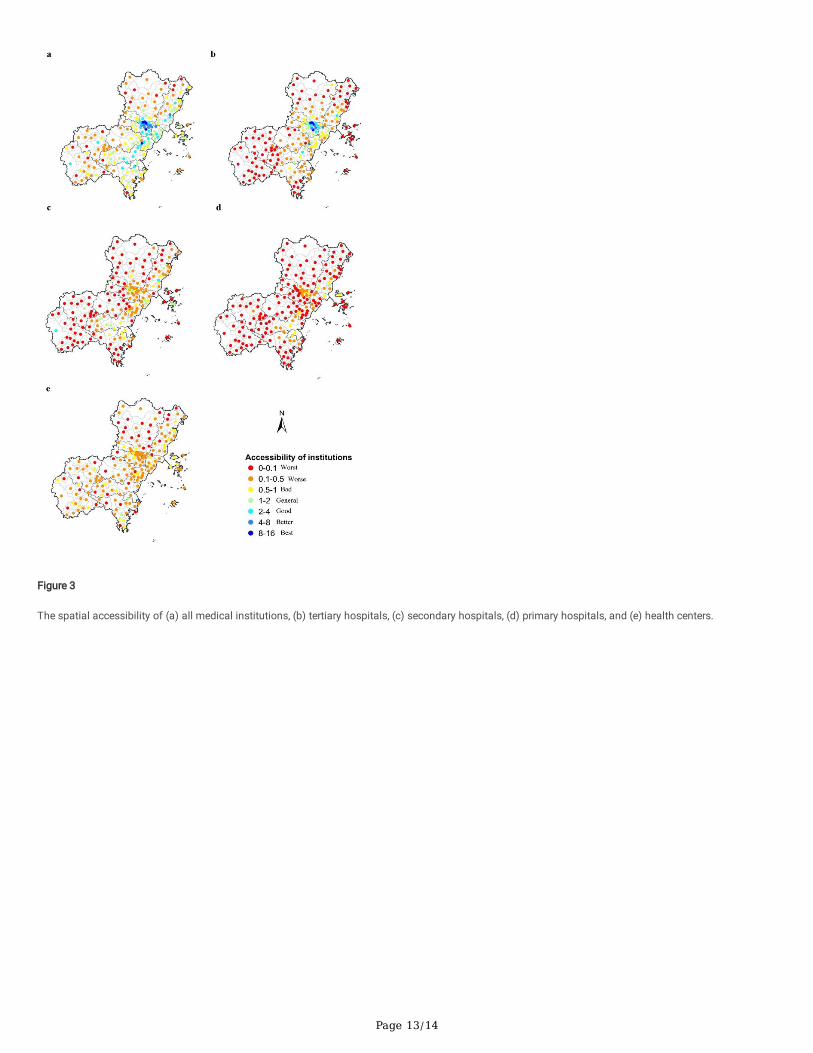
Based on the modi�ed H2SFCA, the overall accessibility in Wenzhou was obtained by summing the accessibility to the all levels of medical institutions. Theaccessibility score represents the number of doctors in medical institutions per thousand population. The higher the accessibility score is, the more medicalresources per capita in the region are available. As shown in Fig. 3a, the overall spatial accessibility of medical institutions in Wenzhou has obvious variation.The residential areas with accessibility in grade of Best are less, and the residential areas with accessibility in grade of General and below account for most ofareas (n = 144), so the overall accessibility is poorer. The areas with highest overall accessibility are concentrated in the urban central areas, such as LC. Thespatial accessibility of RA and YQ is relatively good, while the spatial accessibility is relatively poor in WC and TS. On the whole, spatial accessibility of theeast is higher than that of the west.
There are signi�cant differences in the distribution of accessibility of medical institutions at all levels (Fig. 3bcde). The distribution of accessibility to tertiaryhospitals is the most uneven, showing an obvious cluster of urban centers. The tertiary hospitals in LC have the highest accessibility, which is basicallyconsistent with the distribution of tertiary hospitals. Unlike tertiary hospitals that have strong central accessibility, the accessibility of secondary hospital in LCis no longer the best at this level. The reason for this phenomenon is that LC has the highest population density, while the distribution of secondary hospitalsis scattered and relatively even in most areas. The spatial accessibility of primary hospitals among various levels of medical institutions is the worst, and TShas the lowest accessibility, because there is no primary hospital in TS. The distribution of the accessibility of health centers is relatively even, but theaccessibility scores of health centers in most residential areas are not high, which are at General and below(n = 185), the main reasons are the number ofdoctors in health centers is small and the supply capacity of medical resources is limited.
According to Fig. 4, it can be seen that the overall accessibility of more than 3/4 of the residential areas is General and below, including 64.5% of thepopulation, while the overall accessibility in grade of Good and above only covers 22.2% of the residential areas, but it contains 35.5% of the population, whichindicates that the overall accessibility of Wenzhou is poor, and the population is relatively concentrated in areas with better accessibility. In tertiary hospitalsand secondary hospitals, the proportion of residential areas with accessibility in grade of Bad and above exceeds 80%, covering 4/5 of the population,indicating that the vast majority of residents cannot obtain high-grade medical services. Additionally, the accessibility grades of primary hospitals and healthcenters are all General and below, which shows that the service level of primary hospitals and health centers is poor and the existing medical service levelneeds to be improved.
Correlations between spatial accessibility and in�uence factors
Accessibility scores (Table 4) are positively correlated with the number of medical institutions, the number of doctors, population density, road density andGDP, with the strongest correlation with road density and weakest correlation with GDP. The larger the number of medical institutions, the wider the choice ofmedical treatment for residents, and the higher the accessibility score. There is a strong positive correlation between the number of medical institutions andthe number of doctors, the more medical institutions, the more doctors. Therefore, most doctors will choose to go to the regions where medical resources areconcentrated, resulting in a large difference in the accessibility score. The higher the road density, the better the accessibility, and the more convenient it is forresidents to obtain medical treatment. Consequently, most medical institutions will be built near the road network, and road density is one of the main reasonsfor the difference in accessibility. The areas with higher population density, accessibility is better, and the number of accessible hospitals is relatively large,which can meet medical needs of residents. The economically developed areas have relatively better accessibility, such as LC, YQ and RA, which areeconomically developed and have better accessibility to hospital.
Table 4Correlations between spatial accessibility and in�uence factors.
Analysis index Accessibility score Number of medical institutions Number of doctors population density Road density
Number of medical institutions 0.585**
Number of doctors 0.670** 0.799**
Population density
(person/km2)
0.769** 0.493** 0.590**
Road density
(km/ km2)
0.792** 0.512** 0.592** 0.826**
GDP(ten thousand) 0.310** 0.374** 0.536** 0.326** 0.266**
Note: ** Signi�cant at 0.01 level (two-tailed)
DiscussionThe spatial distribution of medical resources is unbalanced, and the geographical equality needs to be improved
The geographical distribution of all medical resources in Wenzhou is highly unfair, and similar results have also appeared in other studies[36, 37]. On the onehand, this is related to the allocation of resources in China, which usually takes the amount of health resources per thousand population as the main indicator[38]. However, this method does not take into account geographical factors of medical resources allocation, resulting in the concentration of medicalresources in densely populated areas. On the other hand, the allocation of medical resources is positively correlated with the level of regional economic

Page 8/14
development, and well-developed regions often have relatively higher levels of medical resource allocation[39]. Consequently, it is suggested that thegovernment should pay more attention to geographical equality when formulating regional planning, improve the mechanism of medical resource allocation,and allocate more medical resources to remote and underdeveloped areas in order to improve the equity of health resource allocation[40]. For the problems ofexcessive medical resources in central urban areas such as LC and lack of medical resources in districts and counties such as TS, corresponding measuresshould be taken to promote the sinking of medical resources to each district and country to achieve cross-regional �ow of resources. In view of largedisparities in resources among districts and counties in Wenzhou, the government should adopt macro-control, formulate regional health planning byconsidering various factors such as population, geography and economic level, so as to narrow the differences of medical resources allocation amongregions.
The nurses are highly unevenly distributed by population and geography. Due to the in�uence of geographical location, medical staff are more inclined tochoose employment in central urban areas, which can easily lead to excessive concentration of talents in the central city, while medical staff in remote areasare in short supply. Hence, it is suggested that the government should put the equality of nursing resources at the top of the task of improving health humanresources. First, it is necessary to increase the investment of health human resources, improve the nursing performance system, raise the welfare of nursingstaff and enhance the stability of nursing team. second, it should issue corresponding employment guidance policies to encourage college graduates tochoose employment in remote urban areas, and give preference to these personnel in terms of sta�ng, professional title promotion [41]; Third, strengthen the�ow of nursing staff, implement counterpart assistance and increase further study opportunities to improve the theoretical and practical level of primarynurses. Ultimately, it will promote the balanced distribution of nursing resources across different regions, populations and medical institutions at all levels toensure the accessibility of medical services.
Obvious differences in the accessibility of medical resources at all levels, and “graded diagnosis and treatment” policy needs to be strengthened
By comparing the travel time and cost to the nearest medical institutions with the spatial distribution of the overall accessibility score, it is found that thesmaller the travel time cost from residential areas to the nearest medical institutions, the more convenient it is for residents to travel, the higher theaccessibility score in this area and the large number of accessibility hospitals.
The overall spatial accessibility of Wenzhou is poor and the heterogeneity is obvious. LC has the highest accessibility, and WC and TS have poor accessibility.The reason for this gap is the unequal distribution of medical resources. LC is the central city with dense population, developed economy, convenienttransportation, and supported by medical university, which gathers a large number of high-quality medical resources. While WC and TS are located in thesouthwest, where the economic development is relatively lagging behind, the government's investment in medical resources is insu�cient, coupled with thescarcely populated area, low road density, long travel time for residents, resulting in low access to healthcare services. It is suggested that government shouldactively strengthen the road networks construction in remote areas, especially WC, TS and the northwest of YJ. In addition, the areas with higher accessibilitynot only exist in the central city, but also some towns, such as the northwestern part of LW, where the population density is lower and the per capita acquisitionof medical resources are relatively su�cient. On the whole, spatial accessibility of the east is higher than of the west. The main reasons for this spatialdifference are terrain and altitude[9]. The eastern part is a plain area with low altitude and good medical conditions; the western part is a middle-low mountainarea with relatively high altitude, high travel cost and poor accessibility.
The accessibility of medical institutions at all levels has signi�cantly different. In order to improve the spatial accessibility and reduce the inequality ofmedical services at all levels, it is necessary to take corresponding measures for different levels of medical institutions. For tertiary hospitals, building newhigh-grade hospitals in the periphery areas can improve accessibility [42]. For secondary hospitals, it is advisable that the grade of existing hospitals shouldbe improved. For primary hospitals, the government should increase �nancial investment and build primary hospitals in areas with low accessibility of TS andYJ. For health centers, although the number of health centers is more than that of general hospitals, and nearly 90% residential areas can access the nearesthealth center within 15min, but the accessibility scores of health centers are low, implying that the medical services provided by health centers cannot satisfythe demand of local residents. The government should take full advantage of the close proximity of health centers, transfer quality medical resources fromhigh-grade hospitals to health centers, and strengthen the service capacity of health centers [43]. Last and most important point, the government shouldfurther promote the “graded diagnosis and treatment” policy, improve the medical insurance reimbursement system to fundamentally solve the problem ofmedical treatment for residents.
LimitationsThe results of this study are helpful to understand the allocation of medical resources in Wenzhou, and provide a basis for the relevant departments toformulate reasonable planning and layout. However, this study has several limitations that we hope to improve in the future studies. Frist, due to the datalimitation, the population data is at subdistrict/town level, and the location of residential areas is not accurately located, which affects the accuracy of theaccessibility score. Second: The in�uence of demographic factors on accessibility is not considered. Finally: Only the number of doctors represents the servicecapacity of the medical institutions, without considering the subjective preferences of residents to obtain medical treatment.
The unreasonable spatial distribution of medical resources in cities, represented by Wenzhou, re�ects the existing problem of supporting public service inChinese cities. The methods also can be applied to other public services in other countries and regions, especially regions with obvious heterogeneity in publicservices resources, which has important policy guiding signi�cance[44]. Future work should comprehensively consider more dimensions of spatialaccessibility, such as population, socio-economic and culture barriers, to enhance the accuracy of accessibility.
Conclusions

Page 9/14
In this research, the health economics and the modi�ed H2SFCA method were applied to evaluate the equality of medical resources distribution and theaccessibility of different levels of medical institutions, respectively. And the in�uencing factors of accessibility difference was explored by spearmancorrelation analysis. According to the results, the following conclusions can be drawn: (1) The distribution of medical resources in Wenzhou is unbalanced,and the medical resources in LC are highly concentrated, while WC,TS and DT are relatively short. (2) The distribution of medical resources in Wenzhou isinequitable according to population and geographical distribution. (3) The overall spatial accessibility of Wenzhou is poor, the accessibility of east regions ishigher than west regions, and there are obvious differences in accessibility of hierarchical medical institutions. (4) Accessibility is positively correlated with thenumber of institutions, the number of doctors, population density, road density and GDP. Therefore, when making health planning, the government should takepopulation and geographical factors into consideration to narrow the regional differences and improve the e�ciency of medical resource allocation. Moreover,the government should increase �nancial investment in economically backward areas, strengthen the construction of hospitals, and improve tra�c conditionsto meet the demand of local residents for medical treatment.
Abbreviations2SFCA: two-step �oating catchment area; H2SFCA: hierarchical two-step �oating catchment area
DeclarationsEthics approval and consent to participate
Not applicable
Consent for publication
Not applicable
Availability of data and materials
The datasets used and/or analysed during the current study are available from the corresponding author on reasonable request.
Competing interests
The authors declare that they have no competing interests
Funding
Not applicable
Authors' contributions
MD, TF and KM contributed to the framework and designed of this study. MD, LYF and YHZ provided assistance in data collection. MD wrote the �rst draft withsupervision from KM. HH and MHZ helped revising the draft. All authors contributed signi�cant intellectual content in this study and approved the �nalsubmission.
Acknowledgements
Not applicable
References1. United Nations. Transforming our world: The 2030 Agenda for Sustainable Development. 2015. https://sdgs.un.org/2030agenda. Accessed 13 September
2021.
2. Dong E, Liu S, Chen M, Wang H, Chen LW, Xu T, et al. Differences in regional distribution and inequality in health-resource allocation at hospital andprimary health centre levels: a longitudinal study in Shanghai, China. BMJ Open. 2020;10(7):e035635.
3. Emanuel EJ, Persad G, Upshur R, Thome B, Parker M, Glickman A, et al. Fair Allocation of Scarce Medical Resources in the Time of Covid-19. N Engl JMed. 2020;382(21):2049–55.
4. Liu W, Xia Y, Hou J. Health expenditure e�ciency in rural China using the super-SBM model and the Malmquist productivity index. Int J Equity Health.2019;18(1):111.
5. Yang F, Yang Y, Liao Z. Evaluation and Analysis for Chinese Medical Alliance's Governance Structure Modes Based on Preker-Harding Model. Int J IntegrCare. 2020;20(4):14.
�. Zhang X, Zhao L, Cui Z. Wang Y. Study on Equity and E�ciency of Health Resources and Services Based on Key Indicators in China. PLoS One. 2015;10(12):e0144809.
7. Bigman D, ReVelle C: The Theory of Welfare Considerations in Public Facility Location Problems. Geographical Analysis. 1978; 10(3):229–240.
�. Tao Z, Cheng Y, Zheng Q, Li G. Measuring spatial accessibility to healthcare services with constraint of administrative boundary: a case study of YanqingDistrict, Beijing, China. Int J Equity Health. 2018;17(1):7.

Page 10/14
9. Liu S, Qin Y, Xu Y. Inequality and In�uencing Factors of Spatial Accessibility of Medical Facilities in Rural Areas of China: A Case Study of Henan Province.Int J Environ Res Public Health. 2019;16(10).
10. Neutens T. Accessibility, equity and health care: review and research directions for transport geographers. Journal of Transport Geography. 2015;43:14–27.
11. Rosero-Bixby L. Spatial access to health care in Costa Rica and its equity: a GIS-based study. Soc Sci Med. 2004;58(7):1271–84.
12. Joseph AE, Bantock PR. Measuring potential physical accessibility to general practitioners in rural areas: a method and case study. Soc Sci Med.1982;16(1):85–90.
13. Huber C, Watts A, Grills A, Yong JHE, Morrison S, Bowden S, et al. Modelling airport catchment areas to anticipate the spread of infectious diseases acrossland and air travel. Spat Spatiotemporal Epidemiol. 2021;36:100380.
14. Radke J, Mu L. Spatial Decompositions, Modeling and Mapping Service Regions to Predict Access to Social Programs. Geographic Information Sciences.2000;6(2):105–12.
15. Guagliardo MF. Spatial accessibility of primary care: concepts, methods and challenges. Int J Health Geogr. 2004;3(1):3.
1�. Langford M, Higgs G. Measuring Potential Access to Primary Healthcare Services: The In�uence of Alternative Spatial Representations of Population. TheProfessional Geographer. 2006;58(3): 294–306.
17. Cervigni F, Suzuki Y, Ishii T, Hata A. Spatial accessibility to pediatric services. J Community Health. 2008;33(6):444–8.
1�. Mao L, Nekorchuk D. Measuring spatial accessibility to healthcare for populations with multiple transportation modes. Health Place. 2013;24:115–22.
19. Luo J, Tian L, Luo L, Yi H, Wang F. Two-Step Optimization for Spatial Accessibility Improvement: A Case Study of Health Care Planning in Rural China.Biomed Res Int. 2017;2017:2094654.
20. Hashtarkhani S, Kiani B, Bergquist R, Bagheri N, VafaeiNejad R, Tara M. An age-integrated approach to improve measurement of potential spatialaccessibility to emergency medical services for urban areas. Int J Health Plann Manage. 2020;35(3):788–98.
21. Luo W, Qi Y. An enhanced two-step �oating catchment area (E2SFCA) method for measuring spatial accessibility to primary care physicians. Health Place.2009;15(4):1100–7.
22. Dai D. Black residential segregation, disparities in spatial access to health care facilities, and late-stage breast cancer diagnosis in metropolitan Detroit.Health Place. 2010;16(5):1038–52.
23. Wang X, Pan J. Assessing the disparity in spatial access to hospital care in ethnic minority region in Sichuan Province, China. BMC Health Serv Res.2016;16(1):399.
24. Wang F, Luo W. Assessing spatial and nonspatial factors for healthcare access: towards an integrated approach to de�ning health professional shortageareas. Health Place. 2005;11(2):131–46.
25. McGrail MR, Humphreys JS. Measuring spatial accessibility to primary care in rural areas: Improving the effectiveness of the two-step �oating catchmentarea method. Applied Geography. 2009;29(4):533–41.
2�. Jin M, Liu L, Tong D, Gong Y, Liu Y. Evaluating the Spatial Accessibility and Distribution Balance of Multi-Level Medical Service Facilities. Int J Environ ResPublic Health. 2019; 16(7):1150.
27. Resource and Environment Science and Data center. China GDP spatial distribution kilometer grid data set. https://www.resdc.cn/data.aspx?DATAID=252. Accessed 17 May 2021(In Chinese).
2�. Highway Bureau Ministry of Transport of The People’s Republic of China. Technical Standard of Highway Engineering(JTGB01-2014). People’sCommunications Press: Beijing, China; 2014, p.120(In Chinese).
29. Zhang T, Xu Y, Ren J, Sun L, Liu C. Inequality in the distribution of health resources and health services in China: hospitals versus primary care institutions.Int J Equity Health. 2017;16(1):42.
30. Theodorakis PN, Mantzavinis GD, Rrumbullaku L, Lionis C, Trell E. Measuring health inequalities in Albania: a focus on the distribution of generalpractitioners. Hum Resour Health. 2006;4:5.
31. Yu Q, Yin W, Huang D, Sun K, Chen Z, Guo H, et al. Trend and equity of general practitioners' allocation in China based on the data from 2012–2017. HumResour Health. 2021;19(1):20.
32. Wu X, Hu Y, Li D, Zhu X, Li J, Qi, Z. Study on the allocation equity of medical insurance designated retail pharmacies in Shenzhen. Chinese Journal ofHealth Policy. 2021;14(04):28–34(In Chinese).
33. Wang Y, Li Y, Qin S, Kong Y, Yu X, Guo K, et al. The disequilibrium in the distribution of the primary health workforce among eight economic regions andbetween rural and urban areas in China. Int J Equity Health. 2020; 19(1): 28.
34. Peeters D, Thomas I. Distance predicting functions and applied location-allocation models. Journal of Geographical Systems. 2000;2(2):167–84.
35. Wang YF, Zhang C. GIS and gravity polygon based service area analysis of public facility: Case study of hospitals in Pudong new area. Econ Geogr.2005;25(06):800–803 + 809(In Chinese).
3�. Jin J, Wang J, Ma X, Wang Y, Li R. Equality of Medical Health Resource Allocation in China Based on the Gini Coe�cient Method. Iran J Public Health.2015;44(4):445–57.
37. Li Q, Wei J, Jiang F, Zhou G, Jiang R, Chen M, et al. Equity and e�ciency of health care resource allocation in Jiangsu Province, China. Int J Equity Health.2020;19(1):211.
3�. The State Council of China. The national planning for medical and health service system from 2015 to 2020, Government document.http://www.gov.cn/zhengce/content/2015-03/30/content_9560.htm. Accessed 13 September 2021(In Chinese).

Page 11/14
39. Huo J. An analysis of China health resource allocation on the view of economics. Ningbo University. 2011(In Chinese).
40. Sun J, Luo H. Evaluation on equality and e�ciency of health resources allocation and health services utilization in China. Int J Equity Health.2017;16(1):127.
41. Yang Z, Li NX. Research on the equity of the nursing human resource allocation in China, 2013–2017. Modern Preventive Medicine. 2021;48(05):858–861(In Chinese).
42. Tao Z, Cheng Y, Zheng Q, Li G. Measuring spatial accessibility to healthcare services with constraint of administrative boundary: a case study of YanqingDistrict, Beijing, China. Int J Equity Health. 2018;17(1):7.
43. Yue J, Fu Q, Zhou Y, Zhang Y, Ning J, Yin G, et al. Evaluating the accessibility to healthcare facilities under the Chinese hierarchical diagnosis andtreatment system. Geospat Health. 2021;16(2).
44. Zhang S, Song X, Zhou J. An equity and e�ciency integrated grid-to-level 2SFCA approach: spatial accessibility of multilevel healthcare. Int J EquityHealth. 2021;20(1):229.
Figures
Figure 1
The distribution of medical institutions in the study area.

Page 12/14
Figure 2
The travel time cost to nearest medical institutions.
Page 13/14
Figure 3
The spatial accessibility of (a) all medical institutions, (b) tertiary hospitals, (c) secondary hospitals, (d) primary hospitals, and (e) health centers.

Page 14/14
Figure 4
Proportions of residential area and population under different grades of hospital accessibility
Related Documents