Evaluating the impact of Brazil’s central audit program on municipal provision of health services Corresponding Author: 1) Marislei Nishijima Associate Professor at University of Sao Paulo [email protected] Av. Prof. Lúcio Martins Rodrigues, s/n, travessas 4 e 5 Cidade Universitária- ZIP code 05508-020 - São Paulo -SP - Brazil +55(11) 3091-0526 2) Randall P. Ellis Professor at Boston University 270 Bay State Road, Boston, MA 022l5 USA 3) Regina C. Cati Lecturer at Boston University 270 Bay State Road, Boston, MA 022l5 USA Abstract: This paper evaluates the success of Brazil’s Corregedoria Geral da União’s (CGU) anti-corruption program in fostering better performance in the health sector. The effects of the program on various primary health indicators are examined using panel data from the 5560 Brazilian municipalities over the period from 2000 to 2011. Since 2003, the program has randomly selected municipalities to be investigated each year, and immediately disclosed its findings. We examine two mechanisms through which this program could be effective: a deterrent effect whereby municipalities react to the threat of being audited, and an auditing effect, whereby municipalities change their behavior only when actually audited. Four performance measures capture the quantity and quality of expenditure on primary health public goods and services. Overall, we find very weak evidence of effects of the random audits on our health outcomes using three different approaches. A regression discontinuity approach suggests that the number of child care appointments was improved by deterrence, while difference-in-difference models suggest small but statistically significant effects of actually being audited on the infant mortality rate. JEL code: H41, H75, H83 Keywords: primary health, anti-corruption program, audit , municipalities, discontinuity Acknowledgements We gratefully acknowledge the financial support for this project from the FAPESP (Fundação de Amparo à Pesquisa do Estado de São Paulo) agency and the University of Sao Paulo. We thank Ivan Fernandez-Val, Delia Furtado, Albert Ma, Dilip Mookherjee Hannah Patnaik, Fabiana Rocha, and Nathaniel Young Wenjia Zhu for their helpful comments and guidance. All errors are our own.

Welcome message from author
This document is posted to help you gain knowledge. Please leave a comment to let me know what you think about it! Share it to your friends and learn new things together.
Transcript
Evaluating the impact of Brazil’s central audit program on municipal provision of health services
Corresponding Author: 1) Marislei Nishijima Associate Professor at University of Sao Paulo
[email protected] Av. Prof. Lúcio Martins Rodrigues, s/n, travessas 4 e 5
Cidade Universitária- ZIP code 05508-020 - São Paulo -SP - Brazil +55(11) 3091-0526
2) Randall P. Ellis
Professor at Boston University 270 Bay State Road, Boston, MA 022l5 USA
3) Regina C. Cati
Lecturer at Boston University 270 Bay State Road, Boston, MA 022l5 USA
Abstract: This paper evaluates the success of Brazil’s Corregedoria Geral da União’s (CGU) anti-corruption program in fostering better performance in the health sector. The effects of the program on various primary health indicators are examined using panel data from the 5560 Brazilian municipalities over the period from 2000 to 2011. Since 2003, the program has randomly selected municipalities to be investigated each year, and immediately disclosed its findings. We examine two mechanisms through which this program could be effective: a deterrent effect whereby municipalities react to the threat of being audited, and an auditing effect, whereby municipalities change their behavior only when actually audited. Four performance measures capture the quantity and quality of expenditure on primary health public goods and services. Overall, we find very weak evidence of effects of the random audits on our health outcomes using three different approaches. A regression discontinuity approach suggests that the number of child care appointments was improved by deterrence, while difference-in-difference models suggest small but statistically significant effects of actually being audited on the infant mortality rate.
JEL code: H41, H75, H83 Keywords: primary health, anti-corruption program, audit , municipalities, discontinuity Acknowledgements
We gratefully acknowledge the financial support for this project from the FAPESP (Fundação de Amparo à Pesquisa do Estado de São Paulo) agency and the University of Sao Paulo. We thank Ivan Fernandez-Val, Delia Furtado, Albert Ma, Dilip Mookherjee Hannah Patnaik, Fabiana Rocha, and Nathaniel Young Wenjia Zhu for their helpful comments and guidance. All errors are our own.

Title: Evaluating the impact of Brazil’s central audit program on municipal provision of health services
1. Introduction This paper investigates whether the anti-corruption program implemented in Brazil in
2003 was effective in improving the quality of health care services. The setting is an important one for studying anti-corruption effort because the federal program emphasized randomization and immediate information provision. Each year since 2003 a randomly chosen subset of municipalities was selected to audit each year, and only moderately large municipalities were eligible to be audited. Since audits were truly random (even done with replacement,) the quasi-experimental design enables us to compare outcomes before and after audits, which is the “auditing effect.” We are also able to compare the outcomes before and after the program started, and between eligible and ineligible municipalities to see if there is any “deterrent effect”: outcome changes made in anticipation of a possible audit. The time variation in when audits occur also enables us to examine the duration of changes in outcomes, and study lags. Using respectively regression discontinuity and difference in differences techniques, we estimate ‘deterrent’ and ‘auditing’ effects on outcomes. In the last case we also consider its lags.
Brazil’s Corregedoria Geral da União (CGU) or Federal Inspector General’s anti-corruption program’s mandate is to monitor municipalities’ usage of funds provided by the central government. Details of the program are found in Ferraz and Finan (2008). The CGU Program investigates and monitors expenditure by municipalities in numerous areas including education, health, and others. This paper specifically addresses the effect of the program on the health sector. Within this sector the CGU Program monitors the transfers from the central government to the municipalities by the Brazilian Public Health System (SUS). Every year since 2003, sets of eligible municipalities are randomly selected for audit. The eligible municipalities are those with less than 500,000 inhabitants, which represent 99% of all Brazilian municipalities. Figure 1 shows the audited municipalities from 2003 to 2011, illustrating the randomness of the auditing program.

2
Figure 1 – Municipalities that were audited at random from 2003 to 2011
While the health sector is not the only sector affected by the anticorruption program, it is a particularly interesting sector to study. One reason for its interest centers on the way the Brazil’s 1988 Constitution set up the public health systems. It defined a process of decentralization, first decentralizing provision of primary health and prevention services and then decentralizing financial responsibility (Oates, 1972 and 1999). By 2011 the central government had largely decentralized the administrative processes related to the health sector, even while financial decentralization happened much more slowly. The central government still finances around 40% of the provision of health services, particularly through the transfer of resources from the Brazilian Public Health Systems (SUS).
Health sector financial transfers in particular have been the target of investigations by the CGU anti-corruption program. Careaga and Weingast (2000), Rodden (2000), and Persson and Tabellini (2000) argue that attempts to reduce corruption through decentralization cannot be effective until funding no longer comes from the central government. Since Brazilian health system financing remains heavily influenced by the central government, and corrupt municipality leaders have little incentive to do audits, the CGU monitoring program was specifically designed to prevent misuse of central government public resources by municipalities.
The second reason for studying the CGU program concerns Brazil’s new emphasis on transparency and public disclosure of information. The CGU audit reports are all available on the Internet shortly after the municipalities have been audited. Publicizing any irregularities discovered through the inspections reduces information asymmetry and improves economic efficiency by exposing questionable transactions conducted in municipalities; and doing so

3
quickly reduces the prospect of political influence suppressing any findings. The CGU anti-corruption program was launched in response to public concerns over rising levels of corruption and the lack of transparency.
The literature on how transparency, and in particular how Freedom of Information (FOI) legislation, affects corruption has mixed evidence on its effectiveness. Escaleras, Lin and Register (2010), examine panel data on 128 countries that includes 46 countries adhered to FOI in 2003 as a way of promoting greater transparency in the public sector and did not discover any significant effect of developed countries incorporating FOI on the level of corruption. More controversially, the authors find a negative effect of transparency on corruption for developing countries. Brazil only became a signatory to the Freedom of Information Act (FOI) in 2011.
Building on the existing theories, this study aims to assess the effect of the CGU anti-corruption program on improving health standards, measured by four health performance indicators, through increased expenditure. This task was carried out using annual data from 2000 to 2011. We use Brazil’s 5,560 Municipalities as our unit of analysis, which are similar to American counties but include both cities and rural areas. The results of the paper potentially shed light on the feasibility of this kind of anti-corruption program in other countries, especially when reforms are done in the context of financial decentralization and significant corruption.
Our study of the effectiveness of the CGU anti-corruption program is important because there has been significant skepticism about the Brazilian government’s enforcement of policies and programs. This is especially true with regard to its willingness to prosecute and punish combat criminal activities even if detected. One concern is about the slow pace of the justice system in bringing suspected criminals to court. Additionally, court proceedings seem to fail at successfully punishing defendants or compensating victims. A further concern is that even if corruption is identified and punished it may not meaningfully improve public good provision if the punishment is largely invisible.
Complementing the previous efforts to identify, prosecute and punish corrupt officials penalties, the 2003 CGU reforms placed a new emphasis on identifying and publicizing corruption at the municipal level. The CGU program continues to prescribe various penalties for corruption, but holistically these punishments do not differ meaningfully from the previous punishments being carried out. The public randomization of the CGU anticorruption program, together with its immediate publicizing of any findings makes it harder for corrupt municipalities to avoid audit and avoid detection, even if punishment may remain incomplete or slow. This study focuses on the CGU’s efficacy to improve performance measures in the primary health sector.
We distinguish and test for two possible impacts of the CGU anticorruption program. One possibility is that the mere threat of being discovered has a deterrent effect, promoting better governance of resources and allocation. If this is the mechanism for improvement, then reductions in corruption and improved performance should have occurred immediately after the program was started in 2003, and will be independent of whether a municipality is actually audited or not. Municipalities not at risk of an audit should not show any effect of the CGU program. A second possibility is that improvement only occurs when an audit is made and results are and publicized or punished. With this punishment process, benefits of the CGU program should be focused only on those areas that are actually audited.
Another motivation for this study is to better understand the persistence of effects to identify, publicize and punish corruption over time. Even if actual audits or their threat do improve health care outcomes, it matters whether this improved performance persists

4
indefinitely, or only lasts for one or a few years. This issue is particularly important given the recent decline in the number of municipalities actually audited under the CGU program. As shown in Figure 2, during the first three years, from 2003 to 2005 there was a 5-7% chance that a municipality would be audited in each year. By 2011 the audit rate had declined to only 1.9%1. Penalties for corrupt practices remained unchanged over the same period, so the reduced probability of detection was not offset by increased penalties. This trend weakens the CGU program and makes enforcement capabilities questionable. Running an experiment, Azfar and Nelson Jr. (2007) find a positive relationship between the ease of detecting corruption and the corruption incidence.
Figure 2 – Proportion of Brazilian municipalities audited per year, 2003-2011
In Section 2 we review the existing literature, describe the chronology of interventions and changes in the Brazilian health sector, and specify our hypothesis. Section 3 describes our panel data, while Section 4 outlines our empirical strategy. Section 5 presents our results, and Section 6 ends with our concluding remarks.
2. Literature and Contextualization
2.1 Existing Literature There has been a recent rise in discussion of possible solutions for curbing corruption through decentralization. There is also a growing literature on the effects of corruption on various social indicators, including the performance of the health sector.
Brennan and Buchanan (1980) use a model of inter-jurisdictional competition to illustrate the possibility of a negative relationship between decentralization and corruption.
1 Information about the CGU Program, in Portuguese, can be found at http://www.cgu.gov.br/controleinterno/AvaliacaoExecucaoProgramasGoverno/Sorteios/Municipios/Sorteados/index.asp. The website describes the program evaluation, implementation, and design, the lottery data, and all available reports from the investigations.

5
Their results rely upon the logic of market competition: there is less corruption when local governments compete to attract residents and this consumer choice restricts the power of public officials to impose high charges on the services rendered.
Fredriksson and Vollebergh (2009), using data from OECD countries, find indirect evidence that federal systems, as opposed to other types of political systems, tend to have less corruption. Decentralization under a federal system reduces corruption by increasing the number of levels of political officials necessary to bribe in order to obtain large scale benefits. Fisman and Gatti (2002) found that greater decentralization was linked to lower levels of corruption behavior using cross-country data as well. A contrary view is offered by Careaga and Weingast (2000), Rodden (2000) and Persson and Tabellini (2000), and more recently Fan, Lin and Treisman (2009), who warn that decentralization may not be successful in reducing corruption if decentralized spending by municipalities is not accompanied by decentralized revenue.
Using data from the United States, Goel and Nelson (2011) find a negative effect of decentralization on local government corruption activities according to the type of decentralization. According to Acemoglu and Verdier (2000), if the government transfers resources to address a market failure, this creates an incentive for municipalities to indulge in corrupt behavior. A federal structure requires local bureaucrats to gather information and implement federal policies, creating opportunities for local officials to misreport or misrepresent their findings based on their perceived benefits.
Dreher and Schneider (2010) find evidence that corruption and shadow economies are strong complements in developing countries. Brazil has a substantial informal labor market, which while decreasing still represented 32.7 percent of the labor force in 2011 (Moura and Barbosa-Filho, 2013). Peixoto et al. (2012) show that the number of corruption incidents in Brazil’s Southeast region between 2004 and 2010 declined when municipalities gained control over the provision of basic health services.
Yet a different line of argument is that anticorruption programs are inherently ineffective. Banerjee, Mullainathan and Hanna (2012) argue that there are no guarantees that the bureaucrat responsible for auditing the municipalities’ is not himself corrupt. This can occur if the bureaucrat benefits from the existing information asymmetry in the municipalities, or will accept bribes in exchange for ignoring mismanagement.
Several studies examine corruption specifically in Brazil. Ferraz and Finan (2008) find that an increase in the number of corruption charges identified by the CGU program reduced the probability of an incumbent being reelected in the municipal election results. Hence local officials may not want to identify corruption, even if higher level bureaucrats are involved. Ferraz, Finan and Moreira (2012) analyze whether the reduction in allocated funds due to corruption and misuse affects students outcomes in Brazil. They find that missing resources significant constrains school quality. Test scores on national standardized exams and exam pass rates are significantly lower in more corrupt than less corrupt municipalities, while dropout rates are significantly higher.
Lichand, Lopes and Medeiros (2014) analyzed the association between the number of corruption cases discovered by the CGU anti-corruption program and health and non-health spending outcomes. Interestingly, they find that health outputs and outcomes became worse as detected corruption increased. There were less corruption charges, but a marked decline in health indicators. According to the authors, “Preliminary evidence suggests that, after the program, procurement staff hold spending back because they are afraid of accidentally misreporting procurement: the decrease in corruption can therefore be entirely attributed to lower expenditure for a given set of transfers” The Lichand et al. study uses much of the

6
same data and is closest to the current study. Where we differ is that their study assumes that bad health outcomes are driven by how much corruption is detected in the audited municipalities, which we do not examine. Instead of trying to measure the magnitude of corruption and how it affects outcomes, we examine the effectiveness of the government main policy tool for fighting corruption at the municipal level, and whether audits, or the threat of an audit, appears to affect health outcomes meaningfully.
2.2 Brazil’s Health Care System
Brazil’s publicly funded health system, the SUS (Sistema Único de Saúde), was laid down in the 1988 Constitution, and originally intended to promote decentralized provision and financing of primary health care. However, decentralized provision of care did not come into effect immediately and the process of decentralization is still in progress.
Assessing the impact of the CGU program on the health sector is challenging for several reasons. One challenge is that changes happened very slowly, with many steps along the way. In the mid-nineties, Brazil changed the way it provides public services and goods from being a supplier to being a regulator of the suppliers by means of regulatory agencies. Two new health agencies were set up in 1998-1999: the National Regulatory Agency for Private Health Insurance and Plans (ANS) which regulates private health insurance and the Brazilian Health Surveillance Agency (ANVISA), which is similar to US Food and Drug Administration (FDA). The 1998 Generic Drug law standardized and regulated the quality of many drugs in the country, which had previously varied greatly depending on the producers and manufacturers.
With the election of a leftist party in Brazil in 2002, the Party of Workers (PT) instituted a major social agenda. The new government focused on widening the coverage of many existing social programs through the country. A primary example is a cash transfer program, Bolsa Família.
The provision of health services and goods for SUS is shared between the three tiers of government. The central government sets out the guidelines for its health policies, and transfers the funds that are needed to implement the programs to states and municipalities. The states and the big municipalities carry out complex procedures in health and are responsible as well as for primary health care and prevention. The municipal authorities can choose the degree to which primary health care is distributed to its population. In 1994 the Brazilian government started the Family Health Program (PSF) – now called Family Strategy Program (PEF) - based on community agents that were spread to all municipalities. In the last years of decade 2010, more than 80% of population in each municipality was covered by the PSF. This program became the main channel for the population to have access to the SUS (Rocha and Soares, 2010).
In 2000, a Constitution amendment initiated financial decentralization. Amendment 29 made municipal authorities solely responsible for spending 15% of their total budget on health. Although initially targets differed by municipality, by 2005 all municipalities were required to adhere to the same target. Full implementation of the amendment was implemented in 2011.
3. Hypotheses, Data and Methods
3.1. Hypotheses The CGU anti-corruption program can be analyzed as fundamentally as having a price
effect on corruption. The price effect arises because the program, by increasing the likelihood

7
of a municipality being audited, caught and punished for irregularities, increases the cost of corruption for the municipality. Building on the model of Careaga and Weingast (2000), we conceptualize politicians as maximizing their utility U by allocating a fixed budget between public goods, y, and corruption, r, where the total budget available depends on the municipalities total revenue, which depends on transfers coming from the central government, T, and revenue from its own resources, . Hence:
max , , s.t. . (3.1)
In equilibrium the relative cost of y in terms of r, is captured by the relative price of y, , which may be affected by anticorruption efforts. The public official’s marginal rate of
substitution between public goods and corruption will reflect the relative price of the two goods, which can depend on the anti-corruption program effect. The anticorruption program lowers the price of y by decreasing the relative price of corruption and public goods, .
The relative price of corruption can change through two mechanisms. One mechanism is that municipalities change this price due to the threat of being audited and corruption detected, which we call the deterrent effect. A different mechanism is that officials only change their behavior after they are audited and corruption is detected, which we call the auditing effect. This auditing effect could occur either because the corrupt officials are removed from office (or incapacitated, in the legal literature) or because new policies and procedures are implemented which make corruption more difficult. This distinction between these two hypotheses is inspired in Myers (1983). Among other things, Myers studies whether the degree of certainty of punishment deters both first-time criminal activity and subsequent crimes, which is called recidivism. He finds that both first time crime and recidivism go down as the certainty of punishment increases, suggesting that both deterrent and auditing effects are meaningful. In our context the deterrent effect should be declining over time, since the probability of detection is declining over time, as in Figure 2. We formalize these two possibilities as two hypotheses.
Hypothesis 1 (Deterrent Effect): The anti-corruption program deterred corruption in on all municipalities eligible for audits. More resources were available for public health goods in all municipalities at risk of an audit.
Hypothesis 2 (Auditing Effect): The anti-corruption program only affected municipalities once they are audited, such as by removing the corrupt officials. Only when a municipality is audited and any mismanagement is found are more resources available for public health goods in the next period.
The null hypothesis is that the anti-corruption program had no effect on municipality performance measures.
3.2. Data We use annual municipality data from different sources between 2000 and 2011. Data
is primarily extracted from a survey (DATASUS) conducted by the Brazilian Health Ministry. This survey provides information on health indicators and information about financial and management decentralization. The following four health indicators are used as dependent variables: infant mortality rate, rate of undernourished children, number of child care appointments per inhabitant and percentage of children up to age 1 who are vaccinated. Recall that municipalities started to be randomly selected for audit in 2003, when the CGU anti-corruption program started, and continued through 2011. Further details about the data sources and uses are provided in an Appendix A.1.
8
3.3. Econometric Method To test our assumptions we use sharp discontinuity regression design as main tool to identify the effect of the program on health indicators. We also use difference-in-differences models and robustness tests.
4. Results
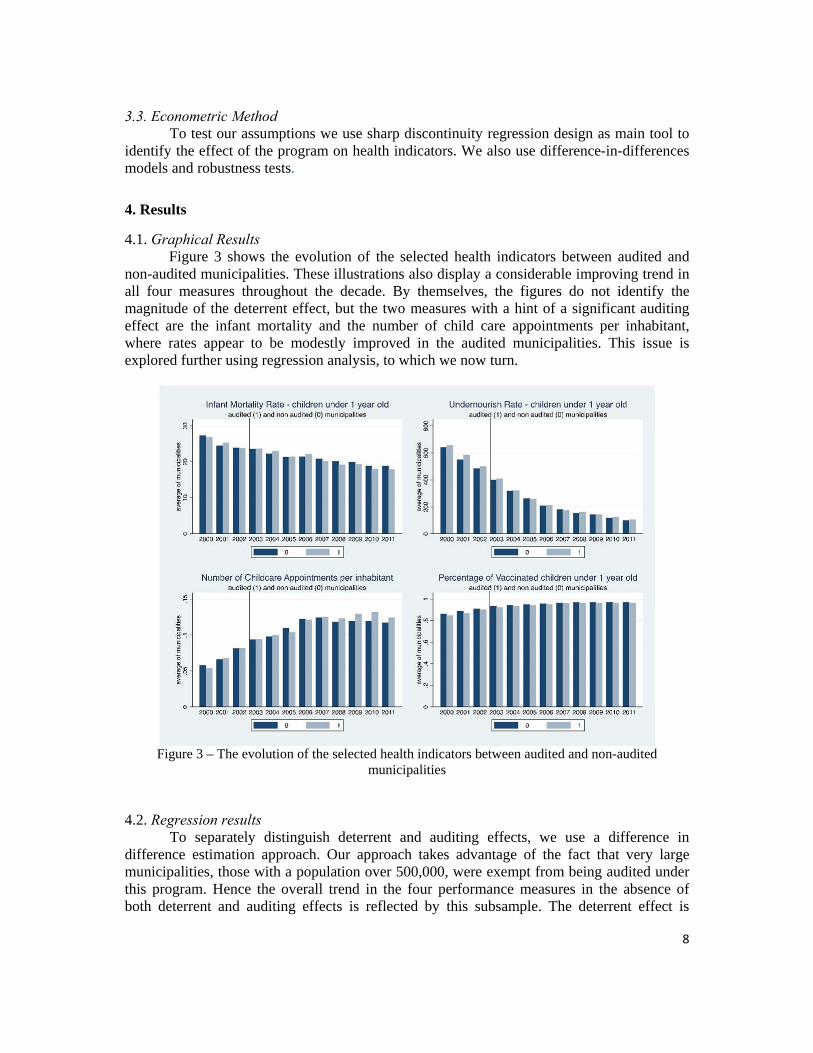
4.1. Graphical Results Figure 3 shows the evolution of the selected health indicators between audited and
non-audited municipalities. These illustrations also display a considerable improving trend in all four measures throughout the decade. By themselves, the figures do not identify the magnitude of the deterrent effect, but the two measures with a hint of a significant auditing effect are the infant mortality and the number of child care appointments per inhabitant, where rates appear to be modestly improved in the audited municipalities. This issue is explored further using regression analysis, to which we now turn.
Figure 3 – The evolution of the selected health indicators between audited and non-audited
municipalities
4.2. Regression results To separately distinguish deterrent and auditing effects, we use a difference in difference estimation approach. Our approach takes advantage of the fact that very large municipalities, those with a population over 500,000, were exempt from being audited under this program. Hence the overall trend in the four performance measures in the absence of both deterrent and auditing effects is reflected by this subsample. The deterrent effect is

9
identified by a change in the trend rate of performance by the municipalities eligible to be audited, while the auditing effect is identified by the change in performance for those municipalities who are actually audited. Control variables are included to help control for observable differences across municipalities, which is particularly relevant since our natural control group is larger and hence inherently different from the smaller municipalities eligible for the CGU program2. We focus here on three panel fixed effect models (4.1) to (4.3), which differ in whether they try to capture deterrent effects only, auditing effects only, or both effects.3
(4.1) (4.2)
(4.3) where yit is a health indicator as previously described;
it =1 if population 500,000 inhabitants, 0 otherwise, which reflects the eligible set of municipalities for CGU program after 2002; Ait =1 once a municipality has ever been audited (including the audit year), 0 otherwise; X is a matrix of control variables; α are municipal fixed effects; λ are yearly time fixed effects; e#it are three idiosyncratic error terms; and the other greek symbols are coefficients (scalars or arrays) to be estimated.
Tables 1 and 2 summarize the estimates from equations (4.1) to (4.3), respectively, for each of our four dependent variables. Although the different specifications capture the program effects - using just a dummy for eligibility, or for being audited, or both - the R2 for each specification remains almost the same in all models. These small changes in the R2 statistics suggest that our policy variables explain a very small proportion of the total variation across municipalities, but our large sample gives us the power to identify statistically significant effects for some outcomes nonetheless.
2 Almost all of the state capitals are big municipalities, for instance while state capitals are rare in the smaller municipalities. 3 Ferraz and Finan (2008) describe 450 thousand of inhabitants as being the cutoff for CGU inspection, but the actual cutoff is the municipalities with less than 500 thousand inhabitants as can checked in Portuguese at www.cgu.gov.br. According to these authors, no previous announcement about the CGU policy was released prior to the year of its implementation, and the selection for audits was truly random with replacement.

10
Table 1 - Fixed effect model results for infant mortality and rate of undernourished children
VARIABLES Infant mortality Rate of undernourished children age < 1
Deterrent only (5.1)
Auditing only (5.2)
Both effects (5.3)
Deterrent only (5.1)
Auditing only (5.2)
Both effects (5.3)
Eligible municipality
-0.395*** -0.389*** -0.026 -0.196
(0.030) (0.031) (0.018) (0.152)
Ever audited municipality
-0.027*** -0.027*** -0.026 -0.026
(0.009) (0.009) (0.018) (0.018)
Observations 48,174 48,174 48,174 48,033 48,033 48,033
R-squared 0.1207 0.1206 0.1209 0.4199 0.4202 0.4202
Number of municipalities
5,390 5,390 5,390 5,255 5,255 5,255
*** p<0.01, ** p<0.05, * p<0.1, Robust standard errors in parentheses Other control variables included are year dummies (2000 dummy is the reference), municipal population, GDP per capita, health expenditure per inhabitant, public school expenditure per inhabitant, the Family Health Program (PSF) coverage, number of beds for 10 thousand inhabitants, private health insurance, percentage of health expenditure coming from central government, and percentage of enrolled students at elementary and medium school older than the expected age for each grade.
Table 2 - Fixed effect model results for number of childcare and vaccinated children
VARIABLES Number of childcare appointment per
inhabitant Vaccinated children under 1 year old Deterrent only (5.1)
Auditing only (5.2)
Both effects (5.3)
Deterrent only (5.1)
Auditing only (5.2)
Both effects (5.3)
Eligible municipality
0.001 0.002 0.076*** 0.076***
(0.011) (0.011) (0.027) (0.027)
Ever audited municipality
-0.001 -0.001 0.000 0.000
(0.002) (0.002) (0.001) (0.001)
Observations 51,697 51,697 51,697 55,567 55,567 55,567
R-squared 0.1333 0.1334 0.1334 0.3300 0.3300 0.3300
Number of municipalities
5,275 5,275 5,275 5,307 5,307 5,307
*** p<0.01, ** p<0.05, * p<0.1, Robust standard errors in parentheses Other control variables included are year dummies (2000 dummy is the reference), municipal population, GDP per capita, health expenditure per inhabitant, public school expenditure per inhabitant, the Family Health Program (PSF) coverage, number of beds for 10 thousand inhabitants, private health insurance, percentage of health expenditure coming from central government, and percentage of enrolled students at elementary and medium school older than the expected age for each grade.

11
We find statistically significant effects of the CGU program for two of our four dependent variables. In our models of infant mortality rate, the estimated coefficient for both the audited effect and for deterrent effect are significant and negative values in all three specifications, suggesting that the auditing program lowered infant mortality via both mechanisms. For vaccinations, we find that the deterrent effect of the CGU program statistically significant and positive, while actually being audited had no significant effect. We fail to find any statistically significant effect on our other two health indicators, rates of undernourished children age <1 and rates of childhood appointments. A simple diff in diff specification treats all municipalities as if they are the same size, so that treatment effects are the same for any size municipality. Even though we included municipality and time fixed effects, there is still a potential for misleading results if there is any relationship between municipality size and the effectiveness of the CGU program on our performance measures. To explore this possibility, we now use a regression discontinuity (RD) design that allows us to better control for possible differences between our eligible and non-eligible municipalities for the CGU program, as detailed in the next section. We also explore other dimensions of treatment effects for this program by examining lag effects for the audited municipalities. In this case we use the traditional difference-in-differences model, applied only to potentially audited municipalities.
4.3 Regression Discontinuity Design Given the sharp cutoff for eligibility to the CGU audits based on municipal population of 500,000, it is informative to look at municipalities just below and just above that threshold. For detecting the deterrent effect of Hypothesis 1, we use sharp discontinuity design regression on the selected health indicator and we use municipal population equal to 500,000 inhabitants as a cut point. In this case the eligible municipalities, populated with less than 500,000 inhabitants, is the treated group, and the most populated municipalities, non-eligible for the CGU program, is the control group. For testing for the auditing effect of Hypothesis 2, we estimate a Difference-in-Differences (DD) model using the audited municipalities as the treated group and the non-audited but eligible municipalities as the control group. For this analysis, larger municipalities do not provide a useful comparison group since they are never audited. We also assess the significance of the observed results by conducting a policy placebo experiment, which randomly selects 1000 new municipality samples among eligible municipalities. Mimicking the design of the original/true program lottery, we estimate 1000 DD models for one of the health indicators, and use the empirical distribution of the estimated treatment effect to calculate statistical significance if there were no treatment effect. We then compare the observed estimate to this distribution to see how likely it would be under the null hypothesis of no treatment effect.
4.3.1. Testing the anti-corruption program’s deterrent effect Following Imbens and Lemieux (2008), we estimate a Sharp Regression Discontinuity (SRD) design model to assess if the announcement and implementation of the CGU program has a deterrent effect on the selected primary health indicators, Yit. As all the municipalities less than 500000 inhabitants are subject to audit, the municipal population is our assignment variable, Xit, and our cutoff point is this municipal population value. Taking the logarithm of this variable, the cutoff point becomes 13.12. We estimate the non-parametric local linear and local polynomial equation (5.4) for each health indicator after 2003 when the CGU program was announced and implemented.

12
According to the regression discontinuity design method, we use only data near the cutoff or give more weight for the observations close to it as a way to compare the program effects only in similar unities. In the SRD design the cutoff point defines the treated and the non-treated groups. Thus we overcome the identification problem, pointed out by the preliminary estimates, using the triangular kernel in SRD estimates. In the Sharp Regression Design (SRD) the discontinuity in the conditional expectation of the outcome on the covariates, including the assignment variable, means an average causal effect of the treatment. Thus the effect can be described by equation (5.4), where c is the cutoff point, Yit is the outcome, the health indicators, Xit is the forcing variable (or treatment-determining), the municipal population in this case.
lim ↓ | lim ↑ | (5.4)
4.3.2. Regression Discontinuity Design Results Figure 4 shows the population histogram and its adjusted kernel density for all years and municipalities as well the CGU program’s cutoff point. The municipal population variable is continuous at the cutoff point for investigation and the majority of municipalities are eligible to be audited; as we already mentioned, 99% of the smallest Brazilian municipalities in population are eligible to be audited by the CGU program
Figure 4 – Municipal Population histogram and kernel density
Figures 5-8 show the scatterplots of the health indicators for the years 2003-2011 against the municipal population and its cutoff region. We also include a polynomial fourth grade adjusted curve for each side of the cutoff. These plots signal that meaningful nonlinearities are present in our performance measures, and hence simple diff in diff estimators that compare group means will be biased. The polynomial curves suggest very modest discontinuities in the childcare appointments and the vaccinated children indicators, but do not provide measures of statistical significance. In the left side of each Figure, green dots are the health indicator values of non-audited municipalities and black dots represent these values for the audited municipalities.

13
Figure 5 – Infant Mortality Rate and municipal population at the cutoff Scatterplot adjusted by a different polynomial curve in each side of the cutoff (50 thousand observations)
Figure 6 – Undernourished children and municipal population at cutoff Scatterplot adjusted by a different polynomial curve in each side of the cutoff (50 thousand observations)
Figure 7 – Childcare appointments and municipal population at cutoff
Population6 8 10 12 14 16 18
Infa
nt M
orta
lity
Ra
te
0
1
2
3
4
5
6
7
Infant Mortality Rate
Population12 12.2 12.4 12.6 12.8 13 13.2 13.4 13.6 13.8 14
Infa
nt M
orta
lity
Ra
te
0
0.5
1
1.5
2
2.5
3
3.5
Population6 7 8 9 10 11 12 13 14 15 16 17
Und
ern
ouris
hed
Chi
ldre
n R
ate
0
2
4
6
8
10
12
Undernourished Children Rate
Population12 12.2 12.4 12.6 12.8 13 13.2 13.4 13.6 13.8 14
Und
ern
ouris
hed
Chi
ldre
n R
ate
0
1
2
3
4
5
6
7
Population6 7 8 9 10 11 12 13 14 15 16 17C
hild
care
app
oint
me
nt p
er in
hab
itant
0
0.2
0.4
0.6
0.8
1
Number of childcare appointment per inhabitant
12 12.2 12.4 12.6 12.8 13 13.2 13.4 13.6 13.8 14
Chi
ldca
re a
ppo
intm
ent
per
inha
bita
nt
0
0.1
0.2
0.3
0.4
0.5
0.6
0.7
0.8
0.9

14
Scatterplot adjusted by a different polynomial curve in each side of the cutoff (50 thousand observations)
Figure 8 – Vaccinated children under 1 year old and municipal population at cutoff Scatterplot adjusted by a different polynomial curve in each side of the cutoff (50 thousand
observations)
See the Appendix A.2 for an alternative scatterplot of the selected health indicator’s means on population.
Table 3 shows the non-parametric discontinuous estimates of the deterrent effect using the triangular kernel for bandwidths of 50%, 100% and 200%, respectively. We find statistically significant results for number of childcare appointments using bandwidth of 50% and 100%. As others have sometimes found, we find that the point estimates are moderately sensitive to bandwidth. Appendix A.3 show the auditing effect’s estimations and other model specifications.
Table 3 – Non-parametric triangular kernel estimates – Bandwidth of 50%/100%/200%
VARIABLES Infant Mortality Rate
Rate of Undernourished children, age
<1
Number of Child Care Appointments per
Inhabitant
Percentage of Vaccinated
children, age <1
lwald50 -0.0676 -0.0341 0.0377** -0.0134 (0.0491) (0.165) (0.0164) (0.00896) Lwald100 -0.0238 0.0821 0.0341*** -0.00717 (0.0343) (0.117) (0.0117) (0.00628) lwald200 0.00185 0.0356 0.0126 -0.00849 (0.0257) (0.0955) (0.00852) (0.00517)
Observations 40,096 40,297 45,966 47,851 *** p<0.01, ** p<0.05, * p<0.1; Standard errors in parentheses
Population6 7 8 9 10 11 12 13 14 15 16 17
Vac
cin
ated
Ch
ildre
n u
nder
1 y
ear
0
0.2
0.4
0.6
0.8
1
1.2
Vaccinated Children under 1 year
Population12 12.2 12.4 12.6 12.8 13 13.2 13.4 13.6 13.8 14
Vac
cina
ted
Chi
ldre
n un
der
1 ye
ar
0
0.1
0.2
0.3
0.4
0.5
0.6
0.7
0.8
0.9
1

15
6. Concluding Remarks Brazil’s anti-corruption program, which used strict randomization and emphasized
speedy publication of findings, provides a unique opportunity to study the effect of a well designed anticorruption program on four important health indicators. Under the assumption that less corruption means more time and money dedicated to health services, we suppose this policy, if effective, must improve the health indicators in some municipalities.
Our study complements the work Lichand et al. (2014), which found that levels of corruption identified through random audits were related to poor health outcomes. We investigate here instead the question of whether audits intended to detect corruption have measurable health benefits. We use the random nature of the auditing program to distinguish deterrent effects from auditing effects when actually audited. We find weak evidence of the effect of audits on our outcomes, with statistically significant but modest evidence of audit on infant mortality rate and evidence of a small on the number of childcare appointments.
The results for auditing effect are robust, even if the effect is small, suggesting a modest but effective contribution of the program to the public health sector. On the one hand, our placebo test for robustness, conducted by taking random draws that mimic the true CGU lottery and conducting difference-in-differences analysis, fails to find a similar effect suggesting that our results are not due to nonlinearities or other uncontrolled for correlations.
On the other hand, the regression discontinuity results for deterrent effect are small and robust only for municipalities near the cutoff. This makes us cautious about interpreting a causal relationship for our modestly significant results. Moreover, we find that the beneficial effects of an audit are short-lived, with no evidence that benefits continue after the year of the random audit.
Since the Brazil’s health system decentralization is typical of the developing countries, where there is a gap between financial and management decentralization, knowledge about the value of attempts to curb corruption and improve the quality of health outputs are potentially valuable to other countries. Because the CGU program is very expensive, our poor results for the health sector indicate that other approaches will be necessary to improve its cost-benefit results. Note that our study only examines health outcomes; other studies suggest that the program may have been effective at changing reelection results and improving education outcomes.
Our results do not help us understand whether the poor performance improving health outcomes comes from problems with the implementation of the anticorruption program or from other institutional problems. One example of an implementation problem is the way the reports of corruption are disclosed. Dissemination of results is done via a 200-page document that describes the irregularities found in the audited municipality, according to the type of health program, without a common methodological pattern. It could be that more standardized and simpler reporting methods would have a greater impact.
Institutional issues may also underlie the poor performance of the anti-corruption auditing program. Others have pointed to the failure of the Brazilian justice system to punish crimes efficiently because of its very slow pace. The instability of Brazilian public institutions is another challenge. Improving the justice system and public administration will take more effort than financial audits.

16
7. References
Acemoglu, D., & Verdier, T. (2000). The Choice between Market Failures and Corruption. American Economic Review, 90, n.1, 194-211.
Azfar, O., & Nelson Jr., W. R. (2007). Transparency, wages and separation of powers: an experimental analysis of corruption. Public Choice, 130, 471-493.
Banerjee, A., Mullainathan, S.; & Hanna, R. (2012). Corruption. National Bureau of Economic Research, Working Paper Series, n.17968.
Bertrand, M., Dufle, E., & Mullainathan, S. (2004). How much should we trust difference-in-differences estimates? Quarterly Journal of Economics, 119, 249-275.
Brennan, G., & Buchanan, J. (1980). The power to tax. New York: Cambridge University Press.
Careaga, M., & Weingast, B. (2000). The fiscal pact with the devil: A positive approach to fiscal federalism, revenue sharing, and good governance. Working Paper. Hoover Institution, Stanford University. Available at http://idei.fr/doc/conf/eco/weingast.pdf
Careaga, M., & Weingast, B. (2003). The fiscal federalism, good governance and economic growth in Mexico. In Search of Prosperity: Analytic Narratives on Economic Growth, Dani Rodrik, 80-119. Princeton: Princeton University Press.
Dreher, A., & Schneider, F. (2010). Corruption and the shadow economy: an empirical analysis. Public Choice, 144, n.1-2, 215-238
Goel, R. K., & Nelson, M. A. (2011). Government fragmentation versus fiscal decentralization and corruption. Public Choice, 148, 471-490.
Ferraz, C., & Finan, F. (2008). Exposing Corrupt Politicians: The Effects of Brazil’s Publicly Released Audits on Electoral Outcomes. The Quarterly Journal of Economics, 123, n2, 703-745.
Ferraz, C., Finan, F., & Moreira, D. B. (2012). Corrupting learning - Evidence from missing federal education funds in Brazil. Journal of Public Economics, 96, i9–10, 712–726.
Escaleras, M., Lin, S., & Register, C. (2010). Freedom of Information Acts public sector corruption. Public Choice, 145, 435-460.
Fan, C. S., Lin, C., & Treisman, D. (2009). Political decentralization and corruption: Evidence from around the world. Journal of Public Economics, 29, 14–34.
Fredriksson, P. G., & Vollebergh, H. R. J. (2009). Corruption, federalism, and policy formation in the OECD: the case of energy policy. Public Choice, 140, n.1-2. 205-221.
17
Imbens, G. W., & Wooldridge, J. M. (2009). Recent Developments in the Econometrics of Program Evaluation. Journal of Economic Literature, 47:1, 5–86.
Imbens, G., & Lemieux, T. (2008). The regression discontinuity design—Theory and applications. Journal of econometrics, 142(2), 611-614.
Lichand, G., Lopes, M.F.M., & Medeiros, M.C. (2014). Is corruption good for your health?
Working paper in preliminary version. Available at http://scholar.harvard.edu/files/glichand/files/is_corruption_bad_for_your_health.pdf
Moura, R. L., & and Barbosa Filho, F. H. (2014). A Queda da Informalidade no Brasil entre 2002 e 2012. In: Regis Bonelli; Fernando Veloso. (Org.). Panorama do Mercado de Trabalho no Brasil. 1ed. Ro de Janeiro: FGV, 125-148.
Myers Jr., S. L. (1983). Estimating the Economic Model of Crime: Employment Versus Punishment Effects. The Quarterly Journal of Economics, 98 (1), 157-166.
Oates, W.E. (1972). Fiscal Federalism. Harcourt, Brace and Jovanovich.
Oates, W.E. (1999). An Essay on Fiscal Federalism. Journal of Economic Literature, 37, 1120-49.
Peixoto, S. D. G., Rocha, F. F., Nishijima, M., & Postali, F. A. S. (2012). Decentralization and corruption: evidence from primary healthcare programs. Applied Economics Letters, 9, 1885/18-1888.
Persson, T., & Tabellini, G. (2000). Constitutional determinants of government spending. Mimeo. Bocconi University.
Rocha, R. C. B. da, & Soares, R. R. (2010). Evaluating the impact of community-based health interventions: Evidence from Brazil´s Family Health Program, Health Economics, 19 (1), 126-158.
Rodden, J. (2000). The dilemma of fiscal federalism: hard and soft budget constraints around the world. Mimeo. MIT.

18
Appendix A.1
Table A-1 – Variables description and sources
Variable description and Source Obs Mean Std. Dev Min Max
Health indicators Logarithm of infant mortality rate under 1 year per 10,000 children (DATASUS)
50794 2.907 0.595 0.243 6.908
Logarithm of undernourished children under 1 year per 10,000 children (DATASUS)
53741 5.106 1.189 0.137 9.210
Logarithm of the number of appointment of children health care per inhabitant (DATASUS)
57531 0.100 0.106 2.0E-06 0.989
Rate of vaccinated children under 1 year (DATASUS)
62151 0.939 0.089 0.013 1.000
Policy variables
Dummy for year of audit (CGU) 67104 0.028 0.164 0.000 1.000
Dummy =1 for each year after an audit (CGU) 67104 0.154 0.361 0.000 1.000
Forcing variable
Logarithm of population - DATASUS 66695 9.376 1.146 6.534 16.223
Control variables Logarithm of GDP (in thousand of Reais) per capita (prices of 2000) – IBGE
66695 1.628 0.596 0.495 5.297
Logarithm of municipal health expenditure per inhabitant (prices of 2000) – DATASUS
65796 4.834 0.536 0.087 7.109
Logarithm of municipal health expenditure per inhabitant (prices of 2000) financed by own municipalities resources (DATASUS)
65793 4.742 0.836 0.000 7.679
Logarithm of school public expenditure per inhabitant (prices of 2000) (IPEA)
63039 5.230 0.481 0.017 10.80
Percentage of population covered by PSF/ESF (DATASUS)
65432 65.30 40.052 0.000 100.0
Logarithm of number of bed per 10 thousand inhabitant (DATASUS)
66736 2.109 1.569 0.000 6.282
Percentage of population covered by health insurance (ANS)
64758 0.061 0.116 4.0E-05 8.595
Percentage of central transfers (from SUS) out of total health expenditure of municipality (DATASUS)
66756 37.99 18.451 0.000 100.0
Percentage of enrolled students at elementary school older than the expected age for each grade (INEP)
66531 30.18 17.488 0.000 88.80
Percentage of enrolled students at high school order than the expected age for each grade (INEP)
66432 43.27 23.408 0.000 100.0
ANS – National Regulatory Agency for Private Health Insurance and Plans. www.ans.gov.br CGU – Corregedoria Geral da União’s (CGU) anti-corruption program. http://www.cgu.gov.br DATASUS – Health Informatics Department of the Brazilian Ministry of Health. www.datasus.gov.br IBGE – Brazilian Institute of Geography and Statistics. www.ibge.gov.br INEP – National Institute for Educational Studies and Research "Anísio Teixeira". www.inep.gov.br IPEA – Brazilian Institute of Applied Economic Research. www.ipeadata.gov.br Appendix A.2.

19
Figure 1A uses the data in Figures 5 through nine, but collapses the data by taking averages for clusters of 250 municipality-years observations across the size spectrum to create a scatterplot of conditional means of the health indicators for different values of the municipal population on which the regression discontinuity is defined. Each dot in the figure plots the mean for 250 different municipality-years. We also plot a local linear smooth line to the average values of the health indicators, which was calculated by optimization criteria using a quadratic fit based on least square method. Separate lines are fit to the left and right sides of the cutoff. The very different pattern of the health indicators across the number of inhabitants suggests that results are sensitive to the assumed functional form. Different types of adjustment lines can lead to different results and conclusions. It seems that there is distinct heteroskedasticity for larger size municipalities, which is difficult to explain.
Figure 1A – Interpolation of the mean of health indicator values conditional on population split at cutoff (all municipalities from 2003 to 2011, 50 thousand observations). Scatterplot adjusted by a polynomial curve in both sides of the cutoff (50 thousand observations)
Appendix A.3. Further model specifications
Discontinuity Regression Design
Robust estimates from SRD using a local linear model and optimized bandwidth are shown in Table A-2, and for methodological interest contrasted with conventional and bias-corrected model results. In this case we find statistically significant (positive) coefficients for the number of childcare appointments health indicators. To see how sensitive the results are to

20
more flexible models on both sides of the threshold, Table A-3 repeats the analysis using a second degree polynomial on both sides. Here we again find number of childcare appointments per capita are statistically significant, but in addition the infant mortality rate is negative and statistically significant in one specification and percentage of infants vaccinated is also negative and weakly (p <0.1) statistically significant.
In sum, using a regression discontinuity design that allows the deterrent effect to vary more flexibly with municipality size, we find some evidence that the eligible municipalities had slightly more childcare appointments per inhabitant.
Table A-2 – Robust non-parametric local linear regression with triangular kernel estimates
VARIABLES Infant Mortality Rate
Rate of Undernourished children, age <1
Number of Child Care Appointments per Inhabitant
Percentage of Vaccinated children, age <1
Conventional -0.0487 0.147 0.0414*** -0.0111* (0.0402) (0.151) (0.0156) (0.00650)
Bias-corrected -0.0776* 0.0697 0.0534*** -0.00985 (0.0402) (0.151) (0.0156) (0.00650)
Robust -0.0776 0.0697 0.0534*** -0.00985 (0.0646) (0.190) (0.0202) (0.00783)
Observations 5,270 3,451 2,824 2,167 *** p<0.01, ** p<0.05, * p<0.1; Standard errors in parentheses
Table A-3 – Robust non-parametric local polynomial regression with triangular kernel estimates
VARIABLES Infant Mortality Rate
Rate of Undernourished children, age <1
Number of Child Care Appointments per Inhabitant
Percentage of Vaccinated children, age <1
Conventional -0.0021 0.0798 0.0140 -0.0011 (0.0276) (0.127) (0.0098) (0.0046)
Bias-corrected -0.0613** 0.0998 0.0503*** -0.0180*** (0.0276) (0.127) (0.0098) (0.0046)
Robust -0.0613 0.0998 0.0503** -0.0180* (0.0453) (0.163) (0.0224) (0.0101)
Observations 4,369 1,463 4,038 2,826 *** p<0.01, ** p<0.05, * p<0.1; Standard errors in parentheses
Difference-in-Differences
To assess whether the audit affects the health only when municipalities are actually audited, the auditing effect of Hypothesis 2, we use an expanded version of the difference-in-

21
differences (DD) model equation (3.3). Instead of using a single dummy for whether a municipality if ever audited, we utilize the audited municipalities as the treated and the non-audited eligible or not eligible as non-treated groups. In addition we split the non-audited municipalities into two control groups, the ones eligible for the program (with less than 500,000 inhabitants, but not audited) and the ones not eligible (with more than 500,000 inhabitants).
We estimate DD model described by equation (A-1). We are concerned about different time interventions for each municipality and more than one control group. Since we have two control groups and 9 time periods of intervention - every year around 200 municipalities are randomly selected to be audited - we use DD estimates for multiple periods and control groups as proposed by Imbens and Wooldridge (2009). We also include municipal fixed effect to control for the unobserved municipal characteristics.
(A-1) where yigt is the health indicator value of municipality i, group g, and in year t, αi is the municipal fixed effect,
� is a full set of time effects or year dummies, is a full set of group effects or dummies for the three groups; the audited municipalities, the
eligible but not audited, and the non eligible municipalities (the biggest ones). pgt is group/time period covariates, (these are the policy variables), a dummy program variable with value 1 after the municipality was audited, and 0 otherwise, xit = matrix of control variables, observed characteristics of the municipalities,
is time and group unobserved effect,
is the individual-specific error.
Bertrand, Dufle and Mullainathan (2004) discuss some problems associated with evaluations of policies and programs on economic variables. According to these authors, econometricians tend to accept the effects of the policies more than they should, based on the difference-in-differences model’s estimates because of endogenous variables. Therefore, we conduct a sensitivity analysis for the DD models’ statistically significant estimates of the program on the health indicators. Because we have a quasi-experimental exogenous variable, we only need check one dimension of the policy variable for robustness. At the same time, this analysis also can be seen as checking whether the CGU program is truly random.
We estimate equation (A-1) 1000 times using the 1000 simulated random placebo program variables instead of the original CGU drawn program variable, pit, for the statistically significant models. The idea is that if we could find seemingly significant effects even when the program has no real effect on health indicators, then a lottery of new samples of municipalities should result in more null rejections for the placebo program than our significance statistics level, 5%.
Table A-4 shows DD model estimates for the health indicators according to equation (A-1). Results suggest that the program has a auditing effect only on the infant mortality rate, and we find no significant CGU program effect on the remaining health indicators.
Table A-4 – DD models (A-1) VARIABLES Infant
MortalityRate of
undernourisheNumber of childcare
Vaccinated children under

22
d children under 1 year
old
appointment per inhabitant
1 year old
pg -0.024** -0.014 -0.001 -0.00002 (0.012) (0.020) (0.002) (0.002)
Observations 47,767 47,638 51,301 55,181
R-squared 0.045 0.473 0.116 0.332 Number of municipalities 5,360 5,225 5,245 5,277
*** p<0.01, ** p<0.05, * p<0.1, Robust standard errors in parentheses. Year dummies (2000 dummy is the reference) and control variables included (municipal population, GDP per capita, health expenditure per inhabitant, public school expenditure per inhabitant, the Family Health Program (PSF) coverage, number of beds for 10 thousand inhabitants, private health insurance, percentage of health expenditure coming from central government, and percentage of enrolled students at elementary and medium school older than the expected age for each grade).
As we find a 5% significant effect of the CGU program on the infant mortality rate, we conduct a sensibility analysis for this health indicator. We randomly draw 1000 samples of “selected municipality” that mimic the real CGU lottery and estimate difference-in-differences regressions replicating equation (A-1) 1000 times. We replicate it replacing the policy variable, pit, by the program placebo that was randomly chosen. We also replace the treated group, and the non-treated but eligible group, according to each random draw conducted. This sensitivity analysis (results not shown here) suggests no effects under the “placebo policies”. By using placebo policy on the infant mortality rate, we got a normal distribution of pit’s coefficient with mean zero. This result is the expected one for placebo policies, and strengthens the positive effect of the CGU program audit on the infant mortality rate. To evaluate the duration of the auditing effect on the infant mortality rate through the time we estimate equation A-1 replacing the policy variable, ptg, with dummies for different years of elapsed time since the year of the audit. The first columns assumes the audit only affects outcomes in the year of intervention, the second only outcomes in the one year after the intervention, and so on. The results show significant effects only at the year of the auditing, Table A-5. Thus, the effect of auditing on infant mortality rate is effective at very short run, disappearing after only one year.
Table A-5 – DD models – Effects
year of auditing 1 year after 2 years after 3 years after 4 years after 5 years after
VARIABLES Infant
mortality rate Infant
mortality rateInfant
mortality rateInfant
mortality rateInfant
mortality rate Infant
mortality rate
Modified ptg -0.0337** -4.56e-05 -0.00599 0.0162 0.00603 -0.0140
(0.0154) (0.0155) (0.0155) (0.0170) (0.0174) (0.0191)
Observations 48,217 48,217 48,217 48,217 48,217 48,217
R-squared 0.046 0.046 0.046 0.046 0.046 0.046

23
Number of coun_code 5,391 5,391 5,391 5,391 5,391 5,391 *** p<0.01, ** p<0.05, * p<0.1, Robust standard errors in parentheses. Year dummies (2000 dummy is the reference) and control variables included (municipal population, GDP per capita, health expenditure per inhabitant, public school expenditure per inhabitant, the Family Health Program (PSF) coverage, number of beds for 10 thousand inhabitants, private health insurance, percentage of health expenditure coming from central government, and percentage of enrolled students at elementary and medium school older than the expected age for each grade).
Related Documents