IMPACT OF A SCHOOL IMPROVEMENT PROJECT IN SCIENCE 1 1 Evaluating the Impact of a School Improvement Program in Student Science Learning: The Case of “Bicentennial Schools” Melina Furman School of Education, Universidad de San Andrés, Argentina. María Eugenia Podestá School of Education, Universidad de San Andrés, Argentina. Paper presented at the NARST 2014 Annual International Conference in Pittsburgh, Pennsylvania, USA. March 30- April 2, 2014. Correspondence may be addressed to Melina Furman, Escuela de Educación, Universidad de San Andrés. Vito Dumas 284, Victoria, Buenos Aires, Argentina, or to [email protected]

Welcome message from author
This document is posted to help you gain knowledge. Please leave a comment to let me know what you think about it! Share it to your friends and learn new things together.
Transcript
IMPACT OF A SCHOOL IMPROVEMENT PROJECT IN SCIENCE 1
1
Evaluating the Impact of a School Improvement Program in Student Science Learning:
The Case of “Bicentennial Schools”
Melina Furman
School of Education, Universidad de San Andrés, Argentina.
María Eugenia Podestá
School of Education, Universidad de San Andrés, Argentina.
Paper presented at the NARST 2014 Annual International Conference in Pittsburgh,
Pennsylvania, USA. March 30- April 2, 2014.
Correspondence may be addressed to Melina Furman, Escuela de Educación, Universidad
de San Andrés. Vito Dumas 284, Victoria, Buenos Aires, Argentina, or to

IMPACT OF A SCHOOL IMPROVEMENT PROJECT IN SCIENCE 2
2
Abstract
Over the last decades, Latin American students have performed poorly in Science both in
national and international tests. PISA and other international examinations have shown, as well,
the profound inequities present in the region´s school systems. This scenario has led to different
efforts in school improvement with the aim of fostering student learning in Science, most of
which have not been properly evaluated or accompanied by research efforts. In this study, we
analyze the case of Bicentennial Schools, a 4-year school improvement program involving 151
elementary schools which attend vulnerable populations of Argentina. We look at the results of
the first 58 elementary schools that completed the program. In doing so, we analyze 4th
and 6th
grade student Science test results, both at the beginning and at the end of the intervention, as well
as teachers’ perceptions of the impact of the program on student learning. Our findings show a
significant level of positive change in student Science learning in all schools participating in the
program, and also an important room for improvement. We also observe a large variation of
impact at the school level, which opens the door for future analysis. In all, our findings point
towards the importance of evaluating educational efforts in Latin America in order to build a
solid foundation for school reform.
Keywords: school improvement, science education, professional development, science learning
IMPACT OF A SCHOOL IMPROVEMENT PROJECT IN SCIENCE 3
3
Evaluating the Impact of a School Improvement Program in Student Science Learning:
The Case of “Bicentennial Schools”
Introduction: Science Education in Latin America
For more than a decade, Latin American students have performed poorly in Science.
Consistently, international and national assessments have shown alarming results regarding
students´ levels of conceptual knowledge and scientific skills. This scenario has brought a call of
attention to educators, policy makers and society as a whole. As in many parts of the world, in
Latin America Science education has been declared a regional priority, acknowledging its key
importance in the formation of creative, informed and responsible citizens.
Last PISA (Program for International Student Assessment) results, for instance, showed
that all Latin American countries were positioned in the lowest places of the world ranking in
Science. As a whole, most secondary school students in the region performed in level 1 or below
in scientific competency, way below the minimum level of basic scientific literacy (OECD,
2013). In countries such as Argentina, Brazil and Colombia, more than half the students could
not recognize the dependent variable within an experiment, distinguish between a model and the
phenomenon being modeled, or identify key words to search for information for a certain
investigation.
At the elementary school level, the results of international exams are consistent with this
worrying picture. SERCE (Second Regional Comparative and Explanatory Study), a regional
exam applied by UNESCO to 3rd and 6th grade students from Latin America and the Caribbean,
showed that only 11,4% of 6th grade students were able to explain everyday situations based on

IMPACT OF A SCHOOL IMPROVEMENT PROJECT IN SCIENCE 4
4
scientific evidence, utilize descriptive models to interpret natural world phenomena, or reach
conclusions based on data (UNESCO, 2009).
In addition to generalized low levels in student´s performance, inequity is another major
problem in Latin American educational systems. National and international exams have shown
significant gaps in Science achievement between children from affluent schools and students
attending disadvantaged-sector establishments. For instance, PISA and SERCE results have
shown that socioeconomic status of students is an important determinant of their scores (Duarte,
Bos & Moreno, 2009; OECD, 2013).
Particularly, in high poverty school contexts, Science teaching is mostly based on rote
memory development and superficial knowledge acquisition, as a recent study developed in
several Latin American countries has shown (Valverde & Näslund-Hadley, 2010). Providing a
clear example of what Haberman (1995) has called “pedagogy of poverty”, this study showed
that teachers employed a series of repetitive and undemanding activities and provided little or no
feedback to students. Teachers´ “deficit- model” of student learning (Calabrese Barton, 2003)
became evident when they attributed low student performance on contextual factors (such as
family) rather than on their teaching practices.
The number of children affected by this problem is considerable, given the fact that in
2011, 29.4% of the population in Latin America was estimated to be living below the poverty
line (ECLAC, 2012). Moreover, a solid foundation in Science can reduce the disadvantages
children in Latin America still experience in their education when compared to other world
regions and can open opportunities in academic life, career, and employment. Therefore, the

IMPACT OF A SCHOOL IMPROVEMENT PROJECT IN SCIENCE 5
5
existing scenario reveals just how imperative the need to improve Science education in
disadvantaged-sector schools has become.
In response to this concern, several school improvement programs and professional
teacher development efforts in Science have recently been introduced in areas of social and
economic vulnerability throughout Latin America (see for instance Gvirtz & Oria, 2010;
Näslund-Hadley, Cabrol, & Ibarraran, 2009; Valverde, Valeiron, Domínguez, & González,
2007). However, few of these programs have been properly evaluated or accompanied by
research efforts, necessary for policy makers and program developers to understand which
educational practices work best and why. Relevant questions that need to be answered by further
research studies are, for instance: what amount of change in student learning can be expected
after a certain intervention time? What factors influence the impact of a school intervention
among different schools? What are teacher educator practices that work best in helping teachers
to support all children in achieving their full learning potential?
Within this regional context, in this study we analyze the case of Escuelas del
Bicentenario (Bicentennial Schools, named after the Bicentennial of the country´s
independence), a 4-year school improvement program targeted to 151 schools attending
populations in poverty located in 6 different states of Argentina (see Program Description for
more details). The program´s goal is to improve student learning in different subject matter areas,
including Science, as well as to advance teachers´ instructional practices by engaging them in
inquiry-based teaching methods and critical reflection of their work.
Being part of a larger study, here we looked at the impact of the program on student
learning of Science, examining the results of the first 58 schools that completed the program
IMPACT OF A SCHOOL IMPROVEMENT PROJECT IN SCIENCE 6
6
between the years 2007 and 2010. For that purpose, we analyzed the results of Science tests
administered to children both at the beginning and at the end of the 4-year intervention (pre- and
post-tests) and looked at teachers´ perceptions of student gains in order to build a richer picture
of the impact of the program on student achievement.
Research Questions
In order to characterize the impact of the Bicentennial Schools program in student
Science learning we addressed the following research questions:
What was the level of students´ Science knowledge and skills before the program
started?
What was the degree of change in students´ Science knowledge and skills at the end of
the program?
What student gains did teachers identify as a result of their work within the program?
What was the variation observed in the impact of the program among participant
schools?
Program Description
Bicentennial Schools (http://www.ebicentenario.org.ar) is a program jointly developed by
IIEP-UNESCO and San Andres University in Argentina to improve quality and equity of
education in public elementary schools that attend underprivileged student populations. It also
seeks to construct a body of evidence on good practices for school improvement and teacher
education, that may ultimately contribute to further thedevelopment of educational policies at the
IMPACT OF A SCHOOL IMPROVEMENT PROJECT IN SCIENCE 7
7
state level (Gvirtz & Oria, 2010). The program receives funding from both public and private
sectors, including local provincial Departments of Education, local non-profit organizations and
private companies.
Launched in 2007, Bicentennial Schools has currently worked with 6 Argentine provinces
at 151 elementary schools, involving 1800 teachers and about 60.000 children attending 1st
through 6th grade.
Participating schools are selected by local education authorities based on poor national
examination test results and high education vulnerability indexes. The latter are established
taking into account local variables, including percentage of population unable to graduate
elementary school, unemployment levels and inadequate housing conditions, among others.
Participation in the program is mandatory for selected schools.
Program interventions at each school last on average 4 years and focus on three different
academic subjects: Literacy, Mathematics and Science. Teacher educators specialized in each
subject area work with teachers for 1 school year. Thus, the program is designed so that, at the
end of the intervention, all school teachers receive 1 year of training during the three academic
areas. In addition, over the 4 years school principals get professional development on School
Management and Leadership.
The intervention is based on a “cascade” approach. A central coordination team based in
Buenos Aires (the capital city) initially designs the key educational guidelines, plans teacher
education workshops and develops educational materials. Afterwards, different members of the
central team travel on a monthly basis to participant provinces to meet local teacher educators,
IMPACT OF A SCHOOL IMPROVEMENT PROJECT IN SCIENCE 8
8
who in turn work with schoolteachers. In doing so, we seek to generate a ripple effect spreading
from the central coordination team, all the way to the classroom.
At the beginning of the program, 4th
and 6th
grade students take a diagnostic test for each
academic subject in order to establish a starting point for the school in terms of student learning
(see “Student tests” for more details). In this study, we focus on the Science component of the
program and look at the results of the Science examinations and teachers surveys in order to
assess the program impact on student Science learning.
Theoretical framework and Program Goals
The goal of the Science component of the program is to introduce teachers to inquiry-
based teaching methods and support them in becoming reflective practitioners.
In Argentina, local curricula endorse inquiry-based Science pedagogies for all
educational levels. National curriculum guidelines state, for instance, that “teachers should
engage students in planning and conducting investigations on natural phenomena … analyze data
according to their initial questions and hypothesis” (CFCE, 2004). However, as mentioned
before, the reality of the classroom, especially in high poverty schools, is closer to having
students memorize science factoids and conduct low demanding and repetitive tasks than
engaging students in intellectual work (Valverde et al., 2010). The reasons behind this are
multiple and complex, with lack of inquiry-based approaches in preservice teacher education
being an important one. Thus, supporting teachers (many of which have been at the profession
for decades) in developing inquiry-based pedagogies is both a challenge and an imperative.
IMPACT OF A SCHOOL IMPROVEMENT PROJECT IN SCIENCE 9
9
Drawing upon the framework of science inquiry practices, teachers work with Science
educators at their own schools for 2 hours every fortnight. In addition, all teachers in the same
province meet on a monthly basis for an average of 4 hours to participate in Science education
seminars. Teachers participate in a variety of professional development practices, such as
analyzing student course work, planning lessons, discussing Science content and pedagogy,
reviewing reading material or designing assessment instruments, among many others. In order to
support teacher work towards inquiry-based pedagogies, the program specialists developed a set
of 18 inquiry-based Science curriculum units (3 for each grade). Curriculum units are designed
to cover all topics in each state curriculum (examples of those units are available in Spanish in
http://www.ebicentenario.org.ar/ebooks_CN.php).
It is important to note that, while the whole school was involved in a 4-year program,
each teacher had only 1 year of professional development in Science (as well as in Math and
Literacy).
Moreover, teacher educators may arrange classroom visits with teachers, or coteach to
model teaching strategies for lessons on particularly challenging topics. Other times, they may
demonstrate Science experiments similar to the ones teachers will conduct with students in the
classroom. Local teacher educators are generally former secondary school Science teachers, or
Science graduates with experience in elementary school teacher training. Although all local
teacher educator teams share a single goal, namely to orient teaching practices towards inquiry-
based methods applying the same professional development resources and practices, each teacher
educator is responsible for deciding which practice to apply and when, based on their personal
judgment and expertise.

IMPACT OF A SCHOOL IMPROVEMENT PROJECT IN SCIENCE 10
10
The program also draws on a situated perspective of teacher professional development
(Borko, 2004). Building on socioconstructivist paradigms, this view describes learning as a
process of enculturation into a new community of practice (Brown, Collins and Duguid, 1989)
and underlines the importance of engaging teachers in the analysis of authentic practice
(including their own) as a starting point to critically reflect on teaching and learning in general.
In Borko´s words, a situated perspective on teacher education is particularly important for
teachers working in disadvantaged schools, because it allows teachers to construct “proofs of
existence” of the kinds of teaching strategies they might undertake on their own in the future in
“non-ideal” schools (Borko, 2004). Along these lines, we have reported elsewhere how, as
teachers in the program started to see inquiry-based pedagogies succeed in their classrooms and
with their own students, they began to try out new teaching strategies (Furman & Podestá, 2013).
In Lee Shulman´s words (1986), proofs of existence are extremely important because they have
the potential to "evoke images of the possible ... not only to document the changes in practices
can be done, but provide at least one example detailed analysis of how an innovation is
organized, developed and pursued."
Methodology
We conducted a mix-methods study, combining a quantitative non-experimental pre-
test/post-test study, with qualitative teacher surveys. We looked at the changes in student´s
Science performance of the first 58 schools that completed the program intervention between the
years 2007 and 2012. With that goal, we analyzed the results of Science tests administered to 4th
and 6th
grade students at the beginning of the intervention (pre-tests) and at the end, after 4 years

IMPACT OF A SCHOOL IMPROVEMENT PROJECT IN SCIENCE 11
11
(post-tests). We also looked at teacher responses in open surveys administered at the end of the
program, regarding their perception of student gains in Science in order to build a richer picture
of the impact of the program on student learning from their teachers´ perspectives .
Student Tests
Tests were administered to 4th
grade and 6th
grade students attending participant schools
(a total of 4223 students). It is important to note that students who took the pre- and post-tests
were not the same children, as we assessed students who were in 4th
and 6th
at each moment of
the intervention. Within each school, all students attending one randomly selected section of 4th
grade and 1 section of 6th
grade were tested.
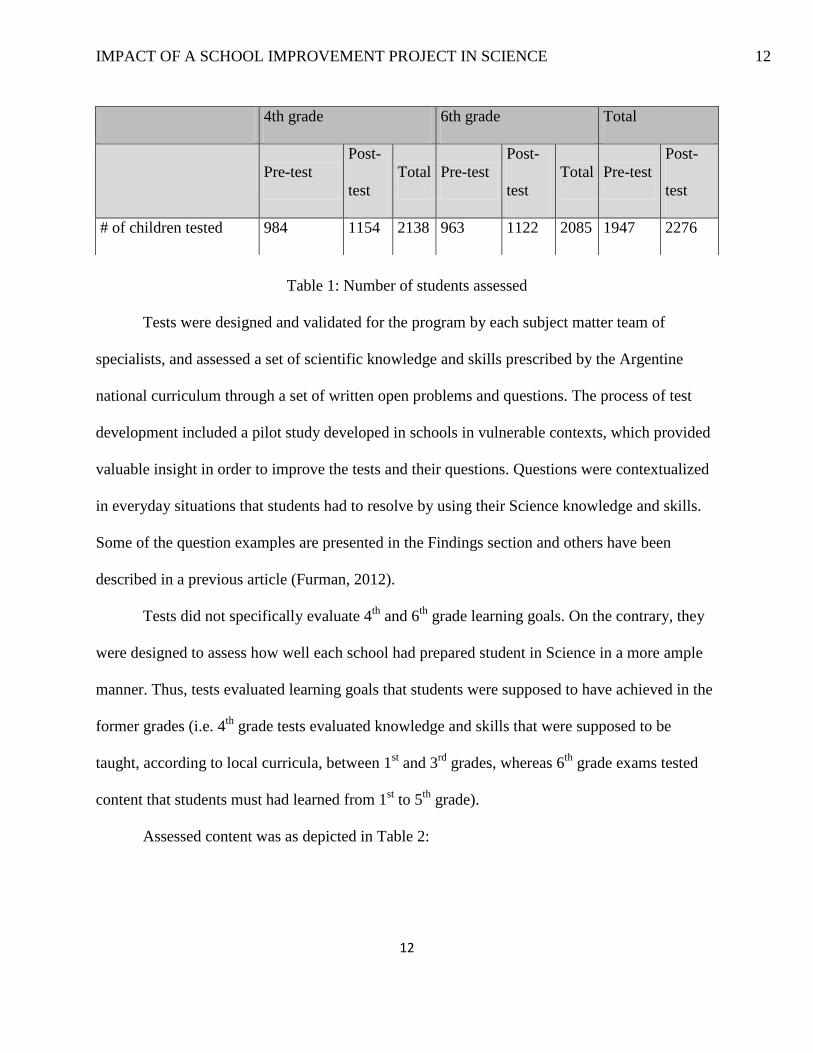
Table 1 shows the number of tests taken at each grade and each moment of the program
for the 58 participant schools.
IMPACT OF A SCHOOL IMPROVEMENT PROJECT IN SCIENCE 12
12
Table 1: Number of students assessed
Tests were designed and validated for the program by each subject matter team of
specialists, and assessed a set of scientific knowledge and skills prescribed by the Argentine
national curriculum through a set of written open problems and questions. The process of test
development included a pilot study developed in schools in vulnerable contexts, which provided
valuable insight in order to improve the tests and their questions. Questions were contextualized
in everyday situations that students had to resolve by using their Science knowledge and skills.
Some of the question examples are presented in the Findings section and others have been
described in a previous article (Furman, 2012).
Tests did not specifically evaluate 4th
and 6th
grade learning goals. On the contrary, they
were designed to assess how well each school had prepared student in Science in a more ample
manner. Thus, tests evaluated learning goals that students were supposed to have achieved in the
former grades (i.e. 4th
grade tests evaluated knowledge and skills that were supposed to be
taught, according to local curricula, between 1st and 3
rd grades, whereas 6
th grade exams tested
content that students must had learned from 1st to 5
th grade).
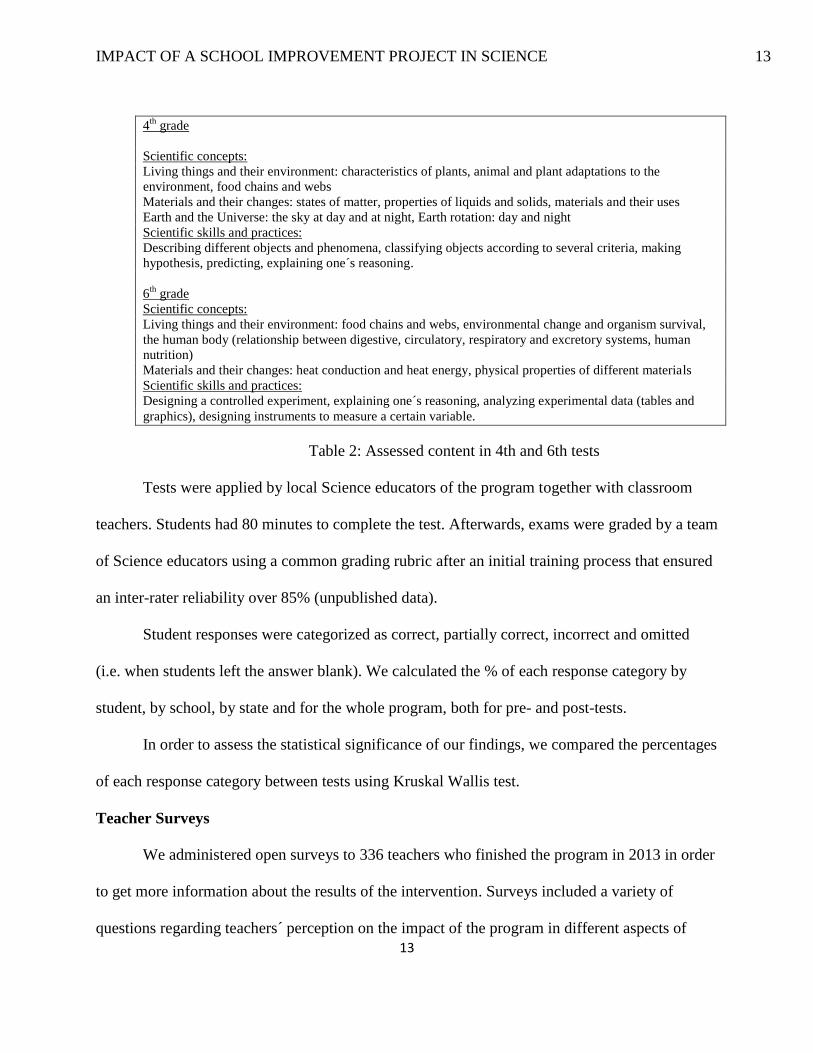
Assessed content was as depicted in Table 2:
4th grade 6th grade Total
Pre-test
Post-
test
Total Pre-test
Post-
test
Total Pre-test
Post-
test
# of children tested 984 1154 2138 963 1122 2085 1947 2276
IMPACT OF A SCHOOL IMPROVEMENT PROJECT IN SCIENCE 13
13
4th
grade
Scientific concepts:
Living things and their environment: characteristics of plants, animal and plant adaptations to the
environment, food chains and webs
Materials and their changes: states of matter, properties of liquids and solids, materials and their uses
Earth and the Universe: the sky at day and at night, Earth rotation: day and night
Scientific skills and practices:
Describing different objects and phenomena, classifying objects according to several criteria, making
hypothesis, predicting, explaining one´s reasoning.
6th
grade
Scientific concepts:
Living things and their environment: food chains and webs, environmental change and organism survival,
the human body (relationship between digestive, circulatory, respiratory and excretory systems, human
nutrition)
Materials and their changes: heat conduction and heat energy, physical properties of different materials
Scientific skills and practices:
Designing a controlled experiment, explaining one´s reasoning, analyzing experimental data (tables and
graphics), designing instruments to measure a certain variable.
Table 2: Assessed content in 4th and 6th tests
Tests were applied by local Science educators of the program together with classroom
teachers. Students had 80 minutes to complete the test. Afterwards, exams were graded by a team
of Science educators using a common grading rubric after an initial training process that ensured
an inter-rater reliability over 85% (unpublished data).
Student responses were categorized as correct, partially correct, incorrect and omitted
(i.e. when students left the answer blank). We calculated the % of each response category by
student, by school, by state and for the whole program, both for pre- and post-tests.
In order to assess the statistical significance of our findings, we compared the percentages
of each response category between tests using Kruskal Wallis test.
Teacher Surveys
We administered open surveys to 336 teachers who finished the program in 2013 in order
to get more information about the results of the intervention. Surveys included a variety of
questions regarding teachers´ perception on the impact of the program in different aspects of

IMPACT OF A SCHOOL IMPROVEMENT PROJECT IN SCIENCE 14
14
their work. Here, we analyzed teachers´ answers to two survey questions, which focused on
student learning.
Questions were as follows: a) How much do you consider the program has impacted
student learning? [O How much do you consider the program impacts student learning?] (from a
scale of 1 to 4), and b) If you responded positively, can you give examples of the advances in
student learning you noticed?
Answers to subquestion b) were categorized according to the type of gain teachers
identified (e.g. acquisition of new scientific skills, increase in student motivation, etc.).
Findings
General Impact of the Program on Student Learning
We found that the program had a significant impact on student Science learning, as
shown by test results. In 4th
grade, the mean of student´s correct answers increased from an
initial 37,3% (±20,1%) to 56,7% (±23,1%) (p<0.01). In 6th
grade, correct answers increased from
25,2% (±18,9%) to 42,3% (±20,1%) (p<0.01). Figures 1 and 2 show student results for both
tests.

IMPACT OF A SCHOOL IMPROVEMENT PROJECT IN SCIENCE 15
15
02
04
06
08
01
00
Pre Post
% C
orr
ect
Percentage of correct answers CN4
Figure 1: Percentage of correct answers on pre and post tests from 4th grade students.
02
04
06
08
01
00
Pre Post
% C
orr
ect
Percentage of correct answers CN6
Figure 2: Percentage of correct answers on pre and post tests from 6th grade students.
A first look at the results show a very alarming starting point for children in Science,
consistent with what national and international exams have shown. We have described these
initial results in more detail elsewhere (see Furman, 2012). Before the program started, students

IMPACT OF A SCHOOL IMPROVEMENT PROJECT IN SCIENCE 16
16
were able to answer only a very low percentage of the test questions (37,3% and 25,2%
respectively for 4th
and 6th
grade). This result is truly worrisome, considering that the tests
evaluated content students should have learned in prior years (as we mentioned, 4th
grade test
evaluated learning goals prescribed for 1st to 3
rd grade, as was the case for 6
th grade test, which
assessed learning goals prescribed for 1st to 5
th grade).
After the 4-year intervention, we see how students showed a key improvement in their
scientific knowledge and skills. This result is very important, as it shows the degree of change
that can be expected in an intensive program of the characteristics we have described. In trying
to understand the significance of these results, it is important to remember that, while the whole
school was involved in a 4-year program, each teacher had only 1 year of professional
development in Science.
A closer look at some of the exam questions is revealing of the meaning of student
improvement in terms of Science learning. As mentioned above, tests included open ended
problems that assessed scientific knowledge and skills in the context of an everyday situation.
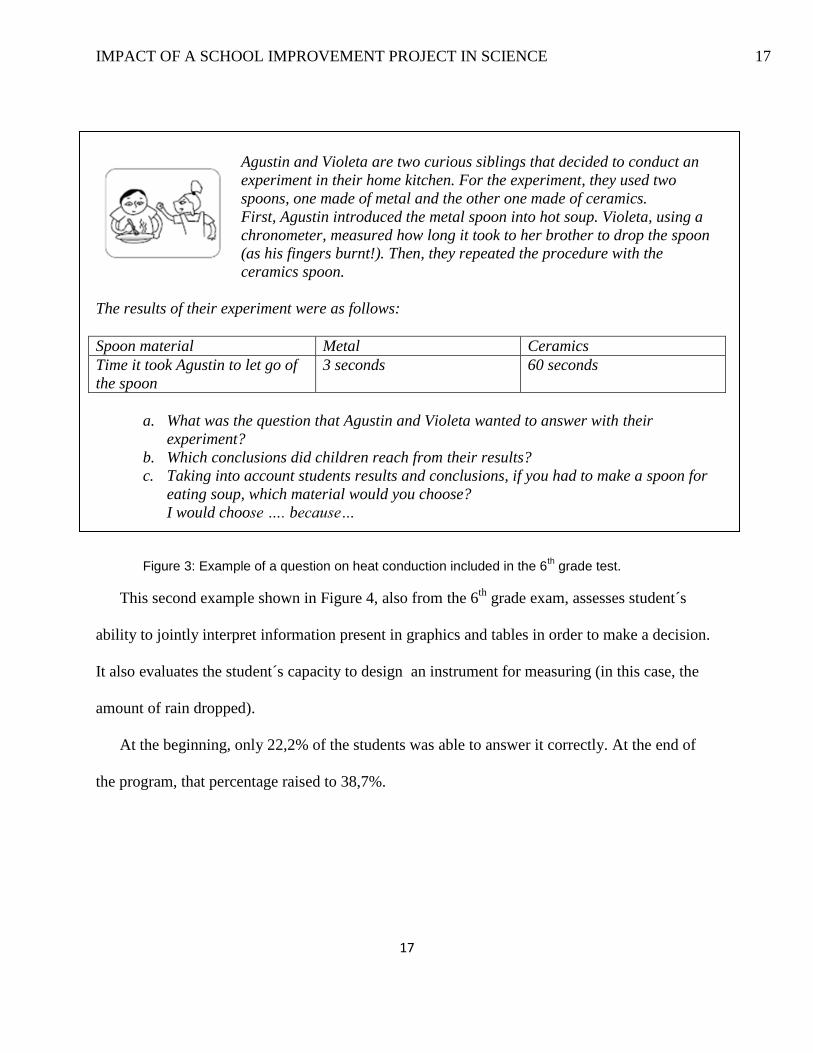
For instance, the following question depicted in Figure 3, included in the 6th
grade exam,
assessed students´ ability to identify the question behind an investigation on heat conduction, to
analyze experimental results and, finally, to apply those results to a new situation.
At the beginning, only 25,1% of students were able to answer this question correctly. At
the end of the program, that percentage raised to 44,1%.
IMPACT OF A SCHOOL IMPROVEMENT PROJECT IN SCIENCE 17
17
Agustin and Violeta are two curious siblings that decided to conduct an
experiment in their home kitchen. For the experiment, they used two
spoons, one made of metal and the other one made of ceramics.
First, Agustin introduced the metal spoon into hot soup. Violeta, using a
chronometer, measured how long it took to her brother to drop the spoon
(as his fingers burnt!). Then, they repeated the procedure with the
ceramics spoon.
The results of their experiment were as follows:
Spoon material Metal Ceramics
Time it took Agustin to let go of
the spoon
3 seconds 60 seconds
a. What was the question that Agustin and Violeta wanted to answer with their
experiment?
b. Which conclusions did children reach from their results?
c. Taking into account students results and conclusions, if you had to make a spoon for
eating soup, which material would you choose?
I would choose …. because…
Figure 3: Example of a question on heat conduction included in the 6th grade test.
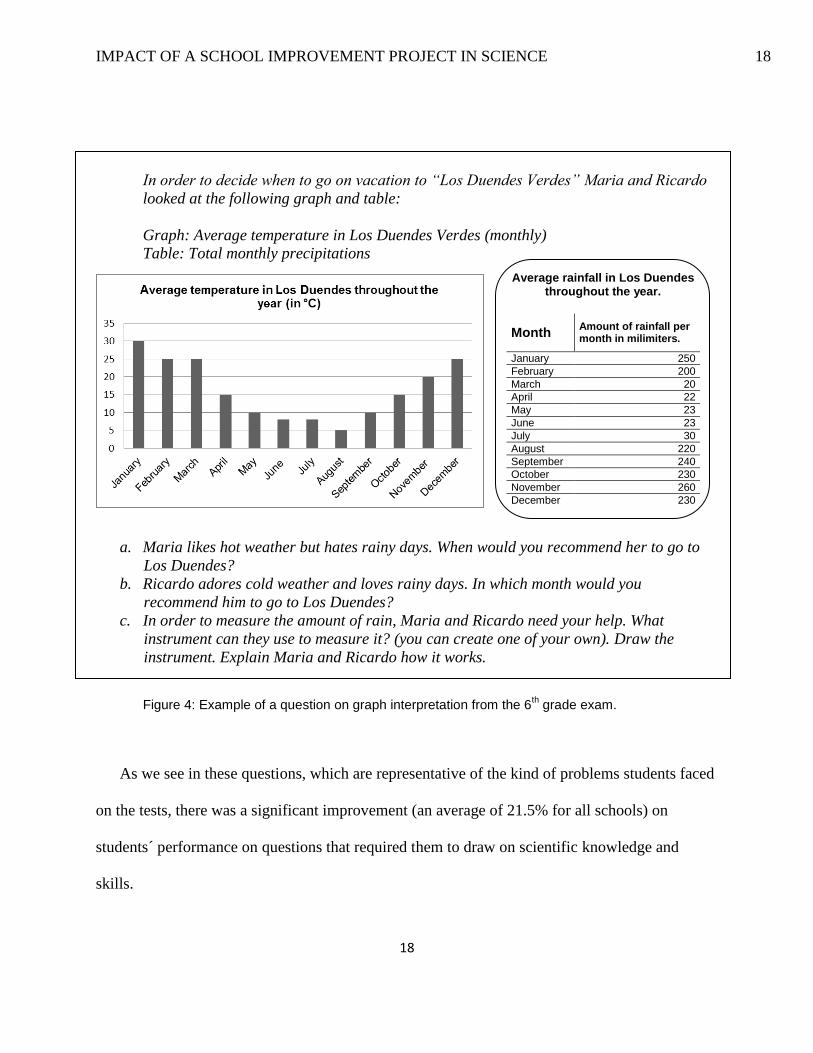
This second example shown in Figure 4, also from the 6th
grade exam, assesses student´s
ability to jointly interpret information present in graphics and tables in order to make a decision.
It also evaluates the student´s capacity to design an instrument for measuring (in this case, the
amount of rain dropped).
At the beginning, only 22,2% of the students was able to answer it correctly. At the end of
the program, that percentage raised to 38,7%.
IMPACT OF A SCHOOL IMPROVEMENT PROJECT IN SCIENCE 18
18
In order to decide when to go on vacation to “Los Duendes Verdes” Maria and Ricardo
looked at the following graph and table:
Graph: Average temperature in Los Duendes Verdes (monthly)
Table: Total monthly precipitations
a. Maria likes hot weather but hates rainy days. When would you recommend her to go to
Los Duendes?
b. Ricardo adores cold weather and loves rainy days. In which month would you
recommend him to go to Los Duendes?
c. In order to measure the amount of rain, Maria and Ricardo need your help. What
instrument can they use to measure it? (you can create one of your own). Draw the
instrument. Explain Maria and Ricardo how it works.
Figure 4: Example of a question on graph interpretation from the 6th grade exam.
As we see in these questions, which are representative of the kind of problems students faced
on the tests, there was a significant improvement (an average of 21.5% for all schools) on
students´ performance on questions that required them to draw on scientific knowledge and
skills.
Average rainfall in Los Duendes throughout the year.
Month Amount of rainfall per month in milimiters.
January 250
February 200
March 20
April 22
May 23
June 23
July 30
August 220
September 240
October 230
November 260
December 230

IMPACT OF A SCHOOL IMPROVEMENT PROJECT IN SCIENCE 19
19
Looking at teacher surveys allows us to enrich this picture some more. We found that 93,9%
of consulted teachers described the impact of the program on student learning as “strong or very
strong”. When asked about specific examples of those gains, 56,3% of teachers talked about
student learning of scientific skills and their improvement in explaining their reasoning, both
verbally and in written form. A 30,1% of teachers described an increase in student participation
in Science class and more motivation to learn, whereas 9.7% of teachers described that students
developed a stronger sense of confidence in their own capacity to learn Science.
Together, these results show an important shift in what students were able to do with
Science, starting from a very low point and improving towards more satisfactory levels.
Room to Improve
However, the results also show that there is still a big room for improvement after the 4-
year intervention, and that the program did not fully accomplish its goal of reaching all children.
The following histograms show the distribution of % of correct answers among students
(Figures 5 and 6). Looking at the results by student, we see that, by the end of the intervention,
the average student was able to correctly answer less than 60% of the tests in both grades. This
result makes us wonder about possible ways to redesign the program in order to have a stronger
impact.

IMPACT OF A SCHOOL IMPROVEMENT PROJECT IN SCIENCE 20
20
05
10
0 50 100 0 50 100
Pre Post
Perc
ent
%C
Percentage of correct answers CN4
Figure 5: Percentage of correct answers in pre and post test from 4th grade students.
05
10
0 50 100 0 50 100
Pre Post
Pe
rcen
t
% Correct
Percentage of correct answers CN6

IMPACT OF A SCHOOL IMPROVEMENT PROJECT IN SCIENCE 21
21
Figure 6: Percentage of correct answers in pre and post test from 6th grade students.
A further look at the graphs shows, in addition, the large variability of student results,
both at the beginning and at the end of the program. This heterogeneity made us think deeper
about the impact of the program on different students.
We wondered, for instance, if there were children to whom their teachers had not been
able to reach at all. With that question in mind, we looked at the percentage of students that did
not reach the minimum levels of achievement in Science at the beginning and at the end of the
program.
Setting a 20% of correct answers as an evidence of those students who were below
minimum levels of performance, our data shows that in 4th
grade that number decreased from a
26,2% to 10,57% and, in 6th
grade, from 47,6 % to a very high 29,3 %.
What these graphics are showing is that, even when there was a global increase in student
performance, there were still an important amount of students who failed to reach the minimum
levels of expected learning in Science, especially in 6th
grade. This result points out to the need
of special efforts in teacher education practices that focus on developing more directed strategies
to reach those children who are still getting behind the group despite the new pedagogies
implemented.
A Closer Look at Omitted Answers
A look at the omitted answers, i.e. those left blank by students, gives us another insight
on the impact of the program. We see how, in 4th
grade, the average % of omitted answers
decreased from an initial 17,6% to 8,6%. In 6th
grade, the decrease went from 22,3% to 14%
(Figures 7 and 8).

IMPACT OF A SCHOOL IMPROVEMENT PROJECT IN SCIENCE 22
22
Omitted answers are different from incorrect answers. They show us evidence of those
type of questions that students found too distant to what they already knew, or too unfamiliar, or
too difficult even to attempt an answer. The decrease in omitted answers is a sign that students
are starting to attempt to provide an answer and aiming to explain their thoughts (it is important
to remember that the tests included open questions).
02
04
06
08
01
00
Pre Post
% O
mitte
d
Percentage of omitted answers CN4
Figure 7: Percentage of ommited answers in pre and post exams from 4th grade students.

IMPACT OF A SCHOOL IMPROVEMENT PROJECT IN SCIENCE 23
23
02
04
06
08
01
00
Pre Post
% O
mitte
d
Percentage of omitted answers CN6
Figure 8: Percentage of ommited answers in pre and post exams from 6th grade students.
As opposed to the increase in correct answers, that reached the majority but not all
students, we see that the improvement in omitted questions was a more general phenomenon.
Looking at the distribution of percentage of omitted questions among students, we see for
instance that in 4th
grade, after the intervention, there were only 2,6% of students who omitted
50% or more of the questions of the test (starting from a 6,1%). In 6th grade, the percentage
decreased from 14,8% to 7,4%. (Figures 9 and 10).

IMPACT OF A SCHOOL IMPROVEMENT PROJECT IN SCIENCE 24
24
02
04
06
0
0 50 100 0 50 100
Pre Post
Pe
rcen
t
% Omitted
Percentage of omitted answers CN4
Figure 9: Percentage of 4th grade students who obtained different percentages of omitted
answers in pre and post exams

IMPACT OF A SCHOOL IMPROVEMENT PROJECT IN SCIENCE 25
25
01
02
03
04
0
0 50 100 0 50 100
Pre Post
Pe
rcen
t
% Omitted
Percentage of omitted answers CN6
Figure 10: Percentage of 6th grade students who obtained different percentages of omitted
answers in pre and post exams
Differences Among Schools
Finally, in order to shed more light on the data analysis, we were interested in knowing
whether the program had impacted differently in different schools. Was the intervention more
successful in some schools than in others? What were the differences in student test results
among the participant schools?
In order to answer those questions, we calculated the average percentage of
students´correct and omitted answers by school for both tests. We calculated growth per school
by substracting pre-test results from post- test ones.
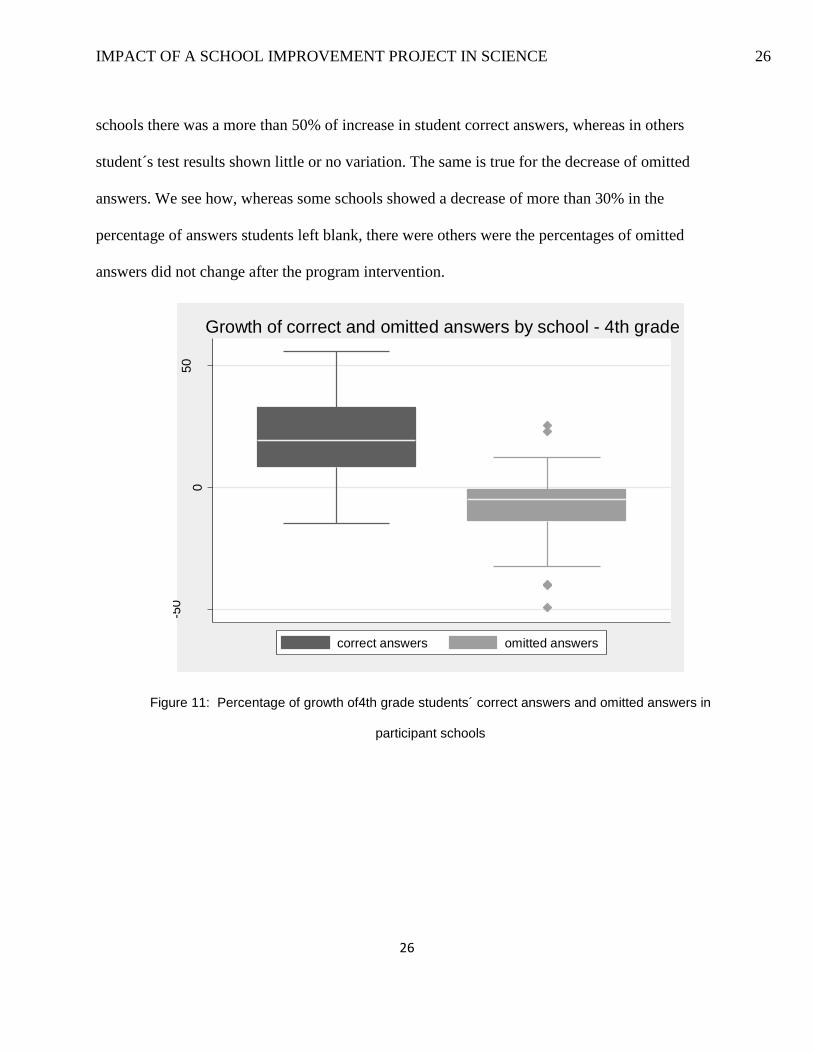
Our analysis shows that there was a large variation among the degree of improvement in
student results shown by different schools in the program. As Figure 11 and 12 show, in some
IMPACT OF A SCHOOL IMPROVEMENT PROJECT IN SCIENCE 26
26
schools there was a more than 50% of increase in student correct answers, whereas in others
student´s test results shown little or no variation. The same is true for the decrease of omitted
answers. We see how, whereas some schools showed a decrease of more than 30% in the
percentage of answers students left blank, there were others were the percentages of omitted
answers did not change after the program intervention.
-50
050
Growth of correct and omitted answers by school - 4th grade
correct answers omitted answers
Figure 11: Percentage of growth of4th grade students´ correct answers and omitted answers in
participant schools

IMPACT OF A SCHOOL IMPROVEMENT PROJECT IN SCIENCE 27
27
-50
050
10
0
Growth of correct and omitted answers by school - 6th grade
correct answers omitted answers
Figure 12: Percentage of growth of 6th grade students´ correct answers and omitted answers in
participant schools
We believe our results indicate the presence of other contextual factors that might explain the
different levels of impact the program had within those schools, which opens a new and
important window for future analysis. Based on our experience in the program and on previous
studies, possible factors to look at that might account for the observed differences are school
principals’ support to the program, as well as teacher rotation and teacher absenteeism, which in
some participant schools were very high.

IMPACT OF A SCHOOL IMPROVEMENT PROJECT IN SCIENCE 28
28
Discussion
We have shown a significant improvement on student Science performance after a 4-year
program intervention aimed to improve teaching practices in vulnerable areas. In other words,
this study provides evidence of the degree of change that might be expected of a school
improvement program in vulnerable areas with the type of school intervention we have
described.
Our results also show the need to develop other support strategies in order to reach all
students in the program, since there was a percentage of children who were still below the
minimum level of scientific competence even at the end of the program. Along these lines, our
experience points towards the need to provide school principals with specific professional
development aimed to help them develop strategies to rethink school organization, including the
grouping of children who need extra support, as well as providing teachers with teaching
strategies that help them reach those students in difficulty.
The large variability of results among different schools show the need for further analysis
in order to understand the contextual factors that account for different levels of change. A closer
look at differences such as principal´s support of the program or teacher rotation may provide
further insight on the kind of contexts that promote the ways different schools get ownership of
an external school program, for instance.
In all, we believe our results become especially important in the context of Latin
American education and global education in general, since in many countries of the developing
world the majority of educational efforts do not include a systematic evaluation component.
Thus, local educational policy makers and program designers are usually “blind” in terms of
IMPACT OF A SCHOOL IMPROVEMENT PROJECT IN SCIENCE 29
29
what to expect as possible results of their efforts , and need to look for empirical evidence
collected in other regions of the country, which very often may not directly apply to the local
context.
Finally, our study offers, as Marilyn Cochran-Smith (2004) has pointed out, a “proof of
possibility,” since they provide evidence of change in student Science performance within
schools located in very disadvantaged areas, which show the worst results of the country in
national tests (Rivas et al., 2010). As we mentioned earlier, for participant schools in our
program, student pre-tests results showed very low levels of scientific knowledge and skills, as
we reported on a previous study (Furman, 2012), which is consistent with national tests results
for students in vulnerable contexts. Our findings speak, therefore, to the urgency of developing
school improvement efforts in Science if we are to transform the kind of Science currently taught
in the Latin American region, and offer all children the possibility of achieving scientific
literacy.

IMPACT OF A SCHOOL IMPROVEMENT PROJECT IN SCIENCE 30
30
References
Brown, J. S., Collins, A., & Duguid, P. (1989). Situated Cognition and the Culture of Learning.
Educational Researcher, 18(1), 32–42.
Borko, H. (2004). Professional Development and Teacher Learning: Mapping the Terrain.
Educational Researcher, 33(8), 3-15.
Calabrese Barton, A. (2003). Teaching science for social justice. New York: Teachers College
Press.
Consejo Federal de Cultura y Educación. (2004). Núcleos de Aprendizaje Prioritarios:
Ministerio de Educación, Ciencia y Tecnología. Consejo Federal de Cultura y Educación. Cochran-Smith, M. (2004). Walking the road: Race, diversity and social justice in teacher
education. New York: Teachers College Press.
Duarte, J., Bos, M.S., & Moreno, M. (2009). Inequidad en los Aprendizajes Escolares en
América Latina. IDB Technical Note No. 4, Inter-American Development Bank,
Washington, DC.
Economic Comission for Latin American and the Caribbean (2012). Social Panorama of Latin
America. United Nations. Available at:
http://www.cepal.org/publicaciones/xml/4/48454/SocialPanorama2012DocI.pdf
Furman, M. (2012). ¿Qué ciencia estamos enseñando en contextos de pobreza? Praxis y Saber,
3(5), 15-51.
Furman, M. y Podestá, M.E. (2009). La aventura de enseñar ciencias naturales. Buenos Aires:
Aique Gvirtz, S., & Oria, A. (2010). Alianzas para la mejora educacional. Buenos Aires: Aique.
Haberman, M. (1995). The Dimensions of Excellence in Programs Preparing Teachers for Urban
Poverty Schools. Peabody Journal of Education, 70(2), 24–43. Retrieved from
http://links.jstor.org/sici?sici=0161-
956X%28199524%2970%3A2%3C24%3ATDOEIP%3E2.0.CO%3B2-I
Leymonié Saenz, J. (2009). Aportes para la enseñanza de las ciencias naturales: Segundo
estudio Regional Comparativo y Explicativo (SERCE). Santiago de Chile: Oficina
Regional de Educación de la UNESCO para América Latina y el Caribe.
Näslund-Hadley, E., Cabrol, M., & Ibarraran, P. (2009). Beyond Chalk and Talk: Experimental
Math and Science Education in Argentina. Washington DC: BID.
Organización para la Cooperación y el Desarrollo Económico (OCDE) (2013). PISA 2012
Results: What Students Know and Can Do: Student Performance in Reading,
Mathematics and Science.
Osborne, J. (2007). Science Education for the Twenty First Century. Education, 3(3), 173-184.
Rivas, A., Vera, A. & Bezem, P. (2010). Radiografía de la educación argentina. Buenos Aires:
CIPPEC.
Shulman, L. S. (1986). Those Who Understand: Knowledge Growth in Teaching. Educational
Researcher, 15(2), 4–14.
UNESCO. (2009). Aportes para la enseñanza de las ciencias naturales: Segundo estudio
Regional Comparativo y Explicativo (SERCE). Santiago de Chile: Oficina Regional de
Educación de la UNESCO para América Latina y el Caribe.
IMPACT OF A SCHOOL IMPROVEMENT PROJECT IN SCIENCE 31
31
Valverde, G., & Näslund-Hadley, E. (2010). La condición de la educación en matemáticas y
ciencias naturales en América Latina y el Caribe. Inter-American Development Bank.
Education Division.
Valverde, G., Valeiron, J., Domínguez, L. & González, S. (2007). How are Mathematics and
Reading Comprehension Learned in the Primary Schools of the Dominican Republic? A
Final Report of Highlights from the Educational Evaluation Research Consortium Study
of Third through Seventh Grade. Albany, NY: Educational Evaluation Research
Consortium and USAID.
Related Documents