Evaluating the Evidence Base in Pharmacovigilance Decision Making. by Amy Tang This thesis is submitted in partial fulfilment of the requirements for the award of the degree of Doctor of Philosophy of the University of Portsmouth. In collaboration with the Drug Safety Research Unit, Bursledon, Southampton, England. October 2010

Welcome message from author
This document is posted to help you gain knowledge. Please leave a comment to let me know what you think about it! Share it to your friends and learn new things together.
Transcript

Evaluating the Evidence Base in Pharmacovigilance
Decision Making.
by Amy Tang
This thesis is submitted in partial fulfilment of the requirements for the award of the
degree of Doctor of Philosophy of the University of Portsmouth.
In collaboration with the Drug Safety Research Unit,
Bursledon, Southampton, England.
October 2010

Evaluating the Evidence Base in Pharmacovigilance
Decision Making.
Abstract
Introduction
It has been said that through monitoring of drug safety, pharmacovigilance (PV)
systems have been instrumental in assisting regulatory decisions on product safety.
However, there has been no, systematic, in-depth study of this role. This thesis
reports such a study conducted in the UK. On the basis of the results, suggestions
are made on how PV data might be produced and used more effectively.
Methods
In Phase 1, a scoping study was conducted to document all changes made to UK
product labelling on safety grounds over a 10 year period (September 1st 1995 to
August 31st 2005). In Phase 2, all product withdrawals and major labelling changes
made during the 10 year study above, were investigated in depth to determine the
therapeutic group, source of ADR data cited as the reason for the change; and
product survival probability, using Kaplan-Meier modelling. Phase 3, informed by
Phases 1 and 2, used a web-based survey (150 respondents) and structured
interviews (13 subjects) with healthcare professionals and scientists with a PV role in
the NHS, pharmaceutical companies and the UK regulator, to gain views on the
current procedures for handling safety issues in the UK and how these might be
improved. Inferences were drawn using interpretative phenomenological analysis
with NVivo 8 software.
Key findings
Phases 1 and 2 revealed the fragmentary nature of information in the public domain
and the difficulties of obtaining unpublished information. Based on public information,
Phase 1 showed that 2,630 safety notices were issued affecting 688 individual
products. The two main safety notice categories were drug interactions (841;32%)
and side effects (537;20%). The rank order of the four most common therapeutic
i

areas in which safety notices occurred was: CNS (23.5%)> anti-infectives (21.6%) >
cardiovascular (15.2%) > cancer chemotherapy (10.8%). The ratio of Type A : Type
B side effects (ADRs) was 1:3.3.
Phase 2 found that of 518 eligible products launched during the study period, 9
(1.7%) were licensed and withdrawn for safety reasons. The ten-year Kaplan-Meier
probability of adverse drug reactions causing the withdrawal of a new product, post-
marketing was 2.2%. All decisions were based on more than one safety data type
and all involved UK yellow cards. One decision considered prescription event
monitoring (PEM) data.
A total of 164 important safety notices affecting 818 individual products were
identified. Of 518 products launched during the study period, 56 experienced at
least one major labelling change for safety reasons. The ten-year Kaplan-Meier risk
of a product experiencing at least one major labelling change on safety grounds was
13.8%. As with product withdrawals, safety decisions were based on a wide range of
data sources of variable quality and quantity. Variation in dissemination of the new
safety information was observed. Only one fifth of safety notices warranting a ‘Dear
Healthcare Professional’ letter or a monograph in ‘Current Problems in
Pharmacovigilance’, were accompanied by a boxed warning in the BNF,
representing an important inconsistency in notifying prescribers.
As with interview participants, respondents to the on-line questionnaire had
difficulties placing the yellow card reports in a formal hierarchy of evidence whilst
acknowledging that the data were valuable in the decision making process.
Suggested ways of improving the quality of such reports included making the
reporting more accessible and training all those eligible to report. PEM studies were
cited by the majority of respondents as a means of generating credible safety data
and raising the general quality of the drug safety database. In terms of dissemination
and education about ADRs, Drug Safety Updates (which replaced the ‘Current
Problems’ publication from the MHRA in August 2007) were highly thought of; they
appeared to be more popular than ‘Dear Healthcare Professional’ letters and
because they were web-based, ought to be accessible by a wider audience.
ii

iii
Conclusions
Safeguarding public health is of utmost importance when making a decision whether
or not to withdraw a product or amend its labelling upon the emergence of new
safety data.
Labelling changes should be made only on the best evidence available at the time
and appropriate risk management strategies should be instigated where feasible; not
only when a safety signal arises post-marketing, but when a drug is first granted a
marketing authorisation.
There is no general consensus on what constitutes ‘best evidence’ and rating
evidence using traditional hierarchies is problematic, The GRADE hierarchy may be
an exception.
Improving ADR reporting should lead to improved data bases from which to draw
safety conclusions. Methods of improving reporting include early instigation and
enforcement of risk management plans by the regulator, education of all those
eligible to report, greater transparency of regulatory decisions and better and more
rapid dissemination of safety change information.

iv
CONTENTS
Abstract i
Contents iv
Declaration xii
List of Tables xiii
List of Figures xvii
Abbreviations xviii
Acknowledgements xxi
Dissemination xxii
Chapter 1: Introduction 1
1.1 Adverse drug reactions 2
1.1.1 Definition of an ADR 2
1.1.2 Classification of ADRs 3
1.1.2.1 Type A ADRs 4
1.1.2.2 Type B ADRs 5
1.1.2.3 Type C ADRs 5
1.1.2.4 Type D ADRs 6
1.1.2.5 Alternative ADR classifications 6
1.2 Sources of ADR data 6
1.2.1 Pre-authorisation data 7
1.2.1.1 Pre-clinical data 7
1.2.1.2 Clinical data 8
1.2.1.2.i Phase 1 studies 8
1.2.1.2.ii Phase 2 clinical trials 9
1.2.1.2.iii Phase 3 clinical trials 9
1.2.1.2.iv Phase 3 trials and detection of rare events – the number problem 11
1.2.2 Post-authorisation ADR data 15
1.2.2.1 The Yellow Card Scheme 16

v
1.2.2.2 Other spontaneous ADR reporting systems 18
1.2.2.3 Use of spontaneous reporting data to generate safety signals 19
1.2.2.4 Post-authorisation epidemiological studies 25
1.2.2.4.i Cohort studies 25
1.2.2.4.ii Case control studies 25
1.2.2.4.iii Prescription event monitoring (PEM) 26
1.2.2.4.iv General Practice Research Database (GPRD) and other health
registers
27
1.2.2.5 Other safety data generated post-authorisation 28
1.2.2.5.i Published case reports 28
1.2.2.5.ii Periodic Safety Update Reports (PSURs) 28
1.2.2.5.iii Company sponsored post-MA safety studies 29
1.2.3 Risk management plans 30
1.3 Current UK Regulatory Framework for authorising medicines 30
1.3.1 National procedure 31
1.3.2 EU centralised procedure 31
1.3.2.1 Nature of data submitted for a MAA through the centralised
procedure
32
1.3.2.2 Centralised procedure: assessment outcome 33
1.3.3 The decentralised system 33
1.3.4 The mutual recognition procedure 34
1.3.5 Content of a Marketing Authorisation Application (MAA) dossier 34
1.3.5.1 Part 1: Data summary 35
1.3.5.2 Part 3: Pharmacotoxicological studies 36
1.3.5.3 Part 4: Clinical studies 38
1.3.5.3.i Responsibilities of the MA applicant regarding ADR reporting in
clinical trials
39
1.3.5.4 Responsibilities of the MA holder regarding ADR reporting 40
1.3.6 Pharmacovigilance responsibilities of the MHRA 42
1.3.7 Risk versus benefit analysis 44

vi
1.4 Impact of ADRs 47
1.4.1 Impact of ADRs on morbidity and mortality 47
1.4.1.1 Hospital admissions due to ADRs 47
1.4.1.2 ADRs in hospital patients 49
1.4.1.3 ADRs in primary care 49
1.4.2 Other impacts of ADRs 50
1.4.2.1 Cost to the patient 50
1.4.2.2 Cost to the healthcare provider(s) 50
1.4.2.3 Cost to the MA holder 50
1.4.2.4 Cost to the healthcare system 51
1.5 Research aims 52
1.5.1 Phase 1 aims 53
1.5.2 Phase 2 aims 53
1.5.3 Phase 3 aims 53
Chapter 2: A longitudinal study of labelling changes and product
withdrawals in the UK, due to ADRs, 1995-2005.
55
2.1 Introduction 55
2.2 Methodology – Phase 1 55
2.2.1 Searching the British National Formulary (BNF) 56
2.2.2 Searching the Pharmaceutical Journal (PJ) 58
2.2.3 Other attempts to retrieve or validate information 59
2.2.3.1 Use of the BNF editorial team database 59
2.2.3.2 MHRA contact 61
2.2.3.3 Contact with individual pharmaceutical companies 61
2.2.3.4 DataPharm Communications 64
2.2.4 Statistical analyses 64
2.3 Results 65
2.3.1 Analysis of side effects 80
2.3.2 Dose changes 80

vii
2.3.3 Food / drink and herbal interactions 83
2.3.4 Lactation warnings 84
2.3.5 Pregnancy warnings 86
2.3.6 Warnings in renal disease 88
2.3.7 Warnings in hepatic disease 90
2.4 Analysis for trends 92
2.5 Overall discussion points 100
Chapter 3: In-depth study of the circumstances surrounding product withdrawals and major labelling changes in the UK and the evidence base used for such decisions.
103
3.1 Introduction 103
3.2 Data quality and hierarchy in a drug safety context 103
3.3 Methodology 109
3.3.1 Product withdrawals 109
3.3.2 Major safety notices 109
3.3.3 Kaplan-Meier survival analysis 110
3.3.3.1 Data analysis - product withdrawals 111
3.3.3.2 Data analysis – major safety notices 112
3.3.4 Assessing data quality 112
3.4 Results 113
3.4.1 Product withdrawals 113
3.4.2 Major safety notices 117
3.5 Discussion 129
3.5.1 Product withdrawals 129
3.5.2 Major safety notice applications 136
3.5.3 Comparison of information used to formulate safety decisions 136
3.6 Overall discussion 138

viii
3.7 Conclusions 139
Chapter 4: A mixed methods study of the views of UK healthcare professionals who work with pharmacovigilance (PV) data.
141
4.1 Introduction 141
4.2 Methods 141
4.2.1 The Pharmaceutical Information and Pharmacovigilance Association (PIPA)
141
4.2.2 The Organisation for individuals in Pharmaceutical Regulatory Affairs (TOPRA)
142
4.2.3 United Kingdom Medicines Information (UKMi) 142
4.2.4 Web-based survey 143
4.2.5 Questionnaire data analysis 146
4.2.6 Structured interview design 146
4.2.7 Structured interview delivery 146
4.2.8 Recruitment of interview subjects 147
4.2.9 Structured interview conduct 148
4.2.9.1 Interview plan 148
4.2.9.2 Interview delivery 149
4.2.10 Structured interview data analysis 149
4.2.11 Ethics approval 152
4.3 Results 153
4.3.1 Questionnaire survey results 153
4.3.2 Structured interview results 168

ix
4.3.2.1 Subject demographics 168
4.3.2.2 Themed analysis 168
4.4 Discussion 170
4.4.1 Web-based survey 170
4.4.1.1 Response rate 170
4.4.1.2 Respondent demographics 170
4.4.1.3 Safety information sources used 171
4.4.1.4 Factors potentially influencing the decision to withdraw a product 171
4.4.1.5 Opinions on Gray’s hierarchy as a means of ranking safety evidence 172
4.4.1.6 Use of Gray’s hierarchy to rank different types of safety evidence 172
4.4.1.7 Ways of improving the quality of drug safety evidence. 173
4.4.1.8 Drug safety scenarios 174
4.4.1.8.i Overall observations on scenario responses 181
4.4.2 Structured interviews 182
4.4.2.1 Views on current options for risk management (metatheme 1) 183
4.4.2.2 Expert committee review 183
4.4.2.3 Conducting additional research 184
4.4.2.4 Labelling changes 185
4.4.2.5 PIL changes 185
4.4.2.6 Dear HCP letters 185
4.4.2.7 Drug Safety Updates 186

x
4.4.2.8 Restriction in supply 186
4.4.2.9 Phased release of new products 187
4.4.2.10 Views on the quality of current decision making (metatheme 2) 187
4.4.2.11 Views on the MHRA 188
4.4.2.12 Views on the pharmaceutical industry 191
4.4.2.13 Signal detection 193
4.4.2.14 Case 1 (hiccups: Scenario 1 from the web-based questionnaire) 194
4.4.2.15 Case 2 (hepatotoxicity: Scenario 6 from the web-based
questionnaire)
195
4.4.2.16 Appropriateness of Gray’s hierarchy of evidence to rate ADR data 197
4.4.2.17 Suggested changes to Gray’s hierarchy 199
4.4.2.18Towards better decision making (metatheme 3) 199
4.4.2.19 Education 200
4.4.2.20 Facilitating ADR reporting 201
4.4.2.21 Mandatory reporting 201
4.4.2.22 Paying the reporter 202
4.4.2.23 Patient reporting 203
4.4.2.24 Simplifying reporting 204
4.4.2.25 Providing feedback to reporters 205
4.4.2.26 Conducting further research 205
4.5 Conclusions 206
Chapter 5: Overall discussion 211

xi
5.1 Overview 211
5.2 Use of GRADE hierarchy to grade the quality of ADR evidence. 215
5.2.1 Advantages and disadvantages of the GRADE system 220
5.2.2 Detractors of grading evidence in a hierarchy 222
5.2.3 Adoption of risk management plans 223
5.3 Critique of study methodology 224
5.3.1 Strengths and weaknesses of survey techniques used. 225
5.3.1.1 Themed analysis 225
5.3.1.2 Combination of web-based questionnaire and face-to-face interview
results.
226
5.3.1.3 Choice of structured interviews 226
5.3.1.4 Survey response rates 228
Chapter 6 Overall conclusions and suggestions for future work 229
6.1 Conclusions 229
6.2 Suggestions for further research 232
References 233
Appendices
Appendix 1. Questionnaire and cover letter sent to selected pharmaceutical
companies seeking information on their products.
253
Appendix 2. Piloted web-based questionnaire and sample cover note. 254
Appendix 3. Details of structured interview participants. 255
Appendix 4. Structured interview schedule. 256


LIST OF TABLES
Table title
Page
Table 1.1 Number of observations (N) needed in each group (A & B) to detect a given change in proportion (power = 80%; p<0.05%).
12
Table 1.2 Number of patients required with no background incidence of ADRs.
13
Table 1.3 How ADR incidence rate and selected relative risk determines subject numbers in a controlled, cohort study.
14
Table 1.4 Impact analysis of safety signals based on spontaneous reports.
22
Table 1.5 Factors influencing the initial assessment of reports constituting a potential safety signal.
23
Table 1.6 Arlett’s proposed elemental risk versus benefit assessment.
46
Table 1.7 Hospital admissions due to ADRs - data from the literature.
48
Table 2.1 Pilot survey of pharmaceutical companies to gain additional information on licensing changes made to selected products – summary of outcomes.
63
Table 2.2 Cases cited in the BNF and PJ over the study period by BNF in which they appeared.
66
Table 2.3 Safety notices by change category (BNF, PJ and total).
67
Table 2.4 Safety notices by BNF therapeutic category (BNF, PJ and total).
69
Table 2.5 Safety notices in BNF therapeutic categories by BNF number – totals from BNF and PJ entries.
71
Table 2.6 Safety notices: BNF therapeutic category by change category – BNF and PJ data combined.
74
Table 2.7 Safety notices: BNF number and change category (combined BNF & PJ data).
78
Table 2.8 Type of ADR vs BNF therapeutic category – PJ and BNF data combined.
81
Table 2.9 Analysis of changes made in the ‘dose’ category specific to groups at the extremes of age, by BNF therapeutic category.
82
Table 2.10 Analysis of non-drug-drug interactions, broken down by BNF 83
xiii

therapeutic category and type of interacting substance (BNF and PJ data combined). Table 2.11 Analysis of lactation warnings analysed by supporting statements and BNF chapter (BNF & PJ data combined).
85
Table 2.12 Analysis of pregnancy warnings analysed by BNF chapter and nature of supporting statements (BNF & PJ data combined).
87
Table 2.13 Analysis of warnings on the use of drugs in renal impairment by BNF therapeutic category, nature of supporting statements and degree of renal impairment at which the warning first applied.
89
Table 2.14 Analysis of warnings on the use of drugs in hepatic disease by BNF chapter, whether the drug should be avoided or whether dose adjustment should be made, and severity of disease (BNF & PJ data combined).
91
Table 2.15 Longitudinal analyses of data for correlation with increasing BNF period (Spearman’s rank order test) and trend.
94
Table 2.16 Results of Spearman’s rank order test for warning notices appearing in the PJ with increasing BNF period.
96
Table 2.17 Results of Spearman’s rank order test for warning notices appearing in the endocrine category with increasing BNF period.
97
Table 2.18 Results of Spearman’s rank order test for warning notices appearing in side effect (SEs) category with increasing BNF period.
99
Table 3.1 Clinical study designs and traditional hierarchies of evidence assigned to them (represents an amalgamation of several authors’ assessments).
105
Table 3.2 Summary of Gray’s hierarchy of evidence used to assess the ADR evidence for products included in the study.
113
Table 3.3 All products withdrawn during the study period and the evidence cited for withdrawal.
114
Table 3.4 List of products licensed and withdrawn for safety reasons during study period.
115
Table 3.5 Sources used to disseminate safety warnings.
118
Table 3.6 Distribution of products affected by major safety notices, by BNF therapeutic category.
118
Table 3.7 Scope of notices with respect to product coverage and proportion of blue box warnings encountered.
119
Table 3.8 Numbers of products affected by safety notices.
120
Table 3.9 Number of information sources cited for safety notices. 120
xiv

Table 3.10 Frequency of highest level of evidence cited for the 164 safety warnings.
121
Table 3.11 Key details of the 56 products subject to important safety notices, licensed during the study period (1995-2005).
126
Table 3.12 Numbers of products with multiple safety notices during study period.
127
Table 3.13 Highest data level used to inform product withdrawal and first major labelling change for UK products licensed between 1/9/95 and 31/8/05.
137
Table 4.1 Product safety scenarios used in the web-based survey of PIPA, TOPRA and UKMi members.
145
Table 4.2 Response rates for web-based questionnaires.
153
Table 4.3 Type of organisation in which respondents worked.
153
Table 4.4 Key roles of respondents.
154
Table 4.5 Professional status of respondents.
155
Table 4.6 Length of experience of respondents.
155
Table 4.7 Nature of company respondents worked for.
155
Table 4.8 Information sources commonly used by respondents when investigating drug safety issues.
156
Table 4.9 Level of importance that respondents attributed to factors which might influence the decision to withdraw a product on safety grounds.
157
Table 4.10 Level of respondent satisfaction with Gray’s hierarchy for ranking ADR data.
158
Table 4.11 Respondents’ rankings of different ADR sources according to Gray’s hierarchy.
159
Table 4.12 Personal preferences for ways of improving the quality of drug safety evidence.
160
Table 4.13 Respondents’ views on Scenario 1.
161
Table 4.14 Respondents’ views on Scenario 2.
162
Table 4.15 Respondents’ views on Scenario 3.
163
Table 4.16 Respondents’ views on Scenario 4.
164
Table 4.17 Respondents’ views on Scenario 5. 165
xv

xvi
Table 4.18 Respondents’ views on Scenario 6.
166
Table 4.19 Respondents’ views on Scenario 7.
167
Table 5.1. GRADE evidence quality assessment criteria.
217

LIST OF FIGURES
Figure Page Figure 2.1 Cases cited in the BNF and PJ over the study period by BNF in which they appeared.
67
Figure 2.2 Safety notices by change category (BNF and PJ) over study period.
68
Figure 2.3 Safety notices by BNF therapeutic category (BNF& PJ combined).
70
Figure 2.4 Safety notices in BNF therapeutic categories by BNF number – totals from BNF and PJ entries.
72
Figure 2.5 Safety notices: BNF therapeutic category by change category – BNF and PJ data combined.
75
Figure 2.6 Distribution of safety notices in the ‘dose’ category by BNF therapeutic category.
76
Figure 2.7 Distribution of safety notices in the ‘drug interactions’ category by BNF therapeutic category.
76
Figure 2.8 Distribution of safety notices in the ‘side effects’ category by BNF therapeutic category.
77
Figure 2.9 Safety notices: BNF number and change category (combined BNF & PJ data).
79
Figure 2.10 Results of runs analysis of BNF period against appearance of PJ warning notices .
96
Figure 2.11 Results of runs analysis of BNF period against appearance of warning notices in the endocrine therapeutic category.
97
Figure 2.12 Results of runs analysis of BNF period against appearance of warning notices in the endocrine therapeutic category.
99
Figure 3.1 Kaplan-Meier product withdrawal survival probability curves for the period 1/9/95-31/8/05.
116
Figure 3.2 Kaplan-Meier product safety notice survival probability curves for the period 1/9/95-31/8/05.
128
Figure 4.1 Stages of qualitative data analysis of structured interviews using NVivo8.
151
Figure 4.2 Theme construct from structured interview analysis.
169
Figure 6.1 Excellence in pharmcovigilance – a 2010 model. 230
xvii

xviii
ABBREVIATIONS USED IN THIS THESIS
ACSD Advisory Committee on the Safety of Drugs
ADHD Attention deficit hyperactivity disorder
ADR Adverse drug reaction
AERS Adverse Event Reporting System
AHFS American Hospital Formulary Service
BCPNN Bayesian Confidence Propagation Neural Network
BNF British National Formulary
CBER Center for Biological Evaluation and Research
CDER Center for Drug Evaluation and Research
CHM Commission on Human Medicines
CHMP Committee for Human Medicinal Products
CIOMS Council for International Organizations of Medical Sciences
CPMP Committee for Proprietary Medicinal Products
CSM Committee on Safety of Medicines
CTD Common technical document
DoH Department of Health
DSRU Drug Safety Research Unit
EC European Commission
EEA European Economic Association
EMEA European Agency for the Evaluation of Medicinal Products
EU European Union
FDA Food and Drug Administration
GPRD General Practice Research Database

xix
GRADE Grades of Recommendation Assessment, Development and Evaluation
HCP Healthcare professional
ICH International Conference for the Harmonisation of the Technical Requirements for the Regulation of Pharmaceuticals for Human Use
IPA Interpretative phenomenological analysis
MA Marketing Authorisation
MAA Marketing Authorisation Application
MCA Medicines Control Agency
MDA Medical Devices Agency
MedDRA Medical Dictionary for Regulatory Activities
MGPS Multi-item Gamma Poisson Shrinker
MHRA Medicines and Healthcare product Regulatory Agency
Mi Medicines Information
NCE New Chemical Entity
NDAA New Drug Approval Application
NHS National Health Service
NICE National Institute for Health and Clinical Excellence
PEM Prescription event monitoring
PE Pharmacoepidemiology
PIPA Pharmaceutical Information and Pharmacovigilance Association
PJ Pharmaceutical Journal
POM Prescription only medicine
PPD Prescription Pricing Division
PPR Proportional reporting ratio
PSUR Periodic Safety Update Report

xx
PV Pharmacovigilance
QP Qualified person
RCT Randomised controlled trial
RMP Risk management plan
RMS Reference Member State
RPSGB Royal Pharmaceutical Society of Great Britain
SPC Summary of Product Characteristics
SUSARs Suspected unexpected serious adverse reactions
TOPRA The Organisation for Individuals in Pharmaceutical Regulatory Affairs
UK United Kingdom
UKMi United Kingdom Medicines Information
UMC Uppsala Monitoring Centre
US United States
WHO World Health Organisation

Acknowledgements
First and foremost I want to thank Professor David Brown who has played an important role
in supervising my PhD thesis; he has been actively involved in my work and has always
been available to advise me. I am very grateful for his patience, time, ideas and stimulating
my PhD experience. I have learned a lot; he has enlightened me through his wide
knowledge of drug safety research and what is necessary to succeed. It would have been
next to impossible to complete this PhD without his help and guidance.
I would also like to thank Professor Saad Shakir for his continuous support, precious
comments, helping me to plan the research and finalise the PhD thesis.
The Drug Safety Research Unit is thanked for its numerous excellent training conferences; in
particular I would like to gratefully acknowledge the help of Dr. Deborah Layton for her
support in the statistical advice for the Kaplan Meier curves.
A word of thanks also to all the study participants, especially the interviewees.
In addition, I would like to thank Anu Davies and Jo Ferdinando, my employers from Shire
Pharmaceuticals Ltd. You gave me the opportunity to study my part time PhD.
And last, but definitely not least, I would like to thank my mum and brothers for all their faith
and support. Thanks to my father; my memory of you will only increase. And most of all for
my loving, encouraging and patient husband Wai-Lun whose support during my six years of
the PhD programme is so appreciated. Thank you.
xxi

DISSEMINATION
Work presented in Chapters 2 and 3 of this thesis was presented in poster format at
the 8th International Meeting of the International Society of Pharmacovigilance,
Buenos Aires, Sept 2008 and subsequently published as:
Tang, A; Layton, D; Shakir, SAW; Brown, D. Medicinal product safety on the UK
market – a ten year study. Drug Safety 2008;31(10):885-960 (proceedings).
xxii

1
CHAPTER ONE: INTRODUCTION
Removal of a medicinal product from the market can be a traumatic
experience for the manufacturer, healthcare professionals and patients.
Medicinal products can be discontinued for several reasons; these include the
emergence of new evidence that was not present at marketing authorisation
such as severe and specific safety problems, significant new drug
interactions, a relatively high adverse drug reaction (ADR) profile across a
range of effects or less than desired effectiveness. Other reasons might
include ineffective marketing practice leading to poor sales or replacement by
improved therapies. More often than not, a combination of factors is
responsible for the failure of a product to sustain a place in the market.1,2,3
The literature points to the fact that medicinal products are continuing to be
withdrawn from the marketplace for safety reasons year on year.4 However,
regulators and sometimes manufacturers, have often used different methods
of risk assessment and reached very different conclusions.5 Examples
include the withdrawal of tolcapone, trovafloxacin and troglitazone from the
European market while these products remained on the market, albeit with
additional precautions, in the United Sates (US). This clearly reflects a
difference in approach to safety analysis.6
If the severity and incidence of adverse effects outweigh the benefits of a drug
it may be necessary to withdraw marketing authorisation. In recent years,
there have been a number of high-profile product withdrawals involving safety
issues. Two recent journal articles focused on product withdrawal decisions.
The first described a limited study of the evidence used to support decisions
to withdraw medicinal product from the UK and US markets.2 The second
discussed in more depth the evidence and methodology used in the decision
making process and discussed some of the advantages and disadvantages of
applying the principles of evidence-based medicine to patient safety.7
Taken together, the findings from these small scale studies indicate a lack of
consistency when using safety data to help decide the fate of a marketed

2
product, both in terms of its quantity, quality and source. The author
concluded that this was an area where more thorough investigation would
prove valuable in suggesting a more consistent approach, with a particular
focus on the UK.
This thesis is divided into six chapters. Chapter One introduces the topic and
reviews what is known about adverse drug reactions, their impact and their
role in the medicinal product authorisation process. Chapter Two reports a
retrospective study on the nature and quantity of product withdrawals and
labelling (authorisation) changes over a 10-year period. Chapter Three
studies the evidence base used to arrive at the regulatory decisions made for
medicines in Chapter Two. Chapter Four describes a study of the attitudes
and opinions of professionals working in the drug safety field, on the main
issues raised by the study in Chapter Three, and Chapter Five provides a
summary of the main findings of this research and recommendations on how
to approach the evaluation of drug safety data more consistently. Chapter 6
provides overall conclusions and suggestions for future research.
Chapter 1 starts with a review of adverse drug reactions (ADRs) – their
causes, classification and information sources, including
pharmacoepidemiological studies, and then considers the interplay between
ADRs and the product development and authorisation processes. Throughout
this thesis, the term marketing authorisation (MA) is used in preference to
product licensing, although it is acknowledged that both terms are frequently
taken to mean the same thing.
1.1 Adverse drug reactions (ADRs)
1.1.1 Definition of an ADR
Every medicine has side effects, ranging from those that are only slightly
troublesome to the patient, to those causing major morbidities and even
death. A commonly accepted definition of an ADR is that given by the World
Health Organisation (WHO) 8,9 and recognised in Europe by the International
Conference on Harmonisation (ICH)10 as being:

3
‘a response to a drug which is noxious and unintended and which occurs at
doses normally used in man for prophylaxis, diagnosis or therapy of disease
or for modification of physiological function.’
The WHO also provides useful descriptions of what are considered to be
serious ADRs. These include any untoward medical occurrence that at any
dose: results in death, is life threatening, requires hospitalisation, prolongs
hospitalisation, results in persistent disability, is a congenital anomaly / birth
defect; or results in anaphylaxis, blood dyscrasias, convulsions, serious skin
reactions (e.g. Stevens Johnson Syndrome); or the development of drug
dependency / drug abuse.11 Of particular relevance to this thesis is the
emergence of latent ADRs that may not be seen until the post-authorisation
life of a medicinal product. The WHO describes such an ADR as one:
‘...... the nature or severity of which is not consistent with the current product
information’
and includes in this category serious idiosyncratic reactions and reactions that
add significant new information on the specificity or severity of known, already
documented ADRs.11 The term ADR implies an association between an
adverse event seen in the patient and a product which they are taking or
have taken in the past. An assessment of the strength of this association, and
therefore the quality of the ADR information forms an important part
pharmacovigilance (PV) methodology and is discussed in Section 1.3.
1.1.2 Classification of ADRs
Many methods have been used to classify ADRs.12 The mechanism-based
classification of ADRs proposed by Rawlins and Thompson in 1977 is still
commonly used;13 it has been usefully modified by the addition of two
additional categories (C and D) as proposed by Edwards and Aronson.14
Types C and D are not based on mechanisms but characteristics of their
manifestations. Thus the classification system used in this thesis separates
ADRs into four types ( A, B, C and D), each with differing, but sometimes
overlapping characteristics.

4
1.1.2.1 Type A ADRs
Type A ADRs generally result from an exaggeration (augmentation) of a
drug’s normal pharmacological action when given in the usual therapeutic
dose. They are normally dose-related and range in severity, from minor
inconvenience to the patient to major life-threatening effects. Therefore to
describe all Type A effects as mild or moderate is incorrect. The augmented
pharmacologic action may occur at the targeted receptors or at other non-
targeted sites and again, to say that all are predictable is not completely
accurate; however, if the pharmacology is known, this can facilitate
classification as Type A. Most ADRs (approximately 80%) are of this type and
most respond to dose reduction or stopping the drug. Given their aetiology,
reproducing the same conditions in a given patient will cause the ADR to
reoccur.14
Examples of ADRs classified as Type A include respiratory depression with
opioids (certainly augmented in overdose); nausea and headache with
theophylline; haemorrhage with tissue plasminogen activators such as
tenecteplase and anticoagulants such as warfarin; postural hypotension with
antihypertensive agents; Cushingoid reactions to corticosteroids and
hypoglycaemia with insulin.
Due to their characteristics, many Type A events are identified prior to product
authorisation and are consequently listed in product labelling. However, some
Type A ADRs are only discovered port-authorisation, either because the drug
is prescribed in patients with reduced capacity to clear the drug (e.g. reduced
hepatic, renal or cardiac function) or because they are co-prescribed with
another drug that reduces clearance by competition within the same
clearance mechanism. For example, terfenadine metabolism by the
cytochrome P450 isoenzyme CYP3A4 is inhibited by the presence of
ketoconazole or erythromycin. This can result in raised plasma and hence
tissue concentrations of terfenadine, leading to serious ADRs, such as cardiac
arrhythmias.15

5
1.1.2.2 Type B ADRs
Type B ADRs represent a novel response, not expected from the known
pharmacological action of the drug. In this respect they may be considered
idiosyncratic or bizarre. They are not necessarily dose-related, and compared
to Type A ADRs, relatively rare, accounting for approximately 20% of all
ADRs. Perhaps partially because of this and their unpredictability, they are
considered more serious than Type A ADRs; certainly they appear to be
associated with a higher rate of mortality.14 As well as having a tenuous
relationship to dose, Type B ADRs can occur at any time after the drug has
been started, emerging at any time during the course of therapy and
sometimes after treatment has stopped. In contrast to Type A ADRs, Type Bs
are difficult to predict and prevent and because of their tendency to be severe,
re-challenge is dangerous. If a patient experiences a Type B ADR, the drug is
usually discontinued. Because of their relative rarity (typically less than one
case per thousand treated patients), many Type B ADRs are only discovered
post-authorisation when a greater number of patients are exposed to the drug.
Examples of Type B ADRs include immune-mediated hypersensitivity
reactions, which can be IgE- or T cell-mediated, or rarely an immune complex
or cytotoxic reaction.16 Other Type Bs resulting in life-threatening states
include blood dyscrasias such as neutropenia and agranulocytosis, skin
reactions such as toxic epidermal necrolysis and Stevens-Johnson
syndrome, and hepatic failure.17
1.1.2.3 Type C ADRs
Type C ADRs may be described as adaptive changes, rebound phenomena
or other effects resulting from long-term (chronic ) drug administration. They
occur after a drug use induction period of variable length and can be serious
and persistent. Examples include thromboembolism with oestrogen-based
oral contraceptives, gastric ulceration with non-steroidal anti-inflammatory
drugs, neuroleptic malignant syndrome following abrupt withdrawal of

6
amantadine and withdrawal symptoms after stopping venlafaxine. A further
example is nephropathy induced by analgesic drugs.18 Although some of
these effects might be predicted from the known pharmacology of the drug,
their time-relatedness is relevant to when they might be discovered in the pre-
or post-authorisation phases of product life.
1.1.2.4 Type D ADRs
Type D ADRs are defined as those that emerge after a prolonged period of
drug use and are described as delayed effects, often only being recognised
after therapy has ceased and making assessment of causality difficult.
Examples include carcinogenesis (e.g. the emergence of endometrial cancer
in patients taking tamoxifen for breast cancer), teratogenesis during early
pregnancy and foetal effects during the latter stages. Indeed, one of the most
famous ADRs that caused a paradigm shift in the way the safety of medicinal
products is monitored –premature foetal death, and limb defects caused by
thalidomide – might be considered a Type D reaction.19,20
1.1.2.5 Alternative ADR classifications
Aronson and Ferner 21 have suggested that the above classification system is
too rigid and proposed an alternative, based on the three dimensions of: dose
relatedness, time relatedness and susceptibility of the patient (DoTS for
short). The authors provide some examples of the practical implementation of
DoTS and highlight the more informative content of the system for the
purpose of regulatory and PV work; indeed the system has been field tested
with some success.22 However, it has not gained wide acceptance and is not
understood by all; hence the traditional classification described above is used
in the present research.
1.2 Sources of ADR data
Some sources of information on ADRs provide more detailed evidence than
others, as outlined below. Drug safety data can be accrued both pre- and

7
post-authorisation and although some types of ADR information are
generated during both phases, they are worth considering separately. A
description of the pre-authorisation drug development process is provided in
Section 1.3.
1.2.1 Pre-authorisation data
1.2.1.1 Pre-clinical data
Animal and in vitro studies are used universally in the drug development
process to screen compounds for efficacy and safety and many will be
rejected at this stage, either due to lack of the former or unacceptable risks
associated with the latter. Acute and chronic toxicity testing in a range of
relevant animal species will yield information which may give an insight into
likely Type A toxicities to expect when the drug is administered in man. These
may be route-specific, e.g. gastrointestinal ulceration after oral administration,
or end organ–specific, e.g. hepatotoxicity or bone marrow suppression.
Effects in overdose will also be investigated.
Organ culture or whole- animal tests may be conducted to investigate the
main clearance pathways for the drug and to identify the main hepatic
enzymes using the drug as a substrate, in an attempt to predict potentially
clinically significant drug interactions.
On occasion, new ADRs have outstripped the design of new pre-clinical tests
to detect them. Some drugs have been withdrawn because an appropriate
test was either not included or unavailable in the pre-MA toxicological testing
programme; consequently, human response was not predicted by animal
testing. For example, toxicological tests for QT prolongation might have been
useful in demonstrating an increased risk of this in man with several drugs,
including grepafloxacin. There is good evidence that many Type B reactions
have an immunological basis, but their aetiology is complex; their expression
being determined by genetic, metabolic and concomitant disease factors. The

8
development of screening tests for drugs that stimulate metabolic activation
potential is another example of attempts to detect and predict potentially
serious side effects at a pre-clinical stage. Developing reliable in vivo or in
vitro models capable of predicting and evaluating idiosyncratic ADRs has
been described as the greatest current challenge in pharmacotoxicology.23
Administration during pregnancy may yield information on adverse effects on
the mother and foetus throughout pregnancy. Reproductive studies may
allow prediction of teratogenesis although, as tragically demonstrated with
thalidomide, the effects seen, and therefore the predictive power of such
experiments to man, can be dependent on the animal species tested.20 Both
in vivo and in vitro (tissue culture) studies are routinely undertaken during
toxicological work, to assess mutagenic and carcinogenic potential.
1.2.1.2 Clinical studies
The data of most relevance to the ADR profile of any drug will be obtained
through its use in man, in what are termed Phase 1 studies, and Phase 2 and
3 clinical trials. Detailed monitoring and the nature of the information likely to
be gained by such studies are reviewed elsewhere. 25 An overview is given
below.
1.2.1.2.i Phase 1 studies
In Phase 1 studies, the drug is tested in a small group (typically 50 – 100) of
healthy individuals. While the emphasis is on establishing pharmacodynamic
and pharmacokinetic behaviour on which to base doses in Phase 2 and 3
trials, additional safety data may be gleaned. This may allow prediction of
likely situations to avoid in patients; for example those with renal impairment if
the drug is cleared predominantly thought the kidney, or co-prescription with
specific interacting drugs. Subjects are intensely monitored for signs or
symptoms of toxicity; therefore Phase 1 studies can provide some indication
of likely end-organ toxicity through careful monitoring of indicators of damage
(e.g. enzyme levels) in blood.

9
Dose ranging studies may reveal Type A ADRs at higher doses and new
ADRs may be revealed that were not seen in pre-clinical animal studies. One
recent and thankfully exceptional example of this was the administration of a
monoclonal antibody TG1412 alpha, to six healthy male volunteers, which
triggered a ‘cytokine storm’ resulting in generalised organ failure and the need
for intensive care management.26
1.2.1.2.ii Phase 2 clinical trials
In Phase 2 trials, the product efficacy and safety are tested in patient groups
for the first time. Some dose ranging may also take place, to establish the
best estimate of the right dose for a particular patient group or disease for
who the product is intended, e.g. epilepsy for a new anticonvulsant, or
hypertension for a new antihypertensive agent. Compared to Phase 3 trials,
Phase 2 trials are relatively small; however subjects are monitored intensively
and additional safety data may emerge. For example, pre-existing renal
disease may result in accumulation of the drug, or the capacity of the drug to
cause hepatotoxicity may be magnified if it is tested in patients disposed to
develop hepatic disease.
In both Phase 2 and Phase 3 trials, there are tight inclusion / exclusion
criteria, such that subjects are unlikely to have concurrent diseases to the one
being treated or be taking concurrent medication. Such trials will also exclude
patients at the extremes of age and those likely to become pregnant. Dosing
and patient compliance are closely monitored.
In many ways, safety data will be similar to that gained at Phase 1; Phase 2
cohorts are small (200 – 400 patients) and so the detection of rare ADRs is
unlikely.
1.2.1.2.iii Phase 3 clinical trials
Phase 3 trials provide the best efficacy and safety data in any authorisation
application dossier. These trials are much larger and of longer duration than
Phase 2 trials, and allow a more robust assessment of risk versus benefit to

10
be made. A classic Phase 3 design involves double-blindness and
randomisation of patients to the various treatment arms to avoid bias.
Importantly, they are also controlled, either by the introduction of a placebo
arm or more commonly, an active comparator. The size of the trial is
determined by the power required to demonstrate a statistical difference in a
real clinical effect and length is determined by the endpoints studied; for
example, study of the efficacy of two lipid lowering agents may take three
months if the chosen endpoint is reaching a lowered target serum cholesterol
level, but many years if the endpoint is a cardiac event.
Often considered the gold standard for demonstrating efficacy, Phase 3,
controlled, double blind trials involve the highest number of patients exposed
to the drug in the development phase and constitute the best chance of
detecting ADRs prior to authorisation. While the most common Type A
reactions may be seen, even these investigations have drawbacks, as
described by several authors. 27,28,29
Firstly, patients are selected according to strict inclusion criteria and
concomitant diseases or unusual characteristics that might enhance drug
toxicity are absent; hence Phase 3 subjects do not represent the end-user
population. Secondly, the emphasis is on investigation of efficacy and
methods of monitoring for ADRs may not be sufficiently robust; important but
rarer ADRs may be overlooked. Thirdly, patients are treated for a limited
period in Phase 3 trials and latent (Type B, C or D) ADRs may not emerge.
Finally, by far the most important limiting factor with Phase 3 trials is that
relatively few patients are exposed to the investigational drug. This severely
limits the ability to detect rarer ADRs. The identification of uncommon, even if
serious or lethal reactions, from such a small number of highly selected
patients is unlikely.

11
1.2.1.2.iv Phase 3 trials and detection of rare events – the number
problem
Rawlins and Jeffreys 29 reviewed the available Phase 3 clinical trial evidence
in marketing authorisation applications (MAAs) submitted in the UK during
1987-1989 and calculated a median of 1,528 (95% CI 1,194-1,748) patients
included in the safety data; the range was very wide: 43 – 15,962 patients.
They observed that a median of 100 patients was exposed to the
investigational drug for more than one year. The situation may have improved
since publication of that study, particularly in the US, where Reichert found
that the new drug approval applications (NDAAs) for 23 new active
substances included a mean of 4,478 subjects (median not available). 30 In a
single year (1999) the author found that in 19 trials, the mean was 4,980 and
the median was 5,435. 30
To further illustrate the inadequacy of clinical trials to detect rare side effects,
consider the following. If one were comparing the efficacy and side effect
profile of two drugs in a clinical trial, Table 1.1 shows the number of
observations that would have to be made (or in this context, the number of
patients required to be included) to detect both common (treatment success)
and rare (side effect) events. Thus if one were comparing the efficacy of two
drugs (A and B) and one expected to see a modest improvement in patients
achieving the efficacy endpoint from 0.5 to 0.55, then one would need 1,640
patients in each treatment group. If one expected all of the patients in Group
B to be successfully treated, then the number in each group would be 20.
Thus in terms of efficacy (or benefit), the numbers are achievable using
conventional clinical trial methodology. However, if one is determined to
detect a difference in much rarer events such as side effects (risks), then
much greater numbers are required. For example, if one knew that the
incidence of depression with one anticonvulsant (Drug A) was 0.01% and one
wished to detect an increase of 10% in this figure with another anticonvulsant
(Drug B), then one would require 168,00 patients in each group. A doubling of
the projected risk, from 0.01 to 0.02 would still require 2,700 in each group.
This illustrates the need to study large numbers of patients, after marketing

12
authorisation, if one is to stand any chance of detecting rare side effects. The
point can also be made that to demonstrate absolute safety (i.e. the
proportion in Group B showing no effects) is unachievable.
Proportion showing
effect in Group A
Proportion showing
effect in Group B
N (number of patients
in each group)
0.5 0.55 1,640
0.5 1.00 20
0.3 0.33 3,890
0.3 0.6 50
0.1 0.11 15,130
0.1 0.2 240
0.01 0.011 168,000
0.01 0.020 2,700
0.001 0.0011 1,684,000
0.001 0.0020 23,000
Table 1.1. Number of observations (N) needed in each group (A & B) to
detect a given change in proportion (power = 80%; p<0.05%). (After
Lewis31)
One further projection of patient numbers required to detect ADRs is shown in
Table 1.2. This shows the number of subjects required if there is no
background incidence of ADRs, to detect either 1,2 or 3 instances of a
particular ADR. Such would be the case for a brand new ADR not detected
pre-MA, for example oculomucocutaneous syndrome with practolol, 32 where
there is no natural incidence in the untreated population. Thus, from Table
1.2, to detect three such occurrences in a new event occurring in 1 in 2,000
subjects would require study of 13,000 exposed individuals.

13
Required number of adverse reactions Expected
incidence of the
ADR
1 2 3
1 in 100 300 480 650
1 in 200 600 900 1,300
1 in 1000 3,000 4,800 6,500
1 in 2000 6,000 9,600 13,000
1 in 10,000 30,000 48,000 65,000
Table 1.2 Number of patients required with no background incidence of
ADRs. (After Lewis 31)
Where there is no known incidence of a particular event, the ‘rule of threes’
may be useful.33,34 Here, one can be 95% certain that the event occurs no
more than 3/X times; for example if 500 subjects were studied prior to
marketing and the event in question was not recorded, one can be 95%
certain that the true incidence rate is 3/500 (0.006) or less. Similarly, if 3,000
subjects were exposed, then the incidence is 3/3,000 (0.001) or less.
Very many fewer patients are required to detect an ADR that has no known
background incidence compared to one that increases an existing background
incidence in untreated patients. The picture is complicated by the nature of
post-MA PV, where rare (Type B) ADRs may present themselves at any time
after embarking upon a course of therapy and accumulation of sufficient
numbers of such effects may take several years. Thus, to be useful, post-MA
PV needs to involve as many exposed subjects, recruited over as long as
possible. Even then problems may arise, depending on the study design.
Strom35 has provided statistical data on the numbers of subjects that would be
required in the most common type of pharmacoepidemiological study (a
controlled cohort study) to detect relatively rare ADRs. The interested reader
is referred to his paper for full details, but key findings are shown in Table 1.3.
Based on a prospective observational cohort study, several things are clear:

14
firstly, that the rarer one assumes the ADR to be, the larger the cohort needed
to detect it; secondly, the relationship between increasing rarity and required
subject numbers is not linear. Thirdly but not shown in Table 1.3, increasing
the number of controls in relation to the number of exposed subjects reduces
the overall number required but its contribution to the overall power of the
study is only increased by a modest amount. So cohort studies can require
very large sample sizes to study uncommon events.
ADR Incidence
rate
assumed
in controls
Relative
risk to be
detected
Control :
exposed
subject
ratio
Number
of
exposed
subjects
required
Number
of
controls
required
0.01 2 1 3,104 3,104 Abnormal liver
function tests 0.01 4 1 568 568
0.001 2 1 31,483 31,483 Hepatitis
0.001 4 1 5,823 5,823
0.0001 2 1 315,268 315,268 Cholestatic
jaundice 0.0001 4 1 58,376 58,376
Table 1.3. How ADR incidence rate and selected relative risk determines
subject numbers in a controlled, cohort study. (After Strom35)
Calculations were made assuming a two tailed alpha (type 1 error) of 0.05 and a beta
(type 2 error) of 0.1.
Summarising, Phase 3 clinical trials are of limited value in assessing the likely
ADR profile of a drug at the time of MAA because they contain patients with
precise, clear-cut diagnoses and are exclusive of ‘real word’ patients who will
receive the drug post-marketing, such as young and elderly, perhaps frail
patients, patients with more serious degrees of the disease under study,
ethnic minorities, those with relevant co-morbidities, those taking multiple drug
therapies, and those likely to display poor compliance or drug abuse; women
tend to be underrepresented. They are unlikely to contain sufficient numbers
to detect rare adverse events and most are of insufficient duration to detect

15
latent effects – it is common to see just a 30-day follow up after the final trial
dose has been given.
1.2.2 Post-authorisation ADR data
Studies in this area of drug safety employ the applied science of
pharmacoepidemiology (PE); this may be defined as ‘the study of the use and
the effects of drugs in large numbers of people or populations’.36 In essence,
PE is a blend of clinical pharmacology with a focus on enquiry into
mechanisms of drug action and epidemiology with a focus on method of
enquiry.
Post-authorisation safety studies do not suffer from the constraints described
in Section 1.2.1.2.iv above. If the drug is widely prescribed, then a much
larger number of patients will be exposed to it, in a wider range of
circumstances and doses; many of these may be outside the terms of the
original MA, but can provide valuable safety data none the less. Many
decisions to alter product labelling or even to withdraw an authorised drug
from the market place are made on the basis of safety data generated post-
authorisation. Systematic post-marketing safety (or surveillance) studies come
under the general heading of PV. The WHO definition of PV which is widely
accepted is as follows:
‘the science and activities relating to the detection, assessment,
understanding and prevention of adverse effects or any other drug related
problems’.37
The latter definition is most relevant to the study of products post-marketing.
Many countries have established PV systems for early detection and
prevention of possible drug-related morbidity and mortality. The overall aim of
any PV activity is to protect patients.

16
The quality of the safety data generated through PV studies is dependent
upon the robustness of their methodologies. The methodologies associated
with PV and their strengths and limitations are described below. While
emphasis is placed on those systems operating in the UK, reference is made
to where they interact with other national or international systems.
1.2.2.1 The Yellow Card Scheme
The Yellow Card Scheme is the main UK system for collecting information on
suspected ADRs to medicines. The scheme is run by the Medicines and
Healthcare products Regulatory Agency (MHRA) and the Commission on
Human Medicines (CHM) in the Department of Health (DoH); it has been in
operation since 1964. The scheme is a spontaneous reporting scheme.
Healthcare professionals and since 2005 patients and their carers, are invited
to report details of suspected ADRs on yellow cards, either in hard copy or by
accessing a dedicated web site. 38
The Information Management Division of the MHRA is responsible for
maintaining a computerised database of yellow card submissions called
SENTINEL. The database is searchable by product name (both generic and
brand) and by adverse reaction. Limited public access is allowed to historical
data with more detailed reports made available to healthcare professionals
and MA holders. 39
Of particular relevance to this research is the fact that in an attempt to gain
early confirmation of a satisfactory benefit to risk profile, newly authorised
products are subjected to intensified surveillance, indicated by the presence
of an inverted black triangle on all product information, including promotional
material, alerting healthcare professionals to the new product status and
therefore inviting them to report any potential ADR, irrespective of their
perception of severity. In addition to new products, the black triangle may also
be applied to new combinations of drugs within a new formulation, the

17
administration of a medicine via a new route significantly different from
existing licensed routes, and an existing drug within a novel delivery system.40
Products carrying the black triangle are monitored in this way until the
outcome of a rigorous safety / risk analysis by the MHRA indicates adequate
safety. For all other products, reporters are requested to report only serious or
unexpected ADRs, according to WHO definitions in Section 1.1.1.
Each yellow card report is subject to systematic manual review. The review
process, including the use of screening algorithms based on automatic signal
detection have been described in detail elsewhere.41,42
The advantages of the Yellow Card Scheme are that it covers all drugs
authorised for use in the UK throughout their product lives, covers use in both
primary and secondary care, is administratively simpler and less labour
intensive than cohort event monitoring (described in Section 1.2.2.4.i), and
that it is accessible by all healthcare professionals, patients and carers in the
UK. Reports are made in confidence; but to some extent information can be
exchanged with other drug regulatory authorities around the world that
operate similar schemes (see Section 1.2.2.2).
One major disadvantage of Yellow Card Scheme is under-reporting. While the
numbers of yellow cards submitted continues to rise year on year, 43 objective
study of the issue indicates that less than 10% of eligible reports are actually
yellow-carded. Inman 44 has suggested a number of reasons for healthcare
professionals not reporting, ranging from ambition to publish independently,
guilt, embarrassment, fear of litigation, through diffidence, to complacency
and even ignorance. Other disadvantages of the scheme are that the quality
of reports is variable, requiring considerable effort in follow-up, there is
insufficient capacity to handle all suspected ADRs for products other than
products carrying the black triangle and so new Type B reactions to
established products may go undetected. Furthermore, the data lacks a

18
denominator as there is no satisfactory figure for the number of patients
exposed to the drug; hence calculation of incidence is impossible.
The yellow card scheme is also prone to external influences which affect all
schemes of this nature including the length of time the product has been on
the market. Reports have been observed to peak at between one and two
years post-authorisation, as shown for NSAIDs 45 and anti-infective,
endocrine, pulmonary and cardiovascular drugs;46 followed by a decline.47
Media publicity has been associated with a marked increase in reporting, as
observed by a number of authors.48,49,50,51 Bhasin et al. 50 noticed a six-to-
seven fold increase in reporting following published descriptions of the
neuropsychiatric effects of mefloquine (Lariam) that contributed towards the
subsequent withdrawal of the product.
In the US, receipts of spontaneous reports linking fluoxetine (Prozac) with
suicidal acts increased some eight-fold after the publication of a paper
suggesting that the drug was associated with suicidal behaviour. 51
1.2.2.2 Other spontaneous ADR reporting systems
At this juncture it is appropriate briefly to mention other schemes, similar to
the yellow card scheme described above, which operate in other countries
with sophisticated healthcare systems and which use similar means of
processing, categorising and reporting safety data.
In the United States, the Food and Drug Administration (FDA) is responsible
for regulating and licensing all foods and medicines. Within the FDA, the
Center for Drug Evaluation and Research (CDER) is responsible for
monitoring drug safety, with the exception of biological products and vaccines,
which is handled by the Center for Biological Evaluation and Research
(CBER). The FDA’s MedWatch Reporting Program is a spontaneous reporting
scheme, open to practitioners and patients, which is designed to capture

19
ADRs to marketed products. Conversely, reporting is mandatory for the
manufacturer. 52 Spontaneous PV reports are managed in an electronic
database (the Adverse Event Reporting System – AERS).
Similar systems exist in many European countries including France and,
Germany and in other countries such as Japan and Australia. Individual
National systems are reviewed elsewhere. 53
Use of similar terminology and methodologies for ADR reporting in the
countries above facilitates international co-operation. A key player in this is
the WHO International Drug Monitoring Programme, based in Uppsala,
Sweden, which monitors PV operations in over 80 countries. The Uppsala
Monitoring Centre (UMC) promotes reporting and shares data through a
dedicated website and by arranging conferences on related topics. One
advantage of international collaboration is that pooled ADR data provides
increased power to detect ADR signals.54
A key correspondent with the UMC is the European Agency for the Evaluation
of Medicinal Products (EMEA). In addition to its increasing role of granting
marketing authorisations for medicinal products to be used within the
European Union (EU), the EMEA develops and maintains its own PV
database consisting of all suspected serious adverse reactions to medicines
observed in the European Community. The system, started on the 5th
December 2001, is called EudraVigilance and contains separate but similar
databases of both human and veterinary reactions. It represents a milestone
in the development of electronic exchange of PV data between member state
authorities and between regulators and companies.
1.2.2.3 Use of spontaneous reporting data to generate safety signals
The WHO International Drug Monitoring Programme describes a drug safety
signal as:

20
‘Reported information on a possible relation between an adverse event and a
drug, the relation being previously unknown or incompletely documented’. 54
Usually more than a single report is required to generate a signal, depending
on the seriousness of the event and the quality of the information. 55,56 In other
words, it is an early warning. If the ADR is rare, a small number of suspected
cases associated with a single drug is unlikely to be a chance phenomenon
and in this context, three cases are considered to be a signal and five to be a
strong signal.57
More recently, additional qualification of the WHO definition was provided by
Lindquist 58 who proposed that a signal is:
‘An evaluated association that is important to investigate further’ and that ‘a
signal may refer to new information on an already known association’.
The operational use of the term signal in PV is not uniform;59 for some the
term implies that AE reports are treated as such if they arouse the strong
suspicion of a hitherto unrecognised ADR; 60 but in the opinion of others, a
signal is:
‘a set of data constituting an hypothesis that is relevant to the rational and
safe use of a drug in humans. Such data are usually clinical, pharmacological,
pathological and epidemiological in nature’ and that: ‘a signal consists of an
hypothesis together with data and arguments’. 55
Signal identification is at the heart of PV and unsurprisingly, attempts are
always being made to enhance the process through automation (see below).
It is widely accepted that there are four key issues to be considered when
deciding whether to investigate a signal further. They are often referred to by
the acronym SNIP, the components of which are as follows: 61,62

21
The strength of the signal – whether the data for each report indicates
a strong association between the drug and the adverse effect.
Whether the information is new – i.e. the phenomenon has not been
observed before with the drug under investigation.
.
The importance of the signal, judged by the seriousness of the reaction
and severity of the cases.
The potential to intervene and prevent the reaction form recurring in
future patients.
UK regulators have developed a refinement of SNIP that takes into account
both the strength of the signal and the public health impact. The components
of the strength of signal are the strengths and weaknesses of the case series
and the biological plausibility of the ADR. The public health impact
components are: the frequency of the ADR in the population per year since
MA; the seriousness of the potential health consequences of the ADR (death
being the most serious); and the order of magnitude of the reporting rate for
the ADR in the year prior to review. This process, termed impact analysis,
allows assignment of scores to each variable and thus a means of prioritising
safety signals.63 This is represented diagrammatically in Table 1.4. Thus
those signals which end up in the top left hand box of Table 1.4 would be
given the highest priority.

22
CLINICAL EVIDENCE
Strong Weak
Major A high priority;
further evaluation
required
No need to
gather more
information
PU
BL
IC H
EA
LT
H
IMP
LIC
AT
ION
S
Minor Low priority for
action
No action
warranted at
present
Table 1.4. Impact analysis of safety signals based on spontaneous
reports. (After Arlett et al. 63).
The main factor(s) influencing a particular decision will be governed by the
source of the ADR reports. Factors influencing the initial assessment of a
possible hazard are listed in Table 1.5. The top half of the table concerns the
assessment of spontaneous or case reports and the shaded portion
summarises factors considered when assessing a signal from formal clinical
trial data. One common element is the assessment of causality. For a
comprehensive description of how the strength of the association may be
measured, see Shakir 64 and Naranjo et al.65
The reader will appreciate that all of the considerations listed in Table 1.5
require the exercise of clinical judgement and personal experience of the
assessor. Spontaneous reports are screened qualitatively by expert medical
reviewers within pharmaceutical companies and regulatory agencies.
Evaluators rely on convincing clinical criteria and event frequencies to identify
potential signals. This method relies on the skills and knowledge of the
reviewer but signals may be missed because of an assessor’s inability to
define complex multidimensional patterns in the data, fatigue if large numbers
of reports are to be screened, and the presence of truly unexpected
‘signals’.66,67

23
Evidence available Underlying issue
Cases themselves
Individual assessment of strength of
association: e.g. temporal relationship, effect
of dechallenge / rechallenge, alternative
causes (e.g. concomitant medication,
coexisting disease), plausible mechanism.
Causality
Quality and completeness of case reports. Documentation
Number of cases in relation to usage.
Frequency / reporting rate
Severity of reactions
Seriousness of hazard
Implication for patients and public health
Pre-clinical studies
Clinical trials
Epidemiological studies
Possible class effects
Existence of other evidence that may support
or refute the signal.
Possible explanations for formal trial data
Chance Levels of statistical significance and study
power
Precisions and specificity of tests
Bias How were patients allocated to treatment
groups?
Confounding Factors other than drug treatment which
might differences between groups
Steps taken to control for confounding
variables (e.g. concomitant diseases /
therapies, matching of subjects)
Causal As for causality above
Table 1.5. Factors influencing the initial assessment of reports
constituting a potential safety signal. Shaded areas are particular
considerations for formal clinical trial data. (After Waller and Tilson62)
Individual case review is still a fundamental ingredient of all PV activity and
plays a dual role in signal detection. The initial expert review will identify
interesting index cases for further, more complex searching and also provide

24
a framework for causality assessment to be performed on further cases
identified by more complex searching.68,69
With the ability to handle and cross reference vast quantities of data
electronically has come the capacity to enhance this traditional technique
through automated signal detection.69,70
At present there are three signal detection methods in general use; all rely on
the availability of an accurate and current means of coding ADRs, such as
MedDRA . The latter is a structured thesaurus of medical terms that has been
adopted as an international standard for exchange of PV information in most
countries engaging in the activity, including Eudravigilance, the US, and
Japan.71,72,73
The Proportional Reporting Ratio is the simplest of these methods and the
easiest to understand.74 This relates the proportion of ADRs for the drug in the
cohort of exposed subjects with the proportion of that event in all other
subjects in the database. As the PRR becomes increasingly greater than 1,
that statistical association between the drug and the ADR in question
becomes more certain and hence the strength of the ‘signal’ increases. This
technique is used by the UK MHRA and the UK Drug Safety Research Unit
(DSRU).
The two other signal generation techniques rely on the application of
Bayesian statistics and take account of the variability of data. Both have
interfaces with commercially available software allowing sophisticated
graphical presentation enhancing signal visualisation. One method – the
Bayesian Confidence Propagation Neural Network (BCPNN) is used by
several pharmaceutical companies and the WHO Centre for International
Drug Monitoring in Uppsala, Sweden to provide signal alerts to regulatory
authorities and manufacturers.67,75 The other – the Multi-item Gamma
Poisson Shrinker (MGPS) is used by the US FDA. 76,77

25
Despite intense interest in these techniques,78,79 none is perfect; and there is
wide agreement in PV circles that they will, at best, in the short to medium
term future, provide support for the traditional methods of rigorous clinical
assessment.80
Once a signal is confirmed the same SNIP criteria (see above) can be used to
help decide how to proceed. For example, if the signal involves cases of
fatality or hospitalisation, then more serious (and rapid) interventions will be
made than if the ADR is mild and self-limiting. Other factors considered are
the frequency of occurrence, preventability, severity of the disease being
treated and the benefits accrued by using the drug and the availability of other
treatments.
1.2.2.4 Post-authorisation epidemiological studies
Several methodologies fall into this category. In general, they provide the
most informative source of quantitative information on ADRs in the post-
authorisation period.
1.2.2.4.i Cohort studies
Such studies identify subsets of a defined population and follow them over
time, looking for differences in their outcome. Cohort studies are generally
used to compare exposed patients to unexposed patients with subsequent
events recorded and compared. This technique was used to investigate the
potential link between the MMR vaccine and autism. The rate of autism in a
vaccinated group was compared with the rate in an unvaccinated group and a
figure for the relative risk of autism calculated. 81
1.2.2.4.ii Case-control studies
These studies compare patients with a disease to controls without a disease,
looking for differences in previous medicine exposures. A significant excess of
exposures to the suspect drug in the case group suggests that there may be
an association with the drug. Once the hypothesis had been raised that

26
aspirin was implicated with Reye’s syndrome, the association was confirmed
by several rigorous case-control studies.82 The value of case control
methodology in PV has been thoroughly reviewed by Rosenberg et al.83
1.2.2.4.iii Prescription event monitoring (PEM).
The best example of such schemes is that run by the Drug Safety Research
Unit (DSRU) in Southampton, an Associate College of the University of
Portsmouth. Green cards are used to gather event data on selected, recently
marketed products of interest. In a typical study, details of the first 30,000
prescriptions are obtained from the UK National Health Service (NHS)
Prescription Pricing Division (PPD) and six months after the initial
prescription, prescribers are sent a Green Card questionnaire asking for
details of any significant health-related events occurring during or after patient
exposure to the drug. No suspicion that the event was an ADR is required.
The collected PEM data contains details of the patient, duration of therapy
and any notable events. Collectively, the data can provide an estimate of
event incidence because the number of patients receiving the drug is known.
The scheme can be described as a non-interventional cohort design. To-date,
the DSRU has details of in excess of 5.4 million prescriptions in 93 completed
PEM studies with a median cohort of 11,543 patients.84
As with the Yellow Card scheme, report data is entered into a database that
can be interrogated on a number of levels to reveal patterns of ADRs that
might indicate a safety signal. The additional data gained through PEM also
allows the calculation of incidence over different time periods of drug
exposure and the comparison of rates of reporting of a particular event with
others for the same drug, or the same event reported with another drug or
drugs, or with all other drugs in the database.
Additional advantages of PEM are that reactions can be characterised in
relation to age, sex, pregnancy status and duration to onset. Other relevant
data such as weight, co-morbidity, and co-administered drugs may enable
other risk factors for the development of ADRs to be determined.

27
Disadvantages of the green card scheme are that it is labour intensive,
studies only primary care (general practice) use and is limited to a minority of
newly authorised products in the UK.
Despite these limitations, PEM has been instrumental in providing important
safety data on a range of newly marketed drugs, revealing higher than
expected levels of oesophagitis with alendrolate,85 cardiac arrhythmias with
sertindole,86 and visual field defects with lamotrigine.87 Counterparts to the
green card scheme are evident in Japan88 and New Zealand.89
1.2.2.4.iv General Practice Research Database (GPRD) and other health
registers
The GPRD is the world's largest computerised database of anonymised,
longitudinal medical records from primary care that is linked with other
healthcare data. It operates as a discrete division within the MHRA. Currently
data are being collected on over 3.6 million active patients (of approx.13
million in total) from around 488 primary care practices throughout the UK,
covering approximately 5% of the UK population. It is the largest and most
comprehensive source of data of its kind and is used worldwide for research
by the pharmaceutical industry, clinical research organisations, regulators,
government departments and leading academic institutions. 90
The GPRD Division provides data, research and other services as well as
tools to support medical and public health research in a variety of areas
including drug safety. The database allows the execution of case-control
studies, and can provide estimates of relative and absolute risk. Examples of
productive use of this facility in PV include the assessment of risk of incident
diabetes associated with antipsychotic medication 91 and the association
between the use of NSAIDs and myocardial infarction.92
A similar scheme is maintained by the University of Dundee in collaboration
with the Scottish NHS. The Tayside Medicines Monitoring Unit (MEMO)
database has facilitated a range of studies to identify and quantify ADRs in
primary care. The use and outputs from MEMO are described by Wei et al.93
The data can be interrogated in a range of approaches, including case-control
and cohort, and a variety of custom epidemiological, economic, outcomes,
genetic and drug utilisation studies can be performed.

28
Other record linkage databases covering a range of topics, including
population-based registers of birth defects, childhood immunisation, medicine-
induced cardiac arrhythmias, ocular side effects, and clozapine-associated
agranulocytosis are available in other countries, as described by Arlett et al.63
A useful review of a wide range of automated databases which can be
employed in pharmacoepidemiological studies, is provided by Strom.94
1.2.2.5 Other safety data generated post-authorisation
Once a product has gained a MA, it should only be prescribed within the
indications and terms of that authorisation. It is likely that on-going clinical
trials perhaps intended to generate data for an authorisation extension to
other indications or in other patient groups, might also yield important safety
data. In addition, the marketing authorisation holder is charged in law, with
maintaining effective PV and reporting systems on all its marketed products
in-house. Such in-house schemes will include monitoring the literature for
published case reports.
1.2.2.5.i Published case reports
In the ADR context, published cases are usually highly detailed reports of a
single patient or a limited series of patients, exposed to a medicine and
experiencing a particular adverse outcome. They are useful for raising
hypotheses about the effects of medicines that can be tested with more
rigorous study designs. They have been vital in alerting healthcare
professionals to the possibility of serious ADRs. 95,96,97 On their own, they are
usually insufficient to establish a causal association because they are prone
to bias, mistaken assumptions and subject to a range of confounding
influences. Furthermore, there is no comparison group or control which is not
exposed to the drug to allow for a quantitative estimate of risk.
1.2.2.5.ii Periodic Safety Update Reports (PSURs)
A PSUR is defined as an update of the worldwide safety experience of a
medicinal product made to competent authorities at defined times post-
authorisation. As part of its on-going legal commitment to PV of its products,

29
the MA holder must prepare PSURs and make them available to the
authorising authority; to do otherwise is a serious offence.98 PSUR content
must be comprehensive and include cumulative data in addition to new
clinical trial data, spontaneous reports received by the company though its
marketing or medical information divisions, and its affiliates, data from
spontaneous reporting schemes – both UK and wherever the drug in
marketed - and where applicable, prescription event monitoring, during the
period since the previous PSUR. The fruits of monitoring the recent world-
wide medical literature should also be included .The PSUR must be supplied
to all ‘interested’ regulatory authorities; so for products authorised by the
central process, this means all EU member states and the EMEA. For other
products, all member States where the product has an MA will suffice.
PSURs are routinely requested every six months during the first two years
after product authorisation, then annually for three years and thereafter every
five years; thus demonstrating a legal commitment to monitor safety
throughout the life of the product.98
1.2.2.5.iii Company sponsored post-MA safety studies
As indicated in Section 1.2.2, post-marketing surveillance is required to
confirm the safety profile of a new product and allow study of safety in a much
larger and more diverse patient population than that available in pre-MA
clinical trials. Spontaneous reporting (see Section 1.2.2.1) is the backbone of
such operations; however specific studies may be carried out to achieve any
of the following:
identify previously unrecognised safety issues;
investigate possible hazards predicted in normal use and
identify new ones;
confirm the expected safety profile; and
quantify established ADRs.
Such studies may be particularly useful where there is uncertainty about the
safety profile or the clinical relevance of toxicological effects seen in animals

30
or where there is a specialised use requiring close monitoring, for example in
an intensive care situation. The responsibility for conducting these trials
usually lies with the MA-holder.
1.2.3 Risk management plans
At authorisation, the regulator believes the risk versus benefit balance to be
sufficiently favourable to allow prescribing within the terms of the SPC;
however, that is just the beginning of an on-going assessment as further
evidence of safety is accumulated. At the time of MAA, applicants must
submit a risk management plan.99,100 This should include identification and
on-going exploration of known side effects, drug interactions and types of
patient who may receive the drug but who have not been included in clinical
trials to date (the so-called ‘safety specification’). The applicant must also
detail additional research strategies needed to define potential harm
(pharmacovigilance) and how the company intends to limit the risks, including
restricting access to at-risk groups (risk minimisation). Such a plan may be
submitted or requested by the Regulatory Authority at any stage after
authorisation, for example when a new safety signal is detected or the MA is
varied to include a new indication or dosage form. The responsibilities of both
the MA holder and the regulatory authority are discussed further in Sections
1.3.5 and 1.3.6.
1.3 Current UK Regulatory Framework for authorising medicines
Marketing authorisation procedures vary around the world, but have many
features in common. In essence, if a company wishes to market a product, it
must submit a dossier containing quality, safety, efficacy and increasingly,
pharmacoeconomic data to the appropriate regulatory body for the country
where the medicine will be sold.
Each regulatory body has its own submission and approval processes. The
reader is referred to excellent reviews of current practice.101,102

31
Product authorisations within the UK are linked to a great extent with those of
other European Union (EU) countries; therefore the European procedures are
reviewed below, with particular emphasis on the role that safety data plays
prior to authorisation. There are four types of licensing application in the EU,
depending on the nature of the active ingredient of the medicinal product and
the number of member states in which the product will be marketed.103,104,105
Drugs can be authorised for use in the UK via the European Medicines
Evaluation Agency (EMEA) or through the Medicines and Healthcare product
Regulatory Agency (MHRA). These routes were introduced on January 1st,
1995 in the EU as the ‘Future Systems’ legislative package in an attempt to
facilitate and streamline market authorisations in EU member states. These
processes have thus been operative throughout the entire length of the
current research project.
1.3.1 National procedure
A company may make a MAA to the regulatory authority of a single member
state; in the UK, this is the MHRA. Legislation relevant to PV for Nationally
authorised products includes Directive 2001/83 (Articles 101-108) and
75/319/EEC, and local provisions. Dealing with PV signals indicating a
product safety concern is the responsibility of the national authority under
national legislation.
1.3.2 The EU centralised system
This system was introduced with the passage of European Council Regulation
(EC) No. 230/93. Legislation relevant to PV for centrally authorised products
includes Regulation 2309/93 (Articles 15, 18, 19-26, 51). Coordinating the
consideration of drug safety issues is done at European level through the
EMEA upon advice from the Committee for Proprietary Medicinal Products
(CPMP) even though the alert may originate from just one member state.

32
Since 1995, the centralised system has been obligatory for biotechnology
products such as gene therapies (so-called Part A products) and new
products for the treatment of AIDS, cancer, neurodegenerative diseases,
diabetes and orphan drugs. Drugs processed via this route have a longer
period of exclusivity (10 years) compared to those going via the decentralised
system (8 years). These periods are important from a PV point of view
because they allow focus on real-world use of single brands, for longer, as
opposed to a plethora of generic copies. A rationale for having a single
centralised procedure for authorisation and subsequent safety monitoring of
these products is that due their nature, many have common characteristics
that might lead to ADRs in man – for example, the ability to sensitise, transmit
infectious disease, trigger the release of a range of inflammatory mediators or
stimulate neutralising antibodies leading to a decreased response.
Products authorised through the centralised procedure are granted marketing
authorisations that cover all EU Member States and the European Economic
Association (EEA). Coordination of the process is the responsibility of the
EMEA and the assessment of submitted evidence is carried out by the
Committee for Human Medicinal Products (CHMP).
1.3.2.1 Nature of data submitted for a MAA through the centralised
procedure.
Information is submitted in the form of a Common Technical Document (CTD),
introduced to facilitate harmonisation of the registration of medicinal products
in the EU, the US and Japan. The CTD is comprised of five modules, as
follows:
Module 1: Administrative and prescribing information;
Module 2: Summaries and overview;
Module 3: Information on product quality;
Module 4: Non-clinical study reports; and
Module 5: Clinical study reports.

33
As far as safety data is concerned, Module 2 must contain overviews of the
non-clinical and clinical aspects of the product, including a review of
anticipated side effects and drug interactions. These are discussed further in
Modules 4 and 5.
1.3.2.2 Centralised procedure: assessment outcome
If the assessment is favourable, the EMEA makes a recommendation to the
European Commission (EC), which after consultation with its Pharmaceutical
Standing Committee, is the final arbiter on the decision to issue a MA. Apart
from local information such as legal status, price and reimbursement
arrangements, the details of the newly authorised medicinal product, including
the side effect profile, should be identical in all Member States. Once the MA
has been granted, it remains valid for 5 years after which time the licence can
be renewed on application by the MA holder.
1.3.3 Decentralised system
Legislation pertinent to PV for products authorised though the decentralised
system include Directives 2001/83 (Articles 1, 101-108) and 75/319/19/EEC
plus local member state provisions. Here, the same MAA is submitted
simultaneously to a number of member states and one state takes the lead in
the assessment. Under this system the CHMP co-ordinates the evaluation of
submitted data, but does not take any part in the decision-making process
unless there is disagreement between member states.107 PV issues are
managed by the CHMP which facilitates the exchange of safety information,
including alerts between member states, the EMEA and MA holders.
Following receipt of a MAA, the CHMP contracts one EU member state to
assess the application. The contracted state is termed the reference member
state (RMS) which then reviews the quality, safety and efficacy data. In the
UK, the agency that evaluates the application under this system is the MHRA.
The company applying for a MA has the right to choose which RMS will

34
evaluate its product. The RMS is contracted to complete its task within 210
days.
Once the RMS has issued a national MA, other selected member states have
90 days to recognise the approval. These other countries may raise
objections if there are concerns about safety, or major scientific or public
health issues.
1.3.4 The mutual recognition procedure
Where the applicant has an existing authorisation in one member state, they
can apply under the mutual recognition procedure for authorisation in other
member states; as above, the member states can rely on the assessment
made in the original member state and accept it as the basis for their own
national decision.108
The mutual recognition process is open to all medicinal products except those
approved by the centralised procedure and homoeopathic medicines. All
authorised medicinal products currently available in the UK have received
MAs (formerly Product Licences) through the decentralised procedure unless
they received an MA through the EU centralised system.
1.3.5 Content of a Marketing Authorisation Application (MAA) dossier
with emphasis on safety data.
The MAA is assessed by medical, pharmaceutical, scientific and statistical
assessors. Whatever the procedure, the MAA is virtually the same. It is
divided into four parts which match closely the ‘Modules’ required for the CTD,
described under the EU centralised system described above:
Part 1: A summary of the most important parts of the application;
Part 2: Data supporting product quality;

35
Part 3: Data supporting pharmacotoxicological properties of the drug
and
Part 4: Data supporting the clinical aspects of the product.
1.3.5.1 Part 1: Data summary
As far as ADR and other safety data are concerned, Part 1 contains the
Summary of Product Characteristics (SPC), listing warnings, precautions and
anticipated side effects at the time of the MAA, and the proposed Patient
Information Leaflet. Individual expert reports are also included on
pharmaceutical aspects of quality, preclinical and toxicological data, and the
clinical documentation, which includes a discussion of Phase 1-3 clinical trials
and any additional safety studies. The SPC is a key document, enshrined in
law; 109 once granted, it cannot be amended without the approval of the RMS.
By the same token, if new safety data (a signal) is discovered by the RMS
post-MA, that it feels warrants intervention, it may request an SPC update that
should apply to all countries marketing the product. Key sections that might be
amended are:
Section 4.1 Therapeutic indications Indications may be limited to those groups deriving greatest benefit and excluding those at greater risk of the ADR.
Section 4.2 Posology (dosing) and method of administration
Dose and / or dose range may be limited to avoid the use of high doses in specific groups, e.g. in elderly or very young patients. Duration of therapy may be curtailed to avoid lengthy exposure.
Section 4.3 Contraindications
Addition of groups of patients in whom the risks of drug use clearly outweigh the anticipated benefit, for example, pre-existing organ impairment.
Section 4.4 Special warnings and precautions for use
Addition of patient groups or diseases where the risk versus benefit analysis must be made with special care. Additional or amended requirements for monitoring patients may also be included.

36
Section 4.5 Interactions with other medicinal products and other forms of interaction
Concomitant drugs, herbs, dietary supplements or foods that have been shown to interact, producing adverse effects. Advice on careful prescribing and monitoring may also be included.
Section 4.6 Pregnancy and lactation
New information about effects on the mother, foetus or neonate.
Section 4.7 Effects on ability to drive and use machines
Any evidence that the drug impairs cognition, awareness or causes drowsiness, including the potential for these to be enhanced by other medicines.
Section 4.8 Undesirable effects
Addition of newly recognised ADRs and new information on the nature, frequency, mechanism, severity and management of those already listed.
Section 4.9 Overdose
ADRs associated with overdose, including management and monitoring advice.
Section 5.3 Preclinical safety data
New data which shed light on any new ADR with relevance for detection, monitoring and management may be included here.
Legal category
Legal status may change, e.g. from P (Pharmacy Only Medicine) to POM (Prescription Only Medicine), depending on restriction to prescription-only use due to the severity of the ADR and the need for closer medical monitoring.
Parts 3 and 4 of the MAA will contain the detailed pre-clinical toxicological and
clinical trial data (including exhaustive analysis of side effects noted in clinical
trials) respectively.
1.3.5.2 Part 3: Pharmacotoxicological studies
Part 3 summarises all relevant, current knowledge in the following areas:
toxicity (both single and multiple dose studies);

37
reproductive function;
embryo-foetal and perinatal toxicity;
mutagenic potential;
carcinogenic potential;
pharmacodynamics;
pharmacokinetics including metabolism, and
local tolerance, depending on the intended administration route,
for example, the eye, ear or skin.
Consideration must be given to, among others, the mammalian species
chosen; at least two species should be included, one of which is non-rodent
and one which produces a response close to that expected in humans. The
animal gender, strain, dose ranges chosen, dose frequency, route of
administration, formulation, duration of exposure, frequency and nature of
observation after dosing and comparisons to baseline, and the use of controls
and autopsy.
Interestingly, there is international agreement that a ‘minimum number of
animals to show the required effects’ should be used’.101 As with human data
(see below) this almost certainly means that rare, Type B reactions are
unlikely to be discovered (or recognised) in preclinical toxicological studies.
There is however a requirement that some animals should be retained post-
study ‘to see whether any toxic effects are reversible’ and also presumably, to
observe for latent side effects. Particular mention is made of the need to
conduct ‘immuno-interference’ studies by examining the spleen, thymus and
lymph node tissue at autopsy.
Biotechnology products, such as hormones, growth factors, cytokines,
cytotoxins, antibodies and vaccines should all be tested as above; however,
some are species-specific (e.g. human interferon) and may have little relevant
effect in other species; hence the need for a wider range of tests and flexibility
when using existing ones for this type of product.

38
Biotechnology products are likely to illicit an immunological response, and
particular effort should be made to monitor for the appearance of antibodies
and immune complexes, including binding of monoclonal antibodies to non-
targeted tissues, their effects and time-course. Clearly immunoreactivity
testing is important, but the animal species chosen for all tests should be
carefully selected, perhaps on the basis of showing a response to a molecule
of the same class in a previous test or where no response is apparent at
‘normal’ doses, expanding the dose range.
1.3.5.3 Part 4: Clinical studies
All human data on the use of the drug appears in this section. The safety of
the product will be considered largely on the evidence presented here but
also, in relation to the risk of the illness(s) for which the treatment is intended
and the risks associated with other drugs authorised for the same purpose.
Data in Part 4 is included under the following headlines:
pharmacodynamics;
pharmacokinetics;
clinical trials;
post-marketing experience; and
published and unpublished experience.
The legislation and guidelines covering the content of Part 4 are reviewed
elsewhere.101 Suffice to say that there is a wide number of guidelines
pertaining to clinical trials in general (e.g. design, ethics, conduct and
reporting), clinical trials for specific diseases (e.g. HIV infection, schizophrenia
and asthma), and trials in specific patient groups (ethnic groups, children and
the elderly). Most clinical trial activity is now covered by the European Clinical
Trials directive (2001/20/EC)109 which was introduced to establish
standardisation of research activity in clinical trials throughout the EC. The
Directive was transposed into UK law as the Medicines for Human Use

39
(Clinical Trials) Regulations 2004 (SI 2004/ 1031) which came into force on
1st May 2004.110
The Directive guidelines are intended to ensure harmony in the presentation
of data within the EU, the US and Japan; therefore clinical trial data including
safety data, generated according to the guidelines should be acceptable in all
three economic areas. In addition, data should also be acceptable to
Australia, Canada, Nordic Countries and the WHO, who have all had input
into the Directive.111
There is a requirement that the protocol for a clinical trial should have a
specific section devoted to the specification of safety parameters, methods
and timing for assessing, recording and analysing safety parameters,
procedures for reporting AEs and the type and duration of follow-up of
subjects experiencing an AE.
1.3.5.3.i Responsibilities of the MA applicant regarding ADR reporting in
clinical trials.
Three International Conference for the Harmonisation (ICH) documents are of
particular relevance to ADR reporting are Document E2A,112 providing
definitions and standards for expedited reporting, E2B,113 defining the data
required for transmission of individual case reports and E2C,114 specifying the
format, standards and timelines for reporting in PSURs.
There are strict rules for reporting ADRs occurring in clinical trials, set down in
EU guidelines.112 For example, all serious ADRs occurring during a clinical
trial should be reported to the MHRA and the Eudravigilance database within
7 days if fatal or life threatening and within 15 days otherwise. Reports must
also go to the trial investigators and the Independent Ethics Committee (IEC).
If the trial is multicentre, then all sites should be notified as above.
The legal basis for UK PV is defined by EU Council Regulation (EEC) no.
2309/93, Commission Regulation (EC) No. 540/95 and Council Directive

40
75/319/EEC, which indicate that the MA holder and the relevant Regulatory
Authority should put systems in place to collect, collate and evaluate
suspected ADRs. Systems should be in place to prevent duplication, maintain
confidentiality and maximise the quality of the safety information. The process
is described in fine detail elsewhere.101,112
1.3.5.4 Responsibilities of the MA holder regarding ADR reporting
The responsibilities of the MA holder are as follows. A Qualified Person (QP)
for PV must be employed,115 who is either a medic or has immediate access
to a medically qualified employee. The QP must establish and maintain an in-
house system capable of capturing all suspected ADR reports made to any
company employee and making these available at a single point within the
EU. The QP is also responsible for preparing various ADR reports such as
case reports and clinical trials (published or otherwise), PSURs, post-MA
study reports and ongoing PV reports, required for the risk versus benefit
assessment of the product.
If the MA was granted through the mutual recognition process each national
regulator where the product is marketed must have a PV system in place for
the product. The reference member state (the state where the MA was
evaluated and first granted) usually takes the lead in PV activities including
the evaluation of reports from other countries.
If the product was approved via the centralised procedure, the EC is the
legally competent authority and monitors product safety under the aegis of the
EMEA. The CHMP in association with an appointed Pharmacovigilance
Working Party evaluates the evidence for centrally authorised products; the
latter acts as a forum for exchange of information between concerned
member states on PV issues.
Whatever the PV system, all suspected ADRs, whether from healthcare
professionals reporting under a spontaneous reporting scheme, post-MA

41
clinical studies or the worldwide literature, should be reported. Even if the MA
does not agree with the assessment of association between the drug and the
ADR, it must be reported to the relevant regulatory authority. All serious
suspected ADRs reported to the regulator must be followed up and validated.
So-called ‘expedited’ reports should be made for both serious unexpected and
expected events in all EU member states. Non-serious reactions do not need
to undergo expedited reporting. All reports should use internationally
recognised terminology (MedDRA: Medical Dictionary for Regulatory
Activities) and electronic transmission of data between the MA holder and the
regulator, and vice versa, is recommended.
In addition to spontaneous reports, the EMEA requires individual marketing
authorisation holders to submit all received adverse reactions, both from
within and outside the EU , in electronic form and to timelines stipulated in
Volume 9a of the Rules Governing Medicinal Products in the European
Union.116
If the MA holder believes that the reported ADR(s) have a serious impact on
the product safety profile defined in the MA, this should be indicated on the
report form and, if deemed appropriate by the MA holder and the regulator,
the SPC may be amended or the product withdrawn. Similarly, if during the
ongoing monitoring of PV reports the regulator detects a new link between a
serious ADR and the product or the severity, nature and frequency of
documented reactions suddenly changes, then it too may approach the MA
holder to make changes to labelling.

42
1.3.6 Pharmacovigilance responsibilities of the MHRA
The MHRA is the regulatory authority for medicines in the UK and is
accountable to ministers in the Department of Health who comprise the
‘Licensing Authority’. It was formed in 2003 from the merger of the Medicines
Control Agency (MCA) and the Medical Devices Agency (MDA). The role of
the MHRA is to ensure that medicines available on the UK market are of the
highest standards in terms of safety, efficacy and quality. When applying for a
UK MA, a pharmaceutical company will submit a file to the MHRA, or the file
will be received via the EMEA if the application is via the EU (see above). The
main advisory body is the Commission on Human Medicines (CHM) which in
2005, amalgamated the Medicines Commission and the Committee on Safety
of Medicines (CSM); the European equivalent is the CHMP. The CHM will
review the application and produce an independent assessment. The CHM
will either recommend an authorisation be granted, accept the application
subject to modifications or reject the application with reasons. The MHRA
frequently employs advisory bodies consisting of independent specialists in a
position to comments on particular aspects of an MA, including safety. 117
The mission statement of the MHRA is to safeguard public health by
controlling medicines. In addition to reviewing MAAs and granting MAs, the
MHRA is responsible for PV and is required to consider and if necessary take
action, when ADRs occur with authorised medicinal products. The MHRA
provides advisory support for the Medicines Commission – another section of
the Department of Health, which advises the Licensing Authority about
decisions affecting the marketing status of individual products, based on
quality, efficacy and importantly in the context of the present research, safety.
Within the MHRA, the post-licensing division is responsible for PV, MA
renewals or variations, legal reclassification, product information and
advertising monitoring – all of which have a strong drug safety element.

43
PV covers the suspected ADR reports received through the Yellow Card
scheme (described in Section 1.2.2.1), the PSURs and other data received
from MA-holder, post-MA studies, published literature, information from other
regulators (e.g. the WHO monitoring database in Uppsala and Medwatch in
the US) and record linkage databases (also described in Section 1.2.2.2).
The rules for PV systems within the UK are governed largely by EU law 109-118
enacted in various strands of legislation under the Medicines Act 1968. A
specific Clinical Trials Directive governs the conduct and PV activities in
clinical trials, both pre- and post-MA.109,110
A review of the nature of safety information available to authority assessors
post-authorisation is given in Section 1.2.2. In contrast to pre-authorisation
data, this accumulates slowly over time, depending on the PV sources used to
gather it.
The safety profile for drugs newly introduced onto the market is never totally
defined because until marketing, they have been studied only in relatively
small and homogenous patient groups. The complete safety profile of a new
drug will be defined only after it is used in the real prescribing world.
From the perspective of product regulation, both the MHRA and the
manufacturer are committed legally to conducting post-marketing PV studies.
The nature of these studies is described in Section 1.2.2, and the function of
the regulator is described below.
Safety data from a variety of sources is monitored on a regular basis by
clinicians, pharmacists, information technology specialists and other scientists
to detect potential safety signals in the accumulating data. Such signals have
had an important role in subsequent regulator decision making. Once a
potential signal is seen, a case conference is held to decide the next step in
the PV procedure. This may or may not involve the manufacturer, especially if
the signal is of a mild effect without significant patient morbidity. At this stage
it may be decided that a watching brief should be maintained on this and
similar effects over a longer period of time; however ultimately, if the signal is

44
considered sufficiently strong or severe, discussion will be held between the
MHRA and the manufacturer to decide what risk management strategies
might be adopted. Options include one or a combination of the following:
strengthening the warnings and precautions, contraindications, drug
interactions, dosage, indications or side effects sections of the product
SPC;
changing the prescribing advice or insertion of a ‘blue box’ warning in
the standard reference text the British National Formulary (BNF);
restricting the indications or dosing in the SPC;
sending a ‘Dear Healthcare Professional’ letter to all doctors and
pharmacists; and
publishing a specific monograph on the topic in the MHRA publication
‘Drug Safety Update’.118
Ultimately, if the signal represents a serious ADR and alters the overall risk
versus benefit assessment to an unacceptable extent, the product may be
withdrawn along with its marketing authorisation or suspended pending further
data collection or analysis. The decision to suspend is rare, but on occasions,
can allow the accumulation of more safety data through further clinical trial or
other post-suspension investigations or a more thorough, re-evaluation of
existing data.
Clearly, such decisions have potential to impact not only patients but
prescribers and the MA holder itself and they should only be taken after a
thorough risk versus benefit analysis.
1.3.7 Risk versus benefit analysis
The whole purpose of monitoring for ADRs is to provide information that can
be used to establish the balance of benefit derived from a medicine compared
to the risks of harm to the patient from its use. The overall aim of any such
analyses should be to protect patients. The assessment of risk versus benefit
balance should be ongoing as data is accumulated.

45
The term risk-benefit ratio implies the use of figures to establish the true
balance between the potential for a medicine to cause harm or good.119 The
term risk benefit analysis encompasses more than the calculation of figures
and more accurately describes the processes adopted by PV scientists to
review safety data.120 Formal analysis can only be undertaken with well-
controlled clinical trial data. Less robust data will dictate the use of less robust
methods, such as comparative analysis; for example where similar drugs are
compared, and efficacy levels for each are known. Judgemental analysis is
probably the most common method adopted for individual case reports or
case series. This is where the total case data is reviewed by a person or
persons with clinical insight; the drawback being that when a decision is made
it is difficult to say which details have been given high priority over others. As
Rawlins suggests,120 such judgements will depend on training, clinical
experience, subjective bias, degree of background exploration and the time
available in which to make the analysis.
As indicated previously, risk versus benefit analysis is the duty of both the MA
holder and the regulator post-MA. Exploration of risk versus benefit should
take place throughout the life of a medicinal product; however in reality there
are a number of key opportunities for formal evaluation. On receipt of the
MAA, the regulatory authority will review the animal and clinical safety data,
expecting studies to have explored rigorously, the likely toxicological hazards
to man during therapeutic use. As explained in Section 1.2.1, there will
probably be insufficient safety data on which to base a robust analysis.
Further safety data will accrue as the drug is prescribed under ‘normal’ use
conditions, in the form of spontaneous reports, published case studies and the
long-term follow-up of established or new clinical trials with the product. The
nature of post-marketing safety data that is likely to be available is described
in Section 1.2.2. At this stage, the integrity of any risk-benefit analysis will
depend on the diligence of the regulator in receiving, recording and pursuing
such data, the frequency of in-house safety reviews and on the sophistication
of its data handling systems. The latter may automatically raise a signal
detection alert which warrants further investigation. The same applies to the

46
MA holder; although it may also consider the impact of risk on itself and its
competitors, and pressure from parliament, media or pressure groups. For the
MA, key risk-benefit analyses will take place during the preparation of
successive PSURs or when an ADR ‘signal’ appears.
Clinical judgment and experience are required to decide whether the profile
has been sufficiently distorted to warrant a change to product labelling.
Greater levels of risk may be allowed for chronic diseases where drug use is
associated with an appreciable improvement in quality of life or where the
drug is used to treat a life-threatening illness. Alternatively, moderately
increased risk may be unacceptable where there are alternative treatments of
comparable efficacy, where the threat of experiencing the ADR leads to poor
patient compliance, where large numbers of patients will be exposed to the
drug and the cost of managing the ADRs is unacceptable, or where the drug
is used for prophylaxis (e.g. vaccines).
A robust methodology for risk benefit analysis that can be followed by all has
been suggested by Arlett;121 the key elements are shown in Table 1.6.
1. Description of the target disease (ADR)
2. Description of the populations being treated
3. Description of the purpose of the intervention
4. Documentation of alternative therapies and their risks
5. Evaluation of the degree of efficacy
6. Evaluation of the type of risk
7. Risk quantification and identification of risk factors
8. Impact of the risk on individuals and populations
9. Comparison of risks and benefits with other or no treatments
10. Consideration of risks and benefits by indication and population
11. Judgement on the balance of benefits and risks and ways to maximise
the former whilst minimising the latter.
Table 1.6. Arlett’s proposed elemental risk versus benefit assessment.121

47
1.4 Impact of ADRs
From the foregoing, it is clear that despite strenuous attempts to prevent
ADRs, through both the authorisation and subsequent PV systems, they
cannot be prevented completely. Indeed, by their essentially unpredictable
nature, Type B reactions will always occur.13,14 It is worth examining their
impact because such analyses are informative when it comes to dissecting
regulatory decisions already made on safety grounds and those that might be
made in the future. There are three aspects: the impact on the patient, the
impact on cost of patient care and impact on the manufacturer; in many cases
they are inextricably linked. While most data is presented for the UK, many of
the most extensive studies have been conducted elsewhere and are
mentioned here for comparison.
1.4.1 Impact of ADRs on morbidity and mortality
During the last few decades a number of studies have demonstrated that
medicine-induced morbidity and mortality is a major health problem which is
beginning to be recognised by health professionals and the public.
1.4.1.1 Hospital admissions due to ADRs
An early study in the US indicated that ADRs resulted in 300,000 admissions
for elderly patients per annum.122 Table 1.7 summarises the results of several
studies of ADRs in patients admitted to hospital.

48
Study Type N Weighted
mean
(%)
95%
CI (%)
Range
(%)
Death
(%)
Einarson 123 Meta-
analysis,
49 studies
69,188 5.1 4.4-5.8 0.2-
21.7
0.2
Wiffen et al. 124
Meta-
analysis,
37 studies
133,471 3.1 3.0-3.2 NR NR
Pirmohamed
et al. 125
Single site,
prospective
18,820 6.5 6.2-6.9 NR 0.15
Kongkaew
et al.126
Meta-
analysis,
25 studies
106,586 5.9 4.3-7.6 0.2-
15.7
Table 1.7. Hospital admissions due to ADRs - data from the literature.
NR = not reported; CI = confidence Interval.
The data indicate that between 3.1 and 6.5% of hospital admissions were due
to ADRs and that subsequently, between 0.15 and 0.2% of patients died as a
result of their ADR. The most reliable UK study investigating this125 showed
that 6.5% of hospital admissions involved an ADR, the most common being
caused by non-steroidal anti-inflammatory drugs (NSAIDs), aspirin, warfarin
or diuretics; the overall fatality rate was 0.15%. The study concluded that at
any one time up to seven, 800-bed hospitals may be occupied by patients
admitted with ADRs. Most of the ADRs were either possibly or definitely
avoidable.
Kongkaew et al.126 conducted a meta-analysis, but only including prospective
observational studies. Their findings resonate with those of earlier studies,
with an average of 5.9% of admissions being related to ADRs. Interestingly,
there appeared to be a positive relationship with age; the ADR rates for
children, adults and elderly patients were 4.1, 6.3 and 10.7% respectively.

49
1.4.1.2 ADRs in hospital patients
Lazarou J. et al. 127 conducted a meta-analysis of 39 US studies of ADRs in
hospital in-patients, concluding that serous ADRs occurred in 6.7% (CI:5.2-
8.2%) of patients and fatal ADRs in 0.3% (95% CI:0.2-0.4%). The latter is
appreciably higher than that found for admissions in Section 1.4.1.1 above. In
the year of the study (1994) overall, 2.216 million hospitalised patients had
serious ADRs and 106,000 in-patients died as a result. ADRs were the fourth
leading cause of death behind stroke, cancer and heart disease, but ahead of
pulmonary disease and diabetes.127 The authors concluded that ADRs were a
serious public health issue. This figure was corroborated by a more recent
study by Krähenbühl-Melcher et al. Who calculated a figure of 6.1%. 128
In a meta-analysis of 18 UK studies involving 154,154 hospital in-patients,
Wiffen et al. 124 computed an ADR rate of 3.7% (CI: 3.6-3.8%). The ADR
prolonged the patient’s hospital stay by an average of 2 days, although for
serious ADRs, a 4-day prolongation was common. The authors calculated that
ADRs required an additional 395,056 extra bed days, equating to just over
three, 340-bed hospital equivalents occupied by patients with ADRs all the
year round.
1.4.1.3 ADRs in primary care
Information on the impact of ADRs in primary care is difficult to find, however
one 6-month study of a single general practice in Scotland 129 estimated that
1.7% of all GP consultations were due to an ADR, accounting for one of every
sixty consultations. Similar results were found by Lumley et al. 130 who asked
36,470 individuals to respond to the question ‘Is the medicine suiting you?’
Overall, 1.7% (one in 59) consultations were for an ADR, with a higher
percentage in the older age groups (2.7% for the over-50s).

50
1.4.2 Other impacts of ADRs
Costs can be thought of in financial, emotional and practical terms.
1.4.2.1 Cost to the patient
Cost to the patient may be nil, for a transitory, mild ADR such as dyspepsia;
however more serious ADRs may come with physical, psychological and
financial costs, in terms of days off work, need to change jobs because of
disability or a need for additional health and / or social care.
1.4.2.2 Cost to the healthcare provider(s)
Personal cost may be incurred in terms of guilt or loss of confidence in one’s
ability. Financial cost may be personal in terms of the need to retrain, loss of
job, loss of patients as clients or a cost to the practice through additional
diagnostic procedures or therapies required to treat the ADR. Additional costs
may occur in attempts to ensure against ADRs caused by negligence or
making reparations due to a successful law suit.
1.4.2.3. Cost to the MA holder
Product development is a high-risk investment for the pharmaceutical
industry. Many millions of pounds are invested in research and development
and a return on that investment will not been seen until the drug is marketed.
ADRs in the research Phases leading up to a MA application can spell
disaster for a lead compound and stop its further development dead in its
tracks.
The first few years of marketing are also a worrying time as PV data begins to
accumulate.

51
The average cost of developing a new product, from test tube to prescription
pad has been estimated at US$802 (£529) million.131 These costs must be
recouped through subsequent sales, although research indicates that 80% of
products fail to do so.132 In a broad overview, Rawlins found that between
1972 and 1994, 3 to 4 percent of new active substances licensed in the UK
were withdrawn for safety reasons.133
In addition to the costs of PV and detecting ADRs (both legal obligations)
there may be litigation and compensation costs for injured parties. Publication
of ADRs associated with potential ‘block-busting’ drugs are known to affect
the share price. 134,135 For example, when Merck announced the voluntary
withdrawal of its acute-pain medication, rofecoxib (Vioxx), on September 30,
2004, its stock price collapsed, wiping out more than a quarter of the
company's market value in a single day.134
Thus the marketing of particularly novel medicines (either as new chemical
entities or novel formulations) is certainly not without financial risk to the MA
holder.
1.4.2.4 Cost to the healthcare system
Many studies have highlighted the appreciable costs of ADRs to social
insurance and national health service schemes, in addition to the costs of
maintaining National and International PV arrangements. For a
comprehensive international literature review see Stephens.136
In the UK study described by Wiffen et al. 124 ADRs were associated with the
approximately 600,000 additional hospital bed days annually, due to ADRs
either in patients admitted due to an ADR, or experiencing an ADR when in
hospital. The authors calculated an annual cost of care of approximately £380
million. In the study by Pirmohamed et al. 125 the projected annual economic
costs of ADR-related admissions to all UK hospitals was even higher, at £466
million. The problem is international. White et al.137 observed that suitable

52
services to treat ADRs impose a high financial burden and that some
countries spend up to 15-20% of their hospital budget dealing with drug
complications.
1.5 Research aims
Product withdrawal from the market place represents an extreme in a range of
options for action that can be taken to improve drug safety.62 Others include
restriction in the licensed indications, warnings about drug interactions,
introducing special warnings or precautions or restrictions on use in specific
patient groups such as the pregnant, those who are beast feeding or those
with renal, hepatic or cardiac impairment. As with product withdrawals,
anecdotally, there appears to be little consistency in the evidence base on
which such decisions are made. Evidence-based health care is about using
research to inform decision-making, from treatment decisions concerning
individual patients to health policy decisions concerning populations. This
project seeks ways of improving the quality of ADR data and rationalising the
data analyses on which decisions about the safety of drugs are based.
From the foregoing sections, it is clear that ADRs to marketed products have
significant implications not just for the effectiveness and cost of patient care
but also the well-being and productivity of the pharmaceutical industry. The
role of PV systems in monitoring drug safety has been instrumental in
assisting regulatory decisions by providing signals of new ADRs.
However, a preliminary overview of recent product withdrawals has shown
what appear to be gross differences in the amount and quality of evidence
cited in the support of the action taken. Some products are withdrawn after a
handful of “yellow card” reports, while others are withdrawn after a long
history of marketing against a background of slowly mounting yellow card
reports, published case studies and an “expert panel” review of evidence.

53
There has been no, systematic, in-depth study of the role of ADR reports in
regulatory decision making. Such a study is worthwhile, because it would
provide some objectivity to the decision making process and perhaps allow for
more consistency in regulatory decisions in the future.
The author’s research had three phases, each with its own aims:
1.5.1 Phase 1 aims
i) To provide background to the study, document all changes
made to product labelling on safety grounds over a 10 year
period, including product withdrawals, in the UK.
Phase 1 is described in Chapter 2 of this thesis.
1.5.2 Phase 2 aims
i) To investigate in depth, all product withdrawals made during the
10 year study above, in terms of:
a) therapeutic group;
b) source and quality of ADR data cited as the reason for the
change; and
c) product survival probability.
ii) To repeat the above for all important changes to labelling.
Phase 2 is also described in Chapter 3 of this thesis.
1.5.3 Phase 3 aims
i) To gain the views of a range of professionals with a PV role on the
current procedures for handling safety issues in the UK and their
thoughts on improvement.

54
This research was informed and facilitated by Phases 1 and 2 above.
Phase 3 is reported in Chapter 4 of this thesis.
Chapter 5 provides an overall synopsis and discussion of the findings and a
study critique.
Chapter 6 makes recommendations on how ADR data might be better
produced and used when making safety decisions.

55
CHAPTER TWO: A LONGITUDINAL STUDY OF LABELLING CHANGES AND
PRODUCT WITHDRAWALS IN THE UK DUE TO ADRS, 1995-2005.
2.1 Introduction
Chapter 1 described the ways in which medicinal products are authorised for use in the
UK and highlighted the nature and extent of safety data which are likely to accompany a
successful MAA. Reference was also made to the fact that as new safety data emerges
upon use of the product post-MA, new safety signals may be discovered, which warrant
subsequent changes to the MA.
Little is known of the true incidence of changes to UK product labelling or product and
drug withdrawals prompted by ADR information, nor of the overall quality of the
information underpinning such changes. If one is to rationalise the decision making
process, a first step is to obtain such data. This then is the basis for Phases 1 and 2 of
this research. Phase 1 was a retrospective, 10-year study to define the incidence of the
changes to products on the UK market and Phase 2 studied major labelling changes
and product withdrawals identified in Phase 1 systematically, in an attempt to define the
role played by the different types of ADR information in such changes. Phase 1 is
reported in Chapter 2 and Phase 2 is reported in Chapter 3.
2.2 Methodology – Phase 1
The aim of Phase 1 was to provide background to the study and survey all changes
made to product labelling on safety grounds over a 10 year period, including product
withdrawals, in the UK.
The data collection methodology involved a comprehensive literature search under the
following sections:

56
1. Searching the British National Formulary (BNF) for safety notices.
2. Searching the Pharmaceutical Journal (PJ) for safety notices.
3. Other attempts to retrieve or validate information.
2.2.1 Searching the British National Formulary (BNF)
The 10-year period selected for study was September 1st 1995 to August 31st 2005.
Each 6-monthly edition of the BNF relevant to the study period (BNFs 31-50), was
scrutinised for published amendments to the advice accompanying licensed medicinal
products, and product withdrawals. The study included all UK licensed medicinal
products. Exclusion criteria were as follows:
Pharmaceutical compatibility / stability warnings not related to a particular
adverse event.
Newly licensed products, as indicated in the ‘Late additions’ and ‘New
preparations included in this edition’ introductory sections of each BNF.
Unlicensed medicinal products and ‘off label’ use.
Wound dressings, sutures and diagnostics.
CSM ‘reminders’ on safety issues previously published and containing no
additional safety information.
The following BNF sections were scrutinised systematically in each BNF:
The introductory ‘Changes’ section, particularly for ‘revised’ or ‘new text’ or ‘dose
changes’ or ‘classification changes’ where there was a possibility of amendments
due to safety issues. Safety issues were those where subsequent perusal of the
text indicated that additional precautions should be taken with the medicine,
indications or doses had been limited or the drug legal classification had changed
resulting in tighter control on use or supply. This was facilitated by the BNF
editorial policy of underlining all changes to previous entries.

57
New ‘Blue Box’ warnings indicating safety issues were also searched for
manually in each BNF.
BNF Appendix 1 (Drug Interactions) was searched for changes from the previous
BNF for a particular medicine. This was facilitated by the BNF policy of
underlining all changes made to a particular entry that differed from text in the
previous BNF.
BNF Appendix 2 (Liver Disease) was searched for new entries to established
products as above.
BNF Appendix 3 (Renal Disease) was searched for new entries to established
products as above.
BNF Appendix 4 (Pregnancy) was searched for new entries to established
products as above.
BNF Appendix 5 (Breast-feeding) was searched for new entries to established
products as above.
BNF Appendix 9 (Cautionary and Advisory Labels) was searched for new entries
to established products as above.
Individual drug monographs were also scrutinised for text changes, including
class changes affecting that drug; dosage changes (new restrictions only –
widening dose bands or doses for new indications for an established drug were
not included); new drug interactions; use in hepatic disease; use in renal disease;
use in pregnancy; use in breast-feeding; warnings and precautions; limitation of
indications from a previous edition; specific side effects; contraindications.
For each change, the following information was abstracted and entered into an Excel
spreadsheet: Generic drug name / Brand name / Date launched / date withdrawn (if
applicable)* / Data gleaned from appendices 1-5 and 9 as indicated above / BNF
therapeutic category (section) / Type of notice / BNF reference.

58
It was unfeasible to determine the launch date for the large number of products
involved; but was possible for the much smaller number of products withdrawn or with
serious licensing restrictions (see Chapter 3).
All Excel entries were scrutinised for duplication within a particular BNF using the word
search facility in Excel for both brand and generic names. BNF Appendix 1 (drug
interactions) sometimes contained two entries for the same interaction (e.g. ergotamine
and reboxetine in BNF 35). The entry for the drug most recently launched was retained,
so in the example above, the reboxetine case was retained and the ergotamine case
deleted. This was to obtain a better impression of change activity relating to recent
licensing. This is not to say that changes to long-established products cannot and do
not occur or that they are unimportant; but the author had to find a way of discounting
duplicates while allowing consideration of as wide a range of products as possible. New
evidence is most likely to be related to the newer drug. Furthermore, it was thought to
be of more interest to take newly licensed products and look at the safety experience in
the first few years of marketing. By the same token, care was taken to eliminate any
interactions between an established drug and a drug classified as ‘new to this edition’ at
the beginning of the relevant BNF. Care was taken to discount any interactions
between established drugs and drugs classified as ‘new to this edition’ at the beginning
of the relevant BNF.
This process produced a data set, BNF (EXCELAMY1) containing 1,553 cases,
including 44 duplicates due to drug-drug interactions; leaving 1509 discrete cases.
2.2.2 Searching the Pharmaceutical Journal (PJ)
Hard copies of all Pharmaceutical Journals (a weekly publication) covering the same
period as the BNF study above (September 2nd 1995 – Volume 25, part 6856 to
September 3rd 2005 – Volume 275, part 7365) were searched manually. Attention was
focussed on the ‘Notice Board’ section of each issue – the main place where changes to
product labelling made on safety grounds are highlighted.

59
Each case was entered into a second Excel spread sheet in a similar way to the BNF
data. Records also included the issue number of the BNF contemporary with the PJ
issue concerned, the change category mentioned above and the BNF therapeutic
section where the notice would logically fall. The numbering of these BNF sections did
not change throughout the study period.
After entry, each PJ case was re-read and compared to the contemporary BNF entries
to see if the information had been duplicated. If this was found to be the case, the PJ
entry was deleted from the PJ file. This left a data set clean of all duplicates and
summarising all changes made on safety grounds advertised in the PJ during the study
period, designated PJ (EXCEKAMY2) containing 1,152 cases including 31 cases
duplicated in the BNF, leaving 1121 discrete cases.
2.2.3 Other attempts to retrieve or validate information
Several options to validate the BNF and PJ information were considered.
2.2.3.1 Use of the BNF editorial team database
An introductory e-mail was sent to the BNF Editor (Dinesh Shah) including an Excel
spread sheet containing a sample of safety cases taken from BNFs 31-50 and enquiring
whether it would be possible to validate and perhaps augment the information gleaned
on such changes using BNF records.
The author was subsequently invited to attend a meeting with Ms Shama Wagle, BNF
Assistant Editor, at the BNF editorial office, Royal Pharmaceutical Society of Great
Britain headquarters, 1 Lambeth High St, London.
The methodology of the author’s study was praised; however assistance at the level
requested could not be given, for the following reasons:

60
The BNF editor did keep a paper record of the reasons behind each change
made; however, BNF staff could provide little assistance in validating these as
records were quickly archived and a great deal of time and effort would be
needed to retrieve this information.
The BNF did not maintain an electronically searchable database. Paper samples
shown to the author consisted of draft BNF pages with handwritten notes in the
margin or attached Post-It stickers, demonstrating a piecemeal approach.
BNF staff had no idea of the numbers of changes made to each BNF during the
study period and had not compared the quality of the evidence on which changes
were based between earlier and later reports.
There were probably hidden changes, particularly in the side effects sections
which have not been highlighted as new; it was not possible to quantify these.
The frequency with which pharmaceutical companies updated the editorial team
on product safety changes was sporadic and efficiency varied between
companies.
The last four points above are potential confounders for this study.
One further interesting observation was that the BNF Joint Formulary Committee,
which makes the final decision on whether to publish a change or not, makes an
appraisal of evidence from various sources including the CSM, MHRA and
manufacturers. In this respect, some changes may not represent actual licence changes
to marketed products, only reflecting the views of Formulary Committee members;
although this will account for a minority of cases.
In the light of the above, Data validation using BNF editorial records was not pursued.
The author was advised to approach the MHRA for help, particularly with product
withdrawals (see below).

61
2.2.3.2 MHRA contact
An e-mail was sent to the MHRA Information centre (Licensing Division:
http://www.mhra.gov.uk/Contactus/SpecificenquiriesbyMHRADivision/Licensing/index.ht
m) on 12th Jan 2007 asking for assistance with the project in terms of access to
records of product licence changes over the study period.
A reply e-mail was issued on the 19th January from a Central Enquiry Point (un-
authored) stating that while the MHRA probably held the information required, retrieving
it for such a period of time (ten years) and such a large number of products would have
resource implications for the MHRA. Individual requests for specific substances would
be treated as requests under the Freedom of Information Act but ‘requests for
information on more than 2 / 3 substances would be refused on cost grounds’.
This response precluded the use of the MHRA database for general validation of the
research data; however, the MHRA did supply a detailed list of products withdrawn in
the study period referenced: MHRA Information Centre G:\Information
Centre\Icsirs\withdrawn drugs.doc. This proved useful in validating information on
product withdrawals and assisted with more detailed analysis of such events in Phase 2
of this study.
2.2.3.3 Contact with individual pharmaceutical companies
One option for validating the information on changes to product labelling was to ask the
manufacturers for assistance from their own records.
University of Portsmouth DSES/SPBMS Joint Research Ethics Committee approval was
obtained prior to the start of this part of the study (Letter from Chair 12/10/06).
Five companies with established UK medical divisions were chosen (see Table 2.1) for
this part of the study. The Medical Information department of each company was
contacted by phone and a brief description of the project was given. Each contact
indicated that they were willing to consider provision of the information required and the

62
investigator was invited to mail a written questionnaire requesting information on up to
three of the company’s products (see Appendix 1).
The questionnaire was devised by the author and her supervisor, and covered a range
of questions intending to find out when the product was first licensed and details of the
incident(s) leading to the labelling change. All changes identified for each product were
included by the author as prompts. A separate questionnaire sheet was supplied for
each change identified. Products and changes investigated are shown in Table 2.1. All
questionnaires were mailed during the latter half of January 2007. The details of reply
are shown in Table 2.1. All companies expressed regret at not being able to spare the
resource to provide the requested information.
It was concluded that this would not be a profitable way of pursuing the study.

63
Company Address / Contact Products (changes) Reply by : Reply
Pfizer Medicines Information Scientist, Pfizer Ltd, Walton Oaks, Dorking Rd, Walton-on-the-Hill, Surrey, KT20 7NS
Epanutin (13)
Lipitor (15)
Feldene (4)
Head of Regulatory Affairs: the workload to supply the information required was too much and Pfizer could not resource this. Some of the information would be regarded as confidential. The investigator was advised to pursue information from other (public domain) sources.
Wyeth Medicines Information Manager, Wyeth Pharmaceuticals, Huntercombe Lane South, Taplow, maidenhead, SL6 0PH
Effexor (9)
Minocin (3)
Medicines Information Scientist: ‘Data difficult to get together and a lot of work; therefore would not be co-operating’.
Glaxo Smith Kline GSK, Stockley Park West, Uxbridge, Middx, UB11 1BT
Lamictal (8)
Imigran (8)
Romazin (1)
Director of MI and Safety: too much information required, could not resource.
Shire Pharmaceuticals Shire Pharmaceuticals Ltd, Hampshire International Business Park, , Chineham, Basingstoke, Hants, RG24 8EP
Baratol (1) Director of Regulatory Affairs: Data is archived and disinclined to participate.
Bayer Bayer plc, Pharmaceutical Division, Bayer House, Strawberry Hill, Newbury, Berks, RG14 1JA
Lipobay (5)
Ciproxin (9)
Medical Director: the decision was not to participate (no reason given)
Table 2.1 Pilot survey of pharmaceutical companies to gain additional information on licensing changes made to selected products – summary of outcomes.

64
2.2.3.4 DataPharm Communications
The author attended two meetings with the Chief Executive of DataPharm
Communications Ltd, Leatherhead, Surrey (Mr Stephen Mott). The latter company is
responsible for publication of the Compendium of Data Sheets and Summaries of
Product Characteristics and maintaining the corresponding database, available at www.
medicines.org.uk. The first meeting with the Chief Executive and a Senior Data
Manager (Mr Alan Henderson), outlined the area of study and discussed the feasibility
of using the DataPharm database to validate the research data. It was agreed that
during a subsequent visit to the unit, the author would interrogate the DataPharm
database using a selection of relatively high-profile product labelling changes that had
occurred during the study period.
The results of the second visit were disappointing. It was discovered that the database
was by no means complete and that in some cases, the data held by the author was
more detailed than that on the DataPharm database.
It was concluded that the DataPharm database would not be a useful way of validating
the research data.
Summarising, attempts were made to validate Phase 1 data using a variety of
commercial and Governmental sources; these proved of extremely limited use, either
due to the way the information was archived or its perceived confidential nature.
It was decided that, with careful analysis, the author’s data were more complete and of
higher quality than that which could be obtained from any other plausible source, and
that further analysis could proceed.
2.2.4 Statistical analyses
All data were analysed using descriptive statistics. To determine whether there were
any correlations between time and appearance of ADR warnings, two analyses were
made, taken on the advice of a University statistician. The first was a simple correlation

65
using Spearman’s rho as a measure of association. The latter was used in preference to
the Pearson correlation coefficient as the data did not follow a normal distribution, so a
non-parametric test was required. Analyses were conducted using SPSS Version 15,
SPSS UK Ltd, Woking) taking p<0.05 as indicating a statistically significant correlation
coefficient. The second analysis was a runs test to investigate the likelihood that
individual data points were following any sub-trends within the run of data. This was
conducted using Minitab Version 15 (Minitab Ltd, Coventry) taking a value of p<0.05 as
indicating a significant value for clustering and for oscillation.
2.3 Results
All data for the BNF (1509 cases), PJ (1121 cases) and BNF-PJ combined (2630 cases)
are shown in Table 2.2 by BNF number and presented graphically in Figure 2.1. There
seemed to be a greater contribution of notices from the PJ, starting in BNF period 42.
Why this was is not known, but may reflect an editorial decision around this time to
publicise such information in a fuller and more systematic way for the benefit of
pharmacists.
All Excel entries were listed alphabetically by generic drug name and the resultant data
searched manually for duplicates. These were only discounted if the Brand name was
identical. The resultant list provided the number of different medicinal products involved
throughout the study period (688). Those products with the five highest numbers of
individual entries were: nefazodone (10), indinavir (9), ciclosporin (8), venlafaxine (8)
and lansoprazole (7).
Data by change category are shown in Table 2.3 and Figure 2.2.

BNF
Number
Period covered BNF entries
n=1509 (%)
PJ entries
n=1121 (%)
Total
n=2630 (%)
31 Oct 95/Mar96 50 (3.3) 37 (3.3) 87 (3.3)
32 Apr96/Sept96 58 (3.8) 31 (2.8) 89 (3.4)
33 Oct 96/Mar97 26 (1.7) 29 (2.6) 55 (2.1)
34 Apr97/Sept97 63 (4.2) 36 (3.2) 99 (3.8)
35 Oct 97/Mar98 104 (6.9) 32 (2.9) 136 (5.2)
36 Apr98/Sept98 89 (5.9) 33 (2.9) 122 (4.6)
37 Oct 98/Mar99 156 (10.3) 42 (3.7) 198 (7.5)
38 Apr99/Sept99 96 (6.4) 13 (1.2) 109 (4.1)
39 Oct 99/Mar00 74 (4.9) 38 (3.4) 112 (4.3)
40 Apr00/Sept00 103 (6.8) 25 (2.2) 128 (4.9)
41 Oct 00/Mar01 97 (6.4) 33 (2.9) 130 (4.9)
42 Apr01/Sept01 113 (7.5) 101 (9.0) 214 (8.1)
43 Oct 01/Mar02 21 (1.4) 38 (3.4) 59 (2.2)
44 Apr02/Sept02 79 (5.2) 101 (9.0) 180 (6.8)
45 Oct 02/Mar03 40 (2.7) 109 (9.7) 149 (5.7)
46 Apr03/Sept03 46 (3.0) 81 (7.2) 127 (4.8)
47 Oct03/Mar04 58 (3.8) 98 (8.7) 156 (5.9)
48 Apr04/Sept04 43 (2.8) 91 (8.1) 134 (5.1)
49 Oct 04/Mar05 67 (4.4) 72 (6.4) 139 (5.3)
50 Apr05/Sept05 126 (8.3) 81 (7.2) 207 (7.9)
Table 2.2 Cases cited in the BNF and PJ over the study period by
BNF in which they appeared.
66

0
50
100
150
200
250
31 32 33 34 35 36 37 38 39 40 41 42 43 44 45 46 47 48 49 50
nPJ
BNF
Figure 2.1 Cases cited in the BNF and PJ over the study period by
BNF in which they appeared.
Change category BNF
n= 1509 (%)
PJ
n=1121 (%)
Total
n=2630 (%)
Drug interactions 617 (40.9) 224 (20.0) 841 (32.0)
Pregnancy 239 (15.8) 13 (1.1) 252 (9.6)
Renal disease 192 (12.7) 12 (1.1) 204 (7.8)
Hepatic disease 165 (10.9) 11 (0.1) 176 (6.7)
Lactation 153 (10.1) 18 (1.6) 171 (6.5)
Dosage 68 (4.5) 43 (3.8) 111 (4.2)
Warnings/precautions 24 (1.6) 163 (14.5) 187 (7.1)
Side effects 22 (1.5) 515 (45.9) 537 (20.4)
Contraindications 16 (1.1) 88 (7.9) 104 (4.0)
General change* 10 (0.7) 0 (0.0) 10 (0.4)
Indication change 3 (0.2) 34 (3.0) 37 (1.4)
Table 2.3 Safety notices by change category (BNF, PJ and total).
*A miscellaneous group of safety notices appearing in the general ‘changes’ section of the BNF: concerning hormone replacement therapy duration (2) and risks of thromboembolism (2); restriction of the use of azapropazone (1), cefpodoxime (1); sotalol (1), centrally acting appetite suppressants (2) and closer monitoring of ibuprofen (1).
67

0
100
200
300
400
500
600
700
800
900Dru
g inte
ract
ions
Pregn
ancy
Renal
dis
ease
Hepat
ic d
isea
seLac
tatio
nDosa
ge
Wani
ng/pre
cautio
nsSid
e ef
fect
s
Contra
indic
atio
nsG
enera
lIn
dica
tion
nPJ
BNF
Figure 2.2 Safety notices by change category (BNF and PJ) over study period.
The range of changes per BNF (i.e. in any six-month period) was 55 (BNF 33) to 214
(BNF 42); statistical analyses for data trends is discussed in Section 2.4.
One striking observation from Figure 2.2 is the disproportionate contribution of side
effect and drug interaction notices from the PJ. It is logical that the PJ should adopt
an editorial policy of highlighting these particular changes to pharmacists as soon as
possible so that they can contribute effectively to patient safety.
Data are shown by BNF therapeutic category in Table 2.4 and Figure 2.3, ranked in
decreasing frequency of appearance.
68

69
BNF therapeutic category
BNF
n=1509 (%)
PJ
n=1121 (%)
Total
n=2630 (%)
CNS 335 (22.2) 283 (25.2) 618 (23.5)
Infection 345 (22.9) 223 (19.9) 568 (21.6)
Cardiovascular 225 (14.9) 175 (15.6) 400 (15.2)
Malignancy 161 (10.7) 124 (11.1) 285 (10.8)
Endocrine 97 (6.4) 75 (6.7) 172 (6.5)
GI 68 (4.5) 84 (7.5) 152 (5.8)
Musculoskeletal 60 (4.0) 53 (4.7) 113 (4.3)
Respiratory 55 (3.6) 17 (1.5) 72 (2.7)
Anaesthesia 50 (3.3) 10 (0.9) 60 (2.3)
OB&urinary 43 (2.8) 16 (1.4) 59 (2.2)
Nutrition / blood 32 (2.1) 4 (0.4) 36 (1.4)
Skin 20 (1.3) 13 (1.2) 33 (1.3)
Eye 9 (0.6) 9 (0.8) 18 (0.7)
ENT 5 (0.3) 7 (0.6) 12 (0.5)
Immunologicals 3 (0.2) 28 (2.5) 31 (1.2)
Other 1* (0.1) 0 (0.0) 1 (0.4)
Table 2.4. Safety notices by BNF therapeutic category (BNF, PJ and total).
*One warning in the ‘other’ category was that the use of methionine to treat drug poisoning might precipitate coma.

0
100
200
300
400
500
600
700
CNS
Infe
ctio
ns
Cardio
vasc
ular
Mal
ignan
cy
Endocrin
e GI
Musc
ulosk
elet
al
Respira
tory
Anaest
hesia
OB&Urinar
y
Nutrion&Blo
odSki
nEye
ENT
Imm
unologic
al
Other
nPJ
BNF
Figure 2.3. Safety notices by BNF therapeutic category (BNF& PJ combined).
The rank order of the top four most commonly occurring therapeutic categories for
safety notices were CNS(23.5%) > infections (21.6%) > cardiovascular (15.2%)>
malignancy (10.8%).
Data are shown by BNF therapeutic category and BNF number for the BNF-PJ
combined in Table 2.5 and Figure 2.4. See also analysis for trends section. One
interesting spike is that for products used to treat malignancy for BNF 37. This
contained 60 safety notices, many of which were the result of ‘blanket’ advice on
adverse effects of chemotherapy on the reproductive process in both men and
women and the need to take additional contraceptive precautions.
70

71
BNF chapter 31 32 33 34 35 36 37 38 39 40 41 42 43 44 45 46 47 48 49 50 Total (%)
GI 4 4 2 1 12 24 28 15 2 3 17 8 2 4 0 14 5 1 3 3 152 (5.8)
Cardiovascular 9 24 2 29 14 15 14 20 12 32 5 36 8 9 21 19 25 22 30 54 400 (15.2)
Respiratory 1 0 2 4 4 8 2 4 3 0 15 9 0 0 2 4 8 3 3 0 72 (2.7)
CNS 39 14 11 19 36 20 34 37 15 9 23 48 11 73 55 32 40 26 17 59 618 (23.5)
Infections 15 31 17 24 30 25 29 12 32 34 27 51 24 32 7 23 27 28 60 40 568 (21.6)
Endocrine 3 3 2 4 8 4 10 11 19 5 8 5 0 12 13 14 7 16 9 19 172 (6.5)
OG&Urinary 2 2 0 2 4 2 2 1 2 9 4 15 0 3 0 0 4 4 2 1 59 (2.2)
Malignancy 3 8 14 10 11 11 60 3 18 15 10 0 6 33 22 9 10 18 7 17 285 (10.8)
Nutrition&blood 0 1 1 3 3 3 3 0 1 4 4 3 0 4 2 0 1 0 3 0 36 (1.4)
Musculoskeletal 2 1 1 1 2 3 6 4 0 8 6 19 2 4 13 10 15 8 0 8 113 (4.3)
Eye 0 0 0 0 2 1 3 0 5 0 0 0 0 1 0 0 2 4 0 0 18 (0.7)
ENT 7 0 0 0 1 0 0 0 0 3 0 1 0 0 0 0 0 0 0 0 12 (0.5)
Skin 0 0 0 0 5 0 0 0 1 0 7 8 3 3 1 0 2 0 0 3 33 (1.3)
Immunological 0 0 0 0 0 1 0 0 2 0 1 9 2 1 11 0 1 3 0 0 31 (1.2)
Anaesthetics 2 1 3 2 4 5 7 2 0 6 3 1 1 1 2 2 9 1 5 3 60 (2.3)
Other 0 0 0 0 0 0 0 0 0 0 0 1 0 0 0 0 0 0 0 0 1 (0.03)
Total 87 89 55 99 136 122 198 109 112 128 130 214 59 180 149 127 156 134 139 207 2630 (100.0)
Table 2.5 Safety notices in BNF therapeutic categories by BNF number – totals from BNF and PJ entries.

3132
3334
3536
3738
3940
4142
4344
4546
4748
4950
GICardiovascularRespiratoryCNSInfectionsEndocrineOG&UrinaryMalignancy
Nutrition&blood
MusculoskeletalEye
ENTSkin
ImmunologicalAnaestheticsOther
0
20
40
60
80
n
BNF no.
Figure 2.4 Safety notices in BNF therapeutic categories by BNF number – totals from BNF and PJ entries.
72

73
The type of change made with respect to BNF therapeutic category is shown for the
total counts (BNF & PJ) in Table 2.6 and displayed graphically in Figure 2.5.
For illustrative purposes, pooled data are shown by BNF therapeutic category for the
change categories of ‘dose’, ‘drug interaction’ and ‘side effects’ in Figures 2.6, 2.7 and
2.8 respectively. All change categories showed a similar distribution with a
preponderance of safety notices in the cardiovascular (400; 15.2%), CNS (618; 23.5%)
and infection (568; 21.6%) categories. This does correlate with the relatively large
numbers of drugs present in each of these categories.

74
BNF therapeutic category
General Dose DIs Hepatic Renal Pregnancy Lactation W&Ps Indication SEs CIs Total (%)
GI 0 9 49 5 7 14 9 7 3 41 8 152 (5.8)
Cardiovascular 0 18 110 26 33 30 33 26 8 93 23 400 (15.2)
Respiratory 0 2 28 5 10 8 5 2 0 9 3 72 (2.7)
CNS 3 24 257 35 31 34 35 39 4 127 29 618 (23.5)
Infections 2 20 229 33 59 36 32 26 2 116 13 568 (21.6)
Endocrine 2 7 29 12 21 21 16 17 7 35 5 172 (6.5)
OG&Urinary 2 6 20 4 6 4 2 5 2 6 2 59 (2.2)
Malignancy 0 5 61 28 15 60 10 44 5 54 3 285 (10.8)
Nutrition&blood 0 3 4 8 5 10 3 0 1 2 0 36 (1.4)
Musculoskeletal 1 6 28 9 8 11 11 11 2 24 2 113 (4.3)
Eye 0 1 2 1 1 2 1 0 0 5 1 18 (0.7)
ENT 0 3 1 1 1 0 0 0 1 5 0 12 (0.3)
Skin 0 1 3 1 2 7 6 4 0 7 2 33 (1.3)
Immunological 0 0 9 1 1 1 0 2 2 13 2 31 (1.2)
Anaesthetics 0 6 11 6 4 14 8 4 0 0 7 60 (2.3)
Other 0 0 0 1 0 0 0 0 0 0 0 1 (0.03)
Total (%) 10 (0.4)
111 (4.0)
841 (32.0)
176 (6.7)
204 (7.8)
252 (9.6)
171 (6.5)
187 (7.1)
37 (1.4)
537 (20.4)
104 (4.0)
2630
Table 2.6 Safety notices: BNF therapeutic category by change category – BNF and PJ data combined.

0
500
Dose DIsHep
atic
Renal
Pregn
ancy
Lacta
tion
W&Ps
Indi
catio
nSEs
CIs
GICardiovascular
Respiratory
CNSInfections
Endocrine
OG&Urinary
Malignancy
Nutrition&blood
Musculoskeletal
EyeENT
SkinIm
munological
Anaesthetics
GI Cardiovascular Respiratory CNSInfections Endocrine OG&Urinary MalignancyNutrition&blood Musculoskeletal Eye ENTSkin Immunological Anaesthetics
Figure 2.5 Safety notices: BNF therapeutic category by change category – BNF and PJ data combined.
75

0
5
10
15
20
25
30
GI
Cardio
vasc
Resp
CNS
Infe
ctio
n
Endocrin
e
OG&U
Mal
ignan
cy
Nut.&Blo
od
Musc
ulosk
elet
alEye
ENTSki
n
Imm
uno
Anaest
hetic
s
Other
n Dose
Figure 2.6 Distribution of safety notices in the ‘dose’ category by BNF therapeutic
category.
050
100150200250300
GI
Cardio
vasc
Resp
CNS
Infe
ctio
n
Endocrin
e
OG&U
Malig
nancy
Nut.&Blo
od
Musc
ulosk
elet
alEye
ENTSki
n
Imm
uno
Anaest
hetic
s
Other
n Drug interactions
Figure 2.7 Distribution of safety notices in the ‘drug interactions’ category by BNF
therapeutic category.
76

020406080
100120140
GI
Cardio
vasc
Resp
CNS
Infe
ctio
n
Endocrin
e
OG&U
Mal
ignan
cy
Nut.&Blo
od
Musc
ulosk
elet
alEye
ENTSki
n
Imm
uno
Anaest
hetic
s
Other
n Side effects
Figure 2.8 Distribution of safety notices in the ‘side effects’ category by BNF therapeutic
category.
In terms of appearance of the safety notices as a function of time, data are shown by
change category and BNF number for BNF-PJ combined data in Table 2.7. The pooled
BNF-PJ data are shown for illustrative purposes in Figure 2.9. To investigate if there
was any real change in the frequency of notices with time, a runs test was performed on
each string of data. Results are discussed in Section 2.4.
77

78
Category 31 32 33 34 35 36 37 38 39 40 41 42 43 44 45 46 47 48 49 50 Total (%)
General change 4 0 0 1 2 0 2 1 0 0 0 0 0 0 0 0 0 0 0 0 10 (0.4)
Dosage 12 11 10 8 6 6 3 5 6 7 5 4 0 3 1 2 9 4 2 7 111 (4.2)
Drug interactions 33 23 15 47 71 67 61 54 51 47 39 58 15 30 48 24 36 27 34 61 841 (32.0)
Hepatic 3 6 2 8 13 7 8 12 2 16 7 11 1 11 9 8 9 11 19 13 176 (6.7)
Renal 5 10 3 9 10 6 10 3 5 17 13 19 5 9 8 4 17 14 16 21 204 (7.8)
Pregnancy 6 2 2 2 5 6 58 19 6 8 27 23 4 19 8 8 12 8 6 23 252 (9.6)
Lactation 7 2 1 3 5 3 22 19 7 9 27 23 3 19 8 7 14 8 6 22 257 (6.5)
Warn&Prec. 0 6 11 8 4 3 4 1 6 3 3 15 8 22 13 21 24 8 15 12 187 (7.1)
Indication 2 3 2 1 1 0 0 1 0 0 1 4 3 2 1 5 5 1 2 3 37 (1.4)
Side effects 12 24 6 2 20 18 24 4 25 20 13 57 11 65 42 44 26 47 37 40 537 (20.4)
Contraindication 9 2 3 10 1 6 6 4 3 0 3 8 6 7 11 6 5 8 3 3 104 (4.0)
Total 87 89 55 99 136 122 198 109 112 128 130 214 59 180 149 127 156 134 139 207 2630 (100.00
Table 2.7 Safety notices: BNF number and change category (combined BNF & PJ data).

0
50
100
31 32 33 34 35 36 37 38 39 40 41 42 43 44 45 46 47 48 49 50
General change
DosageDrug interactions
HepaticRenal
Pregnancy
Lactation
Warn&Prec.
Indication
Side effects
Contraindication
General change Dosage Drug interactions Hepatic Renal Pregnancy
Lactation Warn&Prec. Indication Side effects Contraindication
Figure 2.9 Safety notices: BNF number and change category (combined BNF & PJ data).
79

80
2.3.1 Analysis of side effects
There were 537 changes attributed to side effects. Table 2.8 shows the distribution of
these between different BNF therapeutic categories for the BNF/PJ combined data.
Data were also categorised using the traditional Type A/B/C/D pharmacological
categories described in Chapter 1, Section 1.1.2.
Overall, there were 119 (22.2%) Type A, 394 (73.4%) Type B, 15 (2.9%) Type C and
9 (1.7%) Type D reactions.
These results are as expected in a post-licensing situation where rare Type B/C/D
reactions are more likely to emerge due to wider prescription of the product (78% in
total). It is interesting to note however that about a fifth (22%) of reactions are those
generally considered to be dose-related and predictable from the known pharmacology
of the drug, but were warnings added only after licensing and therefore, presumably,
were not observed in pre-licensing clinical trials.
2.3.2 Dose changes
Overall, there were 111 changes in the ‘dose’ category. Fifty (45%) were concerned
exclusively with dose changes in children / adolescents (35 = 31.5%) or the elderly (15
= 13.5%). The results are summarised in Table 2.9, broken down into age and BNF
therapeutic category. A breakdown of type of action required (usual adult dose
reduction or avoidance) is also given. Of particular interest are the notices where
previously there was no advice, but this was changed to ‘avoid’. Examples of this for
children / adolescents were paroxetine, venlafaxine, aspirin and co-trimoxazole (except
for treatment of otitis media). The only instance for the elderly was reboxetine.
The therapeutic categories where most changes occurred were infection followed by
CNS at both extremes of age.

81
BNF chapter/ADR type
A B C D Totals (%)
GI 7 34 ‐ ‐ 41 (7.6)
Cardiovascular 20 73 ‐ ‐ 93 (17.3)
Respiratory 7 ‐ ‐ 2 9 (1.7)
CNS 35 77 14 1 127 (23.6)
Infections 17 97 ‐ 2 116 (21.6)
Endocrine 10 24 ‐ 1 35 (6.5)
OG&Urinary 4 1 ‐ 1 6 (1.1)
Malignancy 9 45 ‐ ‐ 54 (10.0)
Nutrition&blood ‐ 2 ‐ ‐ 2 (0.4)
Musculoskeletal 7 14 1 2 24 (4.5)
Eye 1 4 ‐ ‐ 5 (0.9)
ENT 1 4 ‐ ‐ 5 (0.9)
Skin ‐ 7 ‐ ‐ 7 (1.3)
Immunological 1 12 ‐ ‐ 13 (2.4)
Anaesthetics ‐ ‐ ‐ ‐ ‐
Other ‐ ‐ ‐ ‐ ‐
Total (%) 119 (22.2)
394 (73.4)
15 (2.8) 9 (1.7) 537 (100)
Table 2.8 Type of ADR vs BNF therapeutic category – PJ and BNF data combined.

82
Table 2.9 Analysis of changes made in the ‘dose’ category specific to groups at the extremes of age, by BNF therapeutic category.
Children / adolescents ElderlyBNF therapeutic category
Decreased dose Avoid Decreased dose Avoid
Total
GI 2 2 1 0 5
Cardiovascular 0 2 2 0 4
Respiratory 0 0 0 0 0
CNS 3 2 5 1 11
Infections 8 4 3 0 15
Endocrine 1 0 0 0 1
OG&Urinary 2 0 1 0 3
Malignancy 1 0 0 0 1
Nutrition&blood 1 0 0 0 1
Musculoskeletal 1 1 2 0 4
Eye 0 0 0 0 0
ENT 3 0 0 0 3
Skin 0 1 0 0 1
Immunological 0 0 0 0 0
Anaesthetics 0 1 0 0 1
Other 0 0 0 0 0
Total 22 13 14 1 50

83
2.3.3 Food / drink and herbal interactions.
There were 841 notices in the ‘drug interactions’ category. These were re-examined to
identify specific references to food, drink or herbal medicines. A breakdown is provided
in Table 2.10. Twenty notices (2.4%) fell into one of these categories, with 11 (1.3%) in
the food / drink section and 9 (1.1%) in the herbal section. For both types of interacting
compound, infection and CNS were the most frequently involved BNF chapters. All
other drug interactions were drug – drug in nature. All the drug-herb interactions
involved St John’s wort, which has many pharmacokinetic drug interactions with drugs
metabolised in the liver. The one exception was a pharmacodynamic interaction where
it was warned that St John’s wort increased the seratonergic effect of duloxetine.
BNF therapeutic category Food / drink Herbs Total
GI alcohol (1) 0 1
Cardiovascular cranberry juice (2) St John’s wort (1) 2
Respiratory grapefruit juice (1) 0 2
CNS alcohol (1) St John’s wort (2) 3
Infections alcohol (3) St John’s wort (5) 8
Endocrine alcohol (1) 0 1
O,G&Urinary ‘food’ (1) 0 1
Malignancy 0 St John’s wort (1) 1
Nutrition&Blood 0 0 0
Musculoskeletal ‘food’ (1) 0 1
Eye 0 0 0
ENT 0 0 0
Skin 0 0 0
Immunological 0 0 0
Anaesthetics 0 0 0
Other 0 0 0
Total 11 9 20
Table 2.10. Analysis of non-drug-drug interactions, broken down by BNF therapeutic category and type of interacting substance (BNF and PJ data combined).

84
2.3.4 Lactation warnings
There were 171 warnings specific to breast feeding in this study. These were analysed
by BNF therapeutic category and nature of warning content (see Table 2.11). Ten
(5.8%) were backed up by an indication that harm had occurred to the suckling infant as
a result of the mother taking the drug and there were 62 cases (36.3%) where the
warning was supported by data from animal studies or where the statement ‘appears in
breast milk’ (without further qualification), accompanied the warning. In the absence of
further information, this was assumed to refer to animal studies. The remaining 99
(57.9%) simply advised ‘caution’ or ‘avoid’, without further qualification. In cases with
human data, there were three warnings to avoid and seven advising caution. In cases
with animal data, there were 35 warnings to avoid and 27 advising caution. In cases
where the statement was not supported by any evidence, there were 33 cases to avoid
and 66 advising caution. Caution was advised as such or taken to imply caution if the
warning included the statement ‘use only if the benefits outweigh the risks’.
The results illustrate the paucity of data in this area, where advice is often vague and
non-committal because safety data is lacking.

85
BNF therapeutic category
Caution backed up by evidence in man
Citation backed up by evidence from animal studies
Warning unsupported by any evidence.
Total
GI 0 3 (3C) 6 (2A/4C) 9 (2A/7C)
Cardiovascular 1 (1C) 7 (6A/1C) 25 (9A/16C) 33 (15A/18C)
Respiratory 0 2 (2A) 3 (2A/1C) 5 (4A/1C)
CNS 4 (2A/2C) 15 (13A/2C) 16 (6A/10C) 35 (21A/14C)
Infections 2 (2C) 18 (5A/13C) 12 (5A/7C) 32 (10A/22C)
Endocrine 1 (1C) 5 (3A/2C) 10 (3A/7C) 16 (6A/10C)
OG&Urinary 0 0 2 (2C) 2 (2C)
Malignancy 1 (1A) 1 (1A) 8 (2A/6C) 10 (4A/6C)
Nutrition&blood 0 0 3 (3C) 3 (3C)
Musculoskeletal 0 4 (2A/2C) 7 (3A/4C) 11 (5A/6C)
Eye 0 0 1 (1A) 1 (1A)
ENT 0 0 0 0
Skin 1 (1C) 2 (1A/1C) 3 (3C) 6 (1A/5C)
Immunological 0 0 0 0
Anaesthetics 0 5 (2A/3C) 3 (3C) 8 (2A/6C)
Other 0 0 0 0
Total 10 (3A/7C) 62 (35A/27C) 99 (33A/66C) 171 (71A/100C)
Table 2.11. Analysis of lactation warnings analysed by supporting statements and BNF chapter (BNF & PJ data combined).
C = advice to exercise caution; A = advice to avoid.
86
2.3.5 Pregnancy warnings
There were 252 new pregnancy warnings in this study. These were analysed by BNF
therapeutic category and by whether evidence was cited to support the warning. This
was analysed as human, animal or none, and whether, within these three main
headings, the advice was to avoid the drug or to use it with caution. Results are shown
in Table 2.12. Just over 10% of warnings cited evidence of harm in humans, 24 (88.9%)
of which advised drug avoidance. Two (leuprorelin and procarbazine) quoted both
animal and human data.
One third quoted data in animals, with 68 (78.2%) advising avoidance of the drug during
pregnancy. Over half the warnings cited no data, yet over half of these advised drug
avoidance.
The most common therapeutic areas for pregnancy warnings were CNS, infections and
malignant disease. The latter involved the most warnings – 60 (23.8%). This is logical
as many drugs in this class are known to be teratogenic or embryotoxic. Thirty-eight of
60 (63.3%) advised drug avoidance on the basis of animal studies; four cited evidence
of harm in humans. All of these advised drug avoidance.
Only 5 of 60 (8.3%) warnings in the malignant disease section advised caution; the rest
advised avoidance. Pregnancy warnings in this category were most frequently
accompanied by advice for both partners to adopt contraceptive measures during
and/or after therapy – 17 of 60 (28.3%). Contraceptive measures were also advised in
one case each in the CNS, infection and musculoskeletal sections.
Those therapeutic areas where cautions outweighed avoidance advice were the
cardiovascular, anti-infectives, and anaesthesia sections. This is logical as the benefits
of continuing with therapy with such agents may in general outweigh the risk to the
foetus of not doing so.

87
Human evidence Animal evidence None BNF therapeutic category
Avoid Caution Avoid Caution Avoid Caution
Total
GI 0 0 1 2 9 2 14
Cardiovascular 1 0 7 2 6 14 30
Respiratory 0 0 2 0 4 2 8
CNS 9 2 4 2 6 11 34
Infections 1 0 5 6 9 15 36
Endocrine 4 0 4 3 6 4 21
OG&Urinary 1 0 1 1 1 0 4
Malignancy 4 0 38 0 13 5 60
Nutrition&Blood 0 0 2 1 3 4 10
Musculoskeletal 0 0 3 2 3 3 11
Eye 0 0 0 0 0 2 2
ENT 0 0 0 0 0 0 0
Skin 2 0 1 0 4 0 7
Immunological 0 0 0 0 1 0 1
Anaesthetics 2 1 0 0 3 8 14
Other 0 0 0 0 0 0 0
Total 24 3 68 19 68 70 252
27 (10.7%) 87 (34.5%) 138 (54.8%)
Table 2.12. Analysis of pregnancy warnings analysed by BNF chapter and nature of supporting statements (BNF & PJ data combined).

88
2.3.6 Warnings in renal disease.
There were 204 such warnings in this study. These were analysed according to BNF
therapeutic category and on the basis of whether the warning applied to mild, moderate
or severe renal disease as defined in the BNF. These main categories were sub-divided
into whether advice was given to avoid the drug, reduce the dose or whether the
warning took the form of a simple caution.
Where advice was given for more than one grade of renal impairment, the least severe
grade of impairment was considered as representing the level at which caution needed
to be applied first. The warning that caution needed to be applied even in mild renal
impairment where none had existed before, is considered to be an important change.
Results are shown in Table 2.13.
The numbers of drugs contraindicated in at least mild, moderate and severe disease
were 19, 18 and 13 respectively. The total was 50 of 204 (24.5%).
Dose reductions were advised in at least mild, moderate and severe disease with 73, 32
and 10 drugs respectively. Cautions (without further qualification) in at least mild,
moderate and severe disease were advised in 35, 1 and 3 cases respectively.
In the majority of therapeutic areas the number of dose reductions / cautions was
greater than the number of times drug avoidance was advised. This might indicate that
compared to hepatic disease (see below), there is more evidence on which to base
advice and that for drugs cleared primarily by the kidney, it is easier to predict what a
certain level of renal impairment will mean for drug clearance.

89
Mild Moderate Severe BNF therapeutic category Avoid Decrease Caution Avoid Decrease Caution Avoid Decrease Caution
Totals
GI 0 1 1 1 0 0 3 1 0 7
Cardiovascular 0 17 5 5 5 0 1 0 0 33
Respiratory 0 3 3 1 1 0 0 1 1 10
CNS 1 10 4 1 7 0 4 4 0 31
Infections 5 22 11 3 11 1 2 4 0 59
Endocrine 4 8 1 5 3 0 0 0 0 21
OG&Urinary 1 1 2 0 1 0 0 0 1 6
Malignancy 3 6 4 1 1 0 0 0 0 15
Nutrition&blood 3 0 1 1 0 0 0 0 0 5
Musculoskeletal 1 3 1 0 3 0 0 0 0 8
Eye 0 0 1 0 0 0 0 0 0 1
ENT 0 1 0 0 0 0 0 0 0 1
Skin 0 1 0 0 0 0 1 0 0 2
Immunological 0 0 0 0 0 0 0 0 1 1
Anaesthetics 1 0 1 0 0 0 2 0 0 4
Other 0 0 0 0 0 0 0 0 0 0
Totals 19 73 35 18 32 1 13 10 3 204
Table 2.13 Analysis of warnings on the use of drugs in renal impairment by BNF therapeutic category, nature of supporting statements and degree of renal impairment at which the warning first applied.

90
2.3.7 Warnings in hepatic disease
There were 176 new warnings on the use of drugs in hepatic disease. These were
analysed in terms of BNF therapeutic category and whether they were to be avoided or
a dose reduction applied. These main categories were sub-divided in terms of severity
of disease. Results are shown in Table 2.14.
To count in the mild category, the first level of hepatic impairment at which the warning
applied was considered; in all cases, this was mild / moderate and no attempt to
distinguish between mild and moderate disease was used when applying the warning. A
total of 79 of 176 (44.9%) warnings were contraindicated in liver disease and 97 of 176
(55.1%) contained advice that the drug should be used with caution.
Forty-six of 79 (58.2%) drugs were contraindicated in severe disease only; advice to
exercise caution in lesser degrees (mild or moderate) of hepatic impairment was
present in 15 of these 46 (32.6%).
Advice to exercise caution / reduce the dose in severe disease occurred in 19 cases out
of 97 (19.6%) whereas new cautions were added in 77 of 97 (79.4%) cases with at least
mild hepatic disease (the latter was assumed when a ‘caution’ was applied without
further qualification).
Just one warning was accompanied by information on the magnitude of dose change
required where dose reduction was advised.

91
Change
Avoid Decrease dose
BNF therapeutic area
Severe disease
Mild disease Severe disease
Mild disease
Totals
GI 0 2 0 3 5
Cardiovascular 10 3 3 10 26
Respiratory 0 4 0 1 5
CNS 10 4 3 18 35
Infections 7 10 3 13 33
Endocrine 4 0 5 3 12
OG&Urinary 0 0 2 2 4
Malignancy 9 4 1 14 28
Nutrition&Blood 3 3 0 2 8
Musculoskeletal 2 1 0 6 9
Eye 0 0 1 0 1
ENT 0 0 0 1 1
Skin 0 0 0 1 1
Immunological 0 0 1 0 1
Anaesthetics 1 2 1 2 6
Other 0 0 0 1* 1
Totals 46 33 20 77 176
Table 2.14. Analysis of warnings on the use of drugs in hepatic disease by BNF chapter, whether the drug should be avoided or whether dose adjustment should be made, and severity of disease (BNF & PJ data combined).
*warning on the possibility that the poisoning antidote, methione might precipitate coma.

92
2.4 Analysis for trends
When looking for trends in data it should be remembered that relationships need not be
linear. Indeed, considering the nature of this research, it is unlikely that the appearance
of new safety warnings (and indeed new products to which they apply) would follow a
geometric increase or decrease with time throughout the study. The Spearman’s rank
correlation coefficient is thus a rather crude measure to apply; however, it should reveal
any gross relationships between time in the study and the emergence of safety notices.
It is also the right test to apply if there is evidence that the data is not normally
distributed. Application of the Kolmogorov-Smirnov test for normality showed this to be
true for some data sets. A two-tailed test was chosen to avoid the preconception that
the numbers of safety notices might increase or decrease with time. The results of
correlational analysis are shown in Table 2.15.
A normal pattern for a process is one of randomness; but if one or more factors
influence that process in a systematic way, they may introduce non-randomness. In the
context of this research, it was of interest to see if there was any systematic change in
the appearance of safety notices over time. The test for randomness chosen for this
study was the runs test. Here, the null hypothesis was that the data had a random
sequence and that overall, there was no consistent increase or decrease in the
appearance of safety notices over the study period. Two measures of randomness were
applied. The first was based on the number of runs occurring above and below a
calculated median for the data set under study. A run is defined as one or more
consecutive points on the same side of the median. The test for the number of runs
about the median is sensitive to two types of non-random behaviour – mixtures and
clustering. An observed number of runs that is statistically greater than expected
supports the presence of mixing. An observed number of runs that is statistically less
than expected supports clustering.

93
The second measure was one of trend. This is based on the number of runs up or
down. A run is defined as one or more consecutive points in the same direction. A new
run begins each time there is a change in direction in the data sequence. The test for
runs is sensitive to two types of non-random behaviour – oscillation and trends. An
observed number of runs that is statistically greater than expected supports the
presence of oscillation. An observed number of runs that is statistically less than
expected supports the existence of a trend. The results of these analyses for clustering
and trend appear in Table 2.15.
Examples of individual programme printouts are included as illustrations. Table 2.16
and Figure 2.10 show the results of the Spearman’s rank correlation and runs tests
respectively for warning notices appearing in the PJ over the study period. They show a
positive correlation (p=0.001) with significant clustering (0.011). This may be interpreted
as non-random behaviour that is sporadic. As can be seen in Figure 2.10, almost all the
data points including and after point 12 are above the median. As discussed earlier, this
might indicate a change in PJ policy to a more thorough highlighting of such notices
around this time. This almost certainly contributed to the significant correlation seen for
the combined data set (p=0.004); although any significant clustering was lost when the
BNF and PJ data were combined (p=0.323).
Two therapeutic categories showed positive correlations: endocrine, with significant
clustering) and musculoskeletal (without clustering). The reason for the clustering with
endocrine might be the appearance of a number of warnings and precautions
associated with hormonal oral contraceptive and hormone replacement therapies that
appeared around BNF periods 7 to 11 (see Table 2.17 and Figure 2.11).
The only significant results for trend, in the ear nose and throat, and skin categories are
based on very small data sets and interpretation is problematic.

94
Statistical test
Runs tests – p values (n=20)Data set (n)
Spearman’s
rank order
p value
Clustering Mixtures Trends Oscillation Comment, if significant
BNF notices (1509) -.17 0.942 0.011 0.989 0.867 0.133 clustering
PJ notices (1121) .691 0.001 0.011 0.989 0.711 0.289 correlation and clustering
(BNF+PJ)(2630) notices .612 0.004 0.323 0.677 0.500 0.500 correlation
GI (152) -.186 0.433 0.042 0.958 0.133 0.867 clustering
Cardiovascular (400) .398 0.082 0.916 0.084 0.987 0.013 oscillation
Respiratory (72) .020 0.934 0.221 0.779 0.133 0.867 -
CNS (618) .388 0.144 0.500 0.500 0.289 0.711 -
Anti-infectives (568) .324 0.164 0.916 0.084 0.711 0.289 -
Endocrine (172) .615 0.004 0.011 0.989 0.289 0.711 correlation and clustering
Obs / Genitourinary (59) .022 0.982 0.288 0.712 0.133 0.867 -
Malignancy (285) .174 0.463 0.677 0.323 0.500 0.500 -
Nutrit. / blood (36) -.120 0.615 0.179 0.821 0.289 0.711 -
Musculoskeletal (113) .516 0.020 0.089 0.911 0.289 0.711 correlation
Ophthalmic (18) .060 0.801 0.288 0.712 0.133 0.867 -
Ear / nose / throat (12) -.324 0.163 0.672 0.328 0.001 1.000 trend
Skin (33) .310 0.183 0.338 0.662 0.048 0.952 trend
Immunologicals (31) .377 0.101 0.189 0.811 0.133 0.867 -
Anaesthetics (60) .028 0.906 0.388 0.662 0.500 0.500 -
Dose (111) -.571 0.009 0.033 0.967 0.003 0.997 correlation and trend

95
Interactions (841) -.052 0.828 0.084 0.916 0.048 0.952 trend
Hepatic (176) .491 0.028 0.677 0.323 0.711 0.289 correlation
Renal (204) .459 0.042 0.323 0.677 0.867 0.133 correlation
Pregnancy (252) .484 0.030 0.480 0.520 0.048 0.952 correlation and trend
Lactation (257) .453 0.045 0.323 0.677 0.289 0.711 correlation
Warn./Prec. (187) .643 0.002 0.106 0.894 0.711 0.289 correlation
Indications (37) .330 0.155 0.033 0.967 0.013 0.987 clustering and trend
Side effects (537) .677 0.001 0.011 0.989 0.987 0.013 corr., clustering and osc.
Contraindications (104) .090 0.707 0.323 0.677 0.133 0.867 -
Table 2.15 Longitudinal analyses of data for correlation with increasing BNF period (Spearman’s rank order test) and trend.
Shaded values represent statistically significant (p<0.05) results.

BNF Period Counts PJ
96
Correlation Coefficient 1.000 .691 Sig. (2-tailed) . .001
BNF Period
N 20 20 Correlation Coefficient .691 1.000 Sig. (2-tailed) .001 .
Spearman's rho
Counts PJ
N 20 20
Table 2.16 Results of Spearman’s rank order test for warning notices appearing in the PJ
with increasing BNF period.
2018161412108642
120
100
80
60
40
20
0
Observation
C3
Number of runs about median: 6Expected number of runs: 10.9Longest run about median: 6Approx P-Value for C lustering: 0.011Approx P-Value for Mixtures: 0.989
Number of runs up or down: 14Expected number of runs: 13.0Longest run up or down: 2Approx P-Value for Trends: 0.711Approx P-Value for Oscillation: 0.289
Run Chart of C3
Figure 2.10 Results of runs analysis of BNF period against appearance of PJ warning
notices .
C3 = the PJ data set; observation = BNF sequence number, corresponding to date periods in Table 2.2.

BNFPeriod End
97
Correlation Coefficient 1.000 .615 Sig. (2-tailed) . .004
BNF Period
N 20 20 Correlation Coefficient .615 1.000 Sig. (2-tailed) .004 .
Spearman's rho
End
N 20 20
Table 2.17 Results of Spearman’s rank order test for warning notices appearing in the
endocrine category with increasing BNF period.
2018161412108642
20
15
10
5
0
Observation
C10
Number of runs about median: 6Expected number of runs: 10.9Longest run about median: 6Approx P-Value for Clustering: 0.011Approx P-Value for Mixtures: 0.989
Number of runs up or down: 12Expected number of runs: 13.0Longest run up or down: 3Approx P-Value for Trends: 0.289Approx P-Value for Oscillation: 0.711
Run Chart of C10
Figure 2.11 Results of runs analysis of BNF period against appearance of warning
notices in the endocrine therapeutic category.
C10 – endocrine data set; observation = BNF sequence number, corresponding to date periods in
Table 2.2.

98
Turning to type of warning, an interesting significant negative correlation, accompanied by a
significant trend was observed for dose changes made on the grounds of safety (see Table
2.15). This indicates a decreasing need to amend drug doses on the grounds of safety; perhaps
because as new products are licensed more is known about dose modification in particular
circumstances (e.g. age, co-morbidities) and precautions are already in place for these special
groups.
There was a marginally significant trend for emergence of drug interactions but no significant
correlation. This might be expected, as new drugs appeared throughout the study period and
established drugs would be expected to have additional warnings added to their product
information about relevant interactions.
Table 2.15 shows that there were significant positive correlations with time for warnings in the
hepatic, renal, pregnancy and lactation categories; but these were not accompanied by
appreciable relations ships in clustering, mixtures, trend or oscillation.
The warnings and precautions, and side effects sections, both large categories, showed highly
significant positive correlations with time. The side effect data analyses are shown in Table 2.18
and Figure 2.12 respectively. This data set showed significant clustering (p=0.011) and
oscillation (p=0.013). New side effects can appear at any stage in the life of a drug, and
intuitively, a positive trend might not be expected. The significant positive correlation may be a
function of consistent values above the median from BNF 14 onwards, compared with much
lower values, almost all below the median, before this period. This may reflect the general tend
to wider and more immediate dissemination of information about new side effects and the data
serve to remind us that new side effect data is always emerging in key drug information sources
used by doctors and pharmacists.

BNF Period SEs
99
Correlation Coefficient 1.000 .677 Sig. (2-tailed) . .001
BNF Period
N 20 20 Correlation Coefficient .677 1.000 Sig. (2-tailed) .001 .
Spearman's rho
SEs
N 20 20
Table 2.18 Results of Spearman’s rank order test for warning notices appearing in side
effect (SEs) category with increasing BNF period.
2018161412108642
70
60
50
40
30
20
10
0
Observation
C29
Number of runs about median: 6Expected number of runs: 10.9Longest run about median: 8Approx P-Value for Clustering: 0.011Approx P-Value for Mixtures: 0.989
Number of runs up or down: 17Expected number of runs: 13.0Longest run up or down: 2Approx P-Value for Trends: 0.987Approx P-Value for Oscillation: 0.013
Run Chart of C29
Figure 2.12 Results of runs analysis of BNF period against appearance of warning
notices in the side effects (SEs) category.
C29 – side effect data set; observation = BNF sequence number, corresponding to date periods in
Table 2.2.

100
2.4 Overall discussion points
Key findings from Phase 1 research are as follows:
1. Data on safety notices were difficult to validate due to the fragmentary nature of
records held by key information providers, e.g. the BNF, DataPharm Publications
and the MHRA. The pharmaceutical companies approached, professed
themselves to be under-resourced to assist with data validation.
2. Meetings with BNF staff and pilot investigations with pharmaceutical companies
and the MHRA indicated general endorsement of the methodology and
convinced the author that her approach to surveying labelling changes made on
safety grounds was the best available to obtain a ‘broad brush’ picture during the
chosen study period.
3. Supplementation of BNF data with that from the PJ was essential to obtain as
complete a picture as possible, particularly with regard to drug interactions and
side effects.
4. A total of 2,630 notices were encountered during the ten-year study period,
affecting 688 individual drugs. The two main safety notice categories were drug
interactions (841) and side effects (537). The PJ reported a disproportionately
high number of each of these warnings, perhaps reflecting an editorial decision to
highlight this information to pharmacists as soon as possible (the PJ is a weekly
publication).
5. The rank order of the four most common therapeutic areas in which safety
notices occurred was: CNS (23.5%) > anti-infectives (21.6%) > cardiovascular
(15.2%) > cancer chemotherapy (10.8%). The top two categories contain many
products, often used in complex ways, diseases and combinations and it is not
surprising to see them here. The presence of anti-infectives so high up the order
detracts from the concept that these drugs are relatively safe. There are many
reasons for the high safety notice frequency – for example the high number of

101
drug interactions now known to occur between anti-retroviral and anti-fungal
drugs.
6. The rank order of the four most common safety notice categories was: drug
interactions (32%) > side effects (20.4%) > pregnancy (9.6%) > renal disease
(7.2%). These represent four key areas where prescribers need up to date
information if they are to ensure the safety of their prescribing.
7. There were 537 notices about new drug side effects (20%) of the total. The ratio
of Type A : Type B side effects (ADRs) in this study was 1:3.3. Traditionally, the
ratio of all Type A to Type B ADRs is the reverse (4:1; see Section 1.1.2).13
However, in the post-authorisation period, more Type B reactions are likely to
emerge and sponsor the issue of safety notices. New Type A reactions were still
emerging however, perhaps raising concerns about the rigour of pre-
authorisation studies in this respect.
8. Where safety notices advising drug avoidance or contraindication were much
more common in categories such as hepatic (44.9%), lactation (41.5%) and
pregnancy (63.5%) than renal (25.0%). In the latter category, more helpful advice
was available on dose adjustment at different stages of renal impairment. This
represents the relative paucity of information in the other categories mentioned
above, where frequently, no justification (such as evidence from animal studies)
was provided. These may represent areas where information could be improved
to assist prescribing decisions; although it is acknowledged that data in
pregnancy is difficult to generate in a systematic way.
9. In the pregnancy category, those therapeutic areas where cautions outweighed
avoidance advice were the cardiovascular, anti-infectives, and anaesthesia
sections, where the benefits of continuing with therapy may outweigh the risk to
the foetus of discontinuation.
10. Correlation analysis was of limited use in this study, but did reveal non-
randomness in some data sets. One example was the apparent increase in

102
safety notices appearing in the PJ from BNF No 42 (April-Sept 2001) onwards.
This may be a reflection of an increased incidence of such notices or more
rigorous reporting at latter stages of the study.
Another was the positive correlation, with significant clustering for notices in the
endocrine category, which coincided with increased safety concerns about
cardiovascular events and possible cancers associated with oral contraceptive
and hormone replacement products, where ‘blanket’ warnings covered many
products.

CHAPTER 3: IN-DEPTH STUDY OF THE CIRCUMSTANCES SURROUNDING
PRODUCT WITHDRAWALS AND MAJOR LABELLING CHANGES IN THE UK AND
THE EVIDENCE BASE FOR SUCH DECISIONS.
3.1 Introduction
Chapter 2 provided an overview of Phase 1 of this research, where safety notices
concerning products marketed in the UK appearing during a 10-year period were
analysed. To gain an insight into the implications for product survival in the market
place, Phase 2 studied in-depth, all products which were either withdrawn for safety
reasons or where a major safety notice was published as a result of a safety concern. In
both cases, product survival probabilities were calculated using Kaplan-Meier statistics.
A key objective of this part of the research was to assess the quality of evidence on
which withdrawal or labelling change decisions were made. A brief discussion of the
options for doing this follows.
3.2 Data quality and hierarchy in a drug safety context.
Section 1.2 described the sources and nature of ADR information available to help
conduct a benefit / risk assessment. It is clear from the descriptions, that not all sources
produce the same type of data; quality and quantity are not the same.
Assessing the quality (or level) of evidence on which clinical recommendations are
based is not a new concept. Since the 1970s, systematic assessments of the available
literature have been used to formulate local and national guidelines aimed at reducing
confusion and enhancing communication. It is rarely possible for an individual
healthcare professional to make such judgements on individual cases due to lack of
time and the absence of all the relevant evidence to hand.
Methods for grading hierarchies of evidence of increasing complexity have emerged
since the 1970s. A 2002 survey 138 indentified 40 such schemes and a study in 2006
103

identified 20 more.139 Sackett et al. 140 introduced a ‘hierarchy of evidence’ designed to
help clinicians critically appraise the scientific literature. This is very similar to that
proposed by Gray.141
The concept of the hierarchy of evidence is based on an assumption that controlled,
randomised, blinded experimental studies minimise opportunities for bias and error, and
thus increase certainty in the research findings. Other authors have produced
evaluations of the utility of the different data types in critically appraising drug efficacy
and these are summarised, together with advantages, disadvantages and examples of
their use in a PV context, in Table 3.1. At this point it is stressed that there is no well-
known hierarchy to assist in assessment of drug harm.
Study design can be important in assessing the causal nature of an ADR because some
designs are more rigorous and appropriate than others, so Table 3.1 also provides an
assessment of evidence quality based on the level of intrusion of bias and other
methodological imperfections. Advancing from designs at the bottom of the table to the
top, one encounters studies that become progressively more sophisticated and
expensive to perform, yet in scientific terms, provide more robust, less biased data. It
should be noted that those at the top have been traditionally used to provide mainly
proof of clinical efficacy rather than safety in comparative clinical trials, and as
mentioned in Chapter 1, may not deserve their ranking here when safety evidence is
considered.
Study Design Level of Evidence
Advantages Disadvantages Examples used in a PV context (see text for description)
Meta-analysis of two or more RCTs
1 Allows accumulation of data from similar trials to allow a more robust assessment of outcomes
Trials must be closely matched in design and measure of outcomes
Chalmers et al. 152
Randomised clinical trial (RCT)
1 Most convincing design. Only design that controls for un-
Most expensive Bombadier et al.152
104

measurable confounders.
Cohort study (including prescription event monitoring)
2 Allows study of multiple outcomes, uncommon exposures.
Low bias in selection and therefore exposure data.
Incidence data available.
Possibly biased outcome data.
More expensive than case-control. Prospective conduct may take years to completion.
Manson et al. 150
Wilton et al. 151
Case-control study
3 Multiple exposures can be studied.
Uncommon diseases can be evaluated.
Logistically easier, faster and cheaper than cohort studies.
Selection and matching of controls can be problematic.
Possible biased exposure data.
Strom & Stolley 149
Secular trend analysis
3 Can provide rapid answers
No controlling for confounding
Mrakush & Siegel 148
Case series 4 Plentiful individual patient detail
Incidence not available; no control group. Cannot be used for hypothesis testing
JCPDU 147
Case reports 4 Plentiful individual patient detail; cheap and easy method for generating hypotheses
Cannot be used for hypothesis testing
Herbst et al. 146
Expert opinion 4 Can provide ideas for hypothesis testing
Opinions may be strongly biased
GRADE 144
Animal and other in vitro studies
5 Can provide ideas for hypothesis testing.
Can signal that use in man is inadvisable under certain circumstances.
Problems with translating results from various animal species to man; particularly Type B ADRs,
Wang et al. 145
Table 3.1 Clinical study designs and traditional hierarchies of evidence assigned to them (represents an amalgamation of several authors’ assessments). 140, 141, 142,143,144
105

Animal and in vitro data (Level 5 in Table 3.1) can provide a wealth of information on the
pharmacology, pharmacokinetics and mechanisms of individual ADRs and drug
interactions that produce them;145 but applicability of the data to man is confounded by
translation from various animal species to humans and differences in doses required to
elicit a response. Expert opinion (Level 4), if not substantiated with hard clinical
evidence, cannot allow the recipient to form an informed opinion and may well be
influenced by the agenda, experiences and attitudes of the person who made it; it
should never be used alone as a basis for making safety decisions.144 Case reports of
events in individual patients (Level 4) may provide a wealth of clinical detail but give no
concept of prevalence or generalisability; neither are they controlled. They are at best
the basis for generating hypotheses to be tested by other means. They may however be
the only information available on very rare ADRs, for example the appearance of clear
cell vaginal adenocarcinoma occurring some 30 years after in utero exposure to
diethylstilbestrol.146
Case series (also Level 4) are collections of case studies of patients who have been
exposed to the drug and their clinical outcomes then described. They are often from a
single hospital of medical practice; study can be prospective, in which case the data is
likely to be more robust; or retrospective. Some assessment of incidence is possible if
one knows the number of patients exposed to the drug and not displaying the ADR in
question. To be of most use, case series need to be large and prospective in nature;
such a series was used to support the claim that cimetidine was not related to
agranulocytosis post-marketing in the US. In this example, the MA holder asked its
representatives to recruit patients through their doctors.147 In this way many more
patients were studied than were included in pre-marketing studies, allowing greater
confidence that this relatively rare ADR did not occur. As with case studies, a major
drawback to case series is that there is no control.
Secular trend analyses (so-called ‘ecological studies; Level 3) examine trends in an
exposure that is a presumed cause of the ADR of interest. Trends can be examined
over time and across geographical boundaries. Statistics such as sales data might be
compared with the death rates for a particular disease. For example, mortality rates
106

from venous thromboembolism were seen to increase in parallel with increasing oral
contraceptive sales in women of reproductive age.148 Secular trend analyses lack data
on individual patients, are uncontrolled and fail to consider confounding factors such as
other lifestyle changes. They can however be useful for hypothesis testing where a
rapid answer is required, but are unlikely to provide sufficiently robust conclusions on
their own.
Case-control studies (Level 3) compare cases with the ADR (or disease) of interest with
controls that do not have the disease. Such a methodology was used to demonstrate a
strong link between oral contraceptive use and venous thromboembolism.149 These
investigations facilitate the study of multiple exposures in addition to the drug in
question and are also useful when studying a relatively rare disease, using significantly
smaller numbers than required for cohort studies. Case-control studies suffer from being
retrospective, dredging exposure detail from medical records, questionnaires or
interviews and selecting and matching controls, which can be problematic and subject
to bias.
Cohort studies (Level 2 in Table 3.1) identify subsets of a population and follow them
over time, searching for differences in outcome. They can compare exposed with non-
exposed subjects, one exposure with another, or the entire cohort can be followed for a
set period to detect a series of outcomes. For example, following a cohort of women of
childbearing age showed a relationship between venous thromboembolism and use of
oral contraceptives which was much weaker in women who used alternative methods of
contraception.150 This supported data derived from secular trends and case-control
studies. Because subjects in cohort studies are recruited on the basis of exposure
rather than presence or absence of a disease, they have to be much larger, depending
on the expected incidence of the ADR (if known); but they do not suffer with the
problems of selecting and matching controls and gathering data retrospectively. Thus a
causal association demonstrated by a case-control study is likely to be less robust than
one demonstrated by a cohort study; hence the higher quality rating. Cohort studies are
most useful post-marketing, when relatively large numbers of patients are exposed; of
course, they may need to be large if the ADR in question is rare and they may also have
107

to be lengthy to detect Type B reactions that do not have a defined time-exposure
relationship. The PEM technique used by the DSRU is essentially a post-marketing,
observational cohort method, which has yielded valuable information on a range of
ADRs associated with newly marketed drugs. One such example is the detection of
latent visual field defects associated with the use of vigabatrin.151
Randomised controlled clinical trials (Level 1) are discussed in detail in Section
1.2.1.2.iii. They are often viewed as the gold standard of clinical methodologies due to
tight control of subject recruitment and monitoring, the use of appropriate controls and
absence of bias due to double-blinding. Thus any causal associations derived using this
methodology are likely to be stronger than those derived from the other methodologies
mentioned above. Use of this methodology to detect anything but common ADRs is
problematic unless large numbers of subjects are involved; 152 and to use such a
methodology to expose an experimental group to a known potential risk as opposed to
benefit raises serious ethical questions. Tight inclusion criteria also mean that ‘real
world’ prescribing does not occur and subjects without factors potentially contributing to
the development of ADRs are excluded from study. The previous comments also apply
to meta-analyses of several clinical trials (also Level 1), with the exception that if more
subjects are studied and their recruitment criteria a truly comparable, more ADRs may
be seen, allowing the generation of an hypothesis for further investigation. Meta-
analyses may thus be useful in quantifying uncommon ADRs- as long as they are
included in the individual trial reports.153
Summarising, each study design may have its part to play in pharmacovigilance. In
general, scientific quality increases from the bottom to the top of Table 3.1. Case
reports and case series are useful for suggesting an association that can be followed up
using higher techniques. Ultimately, if the study question justifies the investment and
can tolerate the delay for results to become available, cohort studies and even RCTs
can be performed to provide more definitive answers.
The grading system recommended by Gray 141 was used in this research because:
it is simple to follow, with no complex matrices;
108

it is transparent;
it encompasses most of the features of previous and subsequent grading
systems;
it provides a recognised and familiar framework with broad categories; and
it is easily reviewed and possibly amended in the context of ADRs.
With reference to the last point, as will be shown in Chapter 4, the use of Gray’s
hierarchy and others like it, to rate ADR evidence was not without problems among
pharmacovigilance workers.
3.1 Methodology
3.3.1 Product withdrawals
The construction of a list of withdrawn products was considered a first step in helping to
gain a better understanding of the safety issues. A list of products withdrawn in the
study period was obtained from the MHRA, address: MHRA Information Centre
G:\Information Centre\Icsirs\withdrawn drugs.doc. A thorough literature search was
conducted to ascertain the reasons for withdrawal and the evidence on which these
were based. This included examination of MHRA / CSM communications such as
‘Current Problems in Pharmacovigilance’ (now Drug Safety Updates) and ‘Dear
Healthcare Professional’ letters. The MHRA website
(www.mhra.gov.uk/home/idcplg?IdcService=SS_GET_PAGE&nodeId=51. Accessed
20/6/08) was also scrutinised for minutes of safety meetings published prior to, or
contemporary with, the withdrawal decision.
3.3.2 Major safety notices
Applying the same research strategy used in Chapter 2, all major safety notices
concerning marketed products were identified , where ‘major’ was defined as being
found in any of the following:
109

1. the subject of a ‘Dear Healthcare Professional’ letter from the Chief Medical
Officer or his / her deputies;
2. a ‘Blue box’ notice appearing in BNFs 31 to 50;
3. a topic discussed in relevant editions of the publication, ‘Current Problems in
Pharmacovigilance’; or
4. a topic mentioned in the online archive of minutes of CSM Safety Subcommittee
meetings.
Every effort was taken to determine the exact date on which the information was
brought to the attention of healthcare professionals. In the case of 1 above, this was the
date of the ‘Dear Healthcare Professional’ letter. For 2 above, this was the middle of the
period covered by the BNF in question; so for a BNF published in September, the date
taken was the first day of June of that same year. For the March edition, the date was
the first day of December from the previous year. For 3 above, the date cited in the
relevant monograph was used. If this was not available, the date of publication of that
particular edition of ‘Current Problems’ was used. For 4, the date cited in the minutes or
if unavailable, the date of the minutes themselves, was used. Wherever possible, the
actual date of appearance of the notice was triangulated by reference to more than one
source.
3.3.3 Kaplan-Meier survival analysis
It was of interest to see what the probability of survival of a product would be over the
period of the present study; where ‘survival’ is defined as the length of time the product
stayed on the market before being withdrawn on grounds of safety. A similar analysis
was conducted with major labelling changes.
The method was similar to that adopted by Lasser et al. 3 and described by Altman. 154
The list of all licensed medicinal products, classed as ‘new active substances’ or ‘new
110

chemical entities’ (NCEs) was obtained from the MHRA via a request made to the
general enquiries section at: [email protected] (cited 20/6/09; anonymous
correspondent).
The list, in Excel format, was edited to exclude the following: duplicates; items with the
same brand name (e.g. multiple formulations of the same NCE); products licensed
before or after the 10-year study period; sutures; and diagnostic agents. Mis-spelt
products were also verified.
Inclusion criteria were: all products licensed between 1/9/95 – 31/8/05 that were NCEs;
and those NCEs that started off as POM but were subsequently deregulated to P.
The MHRA data contained all NCEs from 1990 – September 2005, their MA numbers
and the Product Birth Date (authorisation date). This data set was edited to include only
those products covered by the study period (1/9/95 – 31/8/05). The Product Birth Date
was used initially to approximate to the product market launch date. A preliminary
analysis of 50 products across the range showed that in most cases, the licensing and
launch dates were very close. Where large discrepancies were found, especially with
the withdrawn products, the actual launch date was used in further analyses.
The exact date of product withdrawal was determined via cross-reference to a range of
sources including the MHRA publication, ‘Current Problems in Pharmacovigilance’;
‘Dear Healthcare Professional’ letters issued by the CSM and manufacturers’ Medicines
Information departments.
3.3.3.1 Data analysis - product withdrawals
Using Excel, the dates of product licensing / launch and product withdrawal were
converted to the corresponding date number (days). Product withdrawal date (various)
and if not withdrawn, the closing (cut-off) date of the study 31/8/05 were also converted
to number dates. The period between launch and withdrawal / cut-off was calculated in
days and converted to weeks. The proportion of all NCEs withdrawn was calculated.
111

The exact launch and withdrawal dates were obtained from the licensing authority or the
product manufacturer. Data were subjected to Kaplan Meier survival analysis using
STATA Version 10 (StataCorp. College Station, Texas), to determine the product
survival probability. All products containing new chemical entities licensed between
1/9/95 – 31/8/05 were included. Survival was defined as reaching the endpoint of the
study without withdrawal; such cases were censored. This method takes into account
the fact that NCEs were on the market for varying periods of time. Drugs that survived
were coded as ‘censored’.
3.3.3.2 Data analysis – major safety notices
The date of the first major safety notice applying to a particular product was determined
by triangulation using the sources listed above. Product launch date was determined by
the methods outlined in Section 3.3.3.1.
The proportion of all NCEs subject to a major safety notice was calculated. Data were
subjected to Kaplan Meier survival analysis as described in Section 3.3.3.1 to determine
product survival probability without a major safety notice being applied. All products
containing new chemical entities licensed between 1/9/95 – 31/8/05 were included.
3.3.4 Assessing data quality
Safety data cited in support of each action was determined using all the sources used in
the product withdrawal and labelling searches. In each case printed copy was obtained
and analysed for key information on the nature of the ADR report, the number of
patients involved, the date of signal generation and ADR severity. Each report was
classified and stratified according to its strength, using Gray’s hierarchy shown in Table
3.2.141
112

113
Level Evidence
1 Evidence obtained from systematic reviews of relevant and multiple
randomised controlled trials (RCTs) and meta analyses of RCTs.
2 Evidence obtained from at least one well designed RCT.
3 Evidence obtained from well designed non-randomised controlled trials, single
group pre-post, cohort, time series or matched experimental studies.
4 Evidence obtained from well-designed non-experimental research from more
than one centre or research group.
5 Opinion of respected authorities based on clinical experience, descriptive
studies or reports of expert committees.
Table 3.2 Summary of Gray’s hierarchy of evidence used to assess the ADR
evidence for products included in the study.141
3.4 Results
3.4.1 Product withdrawals
During the study period, 15 products were withdrawn; details of these products are
shown in Table 3.3 together with an overview of the sources of evidence on which the
withdrawal notice was reported to be based.
Higher quality data (level 2-randomised controlled trials) were cited for five products; a
meta-analysis of RCTs was cited in just one case. Published case studies were cited for
three products. Spontaneous (UK yellow card) reports (level 4 data) were cited in all
cases and US Medwatch reports were co-cited for 12 (80%). Just two decisions
involved the use of UK prescription event monitoring data (sertindole and cisapride).
Other pharmacovigilance organisations (e.g. EMEA) contributed to 6 (40%). Published
case studies contributed to just 3 (20%) decisions.

Generic (brand name)
Manufacturer Year action taken
Safety concern(s)
Date withdrawn
Yellow
card reports
Medwatch reports
Other pharmacovigilance organisations (e.g. EMEA)
PEM
studies Company risk vs benefit analysis
UK RCTs conducted post‐marketing
Non‐UK RCTs
Meta‐analysis of new
trial data
TPublished case studies
pemoline
(Volital)
Abbott 1997 hepatotoxicity 1/9/97 √ √
troglitazone
(Romazin)
Glaxo
Wellcome
1997 hepatotoxicity 1/12/97 √ √ √
sertindole
(Serdolect)
Lundbeck 1998 arrhythmias 2/12/98 √ √
tolcapone
(Tasmar)
Roche 1998 hepatotoxicity 12/11/98 √ √ √
fenfluramine
(Ponderax)
Servier 1997 cardiac valve
disease
1/10/97 √ √ √ √ √ √ √
dexfenfluramine
(Adifax)
Servier 1997 cardiac valve
disease
1/10/97 √ √ √ √ √ √
mibefradil
(Posicor)
Roche 1998 drug
interactions
30/6/98 √ √
trovafloxacin
(Trovan)
Pfizer 1999 hepatotoxicity 3/6/99 √ √
grepafloxacin
(Raxar)
Glaxo
Wellcome
1999 QT
prolongation
1/10/99 √ √ √
pulmonary
surfactant (Alec)
Britannia 2000 increased
mortality
1/5/00 √
cisapride
(Prepulsid)
Janssen‐Cilag 2000 arrhythmias 28/7/00 √ √ √ √
Droperidol
(Droleptan)
Janssen‐Cilag 2001 arrhythmias 31/3/01 √ √ √
cerivastatin
(Lipobay)
Bayer 2001 rhabdomyolysis 8/8/01 √ √ √
rofecoxib
(Vioxx)
MSD 2004 thrombotic
events
30/9/04
Table 3.3 All products withdrawn during the study period and the evidence cited for withdrawal.
√ √ √ √ √
valdecoxib
(Bextra)
Pfizer 2005 serious skin
reactions
7/4/05 √ √ √ √
114

There were no products where the decision to withdraw was based on a single source;
however the sources used – which ranged from published randomised controlled trials
and detailed case reports to unpublished yellow card data or in-house company reports
varied considerably, both in quality and number.
518 eligible products were launched during the study period of which 9 (1.7%) were
licensed and withdrawn for safety reasons. All safety decisions were based on more
than one safety data source.
These products were examined against the background of all products licensed during
the study period to assess survival probability. Data for these products is summarised in
Table 3.4.
Table 3.4 List of products licensed and withdrawn for safety reasons during study period.
Brand name
Generic name Launch date
Withdrawal date
Safety concern MA holder
Romazin troglitazone 1/10/97 1/12/97 Hepatotoxicity Glaxo Wellcome
Serdolect sertindole 1/9/96 2/12/98 Arrhythmias Lundbeck
Tasmar tolcapone 28/8/97 12/11/98 Hepatotoxicity Roche
Posicor mibefradil 1/8/97 9/6/98 Drug interactions Roche
Trovan trovafloxacin 3/7/98 3/6/99 Hepatotoxicity Pfizer
Raxar grepafloxacin 1/1/98 1/10/99 Arrhythmias Glaxo Wellcome
Lipobay cerivastatin 13/2/97 8/8/01 Rhabdomyolysis Bayer
Vioxx rofecoxib 7/6/99 30/9/04 Thrombosis MSD
Bextra valdecoxib 27/3/03 7/4/05 Skin reactions Pfizer
115

The Kaplan Meier survival curve for product withdrawal is shown in Figure 3.1.
0.8500
0.9000
0.9500
1.0000
Pro
ba
bili
ty
0 60 120 180 240 300 360 420 480 540Weeks since market launch
95% CI Survivor function
Kaplan-Meier survival curve of time to product withdrawalbetween 1/9/1995 and 31/8/2005
Figure 3.1 Kaplan-Meier product withdrawal survival probability curves for the period
1/9/95-31/8/05
The cumulative withdrawal survival probability was 0.978; therefore the probability of a
product experiencing withdrawal was 0.022 or 2.2%.
The mean time to withdrawal was 109.9 weeks (2.1 years) with a range of 8.7 – 277.6
weeks (0.17 – 5.3 years) and a standard deviation of 89.8 weeks (1.7 years). Five
products (50%) were withdrawn within the first two years of marketing.
116

3.4.2 Major safety notices
A total of 164 important safety notices affecting 818 individual medicinal products were
identified. The majority of notices involved advice on new side effects (135; 82.3%), but
small minorities were concerned with drug interactions (15; 9.1%), special precautions
to be taken in use (5; 3.0%) or drug withdrawal (9; 5.5%).
As with product withdrawals, there were no products where the decision to issue a
safety notice was based on a single source and the sources used – which ranged from
published randomised controlled trials, epidemiological studies, meta-analyses and
detailed case reports to unpublished yellow card data or in-house company reports,
varied considerably, both in quality and number. In some instances, a change was
made on the basis of data emerging from outside the UK.
Through triangulation, it was possible to discover how much effort had been made to
disseminate the safety information. A few notices appeared in only one of the sources
studied, but many were cited in more than one source. The results of triangulation are
shown in Table 3.5. The most likely means of dissemination was a combination of a
mention in ‘Current problems’ and a warning in the BNF.
The distribution of products cited in various BNF therapeutic categories is shown in Table 3.6.
117

Source or combination of sources
Blue box warnings
Other Total
n (%) Dear healthcare professional letter only
- 8 8 (4.9)
‘Current problems’ only - 21 21 (12.8)
Blue box BNF warning only 13 - 13 (7.9)
Blue box warning and ‘Dear HCP’ letter
3 8 11 (6.7)
Blue box warning and ‘Current problems’
12 82 94 (57.3)
Current problems and ‘Dear HCP’ letter
- 2 2 (1.2)
Blue box, Current Problems and ‘Dear HCP’
3 12 15 (9.1)
Total (n,%) 31 (18.9) 133 (81.1) 164 (100)
Table 3.5 Sources used to disseminate safety warnings.
Therapeutic category Total products affected by major safety notices. n (%)
12 (1.5) Gastrointestinal system
52 (6.4) Cardiovascular system
48 (5.9) Respiratory system
141 (17.2) Central nervous system
74 (9.0) Infections
51 (6.2) Endocrine system
297 (36.3) Obs, gynaecological and urinary
17 (2.1) Malignant disease and
14 (1.7) Nutrition and blood
53 (6.5) Musculoskeletal and joint disorders
0 (0) Eye
0 (0) Ear nose and throat
47 (5.7) Skin
5 (6.1) Immunological and vaccines
5 (6.1) Anaesthesia
2 (0.2) Other
818 (100) Total products
Table 3.6 Distribution of products affected by major safety notices, by BNF therapeutic category.
118

Many notices affected more than one product and many of these were ‘class’
warnings. For example, there were 5 separate warnings applying to a wide range
of oral contraceptives. This explains the large number of products cited in the BNF:
Obstetrics, gynaecological and urinary category in Table 3.6.
The scope of the warnings is displayed in Table 3.7, together with an indication of
how many of each were ‘Blue Box’ BNF warnings.
Scope of major change Number of blue box warnings
Number of warnings cited
in other sources
Total warnings
n (%)
Affecting all products in class 16 30 46 (5.6)
Affecting a single named product
15 98 113 (16.3)
Affecting two named products 0 3 3 (0.4)
Affecting three named products
0 2 2 (0.2)
Totals (n,%) 31 (18.9%) 133 (81.1) 164 (100)
Table 3.7 Scope of notices with respect to product coverage and proportion of blue box warnings encountered.
Overall, there were 31 BNF ‘blue box’ warnings, constituting about one fifth of the
total. It is clear that while many warnings were considered important enough to
include in a ‘Dear Healthcare Professional’ letter or ‘Current Problems’, 13 (7.9%)
were not supported by other routes, either prior or contemporary to, the
appearance of the warning in the BNF. As the BNF is referred to more frequently
than any other source of prescribing information, is more readily to hand and less
transient than ‘Current Problems’ or a one-off ‘Dear Healthcare Professional’ letter,
this seems surprising, and an area where improvements might be made. Blue box
119

warnings presumably appear in the BNF when a major safety issue arises and
often contain the heading ‘CSM advice’. More consistency in this approach from
the Formulary Committee or editorial team seems warranted.
The numbers of products affected by each safety warning varied, mainly due to
whether they were individual product or ‘class’ effects. The distribution of these is
shown in Table 3.8.
Number of products affected by labelling change
Frequency
n (%)
1 113 (68.9)
2 3 (1.8)
3 2 (1.2)
4 8 (4.9%)
>4 38 (23.2)
Total 164 (100.0)
Table 3.8 Numbers of products affected by safety notices.
The number of different information sources cited for the 164 safety warnings is
shown in Table 3.9.
Number of information sources cited Frequency
n (%)
1 107 (65.2)
2 25 (15.2)
3 9 (5.5)
4 1 (0.6)
Unknown because none cited 22 (13.4)
Total 164 (100)
Table 3.9 Number of information sources cited for safety notices.
The highest level of evidence cited in the 164 safety warnings is shown in Table
3.10.
120

121
Highest level of evidence Frequency
n (%)
1 1 (0.6)
2 11 (6.7)
3 56 (34.1)
4 64 (39.0)
5 9 (5.5)
Unknown because none cited 23 (14.0)
Total 164 (100%)
Table 3.10 Frequency of highest level of evidence cited for the 164 safety
warnings.
Considering the serious and in some cases urgent, nature of some safety warnings, it is
of concern that no literature was cited in 23 cases.
Fifty-six of the 518 (10.8%) products licensed during the study period were the subject
of a first major safety notice, including five straight product withdrawals. Eight (14.3%)
changes were based on more than one safety data source. Key data for these products
and a summary of the information sources cited is shown in Table 3.11. As with product
withdrawals, there was heavy reliance on spontaneous reports from the UK yellow card
system with 32 (57.1%) of cases; in 24 cases, this was the only data cited. In five cases
(8.9%), decisions were made using only pharmcovigilance data from outside the UK. A
minority (12; 21.4%) referred to published case studies and just two cases (one where
the drug was withdrawn) referred to clinical trial data. PEM study data was conspicuous
by its absence. The highest level of data cited was 2, 3, 4 and 5 in 5, 14, 34 and 3
cases respectively.

Generic (brand name)
Manufacturer+ Year of launch
Safety concern(s) Date of labelling change
Yellow
card reports
Medwatch reports
Other pharmacovigilance organisations (e.g. EMEA)
Epidemiological studies
UK RCTs conducted post‐marketing
Non‐UK RCTs
In‐vivo animal studies
TPublished case studies
certoparin
(Alphaparin) Alpha
1996 Hyperkalaemia 1/3/99 √
cefprozil (Cefzil) BMS 1996 Acute haemolytic
anaemia
1/12/97 √
indinavir
(Crixivan) MSD
1996 Hyperglycaemia 1/9/97 √
lamivudine
(Epivir) GSK
1996 Fatty liver
degeneration
1/3/98 √
saquinavir
(Invirase) Roche
1996 Hyperglycaemia 1/9/97 √
atorvostatin
(Lipitor) Parke‐Davis
1996 Muscle effects 1/10/02 √
meloxicam
(Mobic)
Boehringer
Ingelheim
1996 GI side effects 1/8/98 √
meningococcal
vaccine (NeisVac‐
C)
Abbott 1996 Injection site
reactions
1/9/00 √
ritonavir (Norvir) Abbott 1996 Hyperglycaemia 1/9/97 √
ropinirole
(Requip) GSK
1996 Sudden sleep
onset
1/9/03 √
troglitazone
(Romozin)*
Glaxo
Wellcome
1997 Hepatotoxicity 1/12/97 √ √ √
sertindole
(Serdolect) Lundbeck
1996 Cardiac
arrhythmias
2/12/98 √
122

Generic (brand name)
Manufacturer+ Year of launch
Safety concern(s) Date of labelling change
Yellow
card reports
Medwatch reports
Other pharmacovigilance organisations (e.g. EMEA)
Epidemiological studies
UK RCTs conducted post‐marketing
Non‐UK RCTs
In‐vivo animal studies
Published case studies
nisoldipine
(Syscor) Bayer
1996 Interaction with
grapefruit juice
and raised levels
1/2/97 √
lornoxicam (Xefo) CeNeS 1996 Peptic ulceration 1/4/02 √
stavudine (Zerit) Bristol Myers 1996 Fatty liver
degeneration
1/3/98 √
olanzapine
(Zyprexa) Lilly
1996 Diabetes 1/4/02 √
Donepezil
(Aricept) Pfizer
1997 Seizures 1/3/99 √
cerivistatin
(Lipobay) Bayer
1997 Interaction with
gemfibrozil
(rhabdomyolysis)
1/6/01 √
naratriptan
(Naramig)
Glaxo
Welcome
1997 Seratogenic
effects with SJW
1/5/00 √
levacetymethadol
(OrLAAM) Britannia
1997 Cardiac
arrhythmias
13/4/01 √
mibefradil
(Posicor) Roche
1997 Arrythmias
(interaction with
terfenadine)
1/12/97 √
MMR vaccine
(Priorix) SKB
1997 Idiopathic
thrombocytopenia
1/8/01 √
tolcapone
(Tasmar)* Roche
1997 Hepatotoxicity 12/11/98 √ √ √
levofloxacin
(Tavanic)
Hoechst
Marion
Roussel
1997 Tendon rupture 1/4/02 √
123

Generic (brand name)
Manufacturer+ Year of launch
Safety concern(s) Date of labelling change
Yellow
card reports
Medwatch reports
Other pharmacovigilance organisations (e.g. EMEA)
Epidemiological studies
UK RCTs conducted post‐marketing
Non‐UK RCTs
In‐vivo animal studies
Published case studies
zafirlukast
(Accolate) Astra Zeneca
1998 Churg‐Strauss
syndrome
1/7/98 √
rituximab
(Mabthera) Roche
1998 Cytokine release
after infusion
1/12/99 √
rizatriptan
(Maxalt) MSD
1998 Seratogenic
effects with SJW
1/5/00 √
pramipexole
(Mirpexin) Upjohn
1998 Sudden sleep
onset
1/11/99 √
repaglinide
(Novonorm /
Prandin)
Daiichi Sankyo 1998 Enhanced
hypoglycaemia
with gemfibrozil
1/9/03 √ √
fosphenytoin
(Pro‐Epanutin) Parke‐Davis
1998 Cardiac
arrhythmias after
infusion
1/5/200 √
Grepafloxacin
(Raxar) *
Glaxo
Welcome
1998 QT interval
prolongation
1/10/99
√ √ Company risk vs
benefit review
montelukast
(Singulair) MSD
1998 Churg‐Strauss
syndrome
1/12/98 √
trovafloxacin
(Trovan)* Pfizer
1998 Hepatotoxicity 3/6/99 √ √
sildinafil (Viagra) Pfizer 1998 Drug interactions
leading to raised
plasma levels
1/11/99 √
nelfinavir
(Viracept) Roche
1998 Lipodystrophy 1/3/98 √
nevirapine
(Viramune)
Boehringer
Ingleheim
1998 Hepato‐ and skin
toxicity
1/5/00 √
124

Generic (brand name)
Manufacturer+ Year of launch
Safety concern(s) Date of labelling change
Yellow
card reports
Medwatch reports
Other pharmacovigilance organisations (e.g. EMEA)
Epidemiological studies
UK RCTs conducted post‐marketing
Non‐UK RCTs
In‐vivo animal studies
Published case studies
leflunomide
(Arava)
Hoechst
Marion
Roussel
1999 Severe liver
reactions
13/3/01 √
meningococcal
vaccine
(Meninetec)
Wyeth 1999 Injection site
reactions
1/9/00 √
surgical sealant
(Quixil) Omrix
1999 Severe
neurotoxicity
1/11/99 √ √
infliximab
(Remicaid)
Schering
Plough
1999 Risk of
tuberculosis
1/9/03 √
efavirenz
(Sustiva) Du Pont
1999 Seratonergic
effects with SJW
1/5/00 √
rofecoxib (Vioxx) MSD 1999 GI effects 1/9/00 √
abacavir (Ziagen) Glaxo
Wellcome
1999 Hypersensitivity 1/2/01 √
zolmitriptan
(Zomig) Astra Zeneca
1999 Seratogenic
effects with SJW
1/2/01 √
celecoxib
(Celebrex) Searle
2000 Increased
cardiovascular risk
1/6/01 √
sulindac (Clinoril) MSD 2000 Contraindicated in
peptic ulceration
1/4/02 √ √ √
trastuzumab
(Herceptin) Roche
2000 Fatty liver
degeneration
1/8/01 √
meningococcal
vaccine
(Menjugate)
Chiron 2000 Injection site
reactions
1/9/00 √
125

126
Table 3.11 Key details of the 56 products subject to important safety notices, licensed during the study period (1995-2005).
*product withdrawn; SJW = St John’s wort; + Company name is the name under which the company was trading at the time of notice
issue.
Generic (brand name)
Manufacturer+ Year of launch
Safety concern(s) Date of labelling change
Yellow
card reports
Medwatch reports
Other pharmacovigilance organisations (e.g. EMEA)
Epidemiological studies
UK RCTs conducted post‐marketing
Non‐UK RCTs
In‐vivo animal studies
Published case studies
bupropion
(Zyban) GSK
2000 Contraindication
in patients with
seizure history
1/2/01 √
sibutramine
(Reductil) Abbott
2001 Hypertension /
tachycardia
1/9/03 √
linezolid (Zyvox) Pharmacia 2001 Myelosuppression 1/8/01 √
etoricoxib
(Arcoxia) MSD
2002 Increased
cardiovascular risk
15/2/05 √
escitalopram
(Cipralex) Lundbeck
2002 CNS effects in
children
1/12/03 √
valdecoxib
(Bextra) Pfizer
2003 Increased
cardiovascular risk
17/2/05 √
rosuvastatin
(Crestor) Astra Zeneca
2003 Rhabdomyolysis 1/10/04 √
atomoxetine
(Strattera) Lilly
2004 Hepatotoxicity 2/2/05 √ √

The overarching theme of the notices was to highlight adverse drug reactions in 36
cases (64.3%); warn of drug interactions in 9 (16.1%); add to the list of warnings and
precautions in 7 (15.6%) and advise of an additional contraindication in 4 cases (7.1%).
The 56 cases included a wide range of manufacturers and all mentioned a
predominating possible side effect. The most common effects according to organ class
were: cardiovascular (15; 26.8%); CNS (10; 17.9%); hepatic (9; 16.1%); endocrine (6;
10.7%); gastrointestinal (4; 7.1%); musculoskeletal (4; 7.1%); skin (3; 5.4%);
immunological (2; 3.6%); blood dyscrasias (2; 3.6%) and infection (1; 1.8%).
The numbers of products including the product in question, within this sub-set to which
safety notices applied, are shown in Table 3.12. The majority of notices (58.8%)
concerned single products rather than class effects.
Number of notices applying Number of products to which notice
applied
1 33 (including 5 withdrawals)
2 16
3 3
4 1
5 2
6 1
Table 3.12 Numbers of products with multiple safety notices during study period.
The Kaplan Meier plot for product survival from a major safety notice appears in Figure
2. For those products which were the subject of such a notice, the mean survival time
was 105.8 +/- 84.2 (SD) weeks (2.0 +/- 1.6 years). Range: 3.7 – 373.9 weeks (0.07 –
7.2 years). Thirty products (53.6%) were subject to the first major safety notice within
the first two years of marketing life.
127

0.8500
0.9000
0.9500
1.0000
Pro
ba
bili
ty
0 60 120 180 240 300 360 420 480 540Weeks since market launch
95% CI Survivor function
Kaplan-Meier survival curve of time to first major labellingchange to products between 1/9/1995 and 31/8/2005
Figure 3.2 Kaplan-Meier product safety notice survival probability curves for the period
1/9/95-31/8/05
The cumulative survival probability (or prognosis) for all products in the study was
0.862; therefore the probability of a product being the subject of a major safety notice
was 13.8%. The mean time to change was 101.9 weeks (1.95 years) with a range of
3.71 – 373.86 weeks (0.1 – 7.2 years) and a standard deviation of 85.8 weeks (1.7
years). Thirty-seven products (66.1%) had changes within the first two years of
marketing.
128

3.5 Discussion
3.5.1 Product withdrawals
In this section, the author’s results will be compared with those from the literature.
Removal of a medicinal product from the market can be a traumatic experience for the
manufacturer, healthcare professionals and patients. Medicinal products can be
discontinued for several reasons; these include: severe and specific safety problems; a
relatively high adverse drug reaction (ADR) profile across a range of effects – often
involving drug interactions; less than desired effectiveness: ineffective marketing
practice leading to poor sales, or replacement by improved therapies. More often than
not, a combination of factors is responsible for the failure of a drug to sustain a place in
the market. 1, 155
Analysis of the author’s present research provides us with an indication of the likelihood
(2.2%) of adverse drug reactions causing the withdrawal of an NCE-containing product
being brought to light after product approval. This would appear at first glance to be low;
but considering the considerable investment in bringing the product to the market in the
first place, the investment risk seems higher (two out of every 100 products will fail).
This result is of a similar magnitude to those from previous studies in this area.
Bakke et al. 156 studied discontinuations of NCEs approved and then withdrawn in the
UK and US over a 20-year period (1964 -1983). Numbers withdrawn during this period
were 5 in the UK alone, 2 in the US alone and 3 in both countries. Hence 8 were
approved and withdrawn in the UK during this period (and 5 in the US). It is not possible
to derive Kaplan-Meier plots from the data; but the authors mentioned that during the
study period, 2% of approved drugs were subsequently discontinued ‘in the light of
safety questions’. They went on to state that for most of the drugs withdrawn, there was
no definitive cause for withdrawal, and that the decision to withdraw was often the result
of complex features involving several different problems. They stated that decisions at
that time may have been comprised of safety, efficacy for intended use and commercial
considerations. No attempt was made to assess the safety threshold which, when
exceeded, triggered the decision to withdraw. The authors concluded that drugs which
129

were authorised during the study period were seldom judged to be sufficiently unsafe to
withdraw them. In the present study, the majority of withdrawals were instigated by the
regulator, but in at least one case (Vioxx) the initiative was taken by the authorisation
holder.
In an early study, Hass et al. 157 recorded a total of 514 NCEs introduced in the UK
during the period 1960-1982; just 10 (1.9%) were withdrawn on what were judged to be
safety grounds; while 93 (18.2%) were discontinued for all reasons, including
commercial non-viability. Eight of the 10 discontinuations (80%) made on safety
grounds occurred within two years of introduction and three of 83 (3.6%) of the drugs
withdrawn for reasons other than safety, were withdrawn within 2 years of launch. In the
present study, the mean time for a drug to be withdrawn on safety grounds was 2.1
years (SD 1.7 years), with a range of 0.2 – 5.3 years. So the data from this study and
that of Hass et al. 157 are at least comparable. In a parallel report of the same study,1 the
authors quote the mean market life of all non-safety withdrawals in their study, which
included 75 from the US, to be markedly different - approximately 11 years. It seems
reasonable that drug safety rather than marketing concerns should occur earlier on in
the life of most products. This aspect was not investigated in the present research.
Bakke et al. 158 studied the withdrawal rate of NCEs and new biological entities (NBEs)
in the UK, US and Spain between 1974 and 1993 on safety grounds. The authors did
not analyse individual safety issues or the appropriateness of the decision. The authors
used the time of regulatory approval to indicate the market launch date. If this was
unavailable, the launch date was taken from published sources such as the
Pharmaceutical Journal or the Physicians’ Desk Reference. Dates of discontinuation
were obtained from published sources. A similar strategy was adopted in the present
research as data from industry and unpublished sources were not available.
Twenty-nine drugs were discontinued, with some being withdrawn in more than one
country: 20 in the UK, 10 in the US and 16 in Spain, representing between 3 and 4% of
all drugs introduced in these countries. For the UK particularly, this is a greater
percentage that that discovered by Hass et al.,157 a previous study by the same group156
and indeed in the present study.
130

The median times between introduction and discontinuation were 15, 34 and 65 months
in the US, UK and Spain respectively. Half of the discontinuations in the US and UK
occurred within three years of marketing. The authors observe from their studies that
times may be shorter where the drug is introduced in a ‘pioneer’ market in one country
and longer in other countries where the regulatory authorities approve the drug more
slowly or where the drug is submitted later, with knowledge and appropriate warnings
gained from the pioneer experience. The therapeutic classes to which discontinued
drugs most commonly belonged were NSAIDs, vasodilators and antidepressants. The
most frequent ADRs cited as causes for discontinuation were liver damage, serious skin
reactions and blood dyscrasias. Some products had more than one major type of
associated ADR; Toxicity in animal studies contributed significantly in just two cases
(7%). In the author’s study, the most commonly occurring ADRs were associated with
the cardiovascular system and the liver.
Jefferys et al.4 conducted a study of products withdrawn from the UK pharmaceuticals
market between 1972 and 1994. Among 59 withdrawals, 35 were withdrawn for
commercial reasons, 23 for safety reasons and one for lack of efficacy; so of the 583
NCEs approved during the same period, 3.9% were withdrawn due to safety reasons.
In the most extensive review of its type, Fung et al. 159 conducted a 40-year study of
drug withdrawals due to safety reasons in European, US, Asian and other sub-
continental markets. In total, 121 products were involved. The authors focused on
NCEs, excluding medical devices, medical devices, radiopharmaceuticals and vaccines.
An incidence rate of withdrawal could not be determined because the number of drug
approvals was not readily available. The most common therapeutic categories involved
were NSAIDs (13.2%), non-narcotic analgesics (8.3%), antidepressants (7.4%) and
vasodilators (5.8%). In line with other studies, hepatic ADRs accounted for over a
quarter (26.2%) of all withdrawals, followed by haematological (10.5%), cardiovascular
(8.7%), dermatological (6.3%) and carcinogenic (6.3%) effects. For 87 products, time
from launch to withdrawal was available, indicating a median time on the market of 5.4
years, with approximately a third of products being withdrawn in the first two years. The
authors point to the possible influence of the ‘Weber effect’ being responsible for this,
131

where adverse event reporting tends to decease after the first few years of marketing.160
No attempt was made to assess the appropriateness of the withdrawal decision.
Thirteen (10.7%) products were withdrawn from the UK alone while a further 35 (28.9%)
were withdrawn from mixed markets where the UK was one of a mixture of countries.
Lasser et al.3 conducted a similar study in the US, but grouped together both product
withdrawals and the appearance of ‘black box’ safety warnings appearing in the
Physicians’ Desk Reference. They found 56 of 548 NCEs (10.2%) licensed between
1975 and 1999 (25 years) were either withdrawn or were the subject of black box
warnings due to side effects. This group did not include vaccines or other biologicals,
although both could be considered NCEs (the present study did). Sixteen (2.9%) NCEs
were withdrawn; in a Kaplan Meier analysis, NCEs had a 4% probability of being
withdrawn from the market over the study period compared with 2.2% in the present
study. The overall probability of being withdrawn OR having a black box warning was
20%, compared with 13.8% in the present study. Half of the withdrawals occurred within
two years of launch and half of the black box warnings were introduced within the first
seven years. The most common warning black box warnings were for hepatic toxicity
(19%), hematologic toxicity (16%), cardiovascular toxicity (21%) and risk in pregnancy
(11%). Differences in probabilities for withdrawals and labeling changes produced by
Lasser et al.3 and the present study may be due to the differences in the markets
studied or may represent a real improvement in product survivability with time.
Lexchin161 studied drug withdrawals on grounds of safety in a single (Canadian) market
between 1963 and 2004. He expressed some exasperation with trying to obtain
information on the timing and reasons for withdrawal from published or online literature
sources and reservations about the completeness of his final list of 41 products
(excluding biological and natural products) - something that was also experienced by
the author. Hepatotoxicity (8 products), cardiac problems involving eight products
(arrhythmias and valvular disorders) and blood dyscrasias (7 products) were the three
leading causes of drug withdrawal. From a ten-year data sub-set (1993-2002),
Lexchin161 was able to calculate a withdrawal incidence of 2.1% (6 of 282 NCEs
approved during this period). The author noticed a general increase in withdrawal rate
132

during the latter part of the study, postulating that this may have been due to several
reasons, including the increasing sophistication of pharmacovigilance operations, the
international exchange of safety data, and less stringent approval criteria. Other authors
have pointed to the efforts of some regulatory authorities to drive down the time
between submission of a MA and final approval and suggest that this has been
associated with an increased number of subsequent product withdrawals or boxed
warnings;162 this aspect was not studied in the present research.
Wysowski and Swartz 163 analysed all reports of suspected ADRs submitted to the US
FDA across the whole life span of the currently operating Adverse Event Reporting
System (AERS), between 1969 and 2002, looking at drug withdrawals and restricted
distribution programmes. They identified 75 drugs that had been withdrawn on the basis
of evidence gleaned mainly from spontaneous reports or clinical trials with spontaneous
report verification; no mention is made of published case reports or other types of data.
The authors remark that for many products in the early part of their study, good
historical data were lacking. For those dugs withdrawn between 1978 and 2002 (n=25),
the largest group involved the cardiovascular toxicity (40%, n=10), followed by
hepatotoxicity (16%, n=4). Between 1990 and 2002, eleven drugs with diverse
pharmacological actions and indications, were subject to a restricted distribution
programme as part of the FDA’s risk management strategy. These included clozapine,
isotretinoin, fentanyl, trovafloxacin, thalidomide, bosentan, mefipristone, alosetron,
sodium oxybate, acitretin and dofetilide. Examples of actions taken were a
contraindication in pregnancy (thalidomide, acitretin, isotretinoin) and the introduction of
stringent requirements for patient monitoring, e.g. for agranulocytosis with clozapine,
hepatotoxicity with trovafloxacin and bosentan, and ischaemic colitis with alosetron.
While these are examples of a level of drug restriction just below complete withdrawal,
the authors list other risk management strategies employed as the result of emergence
of ADR signals from spontaneous reports, many of which were seen in the present
study. These included the usual routes of adding boxed warnings, and changes to the
dosage, side effects, contraindications, warnings and precautions sections of product
labelling, similar alterations to the PIL, issuing ‘dear healthcare professional’ letters, and
publication of the problem in the medical literature and popular press; and more
133

extreme measures such as obtaining written informed patient consent before
prescribing.
In the present study, for both product withdrawals and major labelling changes, most
reactions appeared to be novel and Type B in nature. These might be expected to
emerge only in the post-marketing phase. However, it is worth noting that several
reactions emerged from formal clinical trials (e.g. thrombotic events with rofecoxib and
hepatic toxicity with tolcapone (see Tables 3.3 and 3.12). Type B events may have
been observed pre-marketing also; QT-prolongation and two possible deaths may have
been associated with grepafloxacin prior to product approval.1
Several groups have focused on the nature of the information on which the decision to
withdraw was based. These papers highlight the lack of consistency in the quality of
safety data in the context of its use as a basis for regulatory action.
Arnaiz et al.164 studied drug withdrawal decisions in Spain between 1990 and 1999 and
found that almost two thirds (64%) were based on individual case reports or case series
alone; 23% involved comparative observational studies and 18% employed RCT
evidence. Shojania et al.165 discuss in depth, the evidence and methodology used in the
decision making process and some of the advantages and disadvantages of applying
the principles of evidence-based medicine to patient safety. They view the isolated case
report as essentially an hypothesis generating tool and that more are required to permit
careful assessment of possible causative factors and stress the importance of
prioritising clinical (patient oriented) over surrogate outcomes when assessing safety
data.
Clarke et al.2 describe a limited study of the evidence resident in the public domain at
the time of product withdrawal from the UK and US markets during the period 1999 to
2001, excluding herbals, diagnostics, vaccines, and radiopharmaceuticals. The
evidence was classified according to study design and outcome, but not rated as to its
quality. Eleven products were identified; decisions cited the following evidence: RCTs
(18%, n=2); spontaneous reports (73%, n=8) with four (36%) using spontaneous reports
alone. Only two products (18%) were withdrawn on evidence from comparative studies,
134

for a patient relevant outcome, as opposed to a surrogate outcome - which is a potential
precursor to an adverse event (e.g. a prolonged QT interval which may or may not
predispose to a clinically important cardiac arrhythmia). For two products (18%), no
published evidence could be found. Spontaneous reports almost always reported
patient-relevant outcomes. The authors make the point that if the evidence used to
make a withdrawal decision was restricted to RCT data providing patient relevant as
opposed to surrogate outcomes, evidence of harm would have been detected for just
one of the 11 withdrawn products and that including data from comparative
observational studies would only provide evidence for one other product; although
evidence of harm for three more products would be provided if surrogate safety
outcomes were included. As with the present study, the focus was on data present in
the public domain at the time of product withdrawal cited by the regulatory authority or
MA holder. They assumed that all the evidence (or at least, the strongest evidence) that
played a significant role in the decision making process would have been cited,
although this was clearly not the case for two products (astemizole and troglitazone).
The authors note the relative paucity of data other than spontaneous reports used to
support withdrawal decisions; they discuss reasons for this and observe that once a
safety signal has been generated by spontaneous reports, it is often unfeasible and
unethical to conduct prospective studies to strengthen the evidence before the decision
to withdraw has to be made. Rather, such studies should be instigated when the drug is
first marketed to strengthen the often highly contentious decision to withdraw. To find
that spontaneous reports are still the cornerstone of pharmacovigilance and regulatory
decision making in the UK and US was to the authors, disappointing, given the low level
of information provided. The authors point out that spontaneous data lacks a
denominator, that under-reporting is common, that the number of reports is dependent
on the length of time the product has been on the market and the amount of publicity
accorded to a particular drug and adverse event – all factors discussed in Chapter 1 of
this thesis.
135

3.5.2 Major safety notice applications
This analysis provides us with an indication of the likelihood (13.8%) of adverse drug
reactions being brought to light after product approval which then result in a change to
product use. This is smaller than the figure of 20% quoted by Lasser et al.3; this may be
due to a number of factors, including chronological differences and inclusion criteria. As
with product withdrawals, spontaneous reports from healthcare professionals formed
the backbone of evidence on which these warnings were based. Higher levels of
evidence were rarely cited.
3.5.3 Comparison of information used to formulate safety decisions
Table 3.13 shows the highest level of data on which safety decisions were based for the
9 products withdrawn and 56 products re-labelled during the study period. The reliance
on yellow card data is striking, but other data were also considered more frequently
when the decision to withdraw was made, in comparison to a major labelling change
decision.
These data serve to illustrate the dominance of spontaneous ADR reports in the
decision-making process in the UK, where they were involved in all withdrawal
decisions and 57% of major safety notice decisions.
136

Data level* Data type
For product
withdrawal (n=9)
For first major
labelling change+
(n=56)
1 Meta-analysis of relevant
RCTs 0 0
2 At least one robust RCT 3 (33.3%) 4 (7.1%)
3
Epidemiological studies, well-
designed non-randomised
controlled trials, cohort time
series, prescription event
monitoring (PEM) study.
2 (22.2%)
14 (25.0%)
4
Case reports, case series,
spontaneous reporting (e.g.
UK yellow card and
Medwatch data).
4 (44.4%) 34 (60.7%)
5
Unsubstantiated expert
opinion, descriptive studies,
in vivo and animal
experiments.
0 3 (5.4%)
Other
features
Cases involving more than
one data source 9 (100%) 8 (14.3%)
Cases where yellow card
data were considered 9 (100%) 32 (57.1%)
Table 3.13 Highest data level used to inform product withdrawal and first major labelling change for UK products licensed between 1/9/95 and 31/8/05.
*adapted from Gray.141 +includes four straight product withdrawals. RCT – randomised controlled trial.
137

3.6 Overall discussion
Together with Phase 1 of her research, Phase 2 allowed the author to gain an
impression of both the scope and depth of drug labelling changes and withdrawals
made on safety grounds, to UK medicinal products.
As other authors have found, 2,161,163,164 side effect data had to be gleaned from a
number of sources to gain an adequate picture and allow assessment of its quality.
Ascertaining detail on product labelling changes was less precise than for product
withdrawals, largely due to better documentation of the latter in the form of ‘dear
healthcare professional’ letters and notices in ‘Current Problems’.
It is clear that the CSM yellow card data is fundamental to most decisions to withdraw a
product whereas green card data features rarely; likewise with major product labelling
changes.
As Andrews and Dombeck have observed from their study of US data,166 there is an
over-reliance on pre-marketing clinical trial data and post-marketing spontaneous
reports in the decision-making process that has left an information void. When a new
safety signal is generated by the latter, regulators are often limited to either allowing
marketing to continue without significant changes to labelling, or to withdraw a
potentially useful product. Absence of information on how products are used and how
they perform in the real world setting hampers a more rational decision. The presence
of such information, gathered through prospective observational cohort studies, such as
PEM and epidemiological methodologies, instigated from when the first prescription for
the product is written, might go a long way to providing information which would allow a
wider range of options to withdrawal in terms of risk management strategies.
In the present study, decisions to withdraw were most commonly made by the regulator,
but sometimes by the manufacturer, where both safety and commercial factors were
considered. It is reassuring to know that in most cases, withdrawal was by consensus. It
was not possible to discover what part the manufacturer played in any of the decisions
to apply a major labelling change.
138

It is clear that in terms of both drug withdrawals and major labelling changes, the
evidence base used is inconsistent in both quantity and quality. While spontaneous
reports, surrogate outcomes from clinical analyses and systematic reviews will always
have a role in ADR detection and assessment, one suggestion for improving matters is
to commence targeted safety studies at launch. These might include PEM studies,
where the methodology is proven. In addition, the increasing number of record-linkage
databases might facilitate robust phamacovigilance studies, capable of detecting rare
and latent ADRs. The thoughts of healthcare professionals working in the
pharmacovigilance field on these alternative risk management strategies are explored in
Chapter 4 of this thesis.
3.7 Conclusions
The following key findings from the research in Chapter 3 are as follows:
1. Of 518 products launched during the study period, 9 were withdrawn for safety
reasons. The ten-year probability of adverse drug reactions causing the
withdrawal of a new product, post-marketing was 2.2%. This would appear at first
glance to be low; but considering the cost of bringing a product to the market in
the first place, the investment risk is considerable; two out of every 100 products
will fail.
2. All safety decisions were based on more than one safety data source; sources
were of variable quality and quantity.
3. The most common data source used (cited in all nine decisions) was
spontaneous reports from the UK yellow card system. Higher levels of safety
data were rarely cited.
4. Just two decisions involved the use of UK prescription event monitoring data.
5. Of 518 products launched during the study period, 56 experienced a major
labelling change for safety reasons.
6. The risk of at least one major labelling change being made on safety grounds
was 13.8%.
139

140
7. Eight (14.3%) changes were based on more than one safety data source.
8. No literature was cited in 23 cases (14%).
9. Only one fifth of safety notices warranting a ‘Dear Healthcare Professional’ letter
and / or a monograph in ‘Current Problems in Pharmacovigilance’, were
accompanied by a blue box warning in the relevant BNF, representing an
important inconsistency in notifying prescribers.
10. Again, the most common data source used was spontaneous reports from the
UK yellow card system (59%).
11. In six cases (10.7%), decisions were made using only pharmcovigilance data
from outside the UK.
12. Prescription event monitoring as a source of safety data was very rarely used in
such safety decisions.
13. Safety decisions appeared to be based on a wide range of data sources of
variable quality and quantity.
These findings prompted the author to assess ways of ensuring more consistent
generation and use of safety data when making licensing decisions about marketed
medicinal products. To do this, she examined the views of a wide range of healthcare
professionals working in the pharmacovigilance field. These investigations are
described in Chapter 4.

141
CHAPTER 4: MIXED METHODS STUDY OF THE VIEWS OF UK HEALTH CARE
PROFESSIONALS WHO WORK WITH PHARMACOVIGILANCE (PV) DATA.
4.1 Introduction
Chapter 3 showed that over the study period, many changes to drug labelling were
made on the grounds of safety and that in a modest number of cases, the ultimate
sanction of product withdrawal was applied. The data demonstrated the wide
variation in quality of published evidence contributing to such decisions. One is then
led to question the quality of the decisions themselves. This has been the subject of
some debate in the literature and has led to calls for a more systematic approach to
both licensing and the response to the emergence of ADR data post-authorisation. 2,
166, 167, 168, 169, 170
Before making recommendations for a more systematic approach to dealing with
ADR information that has the potential to affect product marketing (see Chapter 5) it
was felt necessary to gauge the opinions of current UK health care professionals
working in this area. This chapter reports the research designed to do this.
4.2 Methods
Health care professionals working in PV in industry, research, the NHS and the UK
Regulatory Authority were approached through a variety of channels described
below.
4.2.1 The Pharmaceutical Information and Pharmacovigilance Association
(PIPA)
PIPA has approximately 800 members, the majority of whom are pharmacists or
clinicians employed directly in the pharmaceutical industry, mainly in medicines
information departments, but also in dedicated pharmacovigilance sections. Seventy-
seven PIPA members were identified (Personal Communication, Vice President,
PIPA - a Global PV manager for a Pharmaceutical Company) as having direct
involvement in PV and therefore in the best position to participate in the study. The

142
questionnaire described in Section 4.2.5 was sent to the PIPA management
committee for comment on appropriateness and clarity. Essentially, this was a
piloting exercise that resulted in several minor alterations to an already, locally-
piloted questionnaire. Subsequently, all PIPA members were informed of the
author’s study and invited to participate in the research via a regular electronic news
letter from the PIPA management committee.
Respondents were given a URL, uniquely linked to their PIPA e-mail address from
which they could access the questionnaire, formatted for SurveyMonkey
(Portland,OR). The SurveyMonkey site remained open for two months in December /
January 2008; due to the high response rate (see results) a re-mail was not
considered necessary.
4.2.2 The Organisation for individuals in Pharmaceutical Regulatory Affairs
(TOPRA)
TOPRA has a global membership consisting mainly of pharmaceutical industry
personnel working in the Regulatory Affairs departments but is open to all those who
have an interest in Regulatory Affairs in the health care sector, for example
independent consultants.
After preliminary correspondence with the Executive Director, all members were
informed of the research and given a unique URL for the SurveyMonkey
questionnaire through the regular on-line TOPRA newsletter, which coincided with
the announcement of the formation of a new TOPRA Pharmacovigilance Special
Interest Group. The survey remained open for a period of one month.
4.2.3 United Kingdom Medicines Information (UKMi)
UKMi is an NHS pharmacy- based service. Its aim is to support the safe, effective
and efficient use of medicines by the provision of evidence-based information and
advice on their therapeutic use. UKMi is staffed primarily by pharmacists who, as
part of their role, receive, interpret and evaluate ADR data on all medicines but
particularly newly marketed ones. This sector was seen as representing the end-user
part of the PV spectrum, as many UKMi members will have had years of experience
in this area and would be expected to hold views on the themes of this research. As

143
with PIPA and TOPRA (see Sections 4.2.1 and 4.2.2) members were invited to
complete the SurveyMonkey questionnaire through individual e-mails, supplied by
the UKMi Executive from the UKMi directory. The President also placed a message
on the UKMi notice board bringing the questionnaire to members’ attention.
Members were given two months to reply, including a second mailing at one month,
after which the survey was closed.
4.2.4 Web-based survey
A copy of the final, piloted questionnaire and a sample cover note that accompanied
it on the website appear in Appendix 2. The questionnaire was formulated using
brain storming sessions between the author and her supervisors and piloted with
four PV professionals (one working at the DSRU and three PIPA members known to
the author). The latter is an exercise in establishing both face validity 171 and content
validity.172 Minimal changes required after the pilot, were largely related to changes
in wording to allow clarity when completing the survey on a web page. Reference
works on good survey design were consulted and features that optimise completion
were incorporated.
Edwards et al. 173 demonstrated that a shorter questionnaire improves response rate
compared to a longer one. Pilot studies showed that an informed pharmacovigilance
professional could complete it in approximately 20 minutes and this was deemed
satisfactory. Questions in Parts 1 and 2 (see Appendix 2) were mainly closed
statements or questions requiring tick-box answers which also assist questionnaire
completion.172 For rating the importance of factors which might influence product
withdrawal, a modified Likert scale was used to assist uniformity of approach.171
Robson174 emphasises the value of using such scales in measuring the attitudes of
a cohort and facilitating analysis. Similarly, respondents were asked to use Gray’s
hierarchy of evidence, itself in a quasi-Likert format, to rank the various types of ADR
data listed.
Burns et al.175 state that ‘the cover letter creates the first impression’. For each
cohort, the covering e-mail was carefully constructed to explain the rationale for the
research and the value to the research placed on individual members’ responses.
Specific deadlines were given in an attempt to ensure a prompt reply. The cover

144
letter also contained a statement of ethics approval and assurances of security and
anonymity of replies. As an example, the PIPA mailing is shown in Appendix 2.
Letters to the other organisations were customised, but the main text was identical.
The web-based questionnaire (see Appendix 2) was designed with the aid of
SurveyMonkey software purchased especially for the study. The questionnaire came
in three parts. Part 1 asked for demographic details from the respondents. Part 2
collected subjects’ views on a range of issues, including the sources of ADR
information used by individuals, their evaluation of the quality of ADR evidence in
those sources according to Gray’s hierarchy (see Chapter 3), their views on the
applicability of Gray’s hierarchy to rating ADR data in this way, requests for
suggestions on how the quality of ADR data might be improved and the importance
of other factors taken into account when making labelling changes on safety
grounds. Part 3 presented respondents with seven fictitious case studies of
increasing complexity, based loosely on real-life examples encountered in the
research described in Chapter 3 or from later cases from the literature (see Appendix
2 and explanation in Table 4.1). Each case described a scenario where new safety
data for a currently marketed product had come to light. Respondents were asked to
consider each case and indicate what regulatory action should take place as a result
of the new data, and their perceptions of the quality of the new data.
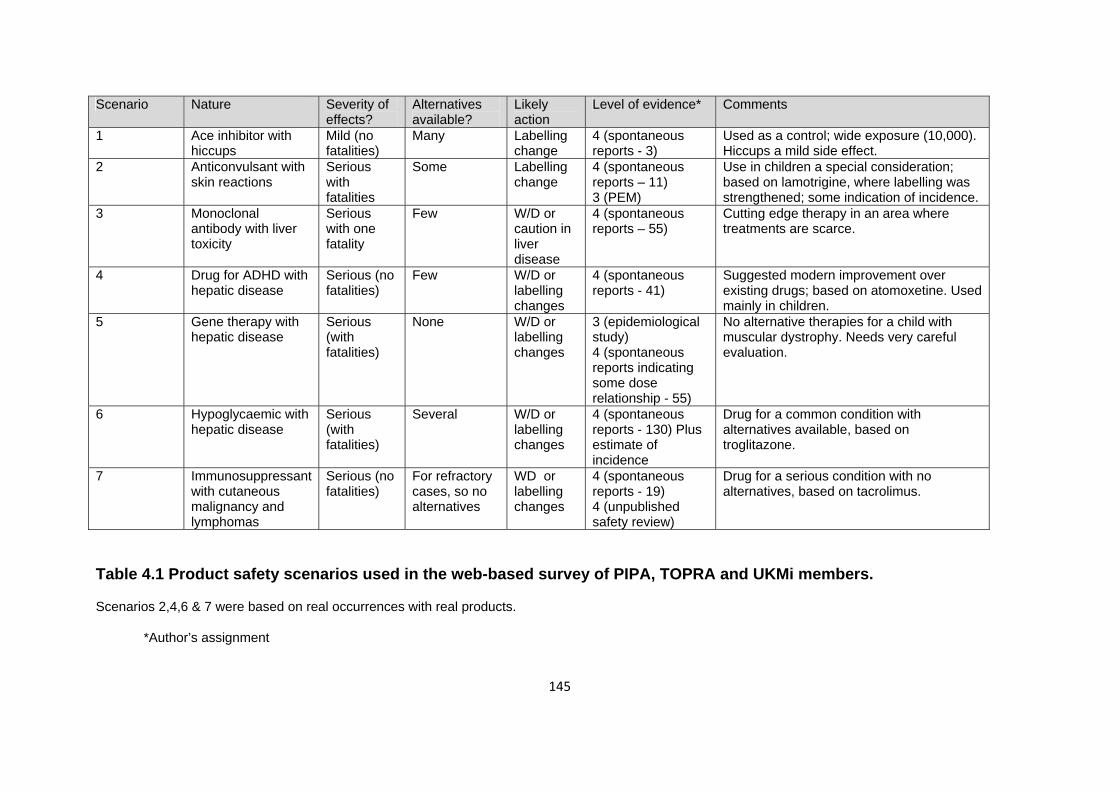
145
Scenario Nature Severity of effects?
Alternatives available?
Likely action
Level of evidence* Comments
1 Ace inhibitor with hiccups
Mild (no fatalities)
Many Labelling change
4 (spontaneous reports - 3)
Used as a control; wide exposure (10,000). Hiccups a mild side effect.
2 Anticonvulsant with skin reactions
Serious with fatalities
Some Labelling change
4 (spontaneous reports – 11) 3 (PEM)
Use in children a special consideration; based on lamotrigine, where labelling was strengthened; some indication of incidence.
3 Monoclonal antibody with liver toxicity
Serious with one fatality
Few W/D or caution in liver disease
4 (spontaneous reports – 55)
Cutting edge therapy in an area where treatments are scarce.
4 Drug for ADHD with hepatic disease
Serious (no fatalities)
Few W/D or labelling changes
4 (spontaneous reports - 41)
Suggested modern improvement over existing drugs; based on atomoxetine. Used mainly in children.
5 Gene therapy with hepatic disease
Serious (with fatalities)
None W/D or labelling changes
3 (epidemiological study) 4 (spontaneous reports indicating some dose relationship - 55)
No alternative therapies for a child with muscular dystrophy. Needs very careful evaluation.
6 Hypoglycaemic with hepatic disease
Serious (with fatalities)
Several W/D or labelling changes
4 (spontaneous reports - 130) Plus estimate of incidence
Drug for a common condition with alternatives available, based on troglitazone.
7 Immunosuppressant with cutaneous malignancy and lymphomas
Serious (no fatalities)
For refractory cases, so no alternatives
WD or labelling changes
4 (spontaneous reports - 19) 4 (unpublished safety review)
Drug for a serious condition with no alternatives, based on tacrolimus.
Table 4.1 Product safety scenarios used in the web-based survey of PIPA, TOPRA and UKMi members.
Scenarios 2,4,6 & 7 were based on real occurrences with real products.
*Author’s assignment

146
Most questions contained sub-sections, with no character limit, for respondents to
supply additional information, such as non-listed options in the demographics
section, alternative sources of ADR information used and most importantly, other
actions thought to be necessary in the safety scenarios presented in Section 3. Used
carefully and sparingly, such options can facilitate gathering of richer data and
encourage respondents to take greater ownership for their replies.176 At the end of
the questionnaire, respondents were invited to participate in further research in the
form of a structured interview (see Section 4.2.6).
4.2.5 Questionnaire data analysis
Individual responses were collated where appropriate to provide group responses
based on professional background and from individual groups, using the descriptive
statistics functions in SurveyMonkey.
4.2.6 Structured interview design
The structured interview schedule was devised by the author to gain further insight
into the replies obtained from the web-based questionnaire. Input from both the
author’s supervisors was considered before producing a final plan for piloting.
Piloting was conducted with one of the author’s supervisors and two of the target
recruits. These recruits are highlighted in Appendix 3, which contains the
anonymised details of all interview participants. Responses from the pilots were
included in the final analysis, as few changes to the original interview schedule were
required. The interview schedule used in the study is shown in Appendix 4.
4.2.7 Structured interview delivery
Although all participants had received an information sheet prior to the interview and
had provided signed consent, the researcher started with a brief overview of the
aims and objectives of the research and an assurance of ethics committee
compliance and research governance issues such as confidentiality and anonymity.
Respondents were reminded that there were no right or wrong answers and that they
could stop the interview at any time.

147
Although the interview schedule was broadly followed, the path depended to some
degree on the individual participant’s responses. With successive interviews for
example, prompts provided by the interviewer might have been based on an issue
raised in a previous interview. The emergent nature of qualitative research allows for
this. Probes were also used to obtain greater clarity or depth of meaning.
This was followed by questions on demographics to confirm identity, job description
and main professional functions of the interviewee. The interviewee was then shown
two of the scenarios from the web-based questionnaire (Scenarios 1 and 6, referred
to here as Cases 1 and 2 respectively) and asked what they thought should happen
to the product as a result of the events shown. This was followed in each case by an
invitation to rank the evidence presented using Gray’s hierarchy.
Two of the subjects had previously completed the survey on-line, which allowed the
author the opportunity of checking the validity of their responses, particularly with
regard to Scenarios 1 and 6.
Subjects were then asked for their opinions on Gray’s hierarchy as a general method
for ranking ADR data. They were then presented with a list of established risk
management strategies employed to limit harm from products with proven ADR
problems and asked if they could offer any additional strategies that they thought
might be feasible or had been shown to be effective, from their experience.
Finally, subjects were asked for their opinions on whether the UK regulator was too
cautious, appropriately cautious or not cautious enough when dealing safety issues
involving marketed products. This question was repeated for pharmaceutical
companies.
Interviewees were then thanked for their time and asked if they could recommend
other candidates for the study – an essential part of the snowball sampling method.
4.2.8 Recruitment of interview subjects
Subjects were recruited through purposive snowball sampling, to achieve a broad
spectrum of PV workers with a range of experience in the NHS, the regulatory
authorities, the pharmaceutical industry and research.

148
Several subjects were self-selected, because they had indicated they would be
prepared to participate in a face-to-face interview when responding to the web-based
questionnaire. Some of these were lost to follow-up for a variety of reasons, meaning
that the final number of interview candidates identified in this way was very small;
however, this did allow some assessment of test-retest reliability in the final analysis.
Subjects treated in this way are identified in Appendix 3.
In parallel, subjects were also purposively selected on the basis of being known to
the researcher’s supervisors as having experience of pharmacovigilance issues and
being at strategic positions in their own organisations. These candidates were
informed by formal letter or by email of the study, with details of the format and
questions asked and invited to take part. At the end of subsequent interviews,
subjects were invited to supply details of persons they thought might also contribute
to the study.
4.2.9 Structured interview conduct
4.2.9.1 Interview plan
Interviews were designed to capture subjects’ views on a limited list of topics derived
from Phases 1 and 2 of the research and the on-line questionnaire responses. The
final interview schedule appears in Appendix 4. This was divided into three sections.
Section 1 allowed the interviewer to re-introduce the project and gain some
demographic information. Section 2 asked for views on two contrasting scenarios
taken from the on-line questionnaire (see Appendix 2). The first was Scenario 1
(hiccups with an ACE inhibitor) and Scenario 6 (hepatic reactions with a new oral
hypoglycaemic agent). This was followed by questions on what subjects understood
by the term “Safety Signal” as applied to PV data and their opinions on using Gray’s
hierarchy, or other methods to rate safety data.
Section 3 sought opinions on how the whole drug safety picture could be improved,
listing a series of risk management strategies, and finally, soliciting the subjects’
views on how the regulator and pharmaceutical companies performed with respect to
managing drug safety risks.

149
At the close of the interview, interviewees were asked if there was anything they
wished to re-visit for better understanding of further comments and then thanked for
their time.
4.2.9.2 Interview delivery
Piloting revealed that the interviews would take between 30 and 45 minutes. An
appointment was made with each subject at his or her place of work. A request was
made that each subject provided a quiet room where the interview could proceed
uninterrupted, in private and at a mutually agreeable time. Where scenarios were
presented for consideration, care was taken to allow sufficient time for subjects to
consider their responses before replying. Each interview was recorded in its entirety
using an Olympus Digital Voice Recorder; in addition, the researcher recorded
replies on a set of field notes to facilitate transcription and contribute to the internal
validity of the study.
Where a face-to-face interview proved impractical due to travel limitations, interviews
were conducted by telephone and recorded in the same way. Respondents were
sent copies of the introductory letter, the interview schedule and the attachments
ahead of time. Such interviews are identified in Appendix 3.
4.2.10 Structured interview data analysis
The analysis was conducted using interpretative phenomenological analysis (IPA) -
or thematic analysis - as described by Smith177; where the investigator identified
themes and attempted to generate a coherent interpretation of those themes.
Steps in data analysis proceeded as follows (see also Figure 4.1):
Step 1. All interview transcripts were copied from the audio record to Word audio
files on the author’s password protected computer and given a unique identifier
code. Each was then transcribed verbatim by the author into a Microsoft Word file,
with frequent reference to the written field notes. All transcriptions were conducted
by the author to facilitate familiarity of the data and to minimise errors and checked
for accuracy by comparing them with the original audio recordings. The transcripts

150
were checked independently by the author’s supervisor to ensure consistency in
interpretation. Audiotapes were then deleted. At the end of each transcription, the
entire tape was reviewed within sight of the transcript to remove discrepancies. Each
30 minutes of taped interview took between 2 and 3 hours to transcribe in this way.
Transcripts were analysed in the same sequence as they were gathered using IPA
with the assistance of a computer-assisted qualitative data analysis software
(CAQDAS) package called NVivo 8 (QSR International Pty Ltd) – installed on the
researcher’s computer.
Step 2. Transcript analysis involved repeatedly reading each Word-based transcript
and extracting relevant sentences or phrases reflecting the feelings of individual
interviewees and placing them in major themes, or nodes, created by the researcher
within NVivo 8. Each item could be traced to the original contributor using the NVivo8
software. The researcher also kept a paper list of themes and added to this as new
themes or sub-themes developed.
Step 3. Additional thoughts, possible additional nodes and their potential
connections and anything else of particular interest were entered as memos,
attached to a particular interview. The author’s field notes were again, very useful in
this process.
Step 4. Themes created in Steps 2 and 3 above were reanalysed and potential
connections between them were considered and where appropriate, clustered
together as tree nodes, in a hierarchical structure, moving from a general or ‘parent’
node to more specific categories (child nodes). To some extent, the construction of
tree nodes was assisted by the interview schedule.
Step 5. Steps 2-4 were repeated for each interview. In Step 5, themes emerging
from each interview were tested against earlier interviews to avoid duplication and
themes were re-appraised as analysis developed. Re-visiting earlier decisions
provided a degree of internal quality assurance of the thematic indexing.

Step 1
Transcription and familiarisation with data, consulting field notes where appropriate. Paper record of initial thoughts on themes.
Step 2
Sorting of comments into draft thematic structure.
Step 3
Re-reading of transcripts, creating memos and re-sorting themes as appropriate.
Step 4
Final grouping of data in theme structure and instatement of metathemes.
Step 5
Refinement of thematic structure.
Stage 6
Peer review of thematic structure.
Stage 7
Discussion of themes and metathemes with referral to results of the on-line survey.
Figure 4.1 Stages of qualitative data analysis of structured interviews using NVivo8.
151

152
The analysis was repeated in a cycle until the researcher was satisfied that all
necessary themes had been constructed. A final list of master themes emerged,
which were reviewed for relatedness and importance. The assessment of importance
was based on the richness and relevance of the items in the theme rather than its
prevalence, although this was also considered. Some comments appeared to cross
themes and sub-themes, suggesting over-arching topics, described by Ely et al. as
‘’metathemes’’. 178 These are described in the analysis of the results.
Step 6. The author’s final theme construct was independently reviewed by one of her
supervisors who re-read all the transcripts to gain comment and consensus with it.
Step 7. The overall theme structure produced from previous steps formed the basis
of the results and discussion for this part of the study. Quotes from each theme were
selected to present the essence of recurrent themes. Where disagreement between
interviewees was observed within a theme, contrasting views are presented without
bias. References were also made to the results of the on-line survey.
4.2.11 Ethics approval
The study was approved prior to commencement by the University of Portsmouth
Schools of Pharmacy and Sport and Exercise Science Research Ethics Committee
(Chair’s letter, FT/08/0065, dated 29/10/2008).

153
4.3 Results
4.3.1 Questionnaire survey results
Response rates are shown in Table 4.2.
Sector Persons contacted
Respondents(N)
Response rate (% of contacts)
Full completion (% of N)
PIPA 77 57 74.0% 29.8% (17) TOPRA 688 15 2.2% 26.7% (4) UKMi 388 78 20.1% 66.7% (52)
Table 4.2 Response rates for web-based questionnaires.
The type of organisation for which respondents worked and their key roles are
shown in Tables 4.3 and 4.4 respectively.
Type of Organisation
PIPA (n; % of N in Table 4.2)
TOPRA (n;%N) UKMi (n;%N)
Academic 2 (3.5%) 0 (0%) 0 (0%) Government regulatory
1 (1.8%) 0 (0%) 1 (1.3%)
Independent Consultancy
11 (19.3%) 9 (60.0%) 0 (0%)
Practising Health care Professional
1 (1.8%) 0 (0%) 75 (96.2%)
Pharmaceutical Industry
37 (64.9%) 6 (40.0%) 0 (0%)
Independent Advisory Committee
- 0 (0%0 0 (0%)
Professional Body 1 (1.8%) 0 (0%) 0 (0%) Other* 4 (7.0%)* 0 (0%) 0 (0%)
Table 4.3 Type of organisation in which respondents worked.
*Other organisations cited by PIPA respondents: independent consultancy, NHS Trust, contract safety surveillance organisation, clinical research organisation.

154
Key role PIPA (n; % of N)* TOPRA (n;% of N) UKMi (n;% of N) Pharmacovigilance / drug safety
35 (61.4%) 4 (26.7%) 16 (20.5%)
Provision of medical information
24 (42.1%) 2 (13.3%) 75 (96.2%)
Preparation of MA applications
10 (17.5%) 5 (33.3%) 0 (0%)
Regulatory Affairs 14 (24.6%) 14 (93.3%) 0 (0%) Sales and Marketing
1 (1.8%) 0 (0%) 0 (0%)
Product R&D 8 (14.0%) 1 (6.7%) 0 (0%) Clinical Trials 6 (10.5%) 1 (6.7%) 9 (11.5%) MA Assessor 0(0%) 0 (0%) 0 (0%) Ethics Committee member
0(0%) 0 (0%) 4 (5.1%)
Manager 11 (19.3%) 1 (6.7%) 12 (15.4%) Direct provision of patient care
1 (1.8%) 0 (0%) 22 (28.2%)
Lay / patient 0 (0%) 0 (0%) 0 (0%) Other* 2 (3.5%) 1 (6.7) 6 (7.7%)
Table 4.4 Key roles of respondents.
Totals are greater than 100% because respondents could choose more than one option.
*Other key roles cited by respondents were PIPA: University lecturer, research associate; TOPRA: regulatory intelligence; UKMi: medicines information provision, education and training, formulary work (2), NHS Direct trainer, ePrescribing and intranet database maintenance.
Professional status and length of experience are shown in Tables 4.5 and 4.6 and for
industry-based respondents the nature of the company for which they worked is
shown in Table 4.7. The sources of drug safety information commonly used by
respondents are shown in Table 4.8.

155
Professional status PIPA (n; % of N in Table 1)*
TOPRA (n;% of N) UKMi (n;% of N)
Doctor 8 (14.0%) 1 (6.7%) 0 (0%) Pharmacist 11 (19.3%) 5 (33.3%) 73 (93.6%) Nurse 2 (3.5%) 0 (0%) 0 (0%) Information Scientist
8 (14.0%) 1 (6.7%) 1 (1.3%)
Scientist with a biomedical background
24 (42.1%) 5 (33.3%) 0 (0%)
Statistician 1 (1.8%) 0 (0%) 0 (0%) Other* 5 (8.8%) 4 (26.7%) 4 (5.1%)
Table 4.5 Professional status of respondents.
*Other professions cited by respondents were PIPA: chartered chemist (2), geneticist, regulatory affairs officer, pharmacovigilance manager; TOPRA: regulatory consultant, veterinary surgeon, microbiologist; UKMi: pharmacy technician (4).
Length of experience
PIPA (n; % of N) TOPRA (n;%of N)* UKMi (n;% of N)*
1-5 years 26 (45.6%) 10 (66.7%) 36 (46.2%) 6-10 years 12 (21.1%) 1 (6.7%) 21 (26.8%) 11-15 years 6 (10.5%) 1 (6.7%) 8 (10.3%) 16-20 years 6 (10.5%) 1 (6.7%) 2 (2.6%) >20 years 7 (12.3%) 1 (6.7%) 9 (11.5%) Other* 0 (0%) 1 (6.7%) 2 (2.6%)
Table 4.6 Length of experience of respondents.
*Other responses included TOPRA: 5 months; UKMi: 2 months, 6 months.
Nature of company+
PIPA (n; % of N)* TOPRA (n;% of N)* UKMi (n;% of N)
UK affiliate of a multi-national
25 (43.9%) 1 (6.7%) 0 (0%)
UK global HQ 14 (24.6%) 4 (26.7%) 0 (0%) Other 16 (28.1%) 8 (53.3%) 0 (0%) No reply 7 (12.3%) 2 (13.3%) 78 (100.0%)
Table 4.7 Nature of company respondents worked for.
+respondents could choose more than one option; *other responses included PIPA (6 written responses): various as an independent consultant (5),University of Brussels; TOPRA (5 written responses): consultancy (4), EU HQ.

156
The information sources commonly used by respondents when investigating drug
safety issues are shown in Table 4.8. The level of importance that respondents
attributed to factors which might influence the decision to withdraw a product on
safety grounds is shown in Table 4.9. The modal, or bimodal values are shaded and
the percentage of responses is also given. The level of overall satisfaction with
Gray’s hierarchy as a way of ranking safety data is shown in Table 4.10 and
respondents’ rankings of different types of ADR data are shown in Table 4.11.
Information source PIPA (16; %) TOPRA (9;%) UKMi (58;%) Yellow card reports 10 (62.5%)+ 3 (33.3%) 56 (96.6%) Non-UK spontaneous reports
10 (62.5%) 4 (44.4%) 4 (6.9%)
Corporate drug safety database
10 (62.5%) 2 (22.2%) 1 (1.7%)
Unpublished clinical trial reports
6 (37.5%) 4 (44.4%) 5 (8.6%)
Prescription event monitoring
1 (6.3%) 2 (22.2%) 12 (20.7%)
PSURs 13 (81.3%) 6 (66.7%) 0 (0%) BNF 9 (56.3%) 4 (44.4%) 50 (86.2%) SmPC 14 (87.5%) 8 (88.9%) 58 (100.0%) Martindale 10 (62.5%) 2 (22.2%) 50 (86.2%) Meyler’s 8 (50.0%) 2 (22.2%) 55 (94.8%) Stockley’s 11 (68.8%) 3 (33.3%) 50 (86.2%) Physicians’ Desk Reference
6 (37.5%) 1 (11.1%) 1(1.7%)
Briggs 6 (37.5%) 1 (11.1%) 47 (81.0%) MHRA Drug Safety Updates
11 (68.8%) 5 (55.6%) 51 (87.9%)
Clinical Literature 11 (68.8%) 4 (44.4%) 25 (43.1%) Specialised Journals
9 (56.3%) 5 (55.6%) 20 (34.5%)
Popular media 5 (31.3%) 3 (33.3%) 5 (8.6%) Other* 4 (25.0%) 4 (44.4%) 16 (27.6%) No reply 19 respondents 6 respondents 20 respondents
Table 4.8 Information sources commonly used by respondents when investigating drug safety issues.
The three most frequently cited sources are shaded for each group. +Percentages total more than 100% because respondents could choose multiple sources. *Other specific sources cited by respondents included PIPA (5 written responses): pre-clinical data, consumer and HCP reports, systematic literature search, FDA Drug Safety Updates, centralised in-house database; TOPRA (1 written response): FDA website; UKMi (16 respondents often cited multiple sources not listed in the question): Micromedex (8), AHFS Drug Information (4), FDA website, Drugdex (6) database, Davies’ Textbook of Adverse Drug Reactions, systematic literature search (3), Drugs by Dollery, Drugs During Pregnancy and Lactation by Schaefer, Trissell’s Handbook of Injectable Drugs, the Renal Handbook.

Table 4.9 Level of importance that resp ors which might influence th ithdraw a product on safety grounds. (Modal or bimodal values are shaded)
ondents attributed to fact e decision to w
PIPA (16; %) TOPRA (8-9;%) UKMi (57-58;%) Factor Unimportant Minor
importance Major importance
Utmost importance
Unimportant Minor importance
Major importance
Utmost importance
Unimportant Minor importance
Major importance
Utmost importance
Available alternative
1 6 8 (50%) 1 1 2 5 (55.6%) 1 8 23 (39.7%) 22 5
Number of eligible patients
3 7 (43.8%) 5 1 0 8 (88.9%) 1 0 16 27 (47.4%) 14 0
Unfavourable risk / benefit profile
1 0 8 (50.0%) 7 0 0 3 5 (62.5%) 1 2 30 (52.6%) 24
More ADRs if product not withdrawn
1 0 6 9 (56.3%) 1 0 3 5 (55.6%) 0 1 30 (51.7%) 27
Legal consequences if not withdrawn
1 2 8 (50.0%) 4 0 2 5(55.6%) 2 1 16 29 (50.0%) 12
Financial pressures to continue marketing
8 (50.0%) 5 2 1 2 4 (44.4%) 3 0 22 (37.9%) 22 (37.9%) 13 1
To safeguard patient health
1 0 2 13 (81.3%) 0 1 3 5 (55.6%) 0 2 14 41 (71.9%)
To continue to provide benefit to patients
2 4 8 (50.0%) 2 0 3 4 (44.4%) 2 1 18 36 (62.1%) 3
Ethical considerations
1 2 7 (43.8%) 6 0 2 3 4 (44.4%) 0 9 31 (53.4%) 18
Company good standing
2 0 10 (62.5%) 4 0 4 (44.4%) 3 2 19 23 (39.7%) 13 3
NHS good standing
4 5 (31.3%) 5 (31.3%)
2 2 3 4 (44.4%) 0 5 21 (36.2%) 20 12
No reply 19 respondents 6 respondents 20 respondents
157

158
Gray’s ranking PIPA (12; %) TOPRA (7;%) UKMi (55;%) Extremely dissatisfied
2 (8.7%) 0 1 (1.8%)
Partially dissatisfied
2 (8.7%) 2 (25.0%) 8 (14.5%)
Partially satisfied 8 (66.7%) 3 (42.9%) 35 (63.6%) Completely satisfied
0 2 (25.0%) 11 (20.0%)
No reply 23 respondents 8 respondents 23 respondents
Table 4.10 Level of respondent satisfaction with Gray’s hierarchy for ranking ADR data. (Modal or bimodal values are shaded)
Respondents’ thoughts on ways of improving the quality of drug safety evidence are
shown in Table 4.12.

159
Table 4.11 Respondents’ rankings of different ADR sources according to Gray’s hierarchy. (modal values are shaded)
*see Table 3.2 for explanation of ranking numbers according to Gray’s hierarchy of evidence.
PIPA (14-16; %) TOPRA (8;%) UKMi (37-57;%) Evidence 1* 2 3 4 5 1 2 3 4 5 1 2 3 4 5
Yellow card reports
1 1 7 (43.8%)
3 4 3 0 3 (37.5%)
2 0 2 12 14 16 (26.1%)
13
Medwatch reports
1 1 7 (43.8%)
2 3 1 2 4 (50.0%)
1 0 1 9 11 (29.7%)
8 8
Other spontaneous reports
1 1 6 (37.5%)
4 4 2 (25.0%)
2 (25.0%)
2 (25.0%)
2 (25.0%)
0 1 10 14 (28.0%)
13 12
PEM reports 1 3 5 (33.3%)
5 (33.3%)
1 1 3 (37.5%)
2 2 0 0 15 (34.9%)
11 10 7
Company risk vs benefit reports
3 4 (26.7%)
3 3 2 1 3 (37.5%)
3 (37.5%)
0 1 1 7 22 (42.3%)
16 6
Published UK RCTs
3 4 (26.7%)
3 3 2 3 (37.5%)
2 1 1 1 16 22 (40.7%)
7 4 5
Published non-UK RCTs
4 2 5 (33.3%)
2 2 4 (50.0%)
2 0 1 1 9 24 (45.3%
10 7 3
Meta-analyses 5 7 (43.8%)
1 2 1 4 (50.0%)
2 1 1 0 27 (48.2%)
17 2 5 5
Case studies 1 4 5 (33.3%)
1 4 1 2 (25.0%)
1 2 (25.0%)
2 (25.0%)
2 5 27 (50.0%)
12 8
Case series 2 5 (35.7%)
3 2 2 1 3 (37.5%)
1 3 (37.5%)
0 2 12 20 (37.7%)
17 2
Case control studies
1 6 (40.0%)
4 4 0 1 4 (50.0%)
1 2 0 5 13 22 (41.5%)
10 3
Epidemiological studies
5 (33.3%)
3 2 4 1 2 2 (25.0%)
2 (25.0%)
2 (25.0%)
2 (25.0%)
12 17 (32.7%)
8 11 4
Drug Safety Updates
2 4 (25.0%)
4 (25.0%)
2 4 (25.0%)
3 (37.5%)
3 (37.5%)
1 0 1 15 21 (37.5%)
2 6 12
PSURs 3 4 2 2 5 (31.3%)
2 3 (37.5%)
2 1 0 0 8 16 (34.8%)
15 7
Other 3 (see discussion) 0 2 (see discussion) No reply 19 respondents (responders for individual types
of evidence ranged between 14 and 16) 7 respondents 21 respondents (responders for individual
types of evidence ranged between 37 and 57)

160
Preference* PIPA (26;%) TOPRA (8;%) UKMi (55;%) Product-specific analysis and reporting by a NICE safety sub-group
4 (15.4) 0 (0%) 20 (36.4%)
Provisional licensing scheme
7 (26.9%) 3 (37.5%) 16 (29.1%)
Independent safety study group
9 (34.6%) 3 (37.5%) 35 (63.6%)
Subject all drugs to PEM
14 (53.8%) 5 (62.5%) 37 (67.3%)
Other (see discussion)
5 (19.2%) 0 (0%) 2 (3.6%)
Table 4.12 Personal preferences for ways of improving the quality of drug safety evidence.
*Percentages total more than 100% because respondents could choose more than one option.
Respondents’ opinions on what should happen in each of the seven scenarios are
presented in Tables 4.13 to 4.19. These tables also include respondents’ ratings of
the new evidence presented in each scenario according to Gray’s hierarchy. The
modal choices within each of the three study groups are shaded.

161
Table 4.13 Respondents’ views on Scenario 1.
(see Appendix 2 for scenario description)
*Respondents were allowed to choose more than one option.
Options* PIPA (23;%) TOPRA (4;%) UKMi (57;%) No changes required 4 (17.4%) 0 (0%) 12 (21.1%) Product labelling should not be changed until further reports are received
10 (43.5%) 2 (50.0%) 16 (28.1%)
Product should be withdrawn from the UK market
1 (4.3% 0 (0%) 0 (0%)
Product should be suspended pending further analysis
1 (4.3%) 0 (0%) 0 (0%)
Product information should be amended to indicate the possibility of hiccups
10 (43.5%) 2 (50.0%) 42 (73.7%)
Restrict to specialist use
1 (4.3%) 0 (0%) 0 (0%)
ADR should be the topic of a ‘Dear Doctor’ letter from the MHRA
2 (8.7%) 0 (0%) 5 (8.8%)
ADR should be featured in the next ‘Drug Safety Update’ from the MHRA
3 (13.0%) 1 (25.0%) 7 (12.3%)
ADR should be the subject of a ‘blue box’ warning in the BNF
2 (8.7%) 0 (0%) 1 (1.8%)
Product should be made subject to special yellow card reporting
2 (8.7%) 0 (0%) 3 (5.3%)
A general PEM study should be commissioned
0 (0%) 0 (0%) 0 (0%)
Other (see discussion)
1 (4.3%) 1 (25.0%) 0 (0%)
Gray’s hierarchy rating
1 2 0 0 2 1 0 2 3 2 0 0 4 1 0 8 5 17 (73.9%) 4 (100.0%) 47 (82.5%)

162
Table 4.14 Respondents’ views on Scenario 2.
(see Appendix 2 for scenario description)
*Respondents were allowed to choose more than one option.
Options* PIPA (21;%) TOPRA (4;%) UKMi (55;%) No changes required 0 (0%) 0 (0%) 0 (0%) Product labelling should not be changed until further reports are received
1 (4.8%) 0 (0%) 1 (1.8%)
Product should be withdrawn from the UK market
1 (4.8%) 0 (0%) 1 (1.8%)
Product should be suspended pending further analysis
3 (14.3%) 0 (0%) 13 (23.6%)
Product should be contraindicated in children <12
12 (57.1%) 3 (75.0%) 15 (27.3%)
Restrict to specialist use
7 (33.3%) 2 (50.0%) 34 (61.8%)
ADR should be the topic of a ‘Dear Doctor’ letter from the MHRA
15 (71.5%) 2 (50.0%) 34 (61.8%)
ADR should be featured in the next ‘Drug Safety Update’ from the MHRA
13 (61.9%) 4 (100.0%) 41 (74.5%)
ADR should be the subject of a ‘blue box’ warning in the BNF
10 (47.6%) 2 (50.0%) 27 (49.1%)
Product should be made subject to special yellow card reporting
10 (47.6%) 3 (75.0%) 22 (40.0%)
A general PEM study should be commissioned
2 (9.5%) 0 (0%) 10 (18.2%)
Other (see discussion)
3 (14.3%) 2 (50.0%) 1 (1.8%)
Gray’s hierarchy rating
1 2 1 (25.0%) 2 2 3 1 (25.0%) 5 3 7 1 (25.0%) 19 4 8 (38.1%) 0 (0%) 21 (38.3%) 5 1 1 (25.0%) 8

163
Options* PIPA (20;%) TOPRA (4;%) UKMi (52;%) No changes required 0 (0%) 0 (0%) 0 (0%) Product labelling should not be changed until further reports are received
3 (15.0%) 0 (0%) 1 (1.9%)
Product should be withdrawn from the UK market
1 (5.0%) 0 (0%0 3 (5.8%)
Product should be suspended pending further analysis
6 (30.0%) 1 (25.0%) 26 (50.0%)
Product should be contraindicated with existing hepatic abnormalities
14 (70.0%) 4 (100.0%) 30 (57.7%)
Restrict to specialist use
9 (45.0%) 1 (25.0%) 24 (46.2%)
ADR should be the topic of a ‘Dear Doctor’ letter from the MHRA
16 (80.0%) 1 (25.0%) 32 (61.5%)
ADR should be featured in the next ‘Drug Safety Update’ from the MHRA
16 (80.0%) 4 (100.0%) 39 (75.0%)
ADR should be the subject of a ‘blue box’ warning in the BNF
13 (65.0%) 2 (50.0%) 20 (38.5%)
Product should be made subject to special yellow card reporting
9 (45.0%) 1 (25.0%) 19 (36.5%)
A general PEM study should be commissioned
6 (30.0%) 1 (25.0%) 11 (21.2%)
Other (see discussion)
2 (10.0%) 1 (25.0%) 3 (5.8%)
Gray’s hierarchy rating
1 2 0 1 2 6 (30.0%) 1 5 3 2 2 (50.0%) 14 4 4 0 10 5 6 (30.0%) 1 22 (42.3%)
Table 4.15 Respondents’ views on Scenario 3.
(see Appendix 2 for scenario description)
*Respondents were allowed to choose more than one option.

164
Options* PIPA (20;%) TOPRA (4;%) UKMi (52;%) No changes required 0 (0%) 0 (0%) 3 (5.8%) Product labelling should not be changed until further reports are received
4 (20.0%) 0 (0%) 7 (13.5%)
Product should be withdrawn from the UK market
2 (10.0%) 0 (0%) 1 (1.9%)
Product should be suspended pending further analysis
1 (5.0%) 0 (0%) 1 (1.9%)
Product should be contraindicated with existing hepatic disease
15 (75.0%) 2 (50.0%) 31 (59.6%)
Restrict to specialist use
8 (40.0%) 0 (0%) 19 (36.5%)
ADR should be the topic of a ‘Dear Doctor’ letter from the MHRA
12 (60.0%) 0 (0%) 23 (44.2%)
ADR should be featured in the next ‘Drug Safety Update’ from the MHRA
10 (50.0%) 3 (75.0%) 35 (67.3%)
ADR should be the subject of a ‘blue box’ warning in the BNF
7 (35.0%) 0 (0%) 15 (28.8%)
Product should be made subject to special yellow card reporting
6 (30.0%) 1 (25.0%) 14 (26.9%)
A general PEM study should be commissioned
8 (40.0%) 0 (0%) 4 (7.7%)
Other (see discussion)
2 (10.0%) 0 (0%) 5 (9.6%)
Gray’s hierarchy rating
1 2 0 1 2 2 0 0 3 2 0 4 4 5 1 13 5 9 (45.0%) 3 (75.0%) 34 (65.4%)
Table 4.16 Respondents’ views on Scenario 4.
(see Appendix 2 for scenario description)
*Respondents were allowed to choose more than one option.

165
Options* PIPA (18;%) TOPRA (4;%) UKMi (52;%) No changes required 0 (0%) 0 (0%) 0 (0%) Product labelling should not be changed until further reports are received
1 (5.3% 0 (0%) 0 (0%)
Product should be withdrawn from the UK market
3 (15.8%) 0 (0%) 4 (7.7%)
Product should be suspended pending further analysis
8 (42.1%) 0 (0%) 21 (40.4%)
Product should be contraindicated with existing hepatic disease
8 (42.1%) 4 (100.0%) 25 (48.1%)
Restrict to specialist use
9 (47.4%) 1 (25.0%) 37 (71.2%)
ADR should be the topic of a ‘Dear Doctor’ letter from the MHRA
12 (63.2%) 2 (50.0%) 25 (48.1%)
ADR should be featured in the next ‘Drug Safety Update’ from the MHRA
11 (57.9%) 4 (100.0%) 28 (53.8%)
ADR should be the subject of a ‘blue box’ warning in the BNF
5 (26.3%) 2 (50.0%) 18 (34.6%)
Product should be made subject to special yellow card reporting
6 (31.6%) 3 (75.0%) 18 (34.6%)
A general PEM study should be commissioned
3 (15.8%) 1 (25.0%) 11 (21.2%)
Other (see discussion)
2 (10.5%) 1 (25.0%) 4 (7.7%)
Gray’s hierarchy rating
1 3 0 1 2 3 0 4 3 8 (42.1%) 3 (75.0%) 16 4 2 1 17 (32.7%) 5 3 0 14
Table 4.17 Respondents’ views on Scenario 5.
(see Appendix 2 for scenario description)
*Respondents were allowed to choose more than one option.

166
Table 4.18 Respondents’ views on Scenario 6.
(see Appendix 2 for scenario description)
*Respondents were allowed to choose more than one option.
Options* PIPA (18;%) TOPRA (4;%) UKMi (52;%) No changes required 0 (0%) 0 (0%) 0 (0%) Product labelling should not be changed until further reports are received
1 (5.6%) 0 (0%) 2 (3.8%)
Product should be withdrawn from the UK market
4 (22.2%) 1 (25.0%) 11 (21.2%)
Product should be suspended pending further analysis
9 (50.0%) 2 (50.0%) 20 (38.5%)
Product labelling should be amended to indicate the possibility of severe liver disease
10 (55.6%) 4 (100.0%) 28 (53.8%)
Restrict to specialist use
6 (33.3%) 1 (25.0%) 11 (21.2%)
ADR should be the topic of a ‘Dear Doctor’ letter from the MHRA
11 (61.1%) 3 (75.0%) 25 (48.1%)
ADR should be featured in the next ‘Drug Safety Update’ from the MHRA
11 (61.1%) 3 (75.0%) 31 (59.6%)
ADR should be the subject of a ‘blue box’ warning in the BNF
7 (38.9%) 3 (75.0%) 12 (23.1%)
Product should be made subject to special yellow card reporting
5 (27.8%) 0 (0%) 13 (25.0%)
A general PEM study should be commissioned
6 (33.3%) 0 (0%) 0 (0%)
Other (see discussion)
1 (5.6%) 1 (25.0%) 0 (0%)
Gray’s hierarchy rating
1 2 0 1 2 3 0 2 3 1 0 4 4 3 1 14 5 9 (50.0%) 3 (75.0%) 31 (59.6%)

167
Options* PIPA (17;%) TOPRA (4;%) UKMi (52;%) No changes required 0 (0%) 1 (25.0%) 0 (0%) Product labelling should not be changed until further reports are received
5 (29.4%) 0 (0%) 6 (11.5%)
Product should be withdrawn from the UK market
1 (5.9%) 0 (0%) 10 (19.2%)
Product should be suspended pending further analysis
5 (29.4%) 0 (0%) 17 (32.7%)
Product be contraindicated in immunocompromised patients
8 (47.1%) 3 (75.0%) 10 (19.2%)
Restrict to specialist use
11 (64.7%) 2 (50.0%) 29 (55.8%)
ADR should be the topic of a ‘Dear Doctor’ letter from the MHRA
8 (47.1%) 2 (50.0%) 21 (40.4%)
ADR should be featured in the next ‘Drug Safety Update’ from the MHRA
7 (41.2%) 3 (75.0%) 29 (55.8%)
ADR should be the subject of a ‘blue box’ warning in the BNF
5 (29.4%) 1 (25.0%) 14 (26.9%)
Product should be made subject to special yellow card reporting
8 (47.1%) 1 (25.0%) 17 (32.7%)
A general PEM study should be commissioned
5 (29.4%) 1 (25.0%) 8 (15.4%)
Other (see discussion)
2 (11.8%) 0 (0%) 2 (3.8%)
Gray’s hierarchy rating
1 1 0 3 2 2 1 2 3 3 0 6 4 2 0 20 5 9 (52.9%) 3 (75.0%) 21 (40.4%)
Table 4.19 Respondents’ views on Scenario 7
(see Appendix 2 for scenario description)
*Respondents were allowed to choose more than one option.

168
4.3.2 Structured interview results
4.3.2.1 Subject demographics
In total, 13 subjects agreed to be interviewed; key anonymised data are shown in
Appendix 3. Medical, pharmaceutical and other professionals were represented,
working in a range of PV environments, including the NHS, the Pharmaceutical
Industry, and for the UK Regulator; although the majority of the latter did so in a
consultancy or advisory capacity. Two members of the MHRA Advisory Committee
on the Safety of Drugs (ACSD) were included, in addition to two who had previously
worked full-time for the MHRA. Two respondents had previously completed the on-
line survey and had agreed to be interviewed. This allowed a test of the reliability of
their responses to key survey questions and development of discussion on their
responses to the two scenarios present in both studies (Cases 1 and 2).
4.3.2.2 Themed analysis
While the construction of themes was driven to some extent by the questionnaire
schedule, an overall theme map that best described the data resulting from NVivo8
analysis is shown in Figure 4.2. The detail of this is discussed and related to the
responses from the web-based questionnaire survey Section 4.4.2.

169

170
4.4 Discussion
4.4.1 Web-based survey
4.4.1.1 Response rate
Response rates for TOPRA and PIPA respondents were disappointing, even after a
second reminder and extended completion period. This may be connected to the
manner in which the questionnaire was circulated or its content. A small minority of
UKMi pharmacists questioned the relevance of some of the questions to their role
and two PIPA members stated that they were inexpert in some aspects of the
questionnaire.
Some questionnaire fatigue was evident as respondents progressed through it, as
evidenced by the full completion rates shown in Table 4.2. This might have been due
to lack of time, interest or experience. A further detractor may have been the lack of
facility to store replies if the survey could not be completed in one sitting.
4.4.1.2 Respondent demographics (Tables 4.3 – 4.7)
As expected, due to their nature, membership of each organisation was
heterogeneous in terms of main occupation, place of work and years of experience
in the field; but the study’s aim to capture the opinions of wide a variety of
professionals working with PV data was achieved. PIPA and TOPRA membership
was largely, although not exclusively, derived from health care professionals working
in the pharmaceutical industry either directly or as consultants; whereas UKMi
members were mainly pharmacists working in NHS Medicines Information
departments, but who also had direct patient contact.
The views of subgroups of individuals within particular organisations were not
analysed systematically, because response rates were low. A preliminary subgroup
analysis of the responses from both PIPA and TOPRA members describing
themselves as having a PV / drug safety role with responses from other PIPA and
TOPRA members showed no discernable differences in responses to all questions
so the analysis was not pursued. The only difference in demographics which could
be detected was a tendency for more PIPA members having the key role of PV /

171
drug safety to have 10 years’ experience or less ( 27 vs 8) compared to more than
10 years’ experience (11 vs 11) in the role (Chi2=4.479, p=0.034).
4.4.1.3 Safety information sources used (Table 4.8)
Respondents used a wide variety of safety information sources when investigating a
drug safety issue. Unsurprisingly, UKMi respondents cited a wide range of
databases and textbooks routinely used to answer other types of Mi enquiries.
PSURs were frequently cited by PIPA and TOPRA members; these individuals may
have had more experience of handling PSUR data due to their work with
pharmaceutical companies, whereas UKMi staff, unless they had worked with a
pharmaceutical company, may not have been aware of their existence. It may have
been interesting to explore this through a supplementary question for UKMi
respondents. Certainly, this result contributes to construct validity of the findings.
4.4.1.4 Factors potentially influencing the decision to withdraw a product
(Table 4.9)
The different groups responded in subtly different ways to this question. All three
groups most frequently chose safeguarding public health as being of utmost
importance; an appreciable minority of UKMi respondents cited financial pressures to
keep marketing the product as of minor or no importance. A majority of PIPA
members (62.5%) cited the good standing of the company as being of major
importance.
One UKMi member (a pharmacist with 6-10 years’ experience in a
pharmacovigilance role) suggested an additional reason why a drug might remain on
the market:
‘The immediate benefits to the patient; e.g. sildenafil has caused a much larger
number of deaths than many other withdrawn products, but the people taking this
product could see an immediate beneficial effect and therefore it was not withdrawn,
with patients accepting the risk. For other conditions, where the benefits were not
immediately visible, the products were withdrawn’.

172
4.4.1.5 Opinions on Gray’s hierarchy as a means of ranking safety evidence
(Table 4.10)
A majority of respondents indicated that they were only partially satisfied with Gray’s
hierarchy as a means of rating the quality of safety data. Only two (25%) TOPRA
and 11 (21%) UKMi members and no PIPA members indicated complete
satisfaction. The ranking may have been novel to some respondents, hence the
uncertainty in its use; it is evident from answers in the Scenarios (see Section
4.4.1.8), that many respondents did not use the hierarchy in a systematic way.
4.4.1.6 Use of Gray’s hierarchy to rank different types of safety evidence (Table
4.11)
As a whole, respondents appeared to be using the prescribed hierarchy in a different
way from the guidance given in the question, suggesting that the ways of ranking
clinical efficacy and drug safety data are different. For example, most PIPA and
TOPRA respondents ranked yellow card data as level 3 or higher, whereas most
UKMi respondents ranked it as level 3 or lower. PEM reports followed a similar
pattern, although the 15 UKMi respondents ranked them as level 2 data.
Epidemiological studies, Drug Safety Updates, published clinical trials and meta-
analyses of clinical trial reports were ranked highly by all three groups.
One PIPA member (an independent consultant with 16-20 years’ experience as of
the pharmaceutical industry) explained his low ranking of RCTs with the following
comment:
‘I have personally seen the MHRA take an unbalanced view on a safety issue by
excluding data (studies which showed no AEs), so (my) ranking is lower than I wish it
was, based on this experience. Both MHRA and FDA for example are influenced by
public opinion and can be more conservative than necessary “in the interest of public
safety” (and) litigation’.
Of PSURs they said:

173
‘In my experience, pharma companies of high repute are guided in their reporting by
the generally strict procedures around writing PSURs, so PSURs are generally
conservative’.
Another PIPA member (a geneticist with 16-20 years’ experience of the
pharmaceutical industry) pointed out that PSURs were updated according to a
prescribed schedule depending on the product life cycle and therefore may not be
totally up to date. They went on to say that:
‘The issues are capturing the things that are not published and getting people to
report more commonly’.
A third PIPA member (an information scientist with more than 20 years’ experience
with the pharmaceutical industry) cited information on overdoses from Poisons
Information Services as being a potentially important source of ADR data.
One UKMi respondent (a pharmacist with 6-10 years’ pharmacovigilance
experience) stated that:
‘Large post-marketing observational studies would be Level 1 in my view, as they are
based on the experience of a real patient population, which may not be true of
RCTs’.
Another UKMi member highlighted the problem of:
‘getting the right balance between good quality evidence and acting promptly to
reduce harm’.
This may have influenced at least this individual’s perception of the importance of
some types of safety information compared to others.
4.4.1.7 Ways of improving the quality of drug safety evidence. (Table 4.12)
The most frequently cited means of improving drug safety data cited by respondents
from all three groups, was to subject all new drugs to PEM. One PIPA respondent (a
clinician with 16-20 years’ experience in pharmacovigilance in the pharmaceutical
industry) called for:
‘commitment to Phase IV safety studies’.

174
Appreciable minorities also cited input from an independent safety study group. One
PIPA member (an independent consultant to the pharmaceutical industry with 16-20
years’ experience) also suggested constructing a parallel scheme to Gray’s
hierarchy:
‘so that a risk-benefit balance is based on similar criteria’.
Another member (a geneticist with 6-10 years’ experience with a pharmaceutical
company) stressed the importance of gathering global data before making decisions
affecting UK products and that this could benefit from being done:
‘by an external organisation’.
Another PIPA member (a biomedical scientist in pharmacovigilance in a
pharmaceutical company) suggested:
‘mandatory reporting of all ADRs by health care professionals’.
This view was reflected by a fourth PIPA member (a biomedical scientist with 6-10
years’ experience in pharmacovigilance with a pharmaceutical company) who in
addition suggested that reports should be made to:
‘the regulatory authority directly, to avoid duplication and consequent skewing of the
data’.
A UKMi pharmacist with 6-10 years’ experience suggested working:
‘towards improving the quality of patient record keeping for medication and
outcomes’
Aa second UKMi pharmacist suggested that during the post-licensing phase, there
should be:
‘properly designed clinical trials with safety as the primary outcome’.
4.4.1.8 Drug safety scenarios
All seven scenarios were hypothetical although four of them (scenarios 2,4,6 and 7)
were based on safety issues with real marketed products known to the author and
her supervisors; drug names, fictitious or otherwise, were not mentioned. This was to

175
inject realism, while at the same time helping to ensure that respondents focussed
on the safety data presented and gave their own views on the action needed to be
taken in the light of the emergence of new safety data, without being unduly
influenced by what had happened previously in the marketplace.
The reader is referred to Appendix 2 for the full details of each scenario. The findings
from each one are discussed below, with keywords of the case as an aide memoir.
Scenario 1. Hiccups with an ACE inhibitor. (see Table 4.13)
Minorities of PIPA (4;17.4%)) and UKMi (12; 21.1%) respondents indicated that they
thought that no changes to marketing were necessary with the emergence of
hiccups. One PIPA member stating that the product should be withdrawn is perhaps
an anomaly. There was a dichotomy of opinion in all three groups as to whether the
labelling should not be changed until further reports are received or the labelling
should be changed to indicate the possibility of hiccups. Approximately half of both
the PIPA and TOPRA groups opted for one or the other, but with UKMi, the choice
was more clear-cut, with around three quarters of respondents opting for changing
the product labelling. No-one was in favour of commissioning a PEM study. As one
PIPA respondent (a biomedical scientist with between 6 and 10 years’ experience of
pharmacovigilqance in a pharmaceutical company) pointed out:
‘ The WHO considers three reports to be a signal so something should be done’.
However a TOPRA respondent (a clinician with 1-5 years’ experience of
pharmacovigilance working in an independent consultancy) was reluctant to make
changes:
‘ Hiccups is not indicative of harm..... would need more evidence’.
Clear majorities judged the new evidence presented as Level 5 using Gray’s
hierarchy, even though it consisted of just three yellow card reports.
Scenario 2. A new anticonvulsant with a higher than expected incidence of
serious skin reactions in children. (see Table 4.14)
Large majorities from all three groups felt that a warning should be broadcast
through a ‘Dear Doctor’ letter and in the next Drug Safety Update; there was also

176
considerable support for inserting a ‘blue box’ warning in the BNF. Just two
respondents (one PIPA and one UKMi) were in favour of withdrawing the drug based
on the new evidence. Majorities of PIPA and TOPRA members were in favour of
contraindicating the product in children less than 12 years of age. Two (9.5%) PIPA
and 10 (18.2%) UKMi respondents were in favour of commissioning a PEM study. A
sense of urgency was conveyed by several respondents. One PIPA member (a
clinician with 16-20 years’ pharmacovigilance experience with a pharmaceutical
company) stated:
‘patients and prescribers should be informed as soon as possible’.
This was repeated by another PIPA member (a pharmacist with 16-20 years’
consulting experience) who went on to say that discrimination should be exercised
and that their decision was:
‘based more on the serious of the AEs rather than the incidence’.
Another PIPA member (a biomedical scientist with 16-20 years’ pharmacovigilance
experience in the pharmaceutical industry) stated that:
‘labelling should be amended to clearly indicate the risks, particularly to children, and
to reinforce recommendations for dosage’.
Two TOPRA members (one, a clinician with 1-5 years’ pharmacovigilance
experience as an independent consultant and the other, a biomedical scientist
working in regulatory affairs as an independent consultant) expressed the opinion
that the product might best be restricted to specialist (consultant) use. As the former
put it:
‘Epilepsy is a life-threatening condition for some children...may be justified that only
neurologists should be initial prescribers’.
A UKMi member (a pharmacist with 11-15 years’ Mi experience echoed this view).
There was an interesting diversity of opinion on where the new evidence (from a
PEM study) sat with Gray’s hierarchy, with Level 4 being the most popular choice
with PIPA and UKMi members.

177
Scenario 3. Monoclonal antibody for serious rheumatoid arthritis associated
with hepatotoxicity (see Table 4.15).
There was strong support from all groups for the reaction to be featured in a ‘Dear
Doctor’ letter and in the Drug Safety Update. There was also strong support for a
‘blue box’ warning in the BNF and for the product to be contraindicated with pre-
existing hepatic abnormalities. Just one (5.0%) PIPA and three (5.8%) UKMi
respondents thought the product should be withdrawn from the UK market. Six
(30.0%) PIPA, one (25.0%) TOPRA and 11 (21.2%) UKMi respondents said that a
PEM study should be commissioned.
One PIPA member (a biomedical scientist with more than 20 years’ experience in
Regulatory Affairs) stressed the need for more data before making a decision:
‘...company may have additional evidence from a range of sources that together give
a clearer picture of the ADR’s frequency and severity’
and that a risk-benefit assessment from this might be submitted to the Regulator.
Another PIPA member (a pharmacist with 16-20 years’ experience of Regulatory
Affairs as an independent consultant to the pharmaceutical industry) believed that:
‘the SmPC should be amended to include the requirement for regular liver function
tests and instruction (given) to discontinue the drug if increases are seen’.
Some respondents were circumspect; one TOPRA member (a clinician with 1-5
years’ pharmacovigilance experience as a consultant) remarked:
‘There are alternative treatments for RA. But again, the product may be very
effective in certain resistant sub-groups......Need to closely examine how it was used
in the US’.
Three UKMi pharmacists, with varying lengths of experience provided written
comments. One thought that if liver function tests became abnormal the drug should
be stopped; another stressed the importance of changing product labelling to reflect
possible serious liver effects and a third highlighted the:
’need to establish whether risk is the same in the UK and what risk factors exist’.
Thus reflecting the views of the PIPA member above.

178
The new safety evidence presented consisted of 53 US spontaneous reports. It is
interesting to see the diversity of opinion on the level of this evidence. PIPA
members were split between Levels 2 and 5, while the most frequently cited level by
UKMi respondents was Level 5.
Scenario 4. New therapy for ADHD associated with hepatotoxicity (see Table
4.16)
There was strong support for the ADR to be mentioned in Drug safety Update and
for the product to be contraindicated in existing hepatic disease. Two (10.0%) PIPA
members and one (1.9%) UKMi member thought the product should be withdrawn.
Eight (40.0%) PIPA and 4 (7.7%) UKMi respondents said that a PEM study should
be commissioned.
One PIPA member (a pharmacist with 16-20 years’ experience in Regulatory Affairs,
as an independent consultant to the pharmaceutical industry) opined that the product
was probably already only used by specialists and as a new product, would be
subject to special reporting under the yellow card scheme anyway (as a black
triangle drug). Another PIPA member (a biomedical scientist with 16-20 years’
pharmacovigilance experience working in a pharmaceutical company) observed that
there was:
‘....not enough data provided to make a proper assessment i.e. did the 41 children
have underlying liver problems’.
Four UKMi pharmacist members with varying lengths of service stressed the
importance of amending the SPC to reflect the new data, one adding that prescribers
and patients should be:
‘vigilant for signs and symptoms of hepatic problems, measure LFTs if indicated and
stop the drug if LFTs become abnormal’.
A fifth referred to the fact that ‘new drug’ yellow card reporting should be in place for
this product.

179
The general consensus among respondents was that even though the new safety
evidence consisted of spontaneous reports, most of them originating outside the UK,
it was Level 5.
Scenario 5. Gene therapy product for children with muscular dystrophy
associated with hepatic reactions. (see Table 4.17)
All groups favoured the Drug Safety Update as a means of highlighting this ADR and
an appreciable proportion of UKMi respondents said the product should be restricted
to specialist use. PIPA members were particularly keen on the ‘Dear Doctor’ letter
approach. A sizable proportion of all groups said the product ought to be
contraindicated in patients with pre-existing hepatic disease. Three (15.8%) PIPA
respondents and 4 (7.7%) UKMi respondents said the product should be withdrawn
in the light of the new safety evidence. Three (15.8%) PIPA, one (25.0%) TOPRA
and 11 (21.2%) UKMi respondents said that a PEM study should be commissioned.
One PIPA respondent (a pharmacist with 16-20 years’ experience of Regulatory
Affairs as an independent consultant to the pharmaceutical industry) stated that they
would like to see a placebo-controlled study:
‘as the risks associated with withholding this drug may outweigh any risk of AEs’.
One could consider lowering the dose or including a warning not to exceed the
recommended dose, depending on the doses associated with ADRs. They added
that they thought this was:
‘.. an emotional one, where the drug could be life-saving.. so the level of tolerance
(to the prescriber) may be higher’.
Another PIPA member (a biomedical scientist with 16-20 years’ pharmacovigilance
experience in the pharmaceutical industry) lamented the lack of additional
information which might facilitate a risk – benefit analysis with other treatments. This
was a view echoed by one TOPRA member (a biomedical scientist acting as an
independent Regulatory Affairs consultant) who argued that additional data might
make the difference between limiting the product to specialist use or product

180
suspension. Four UKMi pharmacists with a range of experience gave written
comments. One stated that they were:
‘.....not sure. This is a serious condition. Think it would depend on the availability of
alternatives and their risks’.
Another pharmacist said that labelling should be changed while additional data was
sought. Another stated that the licensed dose should be reduced pending the
generation of additional data and another that the dose should be reduced and that a
register could be maintained of all patients receiving the drug:
‘as numbers are unlikely to be huge’.
The modal value for level of evidence was Level 3 for PIPA and TOPRA
respondents, but Level 4 for UKMi respondents. The evidence was in two parts: a
small, published epidemiological study and five serious UK spontaneous reports.
Scenario 6. Hypoglycaemic agent with hepatic complications (see Table 4.18)
One (5.6%) PIPA and 2 (3.8%) UKMi respondents believed that the product labelling
should not be changed until further ADR reports had been received. In contrast, four
(22.2%) PIPA, one (25.0%) TOPRA and 11(21.2%) UKMi respondents believed that
the product should be withdrawn on the basis of the new safety evidence. Large
proportions of all three groups suggested amending the product labelling to indicate
the possibility of severe liver disease, issue a ‘Dear Doctor’ letter and inserting a
notice in the Drug Safety Update. Six PIPA respondents said that a PEM study
should be commissioned.
One PIPA respondent (a pharmacist with 16-20 years’ experience of Regulatory
Affairs working as a consultant to the pharmaceutical industry) stated that the case
was:
‘.. borderline withdrawal because there are alternatives’.
A TOPRA respondent wanted to see more information on the new data, but in any
case, product suspension should be considered:
‘due to the nature of the probable initial prescriber’.

181
An appreciable majority in all respondent groups judged the new safety data to be
Level 5. It consisted of 130 spontaneous reports, mostly from abroad, but an
estimated incidence of the reaction in the UK was given.
Scenario 7. Immunosuppressant for atopic dermatitis, associated with
cutaneous malignancies and lymphomas. (see Table 4.19).
One (5.9%) PIPA and 10 (19.2%) UKMi respondents thought the product should be
withdrawn in the light of the new safety evidence. More than half the respondents in
all groups thought the product should be restricted to specialist use. Large
proportions were in favour of making the information a feature of either a ‘Dear
Doctor’ letter or a Drug Safety Update. Five (29.4%) PIPA, one (25.0%) TOPRA and
eight (15.4%) UKMi respondents were in favour of commissioning a PEM study. One
PIPA respondent (a pharmacist with 16-20 years’ experience in Regulatory Affairs
working as a consultant to the pharmaceutical industry though that:
‘Patients and carers should be alerted to the signs of lymphomas and skin cancers
and advised to contact the Doctor as soon as possible’.
Another stated that they would want to do their own risk / benefit analysis rather than
rely on the ‘European-wide safety review’ mentioned in the scenario. A UKMI
respondent (a pharmacist with 6-10 years’ experience) emphasised the need to
follow up these reports to search for further cases; this was echoed by another UKMi
pharmacist.
A clear majority of respondents judged the new safety data to be level 5, despite it
consisting of spontaneous reports and an inconclusive, unpublished safety review.
4.4.1.8.i Overall observations on scenario responses
Most respondents preferred existing channels, such as the ‘Dear Doctor’ letter or
Drug Safety Update and to a lesser extent, a BNF ‘blue box’ warning for raising
awareness of serious safety issues among health care professionals.
There appeared to be a general reluctance to withdraw a product no matter how
serious the new ADR data were. This may have been due to the lack of regulators in
the sample who may have taken a different stance. Reluctance may have been due

182
to the assumption that in most scenarios, some patients derived benefit from the
product and that these patients might be deprived of a useful drug if the product was
withdrawn. Thus alternative risk management strategies were suggested.
Gray’s hierarchy was not used in a systematic way by respondents. Most appeared
to be applying their own rating schemes based on the severity of the safety reports
rather than their sources; i.e., they were using the scale in a discriminatory way, but
not necessarily one based on data quality, which was Gray’s original intention.
PEM studies were mentioned by several respondents as a means of generating
credible safety data. In several scenarios PEM studies were popular with an
appreciable majority of respondents when considering ways of raising the general
quality of the drug safety database.
4.4.2 Structured interviews
The two subjects who completed the web-based survey (INTs 5 & 9) were able to
confirm their written answers in the subsequent structured interviews, thus giving
some indication of the internal reliability of the survey.
All participants talked feely, openly and sometimes with passion about the selected
topics, providing comments and insights that enriched the views obtained from the
web-based survey.
With reference to Figure 4.2, three overarching metathemes were constructed, which
appeared to flow naturally one from the other. The first metatheme, ‘views on current
options for risk management’, appeared to have an important impact on metatheme
2, the perceived ‘quality of current decision making’. A final metatheme: ‘towards
better decision making’ flowed from the above metathemes; a number of important
themes and subthemes were related to the metathemes as shown in Figure 4.2.The
following key points emerged from the analysis of structured interview transcripts.
These points are accompanied by illustrative quotes from participants that are each
given a coded identifier (INT) related to the demographic detail in Appendix 3.

183
4.4.2.1 Views on current options for risk management (metatheme 1)
Six subjects (INTs 1,6,8,9,12 & 13, providing 23 comments) recognised the
requirement that the granting of an MA comes with an obligation on the manufacturer
to instigate a risk management plan (RMP), agreed with the regulator. In general,
this was a welcome addition to the regulatory approval process. INT1 stated that:
‘Drug safety is basically a composite of not just the risk versus benefit of the product
but the safety of the system which manages the risk of the product’. (INT1)
This was echoed by INT8:
‘...we are not just reacting to signals .....we are actually trying to get data that tell us
that the product is safe’ (INT8)
This subject went on to observe, citing Case 2 in the interview, that this was clearly
based on troglitazone, and that a RMP was not in place for that drug at the time;
because of this, movement to prevent further cases after initial reports was relatively
slow. Even at the time of interview, this subject was of the opinion that:
‘there needs to be much closer attention to the whole issue of quality management
and processes for managing risk.’ (INT1)
Making these systems known to patients might also hold benefit:
‘patients are quite willing to tolerate (the possibility of) quite a few ADRs if they feel
processes are in place to stop these ADRs causing them harm.’ (INT1)
Two subjects (INTs 1 & 13) were sceptical about the extent to which RMPs were
followed through after the authorisation agreement had been made. One subject
(INT13) cited evidence that this was not the case in the US with:
‘ the FDA asking for all sorts of risk management plans but never seeing whether
they were completed.’ (INT13)
One subject stated that the introduction of the RMP had:
‘changed the whole paradigm of pharmacovigilance’ and ‘provided better tools to
protect patients.’ (INT8)

184
The actual content of the RMPs was discussed by several respondents. These
aspects are reviewed in subsequent sections.
4.4.2.2 Expert committee review (2 subjects, 3 comments)
Expert committee review (e.g. by the CHMP) was a RMP recognised by one subject
(INT6). One subject (INT13) offered the following about expert committee review:
‘Experts are not infallible and groups of experts are even more difficult; because
there is some evidence that when you have a group of experts, they are more likely
to be “risk averse”. (INT13)
INT13 also expressed doubts about the importance of expert opinion, quoting the
work of Karsch et al. 179 who showed that:
‘clinical pharmacologists don’t even agree with themselves half the time.’INT13
Another study by Arimone et al.180 showed very poor agreement among five
pharmacovigilance experts asked to assess causality among 31 adverse event-drug
pairs, presented in case report format.
4.4.2.3 Conducting additional research (4 subject, 5 comments)
INTs 2,3,8 & 13 discussed the potential for gathering further information on specific
risks as part of the RMP. INT 2 thought that the RMP should be:
‘Whatever might be appropriate depending on the serious of the signal and the time
that you have.’ (INT 2)
PEM studies
Thirteen subjects provided 27 comments on the value of PEM studies as part of a
RMP. The timing of such studies was thought to be important, as a PEM study would
rely on adequate market penetration (INT1); while many PEM studies could take
between one and two years to complete (INT6), the potential was there for earlier
signal detection (INT1). Cost was also raised as a potential negative for this type of
study (INTs 3,4,9,10 & 11) that may even discourage a manufacturer from marketing
the product (INT9).

185
Conducting PEM studies as matter of routine for all new products was viewed
unfavourably because of the danger of:
‘over-bombarding prescribers with forms to fill.’ (INT5)
PEM studies would also be impractical for products used mainly in hospitals (INT6).
A more selective approach, with drugs where a real problem was anticipated was
recommended (INTs 2,8 & 11).
PEM studies were also popular with respondents to the web-based survey as a
means of improving drug safety evidence (see Table 4.12).
Other databases
The GPRD was cited by two subjects (INT6 & 13) as a potential alternative database
for research on new ADRs.
4.4.2.4 Labelling changes (4 subjects, 7 comments)
These were viewed by most subjects as an obvious risk management strategy.
One subject (INT9) felt that restricting the groups of patients receiving the drug by
judicious addition to the SPC of warnings, precautions and contraindications or
indication restrictions was a useful risk management strategy. However, comments
were guarded, depending on the proposed change. For example, INT9 did not agree
with changing doses as this might:
‘change the efficacy of the product.....you might end up with under-dosing.’ INT9
4.4.2.5 PIL changes (1 subject, 4 comments)
Again, this was seen as a potential risk management step, but if the risk needed fast
management and fast communication, updating the PIL – which needed MHRA
approval before incorporation into new stock, would be a rather slow method on its
own (INT9). One suggestion was, in the existing PIL, to refer the patient to a web site
where they could find the latest safety information on their product. The logistical and
legal implications of this suggestion would need careful thought.

186
4.4.2.6 Dear HCP letters (2 subjects, 2 comments)
A feeling expressed by these subjects was that such communications were effective
at raising HCP awareness about specific and important risks; although the
impression of one subject (INT9) was that they were not necessarily read by the
addressee and that better targeting, perhaps by clinical speciality, might provide
better awareness (INT12).
4.4.2.7 Drug Safety Updates (3 subjects, 4 comments)
A clear appreciation of these communications emerged from the comments made by
INTs 1,5 & 9. For one subject, the quality of the Updates and their availability on the
MHRA website had:
‘helped people and raised the awareness of what the issues are.’ (INT5)
This had also raised INT5’s and INT11’s overall opinion of the MHRA itself. A knock-
on effect was that:
‘notices in Drug Safety Updates’ clearly work; the regulatory communications are
hugely important because they are picked up by regulatory authorities around the
world.’ INT9
The drug safety update was cited by a large majority of respondents to the web-
based survey as a common reference source (see Table 4.10) and they ranked it
highly as a source of ADR evidence (Levels 2 or 3 - see Table 4.11).
4.4.2.8 Restriction in supply (5 subjects, 8 comments)
Restriction in supply was seen as the step before product withdrawal, when none of
the other RMPs had worked (INT1). Two respondents cited the example of
clozapine, where patients are placed on a registry and subject to specific monitoring
requirements (INT6). The possibility of restricting supply through selected
pharmacies, which could then monitor for side effects more effectively, was also
suggested (INT6). This was an option chosen by several subjects when asked to
suggest an RMP for Case 2. One flaw in the argument was raised by INT9:

187
‘if it’s a psychiatric drug (for example) that has a cardiac side effect, if you are going
to restrict the supply to psychiatrists, who don’t know anything about cardiology.....
would they be in the best position to pick up cardiac adverse effects?’ (INT9)
Restriction in supply to patients who gave consent to be treated with the drug having
signed a statement that they had been informed of potential side effects and had
undertaken to avoid a list of potentially interacting drugs or foods, in other words,
agreeing to certain restrictions, was suggested by one subject (INT3).
4.4.2.9 Phased release of new products (12 subjects, 20 comments)
There was considerable feedback on the proposal that phasing the release of a new
product might constitute an effective RMS. Phased release was attractive to some
(INTs 3,6,7,9 &11); however, some could not see the point as:
‘the development (i.e. pre-marketing) programme of a product should be targeted for
that patient group who are most likely to benefit.’ (INT1)
Some subjects (INTs 1,2,10,11 & 12) were concerned about the practicalities of
phased introduction. To restrict the licence might have little effect as:
‘as soon as a new drug is launched, doctors start using it in patients in whom it’s
contraindicated anyway; so just having a restriction on the licence won’t stop them
doing that I don’t think.’ (INT1)
There was a general feeling that to restrict to patients with mild disease might deny
the benefits to those with more serious disease who might also tolerate a greater risk
(INT1) or to those where other products had failed (INT10). One subject commented
that restriction would yield little further safety data beyond that already gained from
the pre-marketing RCTs (INT2).
Opposition from the manufacturer was also anticipated, due to perceived limitation of
product market penetration (INTs 4,5 & 11).
One subject suggested the concept of conditional licensing, quoting the example of
orphan drugs used to treat rare diseases, where:

188
‘we ought to be authorising earlier and.....make the authorisation conditional on
further trials; and if those further trails either aren’t done or if (the results) don’t look
good, it (the drug) will disappear.’ (INT8)
4.4.2.10 Views on the quality of current decision making (metatheme 2)
Some interesting views emerged when subjects were asked for their views on the
current decision-making processes used by firstly the MHRA and secondly, by the
pharmaceutical industry. These were the last questions in the interview schedule
(See Appendix 4) and subjects were particularly expansive in this area, both those
with insider experience of working for or with the MHRA (e.g. INTs 1,5,8 & 13) and
those who had more of an industry or hospital background (e.g. INTs 3,7,9 & 12). A
glance at Appendix 3 shows that some subjects had worked, or were working in both
areas.
4.4.2.11 Views on the MHRA (13 subjects, 36 comments)
Opinions on the appropriateness of recent safety decisions ranged from ‘about right’
(INTs 3,7,8,9,10,12 & 13) exemplified by:
‘having dealt with them on quite a few occasions, I think they are about right. I have
a lot of respect for them, I really do.’ (INT9)
And:
‘From what I have seen and what I have heard, it sounds like it’s something they do
take very seriously; they have a lot of expert opinion and committees that look at all
the evidence and weigh it up. I don’t think they take their decisions lightly’ (INT2)
One subject stated that:
‘I know for a fact that (drug safety) discussions are extremely in-depth.........I do think
there is a tendency to cautiousness, but I don’t really think that is a bad thing when
you are looking at public safety.’ (INT12)
Another subject (INT10) echoed this view:
‘I can understand that you will never be sued for withdrawing something; you
potentially could be for keeping something on the market that had a problem. So I

189
think they (the MHRA) have a hugely difficult job; but...... we have become a more
risk-averse culture generally and the MHRA is just a reflection of that. It’s not a
particular criticism of them. It’s just the way society is.’ (INT10)
INT 2 empathised with the dilemma the MHRA might sometimes face:
‘I suppose it’s a really difficult position isn’t it; on one hand they don’t want to jump
too early and deny people medication that might do them some good. I imagine that
once you’ve made that jump you can’t go back very easily; even if you suspend it
and you change your mind and go back. You’ve already put a seed of doubt into the
minds of doctors and patients and HCPs, so the use of that drug may then be
altered; which is a shame if there wasn’t anything to justify that in the first place.’
(INT2)
INT1 had an explanation why the MHRA might be seen to act too suddenly in some
cases:
‘I think part of the problem can be that the company doesn’t realise that the MHRA
hasn’t got confidence in their processes for managing risk; its not a product problem
it’s a system problem.’ (INT1)
This was developed by INT6:
‘Too quick: potentially lumiracoxib which was the first Cox 2 to have a risk
management plan in place............. that product was withdrawn, because of the
potential risk it had with the cardiovascular system and also the liver function. But it
hadn’t been out very long and it was decided that the risk- benefit profile wasn’t
satisfactory. But I still believe because they (the company) had a risk management
plan in place, they were very forward thinking. They never had the chance to show
that they were doing something........The MHRA, weren’t the drivers of the withdrawal
but they followed what everybody else was thinking so I think that was a shame.’
(INT6)

190
The issue of transparency was mentioned by several subjects:
‘It’s very difficult to judge whether at the moment any company or regulatory
authority has acted in a timely manner......... there has never been a public enquiry
into a drug safety crisis – unlike a train / plane crash or.....a refinery fire: you get a
public enquiry into the whole system; you don’t get this in drug safety.’ (INT1)
This subject went on to quote an example:
‘Vioxx (rofecoxib) is an excellent case – we will never now fully understand who did
what, the timelines around the decision making... we will never know. So as a result
the system never learnt how to improve itself.’ (INT1)
Rofecoxib was also mentioned in this context by INT6 who had the impression that:
‘They were a bit slow on rofecoxib because they were waiting for data....... I
understand why......but I think they could have done it differently in restricting its
exposure rather than withdrawing it.’ (INT6)
In contrast, this subject quoted the example of cisapride where:
‘there was clear evidence (but) that took 5 or 6 years from the time the signal was
generated to the time it was withdrawn.’ (INT6)
Potential bias in MHRA decision making was addressed by INT8:
‘OK, industry has to have their say and they’ve got their position and we are
regulating the industry; but I have never been aware that the specific interest of the
industry is a factor. I know some people are concerned that that’s the case. That’s
where transparency comes in; if we have more transparent processes then people
are more ready to accept that.’ (INT8)
Appreciable numbers of respondents from the web-based survey said they would
value the input from an independent safety study group as a means of improving the
quality of drug safety evidence. This, in effect is the main function of the
Pharmacovigilance Expert Advisory Group of the Commission on Human Medicines,
to which two of the interview subjects belonged (INTs 12 & 13).

191
As elsewhere in the interviews, there was praise for the way in which the MHRA
disseminated its decisions to health care professionals:
‘Good feedback....I think the MHRA are really good...I like their Drug Safety
Updates......feedback is important. The MHRA guidance is very helpful …it sort of
says.. you know…in the absence of good evidence, we think this is reasonable and
they keep it under review quite well; they don’t just do it once but also as the data
builds..... as they get more data. I think they do a really good job actually. It’s quite
balanced.’ (INT11)
INT5 was a more circumspect:
‘From my experience they (the MHRA) work in a very insular world in London and
they don’t always have a full appreciation of how things work in practice in the NHS.’
(INT5)
4.4.2.12 Views on the pharmaceutical industry (13 subjects, 33 comments)
Several subjects (INTs 2,5 & 7) expressed the view that the pharmaceutical industry
was too conservative and over-protective of their products when it came to making
drug safety decisions. Others thought that it was difficult to generalise (INT10). One
subject (INT1) observed that sometimes the industry might be over enthusiastic in
requesting labelling changes:
‘because they are afraid of getting sued and we commonly have the scenario where
a drug for example, is cautioned or contra-indicated on the basis of very limited
data.’ (INT4)
In contrast, INT12 stated:
‘I think they try to pull the wool over your eyes too frequently. I don’t think they are
explicit with some of their data; I’ve had so many difficult discussions with the
pharma industry that I have to go and read everything myself before I trust their
opinions’ (INT12)

192
Some (INTs 1,2,3,8 & 11) pointed to potential conflict between the various sections
within the company:
I’m sure they have big arguments in the company where the marketeers are saying
“look, just ignore that” and then the medical information and regulatory people saying
“We can’t, we have got a duty”.’ (INT11) and:
‘At the end of the day they are in business, they are trying to make money; they’ve
got to balance that against whatever they are doing. Because whatever decisions
are being made about their drug affects everything; it affects their stock price, their
employees and their jobs and everything, so of course that must have influence on
what they do.’ (INT2) and:
‘You’ve got a lot of issues in the pharmaceutical company: the balance between
being ultra safe and ultra cautious and the awareness that the pharmaceutical
company needs to make money to pay its shareholders and pay for research to
develop new drugs. So I think there is always a dilemma with the pharmaceutical
companies........working within several companies within pharmacovigilance, I would
say they all take it very seriously with regards to patient safety; but I think in the
wider company, the issues are slightly fudged by conflicting priorities.’ (INT3) and
finally:
‘because their profits depend on selling drugs and they can’t easily sell drugs if the
products cause harm. So it may be that some companies who are a little bit slow to
realise the dangers posed by their products.’ (INT13)
This sub-theme could be summarised by the comments of INT8:
‘At the moment it is relatively difficult for a pharmaceutical company to get an
authorisation and it’s relatively difficult for the regulatory authority to take it away
once they’ve given it – that’s the balance in the system.’ (INT8)
and with respect to the pharmaceutical industry:

193
‘I don’t think they are too conservative; I mean the pharmaceutical industry is driven
by money and it’s like any other industry. We are going to have this broad kind of
capitalist society. We must recognise that in terms of innovation that model works
well and what we want is innovation; we need to control it to make sure it’s safe and
that it’s worthwhile....... What we need are people that are independent and balanced
to make the critical judgement.’ (INT8)
Several subjects remarked on recent improvements in the way the industry
approached ADR signals, for example:
‘So overall, I think they are probably about right and they are much better than they
were; they are pretty open because they know that their reputation depends on it
because if it then comes out that they weren’t open, they are going to get sued; they
get completely pulled apart in the media.’ (INT11)
Two subjects (INTs 2 & 9) highlighted the strict legislation surrounding
pharamcovigilance data gathering and reporting by the pharmaceutical industry as
being an effective check on malpractice for example:
‘Within my knowledge of the companies that I’ve dealt with, especially in
pharmacovigilance departments, they do what they are told. I just don’t see that
(malpractice) happening and I never have had. I just think the regulations are too
tight.’ (INT9)
4.4.2.13 Signal detection
The author was interested to hear the perceptions of subjects on what a safety signal
actually was. Opinions reflected an input into metathemes 2 and 3 (see Figure 4.2).
In the event, all 13 subjects (22 comments) gave similar definitions. Typically, a
signal was:
‘an adverse event for which the observed frequency is more than expected from the
background information......a potential risk that still needs to be confirmed.’ (INT6)

194
Furthermore, a signal was:
‘a hint that there is a problem to investigate’ (INT13) and ‘essentially a starting point
for a process of risk management.’ (INT8)
One interviewee went on to say:
‘it’s not a question of the signal in its own right, but it’s a question of the risk it might
pose and what harm can be caused to the patient.’ (INT1)
Just one subject was prepared to quantify a signal as:
‘3 or more cases in 10,000 patients on the drug.’ (INT2)
Another subject observed that in signal detection:
‘you need an element of maths and an element of clinical judgement to come
together to tell you that something might be real and needs investigating.’ (INT8)
There was some overlap between views on signal detection and comments on the
two cases presented in the interview, all of which had a bearing on the current
quality of decision making.
4.4.2.14 Case 1 (hiccups: Scenario 1 from the web-based questionnaire)
Action to be taken (13 subjects, 22 comments)
Most respondents expressed a need for further information before they made a
decision on what action to take in the light of this ’signal’; in particular the severity of
the hiccups. Three subjects stated that product labelling should be amended if the
cases were found to be severe and disabling (INTs 1,5 & 6).Whereas the majority
(INTs 4,6,7,8,9,11,12 & 13) indicated that, on the basis of the evidence presented,
nothing should be done until further reports are received; two said they would update
the product information (INTs 3 & 10). These results broadly reflect the responses to
this scenario given in the web-based questionnaire, although here, a greater
proportion said they would take some action. The modest difference may reflect the
greater regulatory experience of the interviewees.

195
Level of evidence (13 subjects,13 comments)
As with the on-line survey, the majority of subjects ranked the evidence presented as
level 4 (INTs 1,2,3,6,9,11,12 & 13), with one saying that it was none of the options
presented. Interestingly, the remaining respondents (INTs 5,7,8 &10) rated the
evidence as level 5. One subject explained this choice:
‘it’s nearest to 5. Case reports are clinical experience; there’s some clinical
experience here’ (INT 8).
In the web-based survey, clear majorities described the evidence as level 5.
4.4.2.15 Case 2 (hepatotoxicity: Scenario 6 from the web-based questionnaire)
Action to be taken (10 subjects, 28 comments)
Three subjects (INTs 1,8 & 13) recognised the scenario as being close to the real-life
example of troglitazone. In general, subjects expressed the opinion that the
information represented a far more serious signal than Case 1. As one subject put it:
‘Essentially a large number of cases have been associated with a new drug whose
safety is not yet established. There is a very strong probability – enough to take
strong action’ (INT8).
Consequently, the recommended steps taken as a result of the new information were
more extensive than for Case 1. One subject (INT5) recommended complete
withdrawal, while four others (INTs 6,8,12 & 13) recommended suspension pending
gathering more information on the problem. Sources recommended for this included
a PEM study (INTs 6 & 8) and the GPRD database (INT8); a further subject
recommended a deeper analysis of the cases presented to see if doses and
indications were the same as in the UK or if any ethnic factors were involved (INT9).
Another (INT1) wanted to review other safety data to see if hepatic ADRs were the
only risk, or if there were other ADRs to worry about. In the main, those who
indicated that the drug should remain on the market, said the product information
should be amended (INTs 1,3,9,10 & 12), there should be a blue box warning in the
BNF (INT9), that the reaction should be included in the next drug safety update
(INTs 1,3 & 9) and that a dear doctor letter should be sent (INTs 1,3 & 12).

196
In the web-based survey, which contained far fewer respondents with regulatory
experience, approximately one fifth (22%) recommend product withdrawal and two
fifths (41%) said the product should be suspended pending further data analysis (see
Table 4.18).
Two respondents mentioned restricting indications for the drug (INTs 10 &11);
however INT 11 was circumspect, stating:
‘I have never seen the advantage of restricting to specialist use.....you could say it
should not be given to anyone with any form of liver dysfunction; the trouble is, the
evidence does not tell you whether these people were more at risk’ (INT11)
Several subjects mentioned the possibility of further investigations as part of a RMP
(4 subjects, 8 comments). One subject stressed that after a more thorough analysis
of cases, it might be possible to:
‘inform health care professionals, not only of this serious and important ADR, but
also the features you want reported about these cases’ (INT1).
Four subjects (8 comments, INTs 1,6,8 &13) identified the need for a RMP for such a
product, three of whom expressed surprise that there was not one already in place in
the scenario; there was not one in place with troglitazone, on which the scenario was
based.
Level of evidence (13 subjects, 16 comments)
There was diversity in opinions on how the evidence sat within Gray’s hierarchy. Two
subjects (INTs 1 & 13) suggested that as the scenario gave an idea of incidence in
addition to simply the number of case reports, the evidence lay between 3 and 4 on
the scale. INTs 2,3,5,6,11& 12 stated that the evidence was simply case reports and
should rank at 4; while others (INTs 4,7,8 & 10) rated it as level 5. So did the
majority of respondents in the web-based survey; although here too there was some
variation. INT5, when comparing Case 2 with Case 1 stated:
‘the category of evidence is the same, it’s just that we’ve got vastly stronger
evidence of a problem and the problem is much more serious.’ (INT5)

197
One subject, as with Case 1, rated the evidence lower than 5 because detail was
lacking. Another subject (INT3) stated that:
‘I guess it’s going to be 4 again,...it doesn’t really fit within the framework that Gray’s
hierarchy was designed to fill. So we are using the wrong tool here.’ (INT3)
4.4.2.16 Appropriateness of Gray’s hierarchy of evidence to rate ADR data
Leading on from the above, respondents expressed a range of opinions on the
suitability of the hierarchy to assess adverse event data (13 subjects, 32 comments).
These comments reflected a general uncertainty in its use in this context. Just one
subject (INT7) thought the hierarchy was satisfactory. The remainder expressed
concern, above all with the practicalities of using it. The feeling was best
summarised by INT13:
‘ADRs are not like therapeutic effects; even if they are rare they may be important.
That is not to say that one should regard the demonstration of adverse effects as
being less scientific.... but applying the hierarchy to adverse effects is difficult.’
(INT13)
Two subjects indicated that the hierarchy might have an additional level 6:
‘...that is called something like ‘spontaneous’, because when you fill in the yellow
card you are filling it in when not being 100% certain that the drug is responsible.....
an opinion can only come bottom’ (INT4) and:
‘It’s the observation of a single person at a point in time’ (INT10).
Several subjects pointed out that in terms of decision making, while it was important
to have the highest level of evidence possible, in the post-marketing arena, this was
unlikely to be level 1,2 or 3 data. INT1 stated:
‘you might have two or three (already completed) RCTs and yet if you’ve thousands
of spontaneous reports of problems, it doesn’t matter what the RCTs show, the
spontaneous reports will drive regulatory action.... no one would like to discourage
further research and analysis to strengthen the signal but you DO NOT
(emphasised) wait for this evidence to arrive before you start risk management.... It
actually could cause harm.’ (INT1)

198
Taking the argument further, INT1 stated:
‘... there’s this myth in the pharmaceutical industry that spontaneous reports are of
low scientific value and of course that can be a self-fulfilling prophecy. If that attitude
pervades or contaminates the entire process, then the quality of cases will be bad;
so that attitude should be eradicated.’ (INT1)
This was supported by INT8:
‘... there are people, you know, the so-called evidence-based school, the real hard-
line practitioners (who say) “how could you possibly make any sort of decision on
observational data or anything that isn’t randomised?” ...That sort of thing is unreal in
the world in which we live; particularly in the world of drug safety.’ (INT8)
Two subjects observed that with safety data, it might be impossible to get higher
level data before having to make a decision. INT2 stated:
‘you can’t always do RCTs to look at those (safety) aspects of the drug, so
unfortunately it means that the ....... evidence from a PEM study will be taken as less
credible than an RCT; when actually, in those situations, you couldn’t have an
RCT.....I think if you just go by the hierarchy you are missing the bigger picture of
what evidence can help you and what might not help you.’
INT8 concurred:
‘as a regulator, you have to look at what evidence you’ve got and what evidence you
might be able to get and when you will be able to get it – that sort of thing. Then, you
have to make a judgement based on the evidence that you’ve got...... there is a
factor called the ‘precautionary principle’ which I think is very relevant to regulation
and I think most regulators accept it, whether explicitly or not; in this context it would
mean you don’t have to be certain of cause and effect to take some
action....conceivably dramatic action.’
The unease about Gray’s hierarchy expressed by interview subjects was reflected in
the responses to the web-based survey. A clear majority of respondents were at
best, only partially satisfied with its use to rank the quality of safety data (see Table
4.10). Indeed, when asked to rate information provided in the seven scenarios,

199
Gray’s hierarchy was not used in a systematic way by respondents. Most appeared
to be applying their own rating schemes based on the severity of the safety reports
rather than their sources; i.e., they were using the scale in a discriminatory way, but
not necessarily one based on data quality, which was Gray’s original intention.141
4.4.2.17 Suggested changes to Gray’s hierarchy
Six subjects (11 comments) suggested changes to the hierarchy that might make it
more applicable to ranking the importance of ADR data.
One respondent (INT4) suggested putting case reports at the very bottom of the
hierarchy, as category 6 as:
‘spontaneous case reports from individuals without certainty or causality.’
Most comments reflected the need to move the ADR case report up the hierarchy.
One subject (INT2) thought that it trivialised case reports or case series and by doing
so, important signals might be missed. Other respondents expressed the opinion that
while the existing hierarchy put meta-analyses near the top, it was possible to obtain
poor quality examples (INT6) and that this type of data might not be available for
new drugs (INT12). INT12 also stated:
‘I think it’s (the hierarchy) very prescriptive……. you can’t underestimate the case
report, once you take out the (potential) bias and personal opinion.’ (INT12)
INT8 said:
‘I’m also open to the suggestion that…..we don’t put things on top of each other
vertically; it’s a horizontal thing. Different bits of evidence will be useful in different
ways and I think it’s very hard to argue against that.’
This aspect is discussed further in Chapter 5.
4.4.2.18Towards better decision making (metatheme 3)
Several themes emerged from the interviews relating to how current decisions could
be improved; these are shown in Figure 4.2. Many of these focussed on providing
more, or better quality, case reports; others focussed on ADR prevention.

200
4.4.2.19 Education (6 subjects, 21 comments)
INT1 asserted that:
‘there’s no evidence that increasing the overall number of ADR reports actually
improves safety; the critical factor is improving the quality of the individual case
report…..I think the first thing is to improve the training and awareness of people in
the front line who are most likely to pick up ADRs.’
Five subjects (INTs 1,5,8,9 & 10) suggested that better reporting might stem from
better education of potential reporters. Firstly through incorporating ADR education
into undergraduate and post-graduate training and continuing professional
development, perhaps in the form of simulation exercises, in the same way that other
skills, such as surgery are taught (INT1); or as part of GP training days where case
studies could be presented (INT2). A second suggestion from INT2 was the
development of medical educational safety checklists for carers to follow, when
administering drugs with complicated dose instructions or where subsequent patient
monitoring was required. INT1 stated:
‘there’s a lot going on in the world of simulation that could be adapted by the
pharmaceutical sector and hasn’t been….we haven’t really started it I don’t think.’
INT8 summarised the general sentiments here:
‘A lot of people don’t report because they have no idea there’s a scheme there and
what it’s for and what it’s about. It’s about getting people like medical students, newly
qualified doctors… and also there’s a cohort of people who have gone through the
system and are much further on in their careers who still don’t know.’ (INT8)
And:
’You need to take the initiatives to encourage and promote reporting and to educate
people about how to do it and what its benefits are; I do think those are important.’
(INT8)
INT11 thought that:

201
‘you’ve got to get it into pharmacist and medical education haven’t you? You’ve got
to get the hearts and minds early, so doctors, pharmacists and nurses have really
got to understand that this is actually a really important intelligence gathering
system.’
Better promotion of the black triangle scheme was mentioned by two subjects (INTs
2 & 7). One innovative suggestion was to include the black triangle on all external
product packaging and pharmacy labelling software to act as a prompt at the point of
dispensing (INT10). INT13 thought that automatic reminders embedded in electronic
prescribing systems were much more effective than black triangles in the BNF.
INT11 thought that emphasis on ADR reporting as a ‘professional and ethical
requirement’ during training and by regulatory bodies such as the General Medical
and Pharmaceutical Councils might provide dividends:
‘Everyone should be thinking….”I don’t have an option here really, this is something
that I should be obliged to do”. (INT11)
In terms of improving report gathering, INT1 agreed that raising the awareness of
front-line carers was important. Secondly, training of pharmacovigilance contacts
was also important:
‘…I think improving the training of those who are in first contact with the reporters…
to improve the quality of that interaction. The person receiving that call should collect
as much information as possible. So training is very important. So I think that will
improve not only the quality of the ADR reporting but also the number, as more will
be picked up.’ (INT1)
Summarising, the main components of this theme were education and promotion.
This was closely linked to facilitating more reporting.
4.4.2.20 Facilitating ADR reporting
The main subthemes identified here were as follows.
4.4.2.21 Mandatory reporting (13 subjects, 26 comments)
Several subjects (INTs1,3,6,7 & 12), saw the theoretical benefits – for example:

202
‘facilitating the implementation of a pharmacovigilance system by giving it a legal
basis.’ (INT1)
In general however, views on mandatory reporting were largely negative; for
example INT1 went on to state that that:
‘ we know full-well that making ADR reporting mandatory does not improve the rate
of spontaneous reporting.’ (INT1)
INT 5 commented:
‘It wouldn’t work… there is mandatory reporting in some countries but they don’t get
a better response or a better pharmacovigilance system than we have in the UK.’
INT8 agreed:
‘…I know there are some countries like France and Sweden who are not too far
away from having this requirement…..You can look at the reporting rates in broad
terms per head of population and see that they are not dramatically different from
here or other countries that don’t have mandatory reporting’.
Problems were also seen with enforcement, exemplified by the following statements:
‘It’s not practical; because how would you tell if someone hasn’t done it and how will
you enforce them to do it?’ (INT4).
‘There’s a problem….if you make it compulsory, then you are likely to have
everything reported. If there’s severe punishment in some way, then you are going to
end up with people reporting absolutely everything to cover themselves… and you
are going to end up drowning your important signals with lots of other things’. (INT2)
Lastly, INT13 stated:
‘well, the first difficulty would be defining what you meant by an ADR; and the second
would be compelling people to do it. So it’s not practical on either ground.’ (INT13)
4.4.2.22 Paying the reporter (4 subjects, 8 comments)
INT2 thought that:

203
‘if you incentivise it, you will end up with lots of not very useful reports’. (INT2)
With reference to GP reporting, INT8 stated:
‘GPs in this country are pretty much fee for service people. They get paid for what
they do something (for free) and well, what do you expect?’ (INT8)
This view was echoed by that of INT4:
‘The bottom line is that most of the reporting is done by doctors and doctors don’t do
things unless they are paid’ adding: ‘that is fraught with difficulties because as soon
as you start paying people, if you don’t pay them enough they won’t do it and if you
pay them too much, they will start making data up….so I wouldn’t pay them.’ (INT4)
INT6 stated:
‘there is a massive amount of information required to complete the (yellow)
card……its workload – it’s not just incentive. So if the workload balance could be
changed so that the first report is really simple (even if unpaid), people might do that
and then choose to follow up with more detail’ (INT6)
INT6 could see why reporters might expect payment:
‘because follow-up reporting can take half an hour or an hour of your time…..I have
had a request from a pharmaceutical company which was a centimetre thick….it
goes on the floor; I don’t have time to go through all of the requirements.’ (INT6)
This subject surmised that the follow-up might be paid and that funding for this
should come from the DOH, which could in turn be recouped from the manufacturer
in the form of licensing fees.
On a similar theme, one subject (INT12) stated that where she worked, a bottle of
champagne was awarded to the health care team member who had completed the
most yellow cards in the previous month.
4.4.2.23 Patient reporting (5 subjects, 9 comments)
Subjects demonstrated a general awareness that patients could submit spontaneous
ADR reports; however, most were sceptical about the quality and therefore

204
usefulness, of such reports. INT10 thought that one was more likely to get subjective
symptom reports rather than objective data in a patient report and that the best
report involved collaboration between the patient and their carers; although INT8
considered that a report direct from the patient might indicate that it was real and
important; however this was qualified with:
‘ …to my mind, we have introduced patient reporting a little too quickly for political
reasons, hoping that it can’t be worse and I hope it doesn’t damage the scheme. I
don’t accept on faith that it won’t…… I think it’s possible that health care
professionals will get less likely to report; we could see over time a transfer of the
evidence base to (reports) coming from patients. It is hard to see that that is going to
be progress.’ (INT10)
INT9 too was concerned about the quality of patient reports:
‘it’s not going to give you all the information you normally anticipate to get from the
medics because they don’t know what they are supposed to be telling you.’ (INT9)
One subject (INT12) suggested putting a yellow card in the PIL accompanying each
product.
4.4.2.24 Simplifying reporting
Several subjects indicated that a simplification of the spontaneous reporting process
might encourage better quality reporting. The current on-line facility for completion of
yellow cards was viewed favourably (INT6), but requests for further information by
text messaging was also suggested. INT8 agreed:
‘If you want someone to do something you make it as easy as possible....if they can
do it in 2 minutes, they will probably do it; if it’s going to take them 10, you’ve got no
chance.’ (INT8)
INT12 stated:
‘I think one of the things that people don’t like is the tedious method of filling in forms,
...the tediousness of it all; if we could make it easier, I think it would help a lot.’
(INT12)

205
INT13 suggested that ADR reporting might in future be incorporated into electronic
prescribing software or the GPRD. INT4 alluded to unpublished research on a new
scheme that would allow MI pharmacists, who often have extensive access to drug
information at all levels, to complete yellow cards electronically using a bespoke
system for UK pharmacists called MI Databank.
4.4.2.25 Providing feedback to reporters
INT8 was clear that everyone in PV should promote what they do, so that potential
reporters are aware, understand the process and buy into it. Furthermore, giving
effective feedback to reporters was a way of educating them and encouraging them
to report:
‘you don’t just receive reports, you have to go back and acknowledge receipt, tell
people what is going on and complete the loop. People who report… many of them
want to know what is going on: “I’ve seen this case, have other people seen this
case and it is real?”….there needs to be an interactive process.’ (INT8)
INT10 suggested that any subsequent correspondence to the reporter might usefully
contain information on other reports of a similar nature that had been reported by
other people so that:
‘You kind of know that it (the report) is going into the big picture and that you are
making a difference.’ (INT10)
In this context, several subjects praised the MHRA Drug Safety Update (INTs 1,5 &
11). This publication was commonly cited as being used by respondents to the online
survey (see Table 4.8) and was ranked highly by UKMI pharmacists (see Table
4.11).
4.4.2.26 Conducting further research
One subject stated:
’I think we do need stronger post-marketing regulation, mainly around the area of
getting people to study their medicines properly post-marketing.’ (INT8)

206
The contribution of further research to improving better decision making is discussed
in Chapter 5.
4.5 Conclusions
The following conclusions can be drawn from the research reported in Chapter 4.
1. The opinions of wide a variety of professionals working with
pharmacovigilance data were obtained, including those working in the
pharmaceutical industry, the NHS and for the UK regulatory authority.
2. The medical and pharmaceutical professions were well-represented in the
respondents to the web-based survey and the structured interviews.
Biomedical and information scientists from a range of backgrounds were also
included in the web-based replies.
3. The relevant experience of respondents was mixed, both in terms of length of
time, but also practice context. Some were practitioners with direct care for
patients; others had trained as such but were now working full-time on
pharmacovigilance-related issues, either with the regulator or a
pharmaceutical company. Others had, in additional to pharmacovigilance, a
range of related regulatory functions such as clinical trial or marketing
authorisation responsibilities. This was reflected in the richness of opinions
offered.
4. A wide range of safety data sources were used by respondents to the web-
based survey. Yellow card data, yellow card reports and product SPCs were
commonly used by all groups, but industry-based individuals (e.g. PIPA and
TOPRA members) cited the PSUR more frequently.
5. The majority of respondents to the web-based survey said that safeguarding
public health was of utmost importance when making a decision whether or
not withdraw a product; although a majority of PIPA members cited the good
standing of the company as being of major importance. These two stances
are not mutually exclusive.

207
6. Suggested actions to the scenarios presented in the web-based questionnaire
and the structured interviews were heterogeneous, but in general,
proportional to the perceived severity of the ADR data presented. Most
respondents preferred existing channels, such as the ‘Dear Doctor’ letter or
Drug Safety Update and to a lesser extent, a BNF ‘blue box’ warning for
raising awareness of ‘serious’ safety issues among health care professionals.
7. There was a general reluctance among participants in the web-based survey
and the structured interviews, which contained more regulator representation,
to withdraw a product no matter how serious the new ADR data were (e.g.
Scenarios 2, 3, 5 & 6). A willingness to adopt a stance of watchful waiting and
suggest alternative risk management strategies was noted, even with
Scenario 6 (Case 2 in the structured interview), which was closely based on
troglitazone – a drug which was withdrawn on the basis of such data.
8. Few participants were satisfied with the use of Gray’s hierarchy to rank safety
data and it was clear that this was not used in a systematic way (e.g.
responses to Scenarios 2-6). Most appeared to be applying their own rating
schemes based on the severity of the safety reports rather than their sources;
i.e., they were using the scale in a discriminatory way, but not necessarily one
based on data quality, which was Gray’s original intention. Another illustration
of this was in Scenario1, which consisted of yellow card reports; the majority
of respondents in the web-based survey ranked this as level 5 (see Table
4.13), yet most respondents ranked yellow card reports as level 3 or 4 in a
previous question (see Table 4.11). Several subjects pointed out that in terms
of decision making, while it was important to have the highest level of
evidence possible, in the post-marketing arena, this was unlikely to be level
1,2 or 3 data. The need for an evidence hierarchy in drug safety decision
making is discussed in Chapter 5.
9. PEM studies were cited by the majority of respondents as a means of
generating credible safety data and raising the general quality of the drug
safety database (see Table 4,12); they were also favoured by at least 20% of
respondents as a means of investigating product safety further in Scenarios

208
3,5 & 7. PEM studies as a way of gathering further information on specific
risks, were also seen as an important part of a RMP, dependent on timing to
allow adequate market penetration (see 10 below). While they might take one
and two years to complete, they offered the potential for early signal detection
using a proven methodology. Doubts were raised about cost and their routine
use for all new products was viewed as unfeasible (e.g. for drugs used
exclusively in secondary care). The GPRD was cited by several subjects as a
potential alternative to the yellow card system and PEM.
10. Responses from the structured interviews gave an insight into how the current
system of decision making operated and how it might be improved. The
formulation of a RMP for new products where a problem might be anticipated
as a condition of licensing was favoured. It was also proposed that the
existence of the plan be publicised to patients and providers of the product by
way of reassurance. Once RMPs were in place, it was important that they
were enforced; quality management of such systems was viewed as an
integral component of drug safety.
11. Some respondents cited the example of clozapine as a successful RMP. An
interesting extension of this was to restrict supply of a new drug to selected
pharmacies, which could then monitor the patient for compliance, give
targeted counselling and monitor for the development of side effects. One flaw
might be that restriction to a specialism might mean that side effects outside
the experience of the specialism might go unnoticed.
12. The concept of phased release was discussed by all subjects in the structured
interviews. There was a general feeling that restricting the scope of
prescribing through licensing to a narrower spectrum of recipients than the
evidence suggested could receive the drug might deny the benefits
unnecessarily to those who might tolerate increased side effects; for example
in those with more serious disease where other products had failed. In
addition, restriction would yield little additional safety data beyond that already
gained from the pre-marketing RCTs. Opposition from the manufacturer was
also anticipated, due to perceived limitation of product market penetration.

209
13. Drug Safety Updates (which replaced the ‘Current Problems’ publication from
the MHRA in August 2007) were highly thought of by respondents to the web-
based survey and subjects in the structured interviews. They appeared to be
more popular than dear HCP letters and because they were web-based,
ought to be accessible (and read) by a wider audience.
14. A general view held by almost all subjects in the structured interviews was
that the MHRA had recently made mostly appropriate safety decisions about
changing the status of drugs on safety grounds. Past examples (cisapride,
lumiracoxib, rofecoxib) were quoted as demonstrating some tardiness; but
overall, subjects recognised the complexity of the regulator’s task and the way
in which it was managed, including the use of the Pharmacovigilance Expert
Advisory Group . One subject called for greater transparency in the decision
making process. It would have assisted the author’s research to be able to
access the minutes of meetings where decisions on labelling changes were
made and cited the evidence for their basis.
15. Views on the pharmaceutical industry were more polarised. Some subjects
thought the industry was over-protective of its products in the light of
emerging safety data, but that while it was difficult to generalise, it had
improved its behaviour compared to a few years ago. This may be due to
increased awareness of the damage excessive patient exposure to a
dangerous product might do to the company reputation, but also the improved
legal systems in place governing ADR monitoring and reporting. Some
subjects related experiences of conflict between the marketing and regulatory
functions and that it was a question of achieving a balance between
profitability and product safety; but that the latter outweighed the former.
16. The structured interviews provided some useful insights into how yellow card
ADR reporting, which was acknowledged to be low, could be improved.
Practical suggestions to increase reporting and improve the quality of reports
included the following:
i) Education of potential reporters and those receiving the reports (‘first
contacts’) was important. A need was identified at undergraduate and post-

210
graduate levels across the eligible professions, with emphasis on the fact that
ADR reporting was a professional and ethical requirement. Promotion of the
black triangle scheme was also required.
ii) The provision of an on-line facility for ADR reporting was welcomed,
but the complexity and time-consuming nature of the follow-up information
gathering process was criticised. Simplification of this process, with an on-line
mechanism, perhaps through the GPRD, was a strong suggestion.
iii) Provision of feedback informing individual reporters of other similar
reports that had been made and the relevant known safety profile of the drug
was seen as a positive move. This would keep the reporter involved and
contribute to their education. In this context, the Drug Safety Updates were
welcomed.
iv) Patient reporting was viewed with some scepticism; however, it was
acknowledged that collaboration with the patient’s health care provider might
provide both subjective and objective data, thus enhancing the report.
17. Suggestions that ADR reporting should be mandatory or that reporters
should be paid for their reports were not well received by subjects in the
structured interviews.

CHAPTER 5: OVERAL DISCUSSION
5.1 Overview
Phase 1 of this research undertook a survey of all UK products where changes to
labelling had been made on the basis of safety grounds over a ten-year period.
The information was not easy to retrieve in a systematic way due to the
unwillingness of product manufacturers to participate, for a variety of reasons; thus
the research was limited to that information available in the public domain. As
expected, the two main change categories were drug interactions and side effect
warnings, both of which would be expected to expand as the drug is used in the real
world, post-marketing and new reactions and interactions come to light. The
observation that new Type B reactions emerged at three times the rate of Type A
reactions confirms the notion that Type B reactions are more likely to be found post-
authorisation. The emergence of new drug interaction notices was influenced by the
licensing of new chemical entities and therefore new drug interactions which would
not have been found prior to marketing. Overall, the four most commonly affected
therapeutic classes were CNS, anti-infectives, cardiovascular and cancer
chemotherapy. Reasons for this are discussed in Chapter 2.
While safety notices advising contraindications were commonly found in liver
disease, pregnancy and lactation, little additional evidence or justification was
provided, probably because no such evidence had been gathered, prior to the
emergence of some catastrophic effect, such as liver failure or major birth defects.
This is understandable; such evidence would not be collected systematically prior to
marketing and as found in this study, would rely on case reports in the post-
marketing period. Advice on how to adjust drug dosage in hepatic impairment is
notoriously fragmented, due to the variation in nature and extent of hepatic disease;
in such cases it is not surprising that medical advisors find it easier to recommend
non-exposure rather than dose adjustment. In contrast drug handling by the kidney is
more straightforward and the author found more helpful advice on dose adjustment
at different stages of renal impairment. Thus it would seem that hepatic impairment
represents an area where more research could be focussed on generating data on
which helpful advice might be based.
211

A decision to issue a notice often appeared to result from a risk – benefit analysis;
for example, in the pregnancy, cardiovascular, anti-infectives, and anaesthesia areas
where cautious use was advised, despite potential harm, and where the benefits of
continuing with therapy were judged to outweigh the risk of discontinuation.
There were few trends in the incidence of different types of notices over the ten-year
study period; although it is quite plausible that a landmark trial analysis or case
report series might lead to blanket safety labelling changes to a whole class of drugs.
This was observed in this study for the endocrine category where increased safety
concerns about cardiovascular events and possible cancers associated with oral
contraceptive and hormone replacement products, prompted ‘blanket’ warnings
covering many products.
Chapter 3 describes Phase 2 of the research, where the more serious labelling
changes and product withdrawals were examined in greater depth. This revealed
that a newly-marketed product had a 2.2% ten-year probability of being withdrawn
and a 13.8% probability of having at least one major safety notice added to its
labelling. Study of the impact of such actions on the subsequent use of the product
was outside the scope of this research but would be of immense interest (see
suggestions for future research).
Many of the products which were subject to major labelling changes or withdrawal
had been on the market for several years; so product longevity is not necessarily a
guarantor of drug safety.
There was wide variation in the quality and type of data on which the decisions were
reported to be based. For example, in the case of product withdrawals, the most
common data source used was spontaneous reports from the UK yellow card
system. Higher levels of safety data were rarely cited. Prescription event monitoring
as a source of safety data was very rarely used in such safety decisions; yet a
majority of participants in Phase 3 thought that more use should be made of this.
Only one fifth of safety notices warranting a ‘Dear Healthcare Professional’ letter and
/ or a monograph in ‘Current Problems in Pharmacovigilance’, were accompanied by
212

a blue box warning in the relevant BNF, representing an important inconsistency in
informing prescribers.
Chapter 4 reported the results of Phase 3 of the research where the views of current
users of PV data on its availability and quality, were gathered.
One hundred and fifty respondents replied to the web-based questionnaire and 73
completed it fully. The demographics and detailed responses are discussed in
Chapter 4. The detailed responses from individuals in the structured interviews (13 in
total, two of whom had previously completed the web-based survey) are also
included in Chapter 4. Chapter 4 provides contemporary views on PV procedures,
and Figure 4.2 shows how these views were found to be inter-related.
The views of healthcare professionals, with or without regulatory experience,
revealed several strong themes.
Most agreed that the main aim of PV was to safeguard public health and that this
aim should be the overriding consideration when making labelling change or
withdrawal decisions on the basis of new ADR data.
Phase 2 (Chapter 3) of the research showed the variation in quality, quantity and
sources of ADR data used to make safety decisions. It is difficult to see how this will
change; although some suggestions for improving data quality and data capture
were obtained from Phase 3 (Chapter 4). Here, most appeared to agree that
labelling changes should be made only on the best evidence available at the time
and were enthusiastic about adopting appropriate risk management strategies, not
only when a safety signal arose post-marketing, but when a drug was first granted a
marketing authorisation. There was general consensus that what constituted ‘best
evidence’ could not be rated adequately using traditional hierarchies, such as Gray’s,
and that good ADR reports from those trained in reporting and then assessed by
trained staff, often constituted the best evidence. An alternative way of assessing
ADR evidence is discussed in Section 5.2 below. Evidence from PEM studies and
the GPRD might also be of high quality; for example, the GPRD has been used
successfully to identify an association between SSRIs and suicidal behaviour in
213

children and adolescents;181 but the use of both systems has limitations for routine
use.
Better education of both reporters and those receiving reports was a strong theme.
Very few of the research participants had any formal PV training. Although
comments referred mostly to healthcare professionals and the regulator, education
of pharmaceutical company personnel in a PV role could be included here.
Emphasising the fact that ADR reporting was a professional and ethical requirement
was recommended. Cox and Davies182 recently called for fundamental changes to
the way pharmacists approach PV, with strengthening of training at both
undergraduate and postgraduate levels and the incorporation of ADR reporting into
routine professional practice. Waller and Evans183 observed that PV requires a
stronger academic base and increased availability of basic training.
Pirmohamed et al.125 and others184 observed that most ADRs resulting in hospital
admissions are well-known effects of relatively old drugs and could well have been
avoided if patients and providers were better trained; once again emphasising the
potential for education to form part of a RMP.
Continuing with the education theme, it was shown in Phase 2 of this research that
only one fifth of safety notices for relatively serious changes to labelling appeared in
a ‘Dear Healthcare Professional’ letter and / or a monograph in ‘Current Problems in
Pharmacovigilance’. It is noteworthy that today’s version of the ‘Current Problems’ -
the Drug Safety Update - was cited by a large majority of respondents to the web-
based survey as a commonly used reference source (see Table 4.10) and they
ranked it highly as a source of ADR evidence (see Table 4.11). Care should be taken
by the MHRA to ensure that the Drug Safety Updates are as complete as possible
and publicised to as many health care professionals as possible, as they are clearly
used as an important source of ADR information. The on-line publication could also
be developed as an educational tool for those wishing to learn more about PV.
Related actions that might educate and encourage reporting were making the
decision-making process more transparent and providing more detailed feedback to
reporters on the ADR they had just reported.
214
Many respondents were sceptical about the quality of patient-generated yellow card
reports compared to that of HCP-generated reports. Several authors have
commented that reports submitted directly from patients are of comparable quality to
those from healthcare professionals and while they may contain less factual
information, they do contain rich qualitative descriptions of drug-related symptoms
not always considered by their GPs.185,186 While patient reporting is here to stay, the
quality of reports might be improved by collaboration between the patient and their
carer(s).
5.2 Use of the GRADE hierarchy to grade the quality of ADR evidence.
A majority of respondents, both in the questionnaire responses and individual
interviews, indicated their dissatisfaction with using the hierarchy. Since Gray’s
publication141, others have attempted to refine the hierarchy and place more
consideration on ADR data itself. In 2004 the GRADE (Grades of Recommendation
Assessment, Development and Evaluation) Working Group recommended that
clinical practice guidelines should be developed by panels of people with access to
the available evidence, an understanding of the problem, appropriate research
methods and sufficient time for reflection. 187 After a series of 16 international
meetings over the next five years, the Working Group concluded that its system was
probably the best available and advocated adoption by organisations worldwide.188
This hierarchy emerged during the course of the author’s research and it is worth
reviewing its content, particularly as it is one of the few that facilitate grading ADR,
rather than just efficacy, evidence.
Referring to over 30 publications from around the world, the GRADE Working Group
observed that many organisations had used a variety of systems to assess the
quality of clinical evidence and therefore the strength of their recommendations.188
However, differences, and the shortcomings were confusing and impaired effective
communication. (e.g. the same evidence was been rated as II-2; B; Cplus; 1;
‘strong’; or ‘strongly recommended’, depending on the system used). The group
presented a systematic and explicit approach which considered study design, study
quality, consistency and directness, in judging the quality of evidence for each
215

important outcome, but cautioned that the balance between harm, quality of
evidence, applicability and certainty of the baseline risk should all be considered.
In attempting to overcome the shortcomings of previous schemes, the authors
devised a matrix, which they proposed, enabled more consistent judgement and
assisted with communicating better-informed healthcare decisions. They described a
sequential process for guideline development in which grading the evidence in terms
of quality is only one step. This step is itself broken down into a number of
considerations, all of which require careful consideration of the available evidence.
The steps in evidence grading are shown in Table 5.1, where the reviewer is
instructed to consider the balance of benefits and harms.
The GRADE system classifies the evidence in one of four levels – high, moderate,
low and very low (see Table 5.1). Evidence based on RCTs begins as high quality
evidence but confidence in the evidence (and hence quality rating) may decrease for
several reasons including: study limitations, inconsistency of results, indirectness of
evidence; imprecision; and reporting bias. Observational studies, such as cohort or
case-control studies, start with a low quality rating but may be upgraded (or
downgraded) depending on the presence (or absence) of robust data helping to
resolve any of the factors above. The authors recommend four key elements in
assessing a piece of evidence:
a. Study design
For example, when comparing ADRs occurring in RCTs with those noted in
observational studies, care must be taken to avoid mis- or over-representation. The
authors remark upon the discrepancy in results apparent when observational studies
suggested that hormone replacement therapy decreased the risk of coronary heart
disease, 189 but later RCTs reported no such protection and even an increased
risk.190,191 The evidence from RCTs is thought to be superior, but such studies are
not always feasible in terms of recruiting sufficient subjects to stand a chance of
detecting rare ADRs. Observational (epidemiological) studies may in fact, provide
better evidence.
216

217

Table 5.1. GRADE evidence quality assessment criteria (see text for interpretation, adapted from reference 187.)
Quality of evidence Study design Lower if* score Higher if* score
Study quality has: Association is:
High
Randomised controlled trial Serious limitations -1 Strong: no plausible confounders, consistent and direct evidence1
+1
Moderate
Very serious limitations -2 Very strong: no major threats to validity and direct evidence2
+2
Low
Observational study (e.g. cohort, case-control, interrupted time series,
before and after studies) Important inconsistency -1 Evidence of a dose-response gradient
+1
Directness Presence of all
plausible residual confounders would have reduced the effect
+1
Some uncertainty -1
Major uncertainty -2
Sparse / imprecise data -1
Very low
Any other evidence (e.g. case reports or series)
High probability of reporting bias
-1
* 1= move up or down one grade (e.g. from high to intermediate); 2 = move up or down two grades (e.g. from high to low)
1 A statistically significant relative risk of >2 (<0.5) based on consistent evidence from two or more observational studies, with no plausible confounders.
2 A statistically significant relative risk of >5 (<0.2) based on direct evidence with no major threats to validity.
218

Thus it is essential also to consider the quality of the study, consistency of findings
between studies and the directness of the evidence. Also in the ADR context, a well
designed (and reported) case series may provide high quality evidence for specific
putative ADRs which is of greater value than a brief numerical line listing of ADRs in
one table of a RCT report. In the same vein, a well-designed, prospective cohort
study may provide not only detailed ADR reports, but also an indication of incidence
and therefore be of higher quality.
Aronson and Hauben 192 suggest that some ADRs are so convincing (for example
photosensitivity to a drug that reappears on re-challenge) that a well-documented
anecdotal report – a so-called ‘between the eyes’ ADR report - can provide
convincing evidence of a causal association without the need for further verification.
Such reports would be rare. In this example, quality and quantity are most definitely
not the same. The question with spontaneous reports is not just quality but also
quantity. As questionnaire subjects in Chapter 4 said, a signal was the accumulation
of a small number of reports that then required further, detailed investigation. On its
own therefore they would not consider a signal as particularly high quality evidence
on which to base regulatory action.
b. Study Quality
Study quality is important in assessing the evidence and the GRADE criteria provide
latitude to downgrade a study in quality level if important detail is missing or ‘golden
rules’ are broken; for example non-blindedness in an RCT or insufficient detail to
assess any temporal association between drug use and the appearance of an ADR.
c. Study consistency
Consistency between similar studies is deemed important. In the case of ADRs,
inconsistency may be found in differences in incidence, ways in which the ADR has
been classified or severity of outcomes (e.g. resolved without supporting therapy,
drug withdrawn, hospitalisation, death).
d. Study directness
The term ‘directness’ is used to describe how well the evidence relates to the context
of interest. For example, if a particular ADR is observed in a group of patients
included in a RCT, would the severity and incidence of that ADR be expected to be
218

the same in a cohort of elderly patients with co-morbidities and taking other drugs?
Directness is an aspect that has always complicated comparisons of ADRs seen in
RCTs conducted pre-authorisation with those seen in post-MA cohort studies.
Considering the nature of the two types of patient receiving the drug, only indirect
comparisons can be made between the context in which pre-marketing data was
gathered and the post-marketing situation.
The problem of directness also arises when comparing ADR evidence for drugs in
the same class, but used in separate studies. If drug A (an ACE inhibitor) causes
cough in X% of patients and drug B (also an ACE inhibitor) causes cough in Y% of
patients in another trial, one might try and generalise the evidence to say that ACE
inhibitors as a group, cause cough in X, Y or (X+Y)/2 % of patients, or some other
function. Only an assessment of comparability (directness) between the trials, e.g.
design, subjects, doses, co-morbidities and ways of assessing ‘cough’ itself
(severity, inconvenience / acceptability to the patient, persistence, treatability) will
provide an answer.
The GRADE working group recommended combining the four elements described
above, firstly by grading the evidence according to type, where an RCT is high-grade
evidence, an observational study is medium or low-grade and any other evidence is
very low grade (see Table 5.1), and then applying a complex scoring system based
on the four elements to allocate the evidence to one of four categories:
High – where further research is unlikely to change confidence in the estimate of the
effect;
Moderate – where further research is likely to have an important impact on
confidence in the estimate of the effect and may change its magnitude;
Low – where further research is likely to have an important impact on confidence in
the estimate of the effect and is likely to change that estimate; and
Very low – where the estimate of effect is very uncertain.
With respect to ADRs, the authors state that when the risk of an ADR is critical for
making a clinical judgement, and evidence of risk is weaker than evidence of benefit,
ignoring uncertainty about the risk of harm is problematic. As a solution, they
219

suggest that the lowest quality of evidence for any outcome that is critical for making
a decision should provide the basis for rating the overall quality of the evidence.
For example, if, in order to decide whether to use a particular drug or not, it is
determined that it is critical that it should not cause death, then even if the drug
saves lives, a trial reporting death due to its use must be considered higher quality
evidence than one where lives are saved but no deaths are reported; other
considerations such as improvement in disease or quality of life and the number and
severity of other ADRs besides death colour the decision.
The decision as to what is critical is complex. The plausibility of ADR evidence may
influence the judgement of whether it is critical or not. Evidence of plausibility may
not come from the study in question but from supplementary evidence; for example,
animal studies indicating the potential for an important ADR may enhance the quality
of evidence seen in patients; although in the absence of human data, the former
might be considered low or very low quality data.
This discourse is concerned mainly with assessing the quality of ADR data; however
it is worth considering briefly the potential for the context in which it is used to
influence perceived quality. This often distils into risk versus benefit analysis, as
outlined in Chapter 1. For example, there is high quality evidence that anti-platelet
therapy reduces the risk of non-fatal stroke and myocardial infarction; equally, there
is high quality evidence that bleeding risk is raised. Clinicians accept the former
whilst remaining mindful of the latter and prescribe anti-platelet therapy with caution.
This is an example where recommendations should apply to specific settings and
groups.
5.2.1 Advantages and disadvantages of the GRADE system
The GRADE system is widely used, for example by the WHO, the American College
of Physicians and the Cochrane Collaboration; however some have criticised its
complexity relative to earlier systems. Schunemann et al.193 summarised the benefits
and drawbacks to using a single hierarchy for everything; their observations are
summarised below, together with the author’s.
Advantages of adopting a common system to grade evidence are listed below. ADR
data is indeed reviewed by disparate groups of individuals with varying stances as
220

evidenced in the present research – e.g. regulators, healthcare professionals and
pharmaceutical industry employees.
- A single, robust system would enable transparency and consistency when
communicating and comparing the decisions of different groups studying the
same problem.
- Use of a single system facilitates audit and quality control.
- Using different systems might result in false positive / negative conclusions.
- A common system should prevent individuals with vested interests from
choosing the system that views their product in the most favourable light; i.e.
transparency is facilitated.
- A common system should prevent individuals with vested interests from
choosing the system that views their preferred evaluation approach in the
most favourable light.
- Using different systems for different types of study methodologies could
confuse. In the present study, using a single system had the same effect.
Disadvantages of adopting a common system to grade evidence are as follows; on
the basis of her research, there are some strong arguments here.
- Having an un-workable system to evaluate some kinds of evidence could lead
to false negative conclusions.
- Where RCTs are not feasible, using a system which consistently views all
other data as very poor quality might lead to important interventions not being
made promptly enough; as could be the case with rare ADRs. This clearly
reflected in the comments of some subjects in the structured interviews.
Applying GRADE to the data presented in the seven scenarios in Appendix 2
shows the information to be of very low (Scenarios 1,3,4,6 & 7) or low
(Scenarios 2 & 5). This may not reflect a lack of discrimination as most of the
data is of the same type.
221

- Effects that cannot be studied with RCTs might not get studied because the
data will always be rated as low quality. In terms of ADR case reports, this is
clearly unacceptable.
- A single system that CAN adequately evaluate a wide range of evidence
types may be too complex for routine use. This may apply to the GRADE
system for routine use by healthcare professionals outside of the main PV
environments.
These disadvantages are often raised by those that would have no evidence
hierarchy at all, when evaluating ADR data.
5.2.2 Detractors of grading evidence in a hierarchy
Participants in this research clearly had difficulty with arranging safety evidence in
hierarchies, for example INTs 8 and 13. Detractors of the use of a hierarchy argue
that quality of evidence for both risk and benefit, is a continuum and any discrete
categorisation implies a degree of arbitrariness. For example, Rawlins194 observed
that the notion that evidence can be reliably placed in hierarchies is illusory and that
any decision regarding the safety or efficacy of a medicine should be based on a
thorough appraisal of all the relevant available evidence, whatever level it hails from.
Randomised controlled clinical trials can provide robust evidence of drug safety over
the short timescales of their duration, but only observational studies can provide
evidence for less common or long-latency ADRs. Hierarchies cannot rate evidence
combined from the two data sources. Such combinations require decision-analytical
modelling and new techniques being developed in the emerging field of teleoanalysis
-where a summary estimate of the size of a relationship between a drug and a
particular side effect - the risk - is made by combining data from different types of
study and by inference, evidence of different qualities.195
An example of this thinking would run as follows: we know from case reports or a
cohort study that a particular side effect is caused at one drug serum level but not at
a lower one. Serum levels in a range of individuals produced by a uniform dose lie
within a particular range that includes the breakpoint dose. So it should be possible
to predict the percentage of patients exhibiting the side effect – i.e. estimate the risk.
222

The sheer number of, and inconsistencies between, hierarchies suggests that none
are satisfactory. Rawlins194 observed that ‘hierarchies attempt to replace judgement
with an over-simplistic, pseudoquantitative assessment of the quality of the available
evidence’. In the context of this research, where the life of a product (and also
potentially the lives of patients) depends on making judgements about the reliability
and generalisability of efficacy and safety data, acting solely in accordance with any
hierarchy is not an option. Thus he concluded by saying that hierarchies should be
replaced by embracing a diversity of approaches and pleading that researchers
continue to develop and improve their data evaluation methods, that decision makers
remain open-minded about the nature of evidence and that both accept that
interpretation of evidence requires judgement.
5.2.3 Adoption of risk management plans (RMPs)
The quality of the available evidence is just part of the decision to recommend or not
to recommend a particular course of action – be it therapy or therapy withdrawal; but
it is an important part. Others include risk versus benefit analysis, translation into
specific patient settings and, where budgets are finite, the balance of cost savings by
effectively treating patients with the costs of repairing harm. If there is uncertainty
about baseline risk or translation due to poor quality of evidence, this may lower
confidence in a recommendation. Where data quality is poor, specific research to
address the deficit should be undertaken.
This is supported by Andrews and Dombeck166 who observed that in the US, risk –
benefit analyses based mainly on pre-marketing clinical trial data and the FDA’s
ADR spontaneous reporting system has sustained an information void; to the extent
that when new safety signals emerge from the latter, they cannot be contextualised
in terms of actual, real-world use and regulators are often limited to either
sanctioning continued marketing without significant changes or withdrawing the
product. The authors site several examples, including cisapride, where, in their
opinion, withdrawal had occurred on the basis of poor quality evidence and others
where data collected proactively to better understand the disease and product risks,
can facilitate a wider range of responses to the safety signal, including labelling
changes and restrictions in use, e.g. aciclovir, clozapine and interestingly
thalidomide. In the latter cases, epidemiological data were available to provide
223

reassurance of product safety and continued product use when continued marketing
was dependent on adoption of additional risk management programmes – e.g.
monitoring for agranulocytosis in patients taking clozapine. The authors conclude
that more extensive and earlier epidemiologic assessment of risks and benefits of
new products will create a standard of evidence for industry and regulators, is likely
to result in more effective and balanced regulatory actions, thereby providing better
patient care.
Current philosophy of the UK regulatory authorities is that PV should be just one
strand of an overall RMP for every drug throughout its life, but particularly in the early
years of its development and use. Such strategies may include a stipulation that a
PEM study should be carried out for every newly-authorised product. This proposal
was popular with some correspondents in the present research, but several
observed that conducting a PEM study for each new product was unfeasible. Such
‘observational’ data, at least in the eyes of some, will always be inferior to that
gained from clinical trials.196 Regulators can and do request additional randomised
clinical trials post-marketing, to look at emerging safety concerns and make
continued marketing conditional upon provision of this data; but it appears from the
author’s literature search, that a minority of plans are seen to fruition191, leading her
to suggest that greater monitoring and enforcement is required. This research
suggests that the quality of data gathered in such a RMP could be improved by
encouraging better reporting through existing channels, e.g. the yellow card system,
through education and encouragement of potential reporters. This may in turn, help
to reduce the probabilities of a product being withdrawn or made subject to a major
labelling change shown in Phase 2 of this research.
5.3 Critique of study methodology
Phases 1 and 2 of this research were essentially data gathering from the public
domain. Attempts to encourage involvement from the pharmaceutical industry
proved largely fruitless. In the author’s opinion, this was mainly due to lack of
resource rather than deliberate non-cooperation. Clearly, data on file may have been
used in some decisions to withdraw made by the product manufacturers themselves
224

and as found by Jeffereys et al. 4 and Bakke et al. 156 some decisions may have
been prompted by other factors in addition to drug safety.
It was relatively easy to find at least some justification for the product withdrawals
and major labelling changes shown in Chapter 3, from MHRA publications such as
‘Current Problems in Pharmacovigilance’ and the ‘Dear Doctor’ letters, however an
impression was gained that while the evidence was presented objectively, the
decision on which it was based was more subjective; it proved difficult to obtain the
minutes of meetings at which such decisions were actually made, and therefore of
the risk-benefit analysis conducted.
5.3.1 Strengths and weaknesses of survey techniques used.
5.3.1.1 Themed analysis
Framework or themed analysis has been employed in social sciences for a number
of years. 196,197,198 Reviewing computer assisted qualitative methods for data
analysis, Spencer et al.199 cite their advantages of easier text manipulation and data
management and their ability to facilitate building conceptual networks and the
general consensus that their advent has been beneficial to qualitative research.
However, they do sound caution in over-reliance on the package, for example, taking
quotes out of context or linking chunks of text automatically without a true
understanding of the link. They make the point that none of the computer
programmes, including NVivo8, will perform automatic data analysis and all depend
on researchers defining for themselves what analytic issues are to be explored, what
ideas are important and what modes of representation are important. Nvivo8 was a
pragmatic choice for this study as it appeared to provide the facility to guide careful
analysis while at the same time allowing the author to develop a themed framework.
Themed analysis facilitates systematic but pragmatic data analysis to organise the
data into themes and related sub-themes. This enables the analysis of pre-
determined topics (in this study the opinions of respondents to selected statements
and PV scenarios) while concurrently allowing new themes to emerge.
One area where the present analysis differed from the original concept described by
Ritchie et al.198 was that rather than being linear, where all themes are determined
225

prior to analysis, new themes and sub-themes were allowed to emerge as the
analysis progressed. This has some advantages. Firstly, sorting and interpreting the
data in this way and returning to consider it in context ensures better consideration of
all the content. Secondly, it is truer to the spirit of IPA as each comment, observation
or interjection contributes to constructing a brighter picture of respondents’ true
views and feelings. Thirdly, the creation of new themes as analysis progresses, if
done carefully, adds to its richness and diversity.
5.3.1.2 Combination of web-based questionnaire and face-to-face interview
results.
Web-based questionnaires and face-to-face interviews could be considered
independent research methods. Lambert and Loiselle 200 and Morse and Richards 201
recommended that researchers should use multiple qualitative methods to enhance
IPA. Advantages of the combined approach adopted in this research were that it
allowed triangulation of convergent and divergent opinions and comparison of
viewpoints from different sectors of the PV professional community. Where subjects
who responded to the web-based survey were subsequently interviewed, it also
allowed an assessment of test-retest reliability and issues raised in the web-based
questionnaire could be developed in the face-to-face interview phase.
One disadvantage of the structured interviews, was that it was only possible to ask a
fraction of the questions asked in the web-based survey.
5.3.1.3 Choice of structured interviews
Semi-structured interviews were chosen for this study because in addition to allowing
the researcher to explore the participant’s individual beliefs and perceptions, the
author was in a position to follow up subjects or comments of particular interest to
the interviewee that emerged during the discussion.202 Focus groups were discarded
as an alternative; although they can provide feelings and beliefs generated by
interaction between participants and are a quicker way of involving more
participants,203,204 they suffer from a range of disadvantages in the context of the
present research. These have been summarised by Litosseliti205 and Krueger206
They do not facilitate detailed exploration of an individual’s personal experiences of
226

the research topic. Focus groups can generate bias and manipulation from strong-
minded group members, obscuring the views of less outspoken members.
In this research, individual views, relating to experience and work context rather than
group views were important. In focus groups, individual behaviour is influenced by
that of the group and it is difficult to isolate individual opinion from that of the group.
For this research, individuals were from a wide variety of backgrounds and
professional experiences of PV were sampled purposively; any focus group would
not therefore by definition, be a representative sample from which generalisations
could be extrapolated. Each group would be unique; therefore multiple groups would
be required to balance idiosyncrasies.
Focus groups provide less control for the researcher compared to structured
individual interviews; analysis is dependent on good notes and documentation of
context, which it was anticipated, would have been harder for the author. The
potential research candidates were spread over a large geographical area, mitigating
against finding a place and a time when groups could be brought together. This part
of the research was essentially IPA, where the researcher explored the attitudes of
healthcare professionals to a series of themed questions and scenarios and attempts
to generate a coherent interpretation of those themes. Brocki and Wearden207
reviewed 52 IPA studies and found that 46 (88%) used semi-structured interviews;
IPA was originally developed for analysing semi-structured interview data.
There is general consensus that the best semi-structured interviews allow
participants to consider the broad questions before-hand 202 but allow scope for the
investigator to change and explain wording depending on the direction the interview
takes.174 However, this should not be done at the expense of losing focus. Other
attributes of face-to-face interviews cited by Robson174 and found useful in this
research include their flexibility, the opportunity to follow up responses, the facility to
structure to allow comparisons between interviewees, freedom to explore general
views or opinions in more detail and the opportunity to explore professionally
sensitive issues- all of which occurred at some stage during the interviews
conducted by the author.
227

228
5.3.1.4 Survey response rates
Response rates to the web-based questionnaire were low and attempts to increase
responses by email reminders were of limited success. While valuable information
and views were obtained from respondents, the potential for generalisation outside
of the respondent group is limited. Respondent completion of the entire
questionnaire was less than expected, but may have been related to the number of
scenarios presented for consideration. Perhaps fewer scenarios, with clearer
distinctions between them, in terms of severity and depth would have yielded a
greater response while being able to measure attitudes to the same extent.
Similarly the author had time to interview thirteen respondents. It would have been
interesting to interview a wider variety of subjects, particularly specialist prescribers
such as hospital consultants and those actually involved in making some of the
withdrawal decisions, particularly those from the licensing authority. Again, this does
limit generalisation, but the study did at least attempt to involve representatives from
a wide range of PV workers.

CHAPTER 6: OVERAL CONCLUSIONS AND SUGGESTIONS FOR FUTURE
WORK
6. 1 Conclusions
Figure 6.1 displays a model for excellence in pharmacovigilance, proposed by the
author on the basis of her survey and literature research.
A number of factors could contribute to improved confidence in the available safety
data and the quality of labelling decisions on which they are based.
Improved education of reporters, through greater use of Drug Safety Updates and
better feedback on individual reports might indirectly increase the quality of
spontaneous reports. Undergraduate and postgraduate training of healthcare
professionals should include a significant PV component and emphasis should be
placed not just on the practicalities, but also the ethical and professional importance
of reporting. Training would develop the next generation of PV specialists, capable of
designing and developing its science and practice and providing expert advice to the
regulator. Development and uptake of formal postgraduate courses, such as the
MSc in Pharmacovigilance, run as a collaborative programme between the DSRU
and the University of Portsmouth208 is key to this objective.
To understand the balance between benefit and harm, the regulator requires access
to all the safety data at its disposal. While spontaneous case reports will always
remain valuable as a data source, thought should be given to simplifying the
reporting process, particularly with regard to follow-up.
Waller and Evans183 have suggested that an alternative means of signal detection
would be to look in databases for reasons why drugs were discontinued or changed
during treatment of a particular disease. This could be done retrospectively with
yellow card data or the GPRD; but observational cohort techniques, like PEM are
suitable for studying drug use in this way. Greater use of PEM studies is advocated,
where possible, and particularly where they can form part of a risk management
plan. Risk management planning should not only form part of the MA approval
process, but agreed plans should be enforced. The UK regulator has emphasised
the importance of timely delivery of RMPs entered into at marketing approval and
hinted at making the arrangement mandatory if voluntary agreements are broken.181
229

230

Until now, this has not been the case and up to two thirds of RMPs agreed at
authorisation have not been completed. New EU legislation is expected to enforce
the completion of agreed RMPs, thus providing more complete data.184 A RMP
should be explicit within all divisions of the pharmaceutical company and
transparent, to the extent that mention might be made in the SPC and other product
labelling directed at product users. As Arlett et al.63 have suggested, whatever the
strategy, it should be planned, targeted, understandable, open, informative and
balanced.
Decisions made by any committee have the potential to be influenced by its
membership. Thus regulatory decisions, which may have major effects on company
finances and patient well-being should be taken using the best information and
taking the best advice available to ensure objectivity, equity and accountability
Waller and Evans183 have suggested the inclusion of lay advisers or patients in the
decision making process in addition to PV experts and healthcare practitioners. Such
inclusion is favoured in other areas of health decision making, notably in the NHS
Research for Patient Benefit and Research Ethics Committee programmes. The
quality of decisions should also be monitored; hence the urgent need for greater
transparency and placing all safety decisions in the public domain, so that they can
be reviewed by an independent expert panel.
Quality decisions are usually based on quality data and some uniform means of
assessing that data is required. In using any system at all, it is intellectually honest to
recognise the limits of evidence. Admitting the limitations of the data might promote
better quality research and encourage the culture of scientific development.
This research has shown that simple hierarchies, such as Gray’s are not fit for
purpose as far as ADR data are concerned. The author suggests that the GRADE
system, described in Chapter 5 might prove useful, as it was designed to cope with
both efficacy and safety data. Use of this system allows one to more easily see
where the gaps in knowledge lie, and thus facilitate the formulation of a RMP. The
author recognises that in the absence of ideal data sets (i.e. most of the time) there
is no substitute for clinical judgement from an experienced assessor.
231

Whatever the decision making process, it is important to monitor the effects of the
decision on subsequent public health benefit. This will be assisted by improved
transparency and independent monitoring. This is discussed further in Section 6.2.
Improved dissemination of the change, through publications such as the Drug Safety
Update, BNF blue box warnings and electronic Dear Healthcare Professional letters
and the GPRD might have a greater impact on subsequent prescribing.
6.2 Suggestions for further research
The research reported in this thesis allows recommendations to be made on how
drug safety decisions might be improved. However, the overall aim of the decision
making process is to ensure safe product use; i.e. to measure the success or failure
of the process.
It is recommended that the impact any change(s) could be monitored by observing
the time period after a change has been implemented, to look at the effect on
subsequent appropriate or inappropriate prescribing. The GPRD could be used to
conduct time correlational analyses, similar to those used in Chapter 2, for this
purpose. Analysis of drug use could be accompanied by a longitudinal study of the
impact of the change on morbidity and mortality and appearance of ADRs that the
change was supposed to minimise.
Education was a strong theme to emerge from the research. A study should be
conducted to investigate the extent of PV training and knowledge of those with
responsibility for patient care, at both undergraduate and postgraduate levels. It
might be informative to compare and contrast the extent of training in different
countries with differing educational systems and PV arrangements.
In connection with the above, a training needs analysis could be conducted among
those working with safety data in the pharmaceutical industry and the regulatory
authorities to see how best the need might be addressed. There are very few formal
postgraduate opportunities in the UK and it would be interesting to see how such
needs are currently addressed in-house and if those needs might be better met
elsewhere.
232

233
The Drug Safety Update publications from the MHRA appear to be popular and a
potential means of rapid dissemination of new safety concerns. A user survey on the
content, scope, and dissemination of the Drug Safety Update would prove useful, to
see how its use might be optimised.
The advantages and disadvantages of the GRADE system for ranking the quality of
ADR data are discussed in Section 5.2.1. One disadvantage is that because most
ADR data come from spontaneous reporting of individual cases and seldom from
RCTs, they will always be judged as low or very low quality.
A systematic evaluation of the use of GRADE by pharmacovigilance workers is
recommended in terms of applicability, consistency and acceptability to potential
users.
There may be scope to develop the low / very low end of GRADE to allow
discrimination between case reports in terms of number, detail and similarity. Data
quality would be lower if key data were missing, but higher if certain targets for
frequency, depth and clarity of the cases were met. The presence of corroborating
data from PEM studies, epidemiological, Phase 1 pre-clinical studies might also
contribute to quality.
This process might facilitate the development of a rather different hierarchy for
ranking the quality of ADR data, where for example, data from RCTs, which is often
limited in a published report to a frequency table, would be ranked below a series of
quality cases of a similar nature.
Ultimately, the decision making process for ADR data is there to protect patients. A
study should be performed among patients and patient groups to assess their
current perception of the process, their grasp of its thrust and scope and to gauge
their views on how the process might be improved for their benefit.

References
1. Hass A.E., Portale D.B., Grossman R.E. New drugs; their market life and safety.
Pharmaceutical Journal 1985;February 27: 235-238.
2. Clarke, A., Deeks, J.J., Shakir, S.A.E. An assessment of the publicly
disseminated evidence of safety used in decisions to withdraw medicinal products
from the UK and US markets. Drug Safety 2006;29(2):175-181.
3. Lasser, K.E., Allen, P.D., Woolhandler, S.J., Himmelstein,D.U., Wolfe,S.M.,
Bor,H.B. Timing of new black box warnings and withdrawals for prescription
medications. JAMA 2002; 287(17):2215-2220.
4. Jefferys, D.B., Laekey,D., Lewis, J.A., Payne, S., Rawlins, M.D. New active
substances authorised in the United Kingdom between 1972 and 1994. Br J Clin
Pharmacol 1998;45:151-156.
5. Layton, D. The gastrointestinal and cardiovascular safety of COX-2 selective
inhibitors in general practice – the contribution of Prescription Event Monitoring.
PhD Thesis, University of Utrecht, Utrecht, 2007, pp 340-341.
6. Lumkin, M.M. International pharmacovigilance: developing cooperation to meet
the challenges of the 21st century. Pharmacol Toxicol 2000:86(S1):20-22.
7. Shojania, K.G., Duncan, B.W., McDonald, K. Safe but sound: patient safety meets
evidence-based medicine. JAMA 2002:288(4):508-513.
8. World Health Organisation. International drug monitoring: the role of national
centres. Technical Report Series No.498, WHO, Geneva, 1972.
9. World Health Organisation. The importance of pharmacovigilance – safety
monitoring of medicinal products. WHO, Geneva, 2002.
10. EMEA-CPMP. Note for guidance on clinical safety data management: definitions
for expedited reporting (CPMP/ICH/377/95. ICH Topic E2A). London: 1995.
Available at: http://eudravigilance.emea.europa.eu/human/docs/e2a.pdf.
(Accessed 21/5/09)
234

11. ICH Expert Working Group. Clinical safety data management: definitions and
standards for expedited reporting. E2A. ICH, Geneva, 1994. Available at:
http://www.imim.es/media/upload/arxius/MEDIA436.pdf (Accessed 26/5/09).
12. Royer, R.J. Mechanisms of action of adverse drug reactions: an overview.
Pharmacoepidemiol Drug Safety 1997;6:S43-S50.
13. Rawlins, M.D., Thompson, J.W. In: Davies, D.M . (Ed.)Textbook of Adverse Drug
Reactions. Oxford University Press, London, 1977, p10.
14. Edwards, I.R., Aronson, J.K. Adverse drug reactions: definitions, diagnosis and
management. Lancet 2000;356(9237):1255-1259.
15. Monahan, B.P., Ferguson, C.L., Killeavy, E.S., Lloyd, B.K., Troy, J., Cantilena,
L.R. Torsades de pointes occurring in association with terfenadine use. JAMA
1990;264(21):788-90.
16. Greenberger, P.A. Drug allergy. J Allergy Clin Immunol 2006;117(2 ):S464-S470.
17. Park, B.K., Pirmohamed, M., Kitteringham, N.R. Idiosyncratic drug reactions: a
mechanistic evaluation of risk factors. Br J Clin Pharmacol 1992;34(5):377-395.
18. Meyboom, R.H., Egberst, A.C., Edwards, I.R., Hekster, Y.A., de Konig, F.H.,
Bribnau, F.W. Principles of signal detection in pharmacovigilance. Drug Safety
1997; 6(6):355-365.
19. McBride, W.G. Thalidomide and congenital abnormalities. Lancet 1961; 2:1358.
20. Lenz, W. Malformations caused by drugs in pregnancy. Am J Dis Child 1966;
112:73-96.
21. Aronson, J.K., Ferner, R.E. Joining the DoTS: a new approach to classifying
adverse drug reactions. BMJ 2003;327(7425):1222-1225.
22. Callreus,T. Use of the dose, time, susceptibility (DoTS) classification scheme for
adverse drug reactions in pharmacovigilance planning. Drug Safety 2006;
29(7):557-566.
23. Snodin, D.J. Toxicology and adverse drug reactions. In: Talbot, J., Waller, P.
(Eds). Stephens’ Detection of New Adverse Drug Reactions (5th Edn). J Wiley &
Sons, Chichester, 2004, pp127-166.
24. Owens, R.C, Ambrose, P.G. Torsades de pointes associated with
fluoroquinolones. Pharmacotherapy 2002;22:6663-6668.
235

25. Talbot, J., Stephens, M.D.B. Clinical trials- collection of safety data and
establishing the adverse reaction profile. In: Stephens’ detection of New Adverse
Drug Reactions (5th Edn) Talbot, J., Waller, P. (Eds) J.Wiley & Sons, Chichester,
2004, pp 1-90.
26. Suntharalingam, G., Perry, M.R., Ward, S. Cytokine storm in a phase 1 trial of the
anti-CD28 monoclonal antibody TGN1412. New Eng J Med 2006:355:1018-1028.
27. Mann RD. Prescription-event monitoring -recent progress and future horizons. Br
J Clin Pharmacol 1998;46:195-201.
28. Stricker, B.H., Psaty, B.M. Detection, verification and quantification of adverse
drug reactions. BMJ 2004;329:44-47.
29. Rawlins, M.D., Jeffreys, D.B. UK product licence applications involving new
substances 1987-1989: their fate after appeal. Br J Clin Pharmacology
1993;35:599-602.
30. Reichert, J.M. Clinical development of therapeutic medicines: a
biopharmaceutical versus pharmaceutical product comparison. Drug Inf J 2001;
35:337-346.
31. Lewis, J.A. Post-marketing surveillance: how many patients? Trends Pharmacol
Sci 1981;2(4):93-94.
32. Wright, P. Untoward effects associated with practolol administration;
oculomucocutaneous syndrome. BMJ;1975;1:595.
33. Haenszel, W., Loveland, D.B., Sirken, M.G. Lung cancer mortality as related to
residence and smoking history, 1. White males. J Natl Cancer Inst 1962;28:947-
1001.
34. Handley, J.A., Lippman-Hand, A. If nothing goes wrong is everything all right?
Interpreting zero numerators. JAMA 1983;249:1743-1745.
35. Strom, B.L Sample size considerations for pharmacoepidemiology studies. In:
Strom, B.L (Ed). Pharmacoepidemiology (4th Edn), J Wiley and Sons, Chichester,
2005, pp29-36.
36. Strom, B.L. What is pharmacoepidemiology? In: Pharmacoepidemiology. (4th Edn)
Strom B.L. (Ed); J.Wiley and Sons, Chichester 2005, pp3-15.
236

37. Edwards, R. The International Society of Pharmacovigilance. Pharmacoepidemiol
Drug Safety 2002;11:253-254.
38. Medicines and Healthcare products Regulatory Agency Yellow Card Scheme
Available at: http://yellowcard.mhra.gov.uk (Accessed 22/5/09).
39. Medicines and Healthcare products Regulatory Agency Download Drug Analysis
Prints (DAPs). Available at:
http://www.mhra.gov.uk/Onlineservices/Medicines/Druganalysisprints/index.htm
(Accessed 20/5/09).
40. Medicines and Healthcare products Regulatory Agency Black triangle scheme.
Available at:
http://www.mhra.gov.uk/Safetyinformation/Reportingsafetyproblems/Medicines/Re
portingsuspectedadversedrugreactions/Healthcareprofessionalreporting/BlackTria
ngleScheme/index.htm (Accessed 22/5/09).
41. Gould, A.L. Practical pharmacovigilance analysis strategies. Pharmacoepidemiol
Drug Safety 2003;12:559-574;
42. Evans, S.J.W., Waller, P.C., Davis S. Use of proportional reporting ratios (PPRs)
for signal generation from spontaneous adverse drug reaction reports.
Pharmacoepidemiol Drug Safety 2001;10:483-486.
43. MHRA. Annual Report and Accounts (Annual Statistics). Medicines and
Healthcare products Regulatory Agency, London, 2007, p6. Available at:
http://www.mhra.gov.uk/Publications/Corporate/AnnualReports/CON2031778
(Accessed 26/5/09).
44. Inman, W.H.W. Monitoring for drug safety. MTP Press, Lancaster 1980, pp36-7.
45. Weber, J.C.P. Epidemiology of adverse reactions to non-steroidal anti-
inflammatory drugs. In: Advances in Inflammatory Research, Vol 6., Rainsford,
K.D, Velo, G.P. (Eds) Raven Press, London, 1984, pp1-7.
46. Brodovicz, K., Sharrar, R., Hostelly, L. The Weber effect – is it real?
Pharmacoepidemiol Drug Safety 2001;10:S138.
47. Tubert-Bitter, P., Haramburu, F., Begaud, B., Chaslerie, A. Spontaneous reporting
of adverse drug reactions: who reports and what? Pharmacoepidemiol Drug
Safety 1998;7: 23-329.
237

48. Rawlins, M.D., Spontaneous reporting of adverse drug reactions 1:The data. Br J
Clin Pharmacol 1988;26:1-5.
49. Meinzinger, M.M., Barry, W.S. Prospective study of the influence of media on
reporting of medical events. Drug Inf J 1990;24:575-577.
50. Bhasin, S.,Reyburn, H., Steen, J., Waller, P. The effects of media publicity on
spontaneous adverse reaction reporting with mefloquine in the UK.
Pharmacoepidemiol Drug Safety 1997;6:S32.
51. Teicher, M.H., Glod, C., Cole, J. Emergence of intense suicidal preoccupation
during fluoxetine treatment. Am J Psychiatry 1990;147:207-210.
52. Ahmad, S.R., Goetsch, R.A., Marks, N.S. Spontaneous reporting in the United
States. In: Strom, B.L. (Ed) Pharmacoepidemiology (4th Edn), J.Wiley and Sons,
Chichester, 2005, pp135-159.
53. Arnold, B.D.C. Regulatory aspects of pharmacovigilance. In: Talbot, J., Waller, P.
(Eds) Stephens’ Detection of New Adverse Drug Reactions. (5th Edn) J. Wiley and
Sons, Chichester 2004, pp379-451.
54. Edwards, I.R., Olsson, S., Lindquist M., Hugman, B. Global drug surveillance: the
WHO programme for international drug monitoring. In: Strom, B.L. (Ed)
Pharmacoepidemiology (4th Edn), J. Wiley and Sons, Chichester, 2005, pp161-
183.
55. Meyboom, R.H., Egberst, A.C., Edwards, I.R., Hekster, Y.A., de Konig, F.H.,
Bribnau, F.W. Principles of signal detection in pharmacovigilance. Drug Safety
1997;16(6):355-365
56. Delamothe, T. Reporting adverse drug reactions. BMJ 1992;304:465.
57. Begaud,B., Moride,Y., Tubert-Bitter,P., Chaslerie,A. False positives in
spontaneous reporting: should we be worried about them? Br J Clin Pharmacol
1994;8:401-404.
58. Lindquist, M. The need for definitions in pharmacovigilance. Drug Safety
2007;30(10):825-830.
238

59. Hauben, M., Reich,L. Communications of findings in pharmacovigilance: use of
the term ‘signal’ and the need for precision in its use. Eur J Clin Pharmacol
2005;61(5-6):479-480.
60. Coulter, D.M., PEM in New Zealand. In: Mann, R.D, Andrews E.B. (Eds)
Pharmacovigilance (1st Edn),J. Wiley and Sons, Chichester, 2002, pp345-362.
61. Waller, P.C., Lee, E.H. Responding to drug safety issues. Pharmacoepidemiol
Drug Safety 1999;8:535-552.
62. Waller, P.C., Tilson, H.H. Managing drug safety issues with marketed products.
In: Talbot, J., Waller, P. (Eds) Stephens’ Detection of New Adverse Drug
Reactions. (5th Edn) J. Wiley and Sons, Chichester, 2004, pp345-374.
63. Arlett, P., Moseley, J., Seligman, P.J. A view from the regulatory agencies. In:
Strom, B.I. (Ed) Pharmacoepidemiology (4th Edn), J. Wiley and Sons, Chichester,
2005; pp118.
64. Shakir, S.A.W. Causality and correlation in pharmacovigilance. In: Talbot, J.,
Waller, P. Stephens’ Detection of New Adverse Drug Reactions. (5th Edn). J.
Wiley and Sons, Chichester, 2004, pp329-343.
65. Naranjo, C.A., Busto,U.,Sellers,E.M., Sandor, P. A method for estimating the
probability of adverse drug reactions. Clin Pharmacol Ther 1981;30(2):239-245.
66. Almenoff,J., Tonning, J.M., Gould, A.L., Szarfman, A., Hauben, M., Ouellet-
Helstrom, R. Perspectives on the use of data mining in pharmacovigilance. Drug
Safety 2005;28(11):981-1007.
67. Bate, A, Lindquist, M., Edwards, IR, Orre, R. Data mining approach for signal
detection and analysis. Drug Safety 2002;25(6):393-397.
68. Meyboom, R.H., Hekster, Y.A., Egberts, A.C., Gribnau, F.W., Edwards, I.R.
Causal or casual? The role of causality assessment in pharmacovigilance. Drug
Safety 1997;17(6):374-398.
69. Clark, J.A., Klincewicz,, S.L., Stang, P.E. Spontaneous adverse event signalling
methods: classification and use with healthcare treatment products. Epidemiol
Rev 2001;23(2):191-210.
239

70. Hauben, M. A brief primer on automated signal detection. Ann Pharmacother
2003;37:5-10.
71. Wood, K.L. The Medical Dictionary for Drug Regulatory Affairs (MEDDRA)
Project. Pharmacoepidemiol Drug Safety 1994;3:7-13.
72. Brown, D.R., Brown, E.G., Moulvad, T.B. A comparison of two medical
terminologies in coding and analysing clinical trial safety data. Int J Pharm Med
1997;11:85-89.
73. Brown, E.G. Dictionaries and coding in pharmacovigilance. In: Talbot, J., Waller,
P. (Eds) Stephens’ Detection of New Adverse Drug Reactions. J. Wiley and Sons,
Chichester, 2004, pp533-557.
74. Evans, S.J.W., Waller, P.C., Davis S. Use of proportional reporting ratios (PPRs)
for signal generation from spontaneous adverse drug reaction reports.
Pharmacoepidemiol Drug Safety 2001;10:483-486.
75. Bate, A., Lindquist, M., Edwards, I.R., Olsson, S. A Bayesian neural network
method for adverse drug reaction signal generation. Eur J Clin Pharmacol 1998;
54(4):315-321.
76. DuMouchel, W. Bayesian data mining in large frequency tables. With an
application to the FDA spontaneous reporting system. Am Stat 1999;53:177-190.
77. Szarfman, A., Machado, S.G., O’Neill, T. The use of screening algorithms and
computer systems to efficiently signal higher-than-expected combinations of
drugs and events in the US FDA’s spontaneous reports database. Drug Safety
2002;25(6):381-392.
78. Shakir, S.A.W.(Chair) Signal Generation Symposium. Drug Safety
2002;25(6):380..
79. Ferreira, G.L.C. Development of methodologies for improvement in signal
detection using prescription-event monitoring as a post-marketing surveillance
platform. PhD Thesis, University of Portsmouth, 2008.
80. Reynolds R.F., Glasser, D.B., Dieck, G.S. A view from industry. In: Strom, B.L.
(Ed). Pharmacoepidemiology (4th Edn), J.Wiley and Sons, Chichester, 2005,
pp77-101.
240

81. Taylor, B., Miller, E., Farrington, C.P., Petropoulos,M., Favot-Mayaud, I., Li, J.
Autism and measles, mumps, and rubella vaccine: no epidemiological evidence
for a causal association. Lancet 1999;353:2026-2029.
82. Mann, R.D. Reye’s syndrome and aspirin. J Roy Coll Gen Pract 1986;36:418-
421.
83. Rosenberg,L., Coogan, P.F., Palmer, J.R. Case-control surveillance. In: Strom,
B.L. (Ed) Pharmacoepidemiology (4th Edn), J. Wiley and Sons, Chichester, 2005,
pp185-202.
84. Personal Communication, Layton, D. Senior Research Pharmacist, Drug Safety
Research Unit, May 2009.
85. MacKay, F.J., Wilton, L.V., Pearce, G. Alendrolate and oesophageal reactions.
Pharmacoepidemiol Drug Safety 1997;6(S2):045.
86. Wilton, L.V., Heeley,E., Pickering, R.M., Shakir,S.A. Comparative study of the
mortality rates and cardiac arrhythmias in post marketing surveillance studies of
sertindole and two other atypical antipsychotic drugs risperidone and olazapine. J
Psychopharmacol 2002;15:120-126.
87. MacKay, F.J., Wilton, L.V., Pearce, G. Safety of long-term lamotrigine in epilepsy.
Epilepsia 38(8):881-886.
88. Kubota, K. Prescription event monitoring in Japan (J-PEM). Drug Safety 2002;
25: 441-444.
89. Coulter, D.M. Signal generation in the New Zealand Intensive Medicines
Monitoring Programme: a combined clinical and statistical approach. Drug Safety
2002; 25:433-439.
90. Gelfand, J.M., Margolis, D.J., Dattani, H. The UK General Practice Research
Database. In: Strom, B.L. (Ed) Pharmacoepidemiology (4th Edn) 2005, J. Wiley
and Sons, Chichester, pp337-346.
91. Kornegay, C.J., Vasilakis-Scarmozza C., Jick, H. Incident diabetes associated
with antipsychotic use in the United Kingdom general practice research
database. J Clin Psychiatry 2002;63:758-762.
241

92. Schlienger,R.G., Jick, H.,Meier, C.R. Use of non-steroidal anti-inflammatory
drugs and the risk of first-time myocardial infarction. Br J Clin Pharmacol
2002;54:327-332.
93. Wei, L., Parkinson, J., Macdonald, T.M. The Tayside Medicines Monitoring Unit
(MEMO). In: Strom, B.L. (Ed) Pharmacoepidemiology (4th Edn), J. Wiley and
Sons, Chichester, 2005, pp323-336.
94. Strom, B.L. Overview of automated databases in pharmacoepidemiology. In:
Strom, B.L. (Ed) Pharmacoepidemiology (4th Edn), J. Wiley and Sons,
Chichester, 2005, pp219-239.
95. Neftel, K.A., Woodtly, W., Schmid, M., Frick, P.G., Fehr, J. Amodiaquine induced agranulocytosis and liver damage. Br Med J 1986;292:721-723.
96. Vitola, J., Vukanovic, J., Roden, D.M. Cisapride-induced torsades de pointes. J
Cardiovasc Electrophysiol 1998;9(10):1109-13.
97. Casadevall,N., Nataf,J., Viron, B. Pure red-cell aplasia and antierythopoeitin
antibodies in patients treated with recombinant erythropoietin. New Eng J Med
2002;346:469-475.
98. International Conference on Harmonisation (1996). Clinical safety data
management: periodic safety update reports for marketed drugs (ICH E2C),
International Conferences on Harmonisation, Geneva, 6th November 1996.
99. EudraVigilance 2009. Risk management for medicinal products in the EU
(Online). Available at:
http://www.eudravigilance.emea.europa.eu?human/evriskmanagement.asp
Accessed 15/5/09. European Medicines Agency 2005. (Accessed 23/5/09)
100. Committee for Medicinal Products for Human Use: guideline on risk management
systems for medicinal products for human use (online) Available at:
http://www.emea.europa.eu/pdfs/human/euleg/9626805en.pdf (Accessed
15/5/09).
242

101. Harman, R.J. Development and control of medicines and medical devices. 2004,
London, Pharmaceutical Press, London 2004.
102. Anon. The licensing of medicines in the UK. Drug Ther Bull 2009;47(4):45-48.
103. Medicines and Healthcare products Regulatory Agency 2008. Licensing of
medicines (online). Available at:
http://www.mhra.gov.uk/howweregulate/medicines/licensingof
medicines/index.htm. (Accessed 14/5/09)
104. European Medicines Agency, 2009 Human medicines (online). Available at:
http://www.emea.europa.eu/index/index1.htm (Accessed 14/5/09)
105. Anon. European Medicines Evaluation Agency and their new licensing
arrangements. Drug Ther Bull 1994;32:89-90.
106. Medicines and Healthcare products Regulatory Agency, 2008 My medicine
licensing (market authorisation). Available at:
http://www.mhra.gov.uk/safetyinformation//generalsafety
informationandadvice/adviceandinformationforconsumers/mymedicine/licensingm
arketingauthorisationforconsumers/mymedicine/licensingmarketingauthorisation/o
ndex.htm. (Accessed 14/5/09)
107. European Commission. The rules governing medicinal products in the European
Union, Vol. 3. Guidelines: medicinal products for human use: safety, environment
and information. Luxembourg: European Commission, 1998.
108. Irs A. Development of marketing authorisation procedures. In: Freemantle, N,
Hill, S. (Eds) Evaluating Pharmaceuticals for Health Policy and Reimbursement.
Blackwell, London, 2004.
109. European Commission, 2001. Directive 2001/83/EC of the European Parliament
and of the Council of 6 November 2001 on the community code relating to
medicinal products for human use (Online). Available at:
http://ec.europa.eu/enterprise/pharmaceuticals/eudralex/vol-
1/dir_2001_83_cons/dir2001_83_cons_20081230_en.pdf . (Accessed 18/5/09)
110. MHRA. Description of the medicines for human use (Clinical Trials) regulations.
Available at: http://www.mhra.gov.uk/home/groups/l-
unit1/documents/websiteresources/con2022633.pdf. (Accessed 23/5/09)
243

111. Arnold, B.D.C. Regulatory aspects of pharmacovigilance. In Talbot, J., Waller, P.
(Eds) Stephens’ Detection of New Adverse Drug Reactions. (5th Edn) J. Wiley
and Sons, Chichester, 2004, pp379-451.
112. International Conference on Harmonisation (1994). Clinical safety data
management: definitions and standards for expedited reporting (ICH E2A)
International Conference on Harmonisation, Geneva, 25th October 1994.
113. International Conference on Harmonisation (2000). Clinical safety data
management: data elements for transmission of individual case safety reports
(ICH E2B) International Conferences on Harmonisation, Geneva, 10th November,
2000.
114. International Conference on Harmonisation (1996). Clinical safety data
management: periodic safety update reports for marketed drugs (ICH E2C)
International Conferences on Harmonisation, Geneva, 6th November 1996.
115. MHRA. Qualified persons for pharmacovigilance. Medicines and Healthcare
products Regulatory Agency. Available at:
http://www.mhra.gov.uk/Howweregulate/Medicines/Herbalandhomoeopathicmedi
cines/Herbalmedicines/PlacingaherbalmedicineontheUKmarket/TraditionalHerbal
MedicinesRegistrationScheme/Pharmacovigilance/Qualifiedpersons/index.htm
(Accessed: 26/05/09).
116. European Commission Guidance: Volume 9A of the rules governing medicinal
products in the European Union: Guidelines on Pharmacovigilance for medicinal
Products for Human Use Available at:
http://ec.europa.eu/enterprise/pharmaceuticals/eudralex/vol-9/pdf/vol9A_2007-
01.pdf . (Accessed: 20/5/09)
117. Medicines and Healthcare products Regulatory Agency, 2008. Commission on
Human Medicines (Online) Available at:
http://www.mhra,gov.uk/committees/medicinesadvisorybodies/commissiononhum
anmedicines/index.htm. (Accessed 15/5/09)
118. MHRA. Drug Safety Update. Available at:
http://www.mhra.gov.uk/Publications/Safetyguidance/DrugSafetyUpdate/index.ht
m. (Accessed 23/5/09)
244

119. Ernst, E., Resch,K.L. Risk-benefit ratio, risk-benefit nonsense. J Clin Epidemiol
1996;49(10):1203-1204.
120. Rawlins, M.D. Trading risk for benefit. In: Risk and Consent to Risk in Medicine.
Mann, R.D. (Ed), Parthenon Publishing group, Carnforth 1989; pp193-202.
121. Arlett, P.R. Risk benefit assessment. Pharmaceutical Physician 2001;12:12-17.
122. Atkin, P.A. and Shenfiled,G.M. medication related adverse reactions and the
elderly: a literature review. Adv Drug React Toxicol Rev 1995; 14(3): 175-191).
123. Einarson, W. Drug related hospital admissions. Ann Pharmacother 1993;27:832-
840.
124. Wiffen, P.,Gill,M., Edwards, J., Moore, A. Adverse drug reactions in hospital
patients – a systematic review of prospective and retrospective studies. Bandolier
Extra, 2002,June:1-15.
125. Pirmohamed, M., James, S., Meakin, S., Green, C., Scott, A.K., Walley, T.,
Farrar, K., Park, B. K., and Breckenridge, A . Adverse drug reactions as cause of
admission to hospital: prospective analysis of 18 820 patients. BMJ 2004;329:5–9
126. Kongkaew,C., Noyce, P.R. Ashcroft, D. Hospital admissions associated with
adverse drug reactions: a systematic review of prospective observational studies.
Ann Pharmacother 2008;42:1017-1025.
127. Lazarou, J., Pomeranz, B.H., Corey, P.N. Incidence of adverse drug reactions in
hospitalized patients: a meta-analysis of prospective studies. JAMA
1998;279(15):1200-1205.
128. Krähenbühl-Melcher, A., Schlienger, R., Lampert, M. Drug-related problems in
hospitals: a review of the recent literature. Drug Safety 2007;30(5):379–407.
129. Millar, J.S. Consultations owing to adverse drug reactions in a single practice. Br
J Gen Pract 2001;51:130–1.
130. Lumley, C.E., Walker, S.R., Staunton, N., Grob, P.R. The under-reporting of
adverse drug reactions seen in general practice. Pharm Med 1986;1:205-212.
131. DiMasi,J.A., Hansen,R.W.,Grabowski,H.G. The price of innovation: new
estimates of drug development costs. J Health Econ 2003;22:151-185.
245

132. Gittens, J. Quantitative methods in the planning of pharmaceutical research.
Drug Inf J 1996;30:479-487.
133. Rawlins, M.D. The challenge to pharmacoepidemiology. Pharmacoepidemiol Drug
Safety 1995;4: 5-10.
134. Oberholzer-Gee,F., Inamdar,S.N. Merck’s recall of rofecoxib – a strategic
perspective. New Eng J Med 2004;351(21):2147-2149.
135. Ahmed, P., Gardella, J., Nanda,S. Wealth effect of drug withdrawals on firms and their competitors. Financial Management 2002;31(3):21-41
136. Stephens, M. 1. Introduction. In: Stephens’ Detection of New Adverse Drug
Reactions (5th Edn) Talbot, J., Waller, P. (Eds) J.Wiley and Sons, Chichester,
2004, pp 1-90.
137. White, T. Counting the cost of drug-related adverse events. Pharmacoeconomics
1999;15(5): 445-458.
138. West, S., King V., Carey, T.S., Lohr, K.N., McKoy, N., Sutton SGF., Lux L.
Systems to rate the strength of scientific evidence. In: Evidence report /
technology assessment, AHRQ Publication No.02-E016, Agency for Healthcare
Research and Quality, Rockville, MD, 2002.
139. Schunemann, H.J., Fretheim, A., Oxman, A.D. Improving the use of research
evidence in guideline development, 9: grading evidence and recommendations.
Health Research Policy Systems 2006;4:21.
140. Sackett, D. L., Rosenberg, W. M., Gray, J. A.; Haynes, R. B. and Richardson, W.
S. Evidence Based Medicine: What It Is and What It Isn't. BMJ
1996;312(7023):71–72.
141. Gray, J.A.M. (1997) Evidence based health care. Churchill Livingstone, London,
1997, pp72-74.
142. Strom, B.L. Study designs available for pharmacoepidemiology studies. In: Strom,
B.L., Pharmacoepidemiology, 4th Edn. J.Wiley and Sons, Chichester, 2005, pp17-
28.
143. Phillips R., Ball,C., Sackett,D., Badenoch,D., Strauss,S., Haynes,B., Dawes,M.
Centre for Evidence Based Medicine: Levels of Evidence. March 2009. Available
from: http://www.cebm.net/index.aspx?o=1025 . (Accessed 19/3/10)
246

144. GRADE Working Group. Grading quality of evidence and strength of
recommendations. BMJ 2004;328;1490-1497.
145. Wang,J., Neuvonen,M., Wen,X., Bachman,J.T., Neuvonen,P.J. Gemfibrozil
Inhibits CYP2C8-Mediated Cerivastatin Metabolism in Human Liver Microsomes.
Drug Metab Disposit 2002:30(12):1352-1356.
146. Herbst, A.L., Ulfelder, H., Poskanzer, D.C. Adenocarcinoma of the vagina:
association of maternal stilbestrol therapy with tumour appearance in young
women. N Eng J Med 1971;284:878-881.
147. Joint Commission on Prescription Drug Use. Final Report. Washington, DC, 1980.
148. Mrakush, R.E., Seigel, D.G. Oral contraceptives and mortality trends from
thromboembolism in the United States. Am J Public Health 1969;59:418-434.
149. Strom, B.L., Stolley P.D. Vascular and cardiac risks of steroidal contraception. In
Sciarra, J.W. (Ed) Gynecology and Obstetrics Vol 6. Hagerstown, Harper and
Row, 1989, pp1-17.
150. Manson, J.E., Hsia, J., Johnson,K.C., Rossouw, J.E., Assaf, A.R., Lasser, N.L.
Estrogen plus progestin and the risk of coronary heart disease. N Eng J Med
2002;349:523-534.
151. Wilton, L.V., Stephens, M.D.B., Mann, R.D. Visual field defects in patients on long
term vigabatrin therapy. Pharamcoepidemiol Drug Saf 1997; 6(Suppl 2):S18. ).
152. Bombadier,C., Laine,L., Reicin,A. Comparison of upper gastrointestinal toxicity of
refecoxib and naproxen in patients with rheumatoid arthritis. N Eng J Med
2000;343:1520-1528.
153. Chalmers, T.C., Berrier, J., Hewitt, P., Berlin, J., Reitman, D., Nagalingam, R.
Meta-analysis of randomised controlled trials as a method of estimating rare
complications of non-steroidal anti-inflammatory agents. Aliment Pharmaco Ther
1988:2(S25):9-26.
154. Altman DG. Practical statistics for medical research. Chapman & Hall, London,
1991, pp 367-371.
155. Spriet-Pourra,C., Auriche,M. Drug Withdrawal from Sale (2nd Edn). Scrip Reports,
PJB Publications, 1994.
247

156. Bakke, O.M., Wardell, W.M., Lasagna, L. Drug discontinuations in the United
Kingdom and the United States, 1964 to 1983: issues of safety. Clin Pharmacol
Ther 1984;35(5):559-567.
157. Hass, A.E., Portale, D.E., Grossman, R.E. 1984 New drug introductions,
discontinuations and safety issues in the United Sates and the United Kingdom
1960-1982. Office of Planning and Evaluation, FDA, Washington, 1984.
158. Bakke, O.M., Manocchia,M., de Abajo,F., Kaitin,K.I., Lasgna, L. Drug safety
discontinuations in the United Kingdom, the United States, and Spain from 1974
through 1993: a regulatory perspective. Clin Pharmacol Ther 1995;58:108-117.
159. Fung,M., Thornton,A., Mybeck,K., Hsiao-Hui, J., Hornbuckle, K., Muniz,E.
Evaluation of the characteristics of safety withdrawal of prescription drugs from
worldwide pharmaceutical markets- 1960-1999. Drug Inf J 2001;35:293-317.
160. Fung, M., Kwong,K., Mockbee,C., Hornbuckle, K., Munioz, E. Analysis of the
occurrence of the Weber effect in spontaneous adverse event reporting.
Pharmacoepedemiol Drug Safety, 1999;8:S106.
161. Lexchin,J. Drug withdrawals from the Canadian market for safety reasons, 1963-
2004. Can Med Assoc J 2005;172(6):765-767.
162. Carpenter,D., Zucker,E.J., Avorn,J. Drug review deadlines and safety problems. N
Eng J Med 2008;358:1354-1361.
163. Wysowski,D.K., Swartz,L. Adverse drug event surveillance and drug withdrawals
in the United States, 1969-2002. Arch Intern Med 2005;165:1363-1369.
164. Arnaiz,J.A., Carne, X., Riba, N. The use of evidence in pharmacovigilance: case
reports as the reference source for drug withdrawals. Eur J Clin Pharmacol
2001;57:89-91.
165. Shojania, K.G., Duncan, B.W., McDonald, K. Safe but sound: Patient safety
meets evidence-based medicine. JAMA 288(4):508-513.
166. Andrews, E., Dombeck,M. The role of scientific evidence and risks and benefits in
determining risk management policies for medications. Pharamcoepidemiol Drug
Safety 2004;13:599-608.
167. Topol, E.J., Failing the public health – rofecoxib, Merck and the FDA. N Eng J
Med 2004;351(20):1707-9.
248

168. Kim, P.S., Reicin, A.S. Rofecoxib, Merck and the FDA. New Eng J Med
2004;351(27):2875-6.
169. Psaty, B.M., Furberg, C.D. COX-2 inhibitors – lessons in drug safety. New Eng J
Med 2005;352(11):1133-1135.
170. Okie, S. Safety in numbers – monitoring the risks of approved drugs. New Eng J
Med 2005;352(12):1173-6.
171. Smith, F. Chapter 2: Survey research: instruments, validity and reliability. In:
Research Methods in Pharmacy Practice, Smith,F. Pharmaceutical Press,
London, 2002, pp43-84.
172. Fallowfield, L. Questionnaire design. Arch Dis Child 1995;72:76-79.
173. Edwards,P., Roberts,I., Clarke, M., Di Guiseppe,C., Pratap, S., Wentz, R.
Increasing response rates to postal questionnaires: a systematic review. BMJ
2002;324(3):245-252.
174. Robson, C. Chapter 10: Tests and rating scales. In: Real World Research,
Robson, C. Blackwell Publishing, Oxford, 2002, p293.
175. Burns, K., Duffet, M., Kho, M., Meade, M., Adhikari, N., Sinuff, T. A guide for the
design and conduct of self-administered surveys of clinicians. Can Med Assoc J
2008;179(3):245-252.
176. Oppenheim, A.N., Questionnaire design, interviewing and attitude measurement.
London, Pinter, 1999.
177. Smith, J.A. Beyond the divide between cognition and discourse: using
interpretative phenomenological analysis in health psychology. Psychol Health
1996;11:261-271.
178. Ely, M., Vinz, R., Downing, M., Anzul, M. On writing qualitative research: living by
words. London, 1997, Routledge Falmer.
179. Karsch,F.E., Smith,C.L., Kerzner,B., Mazzullo,J.M., Weintraub,M., Lasgna,L.
Adverse drug reactions – a matter of opinion. Clin Pharmacol Ther 1976;19:489-
492.
180. Arimone,Y., Miremont-Saleme,G., Haramburu,F.,Molimard,M., Moore,N.,
Fourrier-Reglat,A., Begoud,B. Inter-expert agreement of seven criteria in
249

181. Breckenridge,A., Woods,K., Raine,J. Monitoring the safety and licensed
medicines. Nature Reviews Drug Discovery 2005;4:541-3.
182. Cox,A., Davies,E. Pharmacovigilance is for everyone. Pharmaceutical Journal
2009;283:14.
183. Waller P.C., Evans,J.W. A model for the future conduct of pharmacovigilance.
Pharmacoepidiol Drug Safety 2003;12:17-9.
184. Moore,N., Beguad, B. Improving pharmacovigilance in Europe. BMJ
2010;340:821-2.
185. Medawar,C., Herxheimer,A., Bell,A., Jofre,S. Paroxetine, Panorama and user
reporting of ADRs: consumer intelligence matters in clinical practice and post-
marketing drug surveillance. Int J Risk Safety Med 2002;15:161-9.
186. Blenkinsopp,A., Wilkie,P., Wang,M., Routledge,P.A. Patient reporting of
suspected adverse drug reactions: a review of published literature and
international experience. Br J Clin Pharmacol 2006;63(2):148-156.
187. GRADE Working Group. Grading quality of evidence and strength of
recommendations. BMJ 2004; 328:1490-7.
188. Guyatt GH., Oxman AD., Vist GE., Kunz R., Falck-Ytter Y., Alonso-Coello P.,
Schunemann HJ. GRADE: an emerging consensus on rating quality of evidence
and strength of recommendations. BMJ 2008;336:924-6.
189. Humphrey,L.L., Chan, B.K., Sox, H.C. Postmenopausal hormone replacement
therapy and the primary prevention of cardiovascular disease. Ann Intern Med
2002; 137: 273-284.
190. Hulley,S., Grady,D., Bush,T., Furberg,C., Herrington,D., Riggs, B. Randomised
trial of progestin for secondary prevention of heart disease in post-menopausal
women. Heart and Estrogen Replacement Study (HERS) Research Group. JAMA
1998;280:605-613.
191. Roussow,J.E., Anderson,G.L., Prentice, R.L., La Croix,A.Z., Kooperberg,C,
Stefanick,M.L. Risks and benefits of estrogen plus progestin in healthy
250

192. Aronson,K.K., Hauben,M. Anecdotes that provide definitive evidence. BMJ
2006;33:1267-9.
193. Schunneman, H.G., Oxman,A.D., Brozek,J., Glasziou,P., Bossuyt,P., Chang,S.,
Muti,P., Jaeschke,R., Guyatt,G. GRADE: assessing the quality of evidence for
diagnostic recommendations. Evidence Based Med 2008;13:162-163.
194. Rawlins M. Harevian Oration: De testimonio: on the evidence for decisions about
the use of therapeutic interventions. Lancet 2008;372:2152-61.
195. Wald NJ, Morris JK Teleoanalysis: combining data from different types of study.
BMJ 2003; 327: 616-618.
196. Freemantle N., Irs A. Observational evidence for determining drug safety is no
substitute for evidence from randomised controlled trials. BMJ 2008;336:627-8.
197. Burnard P. (1991) A method of analysing interview transcripts in qualitative
research. Nurse Education Today 1991;11 461-466.
198. Ritchie, J., Spencer, L., O’Connor, W. Carrying out qualitative analysis. In
Ritchie, J., Lewis, J. (Eds) Qualitative Research Practice: a guide for social
science students and researchers. London, Sage, 2003, pp219-262.
199. Spencer, L., Ritchie, J., O’Connor, W. Analysis: practices, principles and
processes. In: Ritchie, J., Lewis, J. (Eds) Qualitative Research Practice: a guide
for social science students and researchers. London, Sage, 2003, pp199-218.
200. Lambert, S.D., Loiselle, C.G. (20078) Combining individual interviews and focus
groups to enhance data richness. J Advanced Nursing 2007:62(2):228-237.
201. Morse, J.M., Richards, L. Readme first for a user’s guide to qualitative methods.
London, Sage, 2002.
202. Smith, J.A. Semi-structured interviewing and qualitative analysis. In Smith, J.A.,
Harre, R., Van Langenhove, L. (Eds) Rethinking methods in psychology. London,
Sage, 2005, pp9-26.
203. Krueger,R.A.. Focus groups. A practical guide for applied research. 2nd Edn.
London, Sage 1994.
251

252
204. Smith, J.A., Flowers, P., Larkin, M. Interpretive phenomenological analysis –
theory method and research. London, Sage, 2009.
205. Litosseliti, L. Using focus groups in research. London, Continuum,2003.
206. Krueger, R.A. Focus groups. A practical guide for applied research. (2nd Edn).
London, Sage, 1994.
207. Brocki, J.M., Wearden, A.J. A critical evaluation of the use of interpretative
phenomenological analysis (IPA) in health psychology. Psychol. Health
2006;21(1):87-108.
208. University of Portsmouth MSc in Pharmacovigilance: in collaboration with the
Drug safety Research Unit. Course Documentation, University of Portsmouth,
Portsmouth, September 2010.

Appendix 1. Questionnaire and cover letter
sent to selected pharmaceutical companies seeking information
on their products. 253

A longitudinal study of changes made to the labelling of UK medicinal products prompted by adverse drug reactions (ADRs). To: Medical Information Manager Date (COMPANY NAME AND ADDRESS) Dear sir / madam Re: (PRODUCT BRAND NAME – GENERIC - AND STRENGTH) The University of Portsmouth School of Pharmacy and the Drug Safety Research Unit, Bursledon, Hampshire are conducting a survey of the frequency and timing of product withdrawals and labelling changes necessitated by adverse events. The impact of such changes to marketed products can be far-reaching for producers, healthcare professionals and patients alike and it is important that decisions are based on sound evidence. The aim of our industry-wide study is to examine the strength of evidence used to support the changes to products marketed in the UK in a ten-year period (September 1995 – 2005), covering the product mentioned above. We also hope to construct a predictive model for new product launches using survival analysis techniques. This project has received a favourable opinion from the University of Portsmouth Science Faculty Research Ethics Committee. Could you therefore help us by completing the attached questionnaire on the product mentioned above in the light of the product changes cited below: Labelling or product status change(s) made:
Reference(s)

Q1. When was the product first licensed for use in the UK? (please give exact date where possible) Day……… Month ………. Year ……….. Q2. When was the product launched in the UK? (please give exact launch date if known)
Day……… Month ………. Year ……….. Q3. When was the above labelling change or drug withdrawal decision made? (please give exact date where possible) Day……… Month ………. Year ……….. Q4. When was the labelling change or withdrawal decision implemented? (please give exact date where possible) Day……… Month ………. Year ……….. Q5. Precisely what changes were required?
Product withdrawal in UK Product withdrawal worldwide Product withdrawal in UK and some other countries but not all
If not withdrawn, which of the following sections of the SPC were changed (tick any that apply):
Indications / uses Dosing instructions Contraindications Interactions Pregnancy / lactation Warnings / precautions Undesirable effects Overdosage Formulation details Other – please state below.
………………………………………………………………………………………………………………………………………………………………………………
Continued……..

Q6. Who initiated the change? (tick any that apply)
UK Regulatory authority The EMEA The EMEA after receiving a ‘reasoned opinion’ from the CPMP
US or other nationality parent company Your UK Company Your Medical Division Your Marketing Division Your Regulatory Affairs Division Other - please state below ………………………………………………………………………………………………………………………………………………………………………………………………….. Q7. Who made the withdrawal / labelling change decision? Your company. The UK regulatory authority Your company and the UK Regulatory Authority together. Q8. What type of adverse event data underpinned the withdrawal / labelling change? (tick any that apply)
Signal from re-analysis of the results from double-blind, placebo controlled trials conducted pre-marketing.
Signal from results from double-blind, placebo controlled trials
conducted post-marketing in the UK.
Signal from results from double-blind, placebo controlled trials conducted post-marketing outside the UK.
Meta-analysis of existing trials data.
Meta-analysis of new trial data.
In-house, systematic risk versus benefit analysis
Published case-studies.
In-house case studies.
As a result of a periodic safety update report (PSUR).
Continued……………..

Signal from spontaneous reports from pharmacovigilance conducted in-house.
Signal from spontaneous reports from MHRA yellow card data.
Signal from spontaneous reports from the FDA (Medwatch).
Signal from pharmacovigilance by the DSRU (green card data.)
Signal from pharmacovigilance by other post-marketing
surveillance organisations. (Please identify below).
…………………………………………………………………………………………………………………………………………………………………………………………………………………………………………………………………………………………………………………………………………
MCA-sponsored labelling change to all products of the same class.
Other (please state below) ………………………………………………………………………………………………………………………………………………………………………………………………………………………………………………………………………………………………………………………………………………………………
Q9. Was the evidence used as a basis for the labelling change / withdrawal in the public domain?
No Yes partially Yes completely
If ‘yes partially’ or ‘yes completely’, please give publication(s) details (e.g. authors, journal, year, volume, pages) below. …………………………………………………………………………………………………………………………………………………………………………………………………………………………………………………………………………………………………………………………………………
Continued………

Q10. Apart from safety concerns, what other factors contributed significantly to the withdrawal / labelling change decision? (please tick any that apply). Legal considerations Financial considerations Ethical considerations The Company’s good standing The wish to continue supplying patients deriving clear benefit. Other (please state below)
……………………………………………………………………………………………………………………………………………………………………………………………………………………………………………………………………………………… Q11. CONSIDERING THE PRODUCT IN QUESTION. What is your opinion of withdrawal or the labelling change made? A major improvement to patient safety. A minor improvement to patient safety. An over-reaction to the available evidence. An under-reaction to the available evidence. The change should have been applied to all drugs in the same class. Other comments ……………………………………………………………………………………………………………………………………………………………………………………………………………………………………………………………………………………………… Q12. CONSIDERING THE PRODUCT IN QUESTION AND THE LABELLING CHANGE(S) MADE: What is your Company’s overall assessment of evidence on which the labelling change was based? (tick one box only) Wholly inadequate signal –change was unjustified
Weak signal – partially justified the change Strong signal – change justified but with reservations Very strong signal – change totally justified Other – please comment
………………………………………………………………………………………………………………………………………………………………………………………………………………………………………………………………………
Continued……..

Q13. Subsequent to the labelling change, what is the current status of the product? (tick any that apply)
Product continues to be marketed in the UK with labelling change in place.
Product continues to be marketed in other countries with labelling changes in place.
Product withdrawn permanently in the UK. Product continues to be marketed in other countries unchanged.
Product withdrawn permanently worldwide. Product suspended in the UK pending an appeal on existing
safety data. Product suspended in the UK pending generation of additional
safety data from new trials followed by appeal. Other – please comment.
………………………………………………………………………………………………………………………………………………………………………………………………………………………………………………………………………
Q14. It may be necessary to follow up the information supplied in this questionnaire for clarification or expansion. If you are willing to participate, please provide contact details below.
Name ……………………………………. Contact telephone no……………………. E-mail address………………………….. THANKYOU FOR YOUR TIME. PLEASE RETURN THE COMPLETED QUESTIONNAIRE IN THE ENCLOSED REPLY-PAID ENVELOPE, OR TO: AMY TANG, C/O PROF. DAVID BROWN, SCHOOL OF PHARMACY AND BIOMEDICAL SCIENCES, UNIVERSITY OF PORTSMOUTH, ST MICHAEL’S BUILDING, WHITE SWAN RD, PORTSMOUTH, HANTS. PO1 2DT.
Appendix 2.
Piloted web-based questionnaire and sample cover note.
254

Subject: Questionnaire on the Drug Safety Data Base - What Are Your Views?
Dear PIPA Members The School of Pharmacy, University of Portsmouth and the Drug Safety Research Unit, Southampton are conducting research into factors that influence medicinal product withdrawals or major labelling changes in the UK. This is with the aim of improving transparency and equity of the process as it relates to drug safety. We have designed a questionnaire to help us do this. The aim of the questionnaire is to investigate, compare and contrast the views of various stake holders who are involved in decisions affecting the use and marketing of licensed medicinal products in the UK. As a PIPA member, working in the related field, you are among the professionals from whom we would like to hear. PIPA has supported us contacting you. Your response would be appreciated. Here is a link to the survey: http://www.surveymonkey.com/s.aspx?sm=9Rk5I78NrRSU7s4pwS1nXQ_3d_3d If you feel you are not the most appropriate person to complete this survey, please forward this message to the one who is in your organisation. If you feel that you are unable to answer any question, please omit it and go on to the next question. The questionnaire is divided into three parts. Part One asks for some demographic detail; Part Two asks for your views on the safety evidence base on which withdrawal or labelling changes might take place, and Part Three presents seven safety scenarios, synthesised from actual cases studied in our research, to help us gain an insight into how you would handle such occurrences. The questionnaire should take about 20 minutes to complete; but please take as much time as you can to answer our questions, particularly Stage 3. There is an opportunity for you to provide additional comment in the spaces provided. Please be assured that your replies will be treated with the strictest confidence and there will be no way of linking individuals with their comments in the final project report. By completing the questionnaire it is assumed that you have consented to participate. If at any time you change your mind, contact us and we will remove your contribution from the analysis without prejudice. This study has been approved by the University of Portsmouth Schools of Pharmacy and Sport and Exercise Science Ethics Committee (Reference # FT/08/0065). Many thanks for your participation,

Ms Amy Tang, PhD Researcher, C/O PROF. DAVID BROWN, SCHOOL OF PHARMACY AND BIOMEDICAL SCIENCES, UNIVERSITY OF PORTSMOUTH, ST MICHAEL’S BUILDING, WHITE SWAN RD, PORTSMOUTH, HANTS. PO1 2DT.

Page 1
Questionnaire on the Drug Safety Data Base - What Are Your Views?Questionnaire on the Drug Safety Data Base - What Are Your Views?Questionnaire on the Drug Safety Data Base - What Are Your Views?Questionnaire on the Drug Safety Data Base - What Are Your Views?
Part 1. This section asks for some information about you.
1.1 What type of organisation do you work for?
1.2 What are your key roles within your organisation? ( Please tick any that apply)
1. Default Section
*
*
Academic
nmlkj
Government Regulatory
nmlkj
Independent Consultancy
nmlkj
Practising Healthcare Professional
nmlkj
Pharmaceutical Industry
nmlkj
Independent Advsiory Committee
nmlkj
Professional Society ( e.g. RCGP, RPSGB)
nmlkj
Other (please specify below)
nmlkj
Pharmacovigilance/Drug Safety
gfedc
Provision of medical information
gfedc
Preparation of marketing authorisations
gfedc
Regulatory Affairs
gfedc
Sales and Marketing
gfedc
Product research and development
gfedc
Clinical trials
gfedc
Marketing authorisation assessor
gfedc
Ethics committee member
gfedc
Manager
gfedc
Direct provision of patient care
gfedc
Lay / patient
gfedc
Other (please specify)
gfedc
Other

Page 2
Questionnaire on the Drug Safety Data Base - What Are Your Views?Questionnaire on the Drug Safety Data Base - What Are Your Views?Questionnaire on the Drug Safety Data Base - What Are Your Views?Questionnaire on the Drug Safety Data Base - What Are Your Views?1.3 What is your profession?
1.4 Please indicate the number of years you have been in you current role:
1.5 For industry based respondents, please indicate the nature of the company you work for.
*
*
Doctor
gfedc
Pharmacist
gfedc
Nurse
gfedc
Information Scientist
gfedc
Scientist with a biomedical background
gfedc
Statistician
gfedc
Other (please specify)
gfedc
1-5 years
nmlkj
6-10 years
nmlkj
11-15 years
nmlkj
16-20 years
nmlkj
>20 years
nmlkj
Other (please specify)
nmlkj
UK affilliate of a multi-national
gfedc
UK global HQ
gfedc
Other (please specify)
gfedc
Other

Page 3
Questionnaire on the Drug Safety Data Base - What Are Your Views?Questionnaire on the Drug Safety Data Base - What Are Your Views?Questionnaire on the Drug Safety Data Base - What Are Your Views?Questionnaire on the Drug Safety Data Base - What Are Your Views?
Part 2. This section asks for your opinions on a range of drug safety issues
2.1 What sources of information do you commonly use when investigating a drug safety issue? (Please tick any that apply).
2. Drug Safety Opinions
*
Yellow card spontaneous reports (UK)
gfedc
Spontaneous reports from non-UK regulatory agency databases
gfedc
Your corporate drug safety database
gfedc
Unpublished clinical trial reports
gfedc
Results from prescription event monitoring studies
gfedc
Period Safety Update Reports (PSURs)
gfedc
BNF (British National Formulary)
gfedc
SmPC (Summary of Medicinal Product Characteristic)
gfedc
Martindale
gfedc
Meyler's Side Effects of Drugs
gfedc
Stockley's Textbook of Drug Interactions
gfedc
Physicians' Desk Reference
gfedc
Briggs, Drugs in Pregnancy and Lactation
gfedc
MHRA Drug Safety Updates (formerly ‘Current Problems’)
gfedc
Global Clinical Literature e.g. Lancet/BMJ/JAMA
gfedc
Specialised journals, e.g. ‘Reactions’
gfedc
Reports from the popular media
gfedc
Other (please specify below)
gfedc

Page 4
Questionnaire on the Drug Safety Data Base - What Are Your Views?Questionnaire on the Drug Safety Data Base - What Are Your Views?Questionnaire on the Drug Safety Data Base - What Are Your Views?Questionnaire on the Drug Safety Data Base - What Are Your Views?2.2 Please indicate your perception of importance of the following factors that might influence the decision to withdraw a product on safety grounds.
*
Unimportant of Minor Importance of Major Importance of Utmost Importance
Availability of satisfactory
alternative therapynmlkj nmlkj nmlkj nmlkj
Number of patients
eligible to receive the
drug
nmlkj nmlkj nmlkj nmlkj
Existence of a credible
unfavourable risk vs
benefit analysis
nmlkj nmlkj nmlkj nmlkj
The clinical consequences
of not withdrawing the
product (e.g. more ADRs)
nmlkj nmlkj nmlkj nmlkj
The legal consequences
of not withdrawing the
product (e.g. litigation by
affected patients)
nmlkj nmlkj nmlkj nmlkj
Financial pressures to
continue marketingnmlkj nmlkj nmlkj nmlkj
A wish to safeguard
patient healthnmlkj nmlkj nmlkj nmlkj
The wish to continue to
supply patients deriving
clear benefit from the
product
nmlkj nmlkj nmlkj nmlkj
Ethical considerations nmlkj nmlkj nmlkj nmlkj
The good standing of the
companynmlkj nmlkj nmlkj nmlkj
The good standing of the
National Health Servicenmlkj nmlkj nmlkj nmlkj
Other (please specify and provide importance ranking below)

Page 5
Questionnaire on the Drug Safety Data Base - What Are Your Views?Questionnaire on the Drug Safety Data Base - What Are Your Views?Questionnaire on the Drug Safety Data Base - What Are Your Views?Questionnaire on the Drug Safety Data Base - What Are Your Views?2.3 It has been suggested that Gray’s hierarchy of evidence might be used to grade the quality of ADR data on which regulatory decisions are made.The levels of evidence is described below (adapted from Gray’s Hierarchy of Levels of Evidence in evidence based practice).*Gray JA , Evidence-Based Health Care. Churchill Livingstone, Edinburgh. 1997; page 72-74
Description
Level 1: Evidence obtained from systematic reviews of relevant and multiple randomised controlled trials (RCTs) and meta analyses of RCTs
Level 2: Evidence obtained from at least one well designed RCT
Level 3: Evidence obtained from well designed non-randomised controlled trials, single group pre-post, cohort, time series or matched experimental studies
Level 4: Evidence obtained from well designed non-experimental research from more than one centre or research group
Level 5: Opinion of respected authorities based on clinical experience, descriptive studies or reports of expert committees
Extremely
DissatisfiedPartially Dissatisfied Partially Satisfied
Completely
Satisfied
How would you rate your level of overall satisfaction
with using Gray’s hierarchy to grade the quality of
ADR data you encounter? (please tick one number)
nmlkj nmlkj nmlkj nmlkj
Other

Page 6
Questionnaire on the Drug Safety Data Base - What Are Your Views?Questionnaire on the Drug Safety Data Base - What Are Your Views?Questionnaire on the Drug Safety Data Base - What Are Your Views?Questionnaire on the Drug Safety Data Base - What Are Your Views?2.4 How would you rank the levels of evidence IN A DRUG SAFETY CONTEXT of the following types of data? (Please rank on a scale of 1-5, where 1 represents the highest level of evidence and 5 represents the lowest level).
2.5 What would be your personal preference(s) for ways of improving the quality of drug safety evidence? (tick any that apply)
1 2 3 4 5
Yellow card reports (UK) nmlkj nmlkj nmlkj nmlkj nmlkj
Medwatch reports (US) nmlkj nmlkj nmlkj nmlkj nmlkj
Other, spontaneous reports (e.g.
EMEA)nmlkj nmlkj nmlkj nmlkj nmlkj
Prescription event monitoring reports nmlkj nmlkj nmlkj nmlkj nmlkj
Pharmaceutical Company risk vs
benefit analysesnmlkj nmlkj nmlkj nmlkj nmlkj
Published UK RCTs conducted post-
marketingnmlkj nmlkj nmlkj nmlkj nmlkj
Published Non-UK RCTs nmlkj nmlkj nmlkj nmlkj nmlkj
Published meta-analyses of trial data nmlkj nmlkj nmlkj nmlkj nmlkj
Published individual case studies nmlkj nmlkj nmlkj nmlkj nmlkj
Published case series nmlkj nmlkj nmlkj nmlkj nmlkj
Published case control studies nmlkj nmlkj nmlkj nmlkj nmlkj
Published epidemiological studies nmlkj nmlkj nmlkj nmlkj nmlkj
MHRA Drug Safety Updates nmlkj nmlkj nmlkj nmlkj nmlkj
Company Periodic Safety Update
Reports.nmlkj nmlkj nmlkj nmlkj nmlkj
Other (please specify and provide ranking) Please add comments on your level of comfort with doing this if you wish.
Product - specific analysis and reporting by a NICE safety sub-group.
gfedc
A provisional licensing scheme
gfedc
Independent safety study group (i.e. not the Regulator / Pharmaceutical Company)
gfedc
Subject all new drugs to prescription event monitoring
gfedc
Other (please specify)
gfedc
Other

Page 7
Questionnaire on the Drug Safety Data Base - What Are Your Views?Questionnaire on the Drug Safety Data Base - What Are Your Views?Questionnaire on the Drug Safety Data Base - What Are Your Views?Questionnaire on the Drug Safety Data Base - What Are Your Views?
Part 3. This section contains seven hypothetical drug safety scenarios constructed from our research into the subject over the last ten years. What is presented equates to the sum total of safety evidence available for each product, discovered post-marketing. Note that in all cases, sufficient efficacy data was available to warrant granting a marketing authorisation (MA) initially.
Please read through each case and answer the questions. The questions are similar for each scenario. Please remember this is not a test – we want to find out what you FEEL should happen in the light of the evidence provided.
SCENARIO 1 Product : ACE Inhibitor, fourth in class, indicated for hypertension and heart failure.
Background: in clinical use in the UK for one year. Estimated UK patient exposure is 10,000 patients.
New safety data: UK yellow card scheme inidcates 3 cases of hiccups at recommended doses, all of which resolve when therapy is withdrawn.
3.1.1 CONSIDERING THE PRODUCT IN QUESTION. What action(s) should be taken with respect to the UK product in this scenario? (tick any that apply)
3. Drug Safety Scenarios
*
No changes are required.
gfedc
Product labelling should not be changed until further reports are received.
gfedc
Product should be withdrawn from the UK market.
gfedc
Product should be suspended pending further data analysis.
gfedc
Product information should be amended to indicate the possibility of hiccups.
gfedc
Restrict to specialist use.
gfedc
ADR should be the topic of a ‘Dear Doctor’ letter from the MHRA.
gfedc
ADR should be featured in the next ‘Drug Safety Update’ from the MHRA.
gfedc
ADR should be the subject of a ‘blue box’ warning in the BNF.
gfedc
Product should be made subject to special yellow card reporting.
gfedc
A general PEM (green card) study on the product should be commissioned.
gfedc
Other (please specify and justify the answer you have given to this question)
gfedc

Page 8
Questionnaire on the Drug Safety Data Base - What Are Your Views?Questionnaire on the Drug Safety Data Base - What Are Your Views?Questionnaire on the Drug Safety Data Base - What Are Your Views?Questionnaire on the Drug Safety Data Base - What Are Your Views?3.1.2 Using the numbering system for Gray's hierarchy of evidence shown in below, circle the highest level which you consider best describes the "new safety data" presented in scenario 1.
Description
Level 1: Evidence obtained from systematic reviews of relevant and multiple randomised controlled trials (RCTs) and meta analyses of RCTs
Level 2: Evidence obtained from at least one well designed RCT
Level 3: Evidence obtained from well designed non-randomised controlled trials, single group pre-post, cohort, time series or matched experimental studies
Level 4: Evidence obtained from well designed non-experimental research from more than one centre or research group
Level 5: Opinion of respected authorities based on clinical experience, descriptive studies or reports of expert committees
*
1 2 3 4 5
Level: nmlkj nmlkj nmlkj nmlkj nmlkj
Other

Page 9
Questionnaire on the Drug Safety Data Base - What Are Your Views?Questionnaire on the Drug Safety Data Base - What Are Your Views?Questionnaire on the Drug Safety Data Base - What Are Your Views?Questionnaire on the Drug Safety Data Base - What Are Your Views?
SCENARIO 2 Product : first in class, anticonvulsant.
Background: granted a MA five years ago in the UK. Indicated as add-on therapy in children aged 2-12 years and in adults as monotherapy or in combination. MHRA has established from clinical trial and post-marketing studies, that about 1 in 1000 adults develop serious skin reactions, including Stevens-Johnson syndrome and toxic epidermal necrolysis.New safety data: Recent information from a presciption event monitoring study suggests that the risk of serious skin reactions is higher in children ( 1 in 100-300); 11 yellow card reports have been received, in which the majority required hospitalisation. Four of these cases were prescribed higher than the recommended dose. There have been "rare" fatalities.
3.2.1 CONSIDERING THE PRODUCT IN QUESTION. What action(s) should be taken with respect to the UK product in this scenario? (tick any that apply)
4. SCENARIO 2
*
No changes are required.
gfedc
Product labelling should not be changed until further reports are received.
gfedc
Product should be withdrawn from the UK market.
gfedc
Product should be suspended pending further data analysis.
gfedc
Product should be contrainidcated in children less than 12 years old.
gfedc
Restrict to specialist use.
gfedc
ADR should be the topic of a ‘Dear Doctor’ letter from the MHRA.
gfedc
ADR should be featured in the next ‘Drug Safety Update’ from the MHRA.
gfedc
ADR should be the subject of a ‘blue box’ warning in the BNF.
gfedc
Product should be made subject to special yellow card reporting.
gfedc
A general PEM (green card) study on the product should be commissioned.
gfedc
Other (please specify and justify the answer you have given to this question)
gfedc

Page 10
Questionnaire on the Drug Safety Data Base - What Are Your Views?Questionnaire on the Drug Safety Data Base - What Are Your Views?Questionnaire on the Drug Safety Data Base - What Are Your Views?Questionnaire on the Drug Safety Data Base - What Are Your Views?3.2.2 Using the numbering system for Gray's hierarchy of evidence shown in below, circle the highest level which you consider best describes the "new safety data" presented in scenario 2.
Description
Level 1: Evidence obtained from systematic reviews of relevant and multiple randomised controlled trials (RCTs) and meta analyses of RCTs
Level 2: Evidence obtained from at least one well designed RCT
Level 3: Evidence obtained from well designed non-randomised controlled trials, single group pre-post, cohort, time series or matched experimental studies
Level 4: Evidence obtained from well designed non-experimental research from more than one centre or research group
Level 5: Opinion of respected authorities based on clinical experience, descriptive studies or reports of expert committees
*
1 2 3 4 5
Level: nmlkj nmlkj nmlkj nmlkj nmlkj
Other

Page 11
Questionnaire on the Drug Safety Data Base - What Are Your Views?Questionnaire on the Drug Safety Data Base - What Are Your Views?Questionnaire on the Drug Safety Data Base - What Are Your Views?Questionnaire on the Drug Safety Data Base - What Are Your Views?
SCENARIO 3Product: monoclonal antibodyBackground: given a MA through the common multi-state procedure 2 years ago and has been marketed in the UK and the US for 2 years. In a published, 1 year, open-label study of 5,000 patients, the drug was safe and well tolerated in the licensed indication for the treatment of serious rheumatoid arthritis. Among 1,000 patients in a published placeo-controlled US trial, adverse events occurred in 7% of patients treated with the drug compared to 3% in the placebo. The SPC states that if an increase in liver function tests is observed the drug should be used with caution.
New safety data: US spontaneous reports have revealed five "recent" cases of fulminant liver toxicity, including one death and two requiring liver transplant, plus a further 50 reports of markedly increase liver enzymes persisting after drug withdrawal.
3.3.1 CONSIDERING THE PRODUCT IN QUESTION. What action(s) should be taken with respect to the UK product in this scenario? (tick any apply)
5. SCENARIO 3
*
No changes are required.
gfedc
Product labelling should not be changed until further reports are received.
gfedc
Product should be withdrawn from the UK market.
gfedc
Product should be suspended pending further data analysis.
gfedc
Product should be contrainidcated with existing hepatic abnormalities.
gfedc
Restrict to specialist use.
gfedc
ADR should be the topic of a ‘Dear Doctor’ letter from the MHRA.
gfedc
ADR should be featured in the next ‘Drug Safety Update’ from the MHRA.
gfedc
ADR should be the subject of a ‘blue box’ warning in the BNF.
gfedc
Product should be made subject to special yellow card reporting.
gfedc
A general PEM (green card) study on the product should be commissioned.
gfedc
Other (please specify and justify the answer you have given to this question)
gfedcOther

Page 12
Questionnaire on the Drug Safety Data Base - What Are Your Views?Questionnaire on the Drug Safety Data Base - What Are Your Views?Questionnaire on the Drug Safety Data Base - What Are Your Views?Questionnaire on the Drug Safety Data Base - What Are Your Views?3.3.2 Using the numbering system for Gray's hierarchy of evidence shown in below, circle the highest level which you consider best describes the "new safety data" presented in scenario 3.
Description
Level 1: Evidence obtained from systematic reviews of relevant and multiple randomised controlled trials (RCTs) and meta analyses of RCTs
Level 2: Evidence obtained from at least one well designed RCT
Level 3: Evidence obtained from well designed non-randomised controlled trials, single group pre-post, cohort, time series or matched experimental studies
Level 4: Evidence obtained from well designed non-experimental research from more than one centre or research group
Level 5: Opinion of respected authorities based on clinical experience, descriptive studies or reports of expert committees
*
1 2 3 4 5
Level: nmlkj nmlkj nmlkj nmlkj nmlkj

Page 13
Questionnaire on the Drug Safety Data Base - What Are Your Views?Questionnaire on the Drug Safety Data Base - What Are Your Views?Questionnaire on the Drug Safety Data Base - What Are Your Views?Questionnaire on the Drug Safety Data Base - What Are Your Views?
SCENARIO 4Product: new therapy for the treatment of attention deficit/hyperactivity disorder in children 6 years and older.Background: granted a MA in the UK one year ago. Also available in other countries, with worldwide exposure at 2.5 million.New safety data: Worldwide, 41 spontaneous reports of hepatic disease worldwide, including 2 of hepatitis; three reports in the UK yellow card data, including hepatitis, jaundice and elevated bilirubin levels. No fatalities reported.
6. SCENARIO 4
*
No changes are required.
gfedc
Product labelling should not be changed until further reports are received.
gfedc
Product should be withdrawn from the UK market.
gfedc
Product should be suspended pending further data analysis.
gfedc
Product should be amended to contrainidcate with existing hepatic disease.
gfedc
Restrict to specialist use.
gfedc
ADR should be the topic of a ‘Dear Doctor’ letter from the MHRA.
gfedc
ADR should be featured in the next ‘Drug Safety Update’ from the MHRA.
gfedc
ADR should be the subject of a ‘blue box’ warning in the BNF.
gfedc
Product should be made subject to special yellow card reporting.
gfedc
A general PEM (green card) study on the product should be commissioned.
gfedc
Other (please specify and justify the answer you have given to this question)
gfedc

Page 14
Questionnaire on the Drug Safety Data Base - What Are Your Views?Questionnaire on the Drug Safety Data Base - What Are Your Views?Questionnaire on the Drug Safety Data Base - What Are Your Views?Questionnaire on the Drug Safety Data Base - What Are Your Views?3.4.2 Using the numbering system for Gray's hierarchy of evidence shown in below, circle the highest level which you consider best describes the "new safety data" presented in scenario 4.
Description
Level 1: Evidence obtained from systematic reviews of relevant and multiple randomised controlled trials (RCTs) and meta analyses of RCTs
Level 2: Evidence obtained from at least one well designed RCT
Level 3: Evidence obtained from well designed non-randomised controlled trials, single group pre-post, cohort, time series or matched experimental studies
Level 4: Evidence obtained from well designed non-experimental research from more than one centre or research group
Level 5: Opinion of respected authorities based on clinical experience, descriptive studies or reports of expert committees
*
1 2 3 4 5
Level nmlkj nmlkj nmlkj nmlkj nmlkj

Page 15
Questionnaire on the Drug Safety Data Base - What Are Your Views?Questionnaire on the Drug Safety Data Base - What Are Your Views?Questionnaire on the Drug Safety Data Base - What Are Your Views?Questionnaire on the Drug Safety Data Base - What Are Your Views?
SCENARIO 5Product: new gene therapy product for children with muscular dystrophy.Background: has been licensed in the UK for 6 months. Granted an MA through the common multi-state procedure. New safety data: published epidemiological study indicates complications following treatment in 1 in 100 patients. Worldwide there are 55 spontaneous reports of serious hepatic reactions. The risk was found to be higher aming patients who received higher doses. Post marketing surveillance from UK yellow card data shows 2 deaths and 3 prolonged hospitalisations.
3.5.1 CONSIDERING THE PRODUCT IN QUESTION. What action(s) should be taken with respect to the UK product in this scenario? ( tick any that apply)
7. SCENARIO 5
*
No changes are required.
gfedc
Product labelling should not be changed until further reports are received.
gfedc
Product should be withdrawn from the UK market.
gfedc
Product should be suspended pending further data analysis.
gfedc
Product should be contrainidcated with existing hepatic abnormalities.
gfedc
Restrict to specialist use.
gfedc
ADR should be the topic of a ‘Dear Doctor’ letter from the MHRA.
gfedc
ADR should be featured in the next ‘Drug Safety Update’ from the MHRA.
gfedc
ADR should be the subject of a ‘blue box’ warning in the BNF.
gfedc
Product should be made subject to special yellow card reporting.
gfedc
A general PEM (green card) study on the product should be commissioned.
gfedc
Other (please specify and justify the answer you have given to this question)
gfedc

Page 16
Questionnaire on the Drug Safety Data Base - What Are Your Views?Questionnaire on the Drug Safety Data Base - What Are Your Views?Questionnaire on the Drug Safety Data Base - What Are Your Views?Questionnaire on the Drug Safety Data Base - What Are Your Views?3.5.2 Using the numbering system for Gray's hierarchy of evidence shown in below, circle the highest level which you consider best describes the "new safety data" presented in scenario 5.
Description
Level 1: Evidence obtained from systematic reviews of relevant and multiple randomised controlled trials (RCTs) and meta analyses of RCTs
Level 2: Evidence obtained from at least one well designed RCT
Level 3: Evidence obtained from well designed non-randomised controlled trials, single group pre-post, cohort, time series or matched experimental studies
Level 4: Evidence obtained from well designed non-experimental research from more than one centre or research group
Level 5: Opinion of respected authorities based on clinical experience, descriptive studies or reports of expert committees
*
1 2 3 4 5
Level: nmlkj nmlkj nmlkj nmlkj nmlkj

Page 17
Questionnaire on the Drug Safety Data Base - What Are Your Views?Questionnaire on the Drug Safety Data Base - What Are Your Views?Questionnaire on the Drug Safety Data Base - What Are Your Views?Questionnaire on the Drug Safety Data Base - What Are Your Views?
SCENARIO 6Product: first in class, orally active hypoglycaemic agentBackground: launched in UK two months ago.New safety data: 130 cases of hepatic involvement ( including hepatoceullar damage, necrosis and hepatic failure with six deaths) have been reported worldwide ( mainly from US and Japan). Approximately 400,000 patient have been prescribed the drug. The incidence of such reports in the UK is approximately 1 in 5,000.
3.6.1 CONSIDERING THE PRODUCT IN QUESTION. What action(s) should be taken with respect to the UK product in this scenario? ( tick any that apply)
8. SCENARIO 6
*
No changes are required.
gfedc
Product labelling should not be changed until further reports are received.
gfedc
Product should be withdrawn from the UK market.
gfedc
Product should be suspended pending further data analysis.
gfedc
Product should be amended to indicate the possibility of severe liver disease.
gfedc
Restrict to specialist use.
gfedc
ADR should be the topic of a ‘Dear Doctor’ letter from the MHRA.
gfedc
ADR should be featured in the next ‘Drug Safety Update’ from the MHRA.
gfedc
ADR should be the subject of a ‘blue box’ warning in the BNF.
gfedc
Product should be made subject to special yellow card reporting.
gfedc
A general PEM (green card) study on the product should be commissioned.
gfedc
Other (please specify and justify the answer you have given to this question)
gfedc

Page 18
Questionnaire on the Drug Safety Data Base - What Are Your Views?Questionnaire on the Drug Safety Data Base - What Are Your Views?Questionnaire on the Drug Safety Data Base - What Are Your Views?Questionnaire on the Drug Safety Data Base - What Are Your Views?3.6.2 Using the numbering system for Gray's hierarchy of evidence shown in below, circle the highest level which you consider best describes the "new safety data" presented in scenario 6.
Description
Level 1: Evidence obtained from systematic reviews of relevant and multiple randomised controlled trials (RCTs) and meta analyses of RCTs
Level 2: Evidence obtained from at least one well designed RCT
Level 3: Evidence obtained from well designed non-randomised controlled trials, single group pre-post, cohort, time series or matched experimental studies
Level 4: Evidence obtained from well designed non-experimental research from more than one centre or research group
Level 5: Opinion of respected authorities based on clinical experience, descriptive studies or reports of expert committees
*
1 2 3 4 5
Level: nmlkj nmlkj nmlkj nmlkj nmlkj

Page 19
Questionnaire on the Drug Safety Data Base - What Are Your Views?Questionnaire on the Drug Safety Data Base - What Are Your Views?Questionnaire on the Drug Safety Data Base - What Are Your Views?Questionnaire on the Drug Safety Data Base - What Are Your Views?
SCENARIO 7Product: First in class immunosuppressant for atopic dermatitis in adults and children 2 years of age and above, who fail to respond to conventional therapies.Background: granted a MA through the common multi-state procedure and has been available in the UK for 1 year.New safety data: spontaneous reporting has revealed a new signal involving cutaneous malignancies and lymphomas, 21-790 days after licensed topical application. In the US, there have been 19 cases ( 9 lymphomas and 10 skin cancers) involving 16 adults and 3 children. A "European-wide safety review" ( unpublished ) could not conclude whether or not the topical product caused malignancies and that the balance of risks vs benefits remains favourable.
3.7.1 CONSIDERING THE PRODUCT IN QUESTION. What action(s) should be taken with respect to the UK product in this scenario? ( tick any that apply)
9. SCENARIO 7
*
No changes are required.
gfedc
Product labelling should not be changed until further reports are received.
gfedc
Product should be withdrawn from the UK market.
gfedc
Product should be suspended pending further data analysis.
gfedc
Product should be contraindicated in immunocompromised patients.
gfedc
Restrict to specialist use.
gfedc
ADR should be the topic of a ‘Dear Doctor’ letter from the MHRA.
gfedc
ADR should be featured in the next ‘Drug Safety Update’ from the MHRA.
gfedc
ADR should be the subject of a ‘blue box’ warning in the BNF.
gfedc
Product should be made subject to special yellow card reporting.
gfedc
A general PEM (green card) study on the product should be commissioned.
gfedc
Other (please specify and justify the answer you have given to this question)
gfedc

Page 20
Questionnaire on the Drug Safety Data Base - What Are Your Views?Questionnaire on the Drug Safety Data Base - What Are Your Views?Questionnaire on the Drug Safety Data Base - What Are Your Views?Questionnaire on the Drug Safety Data Base - What Are Your Views?3.7.2 Using the numbering system for Gray's hierarchy of evidence shown in below, circle the highest level which you consider best describes the "new safety data" presented in scenario 7.
Description
Level 1: Evidence obtained from systematic reviews of relevant and multiple randomised controlled trials (RCTs) and meta analyses of RCTs
Level 2: Evidence obtained from at least one well designed RCT
Level 3: Evidence obtained from well designed non-randomised controlled trials, single group pre-post, cohort, time series or matched experimental studies
Level 4: Evidence obtained from well designed non-experimental research from more than one centre or research group
Level 5: Opinion of respected authorities based on clinical experience, descriptive studies or reports of expert committees
You have now reached the end of the questionnaire.
We may wish to carry out a structured interview with a sub-set of respondents either in person or by telephone. The aim of this interview will be to validate the answers given on the questionnaire, and to explore in more detail some of the issues raised.
If you would be willing to take part in this, please could you supply (in strictest confidence) the information requested below. If not, please return the completed questionnaire either on-line or as requested below.
*
1 2 3 4 5
Level: nmlkj nmlkj nmlkj nmlkj nmlkj
Information provided by:
Title:
Address:
Telephone No:
E Mail:

Page 21
Questionnaire on the Drug Safety Data Base - What Are Your Views?Questionnaire on the Drug Safety Data Base - What Are Your Views?Questionnaire on the Drug Safety Data Base - What Are Your Views?Questionnaire on the Drug Safety Data Base - What Are Your Views?THANK YOU VERY MUCH FOR YOUR TIME AND EFFORT
IN COMPLETING THIS QUESTIONNAIRE
Please now submit your completed questionnaire.
If you have any question about the questionnaire, please feel free to contact:
AMY TANG ([email protected])
SCHOOL OF PHARMACY AND BIOMEDICAL SCIENCES, UNIVERSITY OF PORTSMOUTH, ST MICHAEL’S BUILDING, WHITE SWAN RD,
PORTSMOUTH, HANTS. PO1 2DT.

Appendix 4.
Structured interview schedule.
256
Interview on labelling changes and withdrawal of medicinal products in the UK
I'm Amy Tang and I'm a PhD student at the School of Pharmacy, University of Portsmouth and the DSRU. The aim of the study is to investigate, compare and contrast the views of various stake holders who are involved in safety decisions affecting the use and marketing of licensed medicinal products in the UK. We are interested in your general views and experiences on labelling changes and withdrawal of medicinal products in the UK and specifically in what you think of the way different types of safety data are used. I will be taking notes during the interview. The interview will also be audio taped for research purposes only. No part of this conversation will be reported to another interviewee. I should add that this is not a test of you or how you use the medical literature personally. Please feel free to ask any questions of your own or add your comments at any time during the interview. Do you have any questions before we start? Any comments you make will be treated with strict confidence and there will be no way of identifying you with your comments in any research report. We have University of Portsmouth Biosciences Research Ethics Committee approval for this study. The interview will last approximately 30 minutes. I have read the above and agree to take part in this research. Signature:______________ Date:__________________

INTERVIEW SCRIPT
SECTION 1 General Questions 1. What is your official job title? How many years have you been in the job? 2. What are your roles and responsibilities? 3. Do you have any formal training in Pharmacovigilance? 4. This is the scenario 1 and 6 from the questionnaire. Your chosen answers were:___________. Do you have anything to expand on your chosen course of action Comment: scenarios were shown fresh to subjects who had not completed the on-line questionnaire. In each case, subjects were asked for their views on the action(s) to be taken in the light of the new evidence presented and the level of the data, according the Gray’s hierarchy. Scenarios 1 (hiccups with an ACE inhibitor) and 6 (hepatic reactions with a new oral hypoglycaemic agent) were used here. See Appendix 1 for the on-line questionnaire text. 5. What do you understand by the term “Safety Signal” as applied to pharmacovigilance data? SECTION 2 DEVELOPMENT
1. From the Gray’s Hierarchy, how do you rate the ADR Evidence? Do you recommend a better approach? ( see attachment 1)
Comment: attachment 1 was the definition of Gray’s hierarchy used in the on-line questionnaire (See Appendix 1).
2. For Product Withdrawal from the market, do you have anything to add to
the list of risk-minimisation strategies which might be adapted? Could

you provide any examples of that? ( see attachment 2)
Comment: subjects were shown the following list of options:
“When an ADR issue (signal) has been identified there are a number of steps which could be taken, short of withdrawal from the market; these include:
i) Change of dose
ii) Addition to the labelling, on a continuum from a mention in the “Side effect” section up to a blue box warning
iii) Inclusion in the side effects / warnings / precautions section of the PIL
iv) “Dear Healthcare Professional’’ letter
v) Notice in “Drug Safety Updates”
vi) Publication in the medical literature
vii) Restriction in supply to specialist use
viii)Restriction in supply to patients providing written informed consent
ix) Restricting to subjects monitored by special tests.
SECTION 3 GENERAL DEVELOPMENT In this section, I want to see how the whole drug safety picture can be improved.
1. Can you comment on the attractiveness to you personally and the practicalities of the following:
a) Make ADR reporting by healthcare professionals mandatory (if so, how would this be enforced?)
b) Can we do more to encourage ADR report in additional to the black triangle? WHAT & HOW
c) Subject all new products to PEM studies? If yes- who do you think
should pay for this?
d) Phased release of new products, e.g. to patients with few other co-morbidities or with mild disease. Gradually expanding the indications as safety data is accumulated.
.

e) Do you have any other suggestions?
SECTION 3 GENERAL DEVELOPMENT In this section, I would like your views on some general areas
1. Overall, do you think that when making decisions about ADRs, the MHRA is too conservative/ about right/ not conservative enough when dealing with medicine safety issues. Can you give an example that illustrates what you mean?
2. Overall, do you think that when making decisions about ADRs, the pharmaceutical industry is too conservative/ about right/ not conservative enough when dealing with medicine safety issues. Can you give an example that illustrates what you mean
Related Documents


