Evaluating the effectiveness of the EU Emission Trading Scheme The influence of CO₂ pricing on the functioning and effectiveness of emission trading and its innovational effect within the European and German electricity sector Source Espina, 2009 Group 07 Cristina Barber Álvarez- Buylla 921004034080 Marina Cárdenas Herrero 920525155030 Brenda Deden 901009173090 Federico Togni 890302837060 Amount of pages - 20 Course ENP – 34306 Environmental Policy: Analysis and Evaluation Dr. Judith van Leeuwen

Welcome message from author
This document is posted to help you gain knowledge. Please leave a comment to let me know what you think about it! Share it to your friends and learn new things together.
Transcript
Evaluating the effectiveness of the EU Emission Trading Scheme
The influence of CO₂ pricing on the functioning and effectiveness of emission trading and its innovational effect within the European and German electricity sector
Source Espina, 2009
Group 07
Cristina Barber Álvarez- Buylla 921004034080 Marina Cárdenas Herrero 920525155030 Brenda Deden 901009173090 Federico Togni 890302837060
Amount of pages - 20 Course ENP – 34306 Environmental Policy: Analysis and Evaluation Dr. Judith van Leeuwen
2
Index
Evaluating the effectiveness of the EU Emission Trading Scheme ............................................................ 1
Index ........................................................................................................................................................ 2
Abstract .................................................................................................................................................... 3
Introduction ............................................................................................................................................. 4
1. Theoretical Framework ..................................................................................................................... 6
1.1 Focus .............................................................................................................................................. 6
1.2 Evaluation Framework .................................................................................................................... 6
1.3 Design Cap and trade system ........................................................................................................ 11
2. Policy evaluation ............................................................................................................................. 13
2.1 Measuring output: Implementation of Cap and trade system in European/German power sector . 13
2.2 Measuring outcome: functioning and effectiveness of pricing CO2 in relation to emission trading
and innovation in electric companies in the pilot phase ....................................................................... 14
2.3 Measuring outcome: functioning and effectiveness of pricing CO2 in relation to emission trading
and innovation in electric companies in the second phase ................................................................... 17
3. Case study: Germany ...................................................................................................................... 19
Discussion .............................................................................................................................................. 22
Conclusion ............................................................................................................................................. 23
References .............................................................................................................................................. 24
Appendix ................................................................................................................................................ 27
3
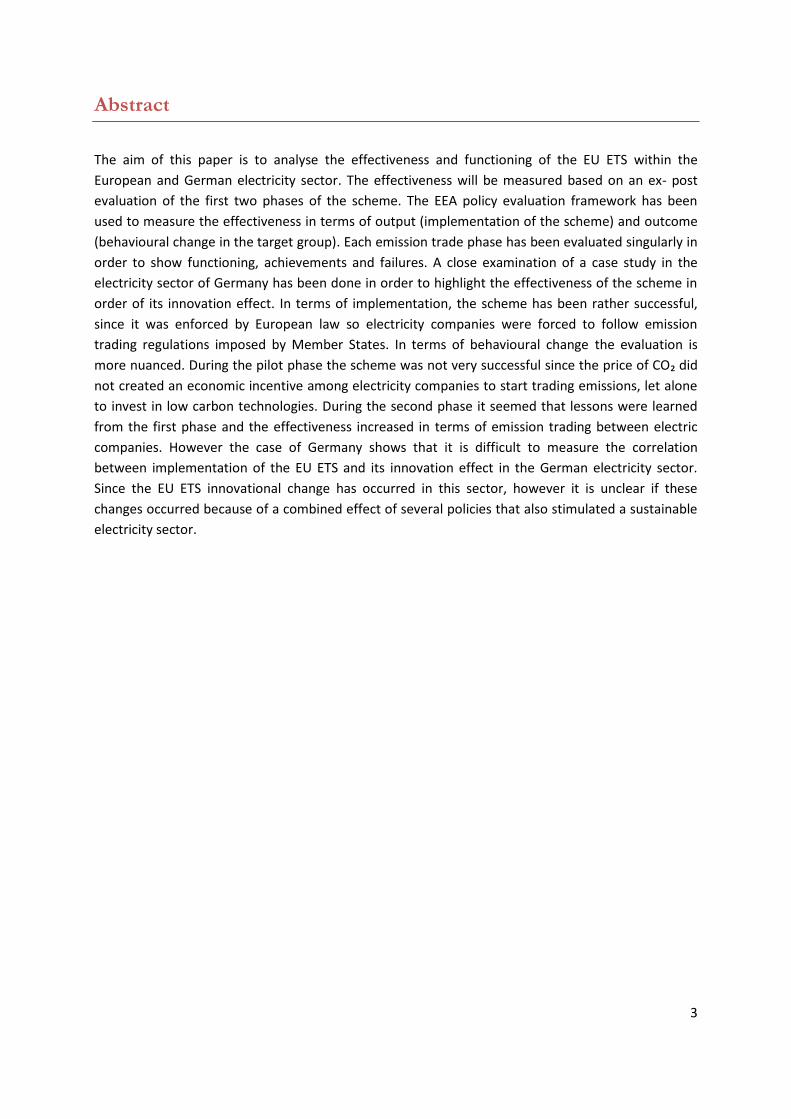
Abstract
The aim of this paper is to analyse the effectiveness and functioning of the EU ETS within the
European and German electricity sector. The effectiveness will be measured based on an ex- post
evaluation of the first two phases of the scheme. The EEA policy evaluation framework has been
used to measure the effectiveness in terms of output (implementation of the scheme) and outcome
(behavioural change in the target group). Each emission trade phase has been evaluated singularly in
order to show functioning, achievements and failures. A close examination of a case study in the
electricity sector of Germany has been done in order to highlight the effectiveness of the scheme in
order of its innovation effect. In terms of implementation, the scheme has been rather successful,
since it was enforced by European law so electricity companies were forced to follow emission
trading regulations imposed by Member States. In terms of behavioural change the evaluation is
more nuanced. During the pilot phase the scheme was not very successful since the price of CO₂ did
not created an economic incentive among electricity companies to start trading emissions, let alone
to invest in low carbon technologies. During the second phase it seemed that lessons were learned
from the first phase and the effectiveness increased in terms of emission trading between electric
companies. However the case of Germany shows that it is difficult to measure the correlation
between implementation of the EU ETS and its innovation effect in the German electricity sector.
Since the EU ETS innovational change has occurred in this sector, however it is unclear if these
changes occurred because of a combined effect of several policies that also stimulated a sustainable
electricity sector.

4
Introduction
Climate change has become one of the most important environmental issues that countries of the
world have to face. Evidences shows that the rapidly grown CO₂ emissions due to human activities
are main responsible for climate change. The necessity of creation of policies for the reduction of
emissions is increasing every day (Mo et al, 2012).
In January 2005, the European Union Emission Trading Scheme was created, also known as the EU-
ETS. It is the largest international system for trading greenhouse gas emissions allowances. It covers
11.000 power stations and industrial plants in 31 countries: the 28 Member States of the European
Union and three more states within the “European Economic Area”, Iceland, Liechtenstein and
Norway (EC, 2013).
The EU-ETS covers approximately 50% of total CO₂ emissions of European countries (EC, 2007, p.6-7).
Trade in emissions allowances consists of giving a monetary value to CO₂ emissions and creating a
market of carbon under a “cap and trade” system, which has been an achievement of global
significance (Grubb et al, 2006).
According to the European Commission, internalizing externalities (negative environmental costs)
makes investing in clean technologies more profitable. If CO₂ has a price, companies are engaging the
ingenuity of their engineers to look for cost-effective ways to reduce their emissions (EC, 2008).
Therefore, the EU-ETS believes in economics tools instead of “command and control” techniques,
which would consist on politicians deciding the targets and then set up measures to enforce
compliance (Connelly and Smith, 2003).
The EU-ETS already finished two phases:
Phase I (2005-2007): a three year pilot period, which served as a preparation for Phase II,
where the policy should be working properly in order to manage the Kyoto protocols
objectives. Just CO₂ emissions of power generators and industrial sectors were covered.
Most of the allowances were given for free and the sanction for the non-compliance was
40€/ tonne CO₂ (EC, 2013).
Phase II (2008-2012): this phase coincided with the beginning of the Kyoto Protocol. Iceland,
Liechtenstein and Norway joined the scheme too. After knowing the results of the Pilot
Phase, it included revised monitoring and reporting rules, and more stringent emissions caps.
(Environmental Agency, 2013). The aviation sector took part of the EU-ETS in 2012. The
sanction for non-compliance increased until 100 €/ tonne CO₂ and the number of allowances
given for free decreased with 10%. (EC, 2013).
The third Phase of the EU-ETS is currently running. It began in January 2013 and will finish in
December 2020. It covers additional greenhouse gases and emission sources and allows small
emitters and hospitals to choose to be excluded from certain obligations (Environmental Agency,
2013).
5
The main objective of the EU-ETS is managing a reduction of 21% (referring to 2005 emissions) by the
year 2020 (EC, 2013).
The cap system has been established in order to reduce caps in future periods by increasing the
incentive for technology investment and reduce emissions at minimum cost and by the promotion of
global innovation (Hoffman, 2007).
In this work we are going to focus on how effective the EU-ETS has been since 2005 in the electricity
sector in Europe. A case study of Germany will be used to illustrate the effectiveness of the scheme
more specific Therefore, our research question is:
“How did the pricing of CO₂ emissions influenced the functioning and effectiveness of the emission trading scheme (EU ETS) when focusing on the trading of emissions and its innovation effect in the electricity sector during the first two phases of the scheme?” After a theoretical description of the evaluation framework used and the characteristics of a cap and
trade system in chapter 1, each emission trading phase will be evaluated singularly in chapter 2 to
describe a relation between the pricing of CO₂ and the functioning, achievements and failures of
actual emission trading between electric companies. In chapter 3 the effectiveness of the scheme will
be examined more closely, by looking to what extend the EU- ETS stimulated an innovation effect
towards low carbon technologies in the case of the German electricity sector
6
1. Theoretical Framework
Analytical Focus and evaluation framework
1.1 Focus
As introduced before, in this paper the EU ETS will be evaluated in the electricity sector based on an
ex- post evaluation of the first two phases of the EU ETS in Europe. In order to do so, the EEA
framework will be used with a particular focus of measuring the effectiveness in terms of output and
outcome. Subchapter 1.2 will elaborate on this.
In this paper the scope of research is narrowed by measuring the functioning and effectiveness of the
EU- ETS in the following areas:
- The European energy sector. This sector is one of the highest emitters of CO₂ and therefore
relevant to put it under regulation of the EU- ETS (Hoffman, 2007). Also it was the first sector
on which the EU-ETS was implemented, so this is also the sector where the most lessons
were learned.
- Effectiveness in terms of CO₂ prices and innovation. Regarding prices, the EU- ETS is an
economic tool in which the price of a product - CO₂ - determines if a company will change its
behavioral (Connelly and Smith, 2003). This makes it relevant to research the relation
between CO₂ pricing and effectiveness. Regarding innovation, the ultimate goal of the EU-
ETS is to achieve emission reduction targets a minimum costs and to promote global
innovation in low emission technologies (Hoffman, 2007), Therefore it’s relevant to see in
what extend the EU- ETS motivated electric companies to invest in technological innovations.
These are all kind of investments that will lead to a lowering of CO₂ emissions in the
electricity sector.
- Germany. A case study of Germany will be used to describe the innovation effect in the
German electricity sector. The reason why is chosen for Germany is because it has the largest
share of planned power generation capacity in the EU and a multitude of providers of power
generation technologies (Hoffman and Rogge, 2010, p.7640).
By doing this study insight in the base of implementation of low carbon techniques is provided, which
can improve the effectiveness in the currently running third phase.
1.2 Evaluation Framework
This chapter is dedicated to describing what evaluation is and why it is useful, what the main features
of ex- post evaluation are, a description of the EEA framework and its three tools to measure
effectiveness and a description of the main characteristics of a cap and trade system.
What is ex- post evaluation
According to Schriven (1991, p. 139): “The key sense of the term ‘evaluation’ refers to the process of
determining the merit, worth, or value [emphasis in the original] of something, or the product of that
process”. Indeed the evaluation process has a significant role in policy making, in fact that it can be
used in order to (Gupta 2013):
Understand the link between policymaking and environmental improvements;
7
understand pros and cons of relying on different policy instruments;
legitimize particular policies;
improve policy processes and outcomes.
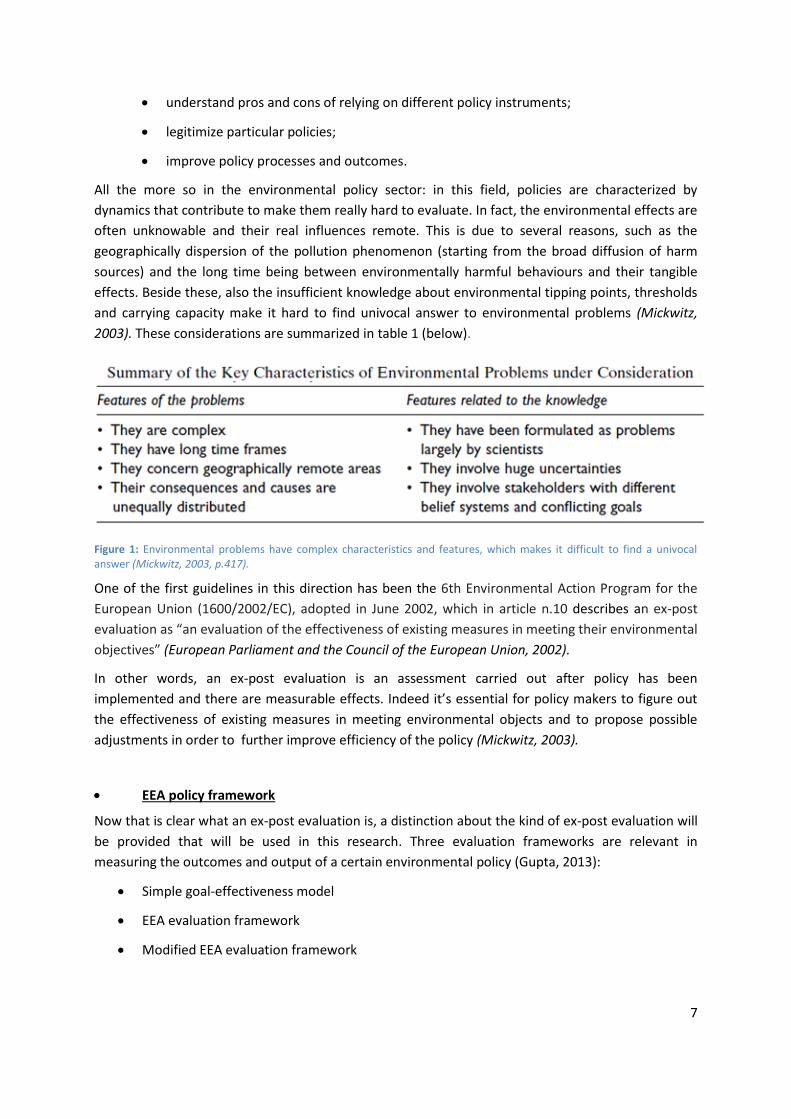
All the more so in the environmental policy sector: in this field, policies are characterized by
dynamics that contribute to make them really hard to evaluate. In fact, the environmental effects are
often unknowable and their real influences remote. This is due to several reasons, such as the
geographically dispersion of the pollution phenomenon (starting from the broad diffusion of harm
sources) and the long time being between environmentally harmful behaviours and their tangible
effects. Beside these, also the insufficient knowledge about environmental tipping points, thresholds
and carrying capacity make it hard to find univocal answer to environmental problems (Mickwitz,
2003). These considerations are summarized in table 1 (below).
Figure 1: Environmental problems have complex characteristics and features, which makes it difficult to find a univocal answer (Mickwitz, 2003, p.417).
One of the first guidelines in this direction has been the 6th Environmental Action Program for the
European Union (1600/2002/EC), adopted in June 2002, which in article n.10 describes an ex-post
evaluation as “an evaluation of the effectiveness of existing measures in meeting their environmental
objectives” (European Parliament and the Council of the European Union, 2002).
In other words, an ex-post evaluation is an assessment carried out after policy has been
implemented and there are measurable effects. Indeed it’s essential for policy makers to figure out
the effectiveness of existing measures in meeting environmental objects and to propose possible
adjustments in order to further improve efficiency of the policy (Mickwitz, 2003).
EEA policy framework
Now that is clear what an ex-post evaluation is, a distinction about the kind of ex-post evaluation will
be provided that will be used in this research. Three evaluation frameworks are relevant in
measuring the outcomes and output of a certain environmental policy (Gupta, 2013):
Simple goal-effectiveness model
EEA evaluation framework
Modified EEA evaluation framework
8
In this paper the EEA evaluation framework will be considered, which feature are analysed in the
following paragraph.
The evaluation framework at issue was given by the European environmental agency through the
action of the Reporting on Environmental Measure commission. In here, it is assessed how far the
reporting obligations contained in EU environmental legislation could help to evaluate the effect and
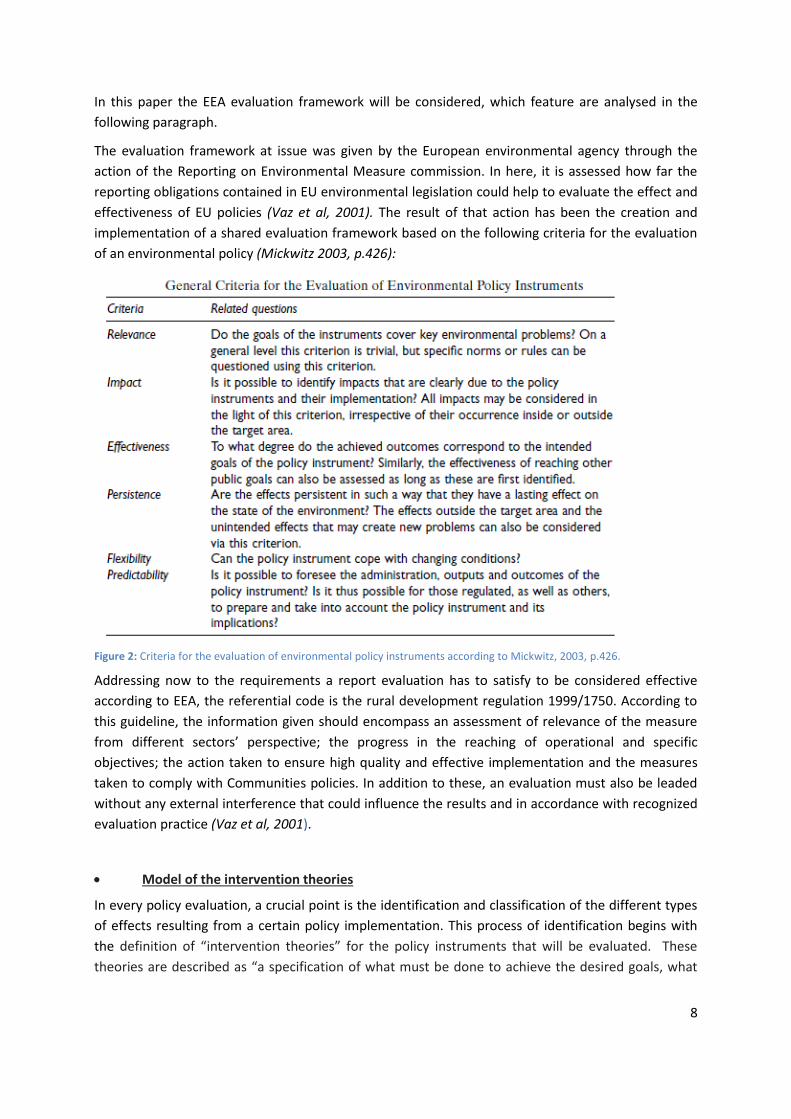
effectiveness of EU policies (Vaz et al, 2001). The result of that action has been the creation and
implementation of a shared evaluation framework based on the following criteria for the evaluation
of an environmental policy (Mickwitz 2003, p.426):
Figure 2: Criteria for the evaluation of environmental policy instruments according to Mickwitz, 2003, p.426.
Addressing now to the requirements a report evaluation has to satisfy to be considered effective
according to EEA, the referential code is the rural development regulation 1999/1750. According to
this guideline, the information given should encompass an assessment of relevance of the measure
from different sectors’ perspective; the progress in the reaching of operational and specific
objectives; the action taken to ensure high quality and effective implementation and the measures
taken to comply with Communities policies. In addition to these, an evaluation must also be leaded
without any external interference that could influence the results and in accordance with recognized
evaluation practice (Vaz et al, 2001).
Model of the intervention theories
In every policy evaluation, a crucial point is the identification and classification of the different types
of effects resulting from a certain policy implementation. This process of identification begins with
the definition of “intervention theories” for the policy instruments that will be evaluated. These
theories are described as “a specification of what must be done to achieve the desired goals, what

9
other important impacts may also be anticipated and how these goals and impacts would be
generated” (Chen, 1990 as described in Mickwitz 2003, p.423).
An intervention theory has the aim to define how the policy will be implemented and will function;
the final result is usually a forecast about the practical effectiveness of the policy intervention.
However, although an intervention theory generally does not provide any descriptions of how a
policy instruments actually works, interventions theories coming from different sources are usually
the basis for a practical intervention. They normally consist of expectations regarding the following
different elements and their causal links:
• Actor • Outputs
• Outcomes • Inputs
The two main functions intervention theories have in an evaluation are: first the establishment of the
effects of the instruments and the areas involved; second, the determination of the outputs (matters
that the target groups are faced with), outcomes (response of the target groups to the outputs, and
their consequences) and causal links to collect data on.
Therefore, evaluations can promote the learning process especially in the environmental field, where
belief systems or views of causal relationships are often conflicting. In fact learning is stimulated both
by the variance of assumptions on the explicit causalities in the intervention theories, and by the
empirical assessment of the assumptions made before the intervention (Mickwitz, 2003).
Outputs and outcomes evaluation in the electricity sector
First a brief description of what is meant with “effectiveness assessment of an environmental policy”
will be given. Vaz et al (2001, p.9) defines effectiveness as “a judgement about whether or not the
expected objectives and targets of the policy measure have been achieved”. In other words, they
claim that assessing effectiveness basically means to judge whether and how a policy has reached his
starting aims and it involves to compare intentions with performances and final results.
Gysen et al (2002) makes a further distinction in defining effectiveness of an environmental policy.
According to them, the general idea of effectiveness can be split in four sub concepts: institutional
effectiveness, target group effectiveness, environmental effectiveness and societal effectiveness. The
investigation of one kind rather than another depends on the elements that are stressed in a cause-
effect analysis of the evaluation as shown in figure 3 (Gysen et al, 2002, 5).
10
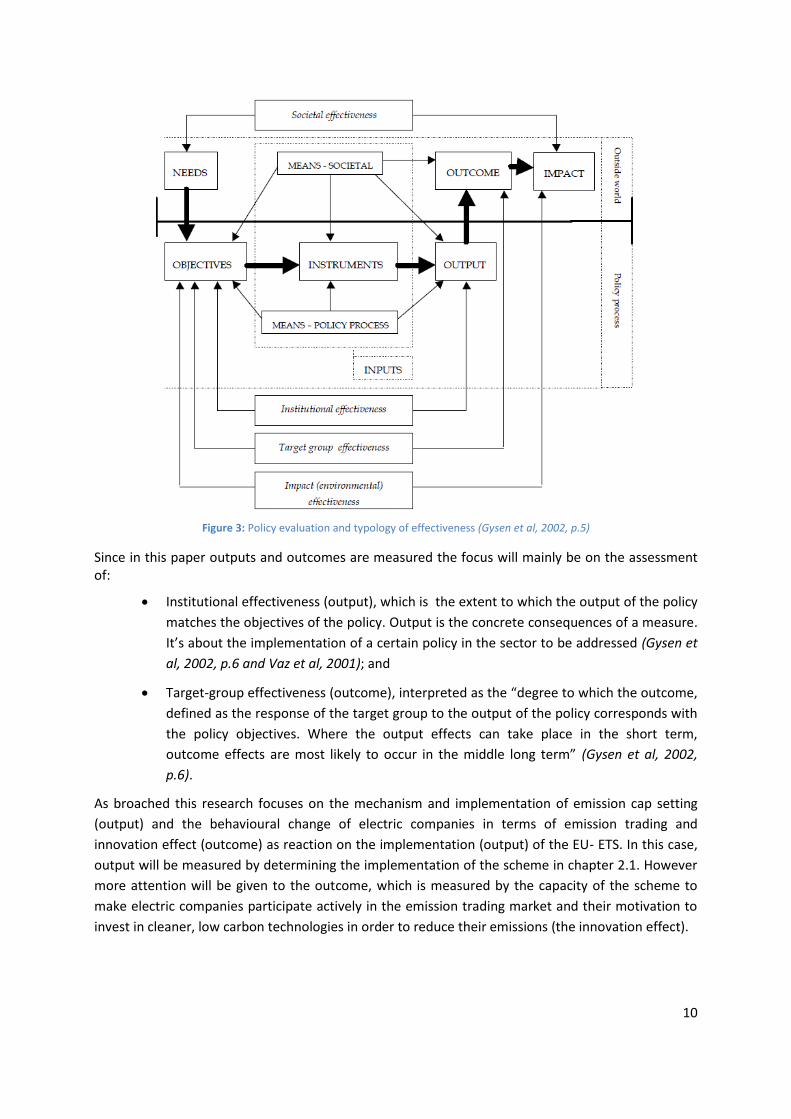
Figure 3: Policy evaluation and typology of effectiveness (Gysen et al, 2002, p.5)
Since in this paper outputs and outcomes are measured the focus will mainly be on the assessment of:
Institutional effectiveness (output), which is the extent to which the output of the policy
matches the objectives of the policy. Output is the concrete consequences of a measure.
It’s about the implementation of a certain policy in the sector to be addressed (Gysen et
al, 2002, p.6 and Vaz et al, 2001); and
Target-group effectiveness (outcome), interpreted as the “degree to which the outcome,
defined as the response of the target group to the output of the policy corresponds with
the policy objectives. Where the output effects can take place in the short term,
outcome effects are most likely to occur in the middle long term” (Gysen et al, 2002,
p.6).
As broached this research focuses on the mechanism and implementation of emission cap setting
(output) and the behavioural change of electric companies in terms of emission trading and
innovation effect (outcome) as reaction on the implementation (output) of the EU- ETS. In this case,
output will be measured by determining the implementation of the scheme in chapter 2.1. However
more attention will be given to the outcome, which is measured by the capacity of the scheme to
make electric companies participate actively in the emission trading market and their motivation to
invest in cleaner, low carbon technologies in order to reduce their emissions (the innovation effect).
11
1.3 Design Cap and trade system
The EU ETS cap and trade system consist in the setting of a limit (“cap”) on the total amount of
certain greenhouse gases that can be emitted by factories, power plants and other installations
within European countries covered by the scheme. The cap is reduced over time in order to reduce
the number of total emissions. In 2020, emissions from sectors covered by the EU ETS are supposed
to decrease by 21% in comparison with those of 2005 (EC, 2013)
The cap and trade system bases are inspired in on the Coase theorem. According to this theorem, if
there is low or inexistent cost of transaction and a good communication system, and if the propriety
of a resource is assigned to one of the interested parts, the market will auto regulate itself and the
equilibrium will be achieved for both parts. This system is designed as a solution for the negative
externalities issue, in this case, the emission of CO2 (Hahn et al, 2010).
Before the implementation of the cap and trade system, several different mechanisms has been tried
to distribute the propriety of the resources. The most famous alternative to the Coase theorem is the
Pigouvian Tax. This method envisages a compensation, in the form of taxes and fines, charged to the
producer of a negative externality (Baumol, 1972). However, it has rarely been used since it revealed
a few flaws. The main problem is represented by the difficulty to set the correct amount for the
money compensation (pigouvian tax). The root of the problem is the impossibility for the regulator to
obtain enough information about the marginal abatement cost curve of each company, it means that
he cannot know exactly firms’ benefits and costs and this basically causes an incorrect setting of the
fines (Hahn et al., 2010).
Cap and trade was designed by Crocker (1966) and Dales (1968) as an alternative to the pugouvian
tax to deal with negative externalities issue and it has revealed more effective because less
information are needed for the mechanism to be established and launched.
In fact, Cap and trade is a system of transferable discharge permits, where the regulator has only to
set the total amount of emissions allowed (the cap), allocate all the rights outstanding, and allow
emission producers to trade the permits in a secondary market until the achievement of an optimal
allocation. According to this model, the final allocation of the permits would be independent upon
the initial allocation and right prices will be determined through the law of demand and supply.
One important requirement in a cap and trade system setting, is a correct arrangement of the limit in
order to maintain an effective value of the emission allowances. An incorrect level of caps could drive
to several glitches: on one hand, too low caps would cause a collapse of the electricity sector, on the
other hand, too high threshold would push companies to pollute without buying new permits.
Similarly, the whole number of allowances issued should be carefully considered since it determines
the price for carbon. Too few allowances will result in too high a carbon price. Too many permits will
cause a low carbon price and therefore reduce efforts towards emission abatement (Newbery 2009).
At this stage of the analysis of the cap and trade method, a really relevant aspect to take into
consideration is the initial distribution of the allowances. There are two possibilities for the
allocation: grandfathering (permits given for free), broadly used during the pilot phase; or
alternatively auctioning, mostly used in the second and third ETS-phase allocation (from 2013 even
60% of the total permits are expected to be put up for auction).
12
In grandfathering, the regulative institution gives the allowances for free to the companies on the
base of the emission levels in the previous years (historical data). In this system the opportunity for
companies to pollute is considered a right, therefore costs of distribution of the allowances are
avoided. The companies just have to pay, if need be, for additional allowances to be bought in the
second market. (Rabbani and Muhájir, 2008). This allocation system has been criticized by numerous
studies (Doble and Kinnunen, 2005; Neuhoff, 2009) because it rises windfall profits, provides few
incentives to use clean, renewable energy and to be more competitive through innovation.
Furthermore, it’s possible that in anticipation of a grandfathering allocation, industries pollute more
than usual in the period before the implementation of the ETS in order to get more permits
afterwards.
On the contrary, with auctioning distribution allowances are put up for auction and companies bid
for them on the base of a fixed starting price. According to Stavins (2013), giving a price for
allowance through auctioning can also have a positive effect on social policies. In fact, revenues can
be profitably used by regulator institutions to eliminating some deadweight loss and cutting overall
social cost, or invested for the reduction of distortionary taxes (such as taxes on labour).
Another aspect to evaluate the cap and trade system, is the need of a secondary market in which
every company can trade allowances buying new permits to comply with the law or alternatively
selling allowances in excess whether it’s emitting less than the personal cap allows. The prices of the
allowances are directly dependent from the number allowances traded on the market (Rabbani and
Muhájir, 2008). If a company has an emissions reduction costs curve lower than other companies it is
more profitable for the first company to sell some allowances until the cost of the reduction of one
unit of emissions equate to the price of the allowances, and for the second it is more profitable to
buy allowances until the price of the allowances equate the price of the cost of reduction one unit of
emissions. This is because the reduction of each new emission unit, has higher costs. So for the first
company the reduction of each unit is cheaper than the allowance prices and is more profitable to
reduce one unit and sell the allowance of that emission unit than continue polluting those emission
unit. For the second company, reducing a unit of emission is more expensive than buying an
allowance for that unit (Jacobo, 1997).
One system for lower the emission reduction cost curve is to invest in new technologies. The
companies invest in new technology if the price of investing is lower than the price of the allowances
that they would not need if they use that technology (Rabbani and Muhájir 2008). Investing in new
technologies is a long term investment, that is why on one hand the cap and trade system needs to
be based on sustainable and stable prices of the allowances, and on the other hand companies have
to trust the system. Only this way they are aware that the boundaries are not going to change and
the investing will continue to being profitable in long term (Mills, 2008).

13
2. Policy evaluation
Design, functioning and effectiveness
2.1 Measuring output: Implementation of Cap and trade system in European/German
power sector
As already became clear in chapter 1.2, measuring output is about the mechanisms for the setting
and implementing of the emission cap (Vaz et al, 2011)1. In this chapter therefore the focus will be
on how the EU- ETS was implemented in the target group – the electricity sector – in Europe and
more specific in Germany.
Implementation of EU-ETS in European electricity sector
Figure 4: Total greenhouse gas emissions by sector in 27 Member States of the European Union in 2005 (EC, 2007, p.14).
The initial focus of the EU-ETS was on CO₂ from big industrial emitters. Due to the large-scale use of
fossil fuels, the electricity sector is the largest contributor to overall CO₂ emissions in Europe (see
figure 4). Therefore the focus of the first trading period of the EU- ETS (2005-2007) was limited to
emissions from the power and heat generation industry. Even with this limited scope, some 10.500
installations in the 27 Member States were covered. Together they account for around 50% of the
EU’s total CO₂ emissions and about 40% of its overall greenhouse gas emissions (EC, 2007).
According to the Kyoto Protocol and its implementation in the EU and the EU ETS, Member States of
the EU are committed to reduce their collective emissions of greenhouse gases by 8% from 1990
levels during the Protocol’s first commitment period from 2008 to 2012 (the second phase of the EU-
ETS). This commitment from the Kyoto Protocol was used for setting the overall emission cap in the
EU-ETS and were translated into differentiated national emission reductions targets that are fixed in
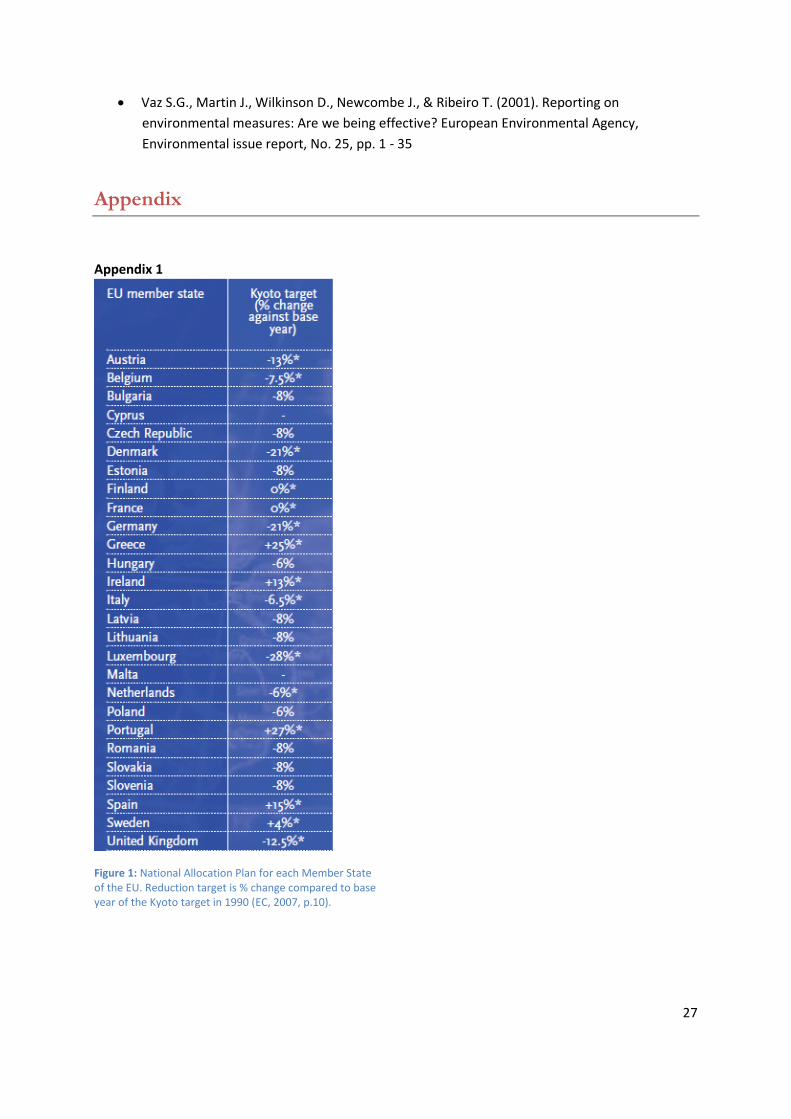
National Allocation Plans. Appendix 1 gives an overview of the allocation of CO₂ reduction targets for
each Member State. The EU ETS has been established through binding legislation proposed by the
European Commission and is approved by the EU Member States and the European Parliament. This
means that all electricity companies within the EU are required by law to participate in the EU ETS
(EC, 2007).
1 See chapter 1.2, page 10.
14
Implementation of EU-ETS in German electricity sector
Also in Germany the electricity sector is the main contributor of the countries CO₂ emissions. In 2004,
electricity generation was responsible for 37,3% of the 885,9 million tons of Germany’s CO₂
emissions. Therefore the electricity sector plays a key role in Germany’s efforts to reach the long-
term greenhouse gas emission reduction goals declared by the Kyoto Protocol and adopted by the
EU-ETS, which are set at a reduction goal of 21% below 1990 levels (see Annex 1) (Hoffman, 2007
and EC, 2007, p.10).
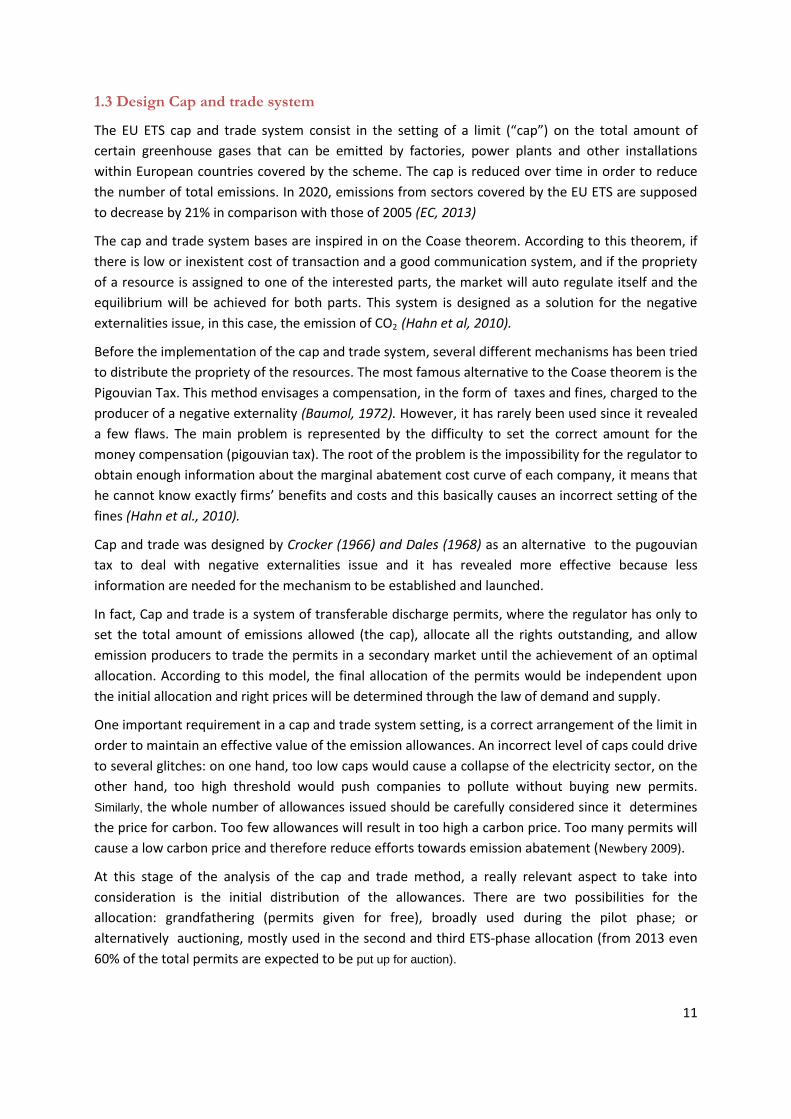
German electricity production relies on a mix of different energy sources. The distribution between
these sources is showed in table 1. It is clear that in 2004 most of the country’s electricity production
comes from lignite (25,5%) and hard coal (22,7%), which makes coal-fired plants the largest supplier
of electricity in Germany. In 2004 Nuclear power was also a major source of electricity and
accountable for 26,9% of total electricity production (Hoffman, 2007). However since the nuclear
accident with the power plant in the Japanese city Fukushima, Germany adopted a policy which will
gradually phase-out future use of nuclear power (Gueldner, 2013).
Production of renewable energy sources are promoted by the Renewable Energy Sources Act (EEG),
which was already implemented before the introduction of the EU ETS. This law provides subsidies
for investments especially in wind and solar power generation (Hoffman, 2007).
Table 1: Overview of Electricity generation in Germany in 2004 (Hoffman, 2007, p.466).
2.2 Measuring outcome: functioning and effectiveness of pricing CO2 in relation to
emission trading and innovation in electric companies in the pilot phase
Electricity represents a 50% of overall emissions regulated by the EU-ETS. It is, therefore, one of the
most important sectors where this European policy was imposed, being key for CO2 prices, and of
course for the success of the project (Neuhoff et al, 2011). The electricity providing sector is also
responsible for one third of Green House Gases emissions in Europe, so it is not surprising that it was
particularly affected by the creation of the EU-ETS (EC, 2007 and Alberola et al, 2007).
The main objective of the Pilot Phase was incenting Power Plants and Energy- Industrial Sectors to
reduce their emissions of CO2 by the promotion of low carbon technologies (Alberola, E. et al, 2007).
Hence, at the beginning, the EU-ETS was mainly focused on electricity producers and industries and
just on CO2 emissions.
In this part of this research the focus is on how effective the EU-ETS was in its pilot phase, in terms of
EUA prices (European Union allowances) and emission trading. These are the prices of the CO2
permits that electric companies could buy in order to emit CO2 if they exceed the cap level.
It is difficult to measure the effectiveness of the EU-ETS in terms of electricity prices because data are
complex to obtain and, as there is no common market of electricity in Europe and, although prices
have decreased over the years, they have not achieve a convergence (Germany involves the biggest
15
electricity market in Europe and the European Energy Exchange (EEX) is one of the most important
European power exchange market) (Mo et al, 2012)
Energy prices were the main drivers of carbon prices, as power generators were able to change their
fuel inputs from coal to natural gas, which would rapidly reduce CO2 emissions. (Alberola et al, 2007).
The increase of gas prices was the main issue that affected the implementation of the EU-ETS in
electricity sector on the pilot phase because it reduced the possibility for electricity producers to
switch from the most pollutant sources (coal and oil) to a cleaner fuel as gas. Clearly, this missed
switch was due to the still higher profitability of using coal instead of gas (Grubb et al., 2006).
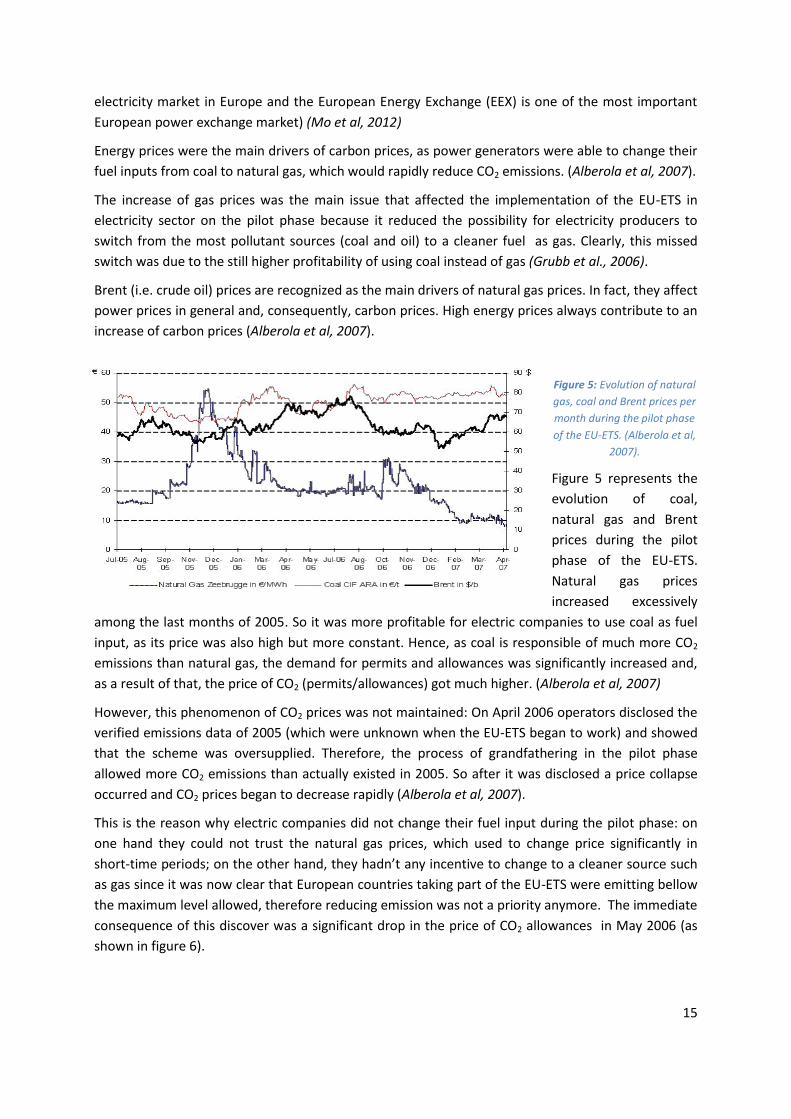
Brent (i.e. crude oil) prices are recognized as the main drivers of natural gas prices. In fact, they affect
power prices in general and, consequently, carbon prices. High energy prices always contribute to an
increase of carbon prices (Alberola et al, 2007).
Figure 5: Evolution of natural
gas, coal and Brent prices per
month during the pilot phase
of the EU-ETS. (Alberola et al,
2007).
Figure 5 represents the
evolution of coal,
natural gas and Brent
prices during the pilot
phase of the EU-ETS.
Natural gas prices
increased excessively
among the last months of 2005. So it was more profitable for electric companies to use coal as fuel
input, as its price was also high but more constant. Hence, as coal is responsible of much more CO2
emissions than natural gas, the demand for permits and allowances was significantly increased and,
as a result of that, the price of CO2 (permits/allowances) got much higher. (Alberola et al, 2007)
However, this phenomenon of CO2 prices was not maintained: On April 2006 operators disclosed the
verified emissions data of 2005 (which were unknown when the EU-ETS began to work) and showed
that the scheme was oversupplied. Therefore, the process of grandfathering in the pilot phase
allowed more CO2 emissions than actually existed in 2005. So after it was disclosed a price collapse
occurred and CO2 prices began to decrease rapidly (Alberola et al, 2007).
This is the reason why electric companies did not change their fuel input during the pilot phase: on
one hand they could not trust the natural gas prices, which used to change price significantly in
short-time periods; on the other hand, they hadn’t any incentive to change to a cleaner source such
as gas since it was now clear that European countries taking part of the EU-ETS were emitting bellow
the maximum level allowed, therefore reducing emission was not a priority anymore. The immediate
consequence of this discover was a significant drop in the price of CO2 allowances in May 2006 (as
shown in figure 6).
16
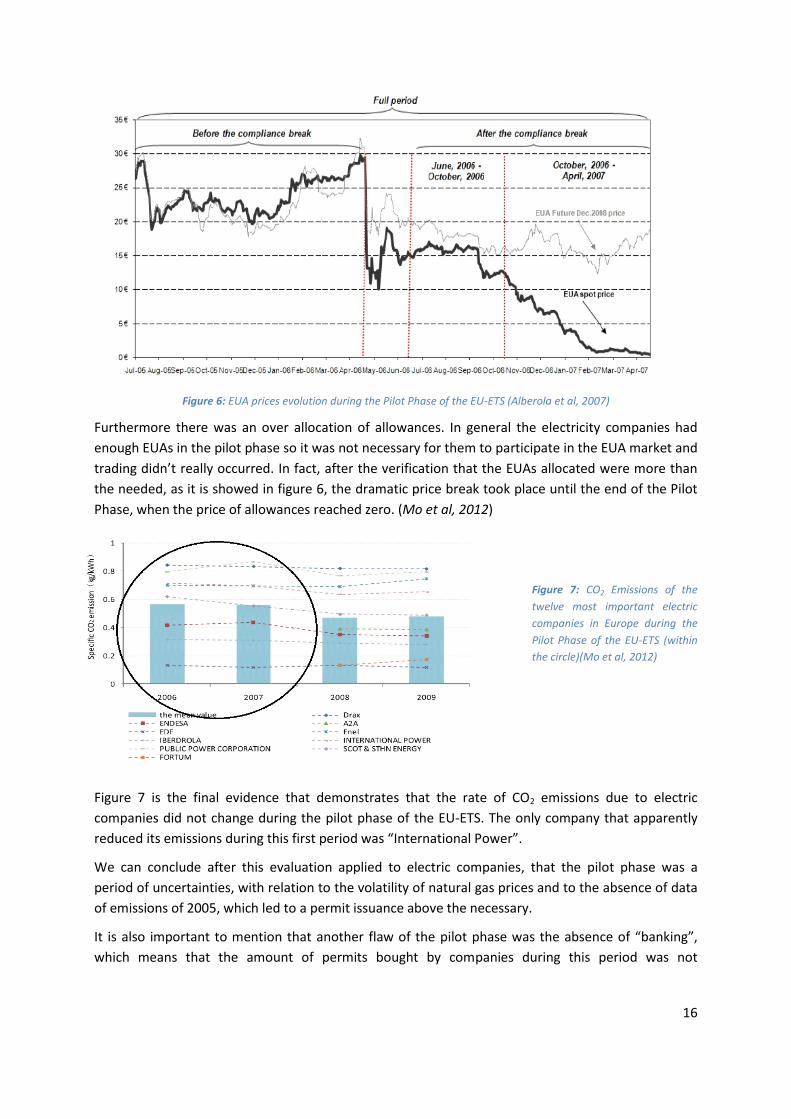
Figure 6: EUA prices evolution during the Pilot Phase of the EU-ETS (Alberola et al, 2007)
Furthermore there was an over allocation of allowances. In general the electricity companies had
enough EUAs in the pilot phase so it was not necessary for them to participate in the EUA market and
trading didn’t really occurred. In fact, after the verification that the EUAs allocated were more than
the needed, as it is showed in figure 6, the dramatic price break took place until the end of the Pilot
Phase, when the price of allowances reached zero. (Mo et al, 2012)
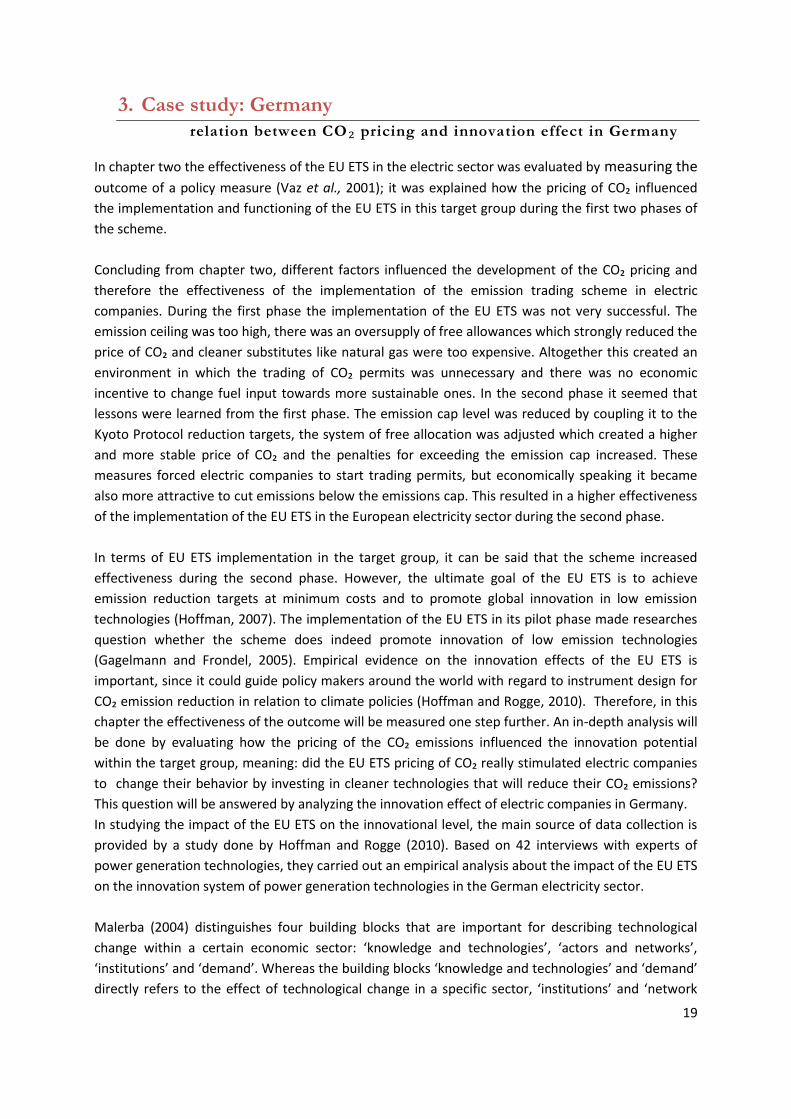
Figure 7: CO2 Emissions of the
twelve most important electric
companies in Europe during the
Pilot Phase of the EU-ETS (within
the circle)(Mo et al, 2012)
Figure 7 is the final evidence that demonstrates that the rate of CO2 emissions due to electric
companies did not change during the pilot phase of the EU-ETS. The only company that apparently
reduced its emissions during this first period was “International Power”.
We can conclude after this evaluation applied to electric companies, that the pilot phase was a
period of uncertainties, with relation to the volatility of natural gas prices and to the absence of data
of emissions of 2005, which led to a permit issuance above the necessary.
It is also important to mention that another flaw of the pilot phase was the absence of “banking”,
which means that the amount of permits bought by companies during this period was not

17
transferable to the second phase. Therefore, the extent of allowances that were bought and not used
in the pilot phase lost their value in entirety (EC, 2012).
The pilot phase was not really effective if we consider the emissions of CO2 which, on the other hand,
never surpassed the limits established when the EU-ETS was created. However, it was a preparatory
phase and it was useful to get information to keep developing the project during the Second Phase.
2.3 Measuring outcome: functioning and effectiveness of pricing CO2 in relation to
emission trading and innovation in electric companies in the second phase
The second phase started in 2008 and continued until 2012. This period coincides in time with the
Kyoto protocol and the objective cap is set according to targets set in the protocol. The main purpose
of this second phase was to achieve an emission reduction of 12% compared to the pilot phase
(Convery et al., 2013).
Other changes that were made in the pilot phase was an increase of the kind of industries under the
EU- ETS and a decrease of 6,5% of the number of allowances divided in the electric sector (Ahamada
et al, 2012). This decrease of allowances was to elude legal and distributional problems. If there is an
excess of allowances, the allowances loss their value and are not needed to achieve the pollution
objectives, so the market system does not work and the Kyoto protocol caps will not be achieved
(Grubb and Neuhoff, 2006).
The free assignation of allowances was reduced from 95% in the pilot phase to 90% in the second
phase. The penalties were increased from 40€/ton CO2 in the first phase to 100€/ ton CO2 in the
second phase. These new measures made that the profits of the electricity sector were more
determined by the allowances, therefore, participating CO2 trading was increased and reduction
became more attractive/profitable for electric companies (Mo et al, 2012).
Due to the no allowance of banking, and the coal crash caused by the economic recession, the
unstable prices in the allowances continued along the first period of the second phase (Cummins,
2013). Reducing the amount of CO2 is more difficult than reducing other pollutants. So there was a
controversy about the reduction of allowances because this makes prices unstable. Due to the big
dependency of the electricity sector on the CO2 emissions, the instability of the prices in this sector
could be even higher (Grubb and Neuhoff, 2006). This instability disincentives electric companies to
invest in renewable energies, This is one of the most criticized points against the effectiveness of the
cap-and-trading system (Linares et al, 2013).

18
Figure 8: the evaluation of CO2 prices from 2005 to 2010 (Aatola et al, 2013).
In figure 8 the evolution of prices of the allowances since 2005 to 2010 is shown. In this part of the
paper the focus is on the second phase which was from 2008 to 2012. In that part of the graph the
prices were between 20 or 30€/ton CO2 from March to October 2008 with a maximum of 28 €/ton in
July. There is a decreasing of the prices under the 20 €/ton CO2 with a minimum in February of
8€/ton CO2 and a recovering of the prices until December 2010 of 13-14€/ton CO2 A stabilization of
the prices was maintained in 2009 until the end of the second phase (Ahamada et al, 2012). This
sustainability of the prices in the second period of the second phase was due to the increasing of
liquidity; the mellowing of the markets; the allowance of banking and the extension of the cap and
trading system to other sectors (Aatola et al., 2013).
In the second phase the effectiveness of the emission allowances could be measured by its increased
capacity for creating an adequate framework for the actual occurrence of emission trading and some
small investments in new technology. These incentives for trading and investing were mostly a result
of lowering the emission cap, higher penalties for exceeding the cap, less grandfathering and the
stabilization of carbon prices. The stabilization of the prices created reliability in the cap and trade
system and its functioning. So the risk of the inversion in new technologies became lower and the
profitability of buying allowances instead of continuing polluting and paying the fines increased. The
companies dared to invest in (research for) new, cleaner technologies because the risk of losing
money in long term decreased and they were able to assume this risk. Also the allowance of banking
ensured the profitability of the allowances in long term increasing its market value (Mo et al, 2012).
19
3. Case study: Germany
relation between CO₂ pricing and innovation effect in Germany
In chapter two the effectiveness of the EU ETS in the electric sector was evaluated by measuring the
outcome of a policy measure (Vaz et al., 2001); it was explained how the pricing of CO₂ influenced
the implementation and functioning of the EU ETS in this target group during the first two phases of
the scheme.
Concluding from chapter two, different factors influenced the development of the CO₂ pricing and
therefore the effectiveness of the implementation of the emission trading scheme in electric
companies. During the first phase the implementation of the EU ETS was not very successful. The
emission ceiling was too high, there was an oversupply of free allowances which strongly reduced the
price of CO₂ and cleaner substitutes like natural gas were too expensive. Altogether this created an
environment in which the trading of CO₂ permits was unnecessary and there was no economic
incentive to change fuel input towards more sustainable ones. In the second phase it seemed that
lessons were learned from the first phase. The emission cap level was reduced by coupling it to the
Kyoto Protocol reduction targets, the system of free allocation was adjusted which created a higher
and more stable price of CO₂ and the penalties for exceeding the emission cap increased. These
measures forced electric companies to start trading permits, but economically speaking it became
also more attractive to cut emissions below the emissions cap. This resulted in a higher effectiveness
of the implementation of the EU ETS in the European electricity sector during the second phase.
In terms of EU ETS implementation in the target group, it can be said that the scheme increased
effectiveness during the second phase. However, the ultimate goal of the EU ETS is to achieve
emission reduction targets at minimum costs and to promote global innovation in low emission
technologies (Hoffman, 2007). The implementation of the EU ETS in its pilot phase made researches
question whether the scheme does indeed promote innovation of low emission technologies
(Gagelmann and Frondel, 2005). Empirical evidence on the innovation effects of the EU ETS is
important, since it could guide policy makers around the world with regard to instrument design for
CO₂ emission reduction in relation to climate policies (Hoffman and Rogge, 2010). Therefore, in this
chapter the effectiveness of the outcome will be measured one step further. An in-depth analysis will
be done by evaluating how the pricing of the CO₂ emissions influenced the innovation potential
within the target group, meaning: did the EU ETS pricing of CO₂ really stimulated electric companies
to change their behavior by investing in cleaner technologies that will reduce their CO₂ emissions?
This question will be answered by analyzing the innovation effect of electric companies in Germany.
In studying the impact of the EU ETS on the innovational level, the main source of data collection is
provided by a study done by Hoffman and Rogge (2010). Based on 42 interviews with experts of
power generation technologies, they carried out an empirical analysis about the impact of the EU ETS
on the innovation system of power generation technologies in the German electricity sector.
Malerba (2004) distinguishes four building blocks that are important for describing technological
change within a certain economic sector: ‘knowledge and technologies’, ‘actors and networks’,
‘institutions’ and ‘demand’. Whereas the building blocks ‘knowledge and technologies’ and ‘demand’
directly refers to the effect of technological change in a specific sector, ‘institutions’ and ‘network
20
and demands’ takes a closer look to the role that interrelated sectors and institutions play in
promoting technological change (Malerba, 2002, 2004). Since the focus of this case study will be on
the innovation effect of the EU ETS on the German electricity sector, the research on the role of
institutions, actors and networks will be left out.
Knowledge and technologies
Knowledge and technologies refers to EU ETS driven investments in energy efficiency that reduces
CO₂ emission of existing power plants and investments in Research Development and Demonstration
(RD&D) within emerging renewable or CO₂ reducing technologies (Rogge and Hoffman, 2010).
Rogge and Hoffman (2010) found that the introduction of the EU ETS promoted the research for CO₂-
free technologies in three main areas in Germany.
Firstly, the EU ETS significantly increased RD&D activities on carbon capture and storage (CCS)
techniques in Germany. Climate policies as a whole is the driver for CCS, but it is the EU ETS that
brings the monetary effects into businesses so, ultimately, the EU ETS can be seen as the main driver.
Secondly, in chapter 2.2 it was seen that the electricity supply in Germany depends for almost 50%
on coal-fired power plants (Hoffman, 2007, p.466). Since the impact of the CO₂ price is particularly
strong for coal, it makes economic sense to reduce the carbon emissions of electricity production by
coal. Therefore the EU ETS reinforced on-going energy efficiency RD&D for large fossil-fuel-fired
power plants. Again, efficiency was already on the agenda of these power plants, but due to the
monetary effect of the EU ETS these tendencies were reinforced. Thirdly, the EU ETS appears to only
indirectly benefit RD&D on technologies for renewable energy sources. Since the implementation of
the EU ETS more projects on renewables are carried out, however in itself the trading scheme does
not significantly affect the RD&D on renewables. Instead other policies and developments, like
governmental support measures is are main drivers for RD&D on renewables.
In general the technical system of electric companies tends to evolve relatively slow because of the
long lifetime of power generation equipment, which varies from 20 up to 90 years (IEA, 2008). This
makes it rather difficult to already draw conclusions about the innovation effective of the EU ETS
within the area knowledge and technologies (Hoffman and Rogge, 2010).
Demand
This topic refers to the demand of electricity companies to power generating technologies. In this
case it is interesting to see if the EU ETS created an incentive for the electricity sector to increase the
demand for low carbon power generating technologies (Hoffman and Rogge, 2010). The research of
Hoffman and Rogge (2010) shows that mostly during the second phase, the pricing of carbon created
five developments in this demand. Firstly, in the beginning years of the EU ETS, the pricing of carbon
seemed to cause a negative reversed effect. Due to oversupply of free allowance and a German
allocation rule of guaranteeing an unchanged level of free allocation for power plants for 14 years,
investments in new power plants were economically attractive for companies. This created a
temporally interest of electric companies to build new fossil-fuel plants in Germany. However during
the second phase both of these rules were cut, which made it more difficult to establish profitable
new fossil-fuel power plants. Secondly, in principle the pricing of carbon incentivized German electric
companies to switch to fuels with lower carbon intensities in the second phase of the EU ETS. But in
Germany these incentives were not all decisive for investment decisions in cleaner technologies,
since this decision was also based on other factors than just the price of CO₂. In this sense the high

21
price of a cleaner substitute – natural gas – played a big role. The price of carbon had to be €60,- to
€70,- per ton of CO₂ to make gas a profitable alternative. But also supportive laws and public
acceptance of new power plants played a role in stimulating innovational change. Thirdly, investment
decisions for cleaner technologies mainly took place in existing or planned coal plants and were
mostly focused on carbon storage techniques. This development was not driven by the EU ETS alone,
but also by authorities that made CCS techniques a precondition for granting a construction permit
for new fossil- fuel power plants and by the price of CO₂, which had to be high enough to compete
with these kind of innovations. Fourthly, it is shown that the EU ETS revealed an incremental increase
in the investments of energy efficiency improvements in new and existing plants, mostly in coal-fired
ones. And lastly, the EU ETS contributes only indirect and relatively weak to an increased demand for
renewable power generation technologies (Rogge and Hoffman, 2010).
In the case of Germany it can be concluded that the system of CO₂ pricing under the EU ETS
stimulated some innovational effect, mostly noticeable since the second phase. Largely, this
accounted for incrementally effects influencing the rate and direction of technological development
and implementation of cleaner power generation technologies, with the main impact occurring in the
high- emitting coal-fired plants. In the case of ‘knowledge and technologies’, innovation took place in
the research fields of energy efficiency and carbon capture techniques. Up to now, these have been
the most prominent direct innovation effects of the EU ETS on the electricity sector of Germany.
Regarding demand, so far the influence of the pricing of CO₂ under the EU ETS had only a limited
effect on the demand of German electricity companies for low emitting technologies. Mainly this can
be explained due to the lack of stringency and predictability of the scheme and the relatively greater
importance of other factors, such as fuel prices of cleaner substitutes and public and governmental
support. When investments in cleaner technologies took place, it mostly concerned innovations
regarding energy efficiency and carbon storage implemented in existing high- emitting- and future
planned power plants (Hoffman and Rogge, 2010). So far, the EU ETS had only a small and indirect
effect on the investments of renewable power generation technologies, so here is room for
improvement during the third phase of the EU ETS.
Above all it can be concluded that the EU ETS triggered innovational change in the implementation
and research of power generation technologies in a limited set of areas of the German electricity
sector. More precisely, changes in the innovation system of the electricity sector occurred because of
a combined effect of several policies that are working towards the same goal: a more sustainable
German electricity sector (Hoffman and Rogge, 2010). Also it can be stated that context factors, e.g.
the price of a cleaner substitute, play a major role in the innovation effect. As a recommendation for
implementation in other and future areas, policy- makers can increase the innovation effect of the
EU ETS by focusing on the interplay of the EU ETS with other policies that work towards the same
goal and by being aware of the decreasing innovation effect that external factors can play.
22
Discussion The EU-ETS is an ambitious project of international significance, a long-range project referring to CO₂
reduction that shows how important the cooperation between different countries is in order to solve
global problems, as climate change.
As it is a policy of such big dimensions, the EU-ETS is based upon lots of facts. This requires that all
those facts come to an equilibrate state in which this project will be working properly to finally
manage all the objectives purposed in the EU-ETS and in the Kyoto Protocol.
One of the main lessons learned from the EU-ETS, and from which policy-makers should always take
care, is the necessity of complete information when creating and environmental policy. Concretely,
this lesson was showed in the pilot phase when the cap levels were imposed without knowing the
emissions data of the year 2005. This conducted to a wrong establishment of boundaries for CO₂
pollution, that were over the levels that were actually necessary.
Lots of uncertainties have surrounded this European Policy since its creation. One of the main
uncertainties we are facing in this project is: Until what point is the reduction of CO₂ actually related
to the cap and trade system and not to other variables or policies? Or how can we know that the
decrease of Green House Gases is mainly caused by this policy and not to economic crisis that led to
a reduction of carbon consumption during those years? Or to an increase of reforestation in Europe?
Or because of other environmental policies or taxes imposed for pollutant activities?
Germany is a good example of this situation, as is one of the most important European countries in
CO₂ reduction, but not just because of the EU-ETS, but for other policies that were being developed
there before 2005. Hence, the EU-ETS can be effective, but it also depends on other policies.
According to Rogge and Hoffman, 2010, p.764, a coordinated policy mix may benefit from a closer
cooperation of environmental, energy and innovation policy departments to achieve a better
alignment of the various regulatory measures.
The point that this system is completely related to economy, creates an ethical problem as
environment should not only be tied to economy: the cap and trade system is managing reduction
objectives in terms of establishing limits that involve the payment of fees in case of non-compliance.
This makes the reduction of CO2 an obligation for pollutant companies and not a moral issue for
society which it should be. If the protection of the environment turns to an obligation for the
companies and thee economy crashes, the environment is often seen as a luxury of better times
instead of a necessity in the society.
On the other hand, the introduction of the environmental issues in the economic system helps to
promote the environmental problems and introduces them in the society as something more
tangible.
However, the EU-ETS is a necessary and effective policy which requires a continuous evaluation of
each of its phases in order to learn from the previous phases and therefore, to work properly.
Lessons learned from the first phase (necessity of knowing emission data, necessity of banking) were
useful in order to improve the policy in its second phase. Therefore it is expected, that the EU-ETS (if
regular revise) will continue to be an important, although in itself insufficient, element in the policy
23
mix needed to decarbonize the electricity sector (Hoffmand and Rogger, 2010). Now it is time to take
into account every error and uncertainty faced previously to achieve the objectives of the third phase
until 2020.
Conclusion
This paper basically underlines EU ETS effectiveness and functioning about the electric sector
throughout the first two phases. It was tried to find an answer on the following research question:
“How did the pricing of CO₂ emissions influenced the functioning and effectiveness of the emission trading scheme (EU ETS) when focusing on the trading of emissions and its innovation effect in the electricity sector during the first two phases of the scheme?”
It’s shown that in the pilot phase the EU-ETS has not been very effective yet. The setting of the cap
was too high, there was an oversupply of free allowances which caused a low and unstable CO₂ price
and cleaner substitutes like natural gas were too expensive. This created an environment in which
emission trading was unnecessary and there was no economic incentive for electric companies to
switch to more cleaner fuel inputs. The second phase saw a decisive improvement. The coupling of
the Kyoto Protocols reduction targets to the EU-ETS had a significant role in this success. Other
important factors for this improve were: the insertion of auctioning in allocation of permits, an
increase of penalties for exceeding the emission cap, adjustment of the system of free which created
a higher and more stable price of CO₂ and the authorization of banking. These measures forced
electric companies to start trading emissions. But economically speaking it became also more
attractive for electric companies to cut emissions below the emission cap and it seemed that the
companies were willing to invest in cleaner technologies. This resulted in a higher effectiveness of
the output and outcome of the EU-ETS in the European electricity sector during the second phase. At
first glance, the case study seems to confirm that the EU- ETS pushes firms to invest increasingly in
RD&D, energy efficiency and carbon storage techniques to lower their emission output. A relation
between the EU-ETS and the investment in technologies for renewable energies is still very small, so
here is room for improvement for the third phase. However, when taking a more holistic, it seems
that other factors than the EU-ETS has also played a big role for stimulating German electric
companies to invest in cleaner technologies. Factors that can be mentioned are: the whole set of
German environmental policies stimulating a sustainable future of the electricity sector; the variation
of fuel prices; the price of cleaner substitutes; public support for new power generation plants and
security of a stable competitive position.
Thus, it can be confirmed that EU ETS is a trigger of technological change only for few elements
within the electric sector in Germany. However, it have to be consider that Germany had already
engaged in emission reduction targets some years before the implementation of EU ETS. Therefore
the role of the policy mix needs to be included in giving a judgment on effectiveness. Such a policy
mix can make EU-ETS constraints less arduous to bear for German electricity firms was still existing
and, of course, it made EU ETS constraint less arduous to bear for German firms. Such a context need
to be kept in mind when measuring the effectiveness of the EU-ETS in other countries.

24
References
Aatola P., Ollikainen M., & Toppinen A. (2013). Price determination in the EU ETS market:
Theory and econometric analysis with market fundamentals. 36: 380–395.
Ahamada I. and Kirat D. (2012). The impact of phase II of the EU ETS on the electricity-
generation sector ( January 9).
Alberola E., Chevallier J., & Chèze B. (2007). European carbon prices fundamentals in 2005-
2007: the effects of energy markets, temperatures and sectorial production.
Baumol, W.J. (1972). On Taxation and the Control of Externalities. American Economic
Review, 62 (3): 307–322.
Chen, H.T. (1990). Theory-Driven Evaluations. Newbury Park, CA: Sage
Crocker, T.D. (1966). The Structuring of Atmospheric Pollution Control Systems”. In: Wolozin,
H. (Ed.), The Economics of Air Pollution. New York: W.W. Norton and Company, Inc.
Connely, J. and Smith, G. (2003). Chapter 5 “Choosing the Means”. In Politics and the
Environment: from Theory to Practice. London: Routledge Press, pp. 157 – 186
Convery F.J., Redmond L. (2013). Market and Price Developments in the European Union
Emissions Trading Scheme. Review of Environmental Economics and Policy 1 (1) (November
14): 88–111.
Cummins M. (2013). EU ETS market interactions: The case for multiple hypothesis testing
approaches. Applied Energy, 111, -, pp701-709
Dales, J. (1968). Pollution, Property and Prices. Toronto: University Press.Delarue, E., A.D.
Ellerman and W.
Doble C. and Kinnunen, H. (2005). The environmental effectiveness of the EU ETS : analysis of
caps". ILEX Energy Consulting Ltd. Retrieved 6 June 2012
Espina, P.C. 2009. Missing the emission trade bonanza [online]. [Consulted November 28,
2013 17:00]. Available on the World Wide Web: http://www.globaltimes.cn/business/top-
photo/2009-07/449053.html
Environmental Agency. (2013). EU Emissions Trading System (EU ETS). Retrieved from
environment-agency Web Site on 2 Dec 2013, available at: http://www.environment-
agency.gov.uk/business/topics/pollution/140761.aspx
European Commission (EC). (2007). EU action against climate change - EU emissions trading:
an open system promoting global innovation.
European Commission. (2008). EU action against climate change-The EU Emissions Trading
Scheme. European Commission, Brussels.
25
European Commission (EC). (2012). Banking of units under EU ETS, California and Australia
emission trading schemes. Retrieved from emissions-euets.com Web Site on 2 Dec 2013,
available at: http://www.emissions-euets.com/banking
European Commission (EC). (2013). The EU Emission Trading Scheme. Retrieved from
European Commission official website on 2 December 2013, available at:
http://ec.europa.eu/clima/policies/ets/
European Parliament and the Council of the European Union (2002) ‘Decision No
1600/2002/EC of the European Parliament and of the Council of 22 July 2002 Laying Down
the Sixth Community Environment Action Programme’, Official Journal of the European
Communities L242(45): 1–15.
Gagelmann, F. and Frondel, M. 2005. The impact of Emission Trading on Innovation- Science
Fiction or Reality? European Environment 15 (4), pp.203 – 211
Grubb, M., and Neuhoff, K. (2006). Allocation and competitiveness in the EU emissions
trading scheme: policy overview. Climate Policy, 6(1), 7-30.
Gueldner, R. (2013). Opening speech annual meeting on nuclear technology 2013.
International Journal for Nuclear Power 58, p. 414
Gupta, A. (2013). Policy Evaluation – I (Evaluation frameworks). Wageningen University,
Social Science Centre, Wageningen. 5 November 2013. Lecture.
Gysen, J., Bachus, K., & Bruyninckx, H. (2002). Evaluating the Effectiveness of Environmental
Policy. An Analysis of Conceptual and Methodological Issues. status: published.
Hahn, R. W., & Stavins, R. N. (2010). The effect of allowance allocations on cap-and-trade
system performance (No. w15854). National Bureau of Economic Research.
Hoffmann, V. H. (2007). EU-ETS and investment decisions:: The case of the German electricity
industry. European Management Journal, 25(6), 464-474
Hoffman, V.H. and Rogge, K.S. 2010. The impact of the EU ETS on the sectoral innovation
system for power generation technologies – Findings for Germany. Energy Policy 38, pp.7639
- 7652
IEA, 2008. World Energy Outlook 2008. OECD/IEA, Paris
Jacobo, A. D. (1997). Instrumentos económicos para la regulación ambiental: los permisos
ambientales transaccionales. Cuadernos de Ciencias Económicas y Empresariales, (33), 35-52
Karoline S. R., Volker H.H. (2010). The impact of the EU ETS on the sectorial innovation
system for power generation technologies – Findings for Germany. p.764.
Linares P., Pintos P. (2013). Los Efectos Económicos del Sistema Europeo de Comercio de
Emisiones de Gases de Efecto Invernadero (November).

26
Malerba, F. 2002. Sectoral systems of innovation and production. Research Policy 31 (2),
pp.247- 246
Malerba, F. 2004. Sectoral systems of innovation, Concepts, Issues and Analyses of Six Major
Sectors in Europe. Cambridge University Press, Cambridge.
Mickwitz, P. (2003). A Framework for Evaluating Environmental Policy Instruments Context
and Key Concepts. Evaluation, 9(4), 415-436.
Mills, P. (2008). La era verde de los mercados: los mercados financieros pueden esempeñar
una valiosa función frente al cambio climático. Finanzas y desarrollo: publicación trimestral
del Fondo Monetario Internacional y del Banco Mundial, 45(1), 32-36.
Mo, J., Lei, Z. & Fan, Y. (2012). The impact of the EU ETS on the corporate value of European
electricity corporations. Energy journal, 45 (1), 3-11.
Neuhoff K., Martinez K.K., & Sato M. (2006). Allocation, incentives and distortions: the impact
of EU ETS emissions allowance allocations to the electricity sector. Climate Policy, 6(1), 73-
91.
Neuhoff, K. (2009). Memorandum submitted by Karsten Neuhoff, Assistant Director, Electric
Policy Research Group, University of Cambridge. The role of carbon markets in preventing
dangerous climate change. The fourth report of the 2009–10 session. UK Parliament House
of Commons Environmental Audit Select Committee. Retrieved 1 May 2010.
Newbery, D. (2009). "Written evidence.". Memorandum submitted by David Newbery,
Research Director, Electric Policy Research Group University of Cambridge. The role of carbon
markets in preventing dangerous climate change. The fourth report of the 2009–10 session.
UK Parliament House of Commons Environmental Audit Select Committee. Retrieved 30 April
2010.
Rabbani, R., & Muhájir, R. (2008). Permisos negociables de emisión de CO2 en la UE.
Rogge, K.S. and V.H. Hoffmann (2009), The impact of the ETS on the sectoral innovation
system for power generation technologies – Findings for Germany, Working paper in
sustainability and innovation, No S2/2009.
Scriven, M. (1991). Evaluation thesaurus. Sage.
Stavins R. (2012). Two Notable Events Prompt Examination of an Important Property of Cap-
and-Trade. Retrieved from robertstavinsblog.org Web Site on 2 Dec 2013, available at:
http://www.robertstavinsblog.org/2012/07/21/two-notable-events-prompt-examination-of-
an-important-property-of-cap-and-trade/
Taylor J.D.M. (2002) Economist warns against false market of CO2 controls. Retrieved from
Heartland Institute Web Site on 2 Dec 2013, available at:
http://news.heartland.org/newspaper-article/2002/01/01/economist-warns-against-false-
market-co2-controls
27
Vaz S.G., Martin J., Wilkinson D., Newcombe J., & Ribeiro T. (2001). Reporting on
environmental measures: Are we being effective? European Environmental Agency,
Environmental issue report, No. 25, pp. 1 - 35
Appendix
Appendix 1
Figure 1: National Allocation Plan for each Member State of the EU. Reduction target is % change compared to base year of the Kyoto target in 1990 (EC, 2007, p.10).
Related Documents