This is a repository copy of Evaluating techniques for metagenome annotation using simulated sequence data. White Rose Research Online URL for this paper: http://eprints.whiterose.ac.uk/99597/ Version: Accepted Version Article: Randle-Boggis, Richard James, Helgason, Thorunn orcid.org/0000-0003-3639-1499, Sapp, Melanie et al. (1 more author) (2016) Evaluating techniques for metagenome annotation using simulated sequence data. FEMS MICROBIOLOGY ECOLOGY. ISSN 0168-6496 https://doi.org/10.1093/femsec/fiw095 [email protected] https://eprints.whiterose.ac.uk/ Reuse This article is distributed under the terms of the Creative Commons Attribution-NonCommercial (CC BY-NC) licence. This licence allows you to remix, tweak, and build upon this work non-commercially, and any new works must also acknowledge the authors and be non-commercial. You don’t have to license any derivative works on the same terms. More information and the full terms of the licence here: https://creativecommons.org/licenses/ Takedown If you consider content in White Rose Research Online to be in breach of UK law, please notify us by emailing [email protected] including the URL of the record and the reason for the withdrawal request.

Welcome message from author
This document is posted to help you gain knowledge. Please leave a comment to let me know what you think about it! Share it to your friends and learn new things together.
Transcript

This is a repository copy of Evaluating techniques for metagenome annotation using simulated sequence data.
White Rose Research Online URL for this paper:http://eprints.whiterose.ac.uk/99597/
Version: Accepted Version
Article:
Randle-Boggis, Richard James, Helgason, Thorunn orcid.org/0000-0003-3639-1499, Sapp, Melanie et al. (1 more author) (2016) Evaluating techniques for metagenome annotation using simulated sequence data. FEMS MICROBIOLOGY ECOLOGY. ISSN 0168-6496
https://doi.org/10.1093/femsec/fiw095
[email protected]://eprints.whiterose.ac.uk/
Reuse
This article is distributed under the terms of the Creative Commons Attribution-NonCommercial (CC BY-NC) licence. This licence allows you to remix, tweak, and build upon this work non-commercially, and any new works must also acknowledge the authors and be non-commercial. You don’t have to license any derivative works on the same terms. More information and the full terms of the licence here: https://creativecommons.org/licenses/
Takedown
If you consider content in White Rose Research Online to be in breach of UK law, please notify us by emailing [email protected] including the URL of the record and the reason for the withdrawal request.

Evaluating techniques for metagenome annotation using
simulated sequence data.
Richard J. Randle-Boggis1*, Thorunn Helgason1, Melanie Sapp2, and Peter D. Ashton1
1Department of Biology, University of York, York, YO10 5DD, UK
2Fera Science Ltd., Sand Hutton, York, YO41 1LZ, UK
* Corresponding author’s e-mail address: [email protected]
Keywords: DNA sequencing; Metagenomics; Metagenome analysis; Microbial ecology;
Sequence annotation
FEMS Microbiology Ecology Advance Access published May 8, 2016 by guest on M
ay 11, 2016http://fem
sec.oxfordjournals.org/D
ownloaded from

Abstract
The advent of next-generation sequencing has allowed huge amounts of DNA
sequence data to be produced, advancing the capabilities of microbial ecosystem studies. The
current challenge is identifying from which microorganisms and genes the DNA originated.
Several tools and databases are available for annotating DNA sequences. The tools, databases
and parameters used can have a significant impact on the results: naïve choice of these factors
can result in a false representation of community composition and function. We use a
simulated metagenome to show how different parameters affect annotation accuracy by
evaluating the sequence annotation performances of MEGAN, MG-RAST, One Codex and
Megablast. This simulated metagenome allowed the recovery of known organism and
function abundances to be quantitatively evaluated, which is not possible for environmental
metagenomes. The performance of each program and database varied, e.g. One Codex
correctly annotated many sequences at the genus level, whereas MG-RAST RefSeq produced
many false positive annotations. This effect decreased as the taxonomic level investigated
increased. Selecting more stringent parameters decreases the annotation sensitivity, but
increases precision. Ultimately, there is a trade-off between taxonomic resolution and
annotation accuracy. These results should be considered when annotating metagenomes and
interpreting results from previous studies.
by guest on May 11, 2016
http://femsec.oxfordjournals.org/
Dow
nloaded from
Introduction
The advent of next-generation sequencing and metagenomics has resulted in
increasing numbers of ever-larger datasets describing the community structure and function
of a variety of different environments, from the human gut (Arumugam et al. 2011; David et
al. 2014) to arctic peat soils (Lipson et al. 2013) and deep-sea vents (Xie et al. 2011;
Anderson, Sogin and Baross 2015), to name a few. Next-generation sequencing technologies
have greatly reduced sequencing costs and speed, and researchers can now affordably study
whole microbial communities and functions. Prior to this, the focus was on community
species composition, studied using 16S rRNA targeted amplicon sequencing. Amplicon
sequencing does not require the DNA coverage that metagenomic studies require and can
accurately identify which species are present in a sample (Woese and Fox 1977; Lane et al.
1985; Hugenholtz 2002), but it does not provide the depth of information, such as gene
function, that full metagenome sequencing and annotation provides. Cost is no longer the
primary limiting factor for undertaking metagenomic studies; rather it is now bioinformatics
and processing power required to process the data produced. Illumina’s HiSeq platform, for
example, can affordably sequence the most complex of microbial communities, and the
challenge now is to interpret the data produced.
Henry et al. (2014) provide an extensive directory of tools available for different tasks
involved in a metagenomic project pipeline, related to a range of ‘omics’ studies. These may
include bespoke bioinformatics pipelines, downloadable programs and web-based services.
MEGAN (Huson et al. 2007) is a popular Graphical User Interface program for analysing and
visualising BLAST results to study the taxonomy of microbial communities. While MEGAN
typically analyses BLAST results in a few minutes, running BLAST searches against
reference sequences in a database is computationally intensive and slow for metagenomes
by guest on May 11, 2016
http://femsec.oxfordjournals.org/
Dow
nloaded from
(Thomas, Gilbert and Meyer 2012; Desai et al. 2012; Hunter et al. 2012). Web-based servers
are increasingly popular for processing large amounts of data. With an intuitive web interface
and a variety of analytical tools to choose from, MG-RAST (Meyer et al. 2008) is
increasingly cited. MG-RAST allows users to upload raw sequence files that are processed
through quality filters and annotated using a selection of user-defined parameters, such as
reference databases, minimum identity cut-off values, maximum E-values, or expect-values,
and minimum alignment lengths. Details of the processing procedure can be found in the
MG-RAST Technical Report (Wilke et al. 2013).
In response to the growing size of data sequenced, faster alignment methods are being
produced. RAPSearch2 (Zhao, Tang and Ye 2012) translates nucleotide sequences and aligns
them with annotated protein sequences, reporting to be c. 100 fold faster than BLASTX with
only a 1.3-3.2 % reduction in sensitivity (the proportion of sequences annotated). With
“accelerate” mode, the speed increase is up to 1,000 fold. PAUDA (Huson and Xie 2014)
uses a similar approach and claims to be 10,000 fold faster than BLASTX, although with a
significant reduction in sensitivity. DIAMOND (Buchfink, Xie and Huson 2015) purports to
be both fast and accurate, with a 20,000 fold increase in processing speed compared to
BLASTX. In sensitive mode, 99 % of sequences are aligned, with a speed increase of 2,000
fold compared to BLASTX. Like BLAST with Megablast, RAPSearch2 and DIAMOND
offer fast and sensitive modes, each coming at the cost of the other. The outputs from both
programs can be viewed and analysed using MEGAN.
One Codex is a web-based program that uses a different technique to BLAST and
MG-RAST to classify sequences (https://onecodex.com/). The program designers report that
it runs 900 times faster than BLAST while maintaining similar genus-level sensitivity and
precision (the proportion of annotated sequences that are correctly identified), taking hours
by guest on May 11, 2016
http://femsec.oxfordjournals.org/
Dow
nloaded from
rather than days to classify most metagenomes. One Codex works by comparing k-mers
(sequences of a set length) from a sequence to a reference database of k-mers; the greatest
number of 100 % k-mer matches determines the classification. BLAST and MG-RAST
classify sequences by matching them with the most similar sequences in a database. Unlike
MG-RAST, One Codex does not annotate genes for function.
The choice of database, minimum identity cut-off value (i.e. sequence match
stringency), minimum alignment length cut-off value and minimum E-value limit (the
probability a match has occurred by chance) all influence sequence annotation accuracy,
which, in turn, affect the reproducibility and interpretation of the data. An inherent issue with
metagenomic studies is that establishing the accuracy of sequence annotation for
environmental samples is practically impossible, given that the quantities of organisms and
genes are unknown. Therefore, determining the most effective annotation method is
fundamental to investigating environmental communities with confidence.
Databases
There are a variety of different reference nucleotide and amino acid databases available
for annotating gene or protein sequences (Supplementary Table 1). The M5NR database
(Wilke et al. 2012) incorporates information from a selection of different databases (see
Supplementary Table 1), increasing the amount of reference data available for annotation.
Using a single reference database may be the best option in some cases, for example where
16S rRNA amplicons are used as a method to identify taxa, rather than other genes.
Whereas taxonomic nomenclature is universal, governed by international conventions,
there are multiple approaches for functional classification. Two popular methods include
Clusters of Orthologous Groups (COG) (Tatusov, Koonin and Lipman 1997) and the Kyoto
by guest on May 11, 2016
http://femsec.oxfordjournals.org/
Dow
nloaded from

Encyclopedia of Genes and Genomes (KEGG) (Kanehisa and Goto 2000). COGs comprise
orthologous functions that allow for functional description of poorly characterised genomes
based on protein orthologs. KEGG provides a reference database of sequences with
functional pathway annotations. Both methods include a hierarchy of functional descriptions.
At the highest level, COG descriptions are characterised under: Cellular processes,
information storage and processing, metabolism, and poorly characterised. KEGG
descriptions are characterised under: cellular processes, environmental information
processing, genetic information processing, human diseases, and metabolism. Due to the
differences in characterisation approaches, COG and KEGG annotations cannot be compared
directly. COG is currently freely available. KEGG operates on a subscription basis, and MG-
RAST uses the latest freely available version (KEGG 2008).
Parameters
Selecting a minimum identity cut-off value for metagenome analysis is challenging
because interspecific sequence identity varies among genes. Too high a value will accurately
identify genes with highly conserved regions, such as 16S rRNA or highly conserved coding
genes with little synonymous substitution, but may fail to identify genes or non-coding
regions that are highly variable. Conversely, a value too low will allow for highly variable
genes to be identified, but may also incorrectly identify an organism/function, thus providing
false community/function profiles.
The optimum identity cut-off point for species identification using the 16S rRNA gene
is widely accepted as 97 % (Stackebrandt and Goebel 1994; Rosselló-Mora and Amann 2001;
Chun et al. 2007; Richter and Rosselló-Móra 2009; VEtrovský and Baldrian 2013; Mende et
al. 2013), although this value has its limitations. Some species, such as certain Rickettsia
spp., have a 16S rRNA gene similarity greater than 97 %, thus a cut-off value at this level
by guest on May 11, 2016
http://femsec.oxfordjournals.org/
Dow
nloaded from

would not differentiate between the species (Fournier et al. 2003). Stackebrandt and Goebel
(1994) suggest that a higher value may be more appropriate, but fewer sequences would be
annotated due to sequencing errors and sequence mutations. Typically, lower cut-off values
are suitable for metagenomic studies as the multitude of genes that contain varying degrees of
conservation are sequenced. The default value used by MG-RAST, and used in many
metagenomic studies (e.g. Tatusov, Koonin and Lipman 1997; Lipson et al. 2013), is 60 %,
as this allows for identification using less conserved genes and non-coding regions.
Minimum alignment lengths set the minimum length of sequence considered for
annotation. A lower value allows shorter sequences to be annotated, although the chance of
incorrectly annotating a shorter sequence is higher. A higher value will reduce this chance,
but may also reduce the number of annotations overall. Combining a low minimum alignment
length with a strict minimum identity cut-off value allows shorter sequences to be annotated
but with a high match criteria.
Setting maximum E-values and minimum alignment lengths allows stringency of
annotations to be controlled. E-values denote the maximum probability that a sequence
annotation has occurred by chance. Lower maximum E-values will reduce the number of
possible incorrect annotations, although this also reduces number of annotations retained for
analysis. The default maximum E-value used by MG-RAST is 1-e-5.
Aims
The aim of this study is to evaluate the accuracy of MEGAN, MG-RAST and One
Codex annotation methods while investigating how using different databases and parameters
impact the annotation of metagenomes. To do this, a novel simulated metagenome was
generated using the NCBI whole bacterial genome database and annotated using each
by guest on May 11, 2016
http://femsec.oxfordjournals.org/
Dow
nloaded from

pipeline and, for MG-RAST, with different reference databases, minimum identity cut-off
values, minimum alignment lengths and maximum E-values.
Using a simulated metagenome comprising known genome abundances allows the
accuracy of annotation to be quantified. The simulated metagenome was also annotated using
Megablast, a faster variation of BLAST, to provide a control and so that MEGAN, MG-
RAST and One Codex could be compared to a standard in sequence annotation. Comparing
the MEGAN, MG-RAST and One Codex annotations to the Megablast annotations will
quantify the accuracy of these programs for annotating sequences from organisms whose
genomes are stored in the NCBI databases.
Methodology
Metagenome simulation
A simulated metagenome, hereafter Simmet, was created using NeSSM (Jia et al.
2013), comprising the complete NCBI bacterial genome database
(ftp://ftp.ncbi.nlm.nih.gov/genomes/Bacteria/all.fna.tar.gz, May 2013 collection, accessed on
29/04/14). NeSSM creates synthetic metagenomes from input genomes based on user-defined
parameters (e.g. sequence count, length and abundance distributions) that aim to simulate real
sequencing data, including expected sequencing errors (i.e. substitutions, insertions, and
deletions) based on the chosen sequencing technology simulated (see “Step II: error models
and sequencing coverage bias estimation in Jia et al. (2013)). 2,400,000 sequences with a
read length of 450 base pairs were designated for simulation, based on 454 pyrosequencing.
One strain for each of the 1,505 species in the NCBI bacterial genome database was
randomly selected to be included in the simulation because certain species, e.g. model
by guest on May 11, 2016
http://femsec.oxfordjournals.org/
Dow
nloaded from

organisms and human pathogens such as Escherichia coli, Salmonella enterica,
Mycobacterium tuberculosis, Bacillus cereus and Staphylococcus aureus, have been
extensively studied and are over-represented in the databases. The resulting genus richness
was 688. The species abundance distribution used for simulation was derived from the
abundance distribution of a pasture soil metagenome (sequence count: 2,378,586, MG-RAST
ID: 4554767.3) (See Equation 1).
Equation 1.
検 噺 伐にねひど健券岫捲岻 髪 なひばねぱ
Where 捲 is the randomly selected species rank.
The sequences were processed with Sickle (Joshi and Fass 2011) to trim low quality
ends, with the average threshold phred score set at 20 (a base call error rate of 1 %).
Analysis
The Simmet metagenome file was annotated with Megablast (available from:
http://blast.ncbi.nlm.nih.gov/Blast.cgi?PAGE_TYPE=BlastDocs&DOC _TYPE=Download)
as a control, using a reference database of the genomes used to create Simmet. This quantifies
the effect that the simulated sequencing errors have on the annotations. The NCBI nucleotide
database (updated 17/11/2014) (ftp://ftp.ncbi.nlm.nih.gov/blast/db/) was also used to assess
the annotation performance of Megablast. The maximum E-value selected was 1-e-5 and the
minimum alignment length, 15 bases. Megablast annotations using the Simmet database will
be referred to as “control” and those using the NCBI nucleotide database will be referred to
as “Megablast”. The BLAST results were uploaded to MEGAN (version 5.2.3) and analysed
using the same parameters used in the BLAST.
by guest on May 11, 2016
http://femsec.oxfordjournals.org/
Dow
nloaded from

Simmet was uploaded to MG-RAST and One Codex. The databases investigated within
MG-RAST were: GenBank, GreenGenes, RDP, RefSeq, SEED, SwissProt and TrEMBL. The
M5NR and M5RNA databases were excluded from individual sequence analysis, as
individual sequence annotations were not available for download from MG-RAST for these
databases. RefSeq was used for One Codex. For both the Megablast and MG-RAST
annotations, which use a minimum sequence alignment match to annotated sequences, the
minimum identity cut-off values tested were: 40 %, 50 %, 60 %, 70 %, 80 %, 90 %, 95 % and
97 %. The minimum alignment lengths tested were: 10, 15, 20, 25, 30, 25, 40, 45, 50, 55 and
60 bp. The maximum E-values tested were: 1-e-1, 1-e-5, 1-e-10 and 1-e-15. Aside from testing,
default parameters were used: 60 %, 15 bp and 1-e-5, respectively, for minimum identify cut-
off, minimum alignment length and maximum E-value.
The sequence IDs and annotations were extracted from the Megablast results
(https://github.com/sandyjmacdonald/blast_parser) and full taxonomic lineages were
generated for each sequence using the NCBI taxonomy database (available from:
ftp://ftp.ncbi.nlm.nih.gov/pub/taxonomy/; NCBI database version generated 13/05/2013).
Species level was excluded from analysis due to the high variation in annotated species
nomenclature and the accepted caveats associated with microbial species classification
(Gevers et al. 2005; Achtman and Wagner 2008), e.g. horizontal gene transfer (Gogarten and
Townsend 2005; Bapteste and Boucher 2009). Discrepancies identified between databases for
organism names were corrected for, such as NCBI using the old name Chloroflexia (as of
17/11/14) and MG-RAST using the new name Chloroflexi for the same class. Those that
were not annotated were named “Unidentified” and those that were annotated but were either
ambiguously annotated or not annotated at all taxonomic levels had the corresponding levels
in the lineage replaced with “Unclassified”. For MEGAN and One Codex, NCBI taxa IDs
were used to generate the lineages.
by guest on May 11, 2016
http://femsec.oxfordjournals.org/
Dow
nloaded from

The taxonomic lineage for each annotated sequence was compared to the lineage for
the corresponding source sequence in Simmet to determine the annotation sensitivity and
precision at each taxonomic level. The effect that minimum identity cut-off values, minimum
alignment lengths and maximum E-values had on annotation sensitivity and precision were
established using Megablast and MG-RAST. The correlations between the relative
abundances for each taxon in Simmet and in the annotations were calculated using Pearson’s
product moment correlation coefficient. Domain was excluded due to the small number of
taxa. The natural logarithms of the relative abundance values were calculated for plotting, as
the original distributions would not visually convey the variations in low abundance taxa. The
taxa richness values for each taxonomic level were calculated.
Unlike investigating taxa, correct functional annotations cannot be ascertained with 100
% confidence. To investigate functional annotation performance, protein sequences
associated with the sequences in Simmet were extracted from GenBank records and
annotated using the KEGG Automatic Annotation Server (KAAS) (Moriya et al. 2007) and
WebMGA (Wu et al. 2011). Both are web-based functional annotation tools independent of
those investigated in this study. They did not contain sequencing errors and thus provided the
best possible indication of the functional annotation accuracy, although the caveats associated
with sequence annotation (e.g. possibly incorrectly assigning a function) are present.
KEGG Orthology (KO) and COG IDs were extracted from the KASS and WebMGA
results, respectively, for each sequence annotated and compared with the IDs assigned by
MG-RAST. The parameters set for the taxonomic investigation were used, and the minimum
identity cut-off values investigated were: 40 %, 50 %, 60 %, 70 %, 80 %, 90 % and 95 %.
The minimum alignment lengths tested were: 10, 15, 20, 25, 30, 25, 40, 45, 50, 55 and 60
base pairs. The maximum E-values tested were: 1-e-1, 1-e-5, 1-e-10 and 1-e-15.
by guest on May 11, 2016
http://femsec.oxfordjournals.org/
Dow
nloaded from
Results
Simulation and annotation
NeSSM produced 2,399,077 sequences (length range: 195 to 459 bp, median length
377 bp). The average phred quality scores remained above 20 until beyond 400 bases
(Supplementary Figure 1) and 98.7 % of sequences are between 300 and 400 base pairs long
(Supplementary Figure 2). Of the 2,399,077 sequences, KASS annotated 1,341,362 (55.9 %)
sequences and WebMGA annotated 1,945,674 sequences (81.1 %).
Parameters (Blast and MG-RAST)
More stringent parameter values resulted in fewer sequence annotations but had a
greater precision; lower values resulted in more annotations being made, but these comprised
increases in both correct and incorrect annotations. For example, with cut-off values of 95 %
and 40 %, MG-RAST RefSeq annotated 40.2 % and 90.3 % sequences, respectively with
incorrect annotation rates of 2.9 % and 34.5 % at the genus level. This was observed for all
parameters tested, for both taxonomic (Figure 1, 3 and 5) and functional (Figure 2, 4 and 6)
annotations. As the taxonomic level moved up the taxonomic hierarchy, more sequences were
correctly annotated (e.g. 0.5 % and 10.2 % for MG-RAST RefSeq with cut-off values of 95
% and 40 %, respectively, at the class level). Note that sensitivity is unaffected by the
taxonomic level investigated.
The correlation coefficients between the taxa relative abundances in Simmet and in the
annotations decreased as parameter stringency increased (Figure 7, associated scatter plots in
Supplementary Figures 3-5). Most databases achieved maximum correlations with a
minimum identity cut-off value of 50 %, a minimum alignment length of 30 bp and a
by guest on May 11, 2016
http://femsec.oxfordjournals.org/
Dow
nloaded from

maximum E-value of 1-e-1. Greater decreases in correlation coefficients occurred with a
minimum identity cut-off value above 70 % and a minimum alignment length greater than 40
bp.
Annotation sensitivity and precision
The control taxonomically annotated 99.9 % of sequences and had a genus precision of
99.5 %. This produced the greatest number of correct annotations (99.4 %) (Table 1, Figure
8, Supplementary Table 2 for all taxonomic levels). Megablast annotated 99.8 % of
sequences and had a genus precision of 97.5 %. One Codex annotated all of the sequences,
but incorrectly annotated more sequences (5.8 %) than MEGAN (2.9 %), Megablast (2.5 %)
and the control (0.5 %). Megablast, MEGAN and One Codex correctly annotated 97.3 %,
95.7 % and 94.2 % sequences respectively, significantly more than the next most successful
methods: MG-RAST RefSeq (55.9 %), MG-RAST TrEMBL (54.9 %) and MG-RAST
GenBank (52.7 %). MG-RAST RDP and Mg-RAST Greengenes, both rRNA databases,
annotated less than one per cent of the sequences. This is consistent with the expected
frequency of rRNA genes within bacterial genomes (VEtrovský and Baldrian 2013). As the
taxonomic level increases, precision increases and becomes more similar across the different
databases.
MG-RAST KEGG annotated 63.3 % of the sequences and had a precision of 71.7 %,
with 45.4 % of sequences correctly assigned a function and 17.9 % incorrectly assigned a
function. MG-RAST COG annotated 50.5 % of the sequences and had a precision of 91.1 %,
resulting in 46.0 % of sequence being correctly assigned a function and 4.5 % being
incorrectly assigned a function (Supplementary Tables 3-5). The portions of sequences
correctly annotated by both methods were 81.5 % for MG-RAST KEGG and 55.4 % for MG-
RAST COG.
by guest on May 11, 2016
http://femsec.oxfordjournals.org/
Dow
nloaded from

Taxa abundance correlations
The control showed the greatest genus-level correlation (r2 = 0.98). Megablast had the
greatest genus-level correlation with Simmet after the control (r2 = 0.95), while MG-RAST
SEED had the weakest (r2 = 0.49). MEGAN and One Codex had genus-level correlations of
r2 = 0.90 and r2 = 0.93, respectively. The greatest correlation achieved, aside from the control,
was by Megablast at the phylum level (r2 > 0.99) (Figure 9, Supplementary Figure 6).
MG-RAST M5NR and MG-RAST RefSeq generated 87 and 56 false positive class
identifications respectively (Table 2). MEGAN had only two false positive class
identifications (“Unidentified” and Insecta) and one false negative identification
(Solibacteres). One Codex also had a low abundance of false positive class identifications
(eight) and no false negative class identifications. Classes with many false positive
identifications include eukaryotes, particularly fungi, and bacteria such as Spartobacteria. The
greatest fold differences for classes can be found in Supplementary Table 6.
Taxa richness
Six of the annotation methods underestimated the genus richness and six overestimated
it (Table 3, Figure 10). The control perfectly estimated the genus richness. The next closest
estimate was achieved by MEGAN (97.7 %), followed by MG-RAST SwissProt (95.5 %),
MG-RAST M5RNA (95.2 %), Megablast (110.2 %) and MG-RAST RefSeq (118.2 %). MG-
RAST M5NR produced the most incorrect richness value at 1,244 genera (180.8 %). One
Codex overstated the genus richness by 26.7 %. The methods were inconsistent in response to
taxonomic level. With increasing taxonomic level some estimates increased in accuracy while
others decreased (Figure 10, Supplementary Table 7). Excluding the control and the domain
level, where the number of taxa is low, MEGAN achieved the most accurate richness value
by guest on May 11, 2016
http://femsec.oxfordjournals.org/
Dow
nloaded from
(101.2 %) at the family level. MG-RAST M5NR achieved the most inaccurate richness value
(253.3 %) at the order level. Megablast and One Codex achieved accurate results relative to
other methods, but they still overstated taxa richness at every taxonomic level.
Discussion
In the study we evaluated the performances of MEGAN, MG-RAST, One Codex and
Megablast by determining their sequence annotation accuracies. All common taxonomic
levels above species are studied, building on the work by Lindgreen, Adair and Gardner
(2016) who study several tools at the genus and phylum levels. By studying a range of
taxonomic levels, we provide a guideline for researchers to establish the annotation accuracy
costs of investigating lower taxonomic levels, allowing them to optimise their investigations
depending on their requirements for taxonomic resolution. MG-RAST and Megablast use a
selection of parameters to determine the stringency of matching a sequence with a reference
sequence in a database. Less stringent parameters (i.e. lower minimum identity cut-off values,
lower minimum alignment lengths and higher maximum E-values) annotate more sequences,
but more incorrect annotations are made, thus producing an incorrect community profile.
More stringent parameters reduce the number of incorrect annotations, but many fewer
annotations are made, resulting in much of the data being rejected. Shakya et al. (2013) drew
similar conclusions for varying minimum identity cut-off values. Decreases in sensitivity
generally occur from minimum identify cut-off values above 60 %, a minimum alignment
lengths greater than 30 bp or a maximum E-value below 1-e-5; therefore the default values
used by MG-RAST maximise sensitivity. According to Carr and Borenstein (2014), the
impact of parameters such as E-value will vary depending on read-length, something that
should be considered in future evaluations as newer sequencing technologies produce longer
reads (e.g. nanopore sequencing (Branton et al. 2008)). The sensitivities and the number of
by guest on May 11, 2016
http://femsec.oxfordjournals.org/
Dow
nloaded from

sequences correctly annotated are relatively low for MG-RAST at the genus and family
levels. At the order level the values are higher, suggesting that this would be the optimum
taxonomic level to study, which maximises the amount of data used without producing too
many incorrect annotations. Ultimately, there is a trade-off between taxonomic resolution and
annotation accuracy, and this must be considered when determining methods for
metagenomic studies.
A marginal number of sequences were not annotated by the control and an even
smaller number were incorrectly annotated. These discrepancies are due to the sequencing
errors inserted into the simulation. We can therefore conclude that 0.5 % of inter-sample
difference at the genus level may be attributed to sequencing error, an important
consideration when interpreting data obtained from environmental samples using these
methods. This is supported by Hoff (2009) and Carr and Borenstein (2014), who found that
increasing error rates decrease gene prediction accuracy. As the error rates of Next
Generation Sequencing technologies improve, this effect will reduce.
One Codex had the greatest annotation sensitivity and the fourth highest annotation
precision. This is likely to be due to a combination of the kmer-based annotation method that
it uses and that the simulated metagenome was created using the NCBI genome database, the
primary reference source for One Codex. Other than the control, Megablast correctly
annotated the most sequences at the genus level (97.3 %), although the sensitivity of this
method was 0.2 % less than One Codex. MEGAN had the second highest precision,
annotating 98.6 % of sequences, with 95.7 % correct annotations. This suggests that
Megablast is the most reliable method for annotating sequences, and indicates that it is more
conservative than One Codex when assigning a sequence hit but also less likely to
misidentify a sequence. MEGAN’s performance was similar to Megablast, which is expected
by guest on May 11, 2016
http://femsec.oxfordjournals.org/
Dow
nloaded from

as MEGAN processed the Megablast output. Discrepancies between the two are therefore
derived from MEGAN’s processing.
MG-RAST RefSeq had the fifth greatest annotation sensitivity and the greatest of the
MG-RAST annotations (excluding MG-RAST M5NR, for which sequence-specific
annotation data were unavailable), although it also achieved the greatest number of
misidentifications. At the genus level, 33.7 % of sequences were misidentified and 55.9 %
were correctly identified, leaving the remainder unassigned despite the fact that all taxa in
Simmet are fully sequenced. This would suggest that investigating metagenomes at the genus
level would be unreliable, generating many false positives and implying an incorrect
community structure and composition. This supports Garcia-Etxebarria, Garcia-Garcerà and
Calafell (2014), who found that more annotations are made at higher taxonomic levels and
that discrepancies between known frequencies and annotations increase at lower taxonomic
levels, and Lindgreen, Adair and Gardner (2016), who report decreases in community
annotation accuracy at the genus level compared to phylum. At the class level, the proportion
of incorrect annotations is reduced to fewer than 10 % for MG-RAST RefSeq, with 80 %
being annotated correctly. While taxonomic resolution is reduced, it ensures that the
confidence in the annotations remains high.
MG-RAST KEGG correctly annotated a similar number of sequences to MG-RAST
COG, but incorrectly annotated many more. KEGG offers a more descriptive annotation as it
comprises specific gene and pathway annotations, whereas COG provides descriptions based
on orthologous sequences. However, the specificity of KEGG classifications may be the
cause of the incorrect annotations as there are more annotations to be selected from and there
may be more closely related functions, increasing the chance of misidentification. Because
KEGG is now subscription based, and MG-RAST uses the last free version (2008), it will not
by guest on May 11, 2016
http://femsec.oxfordjournals.org/
Dow
nloaded from

contain information added after that date. Our results are in line with those produced by
Lindgreen, Adair and Gardner (2016), who also conclude that MG-RAST’s functional
annotation was accurate.
The control, One Codex, Megablast and MEGAN achieved the greatest correlation
coefficients between Simmet and annotation abundances at the genus level, all above 0.9. For
all MG-RAST annotations the correlation coefficients were less than 0.8. For MG-RAST, the
greatest correlation of all abundances was achieved at the order level by the M5NR database,
closely followed by TrEMBL and RefSeq. These correlations inform us about community-
wide analyses, but they are not as sequence sensitivity and precision as correlating
abundances values may occur from coincidental incorrect annotations.
MG-RAST over-annotated many more classes than MEGAN and One Codex, for
which the most abundant feature was the unidentified group. This supports the sensitivity and
precision data in suggesting that One Codex is more likely to categorise unknown sequences
as unidentified, rather than incorrectly identifying them.
The genus richness estimated by MG-RAST M5NR was 81.0 % greater that Simmet’s
actual richness, the highest overstatement, while MEGAN achieved the most accurate genus
richness value (2.3 % lower) after the control (100.2 %). This overstatement could be due to
the greater number of sequences present in MG-RAST M5NR. MG-RAST M5RNA produced
a relatively accurate estimate of genus richness (95.2 %); as M5RNA is a 16S rRNA
database, it is unlikely to annotate non-16S rRNA sequences, reducing the number of
incorrect identifications. However, the taxa abundance correlations show that MG-RAST
M5RNA achieved the second lowest correlation with Simmet at the genus level, and the
lowest at all other taxonomic levels. MG-RAST RefSeq generated the fifth most accurate
richness value, greater than One Codex, although not as accurate as Megablast and MEGAN.
by guest on May 11, 2016
http://femsec.oxfordjournals.org/
Dow
nloaded from

Combined with its high abundance correlation with Simmet, this suggests that MG-RAST
RefSeq provides a relatively accurate representation of both the richness of a community and
the abundance of organisms present. MEGAN and One Codex achieve more accurate taxa
richness values and taxa abundance correlations than MG-RAST RefSeq at the family level
and above, suggesting they would be a viable alternative to MG-RAST RefSeq.
One limitation with evaluating annotations using organism nomenclature, rather than
taxon IDs (which were unavailable for MG-RAST sequence-specific annotation data), is the
lack of taxonomic metadata curation in some databases. Some genomes in the NCBI database
are stored with the abbreviated species name rather than complete name, thus A.mediterranei
would not automatically be identified as an Amycolatopsis species. Furthermore, as names are
updated, disparities can form between different databases. For example, the class
Chloroflexia has been renamed to Chloroflexi, and is called this by MG-RAST. However,
NCBI is using the old name Chloroflexia (as of 17/11/14), thus sequences identified as
Chloroflexi would not be correctly matched in Simmet. These issues were corrected for
during data processing; however there may be other cases of disparities in the plethora of
organisms present in the analysis. A solution to this would be to use the taxon IDs instead,
however these were not available for sequence-specific annotations downloaded from MG-
RAST.
In conclusion, we found that One Codex, Megablast and MEGAN are suitable
methods for annotating DNA sequences that are located in the reference databases that they
use for annotation, with One Codex offering fast, web-based analyses and MEGAN providing
a user-friendly Graphical User Interface to analyse BLAST results. Results appear to vary
significantly depending on the program and parameters used, a conclusion also drawn by
Lindgreen, Adair and Gardner (2016). While MG-RAST appears to have a greater rate of
by guest on May 11, 2016
http://femsec.oxfordjournals.org/
Dow
nloaded from

incorrect assignments, this is reduced when investigating higher taxonomic levels (e.g. with
RefSeq: over 33 % at the genus level compared to less than 15 % and 10 % at the order and
class levels). The correlations between the annotated taxa abundances are greatest for MG-
RAST at the order level, using M5NR, TrEMBL or RefSeq. In many of the tests, MG-RAST
M5NR proved to be a reliable database, but the diversity indices suggest that it is less reliable
than MG-RAST RefSeq; at the class, order and family levels MG-RAST M5NR estimates
more the double the actual richness values. Therefore, we hypothesise that MG-RAST M5NR
would generate more false positive sequence annotations than MG-RAST RefSeq.
A simulated metagenome allows for the quantification of annotation errors. This study
compliments the work by Mavromatis et al. (2007), who evaluated different metagenomic
processing methods using simulated metagenome developed from 113 isolated genomes, and
by Pignatelli and Moya (2011), who used simulated data to study the performances of de
novo short-read assembly programs. It should be noted that the performances of the methods
discussed in this study are likely to differ from the reported results when annotating
environmental sequence data; a greater number of sequences are likely to be unidentified due
to the multitude of uncultured microorganisms (Streit and Schmitz 2004) and non-sequenced
microbial genomes (Tringe et al. 2005) that are currently absent from the NCBI whole
bacterial genome database. While this research focussed on a selection of annotation
methods, the overall conclusions drawn should be considered for any pipeline.
In this study we highlight and quantify the annotation errors for a selection of
parameters and databases. We show that analysis pipelines are not equivalent and certain
parameters can significantly reduce the confidence in results. These findings should be used
as a guideline when determining methods for annotating metagenomic sequences and
considered when interpreting metagenomic results. Ultimately, the most appropriate balance
by guest on May 11, 2016
http://femsec.oxfordjournals.org/
Dow
nloaded from
between taxonomic resolution, annotation sensitivity and annotation precision needs to be
identified for each study conducted.
Funding
This work was supported by the University of York and Fera Science Ltd. joint
seedcorn Ph.D. studentship.
Acknowledgements
We sincerely thank Sandy Macdonald and Tobias Hodges for their technical support
and assistance with data analysis techniques. Sandy in particular provided advice and
guidance throughout the study that ultimately contributed to the work produced.
by guest on May 11, 2016
http://femsec.oxfordjournals.org/
Dow
nloaded from
References
Achtman M, Wagner M. Microbial diversity and the genetic nature of microbial species. Nat Rev Microbiol 2008;6:431–40.
Anderson RE, Sogin ML, Baross JA. Biogeography and ecology of the rare and abundant microbial lineages in deep-sea hydrothermal vents. FEMS Microbiol Ecol 2015;91:1–11.
Arumugam M, Raes J, Pelletier E et al. Enterotypes of the human gut microbiome. Nature 2011;473:174–80.
Bapteste E, Boucher Y. Epistemological Impacts of Horizontal Gene Transfer on Classification in Microbiology. In: Gogarten DMB, Gogarten DJP, Olendzenski DLC (eds.). Horizontal Gene Transfer. Humana Press, 2009, 55–72.
Branton D, Deamer DW, Marziali A et al. The potential and challenges of nanopore sequencing. Nat Biotechnol 2008;26:1146–53.
Buchfink B, Xie C, Huson DH. Fast and sensitive protein alignment using DIAMOND. Nat Methods 2015;12:59–60.
Carr R, Borenstein E. Comparative Analysis of Functional Metagenomic Annotation and the Mappability of Short Reads. PLoS ONE 2014;9:e105776.
Chun J, Lee J-H, Jung Y et al. EzTaxon: a web-based tool for the identification of prokaryotes based on 16S ribosomal RNA gene sequences. Int J Syst Evol Microbiol 2007;57:2259–61.
David LA, Maurice CF, Carmody RN et al. Diet rapidly and reproducibly alters the human gut microbiome. Nature 2014;505:559–63.
Desai N, Antonopoulos D, Gilbert JA et al. From genomics to metagenomics. Curr Opin Biotechnol 2012;23:72–6.
Fournier P-E, Dumler JS, Greub G et al. Gene sequence-based criteria for identification of new rickettsia isolates and description of Rickettsia heilongjiangensis sp. nov. J Clin Microbiol 2003;41:5456–65.
Garcia-Etxebarria K, Garcia-Garcerà M, Calafell F. Consistency of metagenomic assignment programs in simulated and real data. BMC Bioinformatics 2014;15:90.
Gevers D, Cohan FM, Lawrence JG et al. Re-evaluating prokaryotic species. Nat Rev Microbiol 2005;3:733–9.
Gogarten JP, Townsend JP. Horizontal gene transfer, genome innovation and evolution. Nat Rev Microbiol 2005;3:679–87.
Henry VJ, Bandrowski AE, Pepin A-S et al. OMICtools: an informative directory for multi-omic data analysis. Database 2014;2014:bau069–bau069.
by guest on May 11, 2016
http://femsec.oxfordjournals.org/
Dow
nloaded from

Hoff KJ. The effect of sequencing errors on metagenomic gene prediction. BMC Genomics 2009;10:520.
Hugenholtz P. Exploring prokaryotic diversity in the genomic era. Genome Biol 2002;3:reviews0003.
Hunter CI, Mitchell A, Jones P et al. Metagenomic analysis: the challenge of the data bonanza. Brief Bioinform 2012;13:743–6.
Huson DH, Auch AF, Qi J et al. MEGAN analysis of metagenomic data. Genome Res 2007;17:377–86.
Huson DH, Xie C. A poor man’s BLASTX--high-throughput metagenomic protein database search using PAUDA. Bioinforma Oxf Engl 2014;30:38–9.
Jia B, Xuan L, Cai K et al. NeSSM: A Next-Generation Sequencing Simulator for Metagenomics. PLoS ONE 2013;8:e75448.
Joshi N, Fass J. Sickle: A Sliding-Window, Adaptive, Quality-Based Trimming Tool for FastQ Files (Version 1.33) [Software]., 2011.
Kanehisa M, Goto S. KEGG: Kyoto Encyclopedia of Genes and Genomes. Nucleic Acids Res 2000;28:27–30.
Lane DJ, Pace B, Olsen GJ et al. Rapid determination of 16S ribosomal RNA sequences for phylogenetic analyses. Proc Natl Acad Sci 1985;82:6955–9.
Lindgreen S, Adair KL, Gardner PP. An evaluation of the accuracy and speed of metagenome analysis tools. Sci Rep 2016;6:19233.
Lipson DA, Haggerty JM, Srinivas A et al. Metagenomic Insights into Anaerobic Metabolism along an Arctic Peat Soil Profile. PLoS ONE 2013;8:e64659.
Mavromatis K, Ivanova N, Barry K et al. Use of simulated data sets to evaluate the fidelity of metagenomic processing methods. Nat Methods 2007;4:495–500.
Mende DR, Sunagawa S, Zeller G et al. Accurate and universal delineation of prokaryotic species. Nat Methods 2013;10:881–4.
Meyer F, Paarmann D, D’Souza M et al. The metagenomics RAST server – a public resource for the automatic phylogenetic and functional analysis of metagenomes. BMC Bioinformatics 2008;9:386.
Moriya Y, Itoh M, Okuda S et al. KAAS: an automatic genome annotation and pathway reconstruction server. Nucleic Acids Res 2007;35:W182–5.
Pignatelli M, Moya A. Evaluating the Fidelity of De Novo Short Read Metagenomic Assembly Using Simulated Data. PLoS ONE 2011;6:e19984.
Richter M, Rosselló-Móra R. Shifting the genomic gold standard for the prokaryotic species definition. Proc Natl Acad Sci 2009;106:19126–31.
by guest on May 11, 2016
http://femsec.oxfordjournals.org/
Dow
nloaded from

Rosselló-Mora R, Amann R. The species concept for prokaryotes. FEMS Microbiol Rev 2001;25:39–67.
Shakya M, Quince C, Campbell JH et al. Comparative metagenomic and rRNA microbial diversity characterization using Archaeal and Bacterial synthetic communities. Environ Microbiol 2013;15:1882–99.
Stackebrandt E, Goebel BM. Taxonomic Note: A Place for DNA-DNA Reassociation and 16S rRNA Sequence Analysis in the Present Species Definition in Bacteriology. Int J Syst Bacteriol 1994;44:846–9.
Streit WR, Schmitz RA. Metagenomics--the key to the uncultured microbes. Curr Opin Microbiol 2004;7:492–8.
Tatusov RL, Koonin EV, Lipman DJ. A Genomic Perspective on Protein Families. Science 1997;278:631–7.
Thomas T, Gilbert J, Meyer F. Metagenomics - a guide from sampling to data analysis. Microb Inform Exp 2012;2:3.
Tringe SG, Mering C von, Kobayashi A et al. Comparative Metagenomics of Microbial Communities. Science 2005;308:554–7.
VEtrovský T, Baldrian P. The Variability of the 16S rRNA Gene in Bacterial Genomes and Its Consequences for Bacterial Community Analyses. PLoS ONE 2013;8:e57923.
Wilke A, Glass EM, Bischof J et al. MG-RAST Technical Report and Manual v3.3.6 r1. Argonne National Laboratory: University of Chicago, 2013.
Wilke A, Harrison T, Wilkening J et al. The M5nr: a novel non-redundant database containing protein sequences and annotations from multiple sources and associated tools. BMC Bioinformatics 2012;13:141.
Woese CR, Fox GE. Phylogenetic structure of the prokaryotic domain: The primary kingdoms. Proc Natl Acad Sci 1977;74:5088–90.
Wu S, Zhu Z, Fu L et al. WebMGA: a customizable web server for fast metagenomic sequence analysis. BMC Genomics 2011;12:444.
Xie W, Wang F, Guo L et al. Comparative metagenomics of microbial communities inhabiting deep-sea hydrothermal vent chimneys with contrasting chemistries. ISME J 2011;5:414–26.
Zhao Y, Tang H, Ye Y. RAPSearch2: a fast and memory-efficient protein similarity search tool for next-generation sequencing data. Bioinforma Oxf Engl 2012;28:125–6.
by guest on May 11, 2016
http://femsec.oxfordjournals.org/
Dow
nloaded from

Figure 1 Effect of minimum identity cut-off values on taxonomic annotation. The effect of changing minimum identity cut-off value on the number of sequences correctly and incorrectly annotated across the taxonomic levels.
by guest on May 11, 2016
http://femsec.oxfordjournals.org/
Dow
nloaded from

Figure 2 Effect of minimum identity cut-off values on functional annotation. The effect of changing minimum identity cut-off value on the number of sequences correctly and incorrectly annotated for functions.
by guest on May 11, 2016
http://femsec.oxfordjournals.org/
Dow
nloaded from

Figure 3 Effect of minimum alignment length on taxonomic annotation. The effect of changing minimum alignment length on the number of sequences correctly and incorrectly annotated across the taxonomic levels.
by guest on May 11, 2016
http://femsec.oxfordjournals.org/
Dow
nloaded from

Figure 4 Effect of minimum alignment length on functional annotation. The effect of changing minimum alignment length on the number of sequences correctly and incorrectly annotated for functions.
by guest on May 11, 2016
http://femsec.oxfordjournals.org/
Dow
nloaded from

Figure 5 Effect of maximum E-value on taxonomic annotation. The effect of changing maximum E-value on the number of sequences correctly and incorrectly annotated across the taxonomic levels.
by guest on May 11, 2016
http://femsec.oxfordjournals.org/
Dow
nloaded from

Figure 6 Effect of maximum E-value on functional annotation. The effect of changing maximum E-value value on the number of sequences correctly and incorrectly annotated for functions.
by guest on May 11, 2016
http://femsec.oxfordjournals.org/
Dow
nloaded from

Figure 7 Abundance correlations for different parameter values. The Pearson’s product-moment correlation coefficients for the correlations between the Genus relative abundances from Simmet and those from various annotation methods using different A) minimum identity cut-off values, B) Minimum alignment lengths, and C) maximum E-values.
by guest on May 11, 2016
http://femsec.oxfordjournals.org/
Dow
nloaded from

Figure 8 Annotation performance. The annotation sensitivity and number of sequences correctly annotated from a variety of methods and databases across the taxonomic levels investigated.
by guest on May 11, 2016
http://femsec.oxfordjournals.org/
Dow
nloaded from
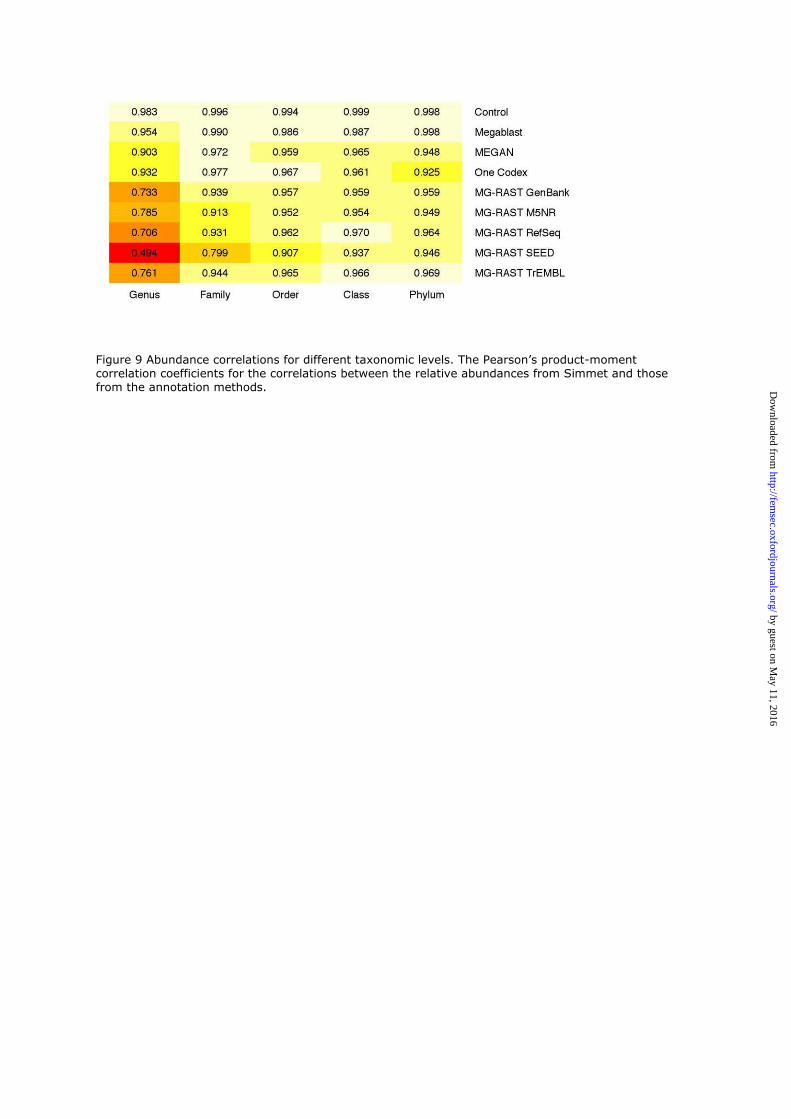
Figure 9 Abundance correlations for different taxonomic levels. The Pearson’s product-moment correlation coefficients for the correlations between the relative abundances from Simmet and those from the annotation methods.
by guest on May 11, 2016
http://femsec.oxfordjournals.org/
Dow
nloaded from

Figure 10 Taxa richness. The differences between annotated richness values and the actual richness value (dashed line) for each taxonomic level.
by guest on May 11, 2016
http://femsec.oxfordjournals.org/
Dow
nloaded from

Table 1. Taxonomic annotation statistics. The Simmet taxonomic annotation statistics for each method and database at the Genus level using default parameters.
Method Database Sensitivity
(%) Correctly
annotated (%) Incorrectly
annotated (%)
Megablast Control 99.88 99.39 0.49
Megablast NCBI 99.81 97.32 2.49
MEGAN MEGAN 98.56 95.65 2.91
MG-RAST GenBank 81.94 52.65 29.30
MG-RAST Greengenes 0.11 0.08 0.03
MG-RAST RDP 0.13 0.10 0.03
MG-RAST RefSeq 89.58 55.90 33.68
MG-RAST SEED 64.97 39.75 25.22
MG-RAST SwissProt 11.49 6.08 5.42
MG-RAST TrEMBL 86.37 54.93 31.44
One Codex One Codex 100.00 94.18 5.82
by guest on May 11, 2016
http://femsec.oxfordjournals.org/
Dow
nloaded from
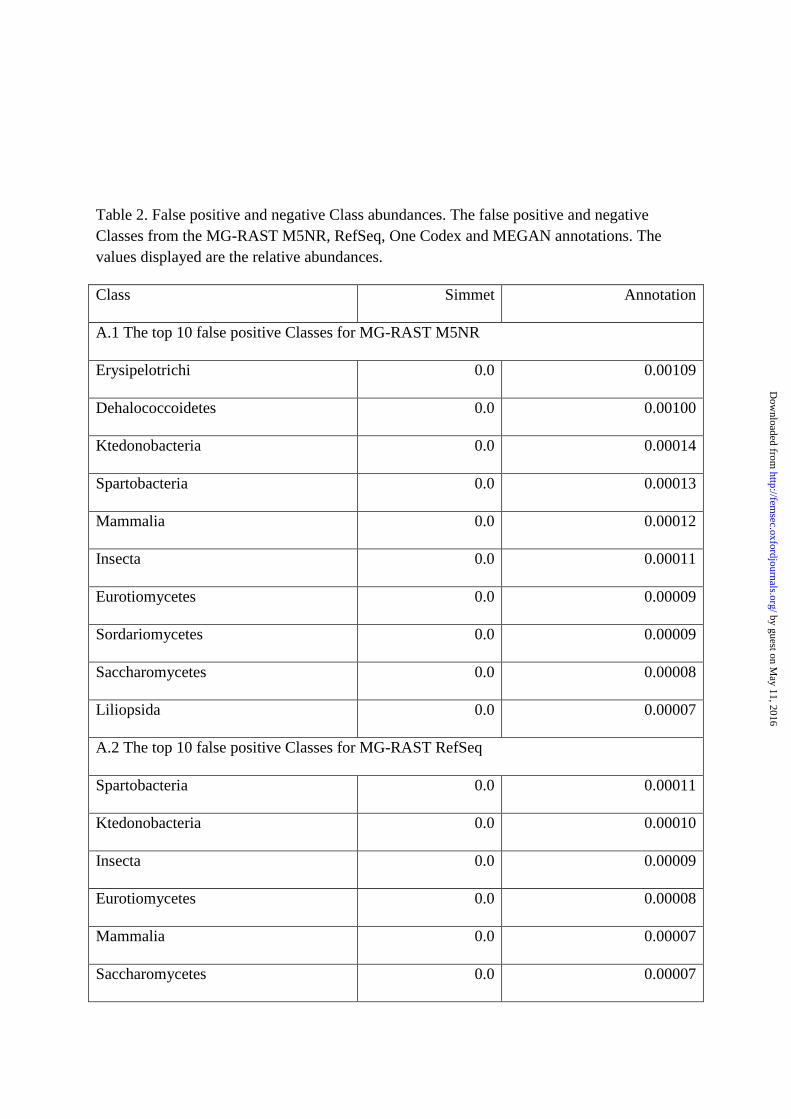
Table 2. False positive and negative Class abundances. The false positive and negative Classes from the MG-RAST M5NR, RefSeq, One Codex and MEGAN annotations. The values displayed are the relative abundances.
Class Simmet Annotation
A.1 The top 10 false positive Classes for MG-RAST M5NR
Erysipelotrichi 0.0 0.00109
Dehalococcoidetes 0.0 0.00100
Ktedonobacteria 0.0 0.00014
Spartobacteria 0.0 0.00013
Mammalia 0.0 0.00012
Insecta 0.0 0.00011
Eurotiomycetes 0.0 0.00009
Sordariomycetes 0.0 0.00009
Saccharomycetes 0.0 0.00008
Liliopsida 0.0 0.00007
A.2 The top 10 false positive Classes for MG-RAST RefSeq
Spartobacteria 0.0 0.00011
Ktedonobacteria 0.0 0.00010
Insecta 0.0 0.00009
Eurotiomycetes 0.0 0.00008
Mammalia 0.0 0.00007
Saccharomycetes 0.0 0.00007
by guest on May 11, 2016
http://femsec.oxfordjournals.org/
Dow
nloaded from

Lentisphaeria 0.0 0.00007
Anthozoa 0.0 0.00005
Amphibia 0.0 0.00005
Zetaproteobacteria 0.0 0.00005
A.3 The false positive Classes for One Codex
Sordariomycetes 0.0 0.00001
Holophagae 0.0 <0.00000
Ktedonobacteria 0.0 <0.00000
Eurotiomycetes 0.0 <0.00000
Leotiomycetes 0.0 <0.00000
Dothideomycetes 0.0 <0.00000
Nitrospinia 0.0 <0.00000
Saccharomycetes 0.0 <0.00000
A.4 The false positive Classes for MEGAN
Insecta 0.0 0.00042
B.1 The false negative Classes for MG-RAST M5NR
Dehalococcoidia 0.00122 0.0
Ignavibacteria 0.00059 0.0
Erysipelotrichia 0.00057 0.0
Chthonomonadetes 0.00055 0.0
Phycisphaerae 0.00049 0.0
Caldilineae 0.00045 0.0
Caldisericia 0.00019 0.0
B.2 The false negative Classes for MG-RAST RefSeq
by guest on May 11, 2016
http://femsec.oxfordjournals.org/
Dow
nloaded from

Anaerolineae 0.00127 0.00000
Ignavibacteria 0.00059 0.00000
Chthonomonadetes 0.00055 0.00000
Phycisphaerae 0.00049 0.00000
Caldilineae 0.00045 0.00000
Thermodesulfobacteria 0.00040 0.00000
Caldisericia 0.00019 0.00000
B.3 The false negative Classes for One Codex
NA
B.4 The false negative Classes for MEGAN
Solibacteres 0.00111 0.0
by guest on May 11, 2016
http://femsec.oxfordjournals.org/
Dow
nloaded from

Table 3. Genus richness. The genus richness estimates and the differences from Simmet for each annotation method. Due to the low numbers, Domain is excluded from comparisons. Richness values at all taxonomic levels can be found in S5 Table.
Method Database Richness Difference (%)
Simmet N/A 688 N/A
Megablast Control 688 100.00
Megablast Megablast 758 110.17
MEGAN MEGAN 672 97.67
MG-RAST GenBank 1,090 158.43
MG-RAST Greengenes 404 58.72
MG-RAST M5NR 1,245 180.96
MG-RAST M5RNA 655 95.20
MG-RAST RDP 469 68.17
MG-RAST RefSeq 813 118.17
MG-RAST SEED 445 64.68
MG-RAST SwissProt 657 95.49
MG-RAST TrEMBL 1,094 159.01
One Codex One Codex 872 126.74
by guest on May 11, 2016
http://femsec.oxfordjournals.org/
Dow
nloaded from
Related Documents