Evaluating satellite remote sensing as a method for measuring yield variability in Avocado and Macadamia tree crops. [email protected] Macadamia Avocado Andrew J Robson, Muhammad Moshiur Rahman, Jasmine Muir, Ashley Saint, Chad Simpson and Chris Searle

Welcome message from author
This document is posted to help you gain knowledge. Please leave a comment to let me know what you think about it! Share it to your friends and learn new things together.
Transcript

Evaluating satellite remote sensing as a method for measuring yield variability in Avocado and
Macadamia tree crops.
Macadamia Avocado
Andrew J Robson, Muhammad Moshiur Rahman, Jasmine Muir, Ashley Saint, Chad
Simpson and Chris Searle

Collaborators

Field Sites: Bundaberg, Qld
N
3 Avocado orchard blocks2 Macadamia orchid blocks

Worldview Satellite Imagery
8 bandscoastal (400‐ 450 nm)blue (450 – 510 nm) green (510 – 580 nm) yellow (585 – 625 nm)red (630 – 690 nm) red‐edge (705 – 745 nm) NIR 1 (770 – 895 nm) NIR 2 (860 – 1040 nm)
Worldview 3 31 cm PS, 1.24 m multispectral
Orbit : 770 km above earthRepeat time: 1.1. days
Worldview 2 46 cm PS, 1.84 m Multispectral
Orbit : 617 km above earthRepeat time: 1 days
16 bands (405‐ 2245 nm)coastal (400‐ 450 nm)blue (450 – 510 nm) green (510 – 580 nm) yellow (585 – 625 nm)red (630 – 690 nm) red‐edge (705 – 745 nm) NIR 1 (770 – 895 nm) NIR 2 (860 – 1040 nm)(Image Copyright © DigitalGlobe)

http://www.markelowitz.com/Hyperspectral.html

Indication of cost (100 km2)8 band 50 cm multispectral ~$ 3,300 (USD)8 band 30 cm multispectral ~$ 5,800 (USD)8 band DEM ~$ 12,000 (USD)16 band 30 cm multispectral ~$ 8,000 (USD)
100 km2 area includes 7 farms @ ~ $5,800 (USD)= $830 (USD)/ farm Or ~ $8 (USD) per orchard block.

Timing of image captures:
2 Sep 2015 to correspond with flowering / pollination surveys. (PhD student Bryony Wilcox)
22 Jan 2016 to correspond with final fruit set.
7 Apr 2016 to correspond with pre‐ harvest.

Identifying General Variability to Coordinate Targeted Sampling: NDVI maps
Classified NDVI of orchard block.
High NDVI
Mid NDVI
Low NDVI

Targeted sampling (18 trees per block)

Blocks Sampled
Classified NDVI images derived from WV‐2 image captured 2 September 2015 of two Macadamia blocks: 19.4 ha (a) and 5.5 ha (b) and the three Avocado blocks: 14.4 ha (c), 6.8 ha (d) and 11.3 ha (e). The yellow markers indicate the
locations of the individual trees sampled for yield parameters.
Block 4 Block 5
Block 1 Block 2
Block 3

• Pollinations surveys • Final fruit set counts• Harvesting • Post harvest fruit quality assessments • Targeted soil sampling• Weather stations (temp/ RH) on 12 trees per block
Field Sampling‐ Avocados

• Pollinations surveys• Nut drop counts• Harvest• Post harvest Nut Quality
Other measures• Weather stations (temp/ RH) on 12 trees per Macadamia blocks.
Field Sampling‐ Macadamia

Results
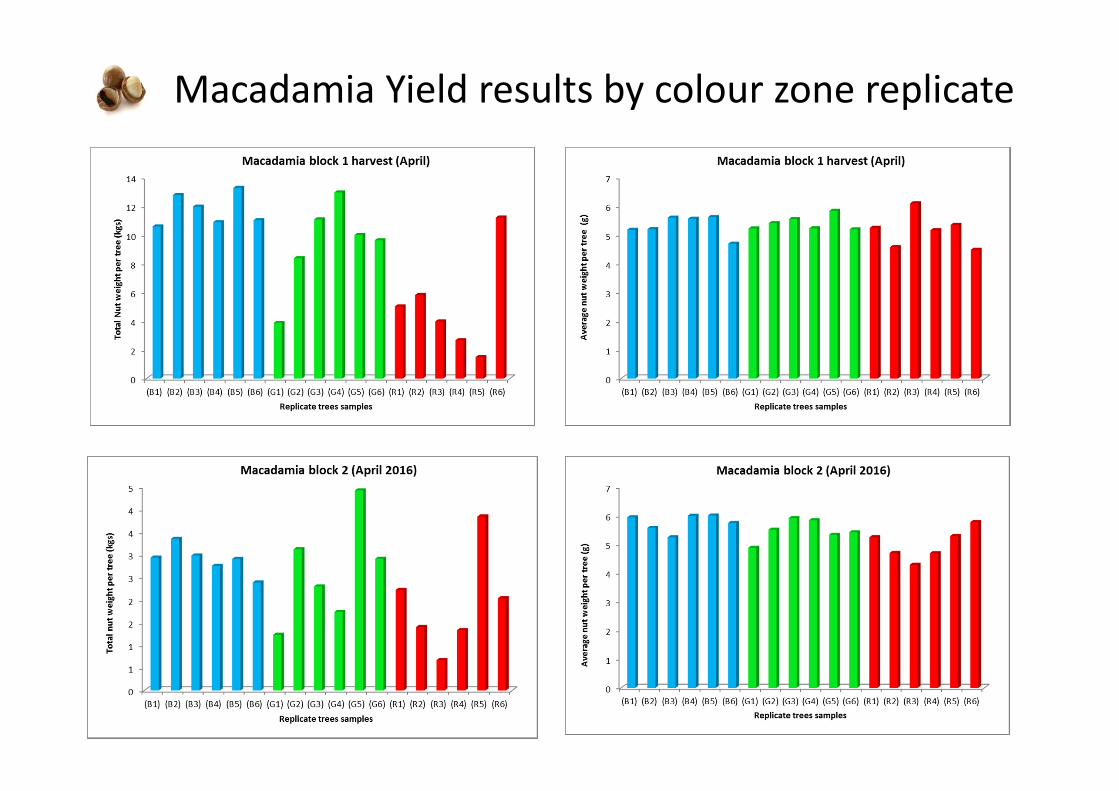
Macadamia Yield results by colour zone replicate

Avocado Yield results by colour zone replicate

Avocado Yield results by colour zone replicate

Extracting canopy reflectance data from each sampled tree
Differential GPS positioning of each tree
2 m buffer applied around each GPS point.
20 structural and pigment based vegetation indices were derived from the 8 band WV‐3 image (7 April)

Macadamia: VI vs Yield Parameter

Avocado: VI vs Yield Parameter

Mapping block yield
False colour WV image with sample locations
Area: 11.3 ha (9*6 spacing)Ave. 3.7 T/ha (20 kg/ tree)Total: 42 tonnes
Linear relationship between measured yield and corresponding canopy spectral data (VI)
Extraction of canopy data for all trees
Calculation of average/ total block yield and derivation yield
map

Derived Yield Maps (Macs)

Derived Yield Maps (Avos)

Improvement on current methods
0
100
200
300
400
500
600
700
1 2 3 4 5 6
Fruit n
umbe
r
Block number
Actual fruit no.
Predicted fruit no.
Estimated fruit no.
Comparison between the actual Vs predicted (extrapolated from imagery/ 18 tree sample) and Growers eyeball estimate fruit number data in 2016

Macadamia Quality• TKR %: Total Kernel Recovery: total kernel wt (g)/ nut is shell wt (g) *100.• Growers are paid on the ratio kernel to shell• SKR %: Sound kernel ratio• Hexanal: a measure of rancidity, a value of 100 + faint off taste

R G Bave temp 24.7 24.1 23.9max temp 34.5 32.6 31.4min temp 18.1 18.3 18.4
ave RH 78.8 80.5 80.9max RH 100.3 100.0 99.7min RH 46.9 50.5 53.2
Temperature data
Low NDVI (Red) trees reach a higher max temp (~3+degC), and lower average relative humidity than the High NDVI (Blue ) trees.
Block 2 R G Bave temp 24.2 23.8 23.6max temp 33.0 31.4 30.1min temp 18.6 18.8 19.1
ave RH 78.6 79.2 80.7max RH 99.3 98.4 97.8min RH 47.2 50.2 54.9
(20 Nov 2015 to 28 May 2016)
12 sensors per block4‐ low NDVI4‐ mid NDVI4‐ high NDVI
Avocado
Mac

Soil Nutrition influencing Yield (6 blocks)

2016/ 17 remote sensing/ Field work
Avocado: Bundaberg/ Chiders, Qld and Renmark S.A.
Macadamia: Bundaberg/ Chiders, Qld and Northern Rivers N.S.W.
Mango: Bundaberg/ Chiders, Qld; Darwin N.T. (P.A. and Magpie geese), and Mareeba (pollination) Qld
Banana: Tully, QLD; Brisbane (PhD/ QDAF)

Acknowledgments
Growers:Chad Simpson (Simpson Farms)
David Depaoli (Austchilli)Tom Redfern (Donovan Family Investments)
Ben Schaefer (Costa S.A.)
Growers:Clayton Mattiazzi (Hinkler Park
Plantations)Andrew Wallis
Ray Norris
Related Documents