Instructions for use Title Evaluating river water quality through land use analysis and N budget approaches in livestock farming areas Author(s) Woli, Krishna Prasad; Nagumo, Toshiyuki; Kuramochi, Kanta; Hatano, Ryusuke Citation Science of The Total Environment, 329(1-3): 61-74 Issue Date 2004-08-15 Doc URL http://hdl.handle.net/2115/35577 Right Type article (author version) Additional Information Hokkaido University Collection of Scholarly and Academic Papers : HUSCAP

Welcome message from author
This document is posted to help you gain knowledge. Please leave a comment to let me know what you think about it! Share it to your friends and learn new things together.
Transcript
Instructions for use
Title Evaluating river water quality through land use analysis and Nbudget approaches in livestock farming areas
Author(s) Woli, Krishna Prasad; Nagumo, Toshiyuki; Kuramochi, Kanta;Hatano, Ryusuke
Citation Science of The Total Environment, 329(1-3): 61-74
Issue Date 2004-08-15
Doc URL http://hdl.handle.net/2115/35577
Right
Type article (author version)
AdditionalInformation
Hokkaido University Collection of Scholarly and Academic Papers : HUSCAP
1
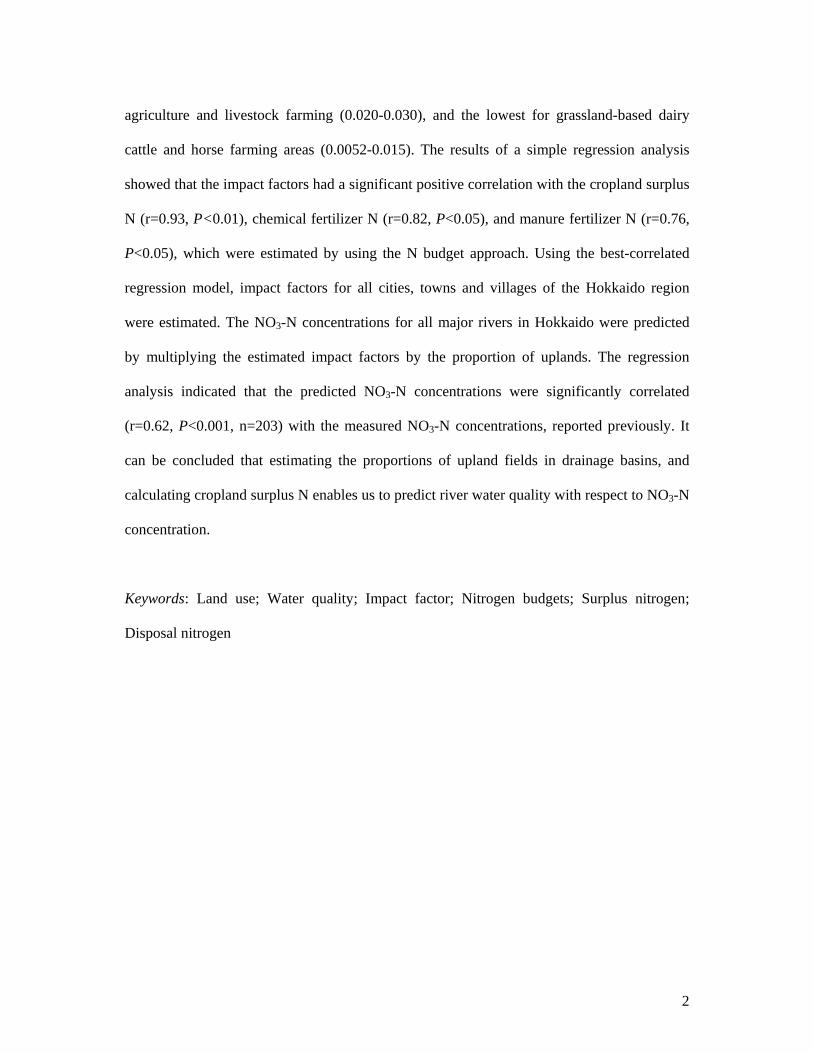
Science of the Total Environment 329 (2004) 61-74
Evaluating river water quality through land use analysis and N budget approaches in livestock farming areas
Krishna Prasad Wolia*, Toshiyuki Nagumob, Kanta Kuramochia, Ryusuke Hatanoc
aLaboratory of Soil Science, Graduate School of Agriculture, Hokkaido University, Sapporo 060-8589, Japan
bCenter for Education and Research of Field Sciences, Faculty of Agriculture, Shizuoka University, Fujieda 426-0001, Japan
cLaboratory of Nutrient Cycling, Field Science Center for Northern Biosphere, Hokkaido University, Sapporo 060-8589, Japan
(*Corresponding author: e-mail: [email protected])
Accepted 10 March 2004 ---------------------------------------------------------------------------------------------------------------- Abstract
This study was carried out to evaluate the quality of river water by analysis of land use in
drainage basins and by estimating the N budgets. The drainage basins of Shibetsu River
(Shibetsu area) and Bekkanbeushi River (Akkeshi area) in eastern Hokkaido, Japan were
selected for a case study, and the evaluation of water quality was up-scaled to the regional
level in Hokkaido by using the Arcview/GIS and statistical information. Water sampling was
carried out in August 2001 and May 2002 in the Shibetsu and Akkeshi areas, respectively.
The proportions of major land uses in drainage basins such as upland field, forest, urban area,
wetland, and wasteland for each sampling site were estimated by using topographic maps
scaled at 1:25000. The linear regression results showed that the correlation between NO3-N
concentration and the proportion of upland in the drainage basins was highly and positively
significant for both the Shibetsu area (r=0.84, n=57) and the Akkeshi area (r=0.71, n=73) at
<0.001 significance level. The regression coefficients or impact factors of river water quality
were 0.015 and 0.0052 for the Shibetsu and Akkeshi areas, respectively. A comparison of
these results with that of the previous study results in Hokkaido indicated that the impact
factors were highest for intensive livestock farming areas (0.040), medium for mixed
2
agriculture and livestock farming (0.020-0.030), and the lowest for grassland-based dairy
cattle and horse farming areas (0.0052-0.015). The results of a simple regression analysis
showed that the impact factors had a significant positive correlation with the cropland surplus
N (r=0.93, P<0.01), chemical fertilizer N (r=0.82, P<0.05), and manure fertilizer N (r=0.76,
P<0.05), which were estimated by using the N budget approach. Using the best-correlated
regression model, impact factors for all cities, towns and villages of the Hokkaido region
were estimated. The NO3-N concentrations for all major rivers in Hokkaido were predicted
by multiplying the estimated impact factors by the proportion of uplands. The regression
analysis indicated that the predicted NO3-N concentrations were significantly correlated
(r=0.62, P<0.001, n=203) with the measured NO3-N concentrations, reported previously. It
can be concluded that estimating the proportions of upland fields in drainage basins, and
calculating cropland surplus N enables us to predict river water quality with respect to NO3-N
concentration.
Keywords: Land use; Water quality; Impact factor; Nitrogen budgets; Surplus nitrogen;
Disposal nitrogen
3
1. Introduction
Agricultural activities have been targeted as key contributors to nitrogen (N) pollution in
the environment (Cooper, 1993). Runoff from agricultural farms is a major source of N
entering rivers, lakes, and coastal waters (Carpenter et al., 1998). For agricultural production,
livestock manures and chemical fertilizers are essential. However, their excessive use
sometimes causes environmental problems such as water and air pollution (Hantschel and
Beese, 1997). Pollution from livestock farm wastes has also caused deterioration of river
water quality in recent years (Schofield et al., 1990) due to the increasing trend of intensive
livestock farming, characterized by more dependence on imported feed and concentration in
small areas (Zebarth et al., 1999). Previous studies have reported that the higher N
application rates result in greater field surplus N in agricultural fields (Hatano et al., 2002;
Pieterse et al., 2003). All fertilizers or manure N are not absorbed by the crops and most of
the residual or surplus N is discharged into ground water through sub-surface drainage
(Hayashi and Hatano, 1999).
In order to evaluate the impact of agricultural activities on the cycling of N at farm or
regional scale and on degrading the water quality, N budget approaches have been put into
practice. The N budget approach, based on a calculation of N flow associated with production
and consumption of food and feed, has been developed and used to determine the impact of N
cycling in farm, community, region, and national levels (Barry et al., 1993; Zebarth et al.,
1999; Matsumoto, 2000; Nagumo and Hatano, 2000). Matsumoto and his co-workers
developed the N Flow Model for evaluating N cycling associated with production and
consumption of food and feed, which was constructed from N budgets in cropland, livestock,
and human dietary subsystems (Matsumoto et al., 1992; 1992a; Matsumoto, 1997). Nagumo
and Hatano (1999) estimated the N budgets for the regional level in Hokkaido, Japan, and
4
reported that the amount of unutilzed or disposed N from agricultural areas was as high as
over 200 kg N ha-1 agricultural land in the livestock husbandry area of southern Hokkaido.
Near or around the Bay of Funka is reported to have potential N loadings due to livestock
excrement, which has resulted in an eutrophication problem in the estuaries (Nagumo and
Hatano, 2001). Woli et al. (2002) estimated N budgets at the community level for three towns
near or around the Bay of Funka, and indicated that the intensive livestock farming town
(Shiraoi) had the highest disposal N (880 Mg N yr-1), which resulted in as much as 250 kg ha-
1 yr-1 surplus N in croplands.
Japanese agriculture has created high N surpluses in agricultural lands due to the
increasing rate of chemical fertilizer application and disposal of livestock wastes per
farmland area (Mishima, 2001). Hokkaido is known as Japan’s primary dairy farming area;
and approximately 93% of livestock excreta are used as organic fertilizers (Hokkaido
Government, 1996). A previous study indicated that river water became significantly polluted
by N while flowing through dairy farming areas (Hojito, 1998). Shimura and Tabuchi (1997)
found that the concentrations of NO3-N in river water were highly correlated with the
stocking density of cattle in some livestock farming areas. The studies conducted in eastern
Hokkaido (Tabuchi et al., 1995) and in southern Hokkaido (Woli et al., 2002) have reported
that NO3-N concentrations in river water had a significantly positive correlation (r=0.83 and
0.78) also with the proportion of upland fields in drainage basins. Woli et al. (2002) further
indicated that the regression slopes of the relation between upland proportions and NO3-N
concentrations varied among the areas investigated; being highest for the intensive livestock
farming area, medium for the mixed agriculture associated with dairy farming area, and
lowest for the grazing-based horse farming area. They assumed that those regression lines
were the baselines for non-point source pollution and the regression slopes were therefore
5
defined as the impact factors of river water quality. There have been very few studies on river
water quality at catchment scale in the dairy cattle farming areas in eastern Hokkaido.
Therefore, the purpose of this study was to evaluate the quality of river water in large
drainage basins, by analyzing land use distribution in the drainage basins and by N budget
approaches. The evaluation of river water quality was further up-scaled to the regional level
in Hokkaido by using ArcView/GIS and statistical information.
2. Site description
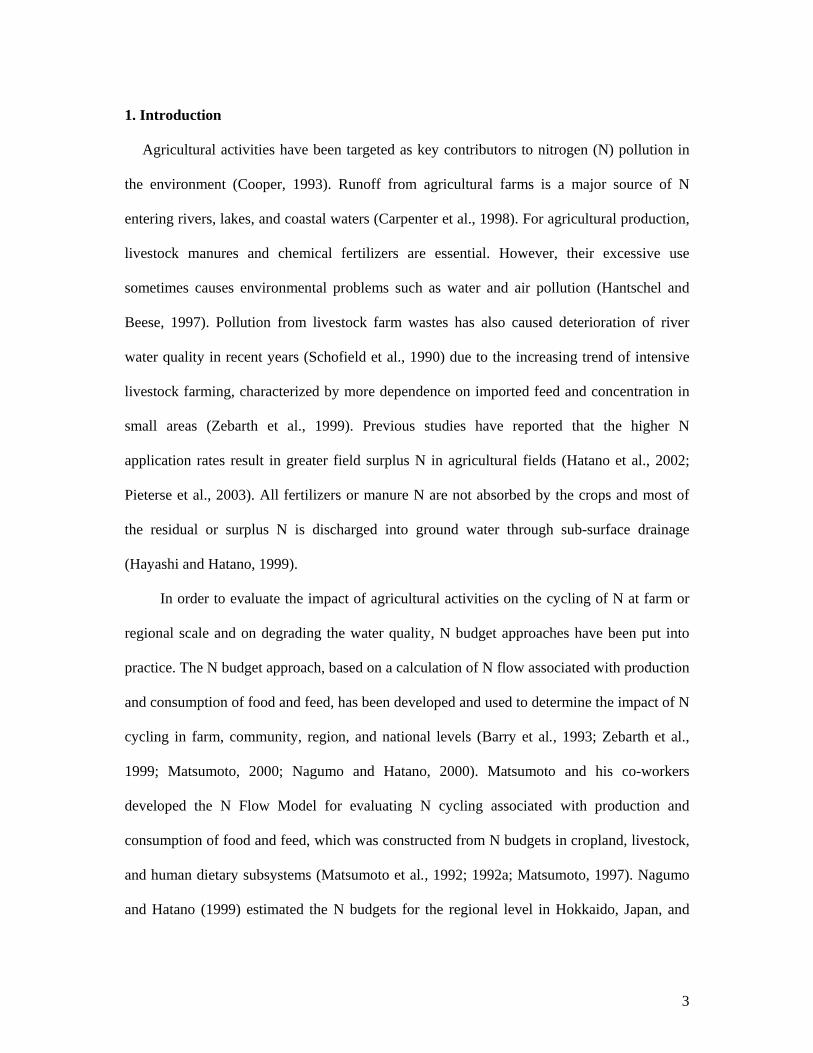
The drainage basins of Shibetsu River (43º35′N, 144º52′E) and Bekkanbeushi River
(43º10′N, 144º48′E) in eastern Hokkaido were selected for this study (Fig. 1). Shibetsu River
and Bekkanbeushi River flow into the Okhotsk Sea and Akkeshi Lake, respectively. The
drainage basin of Shibetsu River (1309 km2) consists of Shibetsu and Nakashibetsu towns,
which are collectively called ‘Shibetsu area’ in this study. The Akkeshi town and a partial
Pacific Ocean
Bay of Funka
Akkeshi area (Drainage basin of BekkanbeushiRiver)
Shibetsu area (Drainage basin of Shibetsu River)
Hokkaido
Fig. 1. Location map of the study sites in eastern Hokkaido, Japan.
Okhotsk Sea
JapanJapanJapanJapan
6
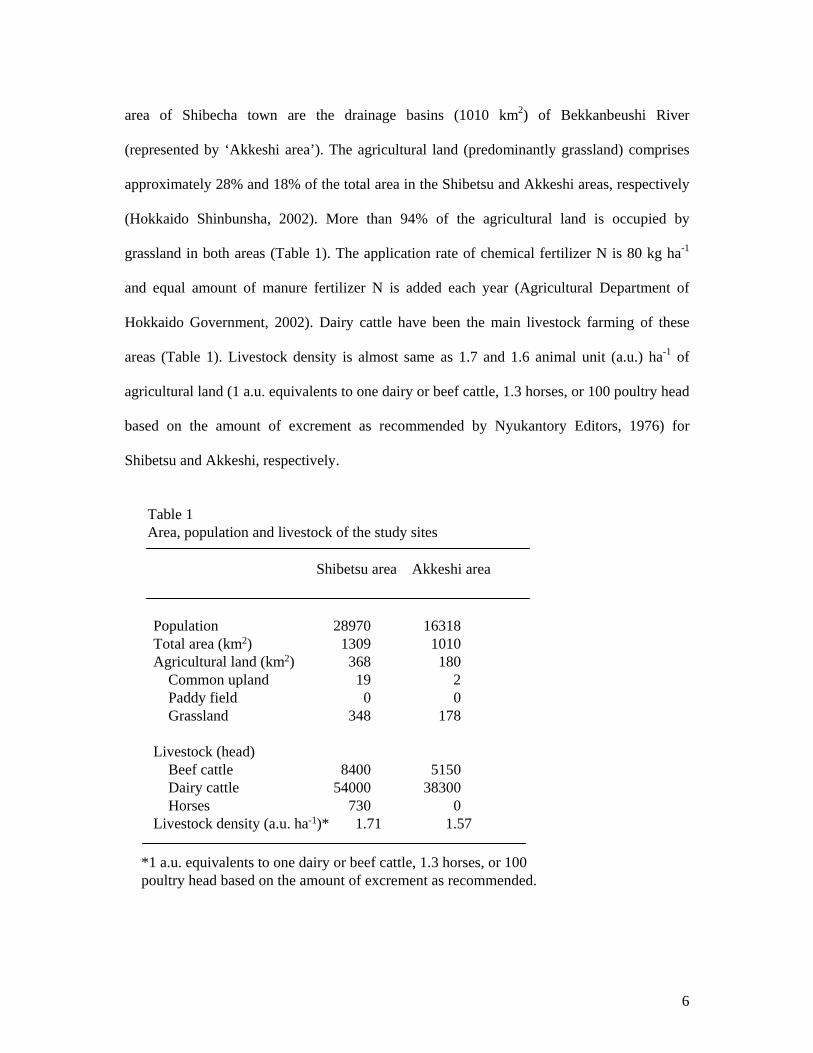
area of Shibecha town are the drainage basins (1010 km2) of Bekkanbeushi River
(represented by ‘Akkeshi area’). The agricultural land (predominantly grassland) comprises
approximately 28% and 18% of the total area in the Shibetsu and Akkeshi areas, respectively
(Hokkaido Shinbunsha, 2002). More than 94% of the agricultural land is occupied by
grassland in both areas (Table 1). The application rate of chemical fertilizer N is 80 kg ha-1
and equal amount of manure fertilizer N is added each year (Agricultural Department of
Hokkaido Government, 2002). Dairy cattle have been the main livestock farming of these
areas (Table 1). Livestock density is almost same as 1.7 and 1.6 animal unit (a.u.) ha-1 of
agricultural land (1 a.u. equivalents to one dairy or beef cattle, 1.3 horses, or 100 poultry head
based on the amount of excrement as recommended by Nyukantory Editors, 1976) for
Shibetsu and Akkeshi, respectively.
Population 28970 16318Total area (km2) 1309 1010Agricultural land (km2) 368 180
Common upland 19 2Paddy field 0 0Grassland 348 178
Livestock (head)Beef cattle 8400 5150Dairy cattle 54000 38300Horses 730 0
Livestock density (a.u. ha-1)* 1.71 1.57
Table 1Area, population and livestock of the study sites
Shibetsu area Akkeshi area
*1 a.u. equivalents to one dairy or beef cattle, 1.3 horses, or 100 poultry head based on the amount of excrement as recommended.
7
3. Materials and methods
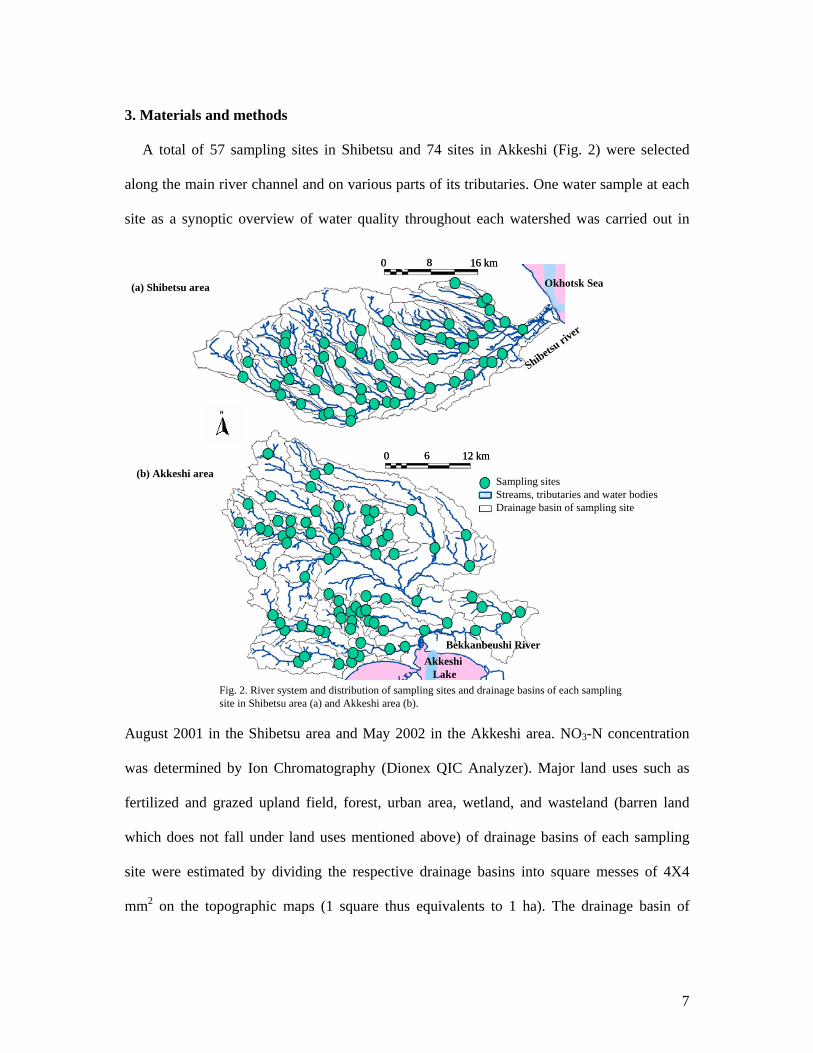
A total of 57 sampling sites in Shibetsu and 74 sites in Akkeshi (Fig. 2) were selected
along the main river channel and on various parts of its tributaries. One water sample at each
site as a synoptic overview of water quality throughout each watershed was carried out in
August 2001 in the Shibetsu area and May 2002 in the Akkeshi area. NO3-N concentration
was determined by Ion Chromatography (Dionex QIC Analyzer). Major land uses such as
fertilized and grazed upland field, forest, urban area, wetland, and wasteland (barren land
which does not fall under land uses mentioned above) of drainage basins of each sampling
site were estimated by dividing the respective drainage basins into square messes of 4X4
mm2 on the topographic maps (1 square thus equivalents to 1 ha). The drainage basin of
Fig. 2. River system and distribution of sampling sites and drainage basins of each sampling site in Shibetsu area (a) and Akkeshi area (b).
Shibetsu riv
er
(a) Shibetsu area
(b) Akkeshi area0 12 km60 12 km6
0 16 km80 16 km8
Okhotsk Sea
Bekkanbeushi RiverAkkeshi
Lake
Sampling sitesStreams, tributaries and water bodiesDrainage basin of sampling site
8
lower reach streams for each sampling site was calculated by including the drainage basins of
all upper streams and tributaries that mix into it. The common upland fields and grasslands
were defined as uplands in this study. The proportion of land use was estimated as the
percentage of total drainage area of sampling sites. The statistical analyses such as linear and
multiple regressions were performed to evaluate the correlation between impact factors of
water quality obtained in this study along with those reported in the previous studies, and
various parameters of N budgets in drainage basins, which were reported in the previous
studies. The ArcView/Geographical information system software (Environmental Systems
Research Institute, 2000) was applied for data presentation and for up scaling the results from
the catchment level to the regional level.
4. Results and discussion
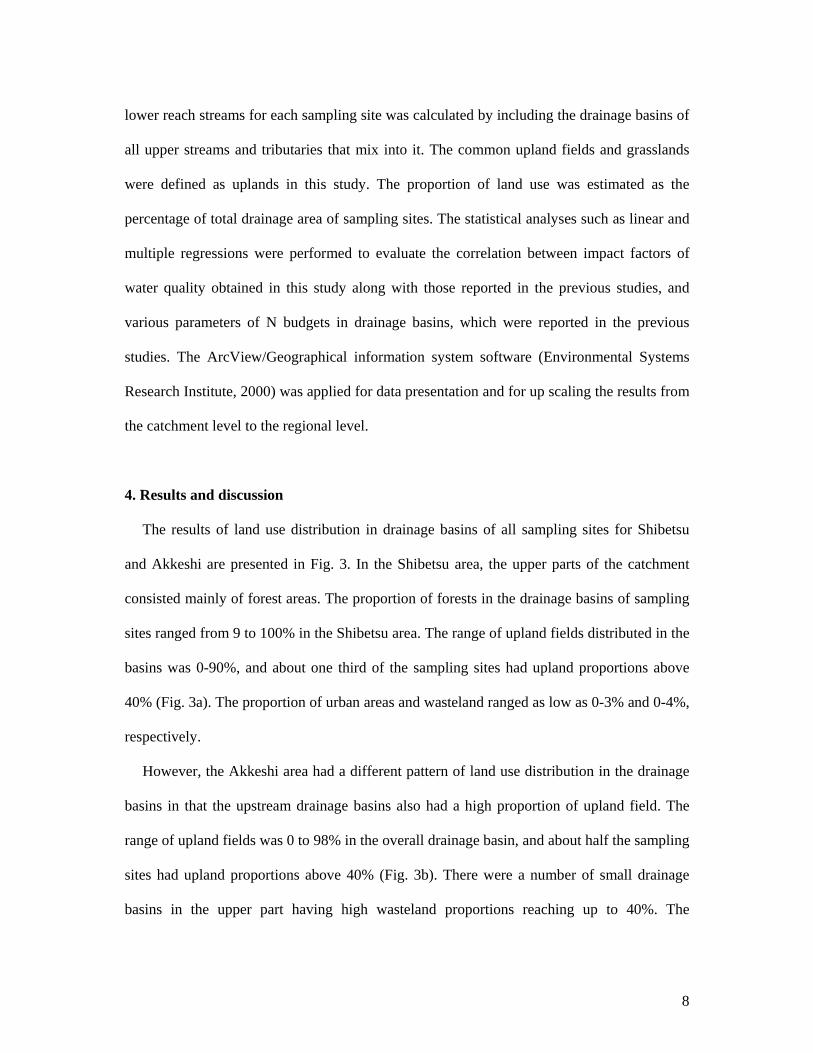
The results of land use distribution in drainage basins of all sampling sites for Shibetsu
and Akkeshi are presented in Fig. 3. In the Shibetsu area, the upper parts of the catchment
consisted mainly of forest areas. The proportion of forests in the drainage basins of sampling
sites ranged from 9 to 100% in the Shibetsu area. The range of upland fields distributed in the
basins was 0-90%, and about one third of the sampling sites had upland proportions above
40% (Fig. 3a). The proportion of urban areas and wasteland ranged as low as 0-3% and 0-4%,
respectively.
However, the Akkeshi area had a different pattern of land use distribution in the drainage
basins in that the upstream drainage basins also had a high proportion of upland field. The
range of upland fields was 0 to 98% in the overall drainage basin, and about half the sampling
sites had upland proportions above 40% (Fig. 3b). There were a number of small drainage
basins in the upper part having high wasteland proportions reaching up to 40%. The
9
proportion of wetland in the drainage basins varied from 0 to18%, while the range in urban
areas was 0-10%.
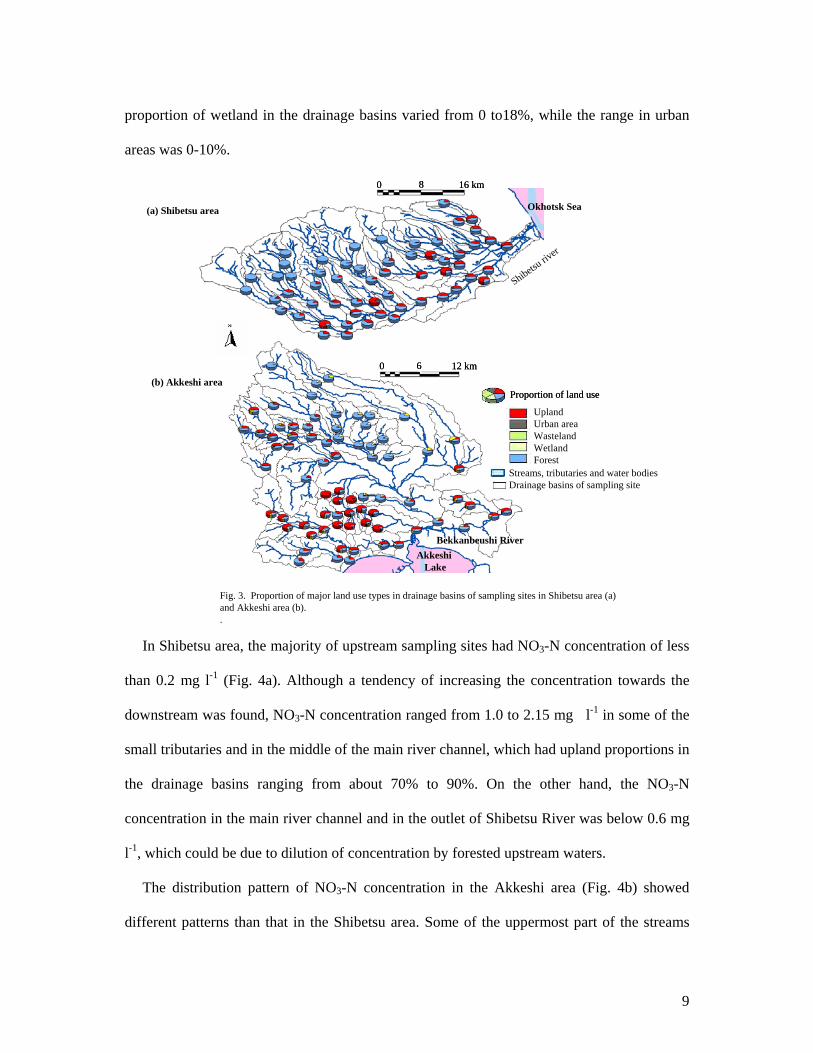
In Shibetsu area, the majority of upstream sampling sites had NO3-N concentration of less
than 0.2 mg l-1 (Fig. 4a). Although a tendency of increasing the concentration towards the
downstream was found, NO3-N concentration ranged from 1.0 to 2.15 mg l-1 in some of the
small tributaries and in the middle of the main river channel, which had upland proportions in
the drainage basins ranging from about 70% to 90%. On the other hand, the NO3-N
concentration in the main river channel and in the outlet of Shibetsu River was below 0.6 mg
l-1, which could be due to dilution of concentration by forested upstream waters.
The distribution pattern of NO3-N concentration in the Akkeshi area (Fig. 4b) showed
different patterns than that in the Shibetsu area. Some of the uppermost part of the streams
Fig. 3. Proportion of major land use types in drainage basins of sampling sites in Shibetsu area (a) and Akkeshi area (b). .
0 12 km60 12 km6
(a) Shibetsu area
(b) Akkeshi area
Bekkanbeushi River
Proportion of land useProportion of land use
Wasteland
UplandUrban area
WetlandForest
Streams, tributaries and water bodiesDrainage basins of sampling site
AkkeshiLake
0 16 km80 16 km8
Shibetsu riv
er
Okhotsk Sea
10
and tributaries also had high concentrations ranging from 0.5 to approximately 1.0 mg l-1 and
the concentration decreased towards the downstream to as low as <0.5 mg l-1. This may be
possibly due to the purification function of riverine wetland (Casey and Klaine, 2001;
Cosandey et al., 2002; Prior and Johnes, 2002) as most of the sampling sites in the upper as
well as lower reach of streams had wetland proportions in the drainage basins reaching up to
18%. Although almost all of the sampling sites had NO3-N concentrations <1.0 mg l-1, only
one site had a concentration reaching up to 2.5 mg l-1, which could have been affected by a
possible point source of pollution.
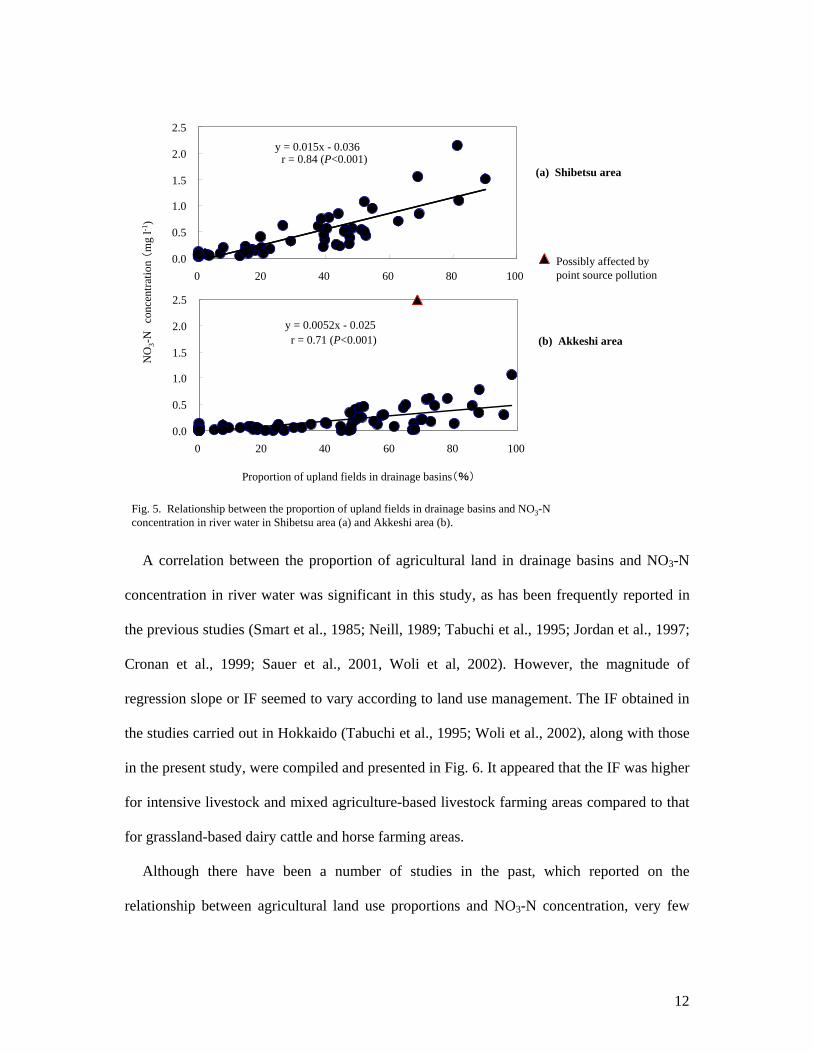
The relationship between the proportion of upland fields in the drainage basins and NO3-N
concentration in river water for both areas is presented in Fig. 5. The result showed that NO3-
0 – 0.20 0.21 – 0.500.51 – 1.001.01 – 2.002.01 – 3.00
Fig. 4. Distribution of measured NO3-N concentration in river and tributaries in Shibetsu area (a) and Akkeshi area (b). .
NO3-N concentration (mg l-1)0 12 km60 12 km6
(a) Shibetsu area
(b) Akkeshi area
Bekkanbeushi RiverAkkeshi
Lake
0 16 km80 16 km8
Shibetsu riv
er
Okhotsk Sea
11
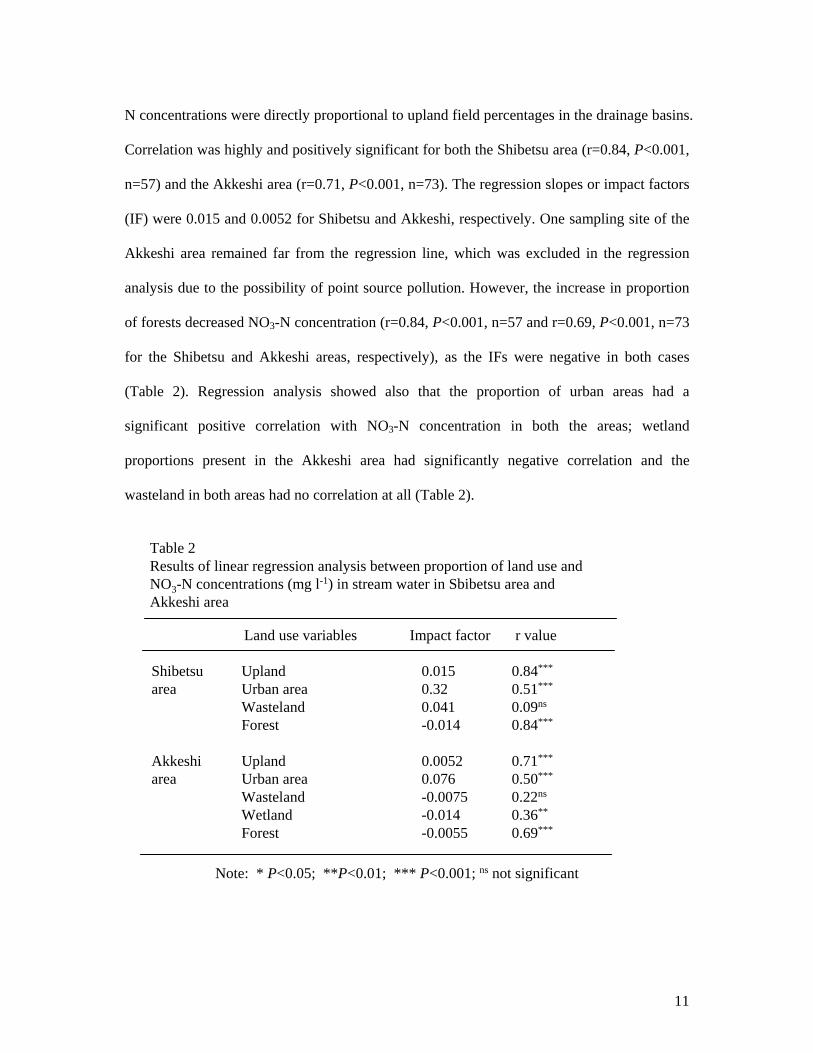
N concentrations were directly proportional to upland field percentages in the drainage basins.
Correlation was highly and positively significant for both the Shibetsu area (r=0.84, P<0.001,
n=57) and the Akkeshi area (r=0.71, P<0.001, n=73). The regression slopes or impact factors
(IF) were 0.015 and 0.0052 for Shibetsu and Akkeshi, respectively. One sampling site of the
Akkeshi area remained far from the regression line, which was excluded in the regression
analysis due to the possibility of point source pollution. However, the increase in proportion
of forests decreased NO3-N concentration (r=0.84, P<0.001, n=57 and r=0.69, P<0.001, n=73
for the Shibetsu and Akkeshi areas, respectively), as the IFs were negative in both cases
(Table 2). Regression analysis showed also that the proportion of urban areas had a
significant positive correlation with NO3-N concentration in both the areas; wetland
proportions present in the Akkeshi area had significantly negative correlation and the
wasteland in both areas had no correlation at all (Table 2).
Table 2Results of linear regression analysis between proportion of land use and NO3-N concentrations (mg l-1) in stream water in Sbibetsu area and Akkeshi area
Land use variables Impact factor r value
Shibetsu Upland 0.015 0.84***
area Urban area 0.32 0.51***
Wasteland 0.041 0.09ns
Forest -0.014 0.84***
Akkeshi Upland 0.0052 0.71***
area Urban area 0.076 0.50***
Wasteland -0.0075 0.22ns
Wetland -0.014 0.36**
Forest -0.0055 0.69***
Note: * P<0.05; **P<0.01; *** P<0.001; ns not significant
12
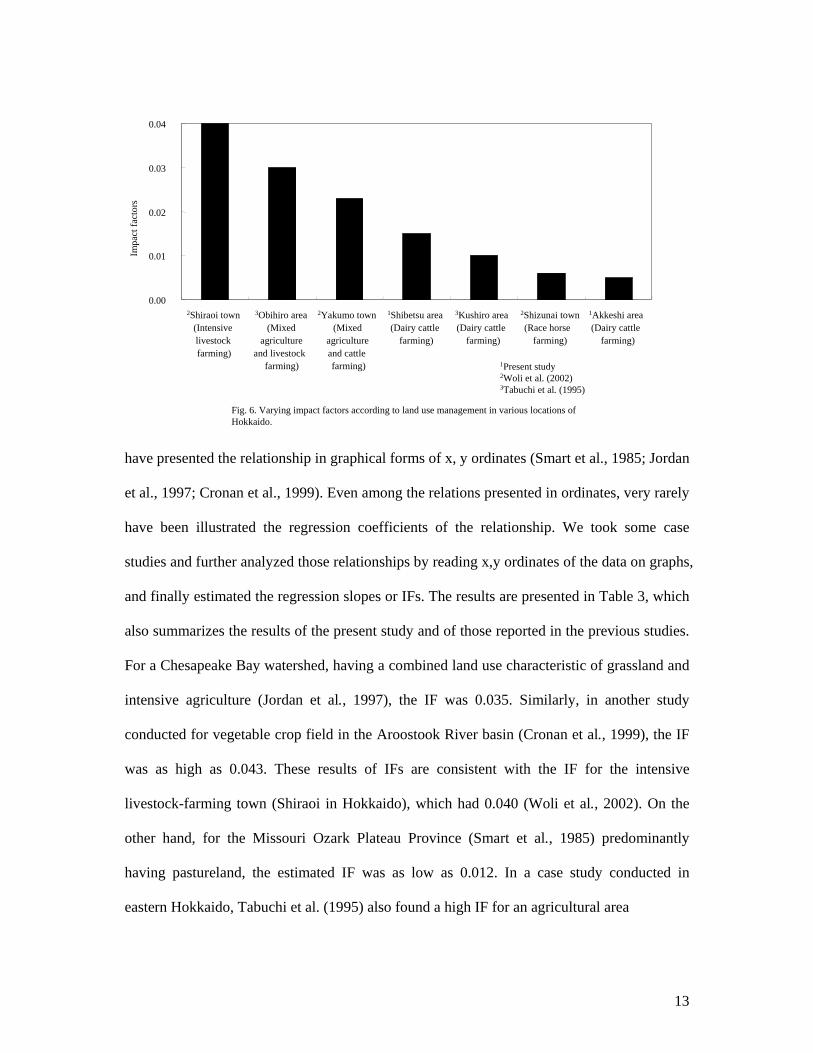
A correlation between the proportion of agricultural land in drainage basins and NO3-N
concentration in river water was significant in this study, as has been frequently reported in
the previous studies (Smart et al., 1985; Neill, 1989; Tabuchi et al., 1995; Jordan et al., 1997;
Cronan et al., 1999; Sauer et al., 2001, Woli et al, 2002). However, the magnitude of
regression slope or IF seemed to vary according to land use management. The IF obtained in
the studies carried out in Hokkaido (Tabuchi et al., 1995; Woli et al., 2002), along with those
in the present study, were compiled and presented in Fig. 6. It appeared that the IF was higher
for intensive livestock and mixed agriculture-based livestock farming areas compared to that
for grassland-based dairy cattle and horse farming areas.
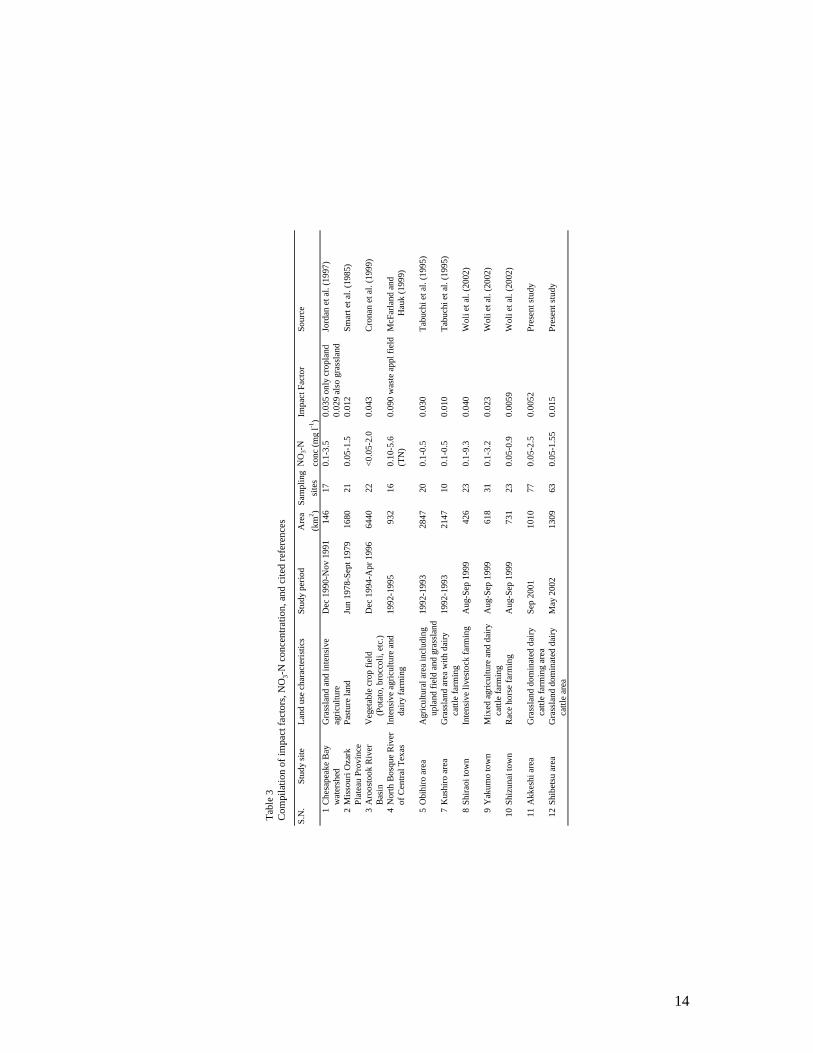
Although there have been a number of studies in the past, which reported on the
relationship between agricultural land use proportions and NO3-N concentration, very few
Proportion of upland fields in drainage basins(%)
NO
3-N
conc
entra
tion (
mg
l-1)
Fig. 5. Relationship between the proportion of upland fields in drainage basins and NO3-N concentration in river water in Shibetsu area (a) and Akkeshi area (b).
(a) Shibetsu area
(b) Akkeshi area
Possibly affected by point source pollution
y = 0.0052x - 0.025r = 0.71 (P<0.001)
0.0
0.5
1.0
1.5
2.0
2.5
0 20 40 60 80 100
y = 0.015x - 0.036r = 0.84 (P<0.001)
0.0
0.5
1.0
1.5
2.0
2.5
0 20 40 60 80 100
13
have presented the relationship in graphical forms of x, y ordinates (Smart et al., 1985; Jordan
et al., 1997; Cronan et al., 1999). Even among the relations presented in ordinates, very rarely
have been illustrated the regression coefficients of the relationship. We took some case
studies and further analyzed those relationships by reading x,y ordinates of the data on graphs,
and finally estimated the regression slopes or IFs. The results are presented in Table 3, which
also summarizes the results of the present study and of those reported in the previous studies.
For a Chesapeake Bay watershed, having a combined land use characteristic of grassland and
intensive agriculture (Jordan et al., 1997), the IF was 0.035. Similarly, in another study
conducted for vegetable crop field in the Aroostook River basin (Cronan et al., 1999), the IF
was as high as 0.043. These results of IFs are consistent with the IF for the intensive
livestock-farming town (Shiraoi in Hokkaido), which had 0.040 (Woli et al., 2002). On the
other hand, for the Missouri Ozark Plateau Province (Smart et al., 1985) predominantly
having pastureland, the estimated IF was as low as 0.012. In a case study conducted in
eastern Hokkaido, Tabuchi et al. (1995) also found a high IF for an agricultural area
Fig. 6. Varying impact factors according to land use management in various locations of Hokkaido.
Impa
ct fa
ctor
s
0.00
0.01
0.02
0.03
0.04
2Shiraoi town(Intensivelivestockfarming)
3Obihiro area(Mixed
agricultureand livestock
farming)
2Yakumo town(Mixed
agricultureand cattlefarming)
1Shibetsu area(Dairy cattle
farming)
3Kushiro area(Dairy cattle
farming)
2Shizunai town(Race horse
farming)
1Akkeshi area(Dairy cattle
farming)
1Present study 2Woli et al. (2002)3Tabuchi et al. (1995)
14
Tabl
e 3
Com
pila
tion
of im
pact
fact
ors,
NO
3-N
con
cent
ratio
n, a
nd c
ited
refe
renc
es
S.N
.St
udy
site
Land
use
cha
ract
eris
tics
Stud
y pe
riod
Are
a Sa
mpl
ing
NO
3-N
Impa
ct F
acto
rSo
urce
(km
2 )si
tes
conc
(mg
l-1)
1C
hesa
peak
e B
ay
Gra
ssla
nd a
nd in
tens
ive
Dec
199
0-N
ov 1
991
146
170.
1-3.
50.
035
only
cro
plan
dJo
rdan
et a
l. (1
997)
wat
ersh
edag
ricul
ture
0.02
9 al
so g
rass
land
2M
isso
uri O
zark
Pa
stur
e la
ndJu
n 19
78-S
ept 1
979
1680
210.
05-1
.50.
012
Smar
t et a
l. (1
985)
Plat
eau
Prov
ince
3A
roos
took
Riv
erV
eget
able
cro
p fie
ldD
ec 1
994-
Apr
199
664
4022
<0.0
5-2.
00.
043
Cro
nan
et a
l. (1
999)
Bas
in
(Pot
ato,
bro
ccol
i, et
c.)
4N
orth
Bos
que
Riv
erIn
tens
ive
agric
ultu
re a
nd
1992
-199
593
216
0.10
-5.6
0.09
0 w
aste
app
l fie
ldM
cFar
land
and
of
Cen
tral T
exas
d
airy
farm
ing
(TN
)
H
auk
(199
9)
5O
bihi
ro a
rea
Agr
icul
tura
l are
a in
clud
ing
1992
-199
328
4720
0.1-
0.5
0.03
0Ta
buch
i et a
l. (1
995)
u
plan
d fie
ld a
nd g
rass
land
7K
ushi
ro a
rea
Gra
ssla
nd a
rea
with
dai
ry
1992
-199
321
4710
0.1-
0.5
0.01
0Ta
buch
i et a
l. (1
995)
c
attle
farm
ing
8Sh
iraoi
tow
nIn
tens
ive
lives
tock
farm
ing
Aug
-Sep
199
942
623
0.1-
9.3
0.04
0W
oli e
t al.
(200
2)
9Y
akum
o to
wn
Mix
ed a
gric
ultu
re a
nd d
airy
Aug
-Sep
199
961
831
0.1-
3.2
0.02
3W
oli e
t al.
(200
2)
cat
tle fa
rmin
g10
Shiz
unai
tow
nR
ace
hors
e fa
rmin
gA
ug-S
ep 1
999
731
230.
05-0
.90.
0059
Wol
i et a
l. (2
002)
11A
kkes
hi a
rea
Gra
ssla
nd d
omin
ated
dai
rySe
p 20
0110
1077
0.05
-2.5
0.00
52Pr
esen
t stu
dy
cat
tle fa
rmin
g ar
ea12
Shib
etsu
are
aG
rass
land
dom
inat
ed d
airy
May
200
213
0963
0.05
-1.5
50.
015
Pres
ent s
tudy
c
attle
are
a
15
including upland field and grassland as 0.030, but lower IF for grassland-based dairy cattle
farming area as 0.010. These were similar to the study results of IFs in the study conducted
by Woli et al. (2002) for the dairy cattle farming town (Yakumo) and race horse farming
town (Shizunai) in southern Hokkaido, and with the results of this study (Akkeshi area and
Shibetsu area), because the IFs for all these areas ranged from 0.0052 to 0.023 (Table 3). In
contrary to these, for a drainage basin of North Bosque of Central Texas, which received
livestock wastes as high as 336 kg ha-1 of agricultural land, the IF was 0.09 for N (McFarland
and Hauck, 1999) and thus as low as 0.02 for nitrate N (by extrapolation). This could be due
to the fact that much of the run off from livestock manure may occur as organic forms of N
resulting in low concentration of inorganic N in the form of nitrate-N.
In order to evaluate the impact of agricultural activities on the values of IFs, the data and
information on various parts of N budgets such as human and livestock disposal N, cropland
surplus N, chemical and manure fertilizer N applied (these are termed as ‘N loading
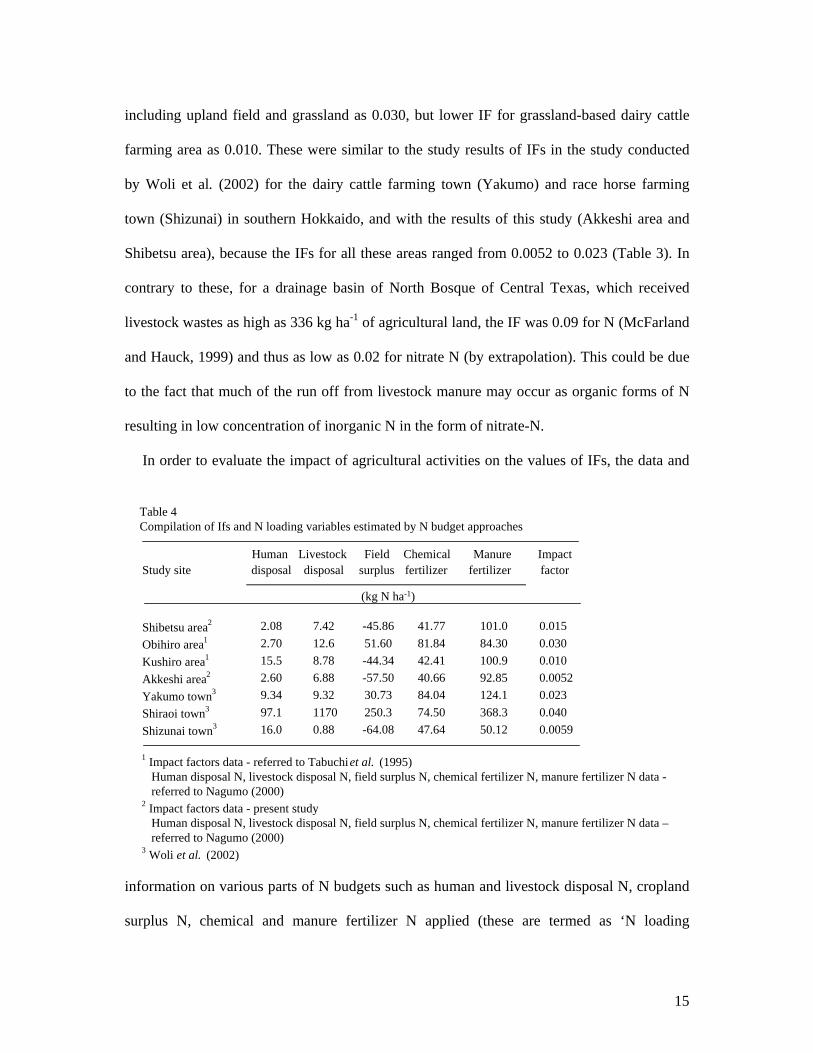
Table 4Compilation of Ifs and N loading variables estimated by N budget approaches
Human Livestock Field Chemical Manure Impact Study site disposal disposal surplus fertilizer fertilizer factor
Shibetsu area2 2.08 7.42 -45.86 41.77 101.0 0.015Obihiro area1 2.70 12.6 51.60 81.84 84.30 0.030Kushiro area1 15.5 8.78 -44.34 42.41 100.9 0.010Akkeshi area2 2.60 6.88 -57.50 40.66 92.85 0.0052Yakumo town3 9.34 9.32 30.73 84.04 124.1 0.023Shiraoi town3 97.1 1170 250.3 74.50 368.3 0.040Shizunai town3 16.0 0.88 -64.08 47.64 50.12 0.0059
1 Impact factors data - referred to Tabuchiet al. (1995)Human disposal N, livestock disposal N, field surplus N, chemical fertilizer N, manure fertilizer N data -referred to Nagumo (2000)
2 Impact factors data - present studyHuman disposal N, livestock disposal N, field surplus N, chemical fertilizer N, manure fertilizer N data –referred to Nagumo (2000)
3 Woli et al. (2002)
(kg N ha-1)
16
variables’ in this study) were compiled in Table 4. The data on N cycling were referred to
Nagumo (2000) and Woli et al. (2002), which were estimated by N budget approaches. The
excreted N from humans and livestock, which were not used or recycled but disposed, was
defined as disposal N. The surplus N in cropland was estimated by subtracting outputs such
as crop uptake, denitrification, and ammonia volatilization, from inputs on croplands such as
fertilizers, manure, rainfall, irrigation, and N fixation (Nagumo, 2000; Woli et al., 2002).
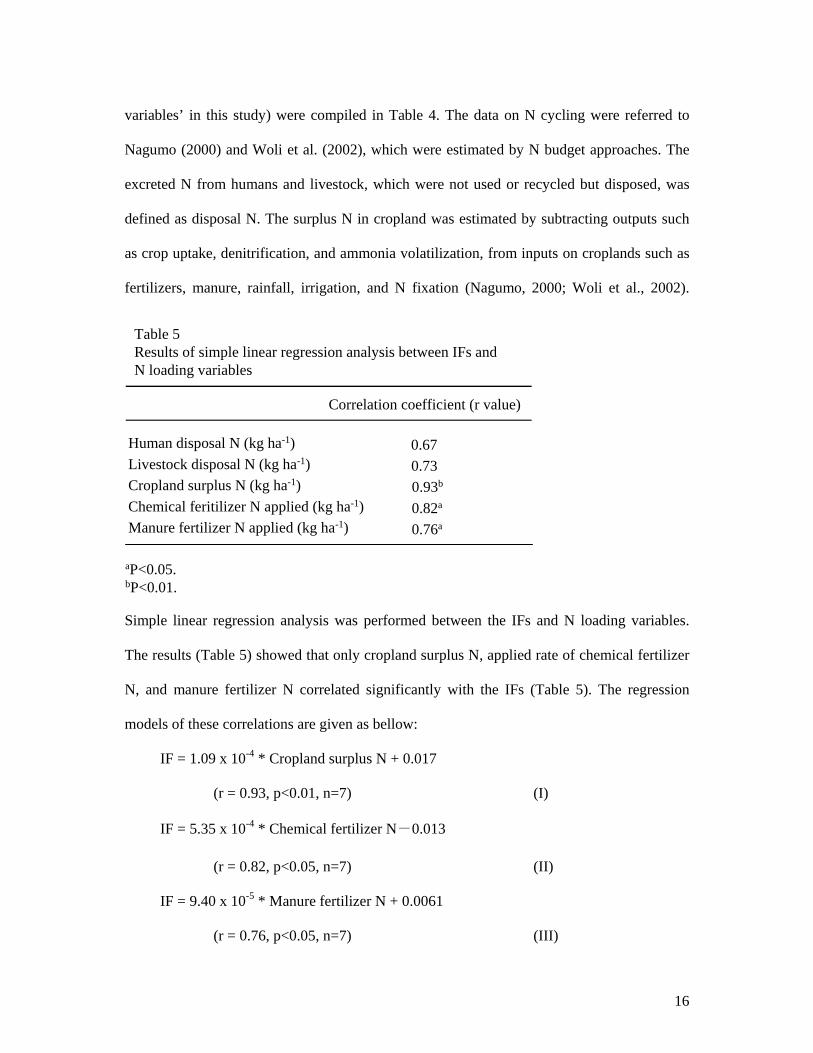
Simple linear regression analysis was performed between the IFs and N loading variables.
The results (Table 5) showed that only cropland surplus N, applied rate of chemical fertilizer
N, and manure fertilizer N correlated significantly with the IFs (Table 5). The regression
models of these correlations are given as bellow:
IF = 1.09 x 10⁻⁴ * Cropland surplus N + 0.017
(r = 0.93, p<0.01, n=7) (I)
IF = 5.35 x 10⁻⁴ * Chemical fertilizer N-0.013
(r = 0.82, p<0.05, n=7) (II)
IF = 9.40 x 10⁻⁵ * Manure fertilizer N + 0.0061
(r = 0.76, p<0.05, n=7) (III)
Table 5Results of simple linear regression analysis between IFs andN loading variables
aP<0.05.bP<0.01.
Correlation coefficient (r value)
Human disposal N (kg ha-1) 0.67Livestock disposal N (kg ha-1) 0.73Cropland surplus N (kg ha-1) 0.93b
Chemical feritilizer N applied (kg ha-1) 0.82a
Manure fertilizer N applied (kg ha-1) 0.76a
17
Among these correlations, cropland surplus N had the best correlation with the IFs. This
result indicated that the surplus N in croplands in a drainage basin could have a direct impact
on river water quality. The results also indicated that there was a stronger correlation of
chemical fertilizer N applied with the IF for uplands compared to that of manure fertilizer N,
because runoff associated with chemical fertilizer generally occurs as inorganic N in the form
of nitrate-N.
Pollution arising from agricultural activities increases mainly because of the
intensification of the food production system. The demand for food production is generally
met by a combination of high yielding varieties and greater reliance to fertilizers, and on
imported animal feed in livestock husbandry areas (Hooda et al., 2000). Woli et al. (2002)
reported that the main flow of N in the agricultural system was the import of feed to, and the
excretion of livestock, in the intensive livestock-farming town of southern Hokkaido. They
reported that as much as 76% of the total livestock excretion was disposed of without
recycling on croplands, and that the unutilized livestock excretion was 12 times greater than
the total excrement produced by human population in the town. They also found that the
cropland surplus N in the town was also as high as 250 kg N ha-1 yr-1. These results indicate
that among agricultural activities, application of livestock manure accompanied by chemical
fertilizers to obtain greater production enhances the N pool in the soil system, and that the N
not taken up by agricultural crops is accumulated in the soil resulting in higher surplus N,
ultimately discharged into ground water through sub-surface drainages (Hayashi and Hatano,
1999; Hatch et al., 2002). The regression results obtained in this study also indicated that
factors such as cropland surplus N, applied rate of chemical and manure fertilizer N affected
the IFs of water quality (Table 5). Among these three factors, the cropland surplus N had the
best correlation with the IFs, which is the product obtained by subtracting the outputs of
18
cropland system from inputs such as applied rates of chemical and manure fertilizer N,
including others as described earlier.
Dierberg (1991) indicated that the amount of N in surface run off is strongly influenced by
a combination of land use and management practices, soil types, and climatic conditions. The
transport of N in runoff from sites where livestock manure has been applied is dependent on
the timing and rate of manure application, together with site (i.e. soil type, slope). For
instance, Kaleel et al. (1980) reported that the total N lost in runoff from a grassland, which
received livestock manure during the winter, was much higher (18.7 kg ha-1 yr-1), compared
to the lower loss (9.1 kg ha-1 yr-1) when applied in the spring. In Hokkaido, livestock manure
is applied to agricultural land or disposed of during the autumn, just before the onset of
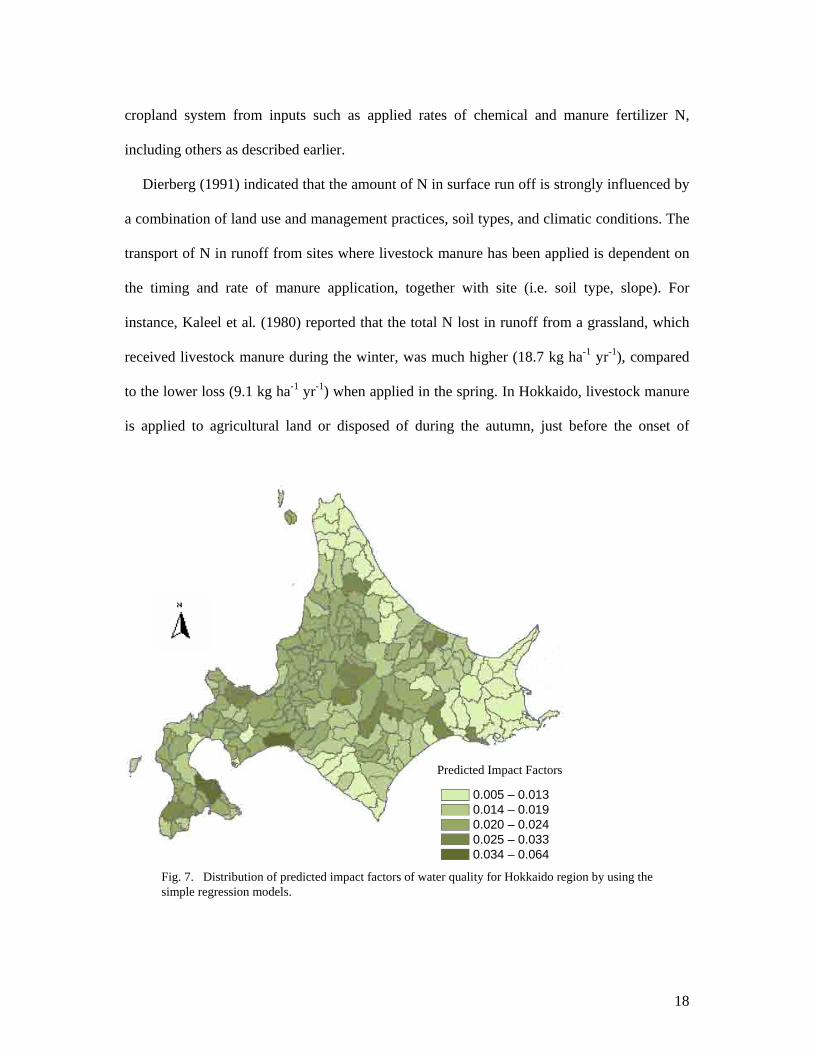
Fig. 7. Distribution of predicted impact factors of water quality for Hokkaido region by using the simple regression models.
0.005 – 0.0130.014 – 0.0190.020 – 0.0240.025 – 0.0330.034 – 0.064
Predicted Impact Factors
19
snowfall. In this season, crop uptake does not take place, and the applied manure is washed
away to a large extent during the snowmelt season. A recent study indicated that the large
loading of nutrients to rivers occurred during the early stage of snowmelt period in Hokkaido
(Hayakawa et al., 2003). These facts suggest that careful attention should be given in timely
application and handling of livestock manure to reduce the surplus N in cropland and dispose
of livestock excreta, eventually reducing pollution in river water.
We performed an up scaling of the evaluation associated with IFs for overall Hokkaido by
using the GIS software and the available statistical information. We used the best-correlated
regression model (Eq. (I)) to predict the IFs for all cities, towns, and villages of Hokkaido by
using the reported cropland surplus N for these areas (Nagumo, 2000). The estimated IFs for
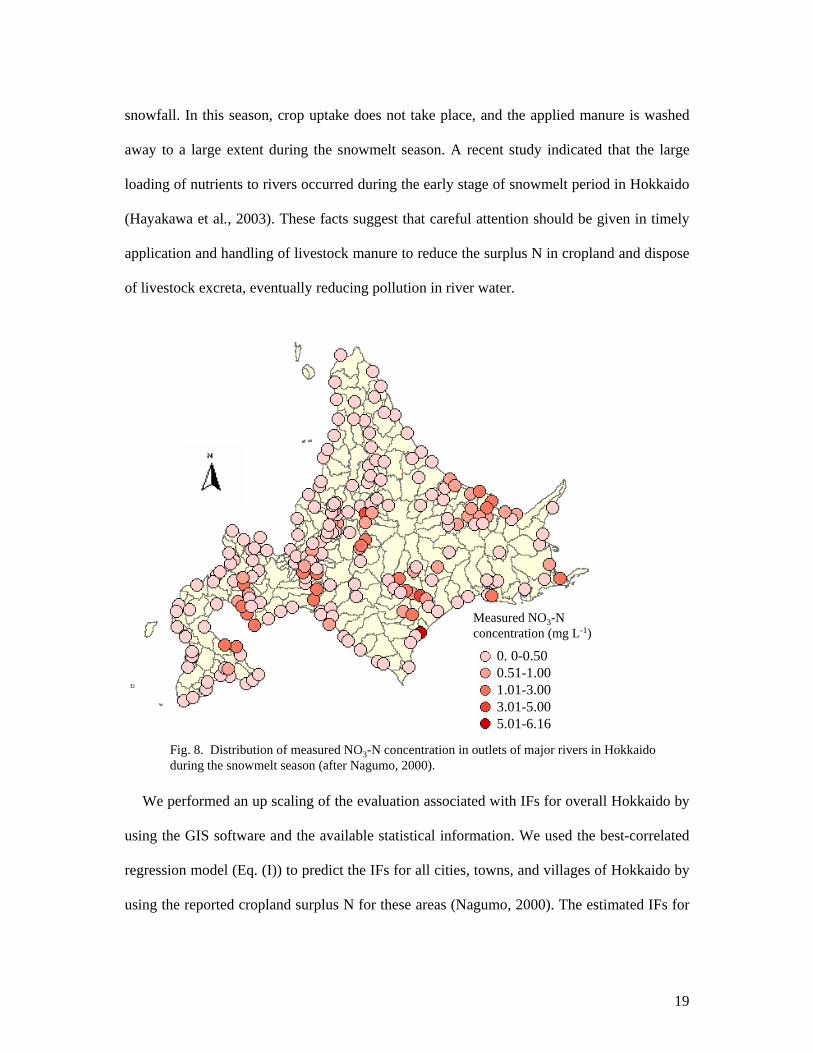
Fig. 8. Distribution of measured NO3-N concentration in outlets of major rivers in Hokkaidoduring the snowmelt season (after Nagumo, 2000).
Measured NO3-N concentration (mg L-1)
0. 0-0.500.51-1.001.01-3.003.01-5.005.01-6.16
20
cities, towns, and villages of Hokkaido are plotted in the Fig. 7. The result indicated that the
predicted IFs reflected a pattern of N surpluses in croplands. Major livestock husbandry areas
showed high IFs, which could be due to heavy application of animal excreta and chemical N
fertilizers in these areas. The distribution pattern for predicted IFs was very close to the
pattern of measured NO3-N concentration for all major rivers in Hokkaido (Fig. 8), as
reported by Nagumo (2000). As the proportion of upland in drainage basins also significantly
correlated with NO3-N concentration in this and in past studies, we estimated NO3-N
concentration for all those sampling sites in Hokkaido by multiplying the predicted IFs by the
proportion of uplands. Regression analysis indicated that the predicted NO3-N concentrations
were significantly correlated (r=0.62, P<0.001, n=203) with the measured NO3-N
concentrations (Fig. 9). The result also indicated that the prediction underestimated the
measured values to some extent. This may possibly be due to the fact that the measured
values of NO3-N concentration were from the snowmelt season, when relatively higher
discharge of nutrients can be expected (Hayakawa et al., 2003). The measured values for
about 7% of the total sites were higher than the predicted values. These sites were basically
the outlets of rivers flowing through major livestock farming and urban areas, therefore it is
considered that these sites may be influenced by possible point source pollution.
Conclusions
The land use pattern in a drainage basin affected the quality of river water, and the
increase in proportions of upland in drainage basins increased NO3-N concentration. The
impact intensity of land use on water quality was as great as the amount of N in cropland
surpluses in the respective drainage basins. The study results also indicated that the analysis
of land use patterns and estimation of N budgets were very effective in predicting NO3-N
21
concentration in river water. A proper management of upland proportions in drainage basins
and of cropland surplus N, is very important in protecting the quality of river water.
Acknowledgments
This study was partly supported by a Japanese Grant-in-Aid for Science Research from the
Ministry of Education, Culture, Sports, Science and Technology (No. 14209002) and the
2003 research grants provided by the 'Hokkaido Regional Development Bureau for the
Restoration project in the Shibetsu River'.
References
Agricultural Department of Hokkaido Government. Standard fertilizer application for
Hokkaido 2002; Sapporo (in Japanese)
Barry DAJ, Goorahoo D, Goss MJ. Estimation of nitrate concentrations in groundwater using
a whole farm nitrogen budget. J Environ Qual 1993;22:767-775.
Fig. 9. Measured NO3-N concentration in outlets of major rivers in Hokkaido during the snowmelt season (Nagumo, 2000) vs predicted NO3-N concentration by using the proportion of upland field and the predicted impact factor values estimated by simple regression model.
Predicted NO3-N concentration (mg L-1)
Mea
sure
d N
O3-
N c
once
ntra
tion
(mg
L-1)
y = 1.2808x + 0.1736r = 0.62
1:1 line
0.0
0.5
1.0
1.5
2.0
2.5
0.0 0.5 1.0 1.5 2.0 2.5
22
Carpenter S, Caraco NF, Correll DL, Howarth RW, Sharpley AN, and Smith VH. Nonpoint
pollution of surface waters with Phosphorus and Nitrogen. Issues in Ecology 1998;3:1-12.
Casey RE, Klaine SJ. Nutrient attenuation by a riparian wetland during natural and artificial
runoff events. J Environ Qual 2001;30:1720-1731.
Cooper CM. Biological effects of agriculturally derived surface water pollutants on aquatic
systems- A review. J Environ Qual 1993;22:402-408.
Cosandey AC, Maitre V, Guenat C, Vedy JC. Patterns of nitrate attenuation in riparian
wetlands. In: Nehring KW, Brauning SE, editors. Wetlands and Remediation, Vol. II,
2002:347-354.
Cronan CS, Piampiano JT, Patterson HH. Influence of land use and hydrology on exports of
carbon and nitrogen in a Maine River basin. J Environ Qual 1999; 28:953-961.
Dierberg FE. Non-point source loadings of nutrients and dissolved organic carbon from an
agricultural-suburban watershed in East Central Florida. Water Res 1991; 25(4):363-374.
Environmental Systems Research Institute. ESRI ArcView 8.1- an integrated set of
geographical information system (GIS) applications. 2000. New York, USA.
Hantschel RE, Beese F. Site-oriented ecosystem management: precondition to reducing
the contamination of waters and the atmosphere. In: Rosen D, Tel-Or E, Hadar Y, Chen Y,
editors. Modern Agriculture and the Environment, Kluwer Academic Publishers,
Dordrecht, 1997:135-145.
Hatano R, Shinano T, Taigen Z, Okubo M, Zuowei L. Nitrogen budgets and environmental
capacity in farm systems in a large-scale Karst region, southern China. Nut Cyc
Agroecosys 2002;63:139-149.
23
Hatch D, Goulding K, Murphy D. Nitrogen. In: Haygarth PM, Jarvis SC, editors. Agriculture,
Hydrology and Water Quality. CABI Publishing, CAB International, London, U.K.,
2002:7-27.
Hayakawa A, Nagumo T, Kuramochi K, Hatano R. Characteristics of nutrient load in a
stream flowing through a livestock farm during spring snowmelt. Soil Sci Plant Nutr
2003;49:301-305.
Hayashi Y, Hatano R. Annual nitrogen leaching to subsurface drainage water from a Clayey
Aquic soil cultivated with onions in Hokkaido, Japan. Soil Sci Plant Nutr 1999;45:451-
459.
Hojito M. Actual circumstances regarding water pollution in dairy farming areas in Hokkaido.
In: Matsunaka T, editor. Proceeding of International Workshop on Environmentally
Friendly Management of Farm Animal Waste, Rakuno Gakuen University, Ebetsu,
Hokkaido, Sapporo, Japan, 1998:73-77.
Hokkaido Government. Agriculture in Hokkaido (in Japanese) Hokkaido Kyodo Tsushinsha,
Sapporo, Japan,1996, p47.
Hokkaido Shinbunsya. Year Book of Hokkaido (in Japanese), 2002:431-432.
Hooda PS, Edwards AC, Anderson HA. A review of water quality concerns in livestock
farming areas. Sci Total Environ 2000; 250:143-167.
Jordan TE, Correll DL, Weller DE. Effects of agriculture on discharges of nutrients from
coastal plain watersheds of Chesapeake Bay. J Environ Qual 1997; 26: 836-848.
Khaleel R, Reddy KR, Overcash MR. Transport of potential pollutants in runoff water from
land areas receiving animal wastes: A review. Water Res 1980;14:421-436.
24
Matsumoto N. Study on nitrogen flow in rural area in attention to organic materials
management to maintain ideal nitrogen cycling (in Japanese). Unpublished Ph.D. Thesis,
Hokkaido University, Sapporo, Japan, 1997.
Matsumoto N. Development of estimation method and evaluation of nitrogen flow in regional
area, Bull Nat Inst Agro-Environ Sci 2000;18:81-152 (in Japanese with English
summary).
Matsumoto N, Satoh K, Hakamata T, Miwa E. Evaluation of organic material flow in rural
area (part 1) Change in organic material flow in the Ushiku Lake basin, Japan. Jpn J Soil
Sci Plant Nutr 1992;63:415-421 (in Japanese with English summary).
Matsumoto N, Hakamata T, Satoh K, Miwa E. Evaluation of organic material flow in rural
area (part 2) Local diversity of organic material flow in Ushiku Lake basin, Ibaraki,
Japan. Jpn J Soil Sci Plant Nutr 1992a; 63:639-645 (in Japanese with English summary).
McFarland AM S, Hauck LM. Relating agricultural land uses to in-stream stormwater quality.
J Environ Qual 1999;28:836-848.
Mishima S. Recent trend of nitrogen flow associated with agricultural production in Japan.
Soil Sci Plant Nutr 2001; 47 (1):157-166.
Nagumo T. Research on evaluating the nitrogen cycling and environmental loads associated
with production and supply of food in regional level (in Japanese). Unpublished Ph.D.
Thesis, Hokkaido University, Sapporo, Japan, 2000:15-22, 139-154.
Nagumo T, Hatano R. Nitrogen losses to the environment with production and consumption
of food in Hokkaido and their impact on water quality. In: Kumazawa K editor).
Proceedings of International Symposium on Bio-Recycling/Composting in Sapporo.
Council for Promotion of Utilization of Organic Materials, Hokkaido, Japan, 1999:37-39.
25
Nagumo T, Hatano R. Impact of nitrogen cycling associated with production and
consumption of food on nitrogen pollution of stream water. Soil Sci Plant Nutr 2000;
46:325-342.
Nagumo T, Hatano R. Regional characteristics of stream water quality during the snow-
melting season in Hokkaido (in Japanese with English summary). Jpn J Soil Sci Plant
Nutr 2001;72:41-48.
Neill M. Nitrate concentrations in river waters in the South-east of Ireland and their
relationship with agricultural practice. Water Res 1989; 23 (11):1339-1355.
Nyukantori Editors. Land application of livestock urine and feces, Hokkaido Kyodo Kumiai
Tsuain-sha, Sapporo (in Japanese), 1976:372-381.
Pieterse NM, Bleuten W, Jorgensen SE. Contribution of point sources and diffuse sources to
nitrogen and phosphorus loads in lowland river tributaries. J Hydrol 2003; 271:213-225.
Prior H, Johnes PJ. Regulation of surface water quality in a Cretaceous Chalk catchment,
UK: an assessment of the relative importance of instream and wetland processes. Sci
Total Environ 2002;282-283:159-174.
Sauer TJ, Alexander RB, Brahana JV, Smith RA. The importance and role of watersheds in
the transport of nitrogen. In: Follett RF, Hatfield JL, editors. Nitrogen in the
Environment: Sources, problems, and management, 2001:147-181.
Schofield K, Seager J, Merriman RP. The impact of intensive dairy farming activities on river
quality: The eastern Cleddau catchment study. J IWEM 1990;4:176-186.
Shimura M, Tabuchi T. The relation between cattle farming and nitrogen concentration in
stream waters- Research on nitrogen outflow from high stocking density area (IV). Jpn
Soc Irrigation Drainage Reclamation Eng 1997;189:45-50.
26
Smart MM, Jones JR, Sebaugh JL. Stream-watershed relations in the Missouri Ozark Plateau
Province. J Environ Qual 1985;14:77-82.
Tabuchi T, Yoshino K, Shimura M, Kuroda S, Ishikawa M, Yamaji E. Relation between land
use and nitrate concentration of outflow water from watersheds of agricultural and forest
areas. Jpn Soc Irrigation, Drainage Reclamation Eng 1995;178:129-135.
Woli KP, Nagumo T, Hatano R. Evaluating impact of land use and N budgets on stream
water quality in Hokkaido, Japan. Nut Cyc Agroecosys 2002;63:175-184.
Zebarth BJ, Paul JW, Kleeck RV. The effect of nitrogen management in agricultural
production on water and air quality: Evaluation on a regional scale. Agr Ecos Environ
1999;72:35-52.
Related Documents