Evaluating management interventions in small populations of a perennial herb Primula vulgaris using spatio-temporal analyses of point patterns Hans Jacquemyn 1 *, Patrick Endels 2 , Olivier Honnay 1 and Thorsten Wiegand 3 1 Division of Plant Ecology and Systematics, University of Leuven, Arenbergpark 31, B-3001 Heverlee, Belgium; 2 Division of Forest, Nature and Landscape Research, University of Leuven, Celestijnenlaan 200E, 3001 Leuven, Belgium; and 3 UFZ Helmholtz Centre for Environmental Research – UFZ, Department of Ecological Modeling, PF 500136, D-04301 Leipzig, Germany Summary 1. In high-intensity agricultural landscapes, small landscape elements such as hedgerows, ditch banks, and rows of pollard trees may represent the last refuge of many plant and animal species, some of them being rare or even threatened with extinction. However, due to their small size and low habitat quality, long-term population survival cannot be ascertained and often active manage- ment is needed to maintain viable populations of species forced to survive in these small landscape elements. 2. Population models are needed to assess the threats to species at risk and to evaluate alternative management actions. Here, we present a methodology to evaluate management interventions using spatio-temporal analyses of point patterns. We apply this method to several populations of prim- rose Primula vulgaris in Flanders, where it is rare and predominantly occurs along ditch banks. 3. The effects of ditch bank clearing on the establishment success of seedlings was investigated by comparing spatial patterns of seedling recruitment, survival and mortality between populations that were grazed and populations that were severely disturbed by mechanical clearing of ditch banks followed by annual mowing. A total of 884 seedlings were mapped and monitored during 4 consecutive years (1999–2002). 4. In all populations, plants showed significant clustering, but in cleared sites only seedlings were significantly clustered around adults. Spatial patterns of mortality varied according to the manage- ment intervention. In grazed sites, mortality was almost random, whereas in cleared sites we found clear evidence for strong negative density-dependent mortality. There was no evidence that the pres- ence of adults affected survival of recruits in any of the sites studied. 5. Synthesis and applications. This study shows that the analysis of spatial point patterns contributes to our understanding of the population dynamics of plant species occurring in different environments. The approach can be broadly applied to other plant species to elucidate the processes that determine the number of individuals that establish and persist into later life stages and will help conservation managers to refine management strategies intended to conserve or restore plant populations. In the case of P. vulgaris, increasing the availability of microsites is most likely to result in increased growth rates, as it results in increased recruitment and establishment of recruits. Key-words: O-ring statistics, pair correlation function, point pattern analysis, Primula, random mortality hypothesis, recruitment Introduction In most of north-western Europe, the intensification of agricul- ture practices has forced many formerly widespread plant and animal species to survive in semi-natural habitat remnants, such as hedgerows, ditch banks, and rows of pollard trees (Sto- ate et al. 2001; Robinson & Sutherland 2002). However, the long-term survival of plant populations along small-landscape elements cannot be guaranteed because of their small area and low habitat quality (Kleijn & Verbeek 2000; Blomqvist et al. 2003). Specific management interventions are often needed to *Correspondence author. E-mail: [email protected] Journal of Applied Ecology 2010, 47, 431–440 doi: 10.1111/j.1365-2664.2010.01778.x Ó 2010 The Authors. Journal compilation Ó 2010 British Ecological Society

Welcome message from author
This document is posted to help you gain knowledge. Please leave a comment to let me know what you think about it! Share it to your friends and learn new things together.
Transcript
Evaluating management interventions in small
populations of a perennial herb Primula vulgaris using
spatio-temporal analyses of point patterns
Hans Jacquemyn1*, Patrick Endels2, Olivier Honnay1 and Thorsten Wiegand3
1Division of Plant Ecology and Systematics, University of Leuven, Arenbergpark 31, B-3001 Heverlee, Belgium;2Division of Forest, Nature and Landscape Research, University of Leuven, Celestijnenlaan 200E, 3001 Leuven,
Belgium; and 3UFZ Helmholtz Centre for Environmental Research – UFZ, Department of Ecological Modeling,
PF 500136, D-04301 Leipzig, Germany
Summary
1. In high-intensity agricultural landscapes, small landscape elements such as hedgerows, ditch
banks, and rows of pollard trees may represent the last refuge of many plant and animal species,
some of them being rare or even threatened with extinction. However, due to their small size and
low habitat quality, long-term population survival cannot be ascertained and often active manage-
ment is needed to maintain viable populations of species forced to survive in these small landscape
elements.
2. Population models are needed to assess the threats to species at risk and to evaluate alternative
management actions. Here, we present a methodology to evaluate management interventions using
spatio-temporal analyses of point patterns. We apply this method to several populations of prim-
rosePrimula vulgaris in Flanders, where it is rare and predominantly occurs along ditch banks.
3. The effects of ditch bank clearing on the establishment success of seedlings was investigated by
comparing spatial patterns of seedling recruitment, survival andmortality between populations that
were grazed and populations that were severely disturbed by mechanical clearing of ditch banks
followed by annual mowing. A total of 884 seedlings were mapped and monitored during 4
consecutive years (1999–2002).
4. In all populations, plants showed significant clustering, but in cleared sites only seedlings were
significantly clustered around adults. Spatial patterns of mortality varied according to the manage-
ment intervention. In grazed sites, mortality was almost random, whereas in cleared sites we found
clear evidence for strong negative density-dependent mortality. There was no evidence that the pres-
ence of adults affected survival of recruits in any of the sites studied.
5. Synthesis and applications. This study shows that the analysis of spatial point patterns
contributes to our understanding of the population dynamics of plant species occurring in different
environments. The approach can be broadly applied to other plant species to elucidate the processes
that determine the number of individuals that establish and persist into later life stages and will help
conservation managers to refine management strategies intended to conserve or restore plant
populations. In the case ofP. vulgaris, increasing the availability of microsites is most likely to result
in increased growth rates, as it results in increased recruitment and establishment of recruits.
Key-words: O-ring statistics, pair correlation function, point pattern analysis, Primula,
random mortality hypothesis, recruitment
Introduction
Inmost of north-western Europe, the intensification of agricul-
ture practices has forced many formerly widespread plant and
animal species to survive in semi-natural habitat remnants,
such as hedgerows, ditch banks, and rows of pollard trees (Sto-
ate et al. 2001; Robinson & Sutherland 2002). However, the
long-term survival of plant populations along small-landscape
elements cannot be guaranteed because of their small area and
low habitat quality (Kleijn & Verbeek 2000; Blomqvist et al.
2003). Specific management interventions are often needed to*Correspondence author. E-mail: [email protected]
Journal of Applied Ecology 2010, 47, 431–440 doi: 10.1111/j.1365-2664.2010.01778.x
� 2010 The Authors. Journal compilation � 2010 British Ecological Society
maintain viable plant populations in agricultural landscapes.
One way of evaluating changes in population viability after
intervention is to usematrix populationmodels (e.g.Brys et al.
2004; Pfeifer et al. 2006). These approaches, however, provide
little insight in the processes that determine why particular life
stages establish and survive into the next life stage and others
do not.
There are two contrasting explanations for the distribution
and abundance of individuals within a population (reviewed in
Turnbull, Crawley & Rees 2000; Clark et al. 2007; Poulsen
et al. 2007). The first states that the distribution of juveniles
and adults is primarily determined by the number of seeds that
are dispersed into a population. The alternative viewpoint is
that population size and the distribution of juveniles and adults
are primarily determined by the quality of suitable sites for
recruitment and the effect of density-dependent survival within
these sites. Recent meta-analyses of seed addition experiments
(Clark et al. 2007; Poulsen et al. 2007) have shown that supple-
mental addition of seeds to populations almost always results
in increased seedling recruitment, indicating that most plant
populations are seed limited. However, the effects of seed addi-
tion were relatively small and most seeds failed to recruit into
the seedling stage, suggesting that establishment limitation,
rather than seed limitation, is the most important factor
limiting the distribution and abundance of individuals (Clark
et al. 2007).
One way of investigating the relative importance of dispersal
and establishment processes in determining the distribution
and abundance in plant populations is the study of spatial
patterns in recruitment, survival andmortality, especially when
temporal changes in these patterns are analysed (e.g. Turnbull
et al. 2004).Whereas spatial patterns of seed arrival depend on
the mechanisms of seed dispersal, seed recruitment depends on
the interaction of multiple biotic and abiotic factors. Biotic
factors relate to seed competition, predation or pathogens,
whereas abiotic factors refer to gaps, resources or microsites
(Clark et al. 1999). Competitive interactions can be further
partitioned according whether they cause density-dependent
or density-independent mortality between seed arrival and
recruitment into a later life stage (Clark, Macklin & Wood
1998). Intra-specific competition can be intense, particularly
when seeds are strongly aggregated at small spatial scales
(Rees, Grubb & Kelly 1996; Turnbull et al. 2004). While
several mechanisms could generate this pattern, local seed
dispersal resulting in seedlings being clustered around adults or
seedlings clumped together at very high local densities, leading
to intra-specific aggregation is most likely for species with
limited dispersal capacities. This implies that patterns of seed
dispersal and the subsequent spatial arrangement of seedlings
within a population may largely determine patterns of growth
and mortality and thus may have important implications for
populationmanagement.
Few studies have investigated processes that determine the
number of individuals that establish and persist into later life
stages (but see Kenkel 1988; De la Cruz et al. 2008). In this
paper, patterns of seedling establishment were investigated in
several populations of the perennial Primula vulgaris by
comparing seedling recruitment, mortality and survival into
later life stages. In Flanders, the species is rare and occurs pre-
dominantly in small landscape elements that are subjected to
different disturbance regimes. Previous demographic research
using matrix models already showed that seed germination,
seedling establishment and survival were the most important
factors determining variation in growth rates (Endels et al.
2007). By examining changes in spatial patterns in natural pop-
ulations along ditch banks we aimed to investigate to what
extent density-dependent or density-independent mortality
between seed arrival and recruitment into a later life stage
determined seedling establishment success. The results of
this study may therefore not only contribute to a better
understanding of the driving forces (dispersal, competition and
management) that shape spatial patterns in plant populations,
but also allow conservation strategies to be refined. The
methodology should be widely applicable as a valuable
addition tomatrix populationmodelling.
Materials and methods
SPECIES
Primula vulgaris Huds. is a small, long-lived, herbaceous, diploid
perennial with a North Atlantic and Mediterranean distribution
(Jacquemyn et al. 2009). In Flanders, Belgium, it is considered a very
rare and declining species: only 89 populations, ranging in size from 1
to 1219 individuals, were found in 1999.Most populations (58 in total
or 68%) contained fewer than 50 individuals (Endels et al. 2002).
AlthoughP. vulgaris is regarded as a typical woodland species (Whale
1984) associated with newly opened gaps (Valverde & Silvertown
1995), most populations (85%) in Flanders occur on ditch banks
along hedgerows and forest edges (Endels et al. 2002). Plants flower
in early spring (March–May) and are mainly pollinated byHymenop-
tera (mostly bumblebees) andDiptera (Jacquemyn et al. 2009). Fruits
ripen around the middle of June and have an elaiosome, which is
attractive to ants and rodents who may actively harvest seeds and
disperse them across the landscape (Valverde & Silvertown 1995).
However, seeds usually fall directly to the ground in the immediate
vicinity of the mother plant (barochory; Cahalan & Gliddon 1985).
Vegetative spread is restricted and only occurs within very short
distances from the mother plant through production of lateral
rosettes. Although these individual rosettes can die off, individual
plants are relatively long-lived (10–30 years; Boyd, Silvertown &
Tucker 1990).
STUDY SITES AND DATA COLLECTION
During 1999–2002, population surveys of P. vulgariswere carried out
at four locations (Appendix S1). Two populations (G1 and G2) were
grazed, whereas the other two (MCL1 and MCL2) occurred at sites
that were cleared mechanically (with scraping of ditch banks and
partial removal of the vegetation) once every three years, followed by
annual mowing and removal of all litter in subsequent years.
Distances between the studied populations were small (0Æ5–2 km),
implying that they experienced similar climatic conditions. All sites
were visited once a year during spring at peak flowering (mid March
to early April). During each survey, all plants were mapped to the
nearest cm, enabling to locate each individual throughout the
sampling period and to locate mortality events within each site. In all
432 H. Jacquemyn et al.
� 2010 The Authors. Journal compilation � 2010 British Ecological Society, Journal of Applied Ecology, 47, 431–440
subsequent analyses, the following data were used. Adults were
defined as adults recorded in the 1999 census. Since there was little
adult turnover until 2002, we used the 1999 adult data in all cases.
Plants not present in the first (1999) census, but present in the 2000
census are recruits that were monitored for 3 years. In 2001 and 2002,
surviving and dead recruits were recorded. New recruits that origi-
nated after 2000were not considered in this analysis.
SPATIAL PATTERN ANALYSIS
We used the O-ring statistic (Wiegand&Moloney 2004) and the pair-
correlation function (Stoyan & Stoyan 1994) as summary statistics to
describe the spatial correlation structure of the bivariate point pat-
terns observed at our study site. Since there were no apparent hetero-
geneities in our study transects (Supporting Information Appendix
S1) we usedmethods for homogeneous point patterns.
The bivariate O-ring statistic for point patterns comprising type 1
and type 2 points (where, for example type 1may represent adult indi-
viduals and type 2 recruits) is the expected density of recruits in a ring
of radius r andwidth dw centred on an arbitrary adult plant (Wiegand
&Moloney 2004). The O-ring statistic has the intuitive interpretation
of a neighbourhood density and is especially sensitive to small-scale
effects (Wiegand & Moloney 2004; Illian et al. 2008). The bivariate
pair-correlation function g12(r) is the intensity normalized version of
O12(r), i.e., O12(r) = k2g12(r), where k2 is the intensity of recruits in
the study transect (i.e. the number of points of pattern 2 divided by
the area of the study plot; Stoyan & Stoyan 1994).We used the bivari-
ate O-ring statistic for analysis of the recruit-adult relationship where
the direct interpretation of a density is of interest, and the pair corre-
lation function for analysis of recruitmentmortality.
Because datawere collected at two replicate transects for eachman-
agement type, the results of the individual analyses of the two popula-
tions were combined into one overall test statistic by weighting the
contribution of each plot with the number of points of pattern 1 of
each plot (Riginos, Milton & Wiegand 2005; De Luis et al. 2008;
Illian et al. 2008). All analyses were done using the software
Programita (Wiegand & Moloney 2004; Wiegand et al. 2006, 2007b;
Wiegand, Gunatilleke & Gunatilleke 2007a). Details on the estima-
tors of the summary statistics and edge correction used in Programita
can be found inWiegand&Moloney (2004).
SIGNIF ICANCE OF PATTERNS AGAINST A NULL MODEL
The observed summary statistics were contrasted to that expected
under the specific null model chosen. Approximate (two-sided)
95% simulation envelopes for a given null model were created by
calculating for each distance r the 5th lowest and highest values
of the summary statistic from 199 Monte Carlo simulations of
the null model. This yields an approximate 5% error rate. Note
however that the simulation envelopes cannot be interpreted as
confidence intervals, given that the null hypothesis is tested
simultaneously at many scales, inflating the chance of type I
errors (Diggle 2003; Loosmore & Ford 2006; Illian et al. 2008).
We therefore examined the significance levels over a distance
interval of interest following the goodness-of-fit test proposed by
Diggle (2003). Under this test, both the observed pattern (i = 0)
and each of the simulated patterns (i = 1, …, 199) are reduced
to a single test statistic ui which represents the total squared devi-
ation between the observed pattern and the theoretical result
across the distances of interest (i.e. where the null model may be
rejected). The larger the rank of u0, the larger the departure of
the empirical summary statistic from that expected under the null
model. If the rank of u0 is larger than 190, the null hypothesis is
rejected at the distance interval of interest on a 5% level.
ANALYSES
Analysis 0: Univariate spatial patterns
We aimed to assess the univariate spatial structure of the spatial pat-
terns of adults and the three recruit cohorts to ascertain if the univari-
ate patterns were aggregated. To this end we compared our data
within each transect to a completely random pattern and used the O-
ring statistic as test statistic.
Analysis 1: Recruit-adult relationships
We sought to establish if the different recruit generations were
clustered around adults and if there were differences between
the two management interventions. We compared the bivariate
data to the null model of independence using the bivariate
O-ring statistic as test statistic and a toroidal shift as null model
(Goreaud & Pelissier 2003; Wiegand & Moloney 2004). This
null model preserves the spatial structures of both pattern, but
breaks the dependence between them. One way of achieving this
is by simulations that involve random shifts of the whole of
one component pattern (the recruits) relative to the other (the
adults). In practice, the rectangular study region is treated as a
torus where the upper and lower edges are connected and
the right and left edges are connected. Because the data for
population 2G comprised basically two transects (Appendix S1)
we analysed them separately.
Analysis 2: Recruit survival
We investigated the spatial structure in mortality of the recruits by
comparing the spatial pattern of surviving and dead recruits at years
2001 (and 2002) to the null model of random mortality (also called
random labelling; Goreaud & Pelissier 2003; Wiegand & Moloney
2004).
For each year (2001 and 2002) we know if a given recruit was
dead or alive. To identify the spatial structures in the process
that assigned a label ‘mortality’ to the recruits the framework of
‘marked point patterns’ is required (Goreaud & Pelissier 2003).
The fundamental question is to find out if the process that
distributed the label was a random process. A suitable null
model for this is ‘random labelling’. We used a Monte Carlo
implementation of random labelling that involves random re-sam-
pling of sets of n1 dead recruits from the total of (n1 + n2) dead
and surviving recruits, i.e. we randomly shuffle the label ‘dead’
among the recruits.
While the concept of random labelling is easy and intuitive, the test
statistics needed to test departures from random labelling are slightly
more complex because they need to be adapted to the specific ques-
tion asked. Conventional random labelling analyses only the two pat-
terns of dead and surviving plants (Goreaud & Pelissier 2003; De la
Cruz et al. 2008). In this case random labelling implies that
g1+2,1+2(r) = g11(r) = g22(r) = g12(r) = g21(r) where 1 symbolizes
dead individuals, 2 surviving, and 1 + 2 symbolizes the joint pattern
of dead and surviving individuals. This convenient property of ran-
dom labelling allows for construction of different test statistics based
on pair correlation functions. We used several specific test statistics,
each of which evaluates a different biological effect of the spatial
interactions that determinemortality.
Spatial population dynamics in Primula vulgaris 433
� 2010 The Authors. Journal compilation � 2010 British Ecological Society, Journal of Applied Ecology, 47, 431–440
Test of aggregation of dead plants with g11. We used the test
statistic g11(r) (i.e. univariate random labelling; Wiegand & Moloney
2004) to explore the patterns of recruit mortality. Under scramble
competition we expect that clumps of interacting recruits should die
together, thus dead recruits should be spatially aggregated (e.g.
Kenkel 1988). The test statistic g11(r) is especially tailored to detect
clustering of dead recruits: if g11(r) shows a positive departure from
the random labelling null model, dead recruits are significantly
clustered at scale r, conditionally on the joint pattern of dead and
surviving recruits.
Test of attraction vs. segregation of dead and surviving plants. We
used the test statistic g12(r) (Goreaud & Pelissier 2003) to explore
spatial patterns of recruit survival and mortality. Under two-sided
scramble competition negative interactions would be most
pronounced in areas of higher recruits density, leading eventually to
clumps of dead recruits which are spatially segregated from surviving
recruits. Conversely, one-sided contest competition leads to a
situation where suppressed ‘losers’ are located near its superior rivals.
Thus, in the language of point pattern analysis, dead recruits will be
‘attracted’ by surviving recruits (Kenkel 1988). The test statistic g12(r)
is tailored to detect correlation between dead and surviving recruits
(Goreaud & Pelissier 2003). Attraction (or segregation) between dead
and surviving recruits occurs if g12(r) shows positive (or negative)
departures from the random labelling null model.
Test of density dependent mortality. We developed the third test
statistic g1,1+2–g2,1+2 specifically to provide a direct test of density
dependent effects in mortality (see also Yu et al. 2009). This test
statistic compares the density of dead and surviving recruits (i.e.
1 + 2) around dead recruits (i.e. pattern 1) with the density of dead
and surviving recruits (i.e. 1 + 2) around surviving recruits (i.e.
pattern 2). The expected value of this test statistics is zero under
random labelling, but under density dependent mortality dead
recruits would occur preferentially y in areas with high pre-mortality
densities, i.e. g1,1+2 > g2,1+2. Conversely, recruits may show higher
survival probabilities in high-density situations. In this case, we
expect that surviving recruits would have more neighbours (i.e.
g1,1+2 < g2,1+2).
Test for additional pattern in dead recruits. To test for the presence
of an additional pattern in mortality (or survival) we used the
differences g21(r)–g22(r) and g12(r)–g11(r) as test statistics (Getzin et al.
2006). A value of g21(r)–g22(r) � 0 means that dead recruits (i.e.,
pattern 1) surround surviving recruits (i.e., pattern 2) at scale r in the
same way as surviving recruits surround surviving recruits. However,
if there was additional clustering within the dead recruits that is
independent from the pattern of surviving recruits (e.g. caused by
competition from adults or environmental conditions), this would
not be detected by the test statistic g21(r)–g22(r), but we would expect
g12(r)–g11(r) << 0. Thus, g21(r)–g22(r) reveals if surviving and dead
recruits follow the same overall pattern and g12(r)–g11(r) reveals if
there is an additional pattern within dead recruits that is independent
from the location of the surviving recruits (Watson, Roshier &
Wiegand 2007; Getzin et al. 2008).
Analysis 3: Survival of recruits vs. adults
To quantify the impact of adults on the survival of recruits we ask if
the probability of survival of recruits depends on the distance from
adult plants. The appropriate null model for this question is again
random labelling, but the test statistic needs to consider additionally
the impact of adults. The software Programita (Wiegand &Moloney
2004) provides an appropriate test statistics (e.g. Biganzoli, Wiegand
& Batista 2009; Xu et al. 2009), which was also independently
proposed byDe laCruz et al. (2008).We have adults plants (subscript
a), dead recruits (subscript 1) and surviving recruits (subscript 2). The
test statistic which estimates the probability of survival of recruits in
dependence on the distance r from adults (subscript a) is given by
pa;2ðrÞ ¼k2
ðk1 þ k2Þga;2ðrÞga;1þ2ðrÞ
eqn 1
where (k1 + k2) and k2 are the intensities of recruits and of the
surviving recruits, respectively, and ga,1+2(r) and ga,2(r) are the
bivariate pair correlation functions measuring the intensity
normalized neighbourhood density of surviving and dead recruits
(1 + 2) and surviving recruits (2), respectively, around adults (a).
The expectation of this test statistic under random labelling is
the overall probability of survival, i.e. number of surviving
recruits divided by number of recruits. In the case of negative
interactions exerted by adults at distance r (i.e. competition) we
expect a lower probability of survival, i.e. pa,2(r) < k2 ⁄ (k1 + k2),whereas positive interactions would be indicated by a higher
probability of survival in the proximity of heterospecific plants,
i.e. pa,2(r) > k2 ⁄ (k1 + k2).
Results
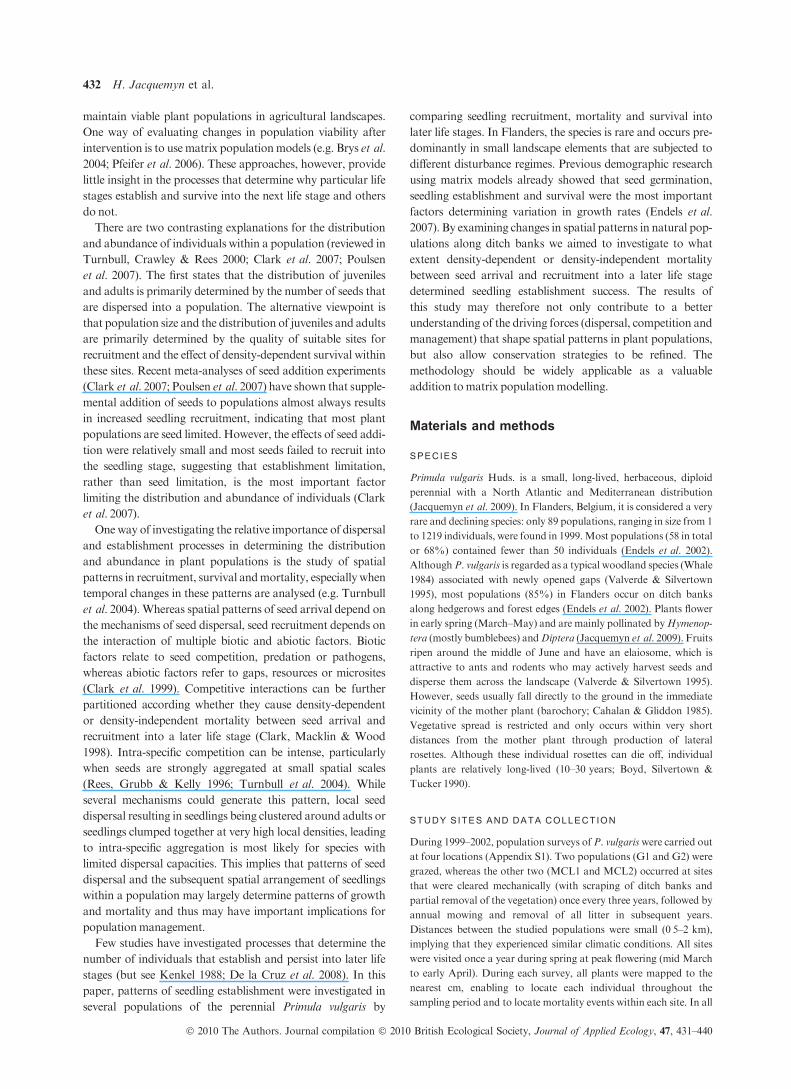
ANALYSIS 0 : UNIVARIATE SPATIAL PATTERNS
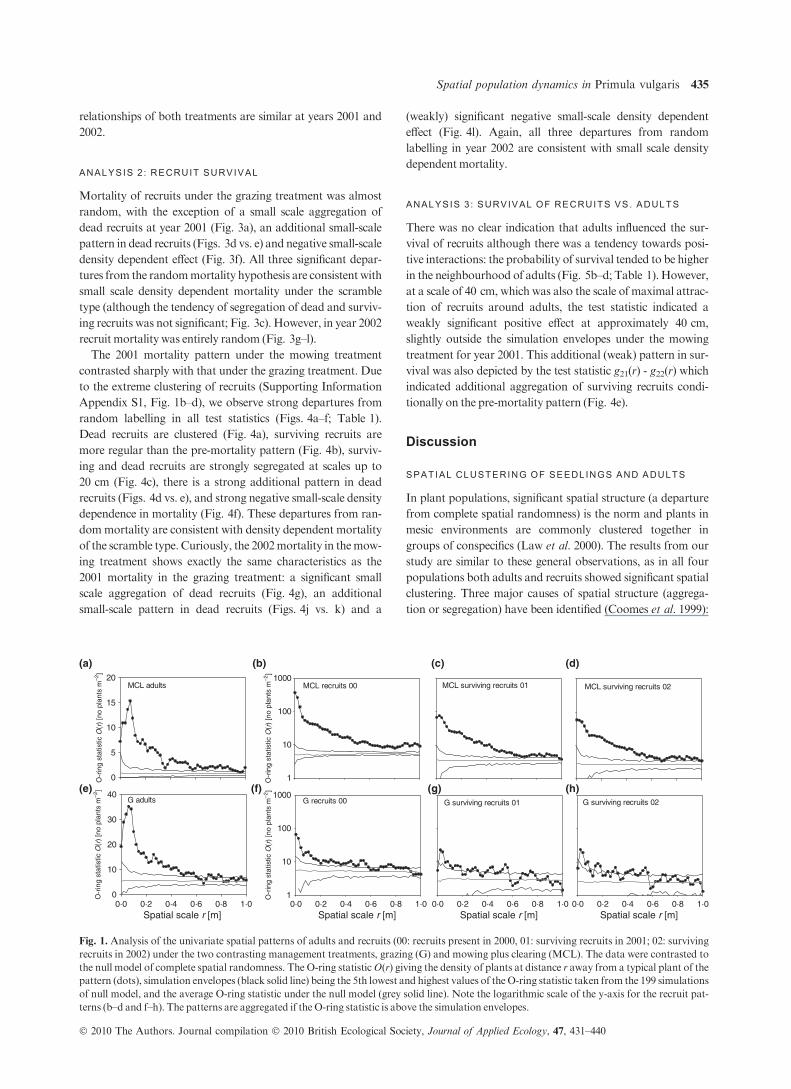
Both recruits and adults were clearly clustered for all
treatments (Fig. 1), which confirms the visual inspection of the
mapped patterns (Appendix S1). The patterns of adults were
relatively similar between the two treatments showing cluster
sizes of roughly 0Æ5 m (the O-ring statistic approached the
simulation envelopes at this scale), but the adult density was
six times higher under the grazing treatment. Recruits showed
extreme aggregation, especially under the mowing treatment,
with similar densities of approximately 5Æ5 recruits m)2.
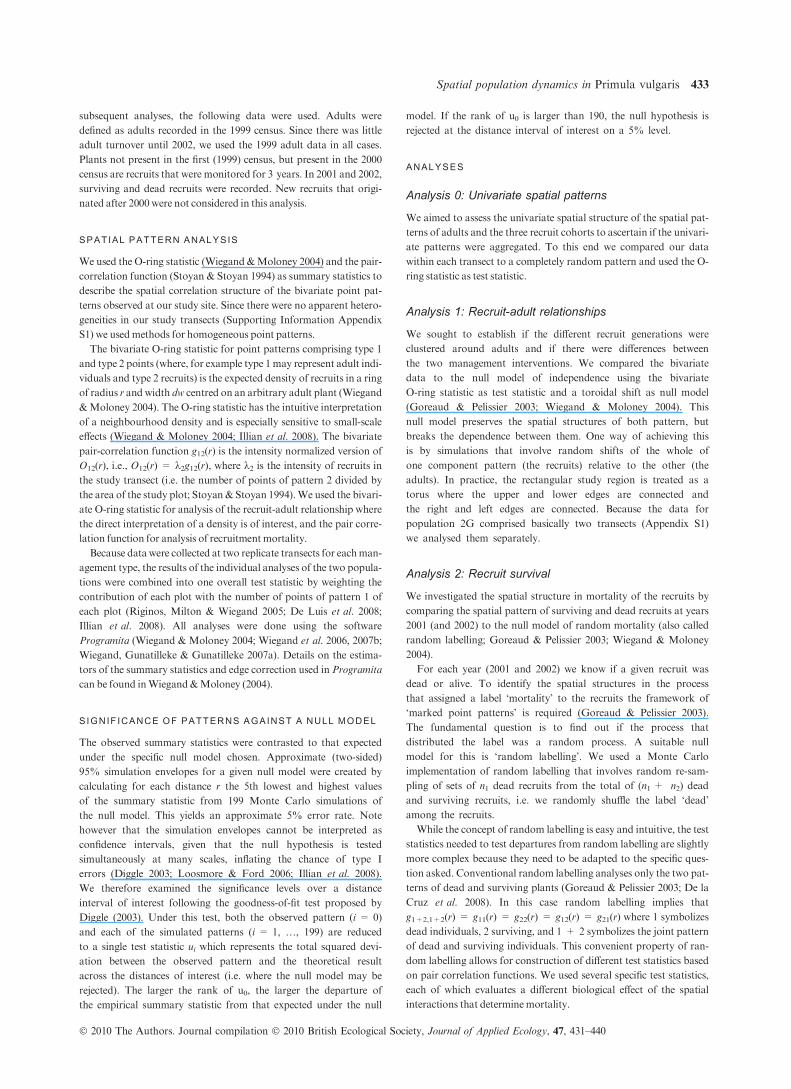
ANALYSIS 1 : RECRUIT -ADULT RELATIONSHIPS
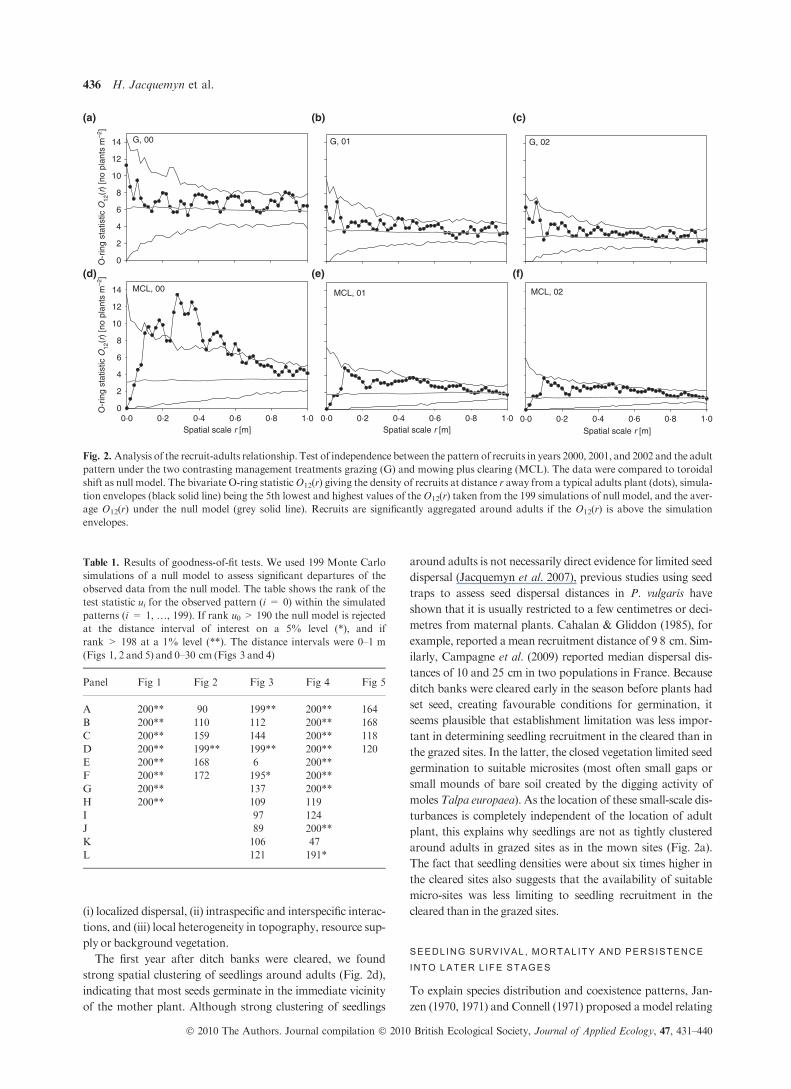
Recruits under the grazing treatment did not show any
aggregation to adults and the adult-recruit relationship did not
change from year 2000 to 2002 (Fig. 2a–c) except that the
recruit neighbourhood density decreased due to the recruit
mortality. However, under the mowing treatment in year 2000
there was a significant, positive association of recruits at
distances of 40 cm away from adults (Fig. 2d; Table 1). The
shape of the O-ring statistics indicates a (non-significant)
tendency of repulsion between recruits and adults at small
scales which changes to significant attraction at intermediate
scales (40 cm) and then disappears at larger scales. Recruit
morality from 2000 to 2001 changed the adult–recruit
relationship under themowing treatment substantially. Besides
a decrease in the neighbourhood density due to mortality, the
attraction at the 40 cm scale disappeared completely, yielding
independent patterns (Fig. 2e,f; Table 1). There was little
change between 2001 and 2002. Interestingly, the spatial
434 H. Jacquemyn et al.
� 2010 The Authors. Journal compilation � 2010 British Ecological Society, Journal of Applied Ecology, 47, 431–440
relationships of both treatments are similar at years 2001 and
2002.
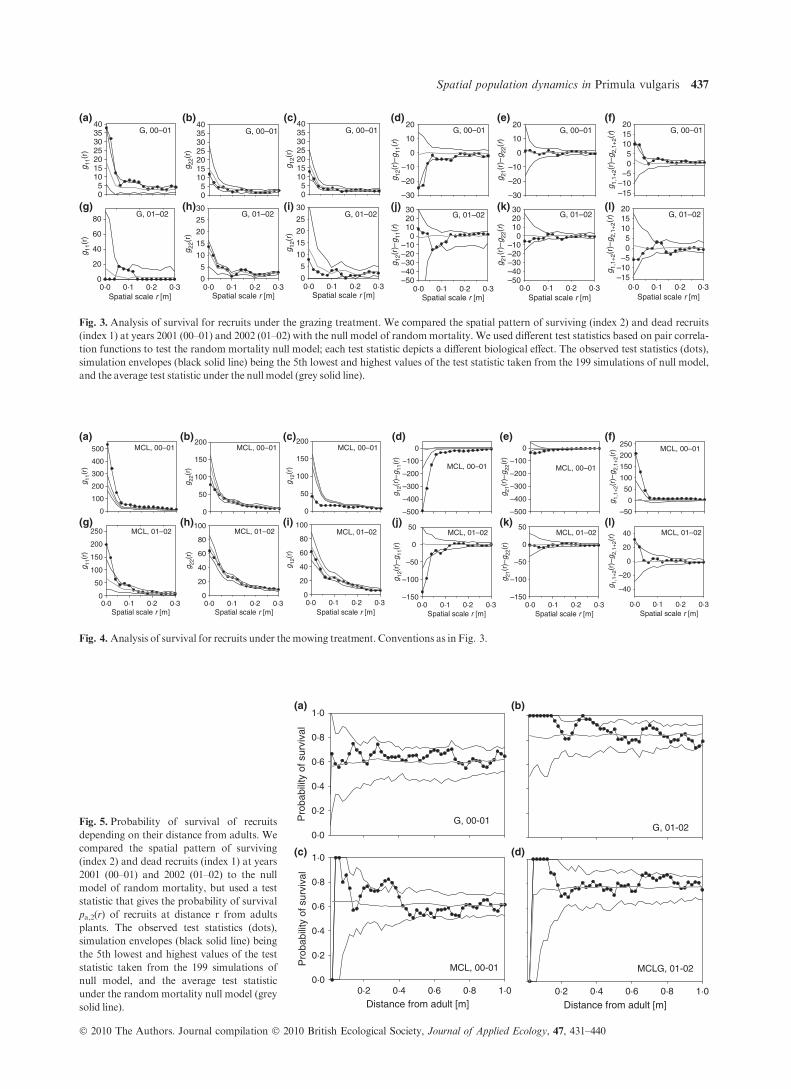
ANALYSIS 2 : RECRUIT SURVIVAL
Mortality of recruits under the grazing treatment was almost
random, with the exception of a small scale aggregation of
dead recruits at year 2001 (Fig. 3a), an additional small-scale
pattern in dead recruits (Figs. 3d vs. e) and negative small-scale
density dependent effect (Fig. 3f). All three significant depar-
tures from the randommortality hypothesis are consistent with
small scale density dependent mortality under the scramble
type (although the tendency of segregation of dead and surviv-
ing recruits was not significant; Fig. 3c). However, in year 2002
recruit mortality was entirely random (Fig. 3g–l).
The 2001 mortality pattern under the mowing treatment
contrasted sharply with that under the grazing treatment. Due
to the extreme clustering of recruits (Supporting Information
Appendix S1, Fig. 1b–d), we observe strong departures from
random labelling in all test statistics (Figs. 4a–f; Table 1).
Dead recruits are clustered (Fig. 4a), surviving recruits are
more regular than the pre-mortality pattern (Fig. 4b), surviv-
ing and dead recruits are strongly segregated at scales up to
20 cm (Fig. 4c), there is a strong additional pattern in dead
recruits (Figs. 4d vs. e), and strong negative small-scale density
dependence in mortality (Fig. 4f). These departures from ran-
dommortality are consistent with density dependent mortality
of the scramble type. Curiously, the 2002mortality in themow-
ing treatment shows exactly the same characteristics as the
2001 mortality in the grazing treatment: a significant small
scale aggregation of dead recruits (Fig. 4g), an additional
small-scale pattern in dead recruits (Figs. 4j vs. k) and a
(weakly) significant negative small-scale density dependent
effect (Fig. 4l). Again, all three departures from random
labelling in year 2002 are consistent with small scale density
dependentmortality.
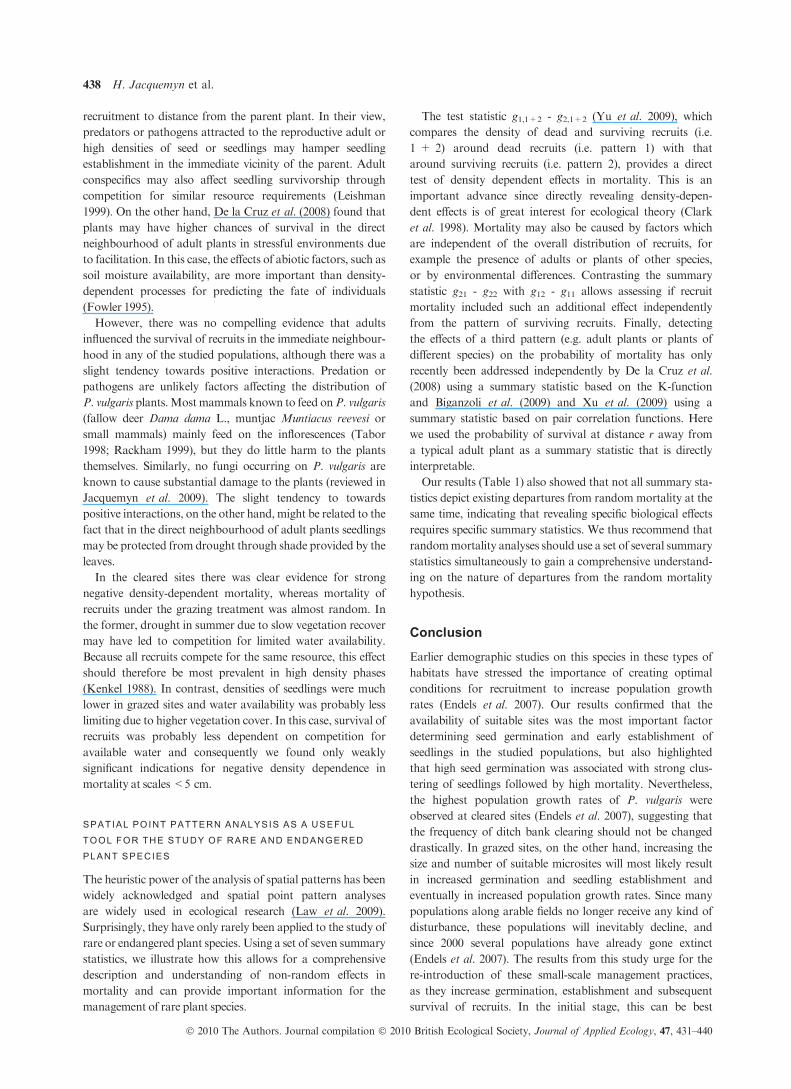
ANALYSIS 3 : SURVIVAL OF RECRUITS VS. ADULTS
There was no clear indication that adults influenced the sur-
vival of recruits although there was a tendency towards posi-
tive interactions: the probability of survival tended to be higher
in the neighbourhood of adults (Fig. 5b–d; Table 1). However,
at a scale of 40 cm, which was also the scale of maximal attrac-
tion of recruits around adults, the test statistic indicated a
weakly significant positive effect at approximately 40 cm,
slightly outside the simulation envelopes under the mowing
treatment for year 2001. This additional (weak) pattern in sur-
vival was also depicted by the test statistic g21(r) - g22(r) which
indicated additional aggregation of surviving recruits condi-
tionally on the pre-mortality pattern (Fig. 4e).
Discussion
SPATIAL CLUSTERING OF SEEDLINGS AND ADULTS
In plant populations, significant spatial structure (a departure
from complete spatial randomness) is the norm and plants in
mesic environments are commonly clustered together in
groups of conspecifics (Law et al. 2000). The results from our
study are similar to these general observations, as in all four
populations both adults and recruits showed significant spatial
clustering. Three major causes of spatial structure (aggrega-
tion or segregation) have been identified (Coomes et al. 1999):
MCL adults
0
5
10
15
20MCL recruits 00
1
10
100
1000
G adults
Spatial scale r [m] Spatial scale r [m] Spatial scale r [m] Spatial scale r [m] 0·0 0·2 0·4 0·6 0·8 1·0 0·0 0·2 0·4 0·6 0·8 1·0 0·0 0·2 0·4 0·6 0·8 1·0 0·0 0·2 0·4 0·6 0·8 1·0
O-r
ing
stat
istic
O(r
) [n
o pl
ants
m–2
]O
-rin
g st
atis
tic O
(r)
[no
plan
ts m
–2]
O-r
ing
stat
istic
O(r
) [n
o pl
ants
m–2
]O
-rin
g st
atis
tic O
(r)
[no
plan
ts m
–2]
0
10
20
30
40G recruits 00
1
10
100
1000
MCL surviving recruits 01
G surviving recruits 01
MCL surviving recruits 02
G surviving recruits 02
(a) (b) (c) (d)
(e) (f) (g) (h)
Fig. 1. Analysis of the univariate spatial patterns of adults and recruits (00: recruits present in 2000, 01: surviving recruits in 2001; 02: surviving
recruits in 2002) under the two contrasting management treatments, grazing (G) and mowing plus clearing (MCL). The data were contrasted to
the null model of complete spatial randomness. The O-ring statisticO(r) giving the density of plants at distance r away from a typical plant of the
pattern (dots), simulation envelopes (black solid line) being the 5th lowest and highest values of theO-ring statistic taken from the 199 simulations
of null model, and the average O-ring statistic under the null model (grey solid line). Note the logarithmic scale of the y-axis for the recruit pat-
terns (b–d and f–h). The patterns are aggregated if the O-ring statistic is above the simulation envelopes.
Spatial population dynamics in Primula vulgaris 435
� 2010 The Authors. Journal compilation � 2010 British Ecological Society, Journal of Applied Ecology, 47, 431–440
(i) localized dispersal, (ii) intraspecific and interspecific interac-
tions, and (iii) local heterogeneity in topography, resource sup-
ply or background vegetation.
The first year after ditch banks were cleared, we found
strong spatial clustering of seedlings around adults (Fig. 2d),
indicating that most seeds germinate in the immediate vicinity
of the mother plant. Although strong clustering of seedlings
around adults is not necessarily direct evidence for limited seed
dispersal (Jacquemyn et al. 2007), previous studies using seed
traps to assess seed dispersal distances in P. vulgaris have
shown that it is usually restricted to a few centimetres or deci-
metres from maternal plants. Cahalan & Gliddon (1985), for
example, reported amean recruitment distance of 9Æ8 cm. Sim-
ilarly, Campagne et al. (2009) reported median dispersal dis-
tances of 10 and 25 cm in two populations in France. Because
ditch banks were cleared early in the season before plants had
set seed, creating favourable conditions for germination, it
seems plausible that establishment limitation was less impor-
tant in determining seedling recruitment in the cleared than in
the grazed sites. In the latter, the closed vegetation limited seed
germination to suitable microsites (most often small gaps or
small mounds of bare soil created by the digging activity of
molesTalpa europaea). As the location of these small-scale dis-
turbances is completely independent of the location of adult
plant, this explains why seedlings are not as tightly clustered
around adults in grazed sites as in the mown sites (Fig. 2a).
The fact that seedling densities were about six times higher in
the cleared sites also suggests that the availability of suitable
micro-sites was less limiting to seedling recruitment in the
cleared than in the grazed sites.
SEEDLING SURVIVAL , MORTALITY AND PERSISTENCE
INTO LATER LIFE STAGES
To explain species distribution and coexistence patterns, Jan-
zen (1970, 1971) and Connell (1971) proposed a model relating
G, 00
0
2
4
6
8
10
12
14 G, 01 G, 02
MCL, 00
Spatial scale r [m] Spatial scale r [m] Spatial scale r [m]
0·0 0·2 0·4 0·6 0·8 1·0 0·0 0·2 0·4 0·6 0·8 1·0 0·0 0·2 0·4 0·6 0·8 1·0
O-r
ing
stat
istic
O12
(r)
[no
plan
ts m
–2]
O-r
ing
stat
istic
O12
(r)
[no
plan
ts m
–2]
0
2
4
6
8
10
12
14 MCL, 01 MCL, 02
(a) (b) (c)
(d) (e) (f)
Fig. 2. Analysis of the recruit-adults relationship. Test of independence between the pattern of recruits in years 2000, 2001, and 2002 and the adult
pattern under the two contrasting management treatments grazing (G) and mowing plus clearing (MCL). The data were compared to toroidal
shift as null model. The bivariate O-ring statisticO12(r) giving the density of recruits at distance r away from a typical adults plant (dots), simula-
tion envelopes (black solid line) being the 5th lowest and highest values of theO12(r) taken from the 199 simulations of null model, and the aver-
age O12(r) under the null model (grey solid line). Recruits are significantly aggregated around adults if the O12(r) is above the simulation
envelopes.
Table 1. Results of goodness-of-fit tests. We used 199 Monte Carlo
simulations of a null model to assess significant departures of the
observed data from the null model. The table shows the rank of the
test statistic ui for the observed pattern (i = 0) within the simulated
patterns (i = 1, …, 199). If rank u0 > 190 the null model is rejected
at the distance interval of interest on a 5% level (*), and if
rank > 198 at a 1% level (**). The distance intervals were 0–1 m
(Figs 1, 2 and 5) and 0–30 cm (Figs 3 and 4)
Panel Fig 1 Fig 2 Fig 3 Fig 4 Fig 5
A 200** 90 199** 200** 164
B 200** 110 112 200** 168
C 200** 159 144 200** 118
D 200** 199** 199** 200** 120
E 200** 168 6 200**
F 200** 172 195* 200**
G 200** 137 200**
H 200** 109 119
I 97 124
J 89 200**
K 106 47
L 121 191*
436 H. Jacquemyn et al.
� 2010 The Authors. Journal compilation � 2010 British Ecological Society, Journal of Applied Ecology, 47, 431–440
MCL, 00–01
–500
–400
–300
–200
–100
0
MCL, 00–01
–500
–400
–300
–200
–100
0MCL, 00–01
0
50
100
150
200
MCL, 01–02
–150
–100
–50
0
50MCL, 01–02
–150
–100
–50
0
50
MCL, 00–01
–50
0
50
100
150
200
250
MCL, 01–02
Spatial scale r [m]Spatial scale r [m]Spatial scale r [m]Spatial scale r [m]Spatial scale r [m]Spatial scale r [m]
–40
–20
0
20
40MCL, 01–02
0
20
40
60
80
100
MCL, 00–01
0
100
200
300
400
500
MCL, 01–02
0·0 0·1 0·2 0·3 0·0 0·1 0·2 0·3 0·0 0·1 0·2 0·3 0·0 0·1 0·2 0·3 0·0 0·1 0·2 0·3 0·0 0·1 0·2 0·3
g 11(r
)
g 22(r
)g 22
(r)
g 12(r
)g 12
(r)
g 12(r
)–g 11
(r)
g 12(r
)–g 11
(r)
g 21(r
)–g 22
(r)
g 21(r
)–g 22
(r)
g 1,1+
2(r)
–g2,
1+2(
r)g 1,
1+2(
r)–g
2,1+
2(r)
g 11(r
)
0
50
100
150
200
250
MCL, 00–01
0
50
100
150
200
MCL, 01–02
0
20
40
60
80
100
(a) (b) (c) (d) (e) (f)
(g) (h) (i) (j) (k) (l)
Fig. 4. Analysis of survival for recruits under the mowing treatment. Conventions as in Fig. 3.
G, 00–01
g 12(r
)–g 11
(r)
g 12(r
)–g 11
(r)
g 21(r
)–g 22
(r)
g 21(r
)–g 22
(r)
g 1,1+
2(r)
–g2,
1+2(
r)g 1,
1+2(
r)–g
2,1+
2(r)
–30
–20
–10
0
10
20G, 00–01
–30
–20
–10
0
10
20G, 00–01
g 22(r
)g 22
(r)
g 12(r
)g 12
(r)
05
10152025303540
G, 01–02
–50–40–30–20–10
0102030
G, 01–02
–50–40–30–20–10
0102030
G, 00–01
–15–10–5
05
101520
G, 01–02
Spatial scale r [m]Spatial scale r [m]Spatial scale r [m]Spatial scale r [m]Spatial scale r [m]Spatial scale r [m]
–15–10–505
101520
G, 01–02
0·0 0·1 0·2 0·3 0·0 0·1 0·2 0·3 0·0 0·1 0·2 0·3 0·0 0·1 0·2 0·3 0·0 0·1 0·2 0·30·0 0·1 0·2 0·30
5
10
15
20
25
30
G, 00–01
g 11(r
)g 11
(r)
05
10152025303540
G, 01–02
0
20
40
60
80
G, 00–01
05
10152025303540
G, 01–02
0
5
10
15
20
25
30
(a) (b) (c) (d) (e) (f)
(g) (h) (i) (j) (k) (l)
Fig. 3. Analysis of survival for recruits under the grazing treatment. We compared the spatial pattern of surviving (index 2) and dead recruits
(index 1) at years 2001 (00–01) and 2002 (01–02) with the null model of randommortality. We used different test statistics based on pair correla-
tion functions to test the random mortality null model; each test statistic depicts a different biological effect. The observed test statistics (dots),
simulation envelopes (black solid line) being the 5th lowest and highest values of the test statistic taken from the 199 simulations of null model,
and the average test statistic under the null model (grey solid line).
G, 00-01Pro
babi
lity
of s
urvi
val
0·0
0·2
0·4
0·6
0·8
1·0
G, 01-02
MCL, 00-01
Distance from adult [m]0·2 0·4 0·6 0·8 1·0 0·2 0·4 0·6 0·8 1·0
Pro
babi
lity
of s
urvi
val
0·0
0·2
0·4
0·6
0·8
1·0
MCLG, 01-02
Distance from adult [m]
(a) (b)
(c) (d)
Fig. 5. Probability of survival of recruits
depending on their distance from adults. We
compared the spatial pattern of surviving
(index 2) and dead recruits (index 1) at years
2001 (00–01) and 2002 (01–02) to the null
model of random mortality, but used a test
statistic that gives the probability of survival
pa,2(r) of recruits at distance r from adults
plants. The observed test statistics (dots),
simulation envelopes (black solid line) being
the 5th lowest and highest values of the test
statistic taken from the 199 simulations of
null model, and the average test statistic
under the randommortality null model (grey
solid line).
Spatial population dynamics in Primula vulgaris 437
� 2010 The Authors. Journal compilation � 2010 British Ecological Society, Journal of Applied Ecology, 47, 431–440
recruitment to distance from the parent plant. In their view,
predators or pathogens attracted to the reproductive adult or
high densities of seed or seedlings may hamper seedling
establishment in the immediate vicinity of the parent. Adult
conspecifics may also affect seedling survivorship through
competition for similar resource requirements (Leishman
1999). On the other hand, De la Cruz et al. (2008) found that
plants may have higher chances of survival in the direct
neighbourhood of adult plants in stressful environments due
to facilitation. In this case, the effects of abiotic factors, such as
soil moisture availability, are more important than density-
dependent processes for predicting the fate of individuals
(Fowler 1995).
However, there was no compelling evidence that adults
influenced the survival of recruits in the immediate neighbour-
hood in any of the studied populations, although there was a
slight tendency towards positive interactions. Predation or
pathogens are unlikely factors affecting the distribution of
P. vulgaris plants.Most mammals known to feed onP. vulgaris
(fallow deer Dama dama L., muntjac Muntiacus reevesi or
small mammals) mainly feed on the inflorescences (Tabor
1998; Rackham 1999), but they do little harm to the plants
themselves. Similarly, no fungi occurring on P. vulgaris are
known to cause substantial damage to the plants (reviewed in
Jacquemyn et al. 2009). The slight tendency to towards
positive interactions, on the other hand, might be related to the
fact that in the direct neighbourhood of adult plants seedlings
may be protected from drought through shade provided by the
leaves.
In the cleared sites there was clear evidence for strong
negative density-dependent mortality, whereas mortality of
recruits under the grazing treatment was almost random. In
the former, drought in summer due to slow vegetation recover
may have led to competition for limited water availability.
Because all recruits compete for the same resource, this effect
should therefore be most prevalent in high density phases
(Kenkel 1988). In contrast, densities of seedlings were much
lower in grazed sites and water availability was probably less
limiting due to higher vegetation cover. In this case, survival of
recruits was probably less dependent on competition for
available water and consequently we found only weakly
significant indications for negative density dependence in
mortality at scales<5 cm.
SPATIAL POINT PATTERN ANALYSIS AS A USEFUL
TOOL FOR THE STUDY OF RARE AND ENDANGERED
PLANT SPECIES
The heuristic power of the analysis of spatial patterns has been
widely acknowledged and spatial point pattern analyses
are widely used in ecological research (Law et al. 2009).
Surprisingly, they have only rarely been applied to the study of
rare or endangered plant species. Using a set of seven summary
statistics, we illustrate how this allows for a comprehensive
description and understanding of non-random effects in
mortality and can provide important information for the
management of rare plant species.
The test statistic g1,1+2 - g2,1+2 (Yu et al. 2009), which
compares the density of dead and surviving recruits (i.e.
1 + 2) around dead recruits (i.e. pattern 1) with that
around surviving recruits (i.e. pattern 2), provides a direct
test of density dependent effects in mortality. This is an
important advance since directly revealing density-depen-
dent effects is of great interest for ecological theory (Clark
et al. 1998). Mortality may also be caused by factors which
are independent of the overall distribution of recruits, for
example the presence of adults or plants of other species,
or by environmental differences. Contrasting the summary
statistic g21 - g22 with g12 - g11 allows assessing if recruit
mortality included such an additional effect independently
from the pattern of surviving recruits. Finally, detecting
the effects of a third pattern (e.g. adult plants or plants of
different species) on the probability of mortality has only
recently been addressed independently by De la Cruz et al.
(2008) using a summary statistic based on the K-function
and Biganzoli et al. (2009) and Xu et al. (2009) using a
summary statistic based on pair correlation functions. Here
we used the probability of survival at distance r away from
a typical adult plant as a summary statistic that is directly
interpretable.
Our results (Table 1) also showed that not all summary sta-
tistics depict existing departures from random mortality at the
same time, indicating that revealing specific biological effects
requires specific summary statistics. We thus recommend that
randommortality analyses should use a set of several summary
statistics simultaneously to gain a comprehensive understand-
ing on the nature of departures from the random mortality
hypothesis.
Conclusion
Earlier demographic studies on this species in these types of
habitats have stressed the importance of creating optimal
conditions for recruitment to increase population growth
rates (Endels et al. 2007). Our results confirmed that the
availability of suitable sites was the most important factor
determining seed germination and early establishment of
seedlings in the studied populations, but also highlighted
that high seed germination was associated with strong clus-
tering of seedlings followed by high mortality. Nevertheless,
the highest population growth rates of P. vulgaris were
observed at cleared sites (Endels et al. 2007), suggesting that
the frequency of ditch bank clearing should not be changed
drastically. In grazed sites, on the other hand, increasing the
size and number of suitable microsites will most likely result
in increased germination and seedling establishment and
eventually in increased population growth rates. Since many
populations along arable fields no longer receive any kind of
disturbance, these populations will inevitably decline, and
since 2000 several populations have already gone extinct
(Endels et al. 2007). The results from this study urge for the
re-introduction of these small-scale management practices,
as they increase germination, establishment and subsequent
survival of recruits. In the initial stage, this can be best
438 H. Jacquemyn et al.
� 2010 The Authors. Journal compilation � 2010 British Ecological Society, Journal of Applied Ecology, 47, 431–440
achieved by scraping of ditch banks, followed by annual
mowing (with removal of all litter) or grazing, provided that
a sufficient number of microsites are being constantly
created.
Acknowledgements
Wewould like to thank Rein Brys and Eric Van Beek for help during fieldwork
and two anonymous reviewers for constructive comments on an earlier version
of this paper.
References
Biganzoli, F., Wiegand, T. & Batista, W.B. (2009) Fire-mediated interactions
between shrubs in a South American temperate savannah.Oikos, 118, 1383–
1395.
Blomqvist, M.M., Vos, P., Klinkhamer, P.G.L. & ter Keurs, W.J. (2003)
Declining plant species richness of grassland ditch banks – a problemof colo-
nization or extinction?Biological Conservation, 109, 391–406.
Boyd,M., Silvertown, J. & Tucker, C. (1990) Population ecology of heterostyle
and homostyle Primula vulgaris: growth, survival and reproduction in field
populations. Journal of Ecology, 78, 799–713.
Brys, R., Jacquemyn, H., Endels, P., De Blust, G. & Hermy, M. (2004)
The effects of grassland management on plant performance and
demography in the perennial herb Primula veris. Journal of Applied
Ecology, 41, 1080–1091.
Cahalan, C.M. & Gliddon, C. (1985) Genetic neighbourhood sizes in Primula
vulgaris.Heredity, 54, 65–70.
Campagne, P., Affre, L., Baumel, A., Roche, P. & Tatoni, T. (2009) Fine-scale
response to landscape structure in Primula vulgaris Huds.: does hedgerow
network connectedness ensure connectivity through gene flow. Population
Ecology, 51, 209–219.
Clark, J.S., Macklin, E. &Wood, L. (1998) Stages and spatial scales of recruit-
ment limitation in southern Apalachian forests. Ecological Monographs, 68,
213–235.
Clark, J.S., Beckage, B., Camill, P., Cleveland, B., HillRisLambers, J., Lighter,
J., McLachlan, J., Mohan, J. & Wyckoff, P. (1999) Interpreting recruitment
limitation in forests.American Journal of Botany, 86, 1–16.
Clark, C.J., Poulsen, J.R., Levey, D.J. &Osenberg, C.W. (2007) Are plant pop-
ulations seed limited? A critique and meta-analysis of seed addition experi-
mentsAmericanNaturalist, 170, 128–142.
Connell, J.H. (1971) On the role of natural enemies in preventing competitive
exclusion in some marine animals and in rain forest trees. Dynamics of
Populations (eds P.J.D. Boer & G.R. Gradwell), pp. 290–310. Pudoc,
Wageningen.
Coomes, D.A., Rees, M. & Turnbull, L. (1999) Identifying aggregation and
association in fullymapped spatial data.Ecology, 80, 554–565.
De la Cruz, M., Romao, R.L., Escudero, A. & Maestre, F.T. (2008) Where do
seedlings go? A spatio-temporal analysis of seedling mortality in a semi-arid
gypsophyteEcography, 31, 1–11.
De Luis, M., Raventos, J., Wiegand, T. & Gonzalez-Hidalgo, J.C. (2008) Tem-
poral and spatial differentiation in seedling emergence may promote species
coexistence in Mediterranean fire-prone ecosystems. Ecography, 31, 620–
629.
Diggle, P.J. (2003) Statistical Analysis of Point Patterns, 2nd edn. Arnold, Lon-
don.
Endels, P., Jacquemyn, H., Brys, R., Hermy,M. &De Blust, G. (2002) Tempo-
ral changes in the population structure of primrose (Primula vulgarisHuds.)
in an agricultural landscape and implications for conservation. Biological
Conservation, 105, 11–25.
Endels, P., Jacquemyn, H., Brys, R. & Hermy, M. (2007) Genetic erosion
explains deviation from demographic response to habitat and year variation
in relic populations of the perennial Primula vulgaris. Journal of Ecology, 95,
960–972.
Fowler, N.L. (1995) Destiny-dependent demography in two grasses: a five-year
study.Ecology, 76, 2145–2164.
Getzin, S., Dean, C., He, F., Trofymow, J.A., Wiegand, K. & Wiegand, T.
(2006) Spatial patterns and competition of tree species in a Douglas-fir chro-
nosequence on Vancouver Island.Ecography, 29, 671–682.
Getzin, S., Wiegand, T., Wiegand, K. & He, F. (2008) Heterogeneity influences
spatial patterns and demographics in forest stands. Journal of Ecology, 96,
807–820.
Goreaud, F. & Pelissier, R. (2003) Avoiding misinterpretation of biotic
interactions with the intertype K12-function: population independence
vs. random labelling hypotheses. Journal of Vegetation Science, 14,
681–692.
Illian, J., Penttinen, A., Stoyan, H. & Stoyan, D. (2008) Statistical Analysis and
Modelling of Spatial Point Patterns. JohnWiley & Sons, Chichester.
Jacquemyn, H., Brys, R., Vandepitte, K., Honnay, O., Roldan-Ruiz, I. &
Wiegand, T. (2007) A spatially explicit analysis of seedling recruitment
in the terrestrial orchid Orchis purpurea. New Phytologist, 176, 448–
459.
Jacquemyn, H., Endels, P., Brys, R., Hermy, M. &Woodell, S.R.J. (2009) Bio-
logical flora of the British Isles: Primula vulgarisHuds. (P. acaulis (L.) Hill).
Journal of Ecology, 97, 812–833.
Janzen, D.H. (1970) Herbivores and the number of tree species in tropical for-
ests.AmericanNaturalist, 104, 501–528.
Janzen, D.H. (1971) Seed predation by animals. Annual Review of Ecology and
Systematics, 2, 465–492.
Kenkel, N.C. (1988) Pattern of self-thinning in jack pine: testing the random
mortality hypothesis.Ecology, 69, 1017–1024.
Kleijn, D. & Verbeek, M. (2000) Factors affecting the species composi-
tion of arable field boundary vegetation. Journal of Applied Ecology,
37, 256–266.
Law, R., Purves, D.W., Murrell, D.J. & Dieckmann, U. (2000) Causes and
effects of small-scale spatial structure in plant populations. Integrating Ecol-
ogy and Evolution in a Spatial Context (eds J. Silvertown & J. Antonovics),
pp. 21–44. Blackwell Science, London.
Law, R., Illian, J., Burslem, D.F.R.P., Gratzer, G., Gunatilleke, C.V.S.
& Gunatilleke, I.A.U.N. (2009) Ecological information from spatial
patterns of plants: insights from point process theory. Journal of Ecol-
ogy, 97, 616–628.
Leishman, M.R. (1999) How well do plant traits correlate with establishment
ability? Evidence from a study of 16 calcareous grassland species. New
Phylologist, 141, 487–496.
Loosmore, N.B. & Ford, E.D. (2006) Statistical inference using the G or K
point pattern spatial statistics.Ecology, 87, 1925–1931.
Pfeifer, M., Wiegand, K., Heinrich, W. & Jetschke, G. (2006) Long-term
demographic fluctuations in an orchid species driven by weather:
implications for conservation planning. Journal of Applied Ecology, 43,
313–324.
Poulsen, J.R., Osenberg, C.W., Clark, C.J., Levey, D.J. & Bolker, B.M. (2007)
Plants as reef fish: fitting the functional form of seedling recruitment. Ameri-
can Naturalist, 170, 167–183.
Rackham, O. (1999) The woods 30 years on: where have the Primroses gone?
Nature in Cambridgeshire, 41, 73–87.
Rees, M., Grubb, P.J. & Kelly, D. (1996) Quantifying the impact of competi-
tion and spatial heterogeneity on the structure and dynamics of a four-spe-
cies guild of winter annuals.AmericanNaturalist, 147, 1–32.
Riginos, C., Milton, S.J. & Wiegand., T. (2005) Context-dependent negative
and positive interactions between adult shrubs and seedlings in a semi-arid
shrubland. Journal of Vegetation Science, 16, 331–340.
Robinson, R.A. & Sutherland, W.J. (2002) Post-war changes in arable
farming and biodiversity in Great Britain. Journal of Applied Ecology,
39, 157–176.
Stoate, C., Boatman, N.D., Borralho, R.J., Rio Carvalho, C., de Snoo, G.R. &
Eden, P. (2001) Ecological impacts of arable intensification in Europe. Jour-
nal of EnvironmentalManagement, 63, 337–365.
Stoyan, D. & Stoyan, H. (1994) Fractals, Random Shapes and Point Fields.
Methods of Geometrical Statistics. Wiley, Chichester.
Tabor, R.C.C. (1998) The oxlip in Britain is its future in doubt?BritishWildlife,
10, 92–101.
Turnbull, L.A., Crawley, M.J. & Rees, M. (2000) Are plant populations seed-
limited?A review of seed sowing experimentsOikos, 88, 225–238.
Turnbull, L.A., Coomes, D., Hector, A. & Rees, M. (2004) Seed mass
and the competition ⁄ colonization trade-off: competitive interactions and
spatial patterns in a guild of annual plants. Journal of Ecology, 92,
97–109.
Valverde, T. & Silvertown, J. (1995) Spatial variation in the seed ecology of a
woodland herb (Primula vulgaris) in relation to light environment. Func-
tional Ecology, 9, 942–950.
Watson, D.M., Roshier, D.A. &Wiegand, T. (2007) Spatial ecology of a para-
sitic shrub: patterns and predictions.Austral Ecology, 32, 359–369.
Whale, D.M. (1984) Habitat requirements in Primula species.New Phytologist,
97, 665–679.
Wiegand, T. & Moloney, K.A. (2004) Rings, circles, and null-models for point
pattern analysis in ecology.Oikos, 104, 209–229.
Spatial population dynamics in Primula vulgaris 439
� 2010 The Authors. Journal compilation � 2010 British Ecological Society, Journal of Applied Ecology, 47, 431–440

Wiegand, T., Kissling, W.D., Cipriotti, P.A. & Aguiar, M.R. (2006) Extending
point pattern analysis to objects of finite size and irregular shape. Journal of
Ecology, 94, 825–837.
Wiegand, T., Gunatilleke, C.V.S. & Gunatilleke, I.A.U.N. (2007a) Species
associations in a heterogeneous Sri Lankan dipterocarp forest. American
Naturalist, 170, E77–E95.
Wiegand, T., Gunatilleke, C.V.S., Gunatilleke, I.A.U.N. & Okuda, T. (2007b)
Analyzing the spatial structure of a Sri Lankan tree species with multiple
scales of clustering.Ecology, 88, 3088–3102.
Xu, X., Harwood, T.D., Pautasso, M. & Jeger, M.J. (2009) Spatio-temporal
analysis of an invasive plant pathogen (Phytophthora ramorum) in England
andWales.Ecography, 32, 504–516.
Yu, H., Wiegand, T., Yang, X.H. & Ci, I.J. (2009) The impact of fire and
density-dependent mortality on the spatial patterns of a pine forest in the
Hulun Buir Sandland, Inner Mongolia, China. Forest Ecology and Manage-
ment, 257, 2098–2107.
Received 16 June 2009; accepted 12 January 2010
Handling Editor: Paul Lukacs
Supporting Information
Additional supporting information may be found in the online ver-
sion of this article.
Appendix S1. Location of adults (red dots) and recruits (black dots)
in four populations of Primula vulgaris located along ditch bank
habitats.
As a service to our authors and readers, this journal provides support-
ing information supplied by the authors. Such materials may be re-
organized for online delivery, but are not copy-edited or typeset.
Technical support issues arising from supporting information (other
thanmissing files) should be addressed to the authors.
440 H. Jacquemyn et al.
� 2010 The Authors. Journal compilation � 2010 British Ecological Society, Journal of Applied Ecology, 47, 431–440
Related Documents


![Pemphigus Vulgaris [Print] - eMedicine Dermatology Vulgaris .pdf · emedicine.medscape.com eMedicine Specialties > Dermatology > Bullous Diseases Pemphigus Vulgaris Bassam Zeina,](https://static.cupdf.com/doc/110x72/5c984ab609d3f21c3a8b874e/pemphigus-vulgaris-print-emedicine-vulgaris-pdf-emedicinemedscapecom.jpg)


