Evaluating Form Designs For Optical Character Recognition NISTIR 5364 Michael D. Garris and Darrin L. Dimmick National Institute of Standards and Technology, Gaithersburg, Maryland 20899

Welcome message from author
This document is posted to help you gain knowledge. Please leave a comment to let me know what you think about it! Share it to your friends and learn new things together.
Transcript

Evaluating Form Designs For Optical Character Recognition
NISTIR 5364
Michael D. Garris and Darrin L. Dimmick
National Institute of Standards and Technology,
Gaithersburg, Maryland 20899


i
TABLE OF CONTENTS
ABSTRACT 1
1. INTRODUCTION 1
2. 1040T FORMS AND PERFORMANCE ASSESSMENT 4
2.1 1040T Forms 4
2.2 1040T Database 4
2.3 Scoring 1040T Forms 6
3. RECOGNITION SYSTEM CONFIGURATIONS 7
4. RECOGNITION SYSTEM CONFIGURATION RESULTS 9
4.1 System Configuration Observations 11
4.2 Field-Based Study 12
4.2.1 Human Factors 13
4.2.2 Field-Based Performances 14
5. ANALYSIS OF SEGMENTATION ERRORS 15
6. CONCLUSIONS 17
7. REFERENCES 19
APPENDIX A. 1040T FORMS A1
P1 1040T Form A3
P2 1040T Form A5
P3 1040T Form A7
APPENDIX B. BILLY AND TINA REFERENCE SETS B1
Field-Labeled 1040T Form B3
Billy Field Value Set B5
Tina Field Value Set B7
APPENDIX C. NIST SCORING PACKAGE C1
C.1. Form-Based Scoring C2
C.2. Effects of Rejection C5

ii
APPENDIX D. MODEL RECOGNITION SYSTEM COMPONENTS D1
D.1. Form Registration D1
D.2. Form Removal D2
D.3. Field Isolation D8
D.4. Character Field Segmentation D8
D.4.1 Connected Component Labeling D8
D.4.2 Form-Based Inter-Character Cuts D9
D.5. Character Image Spatial Normalization D11
D.5.1 First and Second Generation Normalizations D11
D.5.2 Third Generation Normalization D12
D.6. Character Image Feature Extraction D14
D.7. Character Classification D14
D.7.1 Multi-Layer Perceptron D14
D.7.2 Probabilistic Neural Network D15
D.8. Icon Field Detection D16
D.8.1 Circle Fields D16
D.8.2 Signature Fields D17
APPENDIX E. SYSTEM CONFIGURATION RESULTS E1
Legend for Graphs E1
System Configuration A - Alpha Fields E2
System Configuration A - Float Fields E3
System Configuration A - Integer Fields E4
System Configuration B - Alpha Fields E5
System Configuration B - Float Fields E6
System Configuration B - Integer Fields E7
System Configuration C - Alpha Fields E8
System Configuration C - Float Fields E9
System Configuration C - Integer Fields E10
System Configuration D - Alpha Fields E11
System Configuration D - Float Fields E12
System Configuration D - Integer Fields E13
iii
System Configuration E - Alpha Fields E14
System Configuration E - Float Fields E15
System Configuration E - Integer Fields E16
System Configuration F - Alpha Fields E17
System Configuration F - Float Fields E18
System Configuration F - Integer Fields E19
System Mark Detection E20
APPENDIX F. FIELD-BASED RESULTS F1
System Configuration A - Field p060 F2
System Configuration B - Field p060 F3
System Configuration C - Field p060 F4
System Configuration D - Field p060 F5
System Configuration E - Field p060 F6
System Configuration F - Field p060 F7
System Configuration A - Field p045 F8
System Configuration B - Field p045 F9
System Configuration C - Field p045 F10
System Configuration D - Field p045 F11
System Configuration E - Field p045 F12
System Configuration F - Field p045 F13
System Configuration A - Field p161 F14
System Configuration B - Field p161 F15
System Configuration C - Field p161 F16
System Configuration D - Field p161 F17
System Configuration E - Field p161 F18
System Configuration F - Field p161 F19
System Mark Detection - Fields p023 and p034 F20
APPENDIX G. HUMAN FACTORS G1
Breakdown of Human Factors - Field p060 G2
Breakdown of Human Factors - Field p045 G3
Breakdown of Human Factors - Field p161 G4
iv
Breakdown of Human Factors - Field p023 G5
Breakdown of Human Factors - Field p034 G5
APPENDIX H. SEGMENTATION ERRORS H1
System Configuration E - Float Fields H1
System Configuration E - Integer Fields H1
System Configuration E - Field p060 H1
System Configuration E - Field p045 H2
System Configuration E - Field p161 H2
System Configuration E - Errors Due to Human Factors H2
System Configuration F - Float Fields H3
System Configuration F - Integer Fields H3
System Configuration F - Field p060 H3
System Configuration F - Field p045 H4
System Configuration F - Field p161 H4
System Configuration F - Errors Due to Human Factors H4
1
Evaluating Form Designs For Optical Character Recognition
Michael D. Garris and Darrin L. Dimmick
National Institute of Standards and Technology,Gaithersburg, Maryland 20899
ABSTRACT
The National Institute of Standards and Technology, under the sponsorship of the Internal Revenue Service, has conducted an extensive study of three different redesigned tax forms. The NIST Model Recognition System was used in conjunction with the NIST Scoring Package to generate performance measures at the form, field, and character levels. The analyses of these measures conclude that factors introduced onto forms by the writer are the primary cause of segmentation errors, which are the major source of errors within the recognition system. One configuration of the recognition system achieved a 10% character error rate across 13,316 fields containing money amounts. Of these errors, 83% are attributed to segmentation errors (deleted and inserted characters). Analysis shows that 97% of these segmentation errors can be attributed to factors introduced by the writer. Anomalous behavior referred to as human factors include such things as leaving a field blank that requires a value, completing a field with an incorrect value, and crossing out previously written characters. The recognition system achieved a 2.8% character error rate when the fields containing these human factors were removed from the performance analysis. This paper cites three ways in which these types of human factors can be handled so as to increase recognition performance. First, the algorithms and tech-niques deployed within the system can be improved. One configuration of the recognition system initially achieved a 31% character error rate with a 33% field error rate when reading count fields and Social Security Number fields. A new spatial normalization technique was developed, and when integrated, the system achieved a 24% character error rate with a 26% field error rate, for a gain of 7%. Second, the instances of human factors leading to system errors can be detected. Third, writers can be influenced by the design of the form including the layout and structure of the fields. One configuration of the recognition system achieved a 20% character error rate with a 20% field error rate on 14,336 money fields in which there are no inter-character markings on the form to denote proper character spacing. The same recognition system achieved an 11% character error rate for a gain of 9% with a 12% field error rate on 13,316 money fields in which the position of each character within the field is denoted by a separately spaced bounding box. The best performance achieved on alphabetic fields was a 45% character error rate with a 43% field error rate. By applying a combination of these three approaches, human factors can be dealt with, and the errors made by a form processing system can be effectively reduced to classification errors.
1. INTRODUCTION
The Internal Revenue Service (IRS) is an agency that is aggressively pursuing the deployment of Optical Character Recognition (OCR) technology within its tax modernization effort. To facilitate this, IRS has begun to con-sider ways in which their forms can be redesigned to increase OCR throughput without negatively impacting the tax filer when completing the forms. In September of 1993, IRS presented the National Institute of Standards and Tech-nology (NIST) with a set of redesigned forms called 1040T forms (T for Test). The 1040T forms are a summary of field values contained in the current IRS 1040 Package X. It was determined that NIST would study three different versions of 1040T forms (P1, P2, and P3) shown in Appendix A and evaluate how these variations impact OCR. The Image Recognition Group at NIST has worked in cooperation with IRS on handprint OCR and automated form pro-cessing since 1988.1-20 As a result, NIST has developed both a state-of-the-art massively parallel model recognition system21 and performance assessment methods for evaluating form-based OCR systems.22-26 This paper documents the evaluation of the 1040T forms based on running the forms through six different configurations of the NIST Model Recognition System and then scoring and analyzing results using the NIST Scoring Package.
To design a form properly, a compromise must be found between what amount of complexity the current tech-nology is able to reliably handle and what amount of information is reasonable to include on a single form. The impact on the person filling out the form must also be considered at the same time. For an IRS form processing system to be successful, there must be low form complexity for high OCR throughput and accuracy, high information content for legal records, and user friendliness for tax filer acceptability. If a tax form is too complex, then OCR errors will be

2
compounded reducing the throughput of automated processing and increasing the amount of manual labor required. In addition, complex forms will frustrate an already unmotivated tax filer. Legal records require thoroughness. However, if too much information is contained on a form, then the writer will be cramped for space and the quality of his writing will degrade, increasing OCR errors. Field separation will also become ambiguous.
Automated recognition of handprint has been the topic of much research.27-31 In May of 1992, the First Cen-sus Optical Character Recognition Systems (COCR) Conference sponsored by the Bureau of the Census was run by NIST.32 The Conference compared the results from 45 different systems submitted by 26 participants representing organizations from the private sector, academia, and government. Properly segmented images of individual hand-printed characters were recognized and the results reported. It was demonstrated that error rates as low as 3% could be achieved on large samples of digits without rejecting any classifications. Error rates as low as 5% to 6% were demon-strated on uppercase letters; error rates of 10% to 15% were demonstrated for lowercase letters.
The results from the COCR Conference show Optical Character Recognition (OCR) of handprinted informa-tion to be an economically viable technology. Unfortunately, few real applications can be reduced to only recognizing well segmented and isolated characters. Many OCR applications require elements of document understanding and form processing. This paper addresses the latter, the processing of field information entered onto forms. In this domain, complex and intelligent processing is required to get to the point of classifying isolated character images. Steps includ-ing form identification, form registration, form removal, field isolation, and field segmentation must be conducted prior to classifying the characters in each field. Each one of these steps adds complexity and the potential for error to a form processing system. In theory, the results demonstrated in the COCR Conference are achievable, but in practice, auto-mated form processing systems will not deliver error rates this low.
The study presented in this paper documents three approaches that permit an automated form processing sys-tem to achieve a level of performance similar to the COCR Conference results. First, the algorithms and techniques deployed within the recognition system can be improved. For example, neural network-based classifiers can be retrained to improve accuracy, and new filtering techniques can be developed to increase system tolerance to image noise and writing variations. One configuration of the recognition system initially achieved a 31% character error rate with a 33% field error rate when reading count fields and Social Security Number fields. This system configuration utilizes a segmentor based on cutting the characters printed within a field along inter-character spaces defined by field markings on the form. Upon closer inspection, it was determined that pieces of neighboring characters were being included in each segmented character image, and these extraneous pieces where causing severe image distortions when the characters were spatially normalized. A new spatial normalization technique was developed that essentially ignores these extraneous character fragments. When integrated, the system achieved a 24% character error rate with a 26% field error rate. In this case, the 7% gain in performance is substantial.
One configuration of the recognition system achieved a 10% character error rate across 13,316 fields contain-ing money amounts from P3 forms. Of these errors, approximately 83% are attributed to segmentation errors (deleted and inserted characters). The analysis in Section 5 shows that 97% of these segmentation errors can be attributed to anomalous behavior exhibited by the writer. These anomalies are referred to as human factors and are shown in Figure 6. Another human factor not shown in the figure is a writer leaving a field blank when it requires a value. These results suggest that factors introduced onto forms by the writer are the primary cause of segmentation errors, which are the major source of errors within the recognition system. Therefore, it is expected that the performance of this system con-figuration can be dramatically improved by improving the segmentation algorithms used.
Unfortunately, the impact of an algorithmic improvement decreases as the overall performance of the system increases, and improvements as large as those seen with the new spatial normalizer are unlikely. A robust segmentation solution can be seen as an n-dimensional problem in which the solution space encompasses as many writer and char-acter variations as possible. These variations are unbounded, so unique solutions are developed that encompass only portions of this multi-dimensional space based on algorithm constraints and limitations that attempt to cluster similar variations together. To improve upon an existing solution implies encompassing new portions of the solution space. This results in a huge incremental change in the volume of coverage. Machine learning techniques are very useful in solving n-dimensional problems. Unfortunately, these techniques must define this incremental change in volume
3
through examples contained in a training set. The solution becomes intractable because, as the volume of coverage increases, the frequency with which examples occur within this volume decreases.
Other challenges to the recognition system are human factors that basically have no solution. If a writer leaves a field blank, enters the wrong information, or crosses out a previously written field value, there is very little the rec-ognition system can do to compensate for these events apart from applying some type of external context. It is con-ceivable that certain types of human factors, which are a major contributor to system errors, can be detected. This is the second approach to increasing recognition system performance. Fields containing detected instances of human fac-tors can be routed to a human operator for appropriate action so that system errors are reduced. This detection approach was simulated in the analysis in Section 4.2. The first money field, Line 7 under the Income column on the front page, was examined across every P3 form. Of 169 fields, 40 were determined to contain combinations of the human factors shown in Figure 6. When these fields were removed from the performance analysis, the recognition system achieved a 2.8% character error rate. The same recognition system achieved a 10% character error rate across all 13,316 money fields on the P3 forms. A 7.2% improvement in character error rate is demonstrated by simulating human factor detec-tion.
A third way to increase the performance of an automated form processing system is to reduce the complexity of the form itself. Making a form more readable to a computer usually implies maximizing the space within fields so as not to cramp the writer, maximizing the space between fields so that the fields can be isolated easily, printing large registration marks on the form for deskewing the image, etc. The amount of information on the form is traded off for the machine readability of the form. To design a form properly, a compromise must be found between what amount of complexity the current technology is able to reliably handle and what amount of information is reasonable to include on a single form. All this compromise must be made without negatively impacting the person filling out the form.
The 1040T forms contains various types of fields structures. There are fields demarcated by a single horizon-tal baseline; other fields contain inter-character vertical tick marks along a baseline. Characters in Social Security Numbers (SSNs) and Employer Identification Numbers (EINs) are grouped by bounding boxes sharing neighboring sides with a vertical dashed line, and mark-sense fields are signified by circles. The three versions of the 1040T forms vary in how money fields are represented. On P1 forms, money fields are signified by a single bounding box that is to contain all characters handprinted in the field. Punctuation marks such as commas and decimal points are provided on the form. The position of each character in a money field on a P2 form is demarcated by a separately space bounding box. The sides of neighboring boxes are not shared. P3 money fields are similar to P2 money fields, only each character box contains two vertically stacked ovals intended to guide the writer’s shaping of characters. One configuration of the recognition system achieved a 20% character error rate with a 20% field error rate on the 14,336 money fields from the P1 forms. The same recognition system achieved an 11% character error rate for a gain of 9% with a 12% field error rate on 13,316 money fields from P3 forms. In addition, the recognition system achieved only a 25% character error rate with a 25% field error rate across numeric P1 fields comprised of baselines, baselines with vertical ticks, and SSN-type fields. These results clearly show that superior OCR results are obtained from fields in which the position of each character within the field is denoted by a separately spaced bounding box. The character boxes used for SSNs and EINs do not sufficiently influence the writer. To effectively influence the writer, there must be noticeable spacing between the character boxes. This observation is supported by the performance results on P2 forms as well. In this case, the recognition system achieved a 12% character error rate with a 13% field error rate.
This study shows that segmentation errors plague the performance of form processing systems, and that human factors are the primary cause of segmentation errors. By applying a combination of these three approaches: improving algorithms and techniques, detecting human factors, and carefully redesigning forms, the errors made by a form processing system can be effectively reduced to classification errors, making the results from the COCR Confer-ence obtainable. The remainder of this report documents the details of the evaluation. Section 2 describes the database of 1040T forms and presents the performance assessment methods applied. Section 3 defines the six different config-urations of the Model Recognition System. Section 4 presents system configuration results across the three versions of forms in Section 4.1, and results for a select number of individual fields are reported in Section 4.2. Section 5 contains an analysis of segmentation errors, and conclusions are summarized in Section 6. This paper also contains a number of appendices. Appendix A contains color copies of the three versions of 1040T forms. Appendix B lists two sets of field values requested to be entered on the forms. Appendix C presents issues related to form-based scoring and eval-

4
uation. Appendix D describes each recognition system component used in this study. Appendix E reports the results achieved by six different configurations of the Model Recognition System running across the database of 1040T forms. Appendix F reports the results achieved across five independent fields after human factors were removed. Appendix G contains a breakdown of human factor statistics derived from these five independent fields, and Appendix H contains the data from an analysis that relates segmentation errors to human factors.
2. 1040T FORMS AND PERFORMANCE ASSESSMENT
This section describes the two major elements required to conduct recognition system evaluations. First, a database must be created that effectively represents a specific OCR application. Second, a tool for gathering and accu-mulating statistics is required to produce quantifiable measures of performance.
2.1 1040T Forms
Color copies of the blank 1040T forms used in this study are included in Appendix A. These forms are double-sided and portrait-oriented with a page width of 215 cm and a page height of 279 cm (8.5 X 11 in). Unlike the original 1040 Package X forms, which are riddled with instructional information, the instructional information on the 1040T forms is greatly reduced. There is typically a one-line heading for each field. In general, the fields are generously spaced apart from one another, with a few exceptions addressed later. The forms are partitioned into rectangular regions demarcating different subject matter from various forms. The regions are ruled with black lines and pink bor-ders. In general, the fields are demarcated within each region using blue drop-out ink. The 1040T forms have a black registration mark in each corner of the page and a barcode in the bottom left-hand corner.
There are three form versions used in this study. The front and back pages of the first form shown in Appendix A are referred to as type P1. In this version, most alphabetic fields such as names and address are ruled with one hor-izontal baseline with vertical tick marks evenly spaced between character positions. Mark-sense fields, fields that are checked off or colored in, are demarcated by circles. Social Security Numbers are demarcated by boxes bounding each character position with dashed lines used on interior shared sides. The only difference between the three 1040T ver-sions is in the representation of money fields. Money fields on P1 forms are demarcated as a single bounding box encompassing the entire field value. Commas and decimal points are printed in blue drop-out ink with a vertical tick mark above each punctuation. The front and back pages of a P2 form are shown next in Appendix A. In this form ver-sion, money fields are demarcated by separately spaced boxes bounding each character position in the field. The last form in the appendix is of type P3. The money fields on this form are demarcated by separately spaced boxes bounding each character position in the field, and each character box contains two vertically stacked ovals. The ovals are intended to guide the shape of the characters as they are written so that irregularities and character variations are min-imized.
2.2 1040T Database
IRS presented NIST with two sets of 1040T forms at the beginning of this project. The first set of forms was portrait in orientation with field demarcations printed in blue drop-out ink (colors ignored by scanners and copiers) and region borders printed in red ink. The second set of forms was landscape in orientation with field demarcations printed in red ink and region borders printed in blue drop-out ink. Experiments were conducted at NIST on a Fujitsu 3096G scanner and at IRS on a Kodak Imagelink 900D scanner in an attempt to drop out the ink on the landscape version of the forms without success. These landscape 1040T forms were eliminated from the remainder of the study because the red field markings, which could not be automatically removed by the scanners, interfered with the handwriting in the fields. Current scanner technology uses photoreceptors whose peak response occurs within the red spectrum. In order to alleviate these problems in the future, it is recommended that red inks be avoided when choosing drop-out colors.
IRS presented NIST with 570 portrait 1040T forms filled out by hand. The forms were scanned front and back using a Fujitsu 3096G scanner connected via SCSI interface to a Sun Microsystems SPARCstation 2 running Scanshop control software produced by Vividata. Extreme cases of light and dark inks, blue and black inks, and pencil were iden-tified within the 570 forms. A common setting of scanner parameters was derived by scanning the extreme cases and interactively adjusting the scanner settings until all the images produced were of acceptable quality. Criteria for accept-
5
able quality included retaining maximum field data across the entire form while minimizing the amount of drop-out ink retained in the image. The images in the 1040T database were scanned at 12 pixels per millimeter (300 pixels per inch) and digitized as binary (black and white) using an image software threshold of 169 stored in the initialization file used by Scanshop’s Command Line Interface (CLI).*
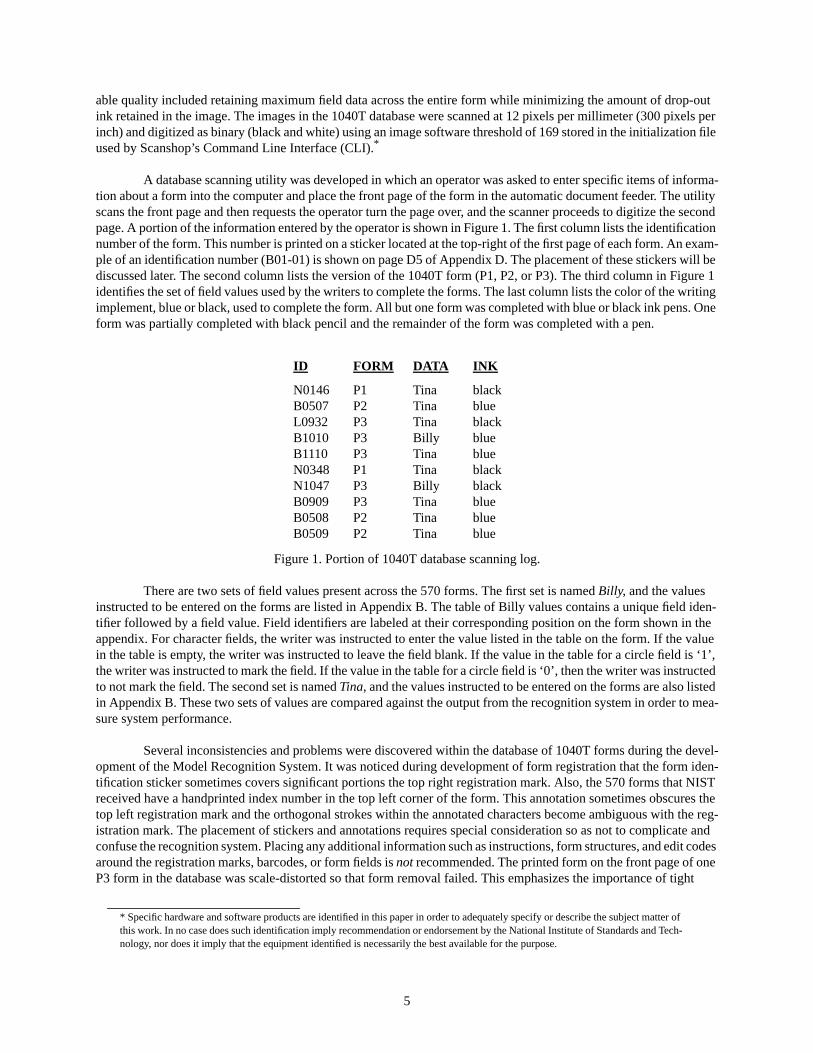
A database scanning utility was developed in which an operator was asked to enter specific items of informa-tion about a form into the computer and place the front page of the form in the automatic document feeder. The utility scans the front page and then requests the operator turn the page over, and the scanner proceeds to digitize the second page. A portion of the information entered by the operator is shown in Figure 1. The first column lists the identification number of the form. This number is printed on a sticker located at the top-right of the first page of each form. An exam-ple of an identification number (B01-01) is shown on page D5 of Appendix D. The placement of these stickers will be discussed later. The second column lists the version of the 1040T form (P1, P2, or P3). The third column in Figure 1 identifies the set of field values used by the writers to complete the forms. The last column lists the color of the writing implement, blue or black, used to complete the form. All but one form was completed with blue or black ink pens. One form was partially completed with black pencil and the remainder of the form was completed with a pen.
Figure 1. Portion of 1040T database scanning log.
There are two sets of field values present across the 570 forms. The first set is named Billy, and the values instructed to be entered on the forms are listed in Appendix B. The table of Billy values contains a unique field iden-tifier followed by a field value. Field identifiers are labeled at their corresponding position on the form shown in the appendix. For character fields, the writer was instructed to enter the value listed in the table on the form. If the value in the table is empty, the writer was instructed to leave the field blank. If the value in the table for a circle field is ‘1’, the writer was instructed to mark the field. If the value in the table for a circle field is ‘0’, then the writer was instructed to not mark the field. The second set is named Tina, and the values instructed to be entered on the forms are also listed in Appendix B. These two sets of values are compared against the output from the recognition system in order to mea-sure system performance.
Several inconsistencies and problems were discovered within the database of 1040T forms during the devel-opment of the Model Recognition System. It was noticed during development of form registration that the form iden-tification sticker sometimes covers significant portions the top right registration mark. Also, the 570 forms that NIST received have a handprinted index number in the top left corner of the form. This annotation sometimes obscures the top left registration mark and the orthogonal strokes within the annotated characters become ambiguous with the reg-istration mark. The placement of stickers and annotations requires special consideration so as not to complicate and confuse the recognition system. Placing any additional information such as instructions, form structures, and edit codes around the registration marks, barcodes, or form fields is not recommended. The printed form on the front page of one P3 form in the database was scale-distorted so that form removal failed. This emphasizes the importance of tight
* Specific hardware and software products are identified in this paper in order to adequately specify or describe the subject matter of this work. In no case does such identification imply recommendation or endorsement by the National Institute of Standards and Tech-nology, nor does it imply that the equipment identified is necessarily the best available for the purpose.
ID FORM DATA INK
N0146 P1 Tina blackB0507 P2 Tina blueL0932 P3 Tina blackB1010 P3 Billy blueB1110 P3 Tina blueN0348 P1 Tina blackN1047 P3 Billy blackB0909 P3 Tina blueB0508 P2 Tina blueB0509 P2 Tina blue
6
printing specifications and quality control. Another inconsistency is the mark-sense field under Line 54 on the second page of P2 forms was printed in black ink rather than blue drop-out ink. There are also differing sizes of SSN character boxes, and differing starting offsets for the name and address fields. These inconsistencies do nothing to enhance machine readability, and only complicate development for the system engineer.
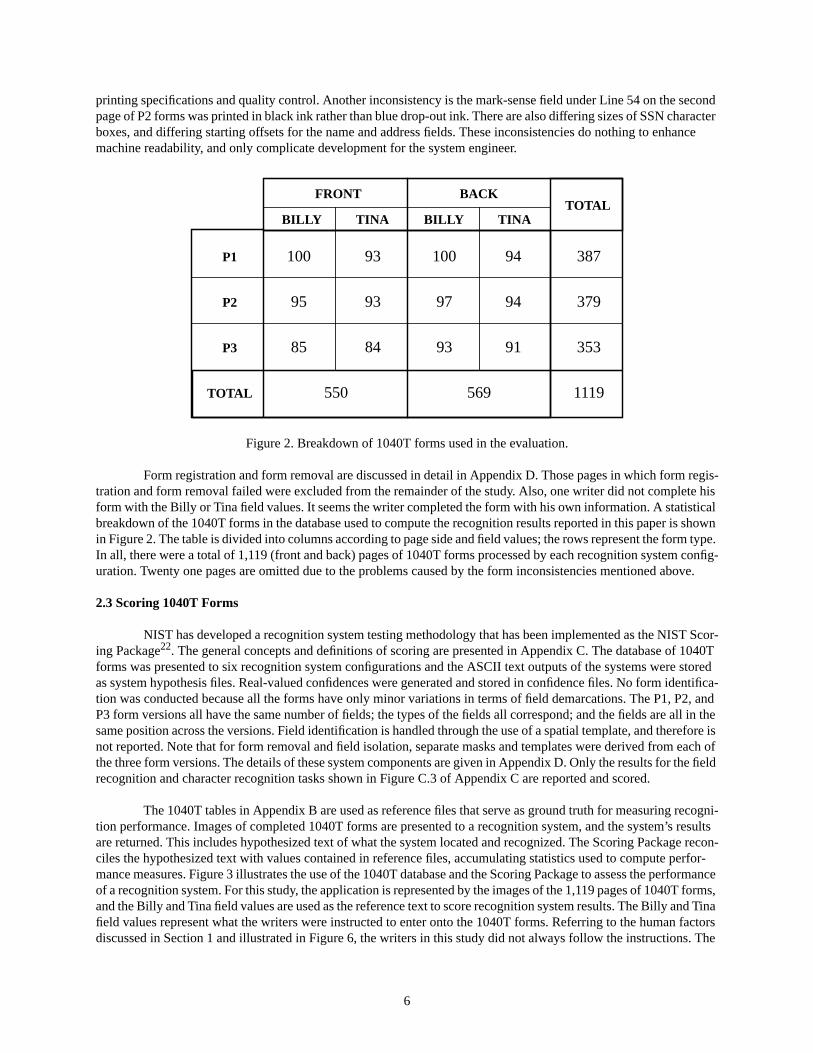
Figure 2. Breakdown of 1040T forms used in the evaluation.
Form registration and form removal are discussed in detail in Appendix D. Those pages in which form regis-tration and form removal failed were excluded from the remainder of the study. Also, one writer did not complete his form with the Billy or Tina field values. It seems the writer completed the form with his own information. A statistical breakdown of the 1040T forms in the database used to compute the recognition results reported in this paper is shown in Figure 2. The table is divided into columns according to page side and field values; the rows represent the form type. In all, there were a total of 1,119 (front and back) pages of 1040T forms processed by each recognition system config-uration. Twenty one pages are omitted due to the problems caused by the form inconsistencies mentioned above.
2.3 Scoring 1040T Forms
NIST has developed a recognition system testing methodology that has been implemented as the NIST Scor-ing Package22. The general concepts and definitions of scoring are presented in Appendix C. The database of 1040T forms was presented to six recognition system configurations and the ASCII text outputs of the systems were stored as system hypothesis files. Real-valued confidences were generated and stored in confidence files. No form identifica-tion was conducted because all the forms have only minor variations in terms of field demarcations. The P1, P2, and P3 form versions all have the same number of fields; the types of the fields all correspond; and the fields are all in the same position across the versions. Field identification is handled through the use of a spatial template, and therefore is not reported. Note that for form removal and field isolation, separate masks and templates were derived from each of the three form versions. The details of these system components are given in Appendix D. Only the results for the field recognition and character recognition tasks shown in Figure C.3 of Appendix C are reported and scored.
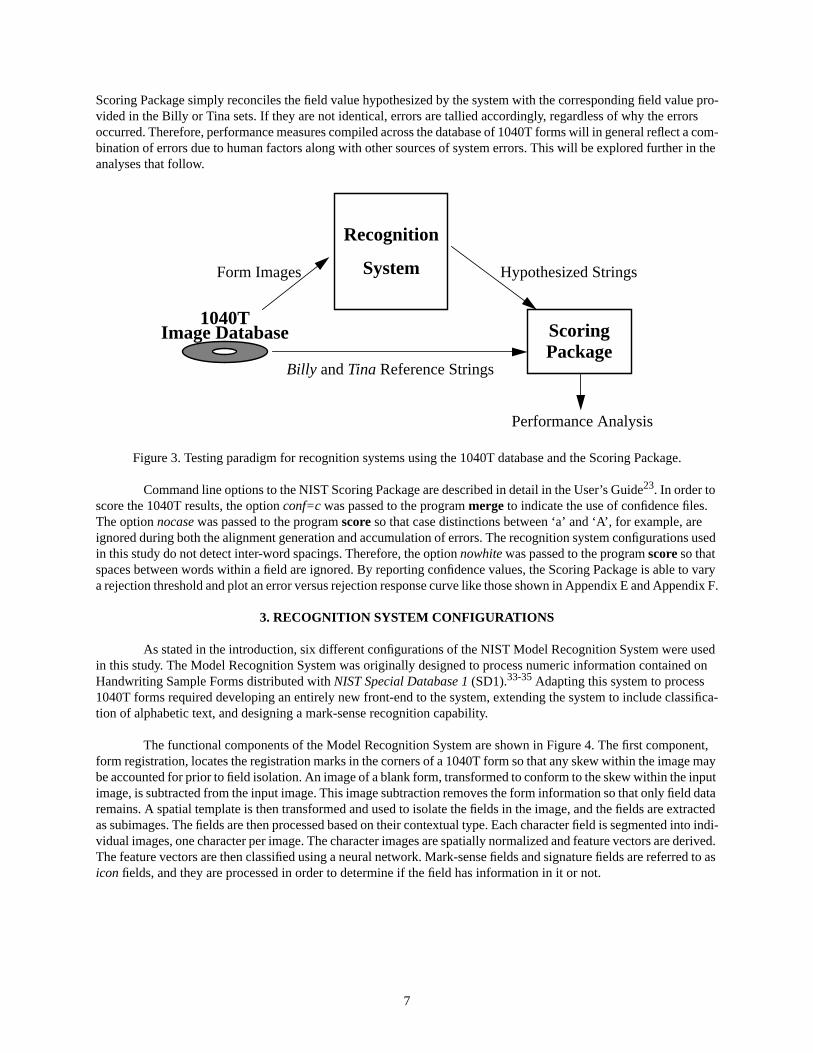
The 1040T tables in Appendix B are used as reference files that serve as ground truth for measuring recogni-tion performance. Images of completed 1040T forms are presented to a recognition system, and the system’s results are returned. This includes hypothesized text of what the system located and recognized. The Scoring Package recon-ciles the hypothesized text with values contained in reference files, accumulating statistics used to compute perfor-mance measures. Figure 3 illustrates the use of the 1040T database and the Scoring Package to assess the performance of a recognition system. For this study, the application is represented by the images of the 1,119 pages of 1040T forms, and the Billy and Tina field values are used as the reference text to score recognition system results. The Billy and Tina field values represent what the writers were instructed to enter onto the 1040T forms. Referring to the human factors discussed in Section 1 and illustrated in Figure 6, the writers in this study did not always follow the instructions. The
P1
P2
P3
FRONT BACK
BILLY TINA BILLY TINA
TOTAL
TOTAL
100
95
85
550
93
93
84
100
97
93
569
94
94
91
387
379
353
1119
7
Scoring Package simply reconciles the field value hypothesized by the system with the corresponding field value pro-vided in the Billy or Tina sets. If they are not identical, errors are tallied accordingly, regardless of why the errors occurred. Therefore, performance measures compiled across the database of 1040T forms will in general reflect a com-bination of errors due to human factors along with other sources of system errors. This will be explored further in the analyses that follow.
Figure 3. Testing paradigm for recognition systems using the 1040T database and the Scoring Package.
Command line options to the NIST Scoring Package are described in detail in the User’s Guide23. In order to score the 1040T results, the option conf=c was passed to the program merge to indicate the use of confidence files. The option nocase was passed to the program score so that case distinctions between ‘a’ and ‘A’, for example, are ignored during both the alignment generation and accumulation of errors. The recognition system configurations used in this study do not detect inter-word spacings. Therefore, the option nowhite was passed to the program score so that spaces between words within a field are ignored. By reporting confidence values, the Scoring Package is able to vary a rejection threshold and plot an error versus rejection response curve like those shown in Appendix E and Appendix F.
3. RECOGNITION SYSTEM CONFIGURATIONS
As stated in the introduction, six different configurations of the NIST Model Recognition System were used in this study. The Model Recognition System was originally designed to process numeric information contained on Handwriting Sample Forms distributed with NIST Special Database 1 (SD1).33-35 Adapting this system to process 1040T forms required developing an entirely new front-end to the system, extending the system to include classifica-tion of alphabetic text, and designing a mark-sense recognition capability.
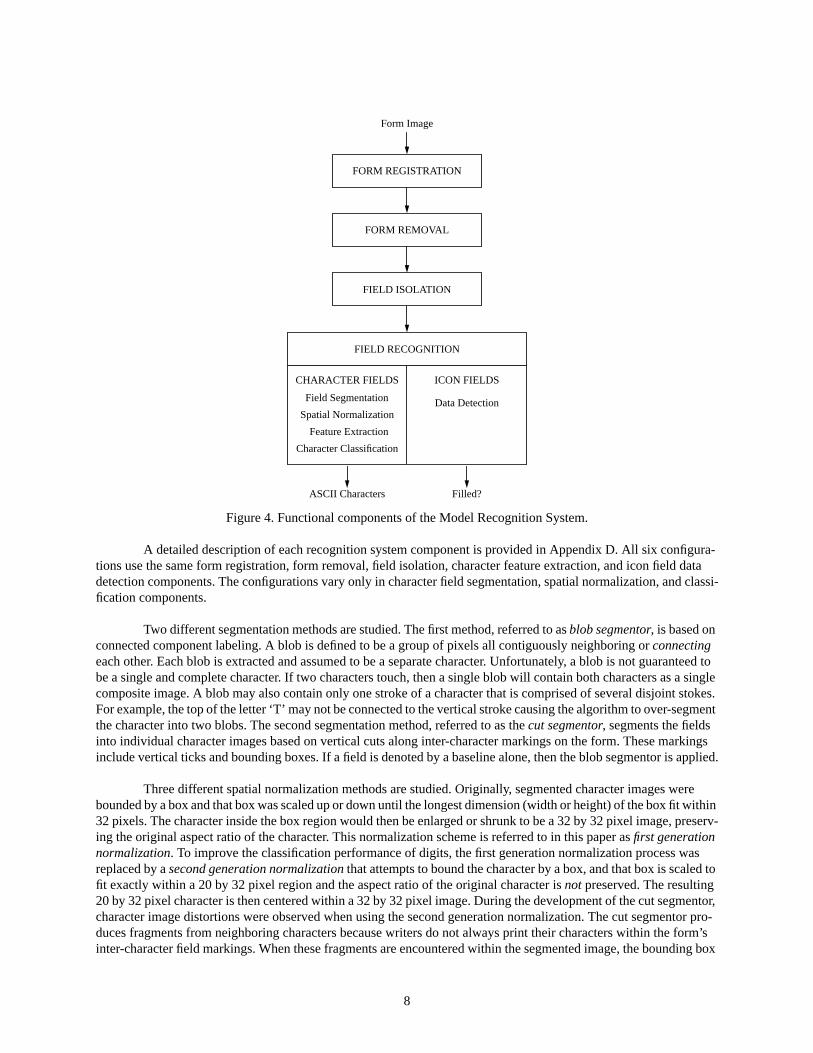
The functional components of the Model Recognition System are shown in Figure 4. The first component, form registration, locates the registration marks in the corners of a 1040T form so that any skew within the image may be accounted for prior to field isolation. An image of a blank form, transformed to conform to the skew within the input image, is subtracted from the input image. This image subtraction removes the form information so that only field data remains. A spatial template is then transformed and used to isolate the fields in the image, and the fields are extracted as subimages. The fields are then processed based on their contextual type. Each character field is segmented into indi-vidual images, one character per image. The character images are spatially normalized and feature vectors are derived. The feature vectors are then classified using a neural network. Mark-sense fields and signature fields are referred to as icon fields, and they are processed in order to determine if the field has information in it or not.
1040TImage Database
Recognition
System
ScoringPackage
Form Images Hypothesized Strings
Billy and Tina Reference Strings
Performance Analysis
8
Figure 4. Functional components of the Model Recognition System.
A detailed description of each recognition system component is provided in Appendix D. All six configura-tions use the same form registration, form removal, field isolation, character feature extraction, and icon field data detection components. The configurations vary only in character field segmentation, spatial normalization, and classi-fication components.
Two different segmentation methods are studied. The first method, referred to as blob segmentor, is based on connected component labeling. A blob is defined to be a group of pixels all contiguously neighboring or connecting each other. Each blob is extracted and assumed to be a separate character. Unfortunately, a blob is not guaranteed to be a single and complete character. If two characters touch, then a single blob will contain both characters as a single composite image. A blob may also contain only one stroke of a character that is comprised of several disjoint stokes. For example, the top of the letter ‘T’ may not be connected to the vertical stroke causing the algorithm to over-segment the character into two blobs. The second segmentation method, referred to as the cut segmentor, segments the fields into individual character images based on vertical cuts along inter-character markings on the form. These markings include vertical ticks and bounding boxes. If a field is denoted by a baseline alone, then the blob segmentor is applied.
Three different spatial normalization methods are studied. Originally, segmented character images were bounded by a box and that box was scaled up or down until the longest dimension (width or height) of the box fit within 32 pixels. The character inside the box region would then be enlarged or shrunk to be a 32 by 32 pixel image, preserv-ing the original aspect ratio of the character. This normalization scheme is referred to in this paper as first generation normalization. To improve the classification performance of digits, the first generation normalization process was replaced by a second generation normalization that attempts to bound the character by a box, and that box is scaled to fit exactly within a 20 by 32 pixel region and the aspect ratio of the original character is not preserved. The resulting 20 by 32 pixel character is then centered within a 32 by 32 pixel image. During the development of the cut segmentor, character image distortions were observed when using the second generation normalization. The cut segmentor pro-duces fragments from neighboring characters because writers do not always print their characters within the form’s inter-character field markings. When these fragments are encountered within the segmented image, the bounding box
CHARACTER FIELDS ICON FIELDS
FIELD RECOGNITION
Data DetectionField Segmentation
Feature Extraction
Character Classification
ASCII Characters Filled?
FORM REMOVAL
Form Image
FORM REGISTRATION
FIELD ISOLATION
Spatial Normalization
9
used by the second generation normalization no longer tightly fits the actual character. Rather, it fits loosely because the extraneous black pixels are encompassed as well. Upon scaling, the second generation normalization warps the character making it less recognizable. A third generation normalization scheme was developed to overcome these sen-sitivities exhibited by the second generation normalization. Third generation normalization is designed to be tolerant of the fragments from neighboring characters.
Two different character classifiers are studied. The first character classifier is a Multi-Layer Perceptron (MLP)36, a traditional neural network architecture. The MLP character classifier used in this study has three layers: an input layer, one hidden layer, and an output layer. The MLP network is trained using a technique of supervised learning called Scaled Conjugate Gradient (SCG)37. The second character classifier used in this study is a Probabilistic Neural Network (PNN)38. It has been our experience that PNN is more accurate than MLP networks for character classifica-tion.39,40
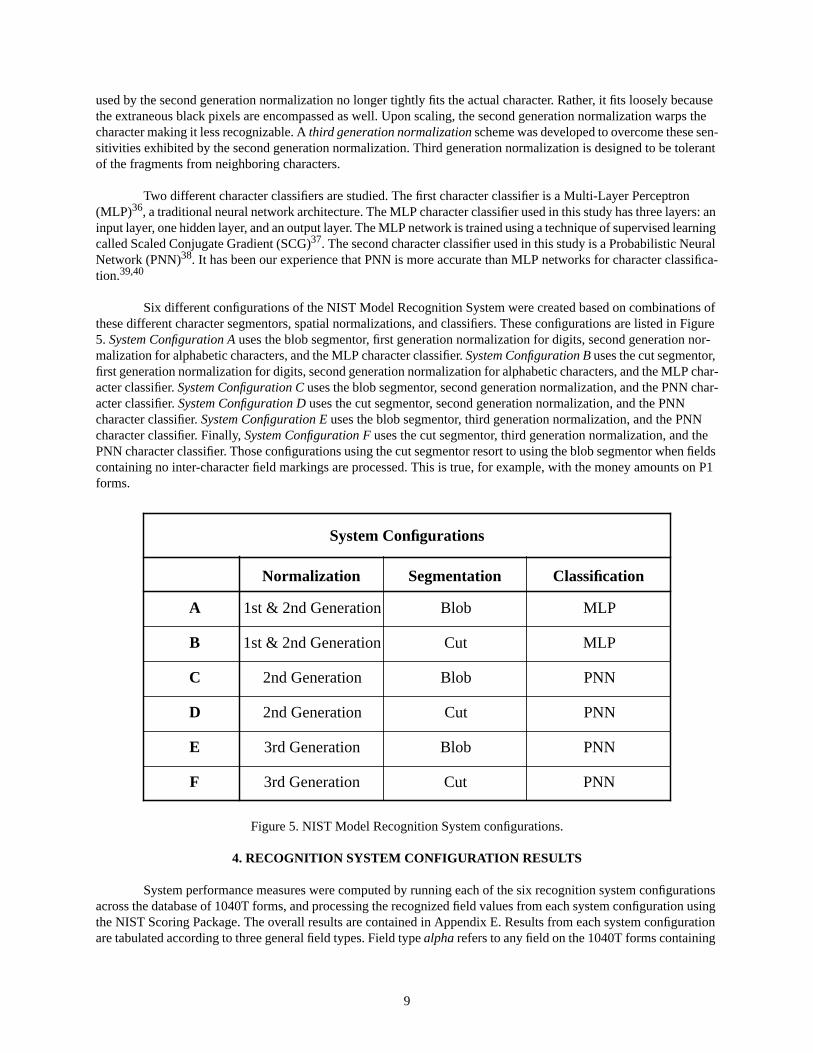
Six different configurations of the NIST Model Recognition System were created based on combinations of these different character segmentors, spatial normalizations, and classifiers. These configurations are listed in Figure 5. System Configuration A uses the blob segmentor, first generation normalization for digits, second generation nor-malization for alphabetic characters, and the MLP character classifier. System Configuration B uses the cut segmentor, first generation normalization for digits, second generation normalization for alphabetic characters, and the MLP char-acter classifier. System Configuration C uses the blob segmentor, second generation normalization, and the PNN char-acter classifier. System Configuration D uses the cut segmentor, second generation normalization, and the PNN character classifier. System Configuration E uses the blob segmentor, third generation normalization, and the PNN character classifier. Finally, System Configuration F uses the cut segmentor, third generation normalization, and the PNN character classifier. Those configurations using the cut segmentor resort to using the blob segmentor when fields containing no inter-character field markings are processed. This is true, for example, with the money amounts on P1 forms.
Figure 5. NIST Model Recognition System configurations.
4. RECOGNITION SYSTEM CONFIGURATION RESULTS
System performance measures were computed by running each of the six recognition system configurations across the database of 1040T forms, and processing the recognized field values from each system configuration using the NIST Scoring Package. The overall results are contained in Appendix E. Results from each system configuration are tabulated according to three general field types. Field type alpha refers to any field on the 1040T forms containing
System Configurations
SegmentationNormalization Classification
A
B
1st & 2nd Generation MLP
Cut1st & 2nd Generation MLP
Blob
C Blob2nd Generation PNN
D Cut2nd Generation PNN
E Blob3rd Generation PNN
F Cut3rd Generation PNN
10
alphabetic characters, including fields such as names and addresses. Field type float refers to all money fields on the 1040T forms. Field type integer refers to any remaining numeric fields that are not money fields. The majority of char-acter information represented by integer fields (non-money amounts) comes from SSN fields. Each field type is broken out by form version (P1, P2, and P3). The structure of field markings remains constant across all three form types for alpha and integer fields. The three form versions differ in how float fields (money amounts) are represented (see Appendix A).
The first page in Appendix E contains a legend for the graphs in this appendix and those that follow. Each subsequent page in Appendix E summarizes the results for a specific recognition system configuration by field type across the three versions of 1040T forms. For example, page E2 contains two tables and one graph. The first table pro-vides a list of the distinguishing components contained in System Configuration A that are used to process the fields of type alpha. Alpha fields are consistently represented across the three form versions, therefore the same components are used repeatedly resulting in only one row in this table. For System Configuration A, alpha fields were processed using 2nd generation spatial normalization, the blob segmentor, and the MLP character classifier across all three form versions (P1, P2, and P3).
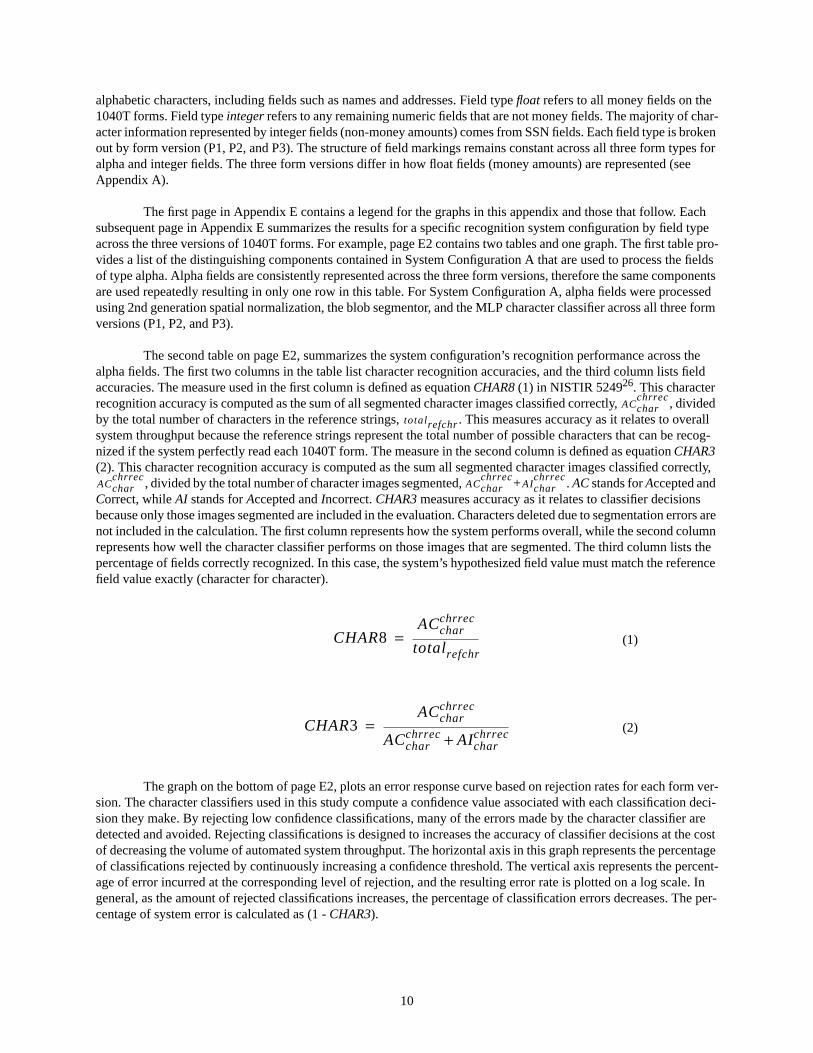
The second table on page E2, summarizes the system configuration’s recognition performance across the alpha fields. The first two columns in the table list character recognition accuracies, and the third column lists field accuracies. The measure used in the first column is defined as equation CHAR8 (1) in NISTIR 524926. This character recognition accuracy is computed as the sum of all segmented character images classified correctly, , divided by the total number of characters in the reference strings, . This measures accuracy as it relates to overall system throughput because the reference strings represent the total number of possible characters that can be recog-nized if the system perfectly read each 1040T form. The measure in the second column is defined as equation CHAR3 (2). This character recognition accuracy is computed as the sum all segmented character images classified correctly,
, divided by the total number of character images segmented, + . AC stands for Accepted and Correct, while AI stands for Accepted and Incorrect. CHAR3 measures accuracy as it relates to classifier decisions because only those images segmented are included in the evaluation. Characters deleted due to segmentation errors are not included in the calculation. The first column represents how the system performs overall, while the second column represents how well the character classifier performs on those images that are segmented. The third column lists the percentage of fields correctly recognized. In this case, the system’s hypothesized field value must match the reference field value exactly (character for character).
The graph on the bottom of page E2, plots an error response curve based on rejection rates for each form ver-sion. The character classifiers used in this study compute a confidence value associated with each classification deci-sion they make. By rejecting low confidence classifications, many of the errors made by the character classifier are detected and avoided. Rejecting classifications is designed to increases the accuracy of classifier decisions at the cost of decreasing the volume of automated system throughput. The horizontal axis in this graph represents the percentage of classifications rejected by continuously increasing a confidence threshold. The vertical axis represents the percent-age of error incurred at the corresponding level of rejection, and the resulting error rate is plotted on a log scale. In general, as the amount of rejected classifications increases, the percentage of classification errors decreases. The per-centage of system error is calculated as (1 - CHAR3).
ACcharchrrec
totalrefchr
ACcharchrrec
ACcharchrrec
AIcharchrrec
(1)CHAR8ACchar
chrrec
totalrefchr=
(2)CHAR3ACchar
chrrec
ACcharchrrec AIchar
chrrec+=
11
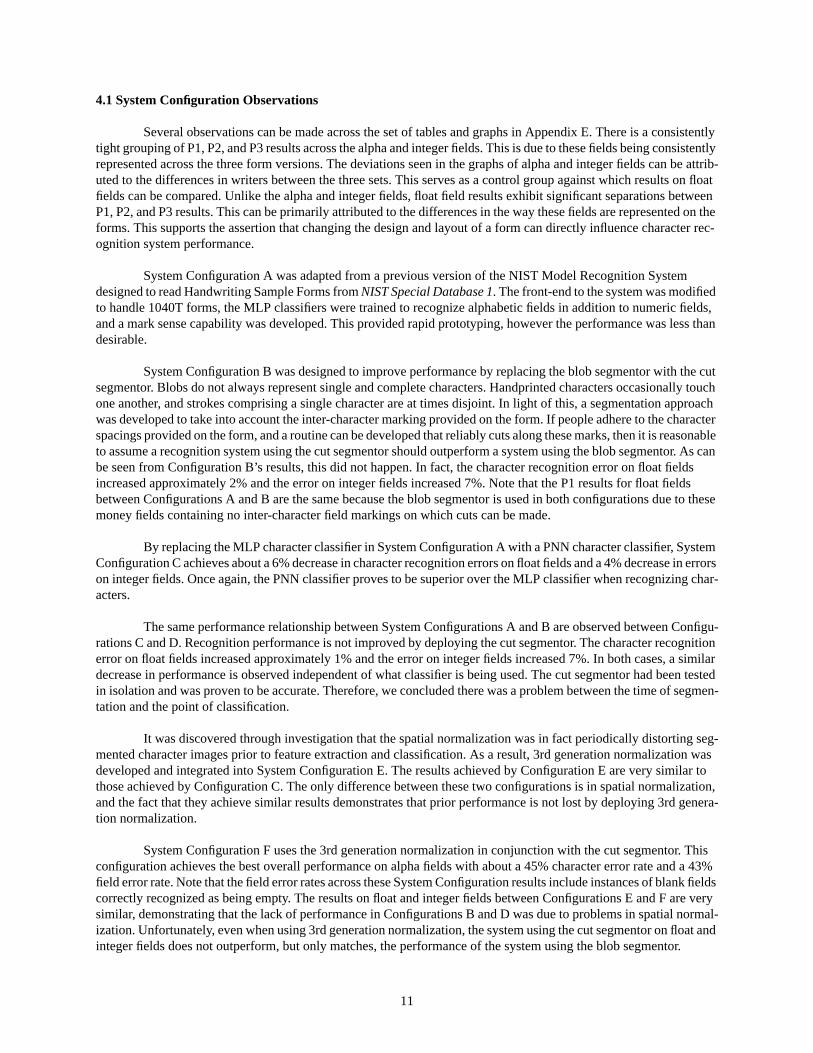
4.1 System Configuration Observations
Several observations can be made across the set of tables and graphs in Appendix E. There is a consistently tight grouping of P1, P2, and P3 results across the alpha and integer fields. This is due to these fields being consistently represented across the three form versions. The deviations seen in the graphs of alpha and integer fields can be attrib-uted to the differences in writers between the three sets. This serves as a control group against which results on float fields can be compared. Unlike the alpha and integer fields, float field results exhibit significant separations between P1, P2, and P3 results. This can be primarily attributed to the differences in the way these fields are represented on the forms. This supports the assertion that changing the design and layout of a form can directly influence character rec-ognition system performance.
System Configuration A was adapted from a previous version of the NIST Model Recognition System designed to read Handwriting Sample Forms from NIST Special Database 1. The front-end to the system was modified to handle 1040T forms, the MLP classifiers were trained to recognize alphabetic fields in addition to numeric fields, and a mark sense capability was developed. This provided rapid prototyping, however the performance was less than desirable.
System Configuration B was designed to improve performance by replacing the blob segmentor with the cut segmentor. Blobs do not always represent single and complete characters. Handprinted characters occasionally touch one another, and strokes comprising a single character are at times disjoint. In light of this, a segmentation approach was developed to take into account the inter-character marking provided on the form. If people adhere to the character spacings provided on the form, and a routine can be developed that reliably cuts along these marks, then it is reasonable to assume a recognition system using the cut segmentor should outperform a system using the blob segmentor. As can be seen from Configuration B’s results, this did not happen. In fact, the character recognition error on float fields increased approximately 2% and the error on integer fields increased 7%. Note that the P1 results for float fields between Configurations A and B are the same because the blob segmentor is used in both configurations due to these money fields containing no inter-character field markings on which cuts can be made.
By replacing the MLP character classifier in System Configuration A with a PNN character classifier, System Configuration C achieves about a 6% decrease in character recognition errors on float fields and a 4% decrease in errors on integer fields. Once again, the PNN classifier proves to be superior over the MLP classifier when recognizing char-acters.
The same performance relationship between System Configurations A and B are observed between Configu-rations C and D. Recognition performance is not improved by deploying the cut segmentor. The character recognition error on float fields increased approximately 1% and the error on integer fields increased 7%. In both cases, a similar decrease in performance is observed independent of what classifier is being used. The cut segmentor had been tested in isolation and was proven to be accurate. Therefore, we concluded there was a problem between the time of segmen-tation and the point of classification.
It was discovered through investigation that the spatial normalization was in fact periodically distorting seg-mented character images prior to feature extraction and classification. As a result, 3rd generation normalization was developed and integrated into System Configuration E. The results achieved by Configuration E are very similar to those achieved by Configuration C. The only difference between these two configurations is in spatial normalization, and the fact that they achieve similar results demonstrates that prior performance is not lost by deploying 3rd genera-tion normalization.
System Configuration F uses the 3rd generation normalization in conjunction with the cut segmentor. This configuration achieves the best overall performance on alpha fields with about a 45% character error rate and a 43% field error rate. Note that the field error rates across these System Configuration results include instances of blank fields correctly recognized as being empty. The results on float and integer fields between Configurations E and F are very similar, demonstrating that the lack of performance in Configurations B and D was due to problems in spatial normal-ization. Unfortunately, even when using 3rd generation normalization, the system using the cut segmentor on float and integer fields does not outperform, but only matches, the performance of the system using the blob segmentor.
12
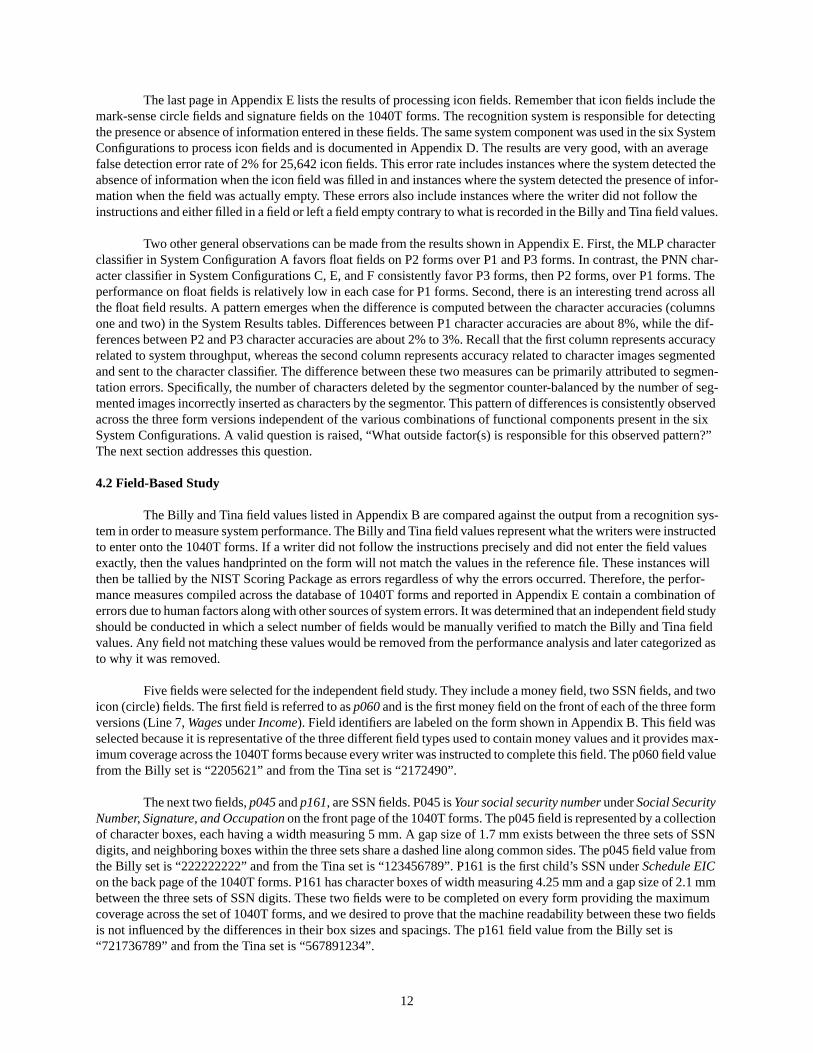
The last page in Appendix E lists the results of processing icon fields. Remember that icon fields include the mark-sense circle fields and signature fields on the 1040T forms. The recognition system is responsible for detecting the presence or absence of information entered in these fields. The same system component was used in the six System Configurations to process icon fields and is documented in Appendix D. The results are very good, with an average false detection error rate of 2% for 25,642 icon fields. This error rate includes instances where the system detected the absence of information when the icon field was filled in and instances where the system detected the presence of infor-mation when the field was actually empty. These errors also include instances where the writer did not follow the instructions and either filled in a field or left a field empty contrary to what is recorded in the Billy and Tina field values.
Two other general observations can be made from the results shown in Appendix E. First, the MLP character classifier in System Configuration A favors float fields on P2 forms over P1 and P3 forms. In contrast, the PNN char-acter classifier in System Configurations C, E, and F consistently favor P3 forms, then P2 forms, over P1 forms. The performance on float fields is relatively low in each case for P1 forms. Second, there is an interesting trend across all the float field results. A pattern emerges when the difference is computed between the character accuracies (columns one and two) in the System Results tables. Differences between P1 character accuracies are about 8%, while the dif-ferences between P2 and P3 character accuracies are about 2% to 3%. Recall that the first column represents accuracy related to system throughput, whereas the second column represents accuracy related to character images segmented and sent to the character classifier. The difference between these two measures can be primarily attributed to segmen-tation errors. Specifically, the number of characters deleted by the segmentor counter-balanced by the number of seg-mented images incorrectly inserted as characters by the segmentor. This pattern of differences is consistently observed across the three form versions independent of the various combinations of functional components present in the six System Configurations. A valid question is raised, “What outside factor(s) is responsible for this observed pattern?” The next section addresses this question.
4.2 Field-Based Study
The Billy and Tina field values listed in Appendix B are compared against the output from a recognition sys-tem in order to measure system performance. The Billy and Tina field values represent what the writers were instructed to enter onto the 1040T forms. If a writer did not follow the instructions precisely and did not enter the field values exactly, then the values handprinted on the form will not match the values in the reference file. These instances will then be tallied by the NIST Scoring Package as errors regardless of why the errors occurred. Therefore, the perfor-mance measures compiled across the database of 1040T forms and reported in Appendix E contain a combination of errors due to human factors along with other sources of system errors. It was determined that an independent field study should be conducted in which a select number of fields would be manually verified to match the Billy and Tina field values. Any field not matching these values would be removed from the performance analysis and later categorized as to why it was removed.
Five fields were selected for the independent field study. They include a money field, two SSN fields, and two icon (circle) fields. The first field is referred to as p060 and is the first money field on the front of each of the three form versions (Line 7, Wages under Income). Field identifiers are labeled on the form shown in Appendix B. This field was selected because it is representative of the three different field types used to contain money values and it provides max-imum coverage across the 1040T forms because every writer was instructed to complete this field. The p060 field value from the Billy set is “2205621” and from the Tina set is “2172490”.
The next two fields, p045 and p161, are SSN fields. P045 is Your social security number under Social Security Number, Signature, and Occupation on the front page of the 1040T forms. The p045 field is represented by a collection of character boxes, each having a width measuring 5 mm. A gap size of 1.7 mm exists between the three sets of SSN digits, and neighboring boxes within the three sets share a dashed line along common sides. The p045 field value from the Billy set is “222222222” and from the Tina set is “123456789”. P161 is the first child’s SSN under Schedule EIC on the back page of the 1040T forms. P161 has character boxes of width measuring 4.25 mm and a gap size of 2.1 mm between the three sets of SSN digits. These two fields were to be completed on every form providing the maximum coverage across the set of 1040T forms, and we desired to prove that the machine readability between these two fields is not influenced by the differences in their box sizes and spacings. The p161 field value from the Billy set is “721736789” and from the Tina set is “567891234”.

13
The final fields selected were two icon fields, p023 and p034. P023 is a circle field that is 3.5 mm in diameter, located at Line 6a under Filing Status and Exemptions, and it was to be filled on every 1040T form in the database. P034 is a circle field that is 2.5 mm in diameter, and it was to be left empty on every 1040T form in the database. P034 is the Under age 1 circle associated with the second dependent under Line 6c, List of dependents.
4.2.1 Human Factors
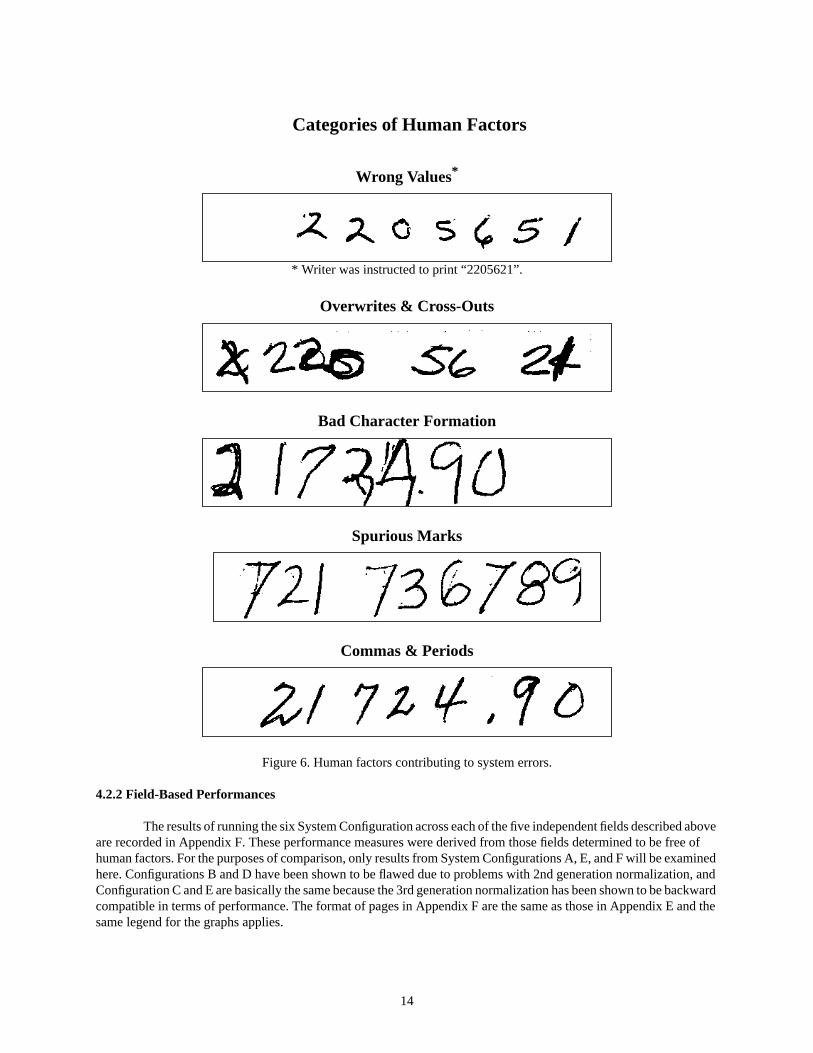
Each one of these five fields was visually verified to match its corresponding Billy or Tina field values across the database of forms. Those fields not correctly entered by the writers were logged and categorized. The resulting cat-egories of human factors are listed in Figure 6. One additional category is a writer leaving a field blank when it required an actual field value. It was observed that writers occasionally transcribed the wrong value onto the forms, crossed out previously printed characters or wrote over top of them, printed radically malformed characters that would challenge any character classifier, left spurious marks in the field such as partial erasures, and provided punctuations in fields where the punctuation was already provided on the form.
A breakdown of human factors across the five selected fields is shown in Appendix G. The first three pages in the appendix include both a table and a graph. For example, the table on page G2 lists the percentage of fields removed from the performance analysis for each category of human factor. The percentages are broken out by form version (P1, P2, and P3). The graph on page G2 plots these percentages with the x-axis representing each category of human factor and the y-axis representing the corresponding percentage of fields removed due to that human factor. The legend for these graphs is the same as the one included at the beginning of Appendix E.
Notice that the P3 version of p060 contains a significantly higher amount of human factors than the P1 and P2 versions of p060. The breakdown of human factors for p045 and p161 are quite different from p060. The plots for each of the form versions for p045 and p161 are relatively uniform with a high percentage of fields left blank. Remem-ber these SSN fields are represented consistently across the form versions, and the fact that the plots are relatively uni-form demonstrates the results shown are reproducible for different writers. Notice the percentage of blank fields for p045 is substantially higher than the percentage of blank fields for p161. It is speculated that the position of these fields on the form is a contributing factor to this phenomena. The density and frequency of entered information in the area surrounding p045 is much lower than the area surrounding p161. Perhaps an increase in local activity on the form also increases a writer’s awareness and focuses his attention.
The impact of human factors on circle fields is documented on the last page of Appendix G. P023 was to be filled on every form, so the primary human factor leading to system errors occurs when the field is left empty by the writer. This occurred 24 times across 550 instances of the p023 field. P034 was to be left empty on every form, so the primary human factor leading to system errors occurs when the field is mistakenly filled in. This occurred only 1 time across the 550 instances of the p034 field.
14
Figure 6. Human factors contributing to system errors.
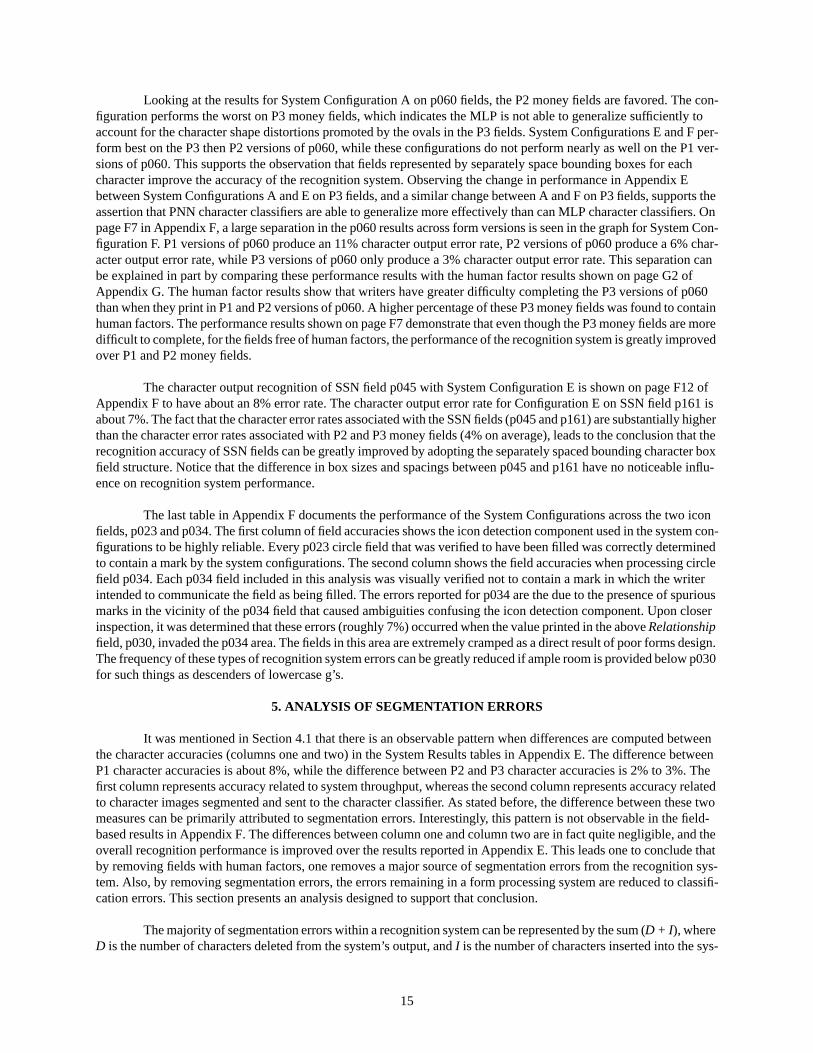
4.2.2 Field-Based Performances
The results of running the six System Configuration across each of the five independent fields described above are recorded in Appendix F. These performance measures were derived from those fields determined to be free of human factors. For the purposes of comparison, only results from System Configurations A, E, and F will be examined here. Configurations B and D have been shown to be flawed due to problems with 2nd generation normalization, and Configuration C and E are basically the same because the 3rd generation normalization has been shown to be backward compatible in terms of performance. The format of pages in Appendix F are the same as those in Appendix E and the same legend for the graphs applies.
Wrong Values*
Overwrites & Cross-Outs
Bad Character Formation
Spurious Marks
Commas & Periods
* Writer was instructed to print “2205621”.
Categories of Human Factors
15
Looking at the results for System Configuration A on p060 fields, the P2 money fields are favored. The con-figuration performs the worst on P3 money fields, which indicates the MLP is not able to generalize sufficiently to account for the character shape distortions promoted by the ovals in the P3 fields. System Configurations E and F per-form best on the P3 then P2 versions of p060, while these configurations do not perform nearly as well on the P1 ver-sions of p060. This supports the observation that fields represented by separately space bounding boxes for each character improve the accuracy of the recognition system. Observing the change in performance in Appendix E between System Configurations A and E on P3 fields, and a similar change between A and F on P3 fields, supports the assertion that PNN character classifiers are able to generalize more effectively than can MLP character classifiers. On page F7 in Appendix F, a large separation in the p060 results across form versions is seen in the graph for System Con-figuration F. P1 versions of p060 produce an 11% character output error rate, P2 versions of p060 produce a 6% char-acter output error rate, while P3 versions of p060 only produce a 3% character output error rate. This separation can be explained in part by comparing these performance results with the human factor results shown on page G2 of Appendix G. The human factor results show that writers have greater difficulty completing the P3 versions of p060 than when they print in P1 and P2 versions of p060. A higher percentage of these P3 money fields was found to contain human factors. The performance results shown on page F7 demonstrate that even though the P3 money fields are more difficult to complete, for the fields free of human factors, the performance of the recognition system is greatly improved over P1 and P2 money fields.
The character output recognition of SSN field p045 with System Configuration E is shown on page F12 of Appendix F to have about an 8% error rate. The character output error rate for Configuration E on SSN field p161 is about 7%. The fact that the character error rates associated with the SSN fields (p045 and p161) are substantially higher than the character error rates associated with P2 and P3 money fields (4% on average), leads to the conclusion that the recognition accuracy of SSN fields can be greatly improved by adopting the separately spaced bounding character box field structure. Notice that the difference in box sizes and spacings between p045 and p161 have no noticeable influ-ence on recognition system performance.
The last table in Appendix F documents the performance of the System Configurations across the two icon fields, p023 and p034. The first column of field accuracies shows the icon detection component used in the system con-figurations to be highly reliable. Every p023 circle field that was verified to have been filled was correctly determined to contain a mark by the system configurations. The second column shows the field accuracies when processing circle field p034. Each p034 field included in this analysis was visually verified not to contain a mark in which the writer intended to communicate the field as being filled. The errors reported for p034 are the due to the presence of spurious marks in the vicinity of the p034 field that caused ambiguities confusing the icon detection component. Upon closer inspection, it was determined that these errors (roughly 7%) occurred when the value printed in the above Relationship field, p030, invaded the p034 area. The fields in this area are extremely cramped as a direct result of poor forms design. The frequency of these types of recognition system errors can be greatly reduced if ample room is provided below p030 for such things as descenders of lowercase g’s.
5. ANALYSIS OF SEGMENTATION ERRORS
It was mentioned in Section 4.1 that there is an observable pattern when differences are computed between the character accuracies (columns one and two) in the System Results tables in Appendix E. The difference between P1 character accuracies is about 8%, while the difference between P2 and P3 character accuracies is 2% to 3%. The first column represents accuracy related to system throughput, whereas the second column represents accuracy related to character images segmented and sent to the character classifier. As stated before, the difference between these two measures can be primarily attributed to segmentation errors. Interestingly, this pattern is not observable in the field-based results in Appendix F. The differences between column one and column two are in fact quite negligible, and the overall recognition performance is improved over the results reported in Appendix E. This leads one to conclude that by removing fields with human factors, one removes a major source of segmentation errors from the recognition sys-tem. Also, by removing segmentation errors, the errors remaining in a form processing system are reduced to classifi-cation errors. This section presents an analysis designed to support that conclusion.
The majority of segmentation errors within a recognition system can be represented by the sum (D + I), where D is the number of characters deleted from the system’s output, and I is the number of characters inserted into the sys-

16
tem’s output. Deletions frequently occur when two characters are segmented as a single image and classified as a single character. This is known as merging. Insertions frequently occur when a character is segmented into two separate images, and each image is classified separately. This is known as splitting. The NIST Scoring Package is capable of accumulating the number of deleted and inserted characters produced by a recognition system. The number of deleted and inserted characters was tallied for System Configurations E and F and the results are recorded in Appendix H.
Results are reported in separate tables for overall float and integer fields and for the independent fields (p060, p045, and p161). For example, the first table on page H1 lists the number of deleted and inserted characters in columns one and two obtained with System Configuration E processing float fields. The third column in the table lists the num-ber of reference characters computed from the Billy and Tina money field values. The fourth column represents a per-centage of segmentation errors (D+I)/R, where the number of deleted and inserted characters are added together and normalized by dividing the sum by the number of reference characters in the corresponding form version set (P1, P2, and P3).
Notice that the segmentation errors for money fields are lower for P2 and P3 versions than they are for P1 versions. System Configuration E achieves a segmentation error rate of about 9% on P2 money fields, 10% on P3 money fields, while achieving a 14% segmentation error rate on P1 money fields. Similar results are shown for System Configuration F when processing float fields. The segmentation error rates for integer fields are much higher with an average of 21% for System Configuration E and 20% for Configuration F. Compare these results to those tabulated for the independent fields (p060, p045, and p161). P1 versions of p060 produce a higher segmentation error over P2 and P3 versions of p060. This is especially true for System Configuration F where the segmentation error rate achieved on P1 versions of p060 is about 4%, P2 versions is 0.4%, and P3 versions is 0.2%. This difference in segmentation error rate is due to the blob segmentor being used on P1 money fields, and the cut segmentor being used on P2 and P3 money fields.
The segmentation error rate for System Configurations E and F on p060 is significantly lower than that shown for overall performance across all float fields. This difference is a result of removing fields containing human factors from the p060 analysis. This is true for the SSN fields as well. System Configurations E on SSN field p045 achieves a segmentation error rate of 2% and Configuration F achieves an error rate of 0.2%. System Configurations E on p161 achieves a segmentation error rate of about 2% and Configuration F achieves an error rate of 0.1%. Once again the cut segmentor in Configuration F is outperforming the blob segmentor in Configuration E.
The last table on pages H2 and H4 summarize the analysis in this section. The overall segmentation error rates reported for the float and integer fields contain errors due to human factors and other system factors. The independent field segmentation error rates are computed across fields that have been verified not to contain human factors. There-fore, the independent field results (p060, p045, and p161) represent errors from sources other than human factors. By subtracting the two sets of result, the amount of segmentation error cased by human factors can be calculated. These differences are listed in the two summary tables entitled Errors Due to Human Factors. For example, the value of 9.85% in the table for System Configuration E is computed by subtracting p060’s P1 result of 4.31% from the float field’s P1 result of 14.16%. The percentages of error between these two summary tables are quite similar, which sup-ports the conclusion that the segmentation errors due to human factors are not dependent on System Configuration, but rather they are dependent on form design as related to field representation on the form.
This analysis demonstrates that the major cause of segmentation errors is human factors, and that segmenta-tion errors are reduced when using fields comprised of separately spaced character boxes like those used for money fields on P2 and P3 forms. In the case of P2 and P3 versions of p060, System Configurations E and F perform compa-rably to the COCR Conference results when fields containing human factors were removed. This is supported by the fact that the differences between the two character accuracy columns from the tables in Appendix F are minimal. This demonstrates that the errors made by a form processing system can be reduced to classification errors if human factors are effectively handled. These results also show the field markings used to represent P2 and P3 money fields provide superior machine readability over fields containing vertical ticks and adjoining character boxes. Not only are segmen-tation errors reduced, but classification is improved by using these field markings. System Configuration F’s character decision error is about 9% on p045 fields and 7% on p161 fields, whereas Configuration F’s character decision error on P2 versions of p060 fields is 6% and P3 versions of p060 is only 3%. Due to consistencies exhibited across System
17
Configurations and form versions within control groups of fields, one can expect a similar gain in system performance if all fields on a form, including alpha and integer fields, are represented using separately spaced bounding boxes for each character in a field. These results show that the rates of both segmentation errors and classification errors are reduced when using the types of fields representing P2 and P3 money amounts.
6. CONCLUSIONS
In conclusion, an extensive study of three versions (P1, P2, and P3) of a redesigned IRS tax form has been presented. Six different configurations of the NIST Model Recognition System were used in conjunction with the NIST Scoring Package to generate performance measures at the form, field, and character levels. The analyses of these mea-sures conclude that factors introduced onto forms by the writer are the primary cause of segmentation errors, which are the major source of errors within the recognition system. These human factors include writers leaving a field blank when it required an actual field value, transcribing the wrong value into the field, crossing out previously printed char-acters or writing over top of them, printing radically malformed characters that would challenge any character classifier including a human, leaving spurious marks in the field such as partial erasures, and printing punctuations in a field where the punctuation is already provided on the form. This paper cites three ways in which these types of human fac-tors can be handled so as to increase recognition system performance. First, the algorithms and techniques deployed within the system can be improved. Second, the instances of human factors leading to system errors can be detected. Third, writers can be influenced by the design of the form including the layout and structure of the fields. By applying a combination of these three approaches, human factors can be dealt with, and the errors made by a form processing system can be effectively reduced to classification errors. The analyses in this paper show this to be true for fields con-taining digits, and similar results are expected when applied to alphabetic fields.
The analyses in this report demonstrate that up to 97% of segmentation errors are caused by human factors, and that segmentation errors can be reduced by as much as 43% when using fields comprised of separately spaced char-acter boxes like those used for money fields on P2 and P3 forms. After fields containing human factors were removed from the performance analysis, one system configuration demonstrated a character classification error rate on a P3 money field to be 6% lower than the same classifier’s error rate on an SSN field. This shows that classification errors in addition to segmentation errors are reduced when fields are represented by separately spaced character boxes. To achieve optimal performance using the recognition system components incorporated in the NIST Model Recognition System, every field containing handprinted character data on a form should be represented by field markings similar to those used for P2 and P3 money fields on the 1040T forms. Note that the P3 money fields achieved better recognition after fields containing human factors leading to system errors were removed. However, the P3 money fields contained a higher percentage of human factors resulting in more fields being rejected which results in a lower rate of automated throughput. Also, the recognition of P3 money fields was better than P2 money fields when the PNN character classifier was used. The MLP classifier was unable to handle the change in character shapes promoted by the stacked ovals within the P3 character boxes. Other types of character classifiers may be negatively influenced as well. Therefore, the use of P2 money field markings may be more desirable.
Several system components were developed as a result of this study. A form registration component was suc-cessfully created that uses the Correlated Run Length Algorithm (CURL) to locate registration marks on the form. A new spatial normalizer was developed that is tolerant of extraneous noise in a segmented character image. Also, a new cut segmentor was developed. An analysis of segmentation errors showed that segmenting a field based on cutting along inter-character markings provided on the form outperforms segmenting a field based on connected component labeling. The results of this study also confirm that PNN classifiers provide greater generalization and accuracy than MLP character classifiers. Accuracy is gained at the expense of processing time. The MLP-based system configura-tions took approximately 2 minutes to process each side of a form, whereas the PNN-based systems required approx-imately 4 minutes per side. All six system configurations were supported by a Massively Parallel DAP 510c connected to a Sun Microsystems 4/470.
A few lessons were learned as a result of this study. A number of pages of 1040T forms were not included in the performance analysis because of occluded registration marks. These occlusions were introduced by the form’s identification sticker being placed over a significant portion of a registration mark, or a handprinted edit being placed in the proximity of the registration mark. It is imperative that the area surrounding a critical form element such as a

18
registration mark or a bar code be free of any other information. One page of a 1040T form not included in the database failed form removal due to a scale distortion in the printing of the form. This emphasizes the need for strict quality control when forms are printed. The performance of automated form processing systems is jeopardized by a lack of strict control over printing specifications. Originally, a set of landscape-oriented 1040T forms were to be included in this study. These forms were designed with field markings printed in red ink. Unfortunately, this ink was not able to be dropped out based on experiments conducted at NIST on a Fujitsu 3096G scanner and at IRS on a Kodak Imagelink 900D scanner. Current scanner technology uses photoreceptors whose peak response occurs within the red spectrum. In order to alleviate these problems in the future, it is recommended that red inks be avoided when choosing drop-out colors. The performance results reported on circle field p034 show the effect of providing inadequate spacing between fields. Of the p034 circle fields verified not to contain a mark intended to communicate the field as being filled, 7% were incorrectly determined to be filled in. These errors occurred when the value printed in the field above invaded the circle field. The frequency of these types of recognition system errors can be greatly reduced if ample room is provided between fields.
Two final recommendations are in order. First, the use of drop-out inks greatly reduces the complexity of form removal. It is recommended that as much form information as possible be printed in drop-out ink. This includes all borders, lines, headings, instructions, and field markings. Ideally, the only information not printed in drop-out ink are critical form elements such as registration marks, bar codes, and form identification numbers. Second, field markings should be consistent for all the fields of the same type. This includes the type of marks (lines, ticks, boxes, etc.) along with their size, spacing, and starting offsets. Small variations in these attributes do nothing to improve the machine readability of the field and only complicate the implementation of recognition system components.
As a general conclusion, this study suggests that human factors are the major cause of segmentation errors, and segmentation errors are a primary contributor to errors made by form processing systems. These human factors can be handled by improving algorithms and techniques, by detecting fields which contain these factors, and by rede-signing forms. All three of these approaches have been applied in this study, demonstrating that dramatic improve-ments in recognition system performance are achievable.
19
7. REFERENCES
1. C. L. Wilson, R. A. Wilkinson, and M. D. Garris. Self-Organizing Neural Network Character Recognition on a Massively Parallel Computer. In the Proceedings of International Joint Conference on Neural Networks, Vol. II, pp. 325-329, IEEE and International Neural Network Society, June 1990.
2. M. D. Garris, R. A. Wilkinson, and C. L. Wilson. Analysis of Biologically Motivated Neural Network for Char-acter Recognition. In Proceedings: Analysis of Neural Network Applications, pp. 160-175, ACM Press, May 1991.
3. M. D. Garris, R. A. Wilkinson, C. L. Wilson. Methods for Enhancing Neural Network Handwritten Character Recognition. In Proceedings of International Joint Conference on Neural Networks, Vol. I, pp. 695-700, IEEE and International Neural Network Society, July 1991.
4. R. A. Wilkinson. Segmenting of Text Images with Massively Parallel Machines. In Intelligent Robots and Com-puter Vision, Vol. 1607, pp. 312-323, SPIE, Boston, 1991.
5. C. L. Wilson and J. L. Blue. Neural Network Methods Applied to Character Recognition. Social Science Com-puter Review. Vol. 10, pp. 173-195, Duke University Press, 1992.
6. J. L. Blue and P. J. Grother. Training Feed Forward Networks Using Conjugate Gradient. In Conference on Character Recognition and Digitizer Technologies, Vol. 1661, pp. 179-190, SPIE, San Jose, February 1992.
7. M. D. Garris and C. L. Wilson. A Neural Approach to Concurrent Character Segmentation and Recognition. In Southcon 92 Conference Record, pp. 154-159, IEEE, Orlando, March 1992.
8. M. D. Garris. A Platform for Evolving Genetic Automata for Text Segmentation (GNATS). In Science of Arti-ficial Neural Networks, Vol. 1710, pp. 714-724, SPIE, Orlando, April 1992.
9. C. L. Wilson. FAUST: a Vision Based Neural Network Multi-Map Pattern Recognition Architecture. In Pro-ceedings: Science of Artificial Neural Networks, Vol. 1710, pp. 425-436, SPIE, Orlando, April 1992.
10. O. M. Omidvar and C. L. Wilson. Optimization of Adaptive Resonance Theory Network with Boltzmann. In Science of Artificial Neural Networks II, Vol. 1966, SPIE, Orlando 1992.
11. M. D. Garris and C. L. Wilson. Reject Mechanisms for Massively Parallel Neural Network Character Recog-nition Systems. In Neural and Stochastic Methods in Image and Signal Processing, Vol. 1766, pp. 413-424, SPIE, San Diego, 1992.
12. O. M. Omidvar and C. L. Wilson. Optimization of Neural Network Topology and Information Content Using Boltzmann Methods. In Proceedings of International Joint Conference on Neural Networks, Vol. IV, pp. 594-599, IEEE and International Neural Network Society, June 1992.
13. C. L. Wilson. Massively Parallel Neural Network Recognition. In the Proceedings of International Joint Con-ference on Neural Networks, Vol. III, pp. 227-232, IEEE and International Neural Network Society, June 1992.
14. O. M. Omidvar and C. L. Wilson. Topological Separation Versus Weight Sharing in Neural Network Optimi-zation. In Neural and Stochastic Methods in Image and Signal Processing, Vol. 1766, pp. 468-479, SPIE, San Diego 1992.
15. R. A. Wilkinson and M. D. Garris. Comparison of Massively Parallel Handprint Segmentors. In Intelligent Robots and Computer Vision: Algorithms, Techniques, and Active Vision, Vol. 1825, SPIE, Boston, 1992.
16. C. L. Wilson. Effectiveness of Feature and Classifier Algorithms in Character Recognition Systems. In Pro-ceedings: Character Recognition Technologies, Vol. 1906, pp. 255-266, SPIE, San Jose, 1993.
17. C. L. Wilson. Statistical Analysis of Information Content for Training Pattern Recognition Networks. In Pro-ceedings: Applications of Artificial Neural Networks IV, Vol. 1965, pp. 621-632, SPIE, April 1993.
18.C.L.Wilson, R. A. Wilkinson, and M.D.Garris. Self-Organizing Neural Network Character Recognition Using Adaptive Filtering and Feature Extraction. Progress in Neural Networks, Vol. 3, to be published, 1993.
19. O. M. Omidvar and C. L. Wilson. Information Content in Neural Net Optimization. Journal of Connection Science, to be published 1993.
20. C. L. Wilson. A New Self-Organizing Neural Network Architecture for Parallel Multi-Map Pattern Recogni-tion - FAUST. Progress in Neural Networks, Vol. 4, to be published 1994.
21. M. D. Garris, C. L. Wilson, J. L. Blue, G. T. Candela, P. Grother, S. Janet, and R. A. Wilkinson. Massively parallel implementation of character recognition systems. In Conference on Character Recognition and Digitizer Tech-nologies, Vol. 1661, pp. 269-280, SPIE, San Jose, February 1992.
22. M. D. Garris and S. A. Janet. Scoring Package Release 1.0, Technical Report Special Software 1, SP, National Institute of Standards and Technology, October 1992.
23. M. D. Garris and S. A. Janet. NIST Scoring Package User’s Guide, Release 1.0. Technical Report NISTIR 4950, National Institute of Standards and Technology, October 1992.
20
24. M. D. Garris. Methods for Evaluating the Performance of Systems Intended to Recognize Characters from Image Data Scanned from Forms. Technical Report NISTIR 5129, National Institute of Standards and Technology, February 1993.
25. M. D. Garris, NIST Scoring Package Certification Procedures in Conjunction with NIST Special Databases 2 and 6. Technical Report NISTIR 5173, National Institute of Standards and Technology, April 1993
26. M. D. Garris. NIST Scoring Package Cross-Reference for use with NIST Internal Reports 4950 and 5129. Technical Report NISTIR 5249, National Institute of Standards and Technology, August 1993.
27. C. L. Wilson, R. A. Wilkinson, and M. D. Garris, “Self-Organizing Neural Network Character Recognition on a Massively Parallel Computer,” International Joint Conference on Neural Networks, Vol. II, pp. 325-329, San Diego, 1988.
28. K. Fukushima, T. Imagawa, and E. Ashida, “Character Recognition with Selective Attention,” International Joint Conference on Neural Networks, Vol. I, pp. 593-598, Seattle, 1991.
29. G. E. Hinton, and C. K. I. Williams, “Adaptive Elastic Models for Handprinted Character Recognition,” Advances in Neural Information Processing Systems, R. Lippmann, Vol. IV, pp. 512-519, Denver, 1991.
30. L. D. Jackel, H. P. Graf, W. Hubbard, J. S. Densker, D. Henderson, and Isabelle Guyon, “An Application of Neural Net Chips: Handwritten Digit Recognition,” International Joint Conference on Neural Networks, Vol. II, pp. 107-115, San Diego, 1988.
31. G. L. Martin and J. A. Pittman, “Recognizing Handprinted Letters and Digits,” Advances in Neural Informa-tion Processing Systems, D. S. Touretzky, Vol. 2, pp. 405-414, Morgan Kaufmann, Denver, 1989.
32. R. A. Wilkinson, et al. The first Census Optical Character Recognition System Conference. Technical Report NISTIR 4912, National Institute of Standards and Technology, July 1992.
33. C. L. Wilson and M. D. Garris, “Handprinted Character Database,” NIST Special Database 1, HWDB, April 18, 1990.
34. M. D. Garris. Design and Collection of a Handwriting Sample Image Database, Social Science Computing Journal, Vol. 10, pp. 196-214, Duke University Press, 1992.
35. M. D. Garris, Design, Collection, and Analysis of Handwriting Sample Image Databases, Encyclopedia of Computer Science, to be published, 1994.
36. D. E. Rumelhart, G. E. Hinton, and R. J. Williams, Learning Internal Representations by Error Propagation, Parallel Distributed Processing: Explorations in the Microstructure of Cognition, D. E. Rumelhart, J. L. McClelland, et al., Volume 1: Foundations, pp. 318-362, MIT Press, Cambridge, 1986.
37. M. F. Moller, A Scaled Conjugate Gradient Algorithm for Fast Supervised Learning, Technical Report PB-339, Aarhus University, 1990.
38. Donald F. Specht. Probabilistic Neural Networks. Neural Networks, Vol. 3(1), pp 109-119, 1990.39. C. L. Wilson. Evaluation of Character Recognition Systems. In Neural Networks for Signal Processing III, pp.
485-496, IEEE, New York, September 1993.40. J. L. Blue, B. T. Candela, P. J. Grother, R. Chellappa, and C. L. Wilson. Evaluation of Pattern Classifiers for
Fingerprint and OCR Applications. Pattern Recognition, to be published.41. D. L. Dimmick, M. D. Garris, and C. L. Wilson. Structured Forms Database. Technical Report Special Data-
base 2, SFRS, National Institute of Standards and Technology, December 1991.42. D. L. Dimmick and M. D. Garris. Structured Forms Database 2. Technical Report Special Database 6, SFRS2,
National Institute of Standards and Technology, September 1992.43. M. D. Garris and R. A. Wilkinson. Handwritten segmented characters database. Technical Report Special
Database 3, HWSC, National Institute of Standards and Technology, February 1992.44. R. A. Wilkinson, M. D. Garris, J. Geist. Machine-Assisted Human Classification of Segmented Characters for
OCR Testing and Training. In Proceedings: Character Recognition Technologies, Vol. 1906, pp. 208-217. SPIE, San Jose, 1993.
45. R. A. Wilkinson. Handprinted Segmented Characters Database. Technical Report Test Database 1, TST1, National Institute of Standards and Technology, October 1992.
46. H. P. Graf, C. Nohl, and J. Ben. Image Segmentation with Networks of Variable Scale. Advances in Neural Information Processing Systems, Vol. IV, pp. 480-487. Morgan Kaufmann, Denver, December 1991.
47. G. L. Martin. Centered-object Integrated Segmentation and Recognition for Visual Character Recognition. Advances in Neural Information Processing Systems, Vol. IV, pp. 504-511. Morgan Kaufmann, Denver, December 1991.
21
48. J. D. Keeler and D. E. Rumelhart. Self-organizing Segmentation and Recognition Neural Network. Advances in Neural Information Processing Systems, Vol. IV, pp. 496-503. Morgan Kaufmann, Denver, December 1991.
49. H. G. Zwakenberg. Inexact Alphanumeric Comparison. The C Users Journal, pp. 127-131. May 1991.50. P. M. Flanders, R. L. Hellier, H. D. Jenkins, C. J. Pavelin, and S. Van Den Berghe; Efficient High-Level Pro-
gramming on the AMT DAP; IEEE Proceedings: Special Issue on Massively Parallel Computers, Vol. 79(4), pp. 524-536, April 1991.
51. C. R. Wyle. Advanced Engineering Mathematics, Second Edition, pp. 175-179, McGraw-Hill, New York, 1960
52. Anil K. Jain. Fundamentals of Digital Image Processing, pp. 384-389, Prentice-Hall, New Jersey, 1989.53. P. J. Grother. Karhunen Loeve feature extraction for neural handwritten character recognition. In Proceedings:
Applications of Artificial Neural Networks III, Vol. 1709, pp. 155-166. SPIE, Orlando, April 1992.54. W. H. Press, B. P. Flannery, S. A. Teukolsky, and W. T. Vetterling. Numerical Recipes, The Art of Scientific
Computing (FORTRAN Version). pp. 349-363, Cambridge University Press, Cambridge, 1989.55. I. Guyon, V. N. Vapnik, B. E. Boser, L. Y. Bottou, and S. A. Solla, “Structural Risk Minimization for Character
Recognition,” Advances in Neural Information Processing Systems, R. Lippmann, Vol. IV, pp. 471-479, Denver, 1991.56. P. J. Grother and G. T. Candela. Comparison of Handprinted Digit Classifiers. Technical Report NISTIR 5209,
National Institute of Standards and Technology, June 1993.

22

A1
APPENDIX A. 1040T FORMS

A2
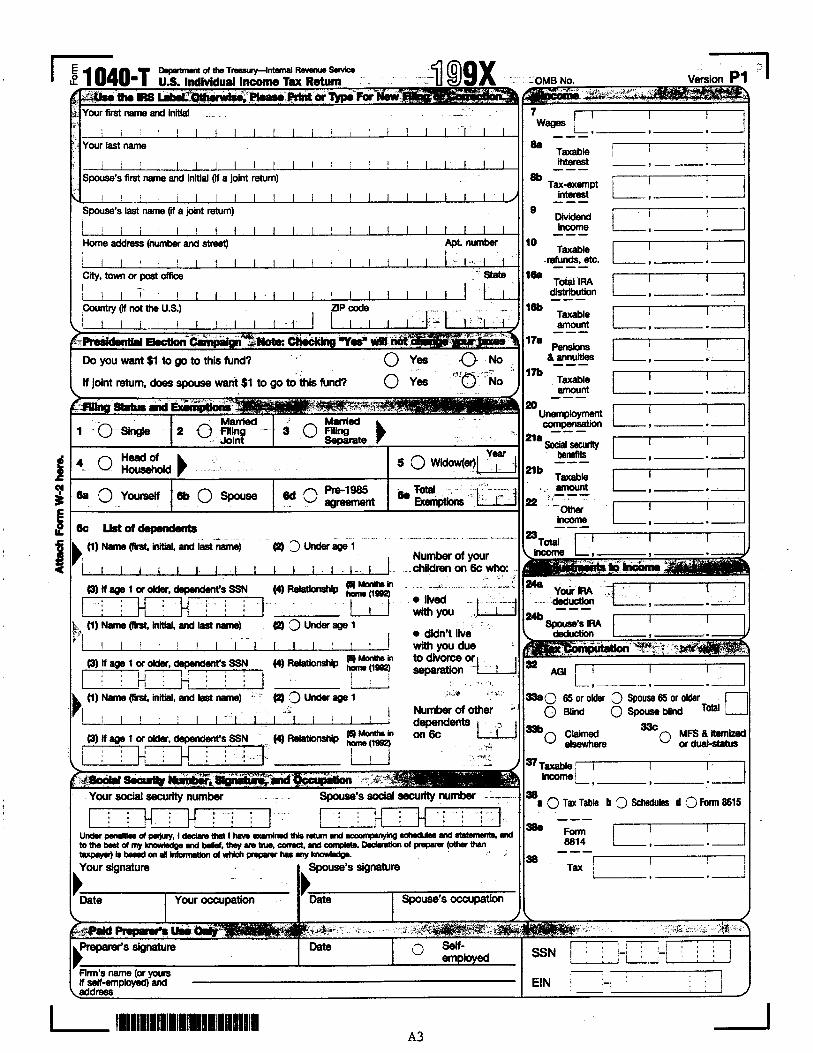
*** P1 Page 1 Here ***

*** P1 Page 2 Here ***
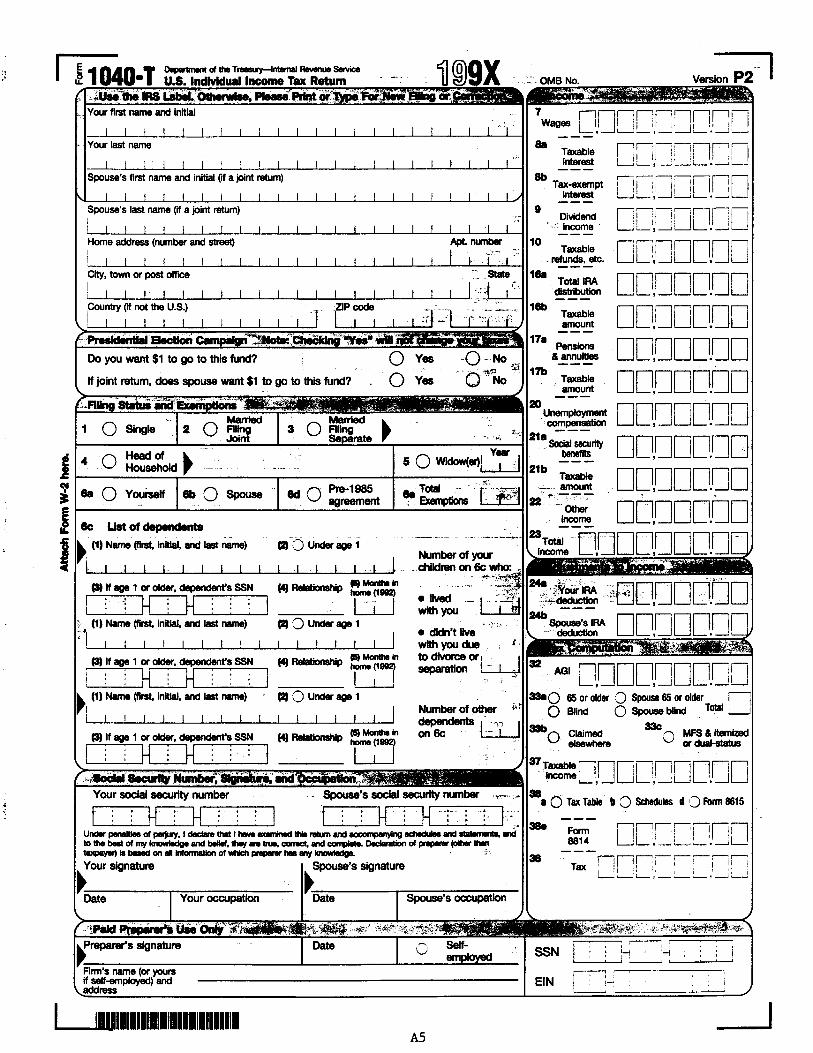
*** P2 Page 1 Here ***

*** P2 Page 2 Here ***

*** P3 Page 1 Here ***

*** P3 Page 2 Here ***

B1
APPENDIX B. BILLY AND TINA REFERENCE SETS

B2

(027)
(029)
(033)
(035)
(039)
(041)
(001)
(002)
(003)
(004)
(005)
(007)
(009) (010)
(008)
(006)
(011)
(013)
(012)
(014)
(015) (016) (017) (018)
(019) (020) (021) (022)
(023) (024) (025) (026)
(28)
(030) (031) (032)(34)
(038)(036) (037)
(40)
(044)
(042) (043)
(045) (046)
(047) (048)
(049) (050) (051) (052)
(053) (054) (055)(056)
(057)
(058)
(059)
(060)
(061)
(062)
(063)
(064)
(065)
(066)
(067)
(068)
(069)
(070)
(071)
(072)
(073)
(074)
(075)
(076)
(77)(79)
(78)(80) (081)
(082) (083)
(084)
(85) (86) (87)
(088)
(089)
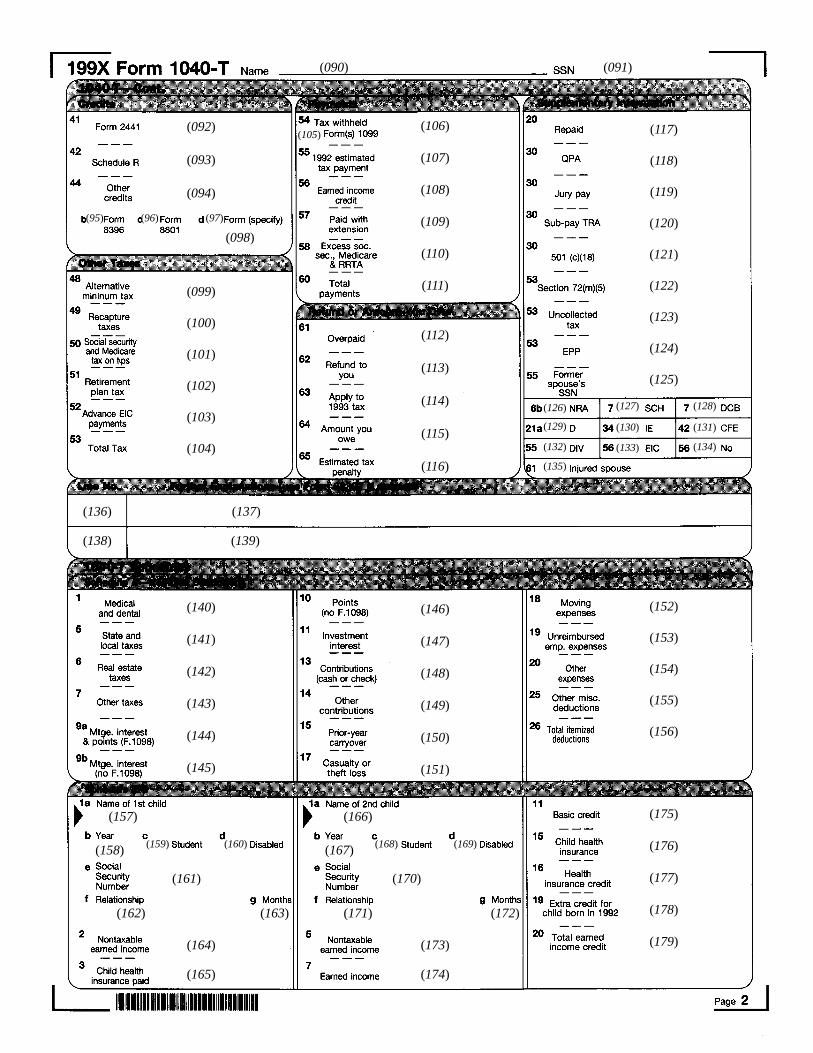
(138) (139)
(092)
(093)
(094)
(95) (96) (97)
(098)
(099)
(100)
(101)
(102)
(103)
(104)
(106)(105)
(107)
(108)
(109)
(110)
(111)
(112)
(113)
(114)
(115)
(116)
(117)
(118)
(119)
(120)
(121)
(122)
(123)
(124)
(125)
(126) (127) (128)
(129)
(132)
(135)
(130)
(133) (134)
(131)
(136) (137)
(140)
(141)
(142)
(143)
(144)
(145)
(146)
(147)
(148)
(149)
(150)
(151)
(152)
(153)
(154)
(155)
(156)
(157) (166)
(158) (167)(159) (160) (168) (169)
(161)
(162) (163)
(164)
(165)
(170)
(171) (172)
(173)
(174)
(175)
(176)
(177)
(178)
(179)
(090) (091)

B5
Billy Set, Page 1:
p001 Billy Jop002 Doep003 Bobby Rayp004 Doep005 7113 West Drivep006p007 Onetownp008 TNp009p010 37814p011 0p012 1p013 1p014 0p015 0p016 1p017 0p018p019 0p020p021 0p022p023 1p024 1p025 0p026 04p027 Sam Doep028 0p029 721736789p030 Daughterp031 12p032 02p033 Randy Doep034 0p035 789123456p036 Sonp037 12p038p039p040 0p041p042p043p044p045 222222222
p046 271123456p047 0p048 0p049p050p051p052p053 0p054p055 0p056p057p058p059p060 2205621p061 2312p062p063 7529p064p065p066p067p068p069p070p071p072p073 2215462p074 25000p075 30000p076 2160462p077 0p078 0p079 0p080 0p081p082 0p083 0p084 640462p085 1p086 0p087 0p088p089 96400
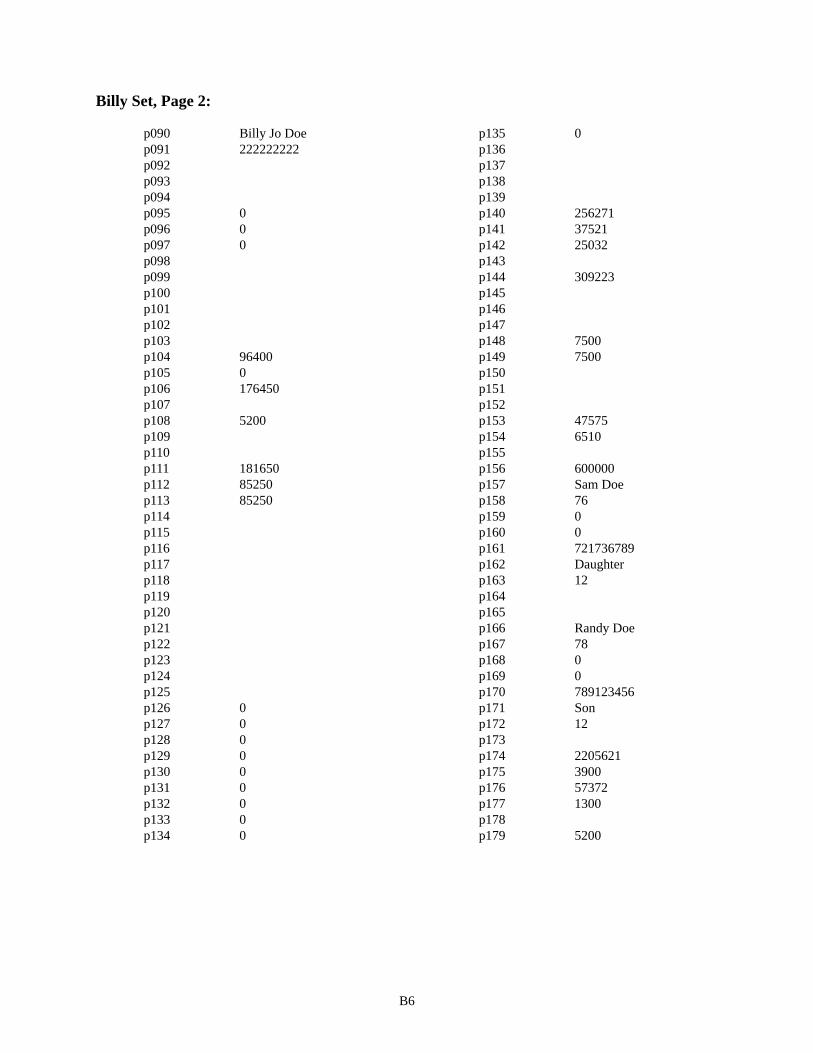
B6
Billy Set, Page 2:
p090 Billy Jo Doep091 222222222p092p093p094p095 0p096 0p097 0p098p099p100p101p102p103p104 96400p105 0p106 176450p107p108 5200p109p110p111 181650p112 85250p113 85250p114p115p116p117p118p119p120p121p122p123p124p125p126 0p127 0p128 0p129 0p130 0p131 0p132 0p133 0p134 0
p135 0p136p137p138p139p140 256271p141 37521p142 25032p143p144 309223 p145p146p147p148 7500p149 7500p150p151p152p153 47575p154 6510p155p156 600000p157 Sam Doep158 76p159 0p160 0p161 721736789p162 Daughterp163 12p164p165p166 Randy Doep167 78p168 0p169 0p170 789123456p171 Sonp172 12p173p174 2205621p175 3900p176 57372p177 1300p178p179 5200
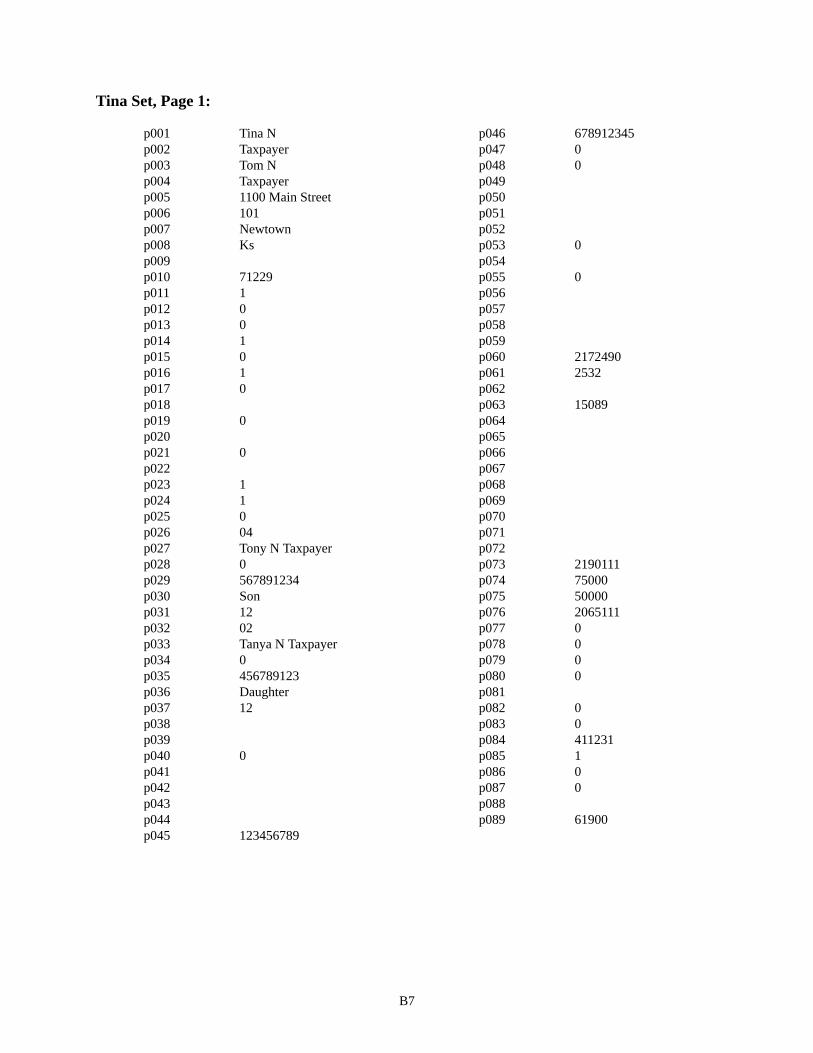
B7
Tina Set, Page 1:
p001 Tina Np002 Taxpayerp003 Tom Np004 Taxpayerp005 1100 Main Streetp006 101p007 Newtownp008 Ksp009p010 71229p011 1p012 0p013 0p014 1p015 0p016 1p017 0p018p019 0p020p021 0p022p023 1p024 1p025 0p026 04p027 Tony N Taxpayerp028 0p029 567891234p030 Sonp031 12p032 02p033 Tanya N Taxpayerp034 0p035 456789123p036 Daughterp037 12p038p039p040 0p041p042p043p044p045 123456789
p046 678912345p047 0p048 0p049p050p051p052p053 0p054p055 0p056p057p058p059p060 2172490p061 2532p062p063 15089p064p065p066p067p068p069p070p071p072p073 2190111p074 75000p075 50000p076 2065111p077 0p078 0p079 0p080 0p081p082 0p083 0p084 411231p085 1p086 0p087 0p088p089 61900
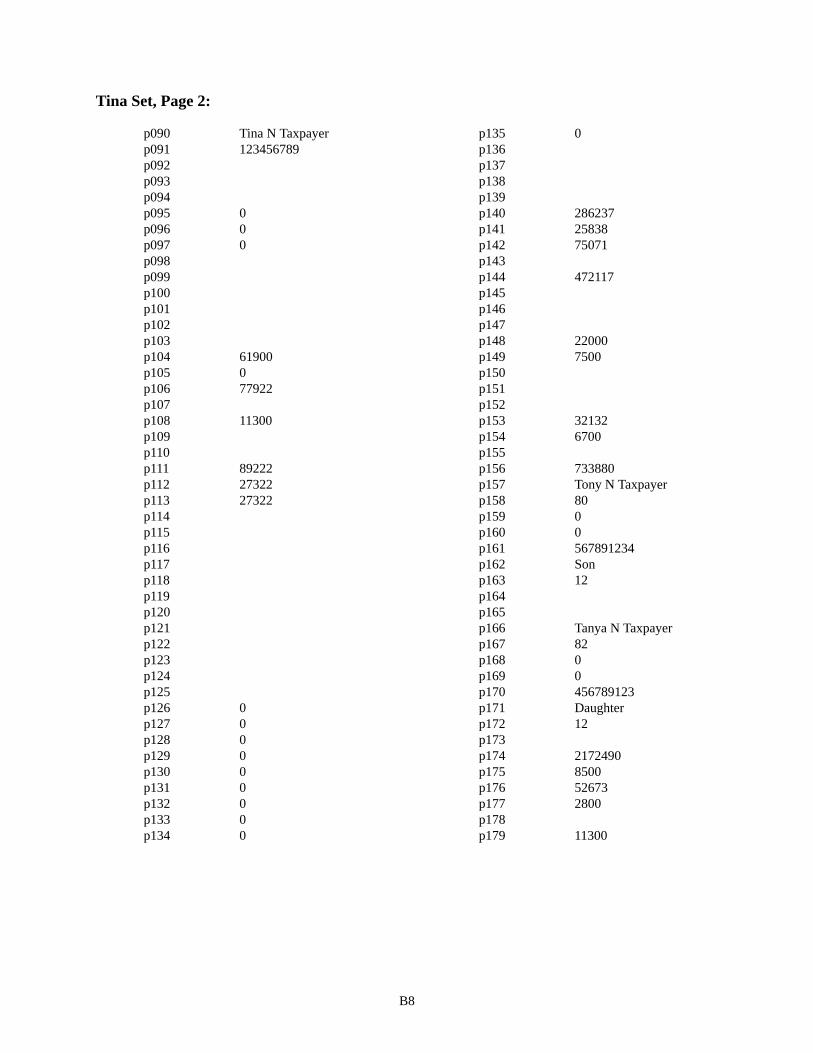
B8
Tina Set, Page 2:
p090 Tina N Taxpayerp091 123456789p092p093p094p095 0p096 0p097 0p098p099p100p101p102p103p104 61900p105 0p106 77922p107p108 11300p109p110p111 89222p112 27322p113 27322p114p115p116p117p118p119p120p121p122p123p124p125p126 0p127 0p128 0p129 0p130 0p131 0p132 0p133 0p134 0
p135 0p136p137p138p139p140 286237p141 25838p142 75071p143p144 472117p145p146p147p148 22000p149 7500p150p151p152p153 32132p154 6700p155p156 733880p157 Tony N Taxpayerp158 80p159 0p160 0p161 567891234p162 Sonp163 12p164p165p166 Tanya N Taxpayerp167 82p168 0p169 0p170 456789123p171 Daughterp172 12p173p174 2172490p175 8500p176 52673p177 2800p178p179 11300

C1
APPENDIX C. NIST SCORING PACKAGE
Application requirements germane to a specific automated character recognition problem are embodied in a representative set of referenced images. Associated with each reference image is the ASCII textual information that is to be recognized in the image. NIST has produced several referenced image databases of digitized forms through the sponsorship of the Bureaus of the Census and IRS which are available to the public and distributed through NIST’s Standard Reference Data Division on CD-ROM. NIST Special Database 1 (SD1)33-35 contains 2,100 digitized pages of a handprint collected on forms completed by 2,100 different writers geographically distributed across the United States. Each full-page image in the database is a form comprised of 33 entry fields. Each entry field is demarcated by a separate box on the form. These fields include 28 numeric fields totalling 130 handprinted digits, 1 alphabetic field containing the 26 lower-case letters, 1 alphabetic field containing the 26 upper-case letters, and a text paragraph field containing the first sentence from the Preamble to the Constitution of the United States. NIST Special Database 2 (SD2)41 contains 5,590 digitized tax forms from the IRS 1040 Package X for the year 1988 completed with machine-print. These include Forms 1040, 2106, 2441, 4562, and 6251 together with Schedules A, B, C, D, E, F, and SE. NIST Special Database 6 (SD6)42 contains 5,595 digitized tax forms from the same list completed with handprint. The infor-mation provided on these images of tax forms was generated by a computer and does not represent real people or real tax data.
Two other referenced databases are available to the public from NIST. They contain images of isolated char-acters that are useful for testing in isolation the character classification components of full-scale recognition systems. NIST Special Database 3 (SD3)43 contains 313,389 images of segmented characters from the 2,100 writers in SD1. SD3 is comprised of 223,125 digits, 44,951 upper-case letters, and 45,313 lower-case letters. These images have been verified to contain correctly segmented characters and do not include images of split and merge characters.44 Associ-ated with every character image in this database is a reference value specifying the class of the character in the image. A second character image database, NIST Special Database 7 (SD7)45, is intended primarily for testing handprint char-acter classifiers. SD7 contains handprint from 500 writers and has approximately 83,000 isolated character images including 59,000 digits and 24,000 upper-case and lower-case letters. Because SD7 is a testing database, the reference classifications for each character image are distributed on floppy disk separately from the character images that are distributed on CD-ROM.
The reference information in these databases serve as ground truth for measuring recognition performance. The images are presented to a recognition system, and the system’s results are returned. This includes hypothesized text of what the system located and recognized. The Scoring Package reconciles the hypothesized text with the refer-ence text, accumulating statistics used to compute performance measures. Figure C.1 illustrates the use of referenced images and the Scoring Package to assess the performance of a recognition system. For this study, the application is represented by the images of the 1,119 pages of 1040T forms, and the Billy and Tina field values are used as ground truth to score recognition system results.
Figure C.1. Testing paradigm for recognition systems using referenced images and the Scoring Package.
ReferencedImage Database
Recognition
System
ScoringPackage
Form Images Hypothesized Strings
Reference Strings
Performance Analysis
C2
The model in Figure C.1 has several advantages. First, knowledge of the internal details of a system being tested is not required. This is critical when testing systems comprised of proprietary functional components. Second, the performance measures are computed in an automated way without any human inspection. This is extremely impor-tant when assessing the performance of OCR technology, especially large-scale character recognition systems. The massively parallel NIST Model Recognition System’s character classifier is capable of recognizing up to 1,000 char-acter images per second.21 This system is capable of processing 2,100 pages of forms from SD1 containing 130 hand-printed digits per form for a total of 273,000 digits in approximately 4 hours. The visual inspection of the system output from a single 4 hour processing session took a technician 6 months. In order to conduct tests in a reasonable amount of time, the compiling and computing of performance measures must be automated.
Using the system testing paradigm in Figure C.1, potential users of character recognition technology can design a collection of referenced images representative of their specific needs. The set of images can then be presented to different candidate systems, and using the NIST Scoring Package, performance measures can be computed from the output of each system for the purpose of system comparison. Likewise, a system developer can take a set of referenced images and present them to several variations of a single system. For example, one system configuration may use algo-rithmic approach A for character segmentation, whereas another system configuration may use algorithmic approach B. By presenting the same set of referenced images to both system configurations, performance measures can be com-puted and used to compare the two algorithmic approaches within the context of a fully operational system. These com-parison strategies were applied to compare the OCR performance of various recognition system configurations running across the database of 1040T forms.
The NIST Scoring Package is distributed as NIST Special Software 1(SS1).22 As with any effort related to technology development, the Scoring Package has evolved and matured over time. The Scoring Package was originally proposed in the draft, “Standard Method for Evaluating the Performance of Systems Intended to Recognize Hand-printed Characters from Image Data Scanned from Forms”, which was submitted to ANSI X.3A1. Early implementa-tions of the Scoring Package exposed various shortcomings and contradictions within the draft standard. A public version of SS1 was released in October of 1992 along with “NIST Scoring Package User’s Guide Release 1.0” (NIS-TIR 4950).23 The User’s Guide describes the reference implementation in great detail, but it does not address the the-ory used to derive the implementation itself. In February of 1993, the paper, “Methods for Evaluating the Performance of Systems Intended to Recognize Characters from Image Data Scanned from Forms” (NISTIR 5129), replaced the original draft standard. NISTIR 5129 formalizes the theory used in the Scoring Package and establishes a uniform method of evaluation.24 A cross-reference, NISTIR 5249, was published in August of 1993.26 The purpose of this report is to map the nomenclature defined in the Methods Paper to the pre-existing User’s Guide. The scoring flows, scoring accumulators, and performance measures defined in NISTIR 5129 are cross-referenced to the Scoring Package output files (summary report and fact sheet) defined in NIST 4950 using the new nomenclature. The software has been developed on a UNIX workstation and is implemented with a combination of utilities written in the ‘C’ programming language and the UNIX shell facility.
C.1. Form-Based Scoring
The Scoring Package has been developed to measure the performance of character recognition systems, and more specifically, automated form processing systems such as those used to process the 1040T forms and the images in SD1, SD2, and SD6. Figure C.2 illustrates four different form processing tasks addressed by the draft standard. These tasks include form identification, field identification, field recognition, and character recognition. In general, the first step to processing a form requires proper identification of the form type. Based on the identified type, fields can be located through the use of a spatial template. If fields cannot be unambiguously identified by position alone, then other contexts may be required such as reading the label printed on the form next to each field. This is referred to as field identification. Once a field has been located and identified, it then can be recognized. Typically the recognition is done character by character, and if all the characters in a field have been correctly classified, the field is considered to be correctly recognized. This definition of field recognition makes it dependent on the results of character recognition. Currently, the Scoring Package is able to measure the system performance of the form identification, field recognition, and character recognition tasks. The ability to measure the task of field identification has yet to be implemented.

C3
Figure C.2: Four tasks of a generic form processing system.
By establishing form identification as the first task, the Scoring Package does not address system issues such as pages missing from a multiple-page document, and other page handling issues. The Scoring Package has been designed to use forms for which the reference information is complete, accurate, and stored in a specified machine-readable file format. Only those forms organized in this fashion can be used by the Scoring Package.
The diagram in Figure C.2 should be not be mistaken as a model for implementing form processing systems. It should be viewed as a flexible framework by which form processing systems can be analyzed and compared. If a specific system does not perform one of the tasks, for example a system may not conduct field identification, then the output resulting from that task is not used in measuring system performance. Note that these system variations are pri-marily dependent on the types of forms being processed, so that as long as the same set of form images are presented to each system, a consistent set of performance measurements will be computed resulting in a valid comparison. These four tasks embody the primary functions which distinguish form processing from other applications such as free-for-matted correspondence reading. Also notice that these tasks in no way limit the implementation of a form processing system by dictating a presumed set of algorithmic procedures. For example, traditional character recognition systems conduct character segmentation prior to character classification.21,46 Methods of combining segmentation and classi-fication into a single concurrent process have also been developed.7,47,48 Regardless of the algorithmic techniques used, both types of systems produce character classifications that can be analyzed and compared, and both systems can be analyzed according to the tasks listed in Figure C.2.
A more detailed diagram of the form processing tasks is shown in Figure C.3. This figure illustrates the pos-sible outcomes resulting from each of the four tasks. Form identification can either result in a correctly identified form or an incorrectly identified form. Likewise, field identification can either result in a correctly identified field or and incorrectly identified field. Character recognition can result in a character being correctly recognized, incorrectly rec-ognized, or missed. Characters are frequently missed due to errors during segmentation. If all the characters in a field have been correctly recognized, then the field is considered to be correctly recognized. Otherwise, the field is consid-ered to have been incorrectly recognized. Performance measurements can be computed by compiling statistics at each of these possible outcomes.
For each form image used to test a form processing system, the Scoring Package is given the form’s type, a list of the form’s field identities, and a list of text strings corresponding to what was entered on the form, field by field. The files and formats used as input to the Scoring Package are discussed in detail in the User’s Guide. Using this ref-erence information, the Scoring Package can determine the level of error the system achieves when performing each of the four tasks. If the type of a form is correctly identified, then the form is tallied as correctly identified and scoring continues at the field identification task. If form identification is incorrect, then no faith can be placed on the outcomes from any subsequent tasks and scoring is discontinued. The form is tallied as incorrectly identified and the fields and characters on the form are tallied as missing. The same is true at the field identification task. If the field is correctly identified, then the field is tallied as correctly identified and scoring continues at the field and character recognition
Form Identification
Field Identification
Field Recognition
Character Recognition

C4
tasks. If the field identification is incorrect, no faith can be placed on the outcomes from any subsequent tasks and scor-ing is discontinued. The field is tallied as incorrectly identified and characters in the field are tallied as missing.
Figure C.3: The possible outcomes resulting from each of the four form processing tasks.
Field recognition is dependent on the outcomes from character recognition so that character recognition anal-ysis is conducted first. For each field which is correctly identified from a correctly identified form, the hypothesized characters generated by the recognition system when reading the field are reconciled with the reference string of what was entered in the field. This is done through the use of a dynamic string alignment algorithm49 which is also discussed in the Scoring Package User’s Guide. The alignments produced are used to tally the number of correct, incorrect, and missing characters. If all the characters in the reference string are recognized by the system correctly and no additional characters are falsely inserted, then the field is tallied as being correctly recognized. Otherwise, the field is tallied as incorrectly recognized. This is true when character level rejections do not exist or are ignored. The next section dis-cusses how system rejections impact scoring.
Form Identification
Field Identification
Correct FormIdentification
Incorrect FormIdentification
Correct FieldIdentification
Incorrect FieldIdentification
Missed Field
Field Recognition
Correct FieldRecognition
Incorrect FieldRecognition
Character Recognition
Correct CharacterRecognition
Incorrect CharacterRecognition
Missed Character

C5
C.2. Effects of Rejection
Up to this point, the effects of system rejections on scoring have not been addressed. Systems have the poten-tial to reject the outcomes from each of the four form processing tasks. For example, a system may choose to reject the hypothesized form type assigned to a specific form image, or a system may choose to reject the hypothesized classifi-cation assigned to a segmented character image. Rejecting outcomes gives a system the ability to flag low confidence decisions as unknown, so that they may be verified by human inspection.
Provisions have been made in the Scoring Package to account for several types of system rejections. If the hypothesized identification of a form is rejected, the Scoring Package considers all the fields and characters on the form to be rejected. Only those fields belonging to forms whose identification is accepted continue to be analyzed at the field identification task. In a similar way, if a field identification is rejected, the Scoring Package considers all the characters in the field to be rejected. Only those characters belonging to fields whose identification is accepted continue to be ana-lyzed at the field recognition and character recognition tasks. In the character recognition task, any classification result-ing from the recognition of a segmented image may be rejected. It is desirable for a system to reject classifications associated with incorrectly segmented images such as split or merged characters and images of noise. These segmen-tation errors result in characters being missed (deletion errors) and in erroneous additional classifications being made (insertion errors). It is also desirable to reject incorrect classifications associated with correctly segmented character images. These represent the substitution errors in the system. Unfortunately, rejection mechanisms are not perfect, so that occasionally, correctly classified character images are also rejected. Having described the various instances of character level rejections, a field is considered correctly recognized only if every character in the field’s reference string has been correctly classified with no characters missed and there are no additional (inserted) classifications remaining after rejection.

C6
D1
APPENDIX D. MODEL RECOGNITION SYSTEM COMPONENTS
The NIST Model Recognition System is implemented across two integrated computers.* Data storage and central processing control are supported by a Sun 4/470 UNIX server. The Sun has 32 Megabytes of main memory and approximately 10 gigabytes of magnetic disk. Connected to the Sun 4/470 is a Cambridge Parallel Computing 510c Distributed Array Processor (DAP)50. The parallel machine is a Single Instruction Multiple Data (SIMD) architecture and consists of two separate 32 X 32 grids of tightly coupled processors. One grid contains 1-bit processing elements and the other contains 8-bit processing elements. Data mappings of both vector mode and matrix mode are well-suited to the DAP, making it useful for both neural networks and traditional image processing. The parallel machine is respon-sible for conducting low-level isolation, segmentation, and classification tasks.
D.1. Form Registration
The first step to processing a 1040T form is to locate the registration mark in each of the four corners of the page so that any skew may be measured and accounted for when isolating the fields on the form. An algorithm designed at NIST to detect intrinsic form structure within binary digitized documents is used. This Correlated Run Length (CURL) algorithm automatically locates and extracts line segments, line endings, and combinations of line intersec-tions including corners, crosses, and T’s from images. The registration marks on the 1040T forms are comprised of two intersecting lines forming a right angle. Therefore, CURL is an ideal algorithm for locating these registration marks. CURL has several advantages over more conventional approaches, such as spatial histograms, in that form structures are detected without any a priori knowledge of the specific form in the image, and these structures are detected directly from the original image so that any distortions including translation, rotation, and scale are automat-ically handled. The algorithm performs extremely well on highly cluttered forms and noisy images and is well suited for implementation in a highly parallel processing environment.
CURL correlates and aggregates pixels along selected trajectories in order to detect and locate shape-based structures within an image. Shape is represented by at least two edge vectors called an edge pair. The elements of the edge vectors address pixel positions within the input image, and these pixel addresses are defined relative to a current pixel location within the image. The edge pair is applied independently to each pixel in the image, extracting pixels along the specified trajectories. For example, one edge vector may be defined to extend horizontally 32 pixels to the right of the current pixel, and another edge may be defined to extend vertically 32 pixels below the current pixel. CURL uses this edge pair definition to detect the upper-left registration mark on 1040T forms. CURL is not limited to linear edges only. A point-to-point correlation can be computed between any two or more vectors representing any given shape and the points within each vector may be spaced apart from one another.
Applying an edge pair to each pixel position in the image, an intersection is computed between the two vectors of extracted pixels, forming contiguous groups of correlated pixels called runs. A non-linear operator is applied to the length of each resulting run called a run length. The non-linear accumulation of a run length accelerates rapidly as the duration of the contiguously correlated pixels increases. The accumulation grows very little for uncorrelated edge vec-tors because the runs are short. In this way, edge pairs can be defined to detect arbitrary shapes.
Figure D.1 illustrates the CURL algorithm as a sequence of fundamental steps. First, a selected set of edge pairs represented by box 1 are distributed across every pixel in input image 2. The intersection in box 3 is computed for each edge pair extracted from the input image. Run lengths in box 4 are computed from each intersection, and a non-linear operator in box 5 is applied to the run lengths. Finally, each pixel in output image 6 is assigned the accumu-lated results from the non-linear operator for a given pair of edges.
* The Sun 4/470 and DAP 510c or equivalent commercial equipment are identified in this paper in order to adequately specify or describe the subject matter of this work. In no case does such identification imply recommendation or endorsement by the National Institute of Standards and Technology, nor does it imply that the equipment identified is necessarily the best available for the purpose.
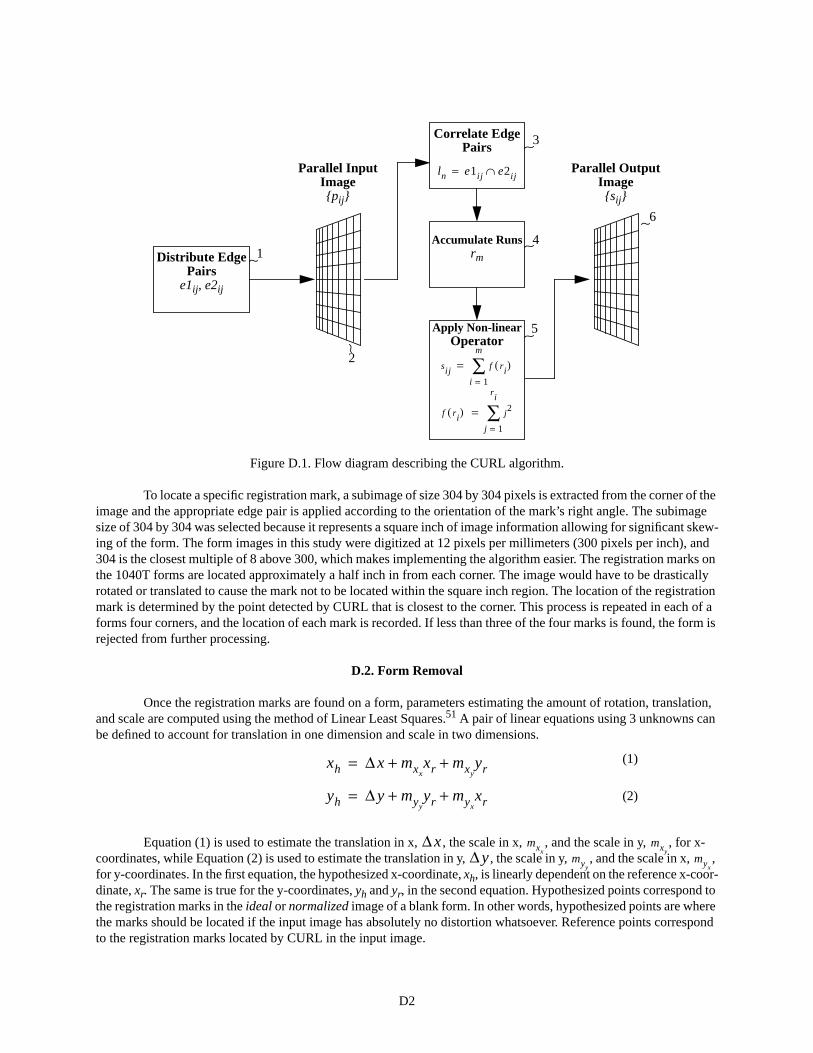
D2
Figure D.1. Flow diagram describing the CURL algorithm.
To locate a specific registration mark, a subimage of size 304 by 304 pixels is extracted from the corner of the image and the appropriate edge pair is applied according to the orientation of the mark’s right angle. The subimage size of 304 by 304 was selected because it represents a square inch of image information allowing for significant skew-ing of the form. The form images in this study were digitized at 12 pixels per millimeters (300 pixels per inch), and 304 is the closest multiple of 8 above 300, which makes implementing the algorithm easier. The registration marks on the 1040T forms are located approximately a half inch in from each corner. The image would have to be drastically rotated or translated to cause the mark not to be located within the square inch region. The location of the registration mark is determined by the point detected by CURL that is closest to the corner. This process is repeated in each of a forms four corners, and the location of each mark is recorded. If less than three of the four marks is found, the form is rejected from further processing.
D.2. Form Removal
Once the registration marks are found on a form, parameters estimating the amount of rotation, translation, and scale are computed using the method of Linear Least Squares.51 A pair of linear equations using 3 unknowns can be defined to account for translation in one dimension and scale in two dimensions.
Equation (1) is used to estimate the translation in x, , the scale in x, , and the scale in y, , for x-coordinates, while Equation (2) is used to estimate the translation in y, , the scale in y, , and the scale in x, , for y-coordinates. In the first equation, the hypothesized x-coordinate, xh, is linearly dependent on the reference x-coor-dinate, xr. The same is true for the y-coordinates, yh and yr, in the second equation. Hypothesized points correspond to the registration marks in the ideal or normalized image of a blank form. In other words, hypothesized points are where the marks should be located if the input image has absolutely no distortion whatsoever. Reference points correspond to the registration marks located by CURL in the input image.
Parallel OutputImage
Distribute EdgePairs
Correlate EdgePairs
Accumulate Runs
Apply Non-linearOperator
{sij}
e1ij, e2ij
rm
Parallel InputImage{pij}
1
3
4
5
2
6
sij f ri( )i 1=
m
∑=
f ri( ) j2
j 1=
ri
∑=
ln e1ij e2ij∩=
xh xΔ mxxxr mxy
yr+ +=
yh yΔ myyyr myx
xr+ +=
(1)
(2)
xΔ mxxmxy
yΔ myymyx

D3
Applying the method of least squares on Equation (1), the equation expands into the following system of 3 linear equations.
This system of three simultaneous linear equations is represented in matrix form as:
where:
Solving for P, the following equation is derived:
The inverse of the matrix A is defined to be:
The determinant of A is defined to be:
xhi 1=
n
∑ n xΔ mxxxr
i 1=
n
∑ mxyyr
i 1=
n
∑+ +=
xhxri 1=
n
∑ x xri 1=
n
∑Δ mxxxr
2
i 1=
n
∑ mxyxryr
i 1=
n
∑+ +=
xhyri 1=
n
∑ x yri 1=
n
∑Δ mxxxryr
i 1=
n
∑ mxyyr
2
i 1=
n
∑+ +=
(3)
(4)
(5)
B AP= (6)
Bb11
b21
b31
xhii 1=
n
∑
xhixri
i 1=
n
∑
xhiyri
i 1=
n
∑
= = Aa11 a12 a13
a21 a22 a23
a31 a32 a33
n xrii 1=
n
∑ yrii 1=
n
∑
xrii 1=
n
∑ xri2
i 1=
n
∑ xriyri
i 1=
n
∑
yrii 1=
n
∑ xriyri
i 1=
n
∑ yri2
i 1=
n
∑
= = Pp11
p21
p31
xΔmxx
mxy
= =
P A 1− B= (7)
A 1− 1detA
AdjA= (8)
detA a11a22a33 a12a23a31 a13a21a32 a31a22a13− a32a23a11− a33a21a12−+ +=
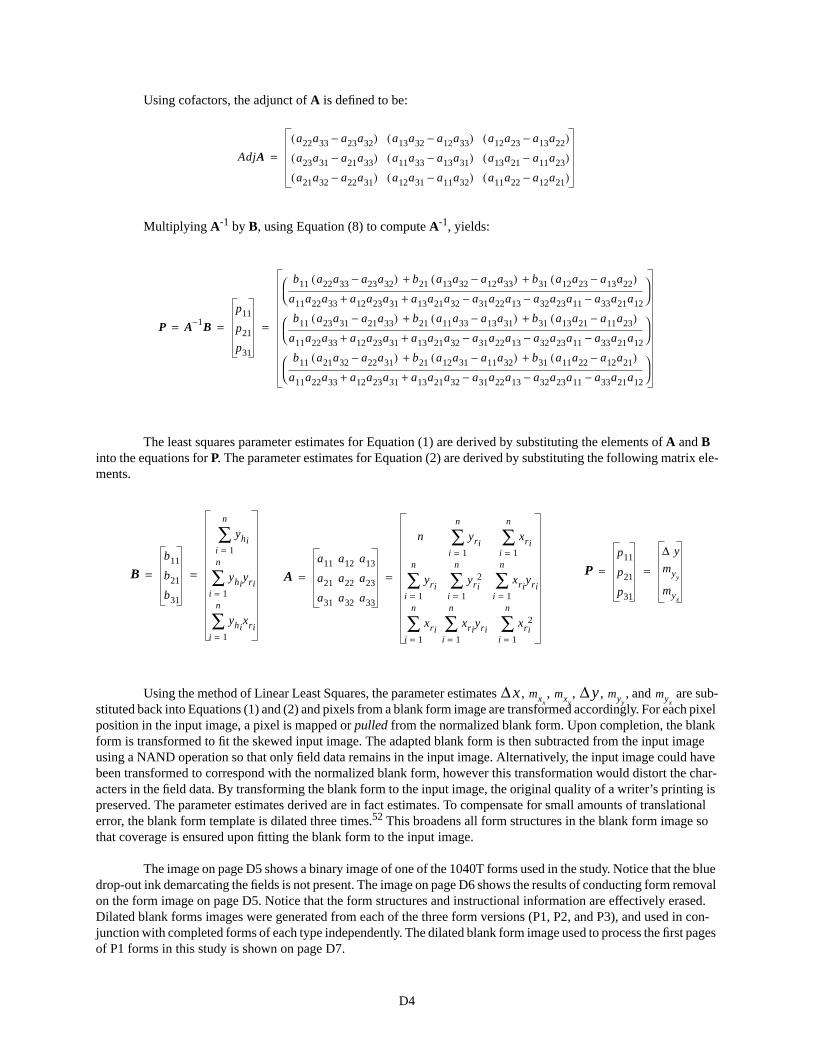
D4
Using cofactors, the adjunct of A is defined to be:
Multiplying A-1 by B, using Equation (8) to compute A-1, yields:
The least squares parameter estimates for Equation (1) are derived by substituting the elements of A and B into the equations for P. The parameter estimates for Equation (2) are derived by substituting the following matrix ele-ments.
Using the method of Linear Least Squares, the parameter estimates , , , , , and are sub-stituted back into Equations (1) and (2) and pixels from a blank form image are transformed accordingly. For each pixel position in the input image, a pixel is mapped or pulled from the normalized blank form. Upon completion, the blank form is transformed to fit the skewed input image. The adapted blank form is then subtracted from the input image using a NAND operation so that only field data remains in the input image. Alternatively, the input image could have been transformed to correspond with the normalized blank form, however this transformation would distort the char-acters in the field data. By transforming the blank form to the input image, the original quality of a writer’s printing is preserved. The parameter estimates derived are in fact estimates. To compensate for small amounts of translational error, the blank form template is dilated three times.52 This broadens all form structures in the blank form image so that coverage is ensured upon fitting the blank form to the input image.
The image on page D5 shows a binary image of one of the 1040T forms used in the study. Notice that the blue drop-out ink demarcating the fields is not present. The image on page D6 shows the results of conducting form removal on the form image on page D5. Notice that the form structures and instructional information are effectively erased. Dilated blank forms images were generated from each of the three form versions (P1, P2, and P3), and used in con-junction with completed forms of each type independently. The dilated blank form image used to process the first pages of P1 forms in this study is shown on page D7.
AdjA
a22a33 a23a32−( ) a13a32 a12a33−( ) a12a23 a13a22−( )
a23a31 a21a33−( ) a11a33 a13a31−( ) a13a21 a11a23−( )
a21a32 a22a31−( ) a12a31 a11a32−( ) a11a22 a12a21−( )
=
P A 1− B
p11
p21
p31
b11 a22a33 a23a32−( ) b21 a13a32 a12a33−( ) b31 a12a23 a13a22−( )+ +
a11a22a33 a12a23a31 a13a21a32 a31a22a13− a32a23a11− a33a21a12−+ +⎝ ⎠⎛ ⎞
b11 a23a31 a21a33−( ) b21 a11a33 a13a31−( ) b31 a13a21 a11a23−( )+ +
a11a22a33 a12a23a31 a13a21a32 a31a22a13− a32a23a11− a33a21a12−+ +⎝ ⎠⎛ ⎞
b11 a21a32 a22a31−( ) b21 a12a31 a11a32−( ) b31 a11a22 a12a21−( )+ +
a11a22a33 a12a23a31 a13a21a32 a31a22a13− a32a23a11− a33a21a12−+ +⎝ ⎠⎛ ⎞
= = =
Bb11
b21
b31
yhii 1=
n
∑
yhiyri
i 1=
n
∑
yhixri
i 1=
n
∑
= = Aa11 a12 a13
a21 a22 a23
a31 a32 a33
n yrii 1=
n
∑ xrii 1=
n
∑
yrii 1=
n
∑ yri2
i 1=
n
∑ xriyri
i 1=
n
∑
xrii 1=
n
∑ xriyri
i 1=
n
∑ xri2
i 1=
n
∑
= = Pp11
p21
p31
yΔmyy
myx
= =
xΔ mxxmxy
yΔ myymyx

D5
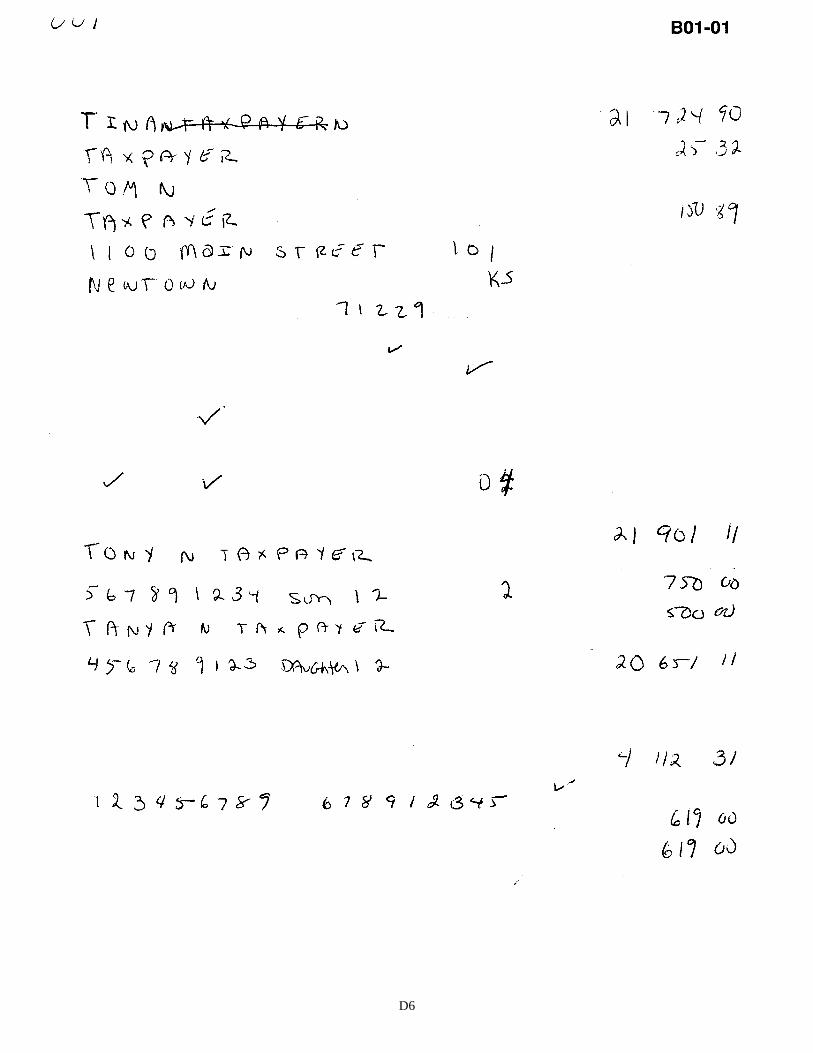
D6

D7

D8
D.3. Field Isolation
Now that the form information has been removed from the input image, field isolation is conducted. A spatial template defining the location and spatial extent of each entry field on the form is adapted using the Linear Least Squares method described above, accounting for any skew in the input image. In this case, the points in the template are mapped or pushed onto the input image, therefore parameter estimates are calculated with hypothesized points cor-responding to the registration marks located by CURL in the input image and reference points corresponding to the normalized marks in the blank form image. The adapted template may undergo any combination of rotation, transla-tion, and scale; therefore, the adapted fields may no longer be rectangular. To minimize computational complexity, each field region is squared off by a bounding rectangle that is aligned with the raster grid in the input image. These adapted rectangular template coordinates are then used to extract subimages of the fields form the input image. Figure D.2 contains the subimage (scaled up 2X) of Line 7 isolated and extracted from the form shown on page D5. Spatial templates were generated from each of the three form versions (P1, P2, and P3), and used in conjunction with com-pleted forms of each type independently.
Figure D.2. The money amount extracted at Line 7 from the form on page D5.
D.4. Character Field Segmentation
Each isolated field image containing characters must be segmented into individual images, one character per image, prior to being classified. Results from system configurations using two different segmentation algorithms are presented in this paper. They are connected component labeling (blob segmentor) and form-based inter-character cuts (cut segmentor).
D.4.1 Connected Component Labeling
The first segmentation scheme separates the field into blobs, where each blob is defined to be a group of pixels all contiguously neighboring or connecting each other. Each blob is extracted and assumed to be a separate character. A parallel implementation of this algorithm is provided by CPP on the DAP 510c making it very inexpensive to com-pute. Although the algorithm is inexpensive to compute on the massively parallel computer, it has significant pitfalls. A blob is not guaranteed to be a single and complete character. If two characters touch, then a single blob will contain both characters as a single composite image. A blob may also contain only one stroke of a character that is comprised of several disjoint stokes. For example, the top of the letter ‘T’ may not be connected to the vertical stroke causing the algorithm to over-segment the character into two blobs.
Figure D.3 shows a field containing “DAuGhter” in which connected component labeling over-segments and under-segments the field. The extracted field subimage is shown at the top. The resulting blobs are listed below the field subimage. The first blob is a vertical stroke that when viewed independently looks like a ‘1’, ‘l’, or ‘I’. This blob is the vertical stroke representing the left potion of the ‘D’ in “DAuGhter”. This is an example of over-segmenting. The remaining three blobs are examples of under-segmenting. The second blob contains portions of ‘D’, ‘A’, and ‘u’. The single blob is assigned a class of ‘X’ by the recognition system’s character classifier because the blob is assumed to be a single character. The third blob contains both the ‘G’ and ‘h’ and is assigned a class of ‘G’. The ‘h’ is deleted from the field. The fourth blob contains ‘t’, ‘e’, and a portion of a clipped ‘r’. This blob is assigned a class of ‘W’. Due to segmentations errors introduced by connected component labeling, the field is recognized as “HXGW” rather than “DAUGHTER”.
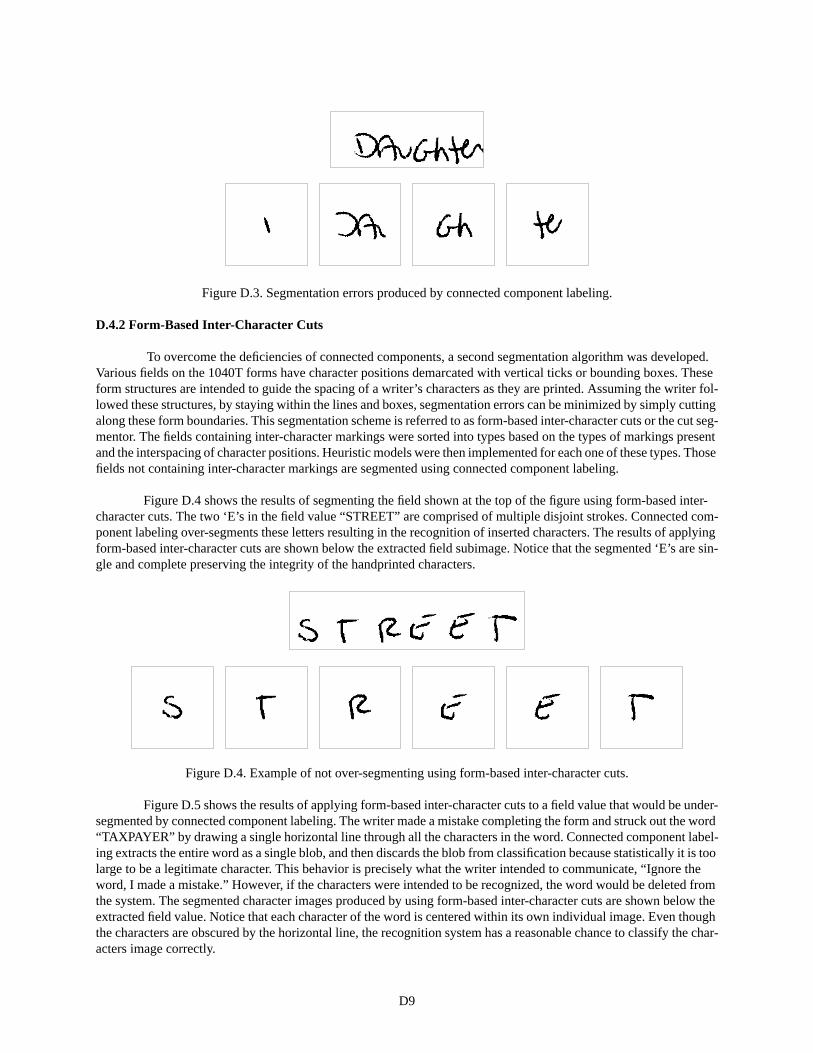
D9
Figure D.3. Segmentation errors produced by connected component labeling.
D.4.2 Form-Based Inter-Character Cuts
To overcome the deficiencies of connected components, a second segmentation algorithm was developed. Various fields on the 1040T forms have character positions demarcated with vertical ticks or bounding boxes. These form structures are intended to guide the spacing of a writer’s characters as they are printed. Assuming the writer fol-lowed these structures, by staying within the lines and boxes, segmentation errors can be minimized by simply cutting along these form boundaries. This segmentation scheme is referred to as form-based inter-character cuts or the cut seg-mentor. The fields containing inter-character markings were sorted into types based on the types of markings present and the interspacing of character positions. Heuristic models were then implemented for each one of these types. Those fields not containing inter-character markings are segmented using connected component labeling.
Figure D.4 shows the results of segmenting the field shown at the top of the figure using form-based inter-character cuts. The two ‘E’s in the field value “STREET” are comprised of multiple disjoint strokes. Connected com-ponent labeling over-segments these letters resulting in the recognition of inserted characters. The results of applying form-based inter-character cuts are shown below the extracted field subimage. Notice that the segmented ‘E’s are sin-gle and complete preserving the integrity of the handprinted characters.
Figure D.4. Example of not over-segmenting using form-based inter-character cuts.
Figure D.5 shows the results of applying form-based inter-character cuts to a field value that would be under-segmented by connected component labeling. The writer made a mistake completing the form and struck out the word “TAXPAYER” by drawing a single horizontal line through all the characters in the word. Connected component label-ing extracts the entire word as a single blob, and then discards the blob from classification because statistically it is too large to be a legitimate character. This behavior is precisely what the writer intended to communicate, “Ignore the word, I made a mistake.” However, if the characters were intended to be recognized, the word would be deleted from the system. The segmented character images produced by using form-based inter-character cuts are shown below the extracted field value. Notice that each character of the word is centered within its own individual image. Even though the characters are obscured by the horizontal line, the recognition system has a reasonable chance to classify the char-acters image correctly.

D10
Figure D.5. Example of not under-segmenting using form-based inter-character cuts.
An example of a field where form-based inter-character cuts can be applied is the filer and spouse’s Social Security Numbers (SSN) on the front of the 1040T forms. The algorithm synchronizes a pointer to the front of the SSN field and a subimage equal to the height of the entry field and the width of 60 pixels is extracted. The pointer is then incremented forward by 60 pixels. This process is repeated three times, one time for each of the first three characters in the SSN. The pointer is then incremented an extra 20 pixels to account for the gap preceding the next two characters on the form. Two more cuts and increments of width 60 pixels are done, and then the pointer is incremented another 20 pixels to account for the gap preceding the last four characters of the SSN. The last four characters are then seg-mented by repeating the cuts and increments of width 60 pixels.
A separate heuristic model was developed for each type of field containing inter-characters marks across the three 1040T form versions. In all, there were 6 types of cut fields and one other type designated to represent fields not containing inter-character markings. Figure D.6 lists these types with a brief description. Notice that there are two types of SSN fields and two types of fields containing vertical tick marks between the letters. This is due to inconsis-tencies in the form design. The SSN fields labeled “BSSN” (B stands for Big) have a character box width measuring 60 pixels and a gap size of 20 pixels between the three sets of SSN digits, whereas the SSN fields labeled “SSSN” (S for Small) have a character box width measuring 51 pixels and a gap size of 25 pixels between the three sets of SSN digits. The vertical tick fields labeled “TCK” have an inter-character spacing of 60 pixels. The vertical tick fields labeled “OTCK” (O for Offset) have the same 60 pixel spacing but have an extra 10 pixels added to the first character position in the field due to the placement of the pink border in front of these fields. These inconsistencies contribute nothing to the human or machine readability of the forms, but only add implementation complexities for the recogni-tion system engineer.
Figure D.6. Types of fields signifying different field demarcations.
BOX
BSSN
SSSN
EIN
TCK
OTCK
NTCK
money fields on P2 and P3 forms
filer, spouse, and dependent SSNs on the first page of the forms
preparer SSN on the first page and all SSNs on the second page ofthe forms
preparer EIN on the first page of the forms
all names and addresses of the filer, spouse, and dependents on thefront page of the forms excluding the first three lines
first three lines of filer and spouse names on the front page of theforms
all other character fields on the forms including the money fields onthe P1 forms
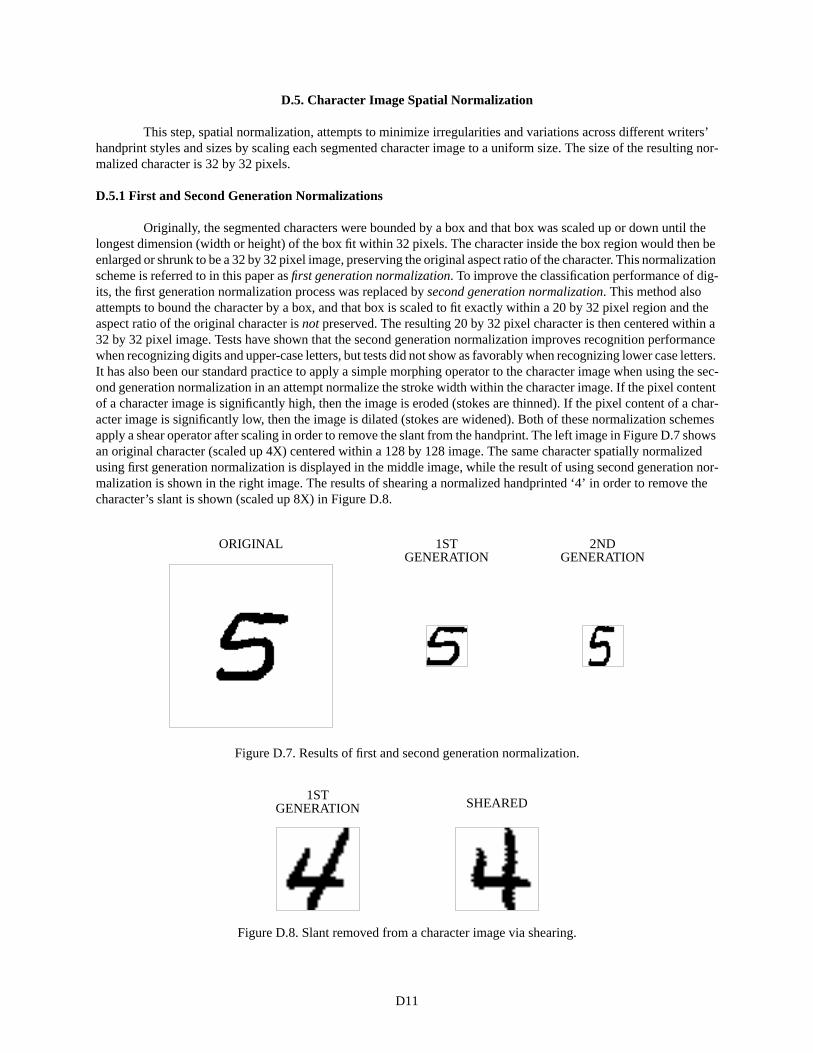
D11
D.5. Character Image Spatial Normalization
This step, spatial normalization, attempts to minimize irregularities and variations across different writers’ handprint styles and sizes by scaling each segmented character image to a uniform size. The size of the resulting nor-malized character is 32 by 32 pixels.
D.5.1 First and Second Generation Normalizations
Originally, the segmented characters were bounded by a box and that box was scaled up or down until the longest dimension (width or height) of the box fit within 32 pixels. The character inside the box region would then be enlarged or shrunk to be a 32 by 32 pixel image, preserving the original aspect ratio of the character. This normalization scheme is referred to in this paper as first generation normalization. To improve the classification performance of dig-its, the first generation normalization process was replaced by second generation normalization. This method also attempts to bound the character by a box, and that box is scaled to fit exactly within a 20 by 32 pixel region and the aspect ratio of the original character is not preserved. The resulting 20 by 32 pixel character is then centered within a 32 by 32 pixel image. Tests have shown that the second generation normalization improves recognition performance when recognizing digits and upper-case letters, but tests did not show as favorably when recognizing lower case letters. It has also been our standard practice to apply a simple morphing operator to the character image when using the sec-ond generation normalization in an attempt normalize the stroke width within the character image. If the pixel content of a character image is significantly high, then the image is eroded (stokes are thinned). If the pixel content of a char-acter image is significantly low, then the image is dilated (stokes are widened). Both of these normalization schemes apply a shear operator after scaling in order to remove the slant from the handprint. The left image in Figure D.7 shows an original character (scaled up 4X) centered within a 128 by 128 image. The same character spatially normalized using first generation normalization is displayed in the middle image, while the result of using second generation nor-malization is shown in the right image. The results of shearing a normalized handprinted ‘4’ in order to remove the character’s slant is shown (scaled up 8X) in Figure D.8.
Figure D.7. Results of first and second generation normalization.
Figure D.8. Slant removed from a character image via shearing.
ORIGINAL 1ST 2NDGENERATION GENERATION
1STSHEAREDGENERATION
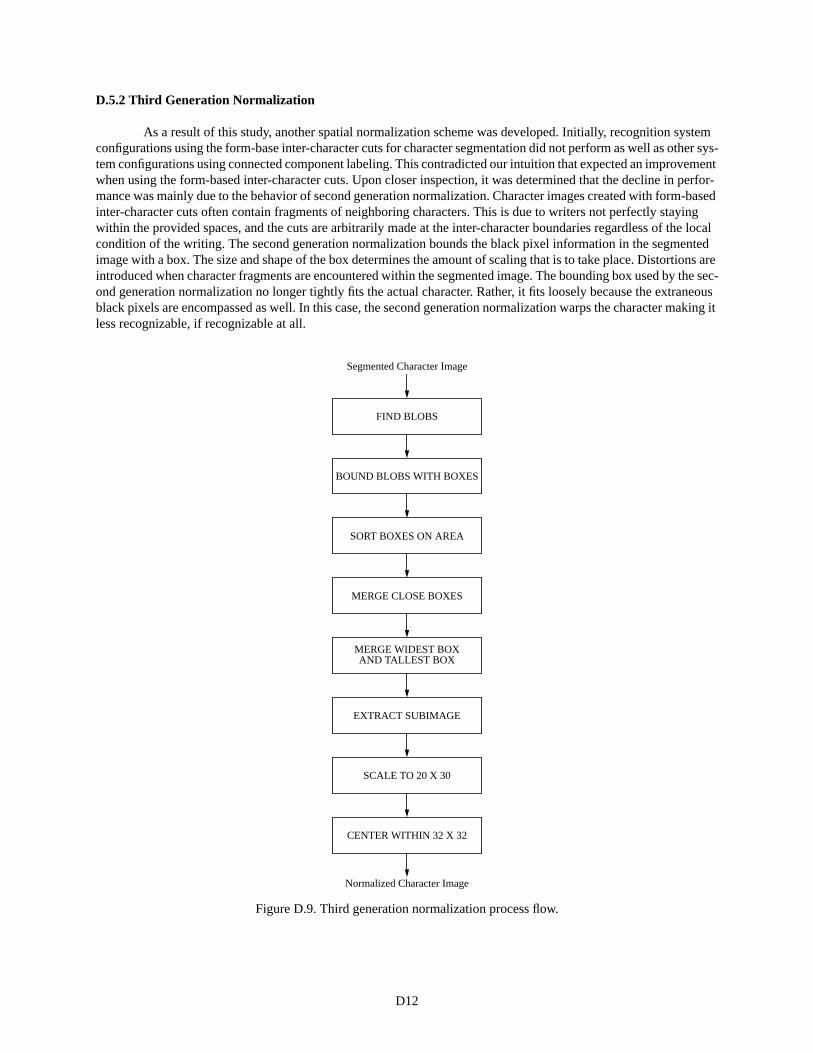
D12
D.5.2 Third Generation Normalization
As a result of this study, another spatial normalization scheme was developed. Initially, recognition system configurations using the form-base inter-character cuts for character segmentation did not perform as well as other sys-tem configurations using connected component labeling. This contradicted our intuition that expected an improvement when using the form-based inter-character cuts. Upon closer inspection, it was determined that the decline in perfor-mance was mainly due to the behavior of second generation normalization. Character images created with form-based inter-character cuts often contain fragments of neighboring characters. This is due to writers not perfectly staying within the provided spaces, and the cuts are arbitrarily made at the inter-character boundaries regardless of the local condition of the writing. The second generation normalization bounds the black pixel information in the segmented image with a box. The size and shape of the box determines the amount of scaling that is to take place. Distortions are introduced when character fragments are encountered within the segmented image. The bounding box used by the sec-ond generation normalization no longer tightly fits the actual character. Rather, it fits loosely because the extraneous black pixels are encompassed as well. In this case, the second generation normalization warps the character making it less recognizable, if recognizable at all.
Figure D.9. Third generation normalization process flow.
BOUND BLOBS WITH BOXES
Segmented Character Image
FIND BLOBS
SORT BOXES ON AREA
MERGE CLOSE BOXES
MERGE WIDEST BOXAND TALLEST BOX
EXTRACT SUBIMAGE
SCALE TO 20 X 30
CENTER WITHIN 32 X 32
Normalized Character Image
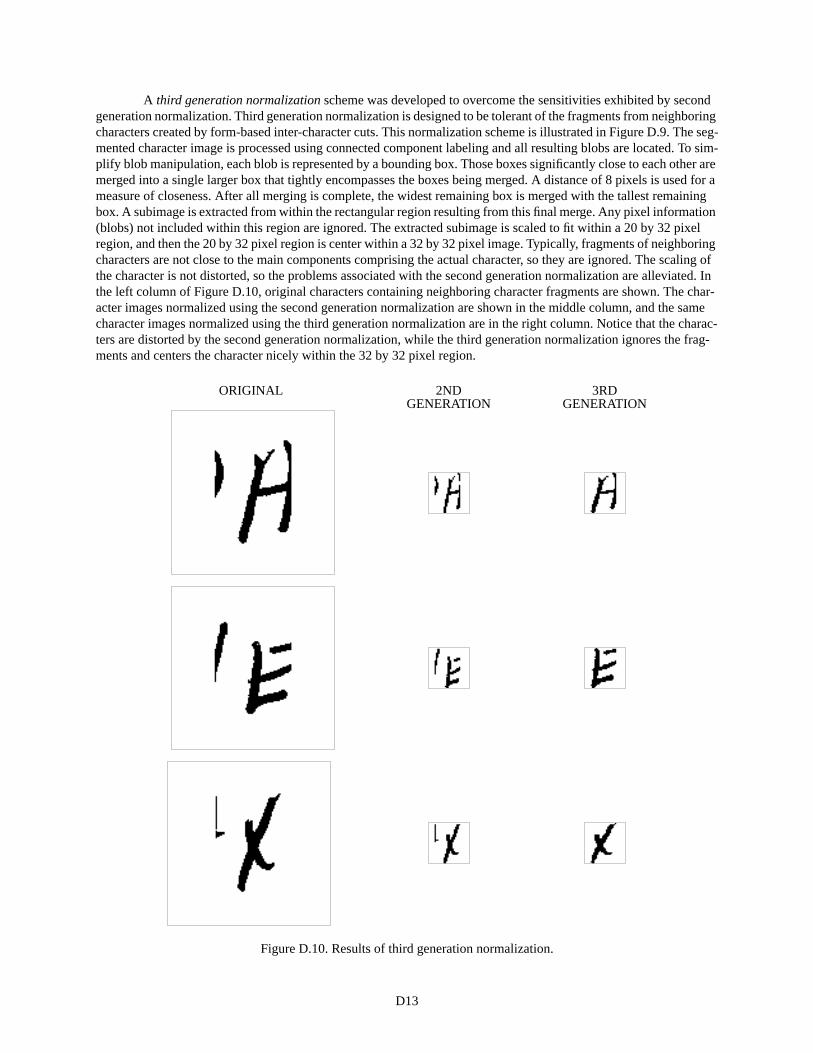
D13
A third generation normalization scheme was developed to overcome the sensitivities exhibited by second generation normalization. Third generation normalization is designed to be tolerant of the fragments from neighboring characters created by form-based inter-character cuts. This normalization scheme is illustrated in Figure D.9. The seg-mented character image is processed using connected component labeling and all resulting blobs are located. To sim-plify blob manipulation, each blob is represented by a bounding box. Those boxes significantly close to each other are merged into a single larger box that tightly encompasses the boxes being merged. A distance of 8 pixels is used for a measure of closeness. After all merging is complete, the widest remaining box is merged with the tallest remaining box. A subimage is extracted from within the rectangular region resulting from this final merge. Any pixel information (blobs) not included within this region are ignored. The extracted subimage is scaled to fit within a 20 by 32 pixel region, and then the 20 by 32 pixel region is center within a 32 by 32 pixel image. Typically, fragments of neighboring characters are not close to the main components comprising the actual character, so they are ignored. The scaling of the character is not distorted, so the problems associated with the second generation normalization are alleviated. In the left column of Figure D.10, original characters containing neighboring character fragments are shown. The char-acter images normalized using the second generation normalization are shown in the middle column, and the same character images normalized using the third generation normalization are in the right column. Notice that the charac-ters are distorted by the second generation normalization, while the third generation normalization ignores the frag-ments and centers the character nicely within the 32 by 32 pixel region.
Figure D.10. Results of third generation normalization.
ORIGINAL 2ND 3RDGENERATION GENERATION
D14
D.6. Character Image Feature Extraction
After spatial normalization and prior to classification, the segmented character images are filtered into ranked principal components using the discrete Karhunen Loeve (KL) transform.53 The recognition system uses these KL fea-tures as input to a neural network classifier. The KL transform is a statistical method that expands characters in terms of eigenvectors whose eigenvalues are variances. The eigenvectors are the principal components of the covariance matrix formed from a sample of characters. Those eigenvectors with the highest eigenvalues are more relevant descrip-tors of the character images. Givens and Householder reductions are used to tridiagonalize the covariance matrix, and the eigenvectors are computed using the QR algorithm.54 The eigenvectors form a minimal orthogonal basis set of which any character is a linear combination. A feature vector of coefficient values is computed by projecting a char-acter image onto the set of eigenvectors. This feature vector is then truncated and used in place of the original character image as input to a neural network, reducing the input dimensionality of the classifier. This dimensional reduction is important for the generalization capabilities of the network.55 In this study, feature vectors are derived using ranked groups of either 48 or 64 KL basis functions. Theses feature vectors are used in place of the original 1,024 pixels con-tained in the 32 by 32 normalized character images.
D.7. Character Classification
The classification of features extracted from normalized character images is discussed in this section. The rec-ognition system configurations studied in this paper use two different feature-based neural network classifiers56, a Multi-Layer Perceptron or a Probabilistic Neural Network.
D.7.1 Multi-Layer Perceptron
The Multi-Layer Perceptron (MLP) is a more traditional neural network architecture.36 The MLP networks used in this study have three layers: an input layer, one hidden layer, and an output layer. Classification using KL fea-ture vectors is accomplished by presenting the network with a 48-element or 64-element input vector. These network inputs are distributed to a fully connected hidden layer and combined into an internal representation. Signals from the hidden layer are transferred using a sigmoid function to the output layer and network activations are produced. The output neurode with the greatest activation is deemed the winner and the character image from which the input pattern was derived is identified as the class to which the winning output neurode represents. The MLP networks are trained using a technique of supervised learning called Scaled Conjugate Gradient (SCG).37 SCG takes into account second-order derivative information derived from the n-dimensional solution surface represented by the MLP weights. It out-performs Back-propagation36, a gradient descent technique which only considers first-order derivative information. Networks trained using SCG converge faster and typically produce better results. Note that the training of these net-works is done once, off-line from the running of the recognition system.
Two sets of weights are used by the MLP-based recognition system configurations used in this study. One set of MLP weights was trained to recognize the ten digits ‘0’ through ‘9’ given approximately 40,000 samples of KL feature vectors derived from the handprint extracted from 250 writers in NIST Special Database 3 (SD3).43 SD3 con-tains over 300,000 properly segmented and labeled character images written by permanent Census field representatives experienced in filling out forms. The second set of MLP weights was trained to recognize the 26 alphabetic characters with upper and lower case merged within the same class. In other words, the neural network was trained to classify a handprinted ‘a’ and ‘A’ as an ‘A’. The alphabetic weights were trained from the same 250 writes used to train the digit weights, and once again approximately 40,000 samples of KL feature vectors derived from handprinted character images were used.
Figure D.11 illustrates the KL feature-based MLP classification model for recognizing digits. Parallel image input from a normalized character is filtered into KL coefficients. The KL basis functions are represented at the input layer of the network as KL1, KL2, through KLN. These coefficients multiplied by the weights between the first and hidden layer are recombined at the hidden layer. For the purpose of clarity, the illustration does not show the neurode interconnections as being fully connected. The signals at the hidden layer are multiplied by the weights between the hidden and output layers, and activations are produced using a sigmoid transfer function. The position of the output neurode receiving maximum activation determines the class of the character.

D15
Figure D.11. KL feature-based MLP network model.
D.7.2 Probabilistic Neural Network
It has been our experience that a second type of neural network, a Probabilistic Neural Network (PNN)38, out-performs MLPs in terms of accuracy.39,40 In the PNN classifier, each training example becomes the center of a kernel function that takes its maximum at the example and decreases gradually as one moves away from the example in fea-ture space. An unknown feature vector x is classified by computing, for each class i containing Mi prototype vectors, the sum of the values of the class-i kernels at x. Many forms are possible for the kernel functions; we have obtained our best results using radially symmetric Gaussian kernels. The resulting discriminant functions are of the following form where is a scalar “smoothing parameter” that may be optimized by trial and error. In this study a of 3.0 is used.
and
While the PNN achieves lower error rates, it is much more expensive to compute than the MLP. The summa-tion in Equation (9) must be recomputed across the training prototypes by assigned class for each feature vector being classified, therefore the training prototypes must be stored in main memory, making the algorithm resource intense as well. MLP classification is much more efficient being reduced in practice to a couple parallel matrix multiplies.
Two sets of prototype KL feature vectors are used by the PNN-based recognition system configurations used in this study. One set of PNN prototypes contains 38,000 feature vectors derived from handprinted character images of the ten digits ‘0’ through ‘9’. The second set of PNN prototypes contain 38,000 feature vectors derived from the 26 alphabetic characters with upper and lower case merged into the same class. The handprint use to derived these PNN prototypes was extracted from 1,000 writers whose quality and style are similar to those in SD3 and NIST Special Database 7 (SD7) also known as NIST Test Database 1 (TD1)45. SD7 contains handprint surveyed from high school
KL1 KL2 KL3 KL4 KLN
0 1 2 3 4 5 6 7 98
Parallel
Image
InputKL Basis
Functions
Hidden
Neurodes
Output
Neurodes
. . .
σ σ
Di x( ) exp1
2σ2−( ) d2 x xj
i( ),( )( )j 1=
Mi
∑= (9)
d2 x y,( ) x y−( ) T x y−( )= (10)
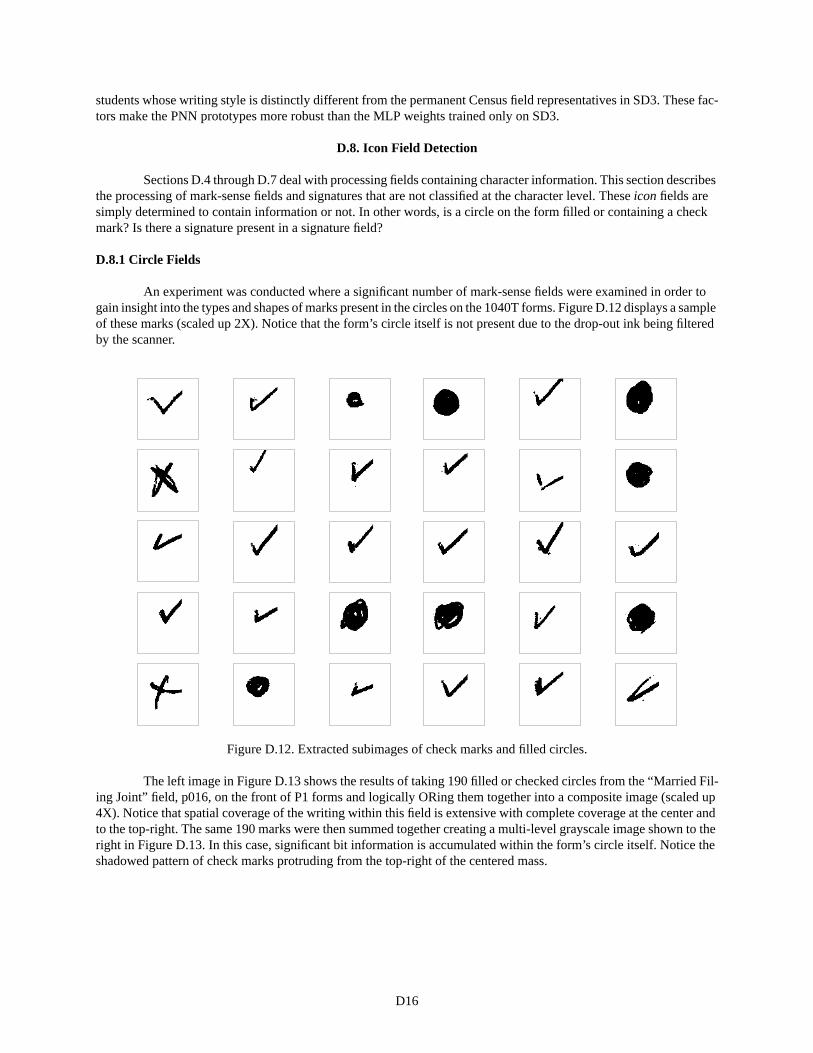
D16
students whose writing style is distinctly different from the permanent Census field representatives in SD3. These fac-tors make the PNN prototypes more robust than the MLP weights trained only on SD3.
D.8. Icon Field Detection
Sections D.4 through D.7 deal with processing fields containing character information. This section describes the processing of mark-sense fields and signatures that are not classified at the character level. These icon fields are simply determined to contain information or not. In other words, is a circle on the form filled or containing a check mark? Is there a signature present in a signature field?
D.8.1 Circle Fields
An experiment was conducted where a significant number of mark-sense fields were examined in order to gain insight into the types and shapes of marks present in the circles on the 1040T forms. Figure D.12 displays a sample of these marks (scaled up 2X). Notice that the form’s circle itself is not present due to the drop-out ink being filtered by the scanner.
Figure D.12. Extracted subimages of check marks and filled circles.
The left image in Figure D.13 shows the results of taking 190 filled or checked circles from the “Married Fil-ing Joint” field, p016, on the front of P1 forms and logically ORing them together into a composite image (scaled up 4X). Notice that spatial coverage of the writing within this field is extensive with complete coverage at the center and to the top-right. The same 190 marks were then summed together creating a multi-level grayscale image shown to the right in Figure D.13. In this case, significant bit information is accumulated within the form’s circle itself. Notice the shadowed pattern of check marks protruding from the top-right of the centered mass.
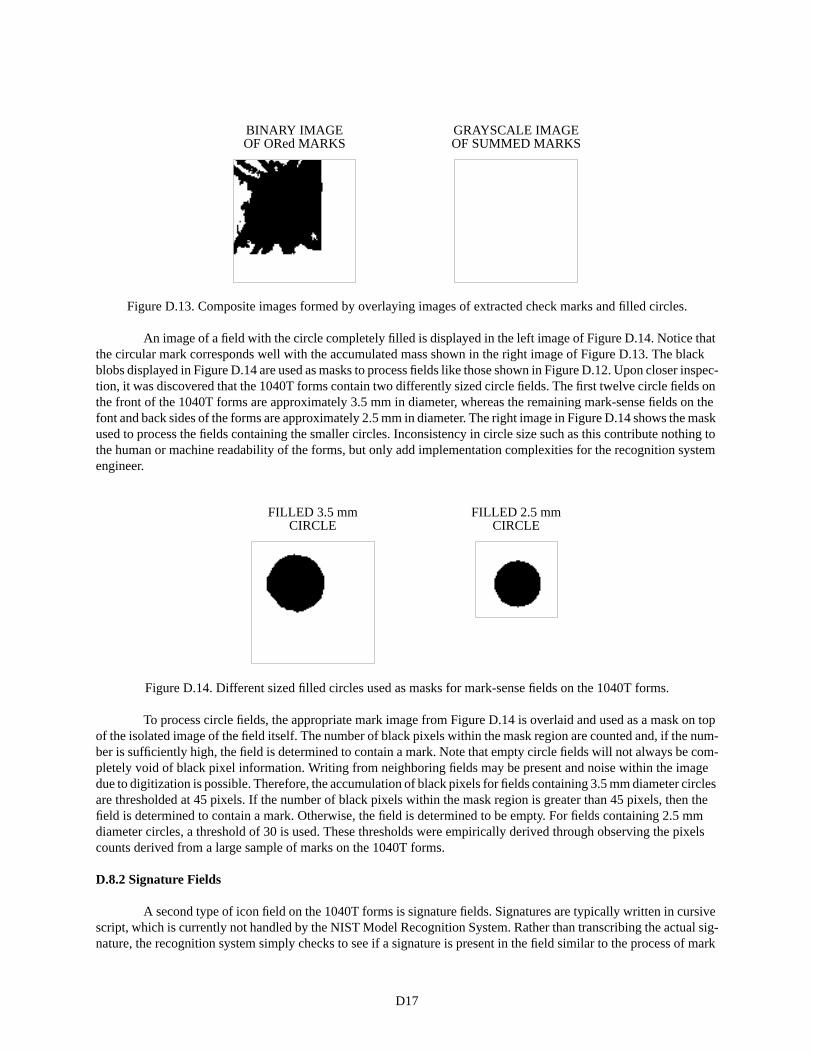
D17
Figure D.13. Composite images formed by overlaying images of extracted check marks and filled circles.
An image of a field with the circle completely filled is displayed in the left image of Figure D.14. Notice that the circular mark corresponds well with the accumulated mass shown in the right image of Figure D.13. The black blobs displayed in Figure D.14 are used as masks to process fields like those shown in Figure D.12. Upon closer inspec-tion, it was discovered that the 1040T forms contain two differently sized circle fields. The first twelve circle fields on the front of the 1040T forms are approximately 3.5 mm in diameter, whereas the remaining mark-sense fields on the font and back sides of the forms are approximately 2.5 mm in diameter. The right image in Figure D.14 shows the mask used to process the fields containing the smaller circles. Inconsistency in circle size such as this contribute nothing to the human or machine readability of the forms, but only add implementation complexities for the recognition system engineer.
Figure D.14. Different sized filled circles used as masks for mark-sense fields on the 1040T forms.
To process circle fields, the appropriate mark image from Figure D.14 is overlaid and used as a mask on top of the isolated image of the field itself. The number of black pixels within the mask region are counted and, if the num-ber is sufficiently high, the field is determined to contain a mark. Note that empty circle fields will not always be com-pletely void of black pixel information. Writing from neighboring fields may be present and noise within the image due to digitization is possible. Therefore, the accumulation of black pixels for fields containing 3.5 mm diameter circles are thresholded at 45 pixels. If the number of black pixels within the mask region is greater than 45 pixels, then the field is determined to contain a mark. Otherwise, the field is determined to be empty. For fields containing 2.5 mm diameter circles, a threshold of 30 is used. These thresholds were empirically derived through observing the pixels counts derived from a large sample of marks on the 1040T forms.
D.8.2 Signature Fields
A second type of icon field on the 1040T forms is signature fields. Signatures are typically written in cursive script, which is currently not handled by the NIST Model Recognition System. Rather than transcribing the actual sig-nature, the recognition system simply checks to see if a signature is present in the field similar to the process of mark
BINARY IMAGE GRAYSCALE IMAGEOF SUMMED MARKSOF ORed MARKS
FILLED 3.5 mm FILLED 2.5 mmCIRCLECIRCLE

D18
detection within the circle fields. The writers filling out the samples of completed 1040T forms in this study were not instructed to enter signatures on the forms. In light of this, only a small number of signatures are provided giving us a very limited number of examples to work with for development. Through empirical study, it was determined that a threshold of 2,000 pixels should be used. The number of black pixels within an isolated signature field are counted, and if the count is greater than 2,000 the field is determined to contain a signature. Remember that the writer’s were not instructed to fill in the signature fields, so that when a signature is actually detected by the system it is scored as an error. Human versus machine errors will be discussed later.

E1
APPENDIX E. SYSTEM CONFIGURATION RESULTS
LEGEND
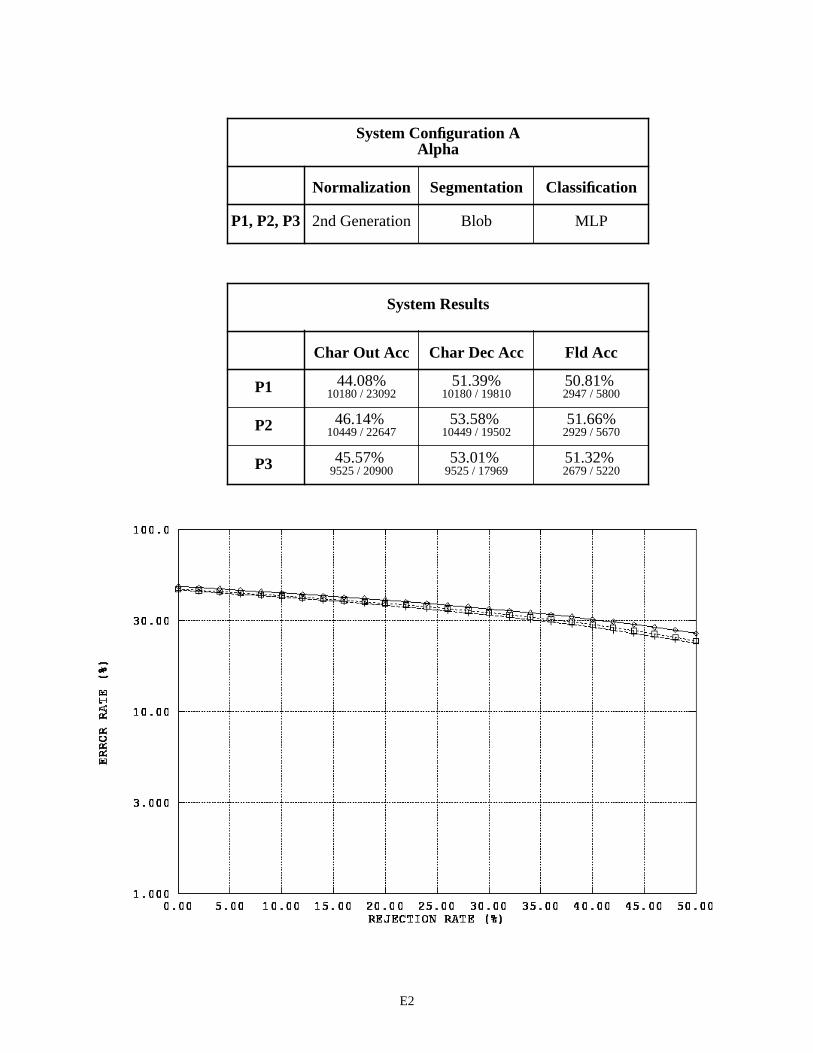
E2
System Results
Char Dec AccChar Out Acc Fld Acc
P1
P2
P3
10180 / 1981010180 / 2309244.08%
2947 / 580050.81%
10449 / 1950253.58%
10449 / 2264746.14%
2929 / 567051.66%
9525 / 1796953.01%
9525 / 2090045.57%
2679 / 522051.32%
51.39%
System Configuration A
SegmentationNormalization Classification
P1, P2, P3 2nd Generation MLPBlob
Alpha

E3
System Configuration A
SegmentationNormalization Classification
P1, P2, P3 1st Generation MLPBlob
Float
System Results
Char Dec AccChar Out Acc Fld Acc
P1
P2
P3
22265 / 2653522265 / 2923776.15%
11064 / 1433677.18%
24309/ 2769987.76%
24309 / 2868784.74%
11678 / 1407482.98%
21340 / 2602981.99%
21340 / 2702578.96%
10288 / 1331677.26%
83.91%
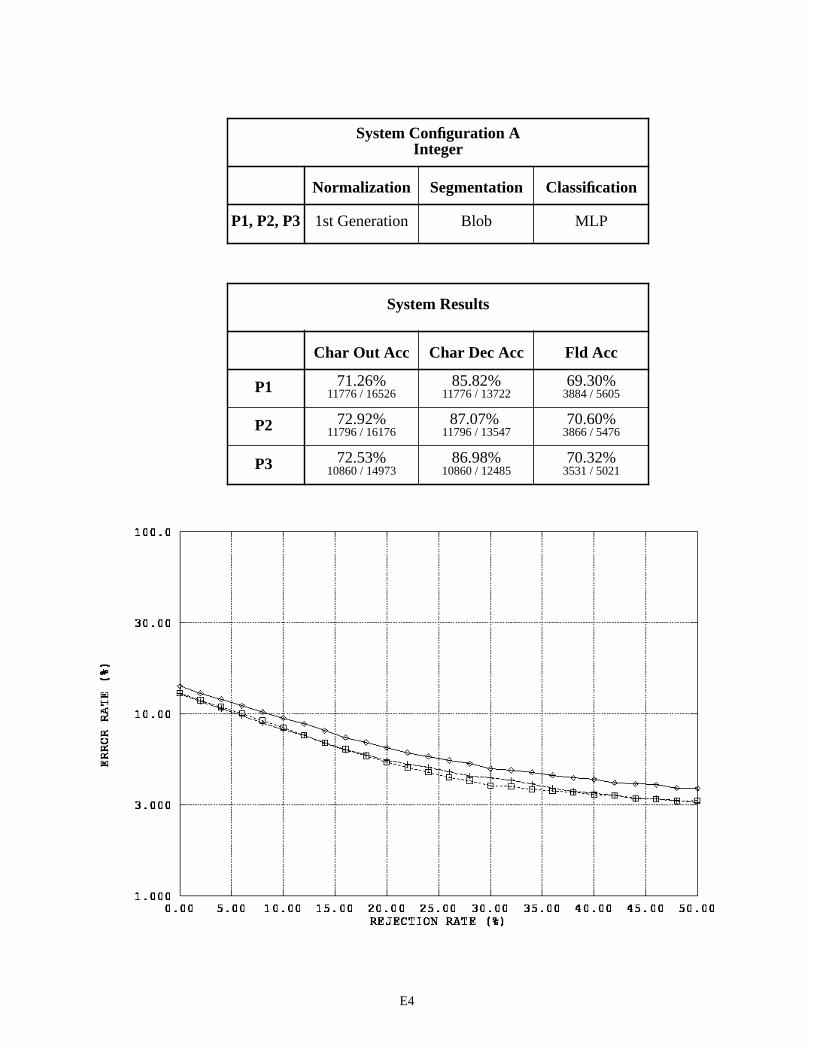
E4
System Results
System Configuration A
SegmentationNormalization Classification
P1, P2, P3 1st Generation MLPBlob
Integer
Char Dec AccChar Out Acc Fld Acc
P1
P2
P3
11776 / 1372211776 / 1652671.26%
3884 / 560569.30%
11796 / 1354787.07%
11796 / 1617672.92%
3866 / 547670.60%
10860 / 1248586.98%
10860 / 1497372.53%
3531 / 502170.32%
85.82%

E5
* Blob segmentor used in place of cut segmentor on fields with no inter-character marks.
System Configuration B
SegmentationNormalization Classification
P1, P2, P3 2nd Generation MLPCut*
Alpha
System Results
Char Dec AccChar Out Acc Fld Acc
P1
P2
P3
10048 / 1930710048 / 2309243.51%
2955 / 580050.95%
10053 / 1902652.84%
10053 / 2264744.39%
2912 / 567051.36%
9091 / 1749451.97%
9091 / 2090043.50%
2681 / 522051.36%
52.04%
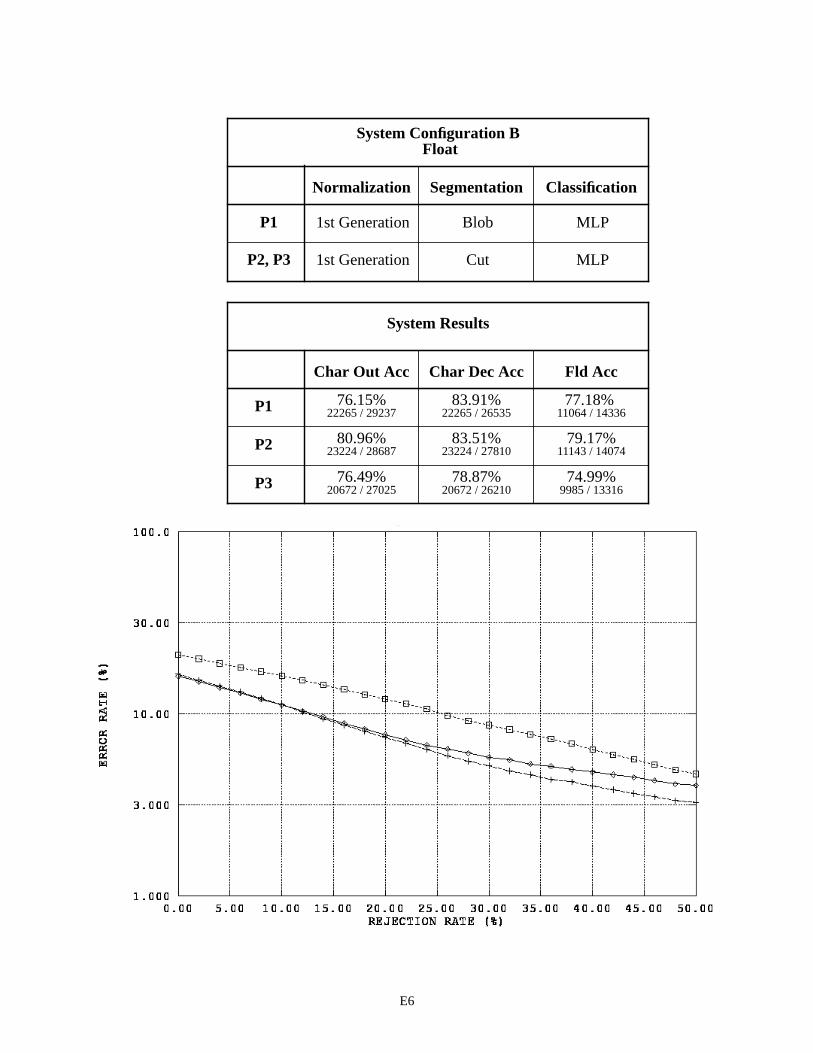
E6
System Results
System Configuration B
SegmentationNormalization Classification
P1
P2, P3
1st Generation MLP
Cut1st Generation MLP
Blob
Float
Char Dec AccChar Out Acc Fld Acc
P1
P2
P3
22265 / 2653522265 / 2923776.15%
11064 / 1433677.18%
23224 / 2781083.51%
23224 / 2868780.96%
11143 / 1407479.17%
20672 / 2621078.87%
20672 / 2702576.49%
9985 / 1331674.99%
83.91%
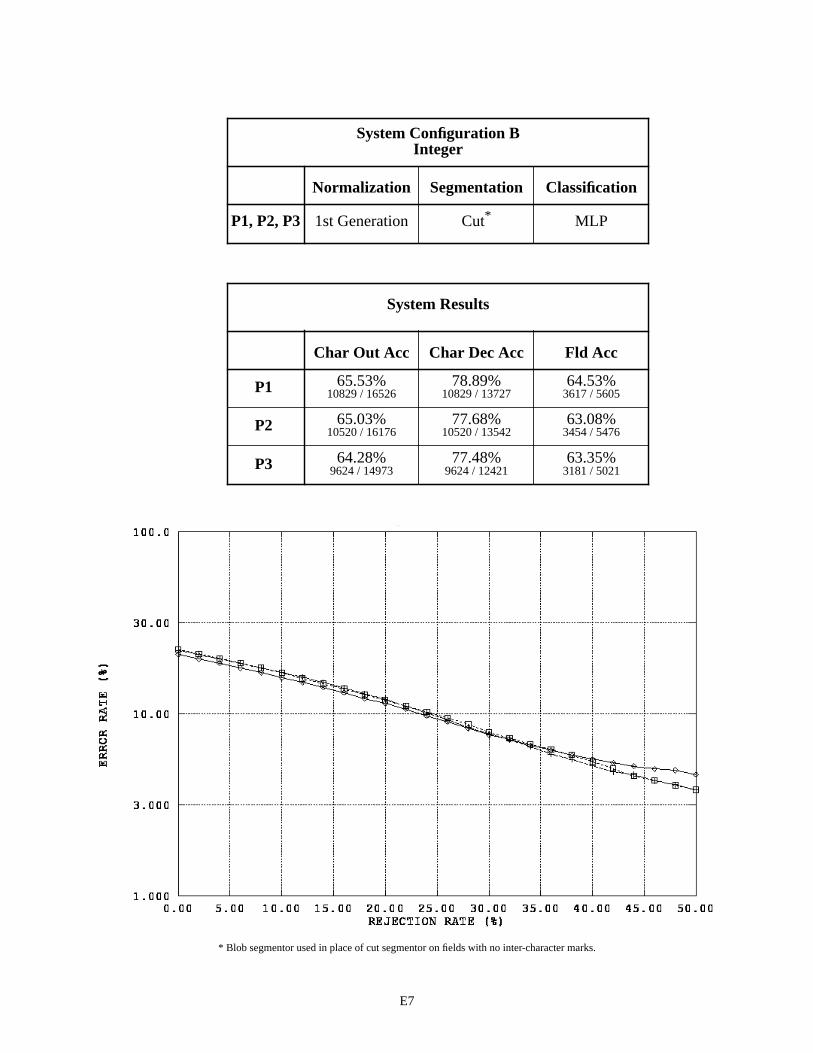
E7
* Blob segmentor used in place of cut segmentor on fields with no inter-character marks.
System Results
System Configuration B
SegmentationNormalization Classification
P1, P2, P3 1st Generation MLPCut*
Integer
Char Dec AccChar Out Acc Fld Acc
P1
P2
P3
10829 / 1372710829 / 1652665.53%
3617 / 560564.53%
10520 / 1354277.68%
10520 / 1617665.03%
3454 / 547663.08%
9624 / 1242177.48%
9624 / 1497364.28%
3181 / 502163.35%
78.89%

E8
System Results
System Configuration C
SegmentationNormalization Classification
P1, P2, P3 2nd Generation PNNBlob
Alpha
Char Dec AccChar Out Acc Fld Acc
P1
P2
P3
11701 / 1981011701 / 2309250.67%
3124 / 580053.86%
12037 / 1950261.72%
12037 / 2264753.15%
3132 / 567055.24%
11100 / 1796961.77%
11100 / 2090053.11%
2901 / 522055.57%
59.07%
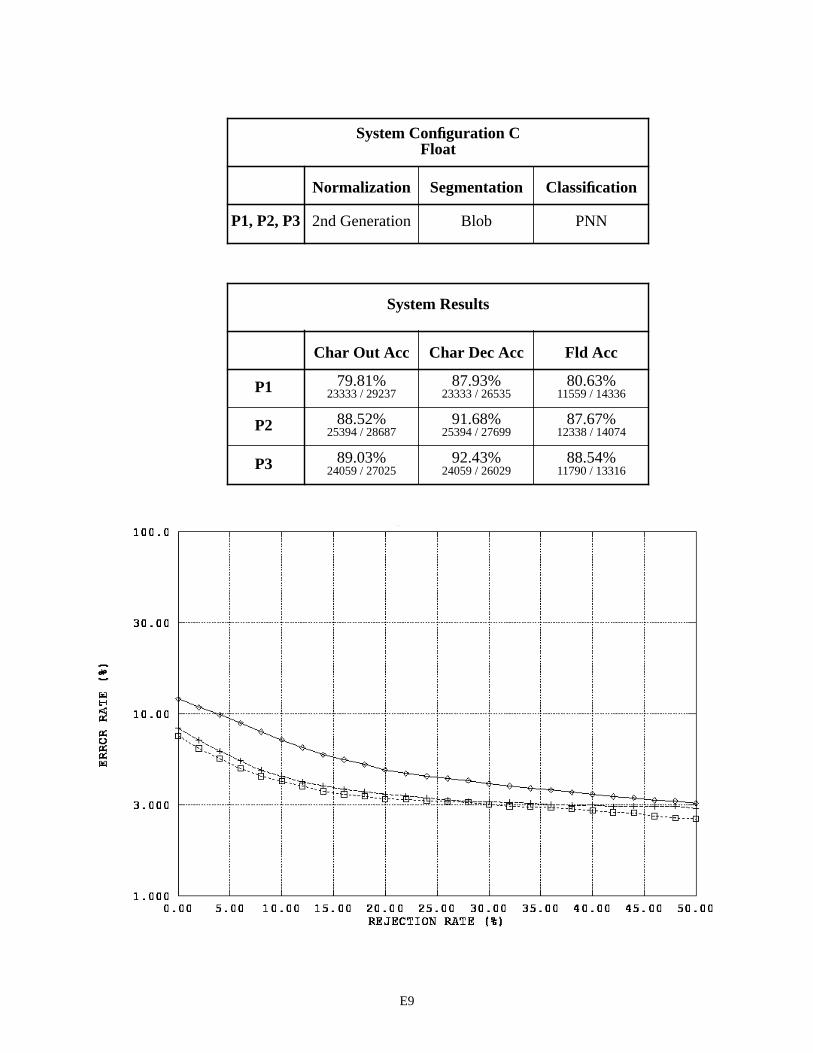
E9
System Results
System Configuration C
SegmentationNormalization Classification
P1, P2, P3 2nd Generation PNNBlob
Float
Char Dec AccChar Out Acc Fld Acc
P1
P2
P3
23333 / 2653523333 / 2923779.81%
11559 / 1433680.63%
25394 / 2769991.68%
25394 / 2868788.52%
12338 / 1407487.67%
24059 / 2602992.43%
24059 / 2702589.03%
11790 / 1331688.54%
87.93%

E10
System Results
System Configuration C
SegmentationNormalization Classification
P1, P2, P3 2nd Generation PNNBlob
Integer
Char Dec AccChar Out Acc Fld Acc
P1
P2
P3
12381 / 1372212381 / 1652674.92%
4200 / 560574.93%
12410 / 1354791.61%
12410 / 1617676.72%
4199 / 547676.68%
11408 / 1248591.37%
11408 / 1497376.19%
3823 / 502176.14%
90.23%
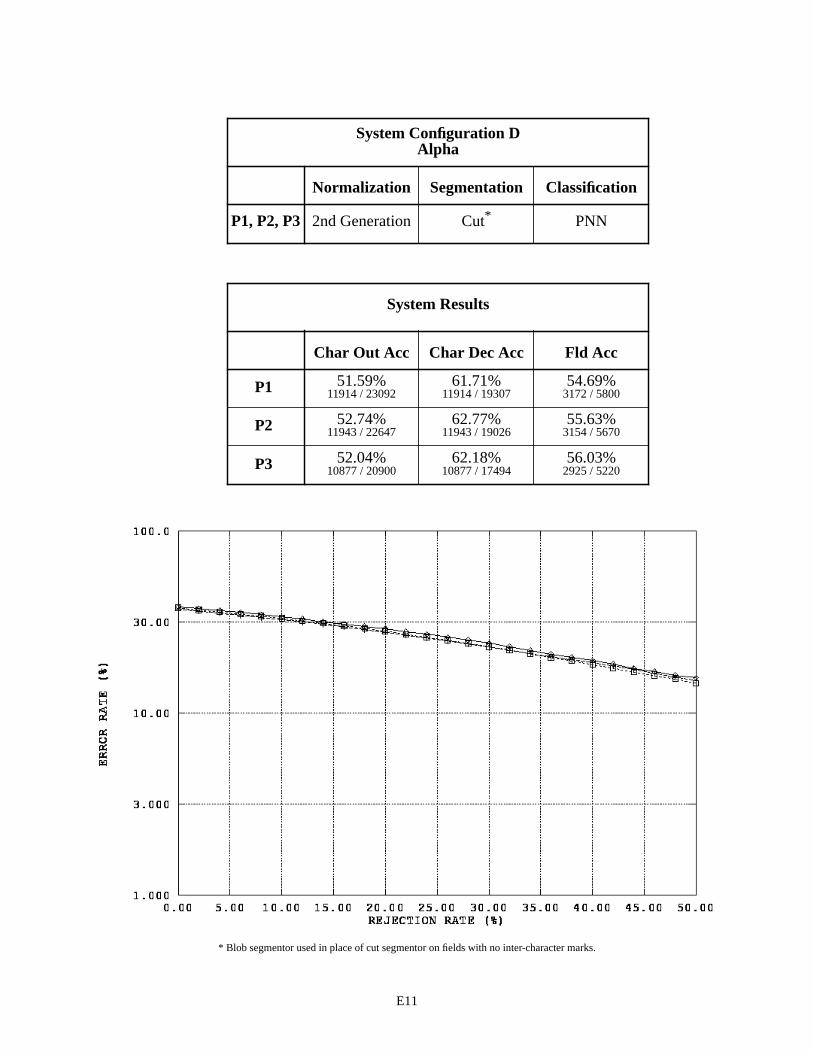
E11
* Blob segmentor used in place of cut segmentor on fields with no inter-character marks.
System Results
System Configuration D
SegmentationNormalization Classification
P1, P2, P3 2nd Generation PNNCut*
Alpha
Char Dec AccChar Out Acc Fld Acc
P1
P2
P3
11914 / 1930711914 / 2309251.59%
3172 / 580054.69%
11943 / 1902662.77%
11943 / 2264752.74%
3154 / 567055.63%
10877 / 1749462.18%
10877 / 2090052.04%
2925 / 522056.03%
61.71%

E12
System Results
System Configuration D
SegmentationNormalization Classification
P1
P2, P3
2nd Generation PNN
Cut2nd Generation PNN
Blob
Float
Char Dec AccChar Out Acc Fld Acc
P1
P2
P3
23333 / 2653523333 / 2923779.81%
11559 / 1433680.63%
24526 / 2781088.19%
24526 / 2868785.50%
11817 / 1407483.96%
23954 / 2621091.39%
23954 / 2702588.64%
11726 / 1331688.06%
87.93%
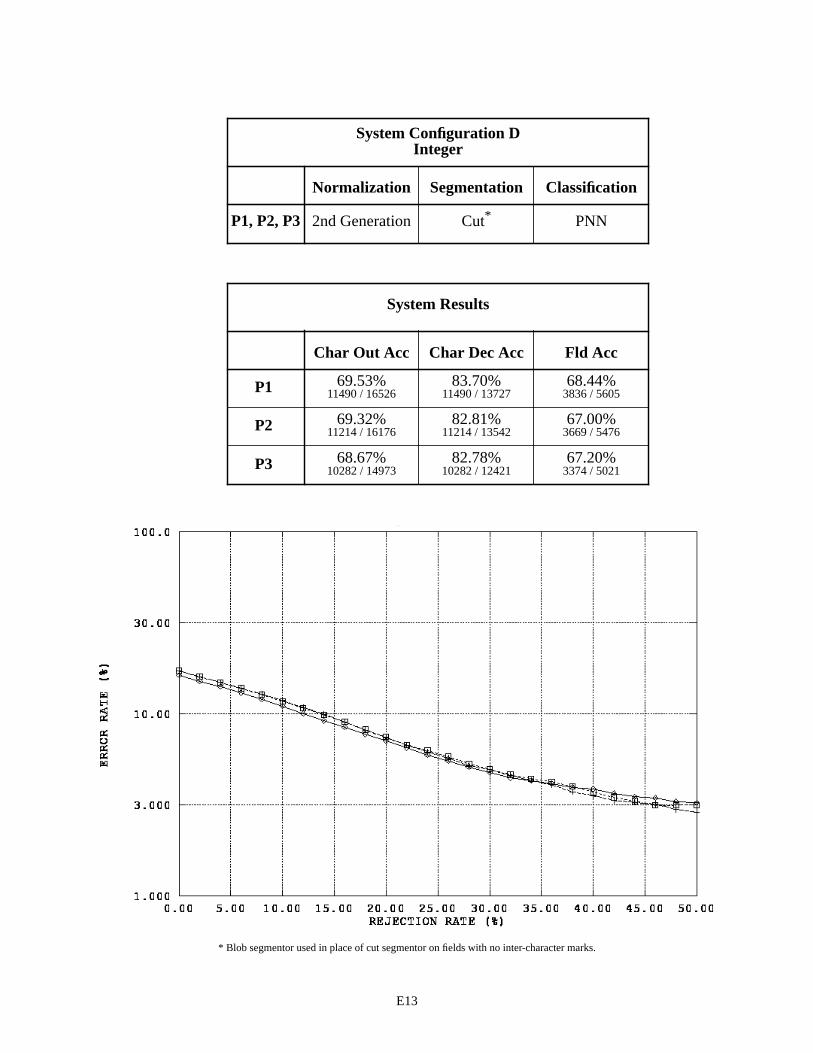
E13
* Blob segmentor used in place of cut segmentor on fields with no inter-character marks.
System Results
System Configuration D
SegmentationNormalization Classification
P1, P2, P3 2nd Generation PNNCut*
Integer
Char Dec AccChar Out Acc Fld Acc
P1
P2
P3
11490 / 1372711490 / 1652669.53%
3836 / 560568.44%
11214 / 1354282.81%
11214 / 1617669.32%
3669 / 547667.00%
10282 / 1242182.78%
10282 / 1497368.67%
3374 / 502167.20%
83.70%

E14
System Results
System Configuration E
SegmentationNormalization Classification
P1, P2, P3 3rd Generation PNNBlob
Alpha
Char Dec AccChar Out Acc Fld Acc
P1
P2
P3
11553 / 1981011553 / 2309250.03%
3107 / 580053.57%
11876 / 1950260.90%
11876 / 2264752.44%
3099 / 567054.66%
11026 / 1796961.36%
11026 / 2090052.76%
2871 / 522055.00%
58.32%

E15
System Results
System Configuration E
SegmentationNormalization Classification
P1, P2, P3 3rd Generation PNNBlob
Float
Char Dec AccChar Out Acc Fld Acc
P1
P2
P3
23275 / 2653523275 / 2923779.61%
11525 / 1433680.39%
25320 / 2769991.41%
25320 / 2868788.26%
12288 / 1407487.31%
24023 / 2602992.29%
24023 / 2702588.89%
11776 / 1331688.44%
87.71%
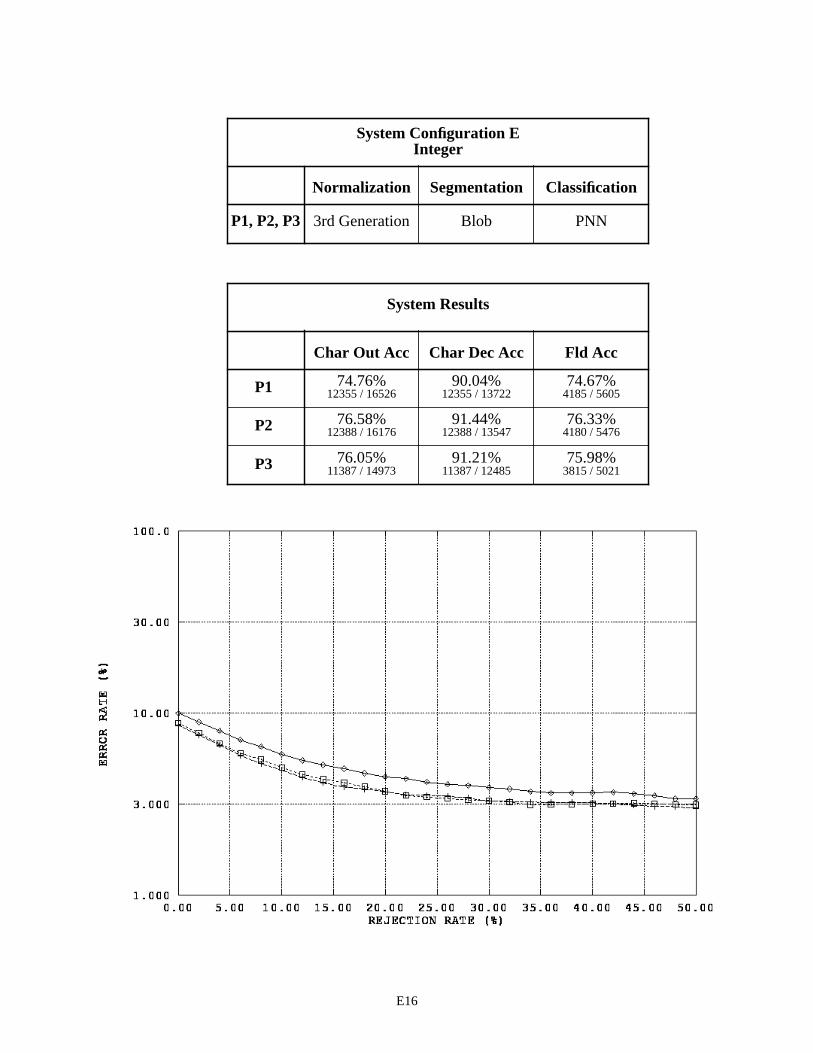
E16
System Results
System Configuration E
SegmentationNormalization Classification
P1, P2, P3 3rd Generation PNNBlob
Integer
Char Dec AccChar Out Acc Fld Acc
P1
P2
P3
12355 / 1372212355 / 1652674.76%
4185 / 560574.67%
12388 / 1354791.44%
12388 / 1617676.58%
4180 / 547676.33%
11387 / 1248591.21%
11387 / 1497376.05%
3815 / 502175.98%
90.04%

E17
* Blob segmentor used in place of cut segmentor on fields with no inter-character marks.
System Results
System Configuration F
SegmentationNormalization Classification
P1, P2, P3 3rd Generation PNNCut*
Alpha
Char Dec AccChar Out Acc Fld Acc
P1
P2
P3
12435 / 1930712435 / 2309253.85%
3234 / 580055.76%
12602 / 1902666.24%
12602 / 2264755.65%
3227 / 567056.91%
11505 / 1749465.77%
11505 / 2090055.05%
2986 / 522057.20%
64.41%
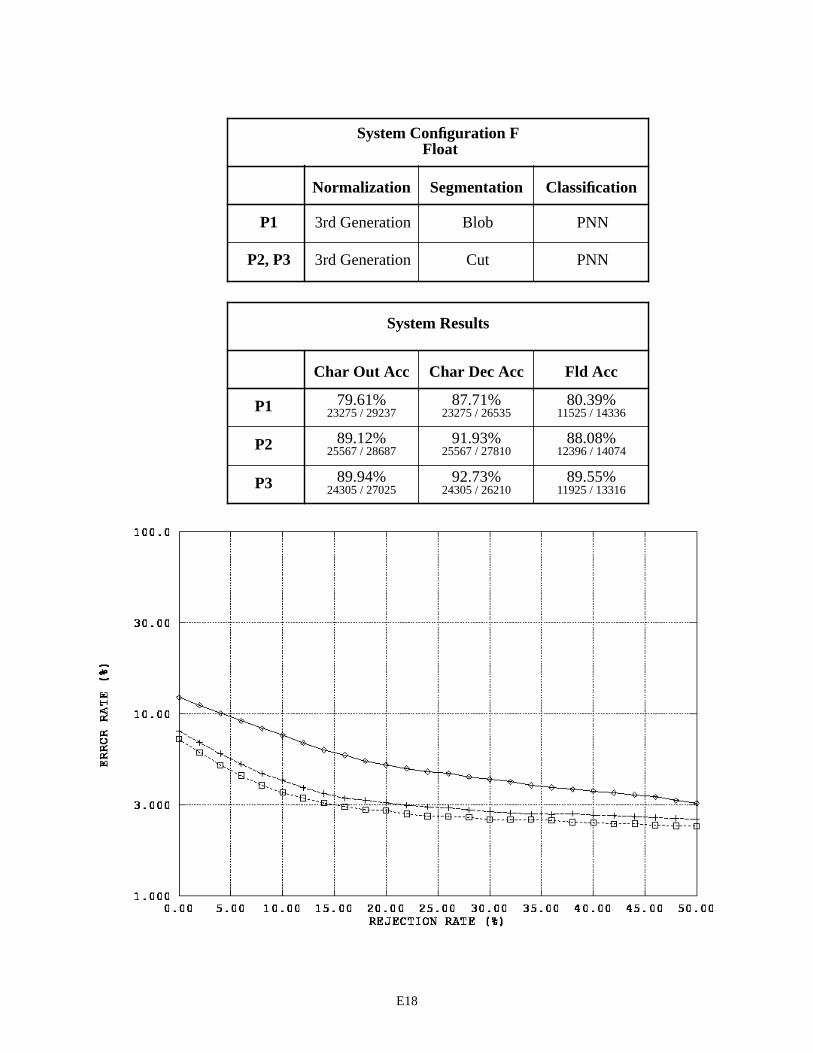
E18
System Results
System Configuration F
SegmentationNormalization Classification
P1
P2, P3
3rd Generation PNN
Cut3rd Generation PNN
Blob
Float
Char Dec AccChar Out Acc Fld Acc
P1
P2
P3
23275 / 2653523275 / 2923779.61%
11525 / 1433680.39%
25567 / 2781091.93%
25567 / 2868789.12%
12396 / 1407488.08%
24305 / 2621092.73%
24305 / 2702589.94%
11925 / 1331689.55%
87.71%

E19
* Blob segmentor used in place of cut segmentor on fields with no inter-character marks.
System Results
System Configuration F
SegmentationNormalization Classification
P1, P2, P3 3rd Generation PNNCut*
Integer
Char Dec AccChar Out Acc Fld Acc
P1
P2
P3
12255 / 1372712255 / 1652674.16%
4171 / 560574.42%
12259 / 1354290.53%
12259 / 1617675.79%
4130 / 547675.42%
11161 / 1242189.86%
11161 / 1497374.54%
3708 / 502173.85%
89.28%
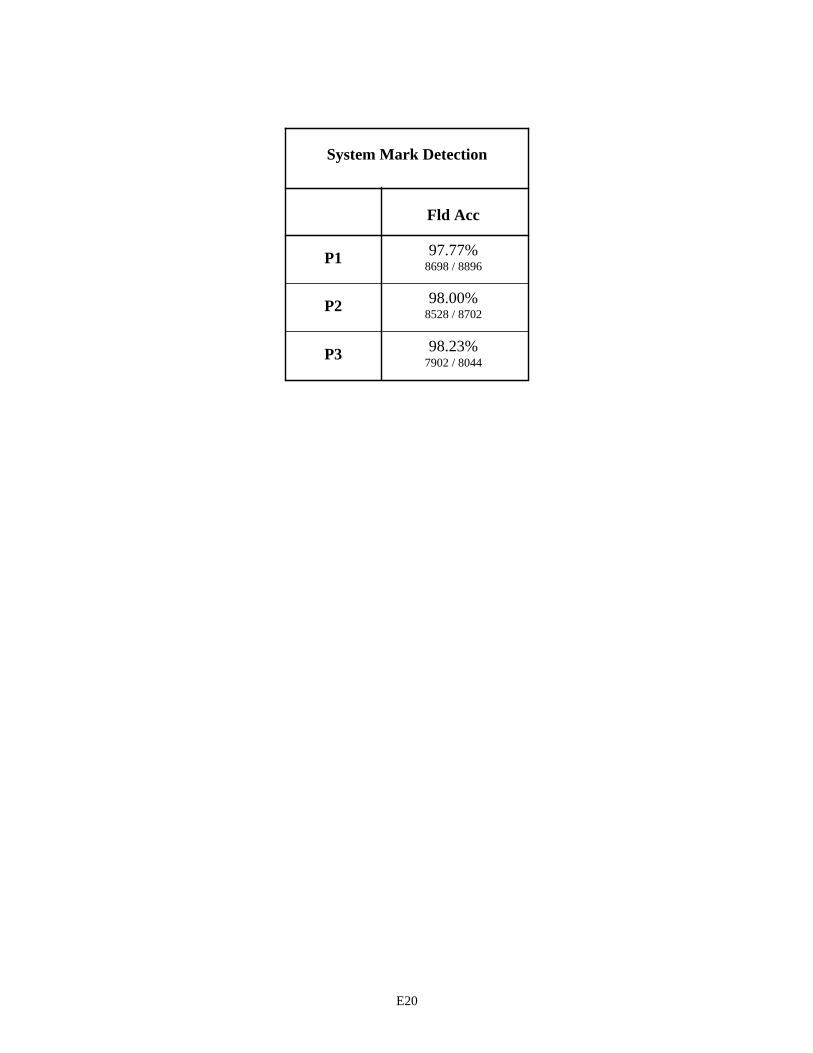
E20
System Mark Detection
Fld Acc
P1
P2
P3
8698 / 889697.77%
8528 / 870298.00%
7902 / 804498.23%

F1
APPENDIX F. FIELD-BASED RESULTS

F2
System Results
System Configuration A
SegmentationNormalization Classification
P1, P2, P3 1st Generation MLPBlob
p060
Char Dec AccChar Out Acc Fld Acc
P1
P2
P3
1058 / 12371058 / 125384.44%
75 / 17941.90%
1089 / 122488.97%
1089 / 123288.39%
91 / 17651.70%
679 / 90874.78%
679 / 90375.19%
23 / 12917.83%
85.53%
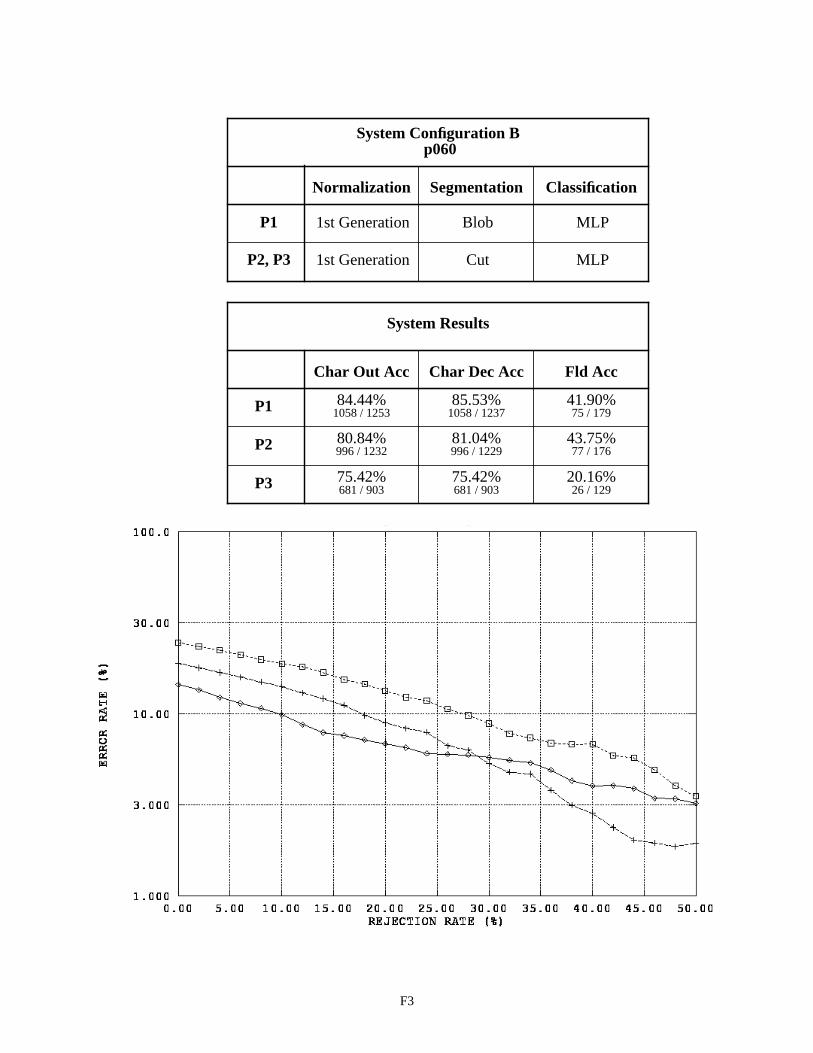
F3
System Results
System Configuration B
SegmentationNormalization Classification
P1
P2, P3
1st Generation MLP
Cut1st Generation MLP
Blob
p060
Char Dec AccChar Out Acc Fld Acc
P1
P2
P3
1058 / 12371058 / 125384.44%
75 / 17941.90%
996 / 122981.04%
996 / 123280.84%
77 / 17643.75%
681 / 90375.42%
681 / 90375.42%
26 / 12920.16%
85.53%
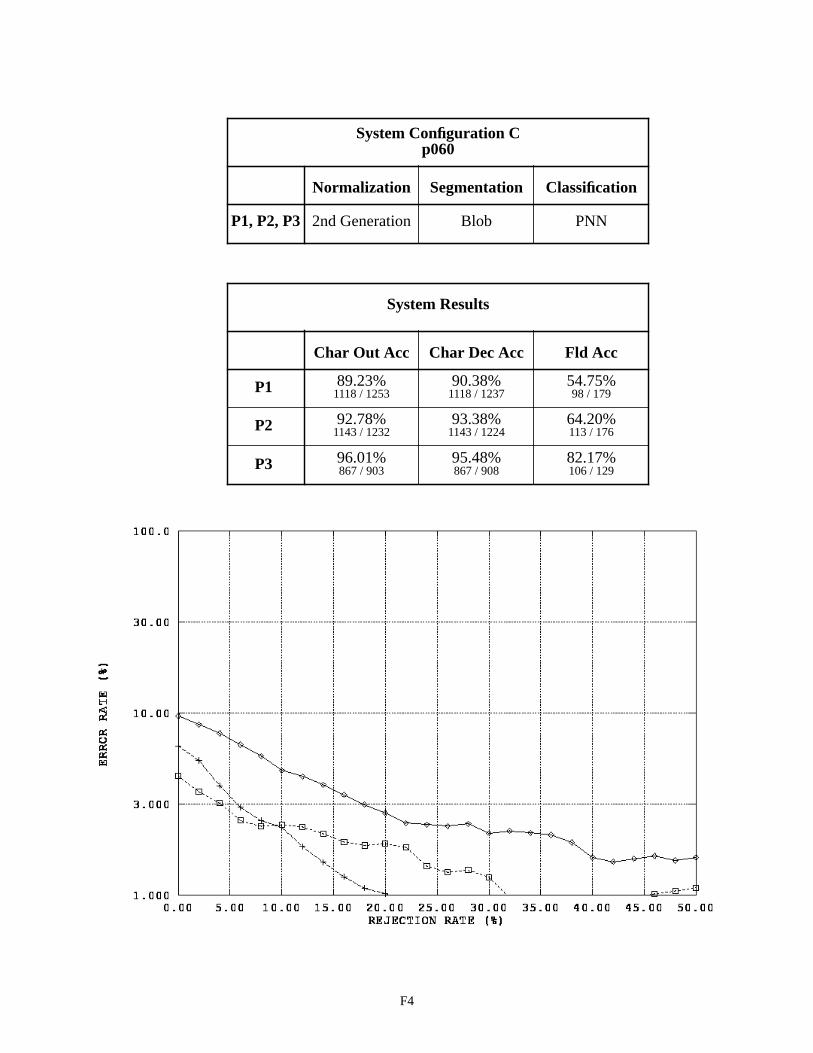
F4
System Results
System Configuration C
SegmentationNormalization Classification
P1, P2, P3 2nd Generation PNNBlob
p060
Char Dec AccChar Out Acc Fld Acc
P1
P2
P3
1118 / 12371118 / 125389.23%
98 / 17954.75%
1143 / 122493.38%
1143 / 123292.78%
113 / 17664.20%
867 / 90895.48%
867 / 90396.01%
106 / 12982.17%
90.38%
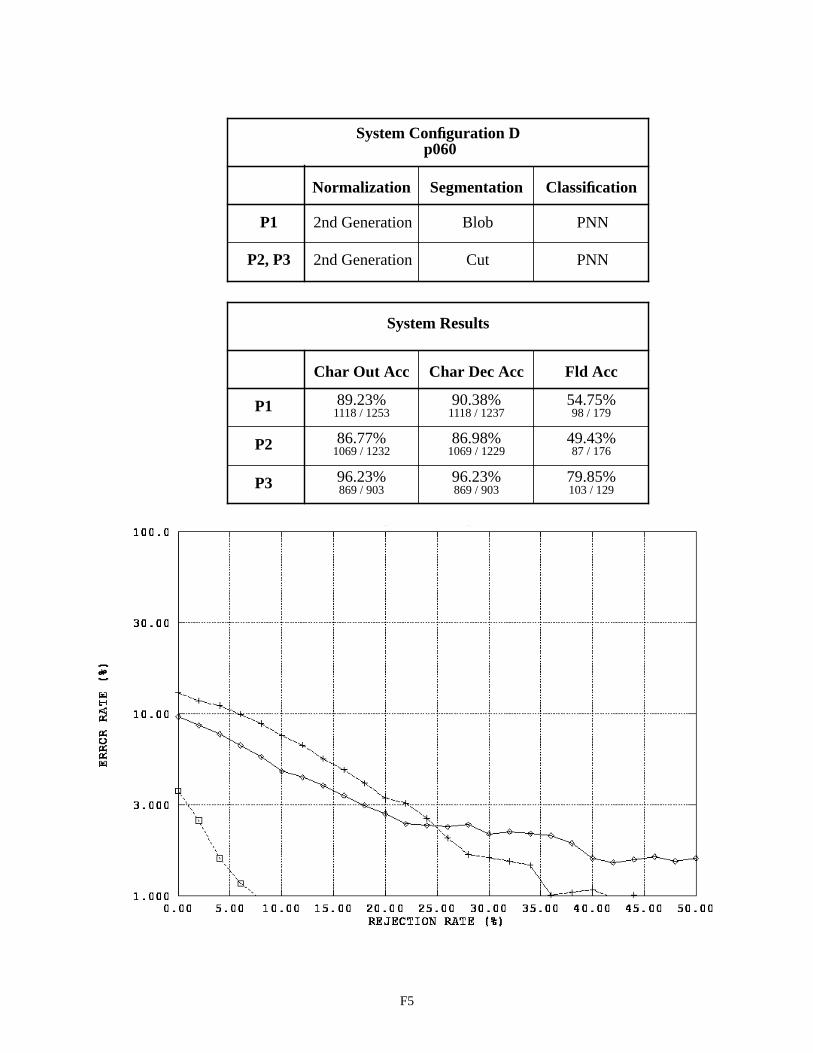
F5
System Results
System Configuration D
SegmentationNormalization Classification
P1
P2, P3
2nd Generation PNN
Cut2nd Generation PNN
Blob
p060
Char Dec AccChar Out Acc Fld Acc
P1
P2
P3
1118 / 12371118 / 125389.23%
98 / 17954.75%
1069 / 122986.98%
1069 / 123286.77%
87 / 17649.43%
869 / 90396.23%
869 / 90396.23%
103 / 12979.85%
90.38%
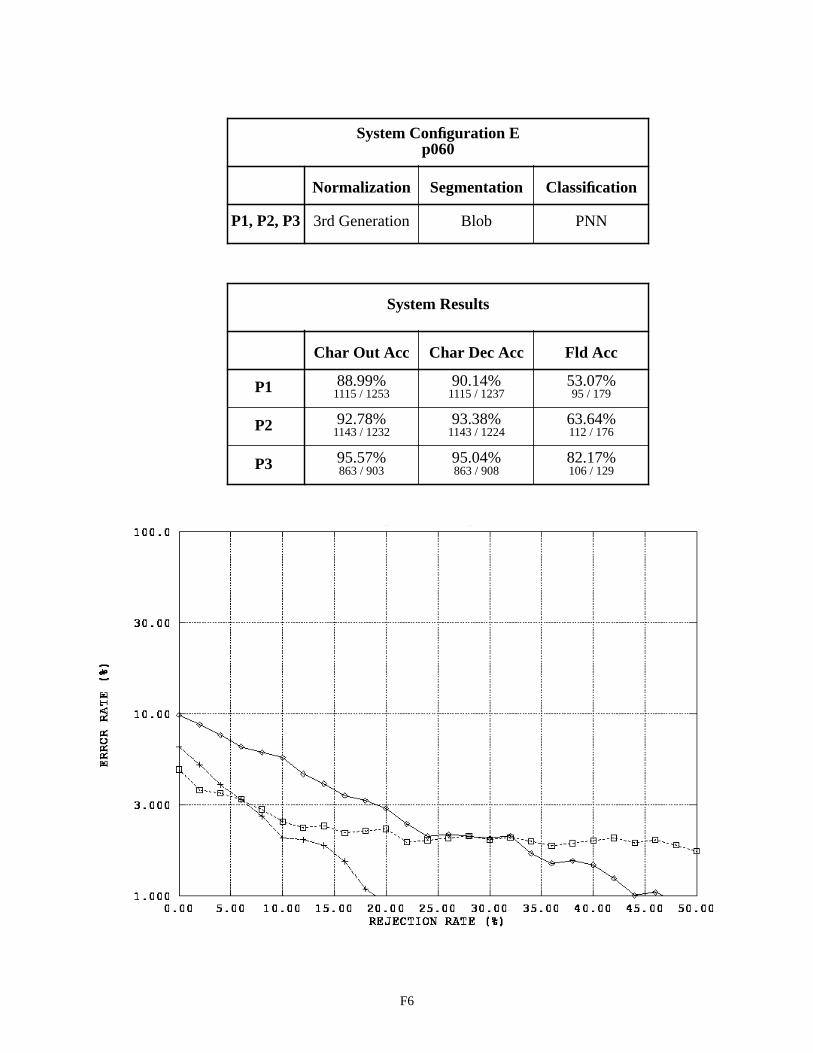
F6
System Results
System Configuration E
SegmentationNormalization Classification
P1, P2, P3 3rd Generation PNNBlob
p060
Char Dec AccChar Out Acc Fld Acc
P1
P2
P3
1115 / 12371115 / 125388.99%
95 / 17953.07%
1143 / 122493.38%
1143 / 123292.78%
112 / 17663.64%
863 / 90895.04%
863 / 90395.57%
106 / 12982.17%
90.14%

F7
System Results
System Configuration F
SegmentationNormalization Classification
P1
P2, P3
3rd Generation PNN
Cut3rd Generation PNN
Blob
p060
Char Dec AccChar Out Acc Fld Acc
P1
P2
P3
1115 / 12371115 / 125388.99%
95 / 17953.07%
1160 / 122994.39%
1160 / 123294.16%
122 / 17669.32%
878 / 90397.23%
878 / 90397.23%
110 / 12985.27%
90.14%

F8
System Results
Char Dec AccChar Out Acc Fld Acc
P1
P2
P3
1165 / 13391165 / 135985.72%
70 / 15146.36%
1201 / 140085.79
1201 / 142284.46%
69 / 15843.67%
1143 / 130187.86
1143 / 130587.59%
67 / 14546.21
87.01%
System Configuration A
SegmentationNormalization Classification
P1, P2, P3 1st Generation MLPBlob
p045

F9
System Configuration B
SegmentationNormalization Classification
P1, P2, P3 1st Generation MLPCut
p045
System Results
Char Dec AccChar Out Acc Fld Acc
P1
P2
P3
1086 / 13561086 / 135979.91%
34 / 15122.52%
1027 / 142172.27%
1027 / 142272.22%
19 / 15812.03
1020 / 130178.40%
1020 / 130578.16%
32 / 14522.07
80.09%

F10
System Results
System Configuration C
SegmentationNormalization Classification
P1, P2, P3 2nd Generation PNNBlob
p045
Char Dec AccChar Out Acc Fld Acc
P1
P2
P3
1240 / 13391240 / 135991.24%
90 / 15159.60%
1297 / 140092.64%
1297 / 142291.21%
101 / 15863.92%
1207 / 130192.77%
1207 / 130592.49%
90 / 14562.07%
92.61%
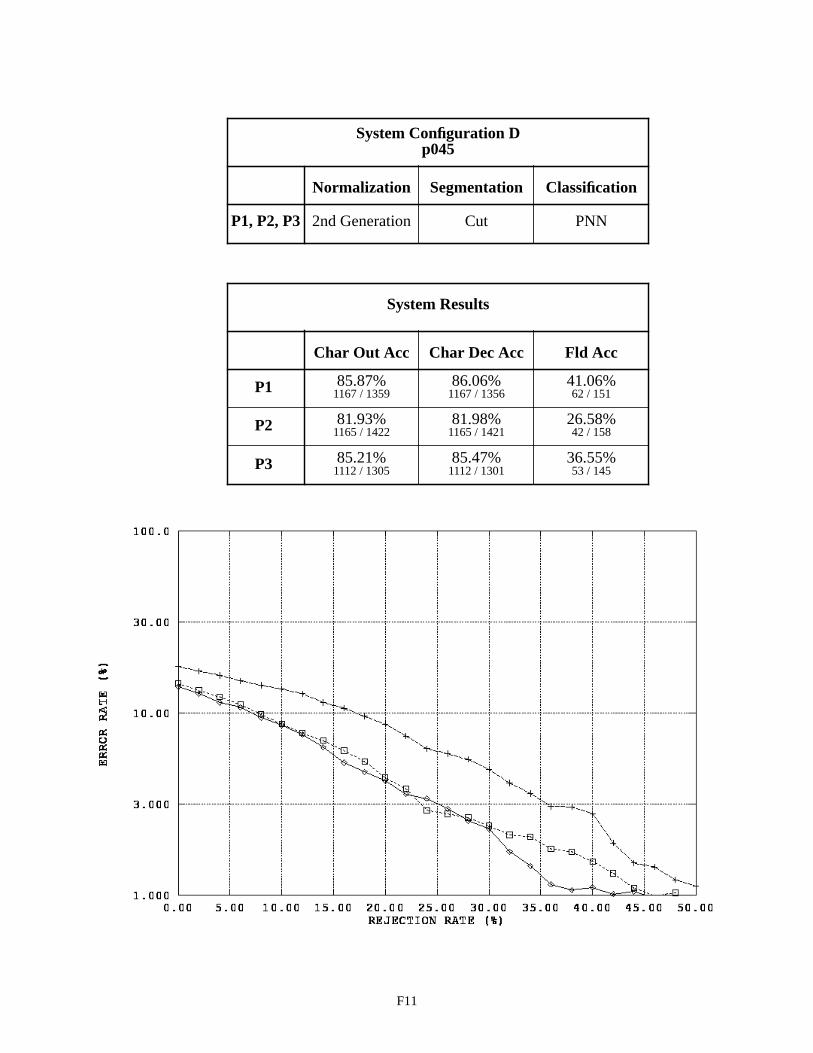
F11
System Results
System Configuration D
SegmentationNormalization Classification
P1, P2, P3 2nd Generation PNNCut
p045
Char Dec AccChar Out Acc Fld Acc
P1
P2
P3
1167 / 13561167 / 135985.87%
62 / 15141.06%
1165 / 142181.98%
1165 / 142281.93%
42 / 15826.58%
1112 / 130185.47%
1112 / 130585.21%
53 / 14536.55%
86.06%
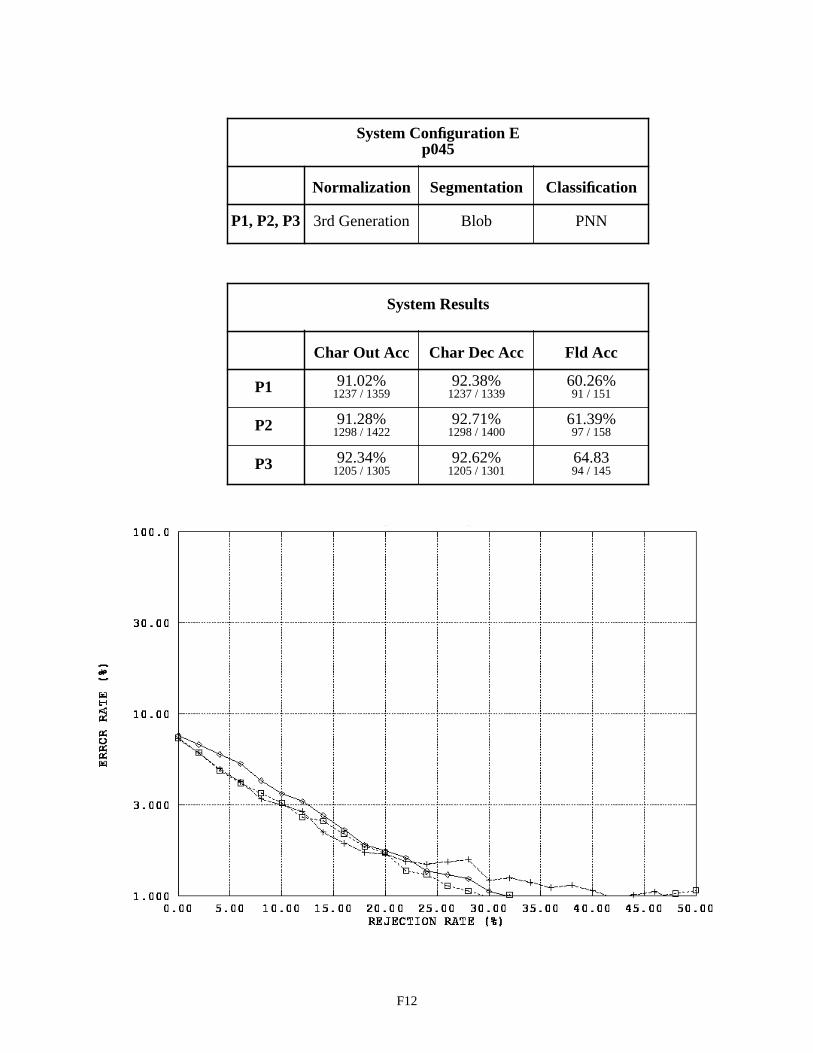
F12
System Results
System Configuration E
SegmentationNormalization Classification
P1, P2, P3 3rd Generation PNNBlob
p045
Char Dec AccChar Out Acc Fld Acc
P1
P2
P3
1237 / 13391237 / 135991.02%
91 / 15160.26%
1298 / 140092.71%
1298 / 142291.28%
97 / 15861.39%
1205 / 130192.62%
1205 / 130592.34%
94 / 14564.83
92.38%

F13
System Results
System Configuration F
SegmentationNormalization Classification
P1, P2, P3 3rd Generation PNNCut
p045
Char Dec AccChar Out Acc Fld Acc
P1
P2
P3
1235 / 13561235 / 135990.88%
80 / 15152.98%
1295 / 142191.13%
1295 / 142291.07%
91 / 15857.59%
1180 / 130190.70%
1180 / 130590.42%
70 / 14548.28
91.08%

F14
System Results
System Configuration A
SegmentationNormalization Classification
P1, P2, P3 1st Generation MLPBlob
p161
Char Dec AccChar Out Acc Fld Acc
P1
P2
P3
1411 / 15611411 / 156690.10%
82 / 17447.13%
1415 / 159688.66%
1415 / 160288.33%
83 / 17846.63%
1358 / 153488.53%
1358 / 153088.76%
66 / 17038.82%
90.39%
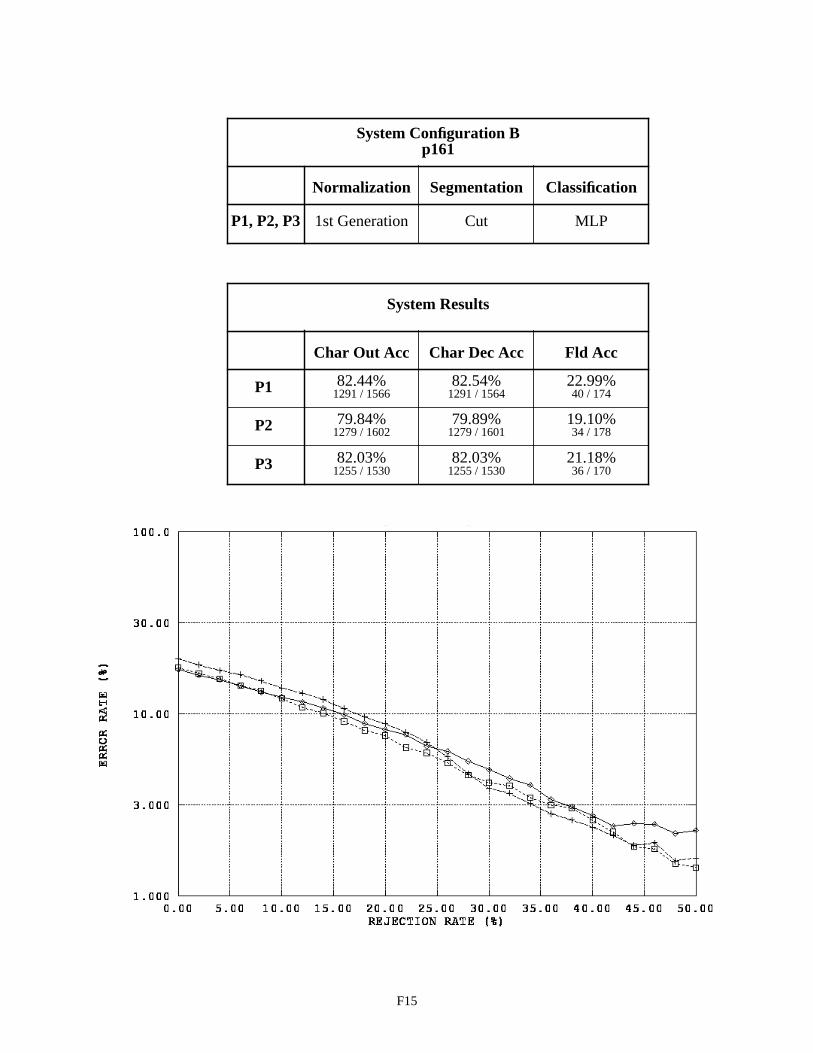
F15
System Results
System Configuration B
SegmentationNormalization Classification
P1, P2, P3 1st Generation MLPCut
p161
Char Dec AccChar Out Acc Fld Acc
P1
P2
P3
1291 / 15641291 / 156682.44%
40 / 17422.99%
1279 / 160179.89%
1279 / 160279.84%
34 / 17819.10%
1255 / 153082.03%
1255 / 153082.03%
36 / 17021.18%
82.54%

F16
System Results
System Configuration C
SegmentationNormalization Classification
P1, P2, P3 2nd Generation PNNBlob
p161
Char Dec AccChar Out Acc Fld Acc
P1
P2
P3
1466 / 15611466 / 156693.61%
100 / 17457.47%
1486 / 159693.11%
1486 / 160292.76%
109 / 17861.24%
1446 / 153494.26%
1446 / 153094.51%
113 / 17066.47%
93.91%

F17
System Results
System Configuration D
SegmentationNormalization Classification
P1, P2, P3 2nd Generation PNNCut
p161
Char Dec AccChar Out Acc Fld Acc
P1
P2
P3
1343 / 15641343 / 156685.76%
48 / 17427.59%
1361 / 160185.01%
1361 / 160284.96%
45 / 17825.28%
1315 / 153085.95%
1315 / 153085.95%
54 / 17031.76%
85.87%
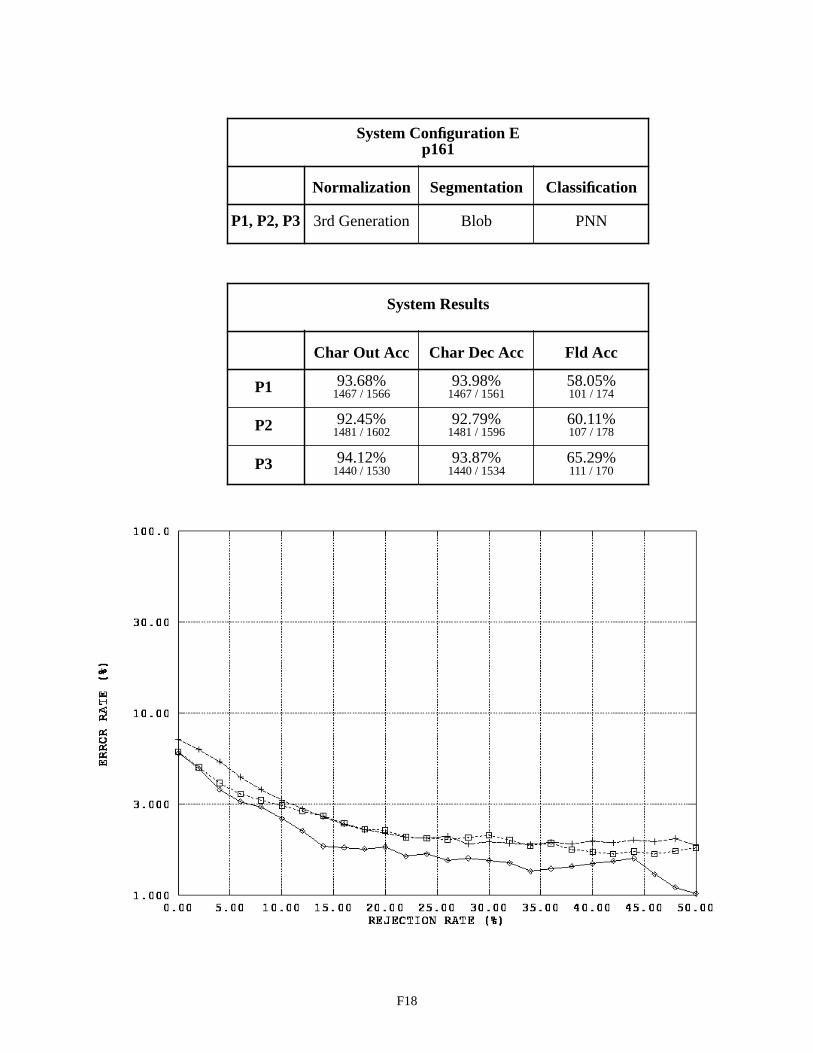
F18
System Results
System Configuration E
SegmentationNormalization Classification
P1, P2, P3 3rd Generation PNNBlob
p161
Char Dec AccChar Out Acc Fld Acc
P1
P2
P3
1467 / 15611467 / 156693.68%
101 / 17458.05%
1481 / 159692.79%
1481 / 160292.45%
107 / 17860.11%
1440 / 153493.87%
1440 / 153094.12%
111 / 17065.29%
93.98%
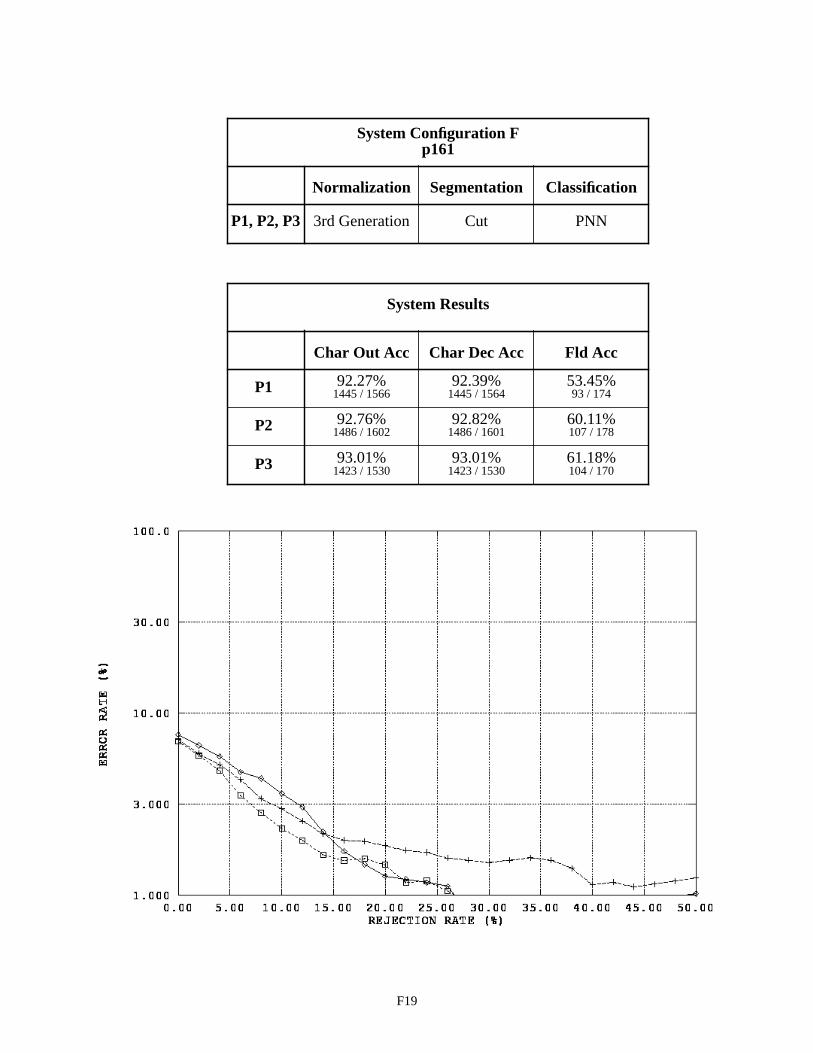
F19
System Results
System Configuration F
SegmentationNormalization Classification
P1, P2, P3 3rd Generation PNNCut
p161
Char Dec AccChar Out Acc Fld Acc
P1
P2
P3
1445 / 15641445 / 156692.27%
93 / 17453.45%
1486 / 160192.82%
1486 / 160292.76%
107 / 17860.11%
1423 / 153093.01%
1423 / 153093.01%
104 / 17061.18%
92.39%
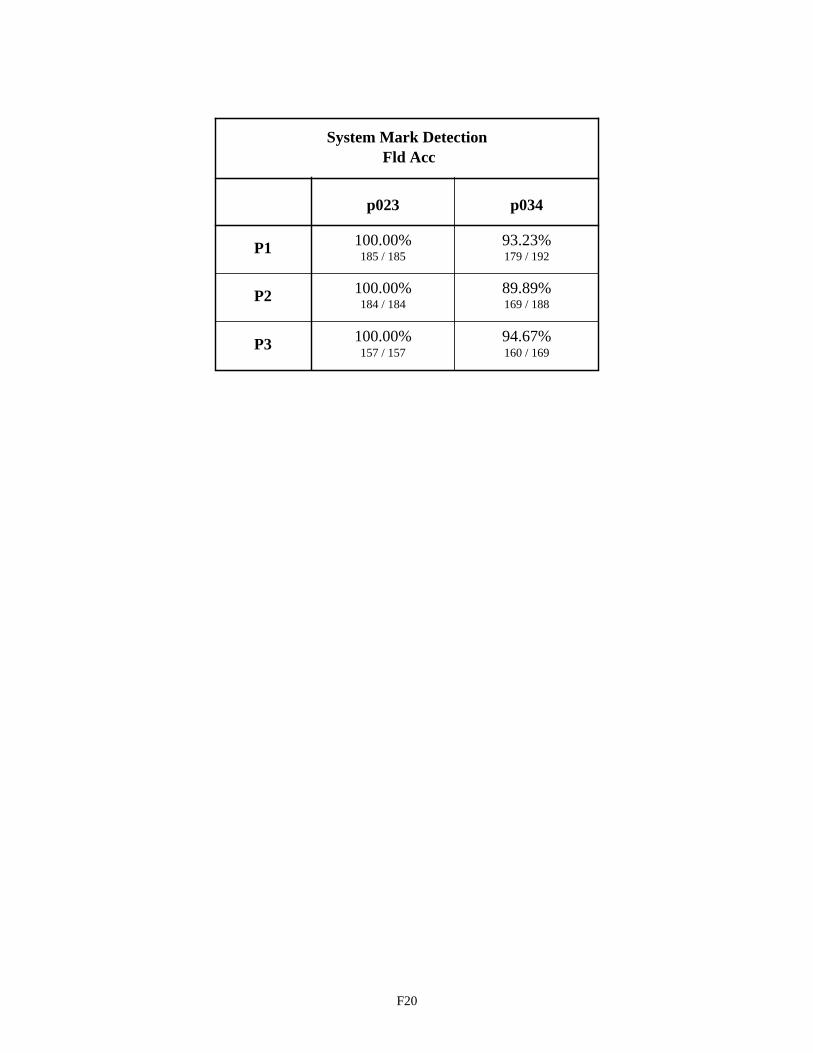
F20
System Mark Detection
p034p023
P1
P2
P3
179 / 192185 / 185100.00%
169 / 18889.89%
184 / 184100.00%
160 / 16994.67%
157 / 157100.00%
93.23%
Fld Acc

G1
APPENDIX G. HUMAN FACTORS
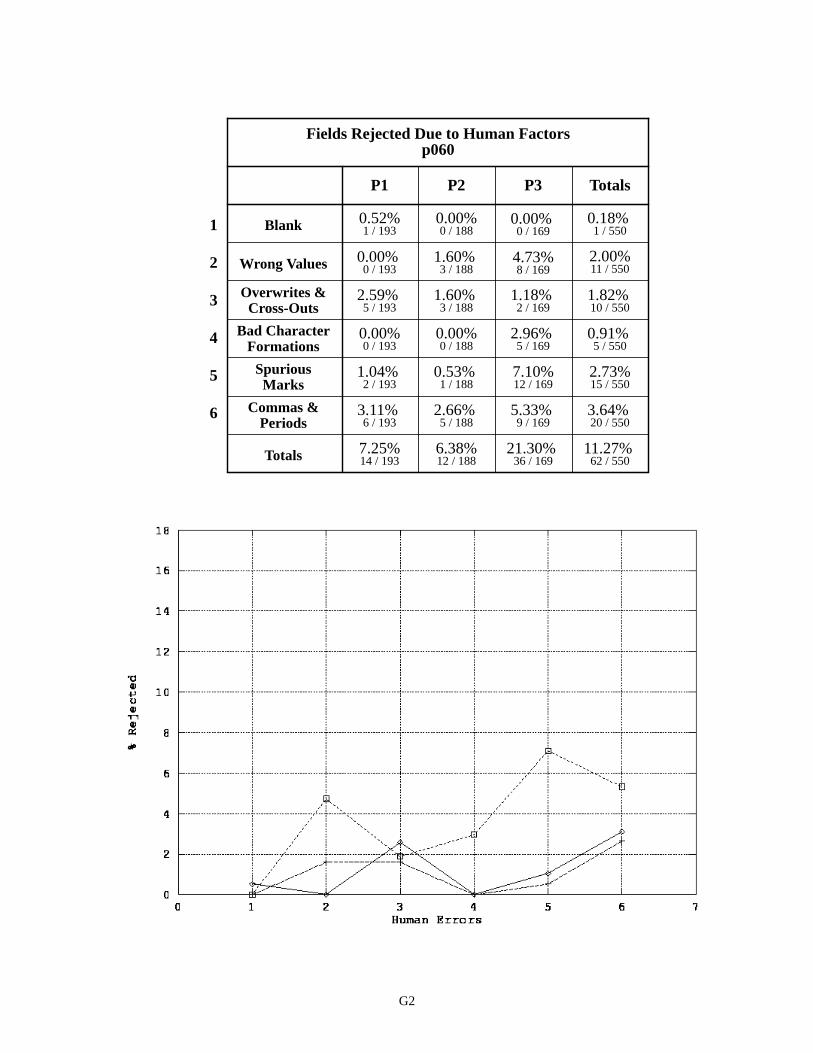
G2
Fields Rejected Due to Human Factors
P2P1 P3
Blank
Wrong Values
Overwrites &
0 / 1881 / 1930.52%
0 / 1690.00%
3 / 1881.60%
0 / 1930.00%
8 / 1694.73%
3 / 1881.60%
5 / 1932.59%
2 / 1691.18%
0.00%
p060
Totals
1 / 5500.18%
11 / 5502.00%
10 / 5501.82%
Cross-Outs
Bad Character
Spurious
0 / 1880 / 1930.00%
5 / 1692.96%
1 / 1880.53%
2 / 1931.04%
12 / 1697.10%
0.00%5 / 550
0.91%
15 / 5502.73%
Totals 12 / 18814 / 1937.25%
36 / 16921.30% 6.38%
62 / 55011.27%
Formations
Marks
Commas &5 / 188
2.66% 6 / 193
3.11% 9 / 169
5.33% 20 / 5503.64%
Periods
1
2
3
4
5
6

G3
Fields Rejected Due to Human Factors
P2P1 P3
27 / 18832 / 19316.58%
20 / 16911.83%
1 / 1880.53%
5 / 1932.59%
2 / 1691.18%
0 / 1880.00%
1 / 1930.52%
1 / 1690.59%
14.36%
p045
Totals
79 / 55014.36%
8 / 5501.45%
2 / 5500.36%
2 / 1882 / 1931.04%
0 / 1690.00%
0 / 1880.00%
2 / 1931.04%
1 / 1690.59%
0 / 1880.00%
0 / 1930.00%
0 / 1690.00%
1.06%4 / 550
0.73%
3 / 5500.55%
0 / 5500.00%
30 / 18842 / 19321.76%
24 / 16914.20% 15.96%
96 / 55017.45%
Blank
Wrong Values
Overwrites &Cross-Outs
Bad Character
Spurious
Totals
Formations
Marks
Commas &Periods
1
2
3
4
5
6
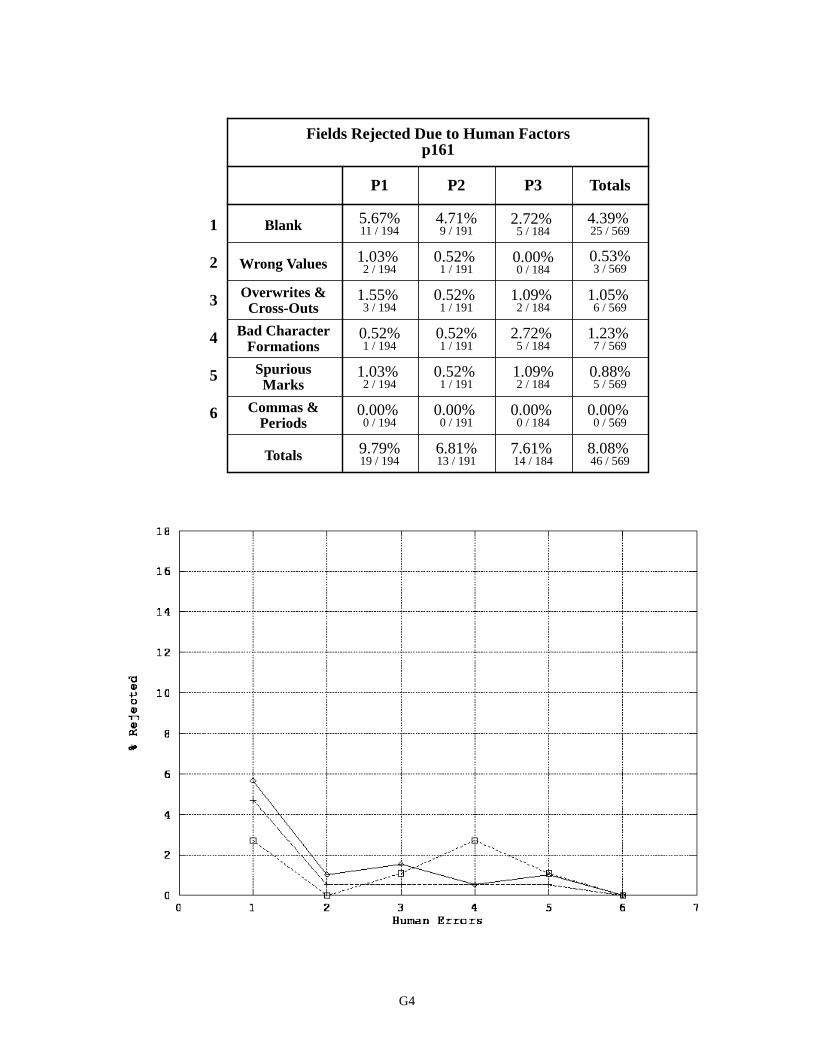
G4
Fields Rejected Due to Human Factors
P2P1 P3
9 / 19111 / 1945.67%
5 / 1842.72%
1 / 1910.52%
2 / 1941.03%
0 / 1840.00%
1 / 1910.52%
3 / 1941.55%
2 / 1841.09%
4.71%
p161
Totals
25 / 5694.39%
3 / 5690.53%
6 / 5691.05%
1 / 1911 / 1940.52%
5 / 1842.72%
1 / 1910.52%
2 / 1941.03%
2 / 1841.09%
0 / 1910.00%
0 / 1940.00%
0 / 1840.00%
0.52%7 / 569
1.23%
5 / 5690.88%
0 / 5690.00%
13 / 19119 / 1949.79%
14 / 1847.61% 6.81%
46 / 5698.08%
Blank
Wrong Values
Overwrites &Cross-Outs
Bad Character
Spurious
Totals
Formations
Marks
Commas &Periods
1
2
3
4
5
6

G5
Fields Rejected Due to Human Factors
P2P1 P3
Blank 4 / 1888 / 1934.15%
12 / 1697.10% 2.13%
p023*
Totals
24 / 5504.36%
Fields Rejected Due to Human Factors
P2P1 P3
Wrong Values 0 / 1881 / 1930.52%
0 / 1690.00% 0.00%
p034*
Totals
1 / 5500.18%
* Circle field p023 was to be marked on every form, and was left empty 24 times.
* Circle field p034 was to be left empty on every form, and was marked once.

G6
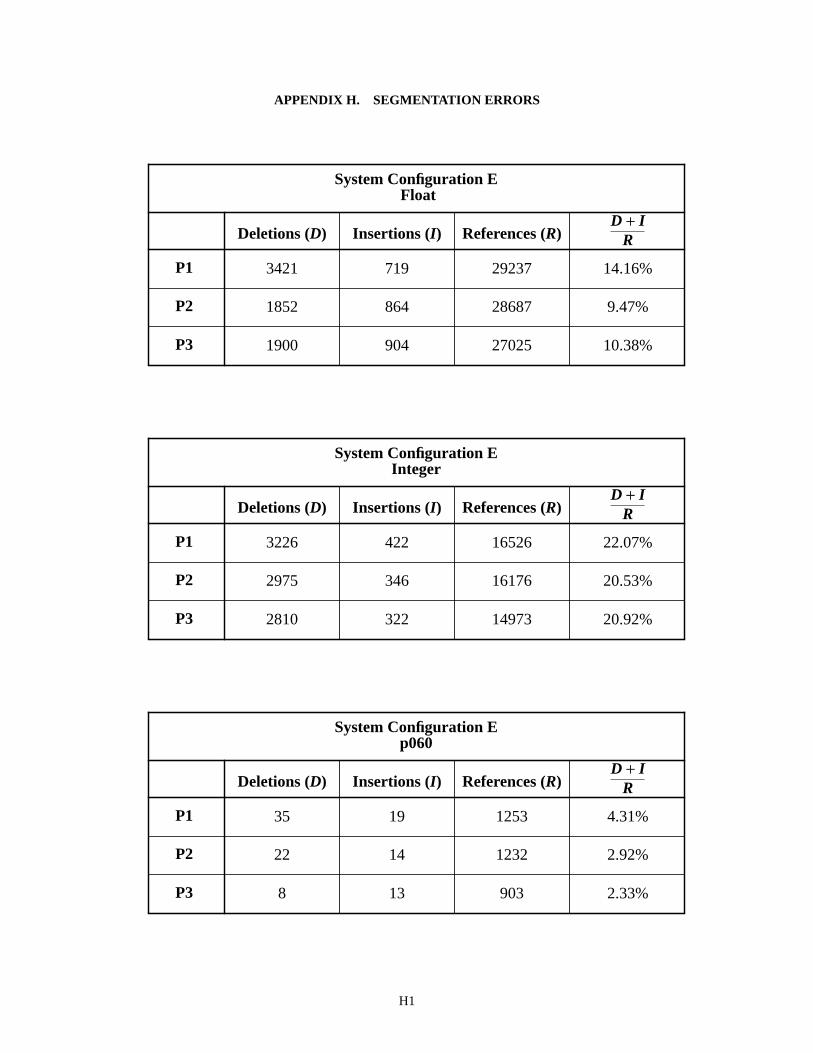
H1
APPENDIX H. SEGMENTATION ERRORS
System Configuration E
Insertions (I)Deletions (D) References (R)
P1
P2
P3
3421 29237
8641852 28687
9041900 27025
719
Float
D I+R
14.16%
9.47%
10.38%
System Configuration E
Insertions (I)Deletions (D) References (R)
P1
P2
P3
3226 16526
3462975 16176
3222810 14973
422
Integer
D I+R
22.07%
20.53%
20.92%
System Configuration E
Insertions (I)Deletions (D) References (R)
P1
P2
P3
35 1253
1422 1232
138 903
19
p060
D I+R
4.31%
2.92%
2.33%
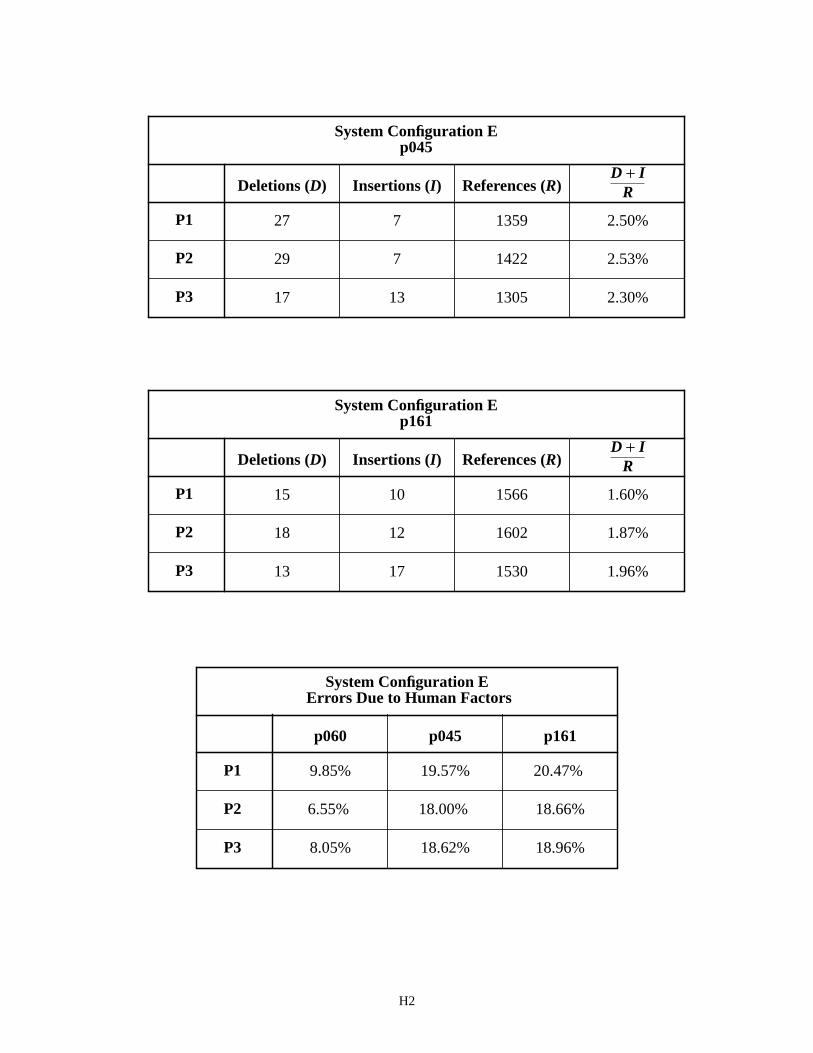
H2
System Configuration E
Insertions (I)Deletions (D) References (R)
P1
P2
P3
27 1359
729 1422
1317 1305
7
p045
D I+R
2.50%
2.53%
2.30%
System Configuration E
Insertions (I)Deletions (D) References (R)
P1
P2
P3
15 1566
1218 1602
1713 1530
10
p161
D I+R
1.60%
1.87%
1.96%
System Configuration E
p045p060 p161
P1
P2
P3
9.85% 20.47%
18.00% 6.55% 18.66%
18.62%8.05% 18.96%
19.57%
Errors Due to Human Factors
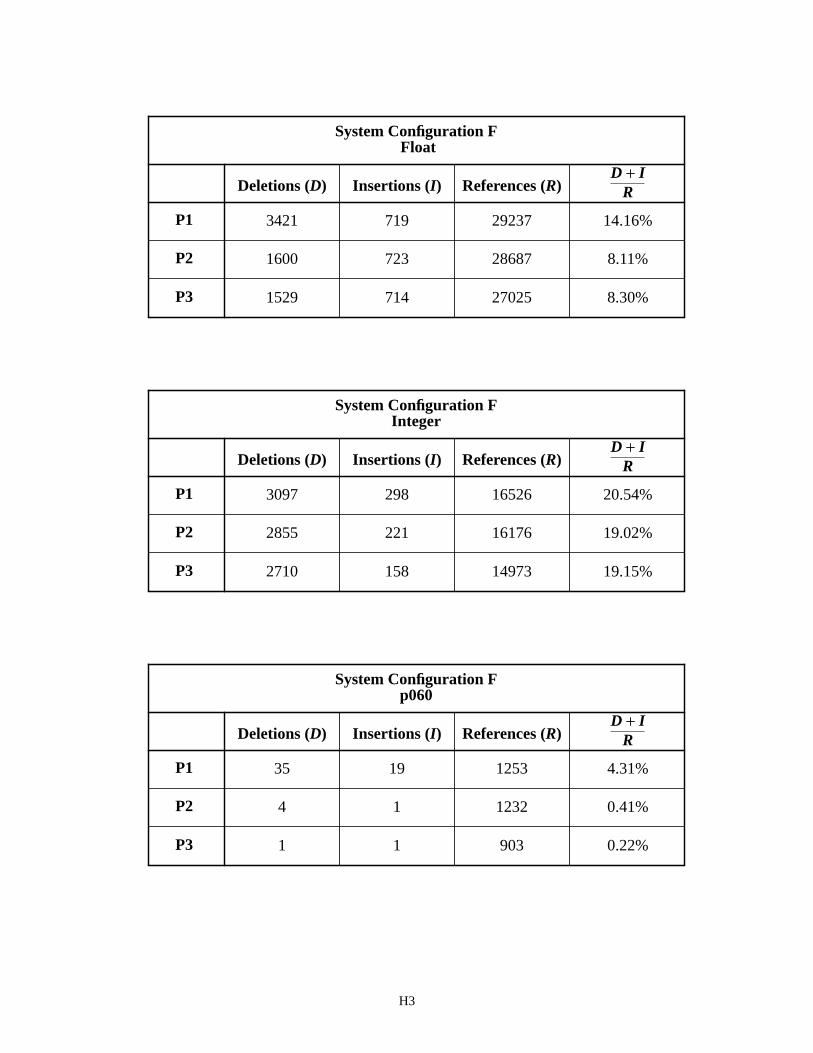
H3
System Configuration F
Insertions (I)Deletions (D) References (R)
P1
P2
P3
3421 29237
7231600 28687
7141529 27025
719
Float
D I+R
14.16%
8.11%
8.30%
System Configuration F
Insertions (I)Deletions (D) References (R)
P1
P2
P3
3097 16526
2212855 16176
1582710 14973
298
Integer
D I+R
20.54%
19.02%
19.15%
System Configuration F
Insertions (I)Deletions (D) References (R)
P1
P2
P3
35 1253
14 1232
11 903
19
p060
D I+R
4.31%
0.41%
0.22%
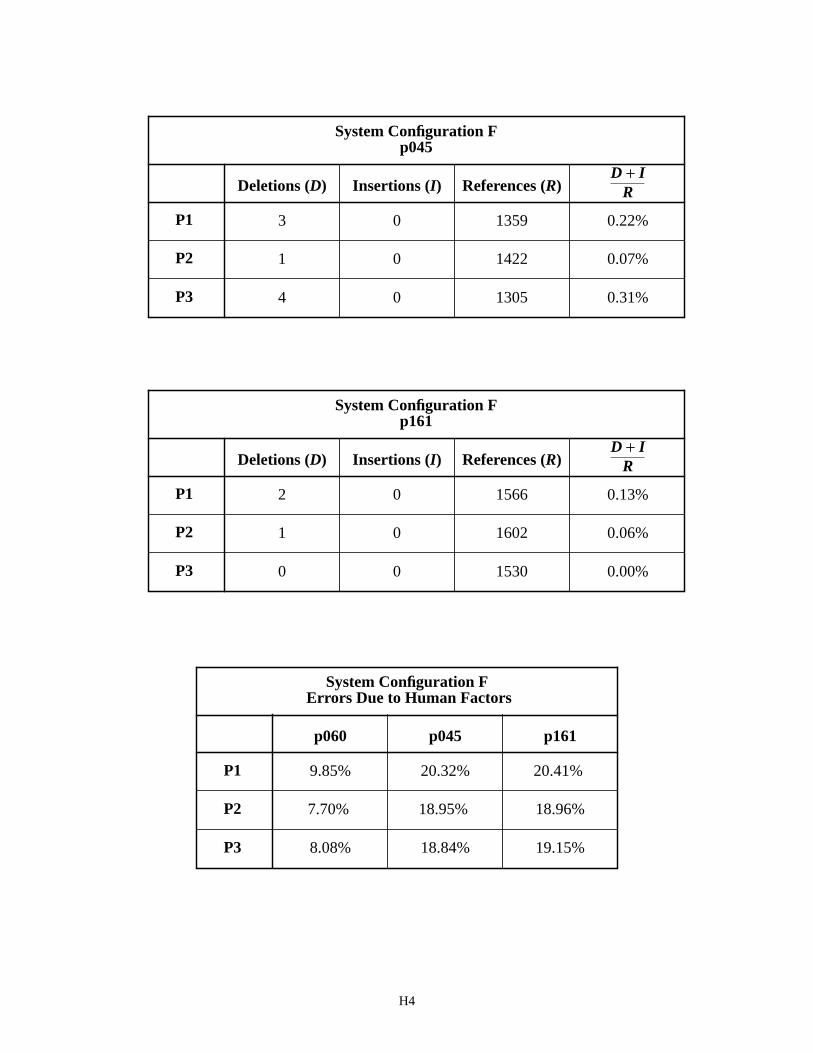
H4
System Configuration F
Insertions (I)Deletions (D) References (R)
P1
P2
P3
3 1359
01 1422
04 1305
0
p045
D I+R
0.22%
0.07%
0.31%
System Configuration F
Insertions (I)Deletions (D) References (R)
P1
P2
P3
2 1566
01 1602
00 1530
0
p161
D I+R
0.13%
0.06%
0.00%
System Configuration F
p045p060 p161
P1
P2
P3
9.85% 20.41%
18.95% 7.70% 18.96%
18.84%8.08% 19.15%
20.32%
Errors Due to Human Factors
Related Documents