1 EVALUATING CROATIAN EQUITIES * Vladimir Cvijanović 1 , Mia Mikić 2 and Edward Tower 3 July 3, 2003 Forthcoming in the Zagreb Journal of Economics, July 2003. Other authors in this issue include Robert A. Mundell Abstract In this paper we evaluate all three of the first quotation equities that are available in Croatia. First quotation equities are those that meet the highest accounting and reporting standards in Croatia. We find that two of the three compare favorably with stocks available on the world market. We also suggest the need for more and better data on Croatian equities. Keywords: Croatian Equities, Market Development, Gordon Formula, Financial Regulation. JEL Classification Number: G1 1. INTRODUCTION In this paper we evaluate all three first quotation equities that are available in Croatia. First quotation equities meet the highest standards of accounting and for reporting the accounts and dividends in Croatia. All three are traded on the Zagreb Stock Exchange (ZSE), where the first quotation is called Quotation I. We use several techniques to evaluate how Croatian equities are likely to perform relative to those in the rest of the world. We also suggest the need for better reporting standards for Croatian equities. * Tower did his work on the paper while being hosted by the University of Zagreb on a Fulbright grant. We are grateful for helpful suggestions to Melita Marčeta Racanović and also to Bill Bernstein, Omer Gokcekus, Gordana Pučar, Ken Reinker and Domagoj Račić. We would like to thank Gordana Miškulin of the Zagreb Stock Exchange for mailing the data to us. 1 The Institute of Economics, Zagreb, Trg J.F. Kennedy 7, 10000 Zagreb, Croatia, e-mail: [email protected] 2 Graduate School of Economics and Business, Trg J.F. Kennedy 6, 10000 Zagreb, Croatia, e-mail: [email protected] 3 Economics Department, Duke University, Durham, NC 27708-0097, USA, e-mail: [email protected]

Welcome message from author
This document is posted to help you gain knowledge. Please leave a comment to let me know what you think about it! Share it to your friends and learn new things together.
Transcript
1
EVALUATING CROATIAN EQUITIES*
Vladimir Cvijanović1, Mia Mikić2 and Edward Tower3
July 3, 2003
Forthcoming in the Zagreb Journal of Economics, July 2003. Other authors in this issue include Robert A. Mundell
Abstract
In this paper we evaluate all three of the first quotation equities that are available in Croatia. First quotation equities are those that meet the highest accounting and reporting standards in Croatia. We find that two of the three compare favorably with stocks available on the world market. We also suggest the need for more and better data on Croatian equities. Keywords: Croatian Equities, Market Development, Gordon Formula, Financial Regulation. JEL Classification Number: G1
1. INTRODUCTION
In this paper we evaluate all three first quotation equities that are available in Croatia. First quotation equities meet the highest standards of accounting and for reporting the accounts and dividends in Croatia. All three are traded on the Zagreb Stock Exchange (ZSE), where the first quotation is called Quotation I. We use several techniques to evaluate how Croatian equities are likely to perform relative to those in the rest of the world. We also suggest the need for better reporting standards for Croatian equities.
* Tower did his work on the paper while being hosted by the University of Zagreb on a Fulbright grant. We are grateful for helpful suggestions to Melita Marčeta Racanović and also to Bill Bernstein, Omer Gokcekus, Gordana Pučar, Ken Reinker and Domagoj Račić. We would like to thank Gordana Miškulin of the Zagreb Stock Exchange for mailing the data to us. 1 The Institute of Economics, Zagreb, Trg J.F. Kennedy 7, 10000 Zagreb, Croatia, e-mail: [email protected] 2 Graduate School of Economics and Business, Trg J.F. Kennedy 6, 10000 Zagreb, Croatia, e-mail: [email protected] 3 Economics Department, Duke University, Durham, NC 27708-0097, USA, e-mail: [email protected]
2
2. THE DEVELOPMENT OF THE CROATIAN EQUITIES MARKET: HISTORY DETERMINES THE FUTURE
Croatia has had quite a burdensome political and economic transition from socialism to a market economy. It has been aggravated by war 1991-1995 and its consequences, as well as by the relative economic and political isolation of the country until the new government was elected in 2000. Economic reforms started during the war with the introduction of the national currency and a stabilization program in 1993. Since then, Croatia has made satisfactory progress in some areas of reform. It achieved macroeconomic stability, liberalized foreign trade, reduced capital controls, privatized a number of small enterprises, and reformed the banking sector. However, mediocre results have been achieved in labor market reforms, privatization of medium and large enterprises, regulation of monopolies, restructuring of state-owned enterprises, regulation and enforcement of regulations with regard to corporate governance, and development of capital markets and non-bank financial institutions. Moreover, one of the most pronounced problems remaining is the legal system. The judiciary is opaque, inefficient and slow, burdened with many unresolved cases and widespread rent-seeking, graft and corruption. All this has had an especially negative effect on doing business in Croatia.
Is the regulation of the Croatian equities market adequate? This is one of the first questions an investor should ask before putting money into equities in Croatia. We believe that the reporting of data on firms’ accounts and dividends needs to be improved. The market is very young and recent history explains why it remains relatively underdeveloped. Crucial laws regulating the capital market were passed by the parliament quite late. The starting year for privatization in Croatia was 1991, but the most important law for the domestic capital market was not enacted until 1995 – “Law on Issuance and Sale of Securities”. Since 1995 many securities laws have been enacted. Finally, in July 2002, Croatia passed the new "Law on Securities Market", in line with some standards of The International Organization of Securities Commissions (IOSCO) European Union (MF, 2003).
The privatization process in Croatia has had an enormous impact on the development of the Croatian equities market. Although exact data on the ownership structure of Croatian firms does not exist, there are some estimates in the literature we can rely on. Most companies intended for privatization have been privatized through management buy-outs and worker buy-outs, which has led to insiders having dominant ownership in these firms. Old management and workers who bought company stocks or shares of equity capital primarily wanted to retain their positions, while purely investment motives were secondary to them (Kušić, 2001). The interests of minority shareholders have often been trampled on. Hence, the manner in which privatization4 was carried out has 4 As already mentioned, the most important laws for the establishment and development of the domestic capital market were enacted quite late, which left the most important, early phase of privatization, to a large extent unregulated. Besides, neither the judiciary nor any sort of public control has functioned properly, all of which enabled political influence to triumph over considerations of economic efficiency and fairness in Croatia. In many cases the new ownership elite acquired a significant portion of ownership through political
3
prevented the domestic equity market from becoming a driving force for generating efficiency and profitability. Moreover, the majority shareholders are unwilling to give up their control and are consequently reluctant to float new equity.
3. FUNCTIONING OF THE CROATIAN EQUITIES MARKET
There are two organized securities exchanges in Croatia: The Varazdin Stock Exchange (VSE) and The Zagreb Stock Exchange (ZSE). Because of the lack of reliable and systematic data, in this paper we do not consider trading on the VSE. The ZSE has three active quotations: Quotation I, Quotation TN, and Quotation JDD. Data problems prevented us from examining stocks in the latter two quotations. There are currently three equities listed in the Quotation I category, and we decided to focus on them. The issuers of any first quotation equities in Croatia are required by law to publish financial statements and data on dividends on a quarterly basis. The most important requirements for the Quotation I stocks of the ZSE are free transferability of the equities, listing of the whole class of securities, a prospectus, financial statements of the issuer to be audited for three years prior to the listing, minimum three years of operation, at least 25 percent of securities to be in public hands (owned by non-dominant shareholders), and expected market capitalization of the issuer's stock to be at least 10 million euros (ZSE, 2003). Therefore, the equities we analyze have the highest level of transparency.
The official equity index of the ZSE is CROBEX, a capitalization weighted index, which started at 1000 points on September 1, 1997. Eleven equities are included in the index at the time of the writing, with two of them from the Quotation I category. The year CROBEX started is also the year from which we start our analysis in this paper. Figure 1 shows a strong upward trend of the CROBEX since 1999.
This is the ideal location for Figure 1
4. DATA AVAILABILITY IN CROATIA
The ZSE was founded in 1991, while the VSE started its operations in 1993 as an over-the-counter market (with limited accounting and disclosure requirements) until June 2002, when it was transformed into a stock exchange (with more rigorous standards). At year-end 2002, the stock market capitalizations of the VSE and ZSE were 1,7 and 4,0 billion USD, respectively. The VSE has several quotations with different requirements for membership in each one. It has currently no equities listed in its first quotation and trading in the JDD quotation stocks, discussed below, is not active there yet. Most equities, some 300, are traded in the Free Market category, for which the requirements are similar to the requirements of the TN Quotation of the ZSE (see below). The VSE does not have the data on the dividends of those equities, and their issuers are not obliged to disclose dividends. Furthermore, the VSE also has a category labeled Second Quotation, in which only one ties with the political elite, thereby transferring wealth; and not through the building of wealth or trading of equities via the capital market (Čučković, 2001). The role of political influence was certainly unethical and in many cases illegal.
4
equity is listed currently. The financial statements with dividend data for that equity can be found on the VSE web.
The Quotation TN category of ZSE, with 70 stocks traded in 2002, could be classified as the unlisted market, with no requirements whatsoever imposed by either law or the ZSE for their issuers to disclose data on dividends. Moreover, according to a high- ranking official of one of the two stock exchanges, sometimes the data on dividends that Croatian companies do disclose is unreliable. We are not clear whether there are significant penalties for incorrect reporting, and if so, whether they are enforced. We also spoke to officials from the ZSE, who told us that not even the ZSE had all the data on dividends for the equities listed in Quotation TN and that we would have to call each of the companies to ask them about their dividends. The ZSE does not have the data on all dividends even for the equities that are included in the official equity index of the ZSE, CROBEX. However, the ZSE did provide us with data on three equities we analyzed.
The “Law on Securities Market” of 2002 states that: companies that "1. issue stocks by public offers or 2. have more than 100 stockholders and have equity larger than 30 million kuna" (NN, 2003) (roughly 4,2 million USD) must list their stocks on a quotation for public joint stock companies. Our understanding of the law is that these companies must list either on the quotation for public joint stock companies (quotation JDD, from Croatian javna dionicka drustva - public joint stock companies) or on the first quotation. Those companies have to publish their financial statements quarterly. However, because of the very recent listing of equities in the Quotation JDD category on the ZSE and the fact that no JDD companies have yet been traded on the VSE, we excluded stocks in this quotation category from our analysis. The aforementioned provision has induced some companies to reduce their equity capital below the 30 million kuna mark, because many of them do not want to be listed.
One can obtain some, but not all, of the dividends data for the stocks traded on either VSE or ZSE from the Public Information Library of the Croatian Securities Commission. The Public Information Library has pertinent data for over 700 Croatian companies on a CD-ROM that can be accessed at the Library for free. But in some cases, firms have not provided all data, and the data they did provide is inconsistent. Moreover, the documentation is inadequate and the CD-ROM is user unfriendly. For example, the precise dates for which dividend yields are calculated are not easy to figure out.
We cannot directly compare the stock market capitalizations of the VSE and the ZSE, since some of equities are traded on both markets, and their market capitalization figures are included in the total market capitalization of each stock exchange. Because of the lack of good statistical data we do not know the total market capitalization of the equities market in Croatia.
Financial Agency (FINA) is a government firm that collects information from all companies and disseminates it. It charges for this information. The charge depends on the information required, but the information on a single company may cost as much as 183 kuna (about 30 USD). Moreover, permission of the company is required for release of information to each investor, and the dividends data are not available. According to the
5
new "Law on the Registry of Annual Financial Statements", the Registry of Annual Financial Statements will soon be set up by FINA. It is intended to be a centralized database containing data about firms that are liable to pay the corporate income tax. Those companies will be obliged to supply their financial statements to FINA once per year, including their balance sheet, profit and loss account and other data. Nevertheless, the dividends data will still not be available. The registry is public, and the data will be accessible on the Internet, but its users will have to pay. Besides, some of the data will still be available only if there is a written consent from the company that supplied them. However, this is an improvement over the current situation, in which FINA levies a charge for all company data, considers it private, and releases it only with permission of the company.
Even the limited amount of data that we used in this study was not available on the web, but the ZSE kindly mailed it to us. Data on non-first quotation stocks is not systematically collected by the exchanges or available free from the government. However, fundamental indicators for some Croatian stocks, including the dividend yields, can be obtained from statistical departments of some banks and brokerage houses. Some of that data is even available free of charge. However, the analyses are normally done only for the most interesting equities, not for the vast majority of equities that are less actively traded.
5. THE DATA WE USE
The data on dividends and earnings that we use are available by request from the Zagreb Stock Exchange. Since CROBEX started only in 1997, and because the capital market from that year onwards was to a large extent already regulated, we decided to evaluate Quotation I stocks of the ZSE using data from January 1997 onwards. At one time there were six Quotation I stocks, but three have been delisted, leaving only three that are currently traded. These are Pliva d.d. (pharmaceutical industry), Podravka d.d. (food industry) and Shipyard "Viktor Lenac" d.d. (shipbuilding). The first four letters of their ticker symbols are PLVA, PODR, and VLEN, respectively. Pliva is also traded on the London Stock Exchange. All of our data for Croatian stocks starts in January of 1997 and carries through the end of 2002. Our evaluations rely on dividend yields and earnings yields that are calculated on January 1, 2003.
We compare valuations with those provided by Reinker and Tower (2002), RT, for the stock markets in other countries. The RT calculations are carried out as of January 1, 2002 and RT used data series starting earlier than the Croatian series in each case. Thus, the series are not strictly comparable. Still, we believe that the comparison gives a sense of whether the Croatian stock market is valued reasonably relative to alternatives available in the international market.
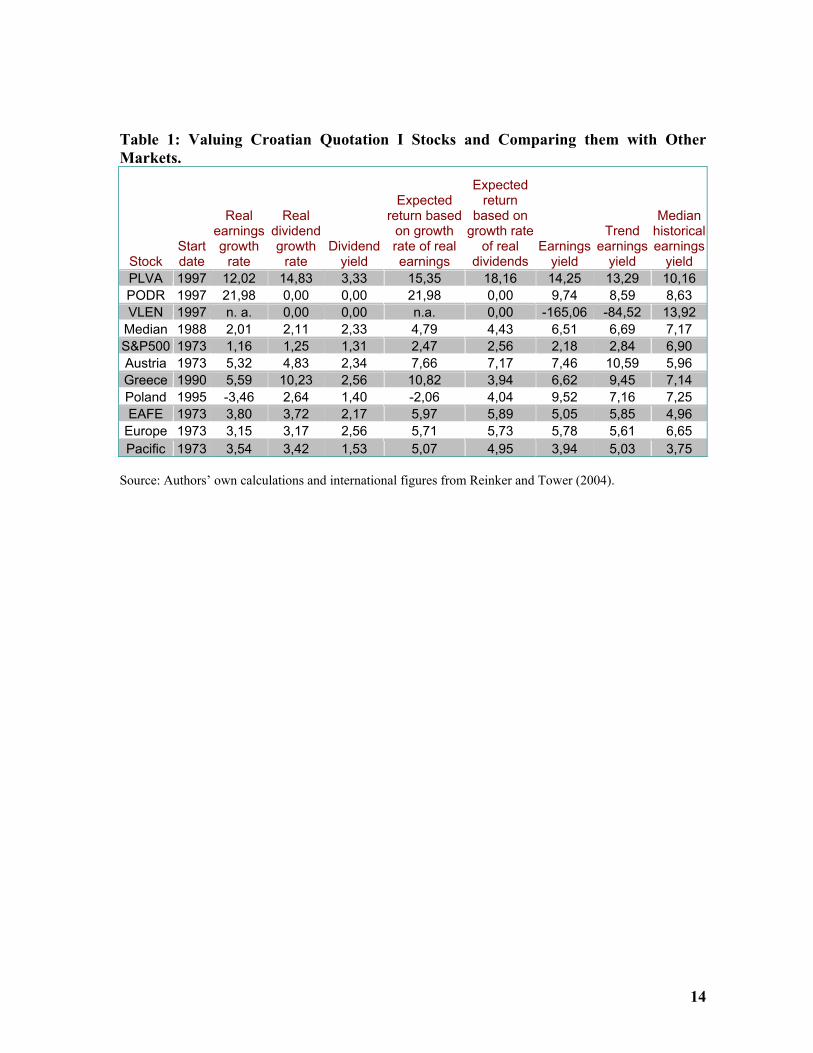
All the calculations are presented in Table 1. We provide international benchmark expected rates of return calculated by RT. These are determined for the Datastream indexes which track three of the Morgan Stanley indexes, EAFE (Europe, Australia and Far East), Europe, and Pacific. They are also determined for the U.S. Standard and Poors 500 index (roughly the largest 500 firms in the US.), and for three of Croatia’s neighbors (Austria,
6
Greece and Poland). The entry labeled median refers to the median values that RT obtained for the 37 countries they examined.5
The country weights in two of the three international indexes are provided in RT and reproduced below.
• Europe: UK 36%, France 12%, Switzerland 11%, Germany 10%, Netherlands 8%, Italy 5%, Finland 3%, Sweden 2%, Belgium 2%, Ireland 1%, Denmark 1%, US 1%, Thailand 1%, Australia 1%, Norway 1%, Greece 1%, Portugal 1%.
• Pacific: Japan 74%, Australia 15%, HK 7%, Singapore 3%
They are calculated from the January 2002 Morningstar Principia Pro compact disks. Morningstar is a mutual fund advisory service. The numbers are shares of countries by capitalization in each of the indexes. These are calculated from the shares reported to Morningstar by the Vanguard company, which provides mutual funds which track these indexes. So they apply to dates sometime in 2001.
6. THE GORDON FORMULA
The Gordon formula states that if dividends per share are expected to grow at a constant real rate g forever, and the initial dividend yield is y, then the rate of return which equates the present value of the dividend stream to the current market value of the share is g + y. A rigorous proof requires calculus and is provided in the appendix, but the intuition is captured by the following argument. Suppose the ratio of stock price to dividends is expected to be the same in the future as it is today. Then dividend growth will imply stock appreciation at a rate g which combined with a dividend yield of y, yields a rate of return of g + y.
To apply the Gordon formula, we need to make some assumption about how fast dividends are likely to grow in the future. Two natural alternatives suggest themselves: that real dividends for the firm in question will grow in the future as fast as either real dividends or else real earnings have grown in the past. This is what we do. An alternative is to recognize that growth rates for firms tend to regress toward the mean, and project rates of growth for dividends closer to past growth rates for major stock indexes.
5 These countries are Argentina, Australia, Austria, Belgium, Canada, Chile, China, Denmark, Finland, France, Germany, Greece, Hong Kong, Indonesia, Ireland, Italy, Japan, Malaysia, Mexico, Netherlands, New Zealand, Norway, Philippines, Poland, Portugal, Singapore, South Africa, South Korea, Spain, Sweden, Switzerland, Taiwan, Thailand, Turkey, UK, US, and Venezuela.
7
7. EARNINGS OR TREND EARNINGS AND THE EARNINGS YIELD
Robert Shiller (2000) suggests that since earnings vary from year to year that in predicting equity returns it is useful to calculate the ratio of real earnings averaged over a ten-year period to real price. We follow RT in using a variant of this idea and examine the ratio of trend real earnings to equity price as one of our methods of assessing whether Croatian stocks are valued appropriately. We refer to the ratio of earnings to equity price as the earnings yield, and to the ratio of trend real earnings to real price as trend real earnings. We believe both to be useful indicators. To the extent that trend real earnings corrects for cycles, we believe it to be superior, but to the extent that trend real earnings amplifies cycles, we believe it to be inferior.
Jeremy Siegel (2002) suggests that the earnings yield is a reasonable guess for the expected future real rate of return, because it represents profits per dollar invested in a share, so we present this as an additional measure of likely return.
We also present the historical median earnings yield, calculated using the median value of January 1 earnings yields over the sample. If one believes that the historical earnings yield is likely to be restored in the future by a change in the equity price, then a high current earnings yield or trend earnings yield relative to the historical median value implies that equity appreciation is likely. We use medians rather than means to minimize the role of extreme observations and since the median price earnings ratio equals the reciprocal of the median earnings yield, which is not true for means.
8. RESULTS
In the discussion below we refer to companies by the first four letters of their ticker symbols. Referring to Table 1, we see that VLEN pays no dividends currently. Also, its negative real earnings in the last year vastly outweigh its positive earnings in previous years. We calculate each growth rate as the coefficient of time obtained by regressing the natural log of real earnings or real dividends on time and multiplying by 100. When there are negative real earnings, as in the case of VLEN, the log is undefined, and the growth rate is undefined or n.a. for non-applicable. We also record the growth rate of dividends as zero if the firm currently pays no dividends, even if dividends have been positive in the past. We calculate the dividend yield as the ratio of dividends paid in 2002 to the price of the equity at the end of 2002.
This is the ideal location for Table 1
We see that PLVA and PODR have seen their real earnings grow more rapidly than is true of all of the stock markets in the rest of the world for which we have reported data. This is also true of the growth rate of dividends for PLVA. Only PLVA currently pays dividends, but its dividend yield is higher than for the indexes we have considered.

8
The expected returns for PLVA and PODR exceed those in the rest of the world when calculated using the growth rate of real earnings. This is also true for PLVA when calculated using the growth rate of real dividends, but not for the other two companies.
The earnings yields make PLVA and PODR look better than equities elsewhere in the world and VLEN look inferior to those in the rest of the world. The same results occur for PLVA and PODR if one looks at trend earnings yields. However trend earnings yield makes PODR inferior to equities in Austria and Greece, but superior to other international equities.
The earnings yields for PLVA and PODR exceed their historical median values, with this being true of only two of the ten international indexes considered. For VLEN the earnings yield is less than the historical median value. When trend earnings yield is used the earnings yield for PLVA exceeds its historical median value with the reverse being true for the other two Croatian equities. The international indexes show the ranking of trend earnings yield versus median earnings yield to be evenly split.
Based on all of our criteria PLVA appears to be a sound investment. The same is true of PODR, although in this case the lack of dividends is a concern, especially given the importance that Fama and French (1988) and others attach to dividends. Based on these publicly available statistics that we have used, VLEN does not seem to be a good investment.
9. PUBLIC POLICY IMPLICATIONS
Frank Partnoy (2003, p. 412) closes his book on recent financial scams by US firms as follows:
“Today, there are an astonishing number of individuals buying and selling stocks. Maybe you are one of them. Maybe you have contributed to the volatile and risky nature of these new markets. As you reflect on the story of the last fifteen years of risk and deceit, ask yourself: Did I carefully read the annual reports of the companies whose stocks I bought? Did I really understand what these companies were doing, who their customers were, and how they made money? Did I know how much they were involved in complex financial instruments? Did I resist the recommendations of friends, colleagues, and talking heads on television about the latest hot stock?
If you answered “no,” you have one more person to blame, in addition to the accountants, bankers, lawyers, credit raters, corporate executives, directors and regulators who failed to spot the various financial schemes of recent years. You.”
He also quotes legendary US investor, Warren Buffett (p. 391) as saying “When I take a look at a company’s annual report, if I don’t understand it, they don’t want me to understand it.” Consequently, Buffett avoids these companies. Throughout his book,
9
Partnoy emphasizes that it was the nature of US banks and firms to take advantage of clients and investors who did not understand their products and accounting.
Shiller (2000) laments the gambling nature of US investors while Smithers and Wright (2002) lament the non-scientific nature of brokers’ recommendations.
Lack of data availability makes it impossible to select equities to invest in appropriately. Without data, it is impossible to confidently select a set of stocks worth investing in or to select a portfolio that balances risk with return in an efficient way. The consequences are that risk averse or suspicious investors are likely to invest abroad. Some other investors will choose to invest in Croatia, but will select an inefficient portfolio that shrinks their expected utility below what an optimum portfolio would yield. When portfolios are unbalanced, it is not only the investors who suffer. The level of capital formation suffers in the aggregate and it is directed less into low risk, high productivity activities than it could be. This means that the Croatian economy suffers from excessive risk, inadequate capital formation and a lower product from that capital stock than could be the case. When capital formation is characterized by low productivity and high risk, Croatian wages and the demand for Croatian non-traded goods will be lower and more volatile than needs to be the case. This will also be true of government tax revenues. Lack of good data also encourages financial scams and raises the possibility that a major scandal will erupt in the Croatian equities market, which will erode trust for a long time to come.
For all these reasons, we believe it is in the interest of the government to encourage the distribution of accounting and dividend data to investors by all firms listed on the Croatian stock exchanges. We also believe that it is in the interest of most firms to cooperate with the government and to initiate the provision of this data voluntarily. This should encourage a private entrepreneur to construct a newsletter or web site that provides this information at a low enough cost that it is accessible to a broad collection of investors and investor advisory services. If the financial markets are to serve Croatians by guiding resources wisely and preserving stability, Croatians need reliable, timely and low-cost data relevant to their investments. Consequently, we suggest the following initiatives.
• All companies traded on any of the Croatian stock exchanges should be required to post their accounts on the web either themselves or through an agent.
• Companies should be penalized for providing false or incomplete information.
• Companies should be required to post information indicating the proportion of equities held by insiders: managers, workers and their close relations.
• Companies should be required to post information on insider purchases and sales of equity.
10
• The stock exchanges should be required to post summary data on dividends, earnings, balance sheets, the proportion of equities held by insiders, and insider purchases and sales of companies on the web.
• The stock exchange web page should contain links to the web pages containing detailed company information.
We feel that a double set of postings is desirable for two reasons. Companies or their agents should be able to update their information more quickly than the stock exchanges could. Also, the responsibility for incomplete, late or incorrect data would then rest squarely with the company itself, giving the investor an additional insight into corporate effectiveness. Finally, the summary data from the stock exchanges would make the information easily digestible.
10. CONCLUSIONS
The data series on Croatian equities is too short to have very much confidence in the predictions here that PLVA is a sound investment, PODR reasonably sound and VLEN unsound. However, we believe that the tools we suggest here are appropriate instruments for making plausible guesses about rates of return. Moreover, we believe that equity advisory services as a matter of standard business should present clients with calculations similar to those we propose here. We also hope that individual companies whose accounting and disclosure standards do not meet the first quotation standard will be persuaded to provide enough data to permit similar analysis for these equities.
We find it interesting that even in the US where data collection is easy, equity advisory services, like Valueline, provide predictions, but none disclose their methodology. Nor do they evaluate their performance relative to alternative simple prediction methods, like those presented in this paper. There are several methodologies which have predictive power, and it would be helpful for the investor to know to what extent recent academic research is reflected in advisory service predictions. For example: Fama and French (1988), find that dividend yields predict US equity returns and their work has been extended to international equity returns; Shiller (2000) finds that real price over a moving average of real returns predict; Smithers and Wright (2000) find that Tobin’s q predicts, and Harney and Tower (2003) test the choice between the Shiller and Smithers-Wright approaches, finding the Smithers-Wright approach superior. We would like to see more testing of the relative merits of alternative predictions.
BIBLIOGRAPHY
Čučković, N., (2001) "Utjecaj postprivatizacijske vlasničke strukture na kvalitetu korporacijskog upravljanja u Hrvatskoj", in: Čengić, D.; Rogić, I. (eds.) Upravljačke elite i modernizacija, Institut društvenih znanosti Ivo Pilar, Zagreb, 2001, pp. 213-239.
11
Fama, E. and K. French, (1988) “Dividend Yields and Expected Stock Returns” Journal of Financial Economics, Vol. 22, pp.3-25, October.
Harney, M. and E. Tower, (2003) “Rational Pessimism: Predicting Equity Returns Using Tobin’s q and Price/Earnings Ratios”, The Journal of Investing, Vol. 12, Fall. Available at www.econ.duke.edu/Papers/Other/Tower/Pessimism.pdf.
Kušić, S., (2001) Privatisierung im Transformationsprozess. Das Beispiel der Republik Kroatien, Wiesbaden: Deutscher Universitäts-Verlag.
Ministry of Finance of the Republic of Croatia (MF), (2003) "Regulatorni okvir tržišta kapitala u Republici Hrvatskoj", Ministry of Finance of the Republic of Croatia, unpublished document.
Narodne novine (NN), (2003) "Zakon o tržištu vrijednosnih papira", available at www.nn.hr.
Partnoy, F., (2003) Infectious Greed: How Deceit and Risk Currupted the Financial Markets, New York, NY: Times Books.
Reinker, K. S. and E. Tower, (2004) “Predicting Equity Returns for 37 Countries: Tweaking the Gordon Formula”, The Journal of Investing, Vol 13. Available at http://www.econ.duke.edu/Papers/Other/Tower/Equity_Returns.pdf.
Shiller, R. J., (2000) Irrational Exuberance, Princeton: Princeton University Press, with useful data available on his website at www.econ.yale.edu/~shiller/.
Siegel, J., (2002) Stocks for the Long Run, Third edition, New York, NY: McGraw Hill.
Smithers, A. and S. Wright, (2000) Valuing Wall Street: Protecting Wealth in Turbulent Markets, New York, NY: McGraw Hill.
Zagreb Stock Exchange (ZSE) web site, (2003), available at www.zse.hr.

12
APPENDIX: DERIVING THE GORDON FORMULA
The real rate of return on an equity that is purchased at time = 0 and is held forever is the real discount rate, r, that sets the purchase price of the equity, P, to the discounted value of the stream of future dividends. The initial dividend is D. The Gordon formula for this real rate of return anticipates real dividends to grow at an instantaneous rate g, so the present value at time 0 of the dividends paid during interval dt at time t is
dteDeV rtgt −= .
Equating the present value of the stream of dividends forever to the current price of the equity yields
.0
dteeDP rtgt −∞
∫=
Writing D/P as the current dividend yield, y, and adding the exponents yields
The integration yields
.1 )(0
trgerg
y −∞
−=
Tentatively assuming the rate of return exceeds the dividend growth rate, yields:
]10[1 −−
=rg
y
which is rearranged as .ygr +=
Thus, the continuously compounded real rate of return from buying and holding the equity forever is the sum of the growth rate of real dividends and the dividend yield.
Two issues need to be cleaned up. First, we see that our tentative assumption that r exceeds g is consistent with our result. Had we assumed the inequality to be reversed we would have reached a contradiction. Second, if we assume that the stock is ultimately sold, but at a time, T, in the very distant future, do we need to reckon with the sale price of the equity? If there is a limit, k, to the ratio of the sales price of the equity to the dividend, then the present value of the sales price at time T at the discount rate of g+y is no greater than
yTTygg ekDeekDePVS −−− == )(
.10
)( dtey trg∫∞
−=

13
which approaches zero in the limit as T approaches infinity. So we don’t have to reckon with the sales price if the sale is sufficiently far in the future.
Finally, Ken Reinker has suggested that many readers may find a proof in discrete time more appealing. An investor who buys an equity at a price P at the beginning of year zero and reaps real dividends D[1+G]t at the end of each year, t, will experience a real rate of return, R, on the investment of
...]1/[]1[]1/[]1[]1/[322 ++++++++= RGDRGDRDP
where R and G are defined as the annualized real rates of return and dividend growth respectively. Recognizing that the dividend yield at time 0 is D/P, and summing the infinite series yields
YGR +=
where the capital Y indicates that the dividend yield is calculated as real dividends at the end of the year divided by price at the beginning of the year.
Figure 1: The Official ZSE equity index CROBEX and equity market capitalization on ZSE as percent of GDP 1997-2002.
0,0
200,0400,0
600,0800,0
1.000,01.200,0
1.400,0
1997
1998
1999
2000
2001
2002
Years
CRO
BEX
(bas
e ye
ar 1
997)
0,00%
5,00%
10,00%
15,00%
20,00%
25,00%
Perc
ent
CROBEX equityindex (left scale)
Equity marketcapitalization/GDP inpercent (right scale)
Source: ZSE, 2003 and authors' own calculations.
14
Table 1: Valuing Croatian Quotation I Stocks and Comparing them with Other Markets.
Stock Start date
Real earnings growth
rate
Real dividend growth
rate Dividend
yield
Expected return based
on growth rate of real earnings
Expected return
based on growth rate
of real dividends
Earnings yield
Trend earnings
yield
Median historical earnings
yield PLVA 1997 12,02 14,83 3,33 15,35 18,16 14,25 13,29 10,16 PODR 1997 21,98 0,00 0,00 21,98 0,00 9,74 8,59 8,63 VLEN 1997 n. a. 0,00 0,00 n.a. 0,00 -165,06 -84,52 13,92
Median 1988 2,01 2,11 2,33 4,79 4,43 6,51 6,69 7,17 S&P500 1973 1,16 1,25 1,31 2,47 2,56 2,18 2,84 6,90 Austria 1973 5,32 4,83 2,34 7,66 7,17 7,46 10,59 5,96 Greece 1990 5,59 10,23 2,56 10,82 3,94 6,62 9,45 7,14 Poland 1995 -3,46 2,64 1,40 -2,06 4,04 9,52 7,16 7,25 EAFE 1973 3,80 3,72 2,17 5,97 5,89 5,05 5,85 4,96
Europe 1973 3,15 3,17 2,56 5,71 5,73 5,78 5,61 6,65 Pacific 1973 3,54 3,42 1,53 5,07 4,95 3,94 5,03 3,75
Source: Authors’ own calculations and international figures from Reinker and Tower (2004).
Related Documents