Evaluating and Monitoring Small Scale Gold Mining and Mercury Use: Building a Knowledge-base with Satellite Imagery and Field Work UNIDO PROJECT EG/GLO/01/G34 FINAL REPORT November 2007 Authors: Kevin Telmer and Daniel Stapper Aqueous Geochemistry Laboratory School of Earth and Ocean Sciences, University of Victoria P.O. Box 3055 STN CSC, Victoria, BC Canada V8W 3P6 Keywords: Small Scale Gold Mining, Mercury, ASM, Indonesia, Brazil, Satellite Imagery

Welcome message from author
This document is posted to help you gain knowledge. Please leave a comment to let me know what you think about it! Share it to your friends and learn new things together.
Transcript

Evaluating and Monitoring Small Scale Gold Mining and Mercury Use: Building a Knowledge-base with Satellite Imagery and Field Work UNIDO PROJECT EG/GLO/01/G34 FINAL REPORT November 2007 Authors: Kevin Telmer and Daniel Stapper Aqueous Geochemistry Laboratory School of Earth and Ocean Sciences, University of Victoria P.O. Box 3055 STN CSC, Victoria, BC Canada V8W 3P6 Keywords: Small Scale Gold Mining, Mercury, ASM, Indonesia, Brazil, Satellite Imagery

1
AGL The Aqueous Geochemistry Laboratory (AGL) at the University of Victoria has been in existence since 1999 and is a leader in combining remote sensing (RS) and geochemistry to solve environmental problems.

2
Preface The need for this report came from the recognition that (i) because of its highly decentralized and remote nature, and because it often exists outside the law, there is a paucity of high quality information on ASM, and (ii) that governments, international bodies, industry, and local communities and miners, can only produce effective solutions when well informed and educated – good decisions rely on good information and education. A good knowledge base is the required backbone to formulate solutions to the problems associated with Mercury and ASM. Indeed, many attempts to improve the livelihoods and living conditions of miners or to reduce the environmental impacts of ASM have failed because of lack of appropriate knowledge about the ASM community. There have been attempts to create alternative livelihoods or to introduce mercury-free technologies to miners based simply on the “idea” or “wish” that they should behave differently, rather than starting by understanding the financial burden that such interventions might cause and then building up a solution from there. For example the size of the primary economy in the Indonesian case study in this report is around 35 million USD per year. If any intervention is to succeed, a sensible primary criterion would be to grow, or at least maintain, the size of the primary economy. Otherwise, the interventionists, whether they be local, regional, or national governments, aid programs, NGO’s, or international bodies, are unilaterally asking some of the world’s poor to take a pay cut. Not only does that seem unethical, the history of the modern gold rush illustrates that it simply hasn’t worked. In assessing an ASM site, there are many useful bits and pieces of information that help constrain the socio-economic and environmental realities of small scale gold mining. Of these, perhaps some of the most useful quantities are: (i) how many people are mining? (ii) how much gold are they producing?; (iii) how much mercury do they use to do so?; and (iv) what is the scale of the impacts they are having on the landscape? – How much habitat (land and water) has been impacted? This basic information can then be used to constrain many other important aspects of ASM, and then to educate the stakeholders and interest groups involved – including the miners themselves. This in turn helps immensely in guiding the formulation of appropriate intervention strategies, focusing resources, and avoiding costly and frustrating failures. The project described below is a pilot study at building a basic database for ASM sites in Brazil and Indonesia. The aim was to combine field work with satellite imagery to build a database that would span spatial scales and times greater than possible through field work alone.
3
Contents Evaluating and Monitoring Small Scale Gold Mining and Mercury Use: Building a Knowledge-base with Satellite Imagery and Field Work Preface .................................................................................................................................... 2 List of Tables ......................................................................................................................... 5 List of Figures ........................................................................................................................ 6 1 Current Situation ............................................................................................................ 9
1.1 Mercury in the Environment ................................................................................... 9 1.2 Environmental Concern of Mercury ........................................................................ 9 1.3 Human Exposure to Mercury .................................................................................. 9 1.4 Mercury Use in ASM .............................................................................................. 9 1.5 How Mercury is released to the Environment ....................................................... 10 1.6 Type of Amalgamation versus Amount of Mercury Consumed ........................... 10 1.7 Methyl Mercury from ASM .................................................................................. 11 1.8 Summary of Mercury in ASM ............................................................................... 11 1.9 River Siltation in ASM .......................................................................................... 11 1.10 Environmental Impacts of Siltation ................................................................... 12 1.11 Knowledge Gaps ................................................................................................ 12 1.12 Database and Monitoring of ASM ..................................................................... 13 1.13 Development of Database and Monitoring System ........................................... 13 1.14 Summary ............................................................................................................ 13 1.15 Highlights .......................................................................................................... 14
2 Current Project ............................................................................................................. 15 3 Building a Database on ASM and Mercury Use .......................................................... 16
3.1 Optical Imagery ..................................................................................................... 16 3.2 Radar Imagery ....................................................................................................... 17 3.3 Shuttle Radar Topography Mission (SRTM) ........................................................ 17 3.4 Aerial Photography ................................................................................................ 17 3.5 Approach ............................................................................................................... 18
4 The Indonesia Case ...................................................................................................... 19
4.1 Background ........................................................................................................... 19 4.2 Statistics ................................................................................................................. 21
4.2.1 Introduction .................................................................................................... 21 4.2.2 Delineation of ASM extent ............................................................................ 22 4.2.3 Number of Operations .................................................................................... 25 4.2.4 Efficiency of Sluicing Operations around Kareng Pangi ............................... 26 4.2.5 Gold Production and Value since Inception of ASM .................................... 27 4.2.6 Mercury Consumption since Inception of ASM ............................................ 28 4.2.7 Mercury Emissions and Gold Production for Kalimantan ............................. 30
4
4.2.8 River Mercury levels and Turbidity (sediments mobilized by mining) ......... 30 4.3 Monitoring ASM Using Remote Sensing.............................................................. 32
4.3.1 RADAR .......................................................................................................... 32 5 The Brazilian Case ....................................................................................................... 36
5.1 Background ........................................................................................................... 36 5.2 Statistics ................................................................................................................. 37
5.2.1 Introduction .................................................................................................... 37 5.2.2 ASM extent .................................................................................................... 39 5.2.3 Number of Operations .................................................................................... 39 5.2.4 Extrapolation of Hg emissions ....................................................................... 40 5.2.5 River Siltation and Turbidity ......................................................................... 41 5.2.6 Sites for Mine Reclamation ............................................................................ 42
6 Database ....................................................................................................................... 44
6.1 Limitations of satellite imagery ............................................................................. 44 6.2 The digital database ............................................................................................... 44
7 Conclusions .................................................................................................................. 45 8 Appendix ...................................................................................................................... 46
8.1 DATA Acquired .................................................................................................... 46 9 References .................................................................................................................... 47
5
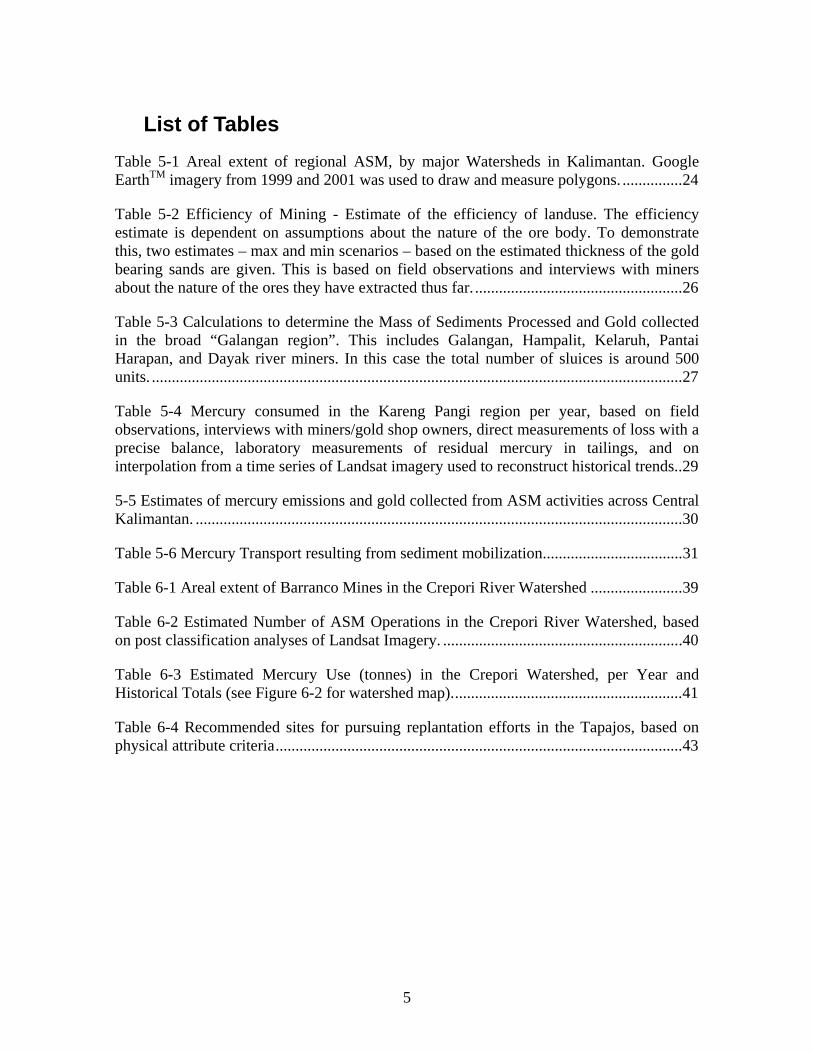
List of Tables Table 5-1 Areal extent of regional ASM, by major Watersheds in Kalimantan. Google EarthTM imagery from 1999 and 2001 was used to draw and measure polygons. ............... 24
Table 5-2 Efficiency of Mining - Estimate of the efficiency of landuse. The efficiency estimate is dependent on assumptions about the nature of the ore body. To demonstrate this, two estimates – max and min scenarios – based on the estimated thickness of the gold bearing sands are given. This is based on field observations and interviews with miners about the nature of the ores they have extracted thus far. .................................................... 26
Table 5-3 Calculations to determine the Mass of Sediments Processed and Gold collected in the broad “Galangan region”. This includes Galangan, Hampalit, Kelaruh, Pantai Harapan, and Dayak river miners. In this case the total number of sluices is around 500 units. ..................................................................................................................................... 27
Table 5-4 Mercury consumed in the Kareng Pangi region per year, based on field observations, interviews with miners/gold shop owners, direct measurements of loss with a precise balance, laboratory measurements of residual mercury in tailings, and on interpolation from a time series of Landsat imagery used to reconstruct historical trends. . 29
5-5 Estimates of mercury emissions and gold collected from ASM activities across Central Kalimantan. .......................................................................................................................... 30
Table 5-6 Mercury Transport resulting from sediment mobilization................................... 31
Table 6-1 Areal extent of Barranco Mines in the Crepori River Watershed ....................... 39
Table 6-2 Estimated Number of ASM Operations in the Crepori River Watershed, based on post classification analyses of Landsat Imagery. ........................................................... .40
Table 6-3 Estimated Mercury Use (tonnes) in the Crepori Watershed, per Year and Historical Totals (see Figure 6-2 for watershed map). ......................................................... 41
Table 6-4 Recommended sites for pursuing replantation efforts in the Tapajos, based on physical attribute criteria ...................................................................................................... 43

6
List of Figures Figure 4-1 Aerial Photography taken by Kevin Telmer in 2006 shows ASM methods and their impacts in Indonesia. (i) Dredges in the Kahayan River, Kalimantan (top left); (ii) sluices operating at a pit in Galangan, Kalimantan (top right); (iii) the vastly altered landscape resulting from 15 years of sluicing operations in Galangan (center); (iv) cyanide processing tanks (roofed), bags of ore, and cyanide and mercury rich tailings, near Kotamobagu, Sulawesi (bottom). ......................................................................................... 20
Figure 4-2 Photo-micrographs of heavy mineral concentrates mined in Galangan, Kalimantan. Locally this mix is called Zircon but is comprised of a variety of heavy minerals including titanite, apatite, hematite, garnet, and zircon. Some operations are dedicated solely to extracting these heavy minerals, but in many cases gold mining tailings are reworked to recover the heavy minerals – the concentrate produced from the sluices shown in Figure 5-1 is rich in heavy minerals and so is frequently reprocessed. Much of the heavy mineral product, therefore, has either already been amalgamated with mercury or will be amalgamated with mercury to recover any gold, and thus it is frequently strongly contaminated in mercury. Much of the heavy mineral product is export to China for use in the abrasives and ceramics industry. The mercury contained in the product is therefore exported along with it, getting released slowly along the way, and then completely when heated later in an industrial process. .................................................................................... 21
Figure 4-3 Transformation of the Galangan landscape from tropical rainforest to mine pits and highly reflective sand tailings. Composite Satellite images are from Landsat 5 TM, 1989 (upper left) Landsat 7 ETM+, 1999 (upper right) and Landsat 7 ETM+, 2002 (lower). The resolution of the 2002 scene was increased using the ETM+ panchromatic band, made possible with the PANSHARP algorithm (PCI), revealing numerous ponds within the mined area. ........................................................................................................................... 23
Figure 4-4 One of a Myriad of workings along small river courses in Kalimantan. Hundreds of kilometres of small drainages have been worked for gold and zircon like this. It is more difficult to detect than large workings such as those shown in Figure 5-1 due to confusion with natural river courses. Note also the colour of the water demonstrating its very high dissolved organic carbon content – known to be a strong complexing agent of Mercury. ............................................................................................................................... 24
Figure 4-5 the border between imagery types across an ASM operation in Central Kalimantan, revealing the difference in detail between data types. Spatial resolution is a principle difference but spectral information also has great utility for understanding ASM sites – for example spectral information may be able to reveal the age of surfaces and the types of materials being worked. Sluices can be seen in the Quickbird high resolution imagery, blown up at right. .................................................................................................. 25
Figure 4-6 directly weighing and calculating amounts of mercury consumed during the amalgamation process and gold refining. This method revealed that on average for the region 1.5 units of mercury are consumed per unit of gold recovered and that 30% of the
7
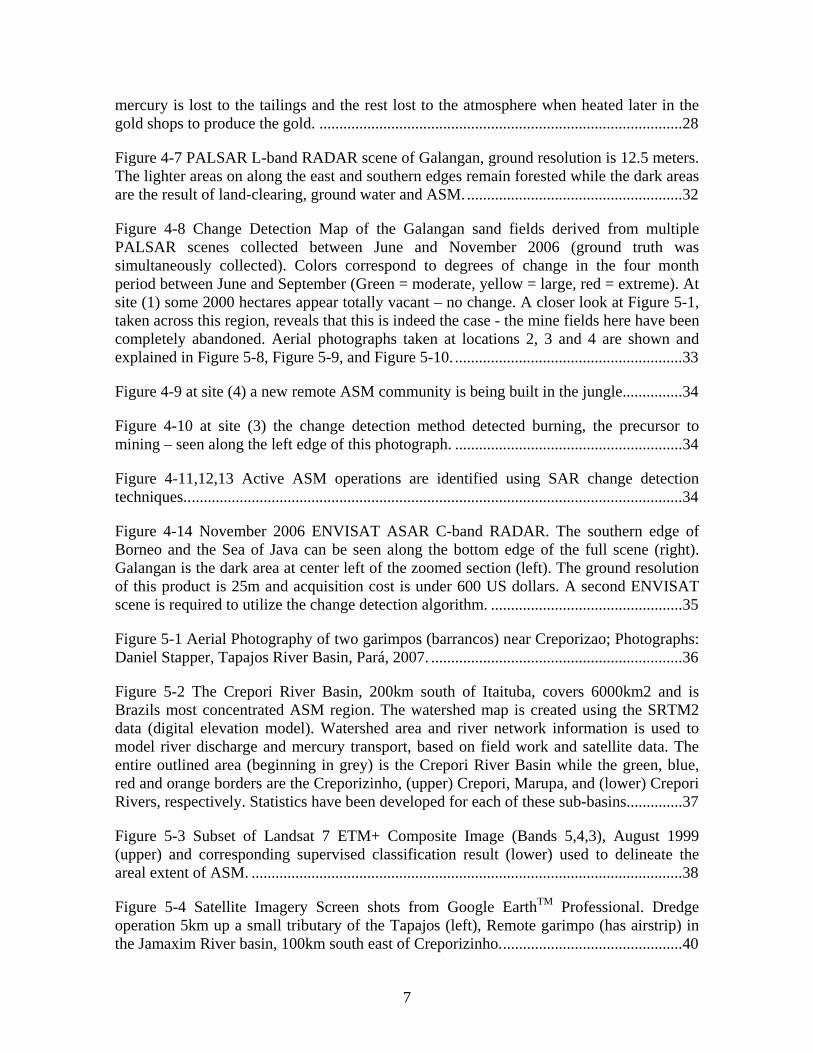
mercury is lost to the tailings and the rest lost to the atmosphere when heated later in the gold shops to produce the gold. ........................................................................................... 28
Figure 4-7 PALSAR L-band RADAR scene of Galangan, ground resolution is 12.5 meters. The lighter areas on along the east and southern edges remain forested while the dark areas are the result of land-clearing, ground water and ASM. ...................................................... 32
Figure 4-8 Change Detection Map of the Galangan sand fields derived from multiple PALSAR scenes collected between June and November 2006 (ground truth was simultaneously collected). Colors correspond to degrees of change in the four month period between June and September (Green = moderate, yellow = large, red = extreme). At site (1) some 2000 hectares appear totally vacant – no change. A closer look at Figure 5-1, taken across this region, reveals that this is indeed the case - the mine fields here have been completely abandoned. Aerial photographs taken at locations 2, 3 and 4 are shown and explained in Figure 5-8, Figure 5-9, and Figure 5-10. ......................................................... 33
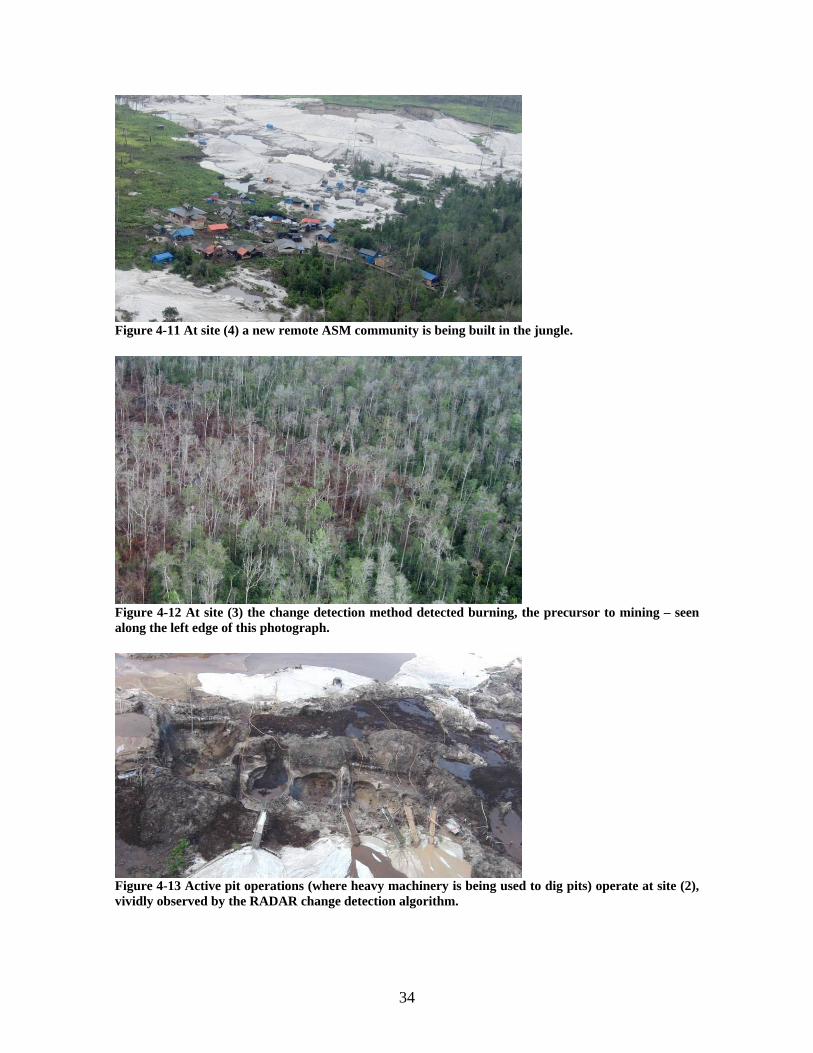
Figure 4-9 at site (4) a new remote ASM community is being built in the jungle............... 34
Figure 4-10 at site (3) the change detection method detected burning, the precursor to mining – seen along the left edge of this photograph. ......................................................... 34
Figure 4-11,12,13 Active ASM operations are identified using SAR change detection techniques.. ........................................................................................................................... 34
Figure 4-14 November 2006 ENVISAT ASAR C-band RADAR. The southern edge of Borneo and the Sea of Java can be seen along the bottom edge of the full scene (right). Galangan is the dark area at center left of the zoomed section (left). The ground resolution of this product is 25m and acquisition cost is under 600 US dollars. A second ENVISAT scene is required to utilize the change detection algorithm. ................................................ 35
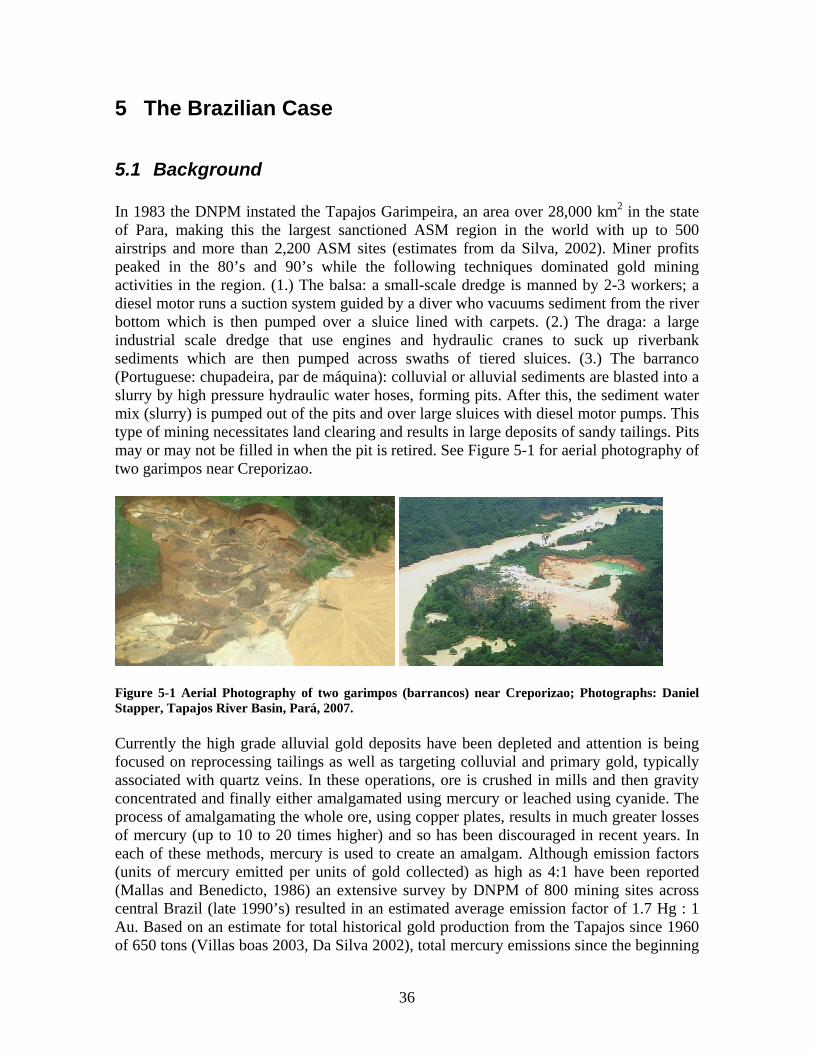
Figure 5-1 Aerial Photography of two garimpos (barrancos) near Creporizao; Photographs: Daniel Stapper, Tapajos River Basin, Pará, 2007. ............................................................... 36
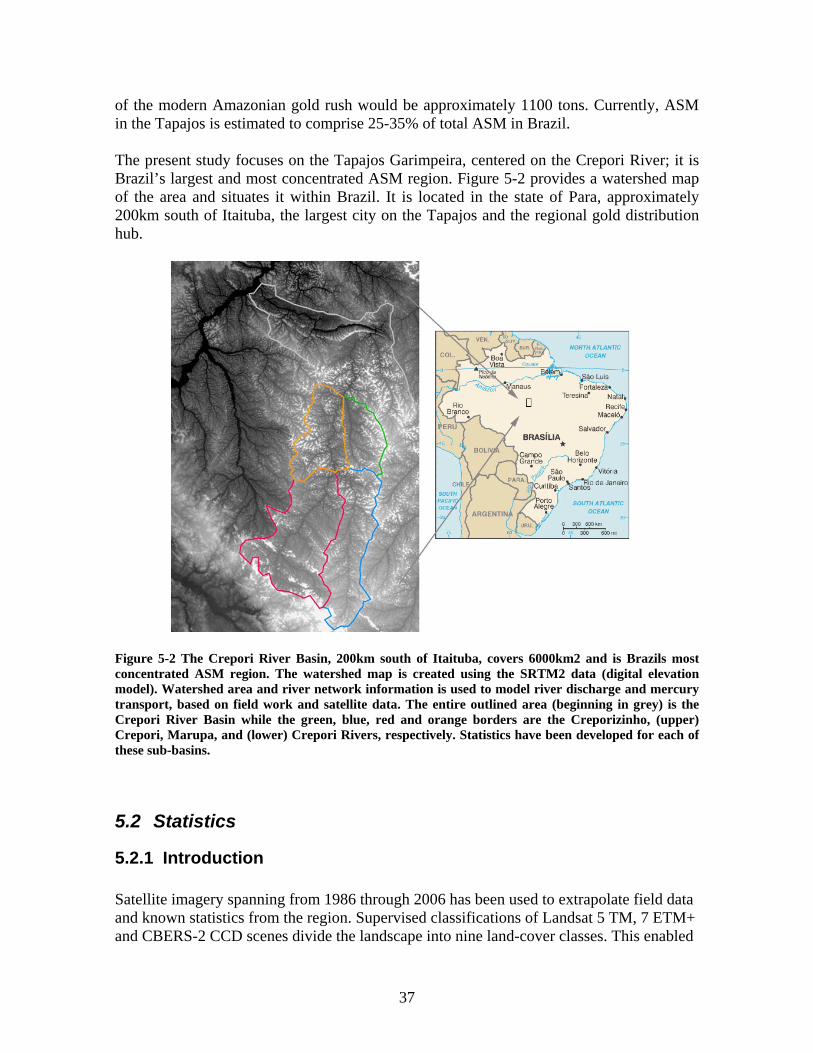
Figure 5-2 The Crepori River Basin, 200km south of Itaituba, covers 6000km2 and is Brazils most concentrated ASM region. The watershed map is created using the SRTM2 data (digital elevation model). Watershed area and river network information is used to model river discharge and mercury transport, based on field work and satellite data. The entire outlined area (beginning in grey) is the Crepori River Basin while the green, blue, red and orange borders are the Creporizinho, (upper) Crepori, Marupa, and (lower) Crepori Rivers, respectively. Statistics have been developed for each of these sub-basins. ............. 37
Figure 5-3 Subset of Landsat 7 ETM+ Composite Image (Bands 5,4,3), August 1999 (upper) and corresponding supervised classification result (lower) used to delineate the areal extent of ASM. ............................................................................................................ 38
Figure 5-4 Satellite Imagery Screen shots from Google EarthTM Professional. Dredge operation 5km up a small tributary of the Tapajos (left), Remote garimpo (has airstrip) in the Jamaxim River basin, 100km south east of Creporizinho. ............................................. 40
8
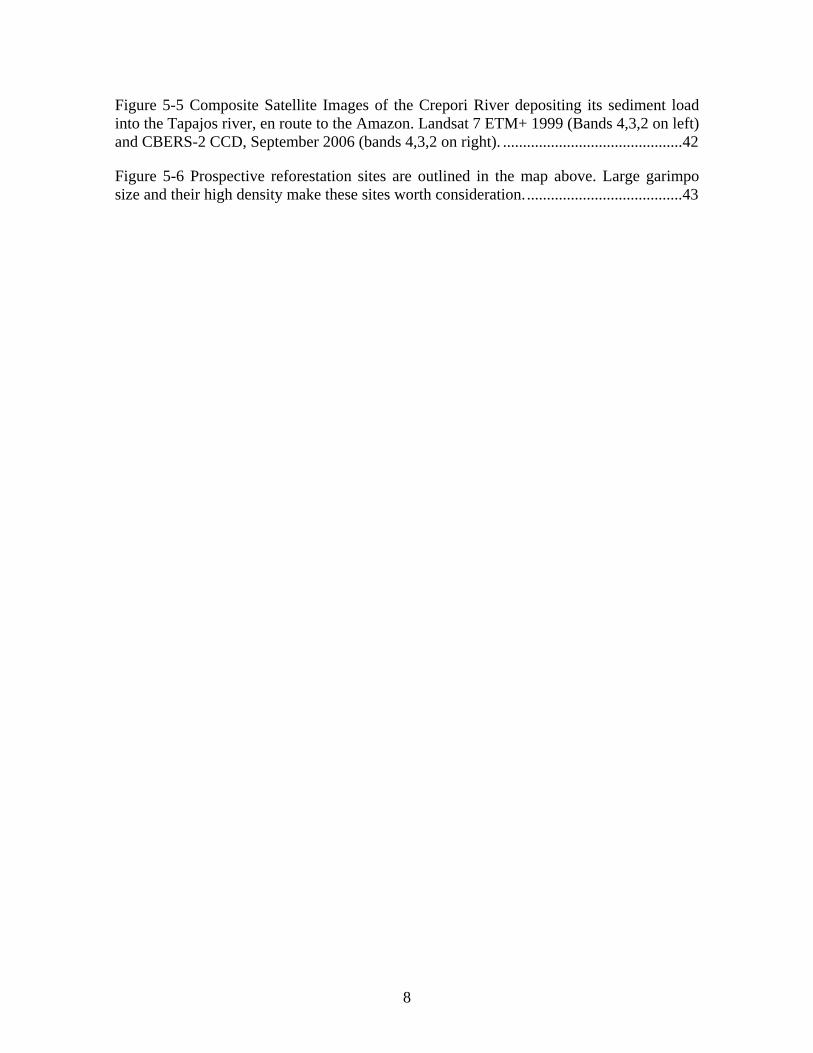
Figure 5-5 Composite Satellite Images of the Crepori River depositing its sediment load into the Tapajos river, en route to the Amazon. Landsat 7 ETM+ 1999 (Bands 4,3,2 on left) and CBERS-2 CCD, September 2006 (bands 4,3,2 on right). ............................................. 42
Figure 5-6 Prospective reforestation sites are outlined in the map above. Large garimpo size and their high density make these sites worth consideration. ....................................... 43
9
1 Current Situation Small scale gold mining represents the single largest demand for mercury in the world, releasing 800 to 1000 tonnes of mercury per year into the environment. Between 10 to 15 million small scale miners in at least 55 countries work using many different techniques on a wide array of ore types.
1.1 Mercury in the Environment Mercury has a complex biogeochemical cycle in air, soils, water, and biota. Mercury originates from both natural and anthropogenic sources. Human activities are believed to have increased mercury in the environment by a factor of three globally (Fitzgerald et al. 1998). The main anthropogenic emissions are through energy production, artisanal gold mining (ASM), industry, and dental amalgam. Artisanal Gold Mining has recently become the single largest direct use source of Mercury to the Environment and represents 1/4 to 1/3 of all anthropogenic emissions. For example Robert Finkleman of the USGS and University of Texas has suggested that a more reasonable estimate for mercury emissions from coal is ~1000 tons per year (pers. comm., 2007).
1.2 Environmental Concern of Mercury The main environmental concern is the transformation of mercury into its most toxic form – methylmercury – and its subsequent bioaccumulation in the food chain (mainly into fish) (Kainz et al., 2006). Fish are one of the most important dietary sources of protein – particularly in terms of quality. Only a tiny fraction of the total mercury in a contaminated site needs to be methylated in order to create serious food chain contamination. Mercury contamination of aquatic systems persists for hundreds of years and is extremely difficult to clean up (Winch, 2007).
1.3 Human Exposure to Mercury Humans are exposed primarily through fish consumption but also through direct inhalation of mercury vapour. The main health concern is neurological damage. Unborn foetuses and babies are most strongly impacted because neurological development is interrupted whereas for adults impacts are due to degradation of a properly developed neurological system. Health research struggles to define guidelines to balance the health benefits of fish consumption against the hazards of mercury intake. Unlike some other metals, there is no safe threshold below which mercury intake does not impact health. Therefore the current trend is to lower the intake guidelines. This means fish consumption, especially for mothers and children, remains a controversial issue.
1.4 Mercury Use in ASM
Mercury is used in ASM for the following reasons:

10
• It is effective at capturing gold • It is very easy • It is very independent – 1 person can do it • It is accessible and affordable (1g Hg = $0.05; 1g Au = $20; 1:400, or 0.3% of
revenue) • Miners are not aware of the risks • In many cases miners are not aware of alternatives or do not have the capacity to
practice them – i.e. they have no choice
Mercury is commonly used when simple gravity methods cannot produce concentrates greater than 10-20% gold. This is true of many simple hydraulic sluicing operations. It is also used when capital (cash) is needed quickly for subsistence or to purchase materials and supplies needed for more sophisticated techniques like leaching with cyanide.
1.5 How Mercury is released to the Environment Mercury is released to the environment during artisanal gold mining (ASM) in a variety of ways. When it is used to amalgamate gold, some escapes directly into water bodies as elemental mercury droplets or as coatings of mercury adsorbed onto sediment grains. The mercury that forms the amalgam with gold is emitted to the atmosphere when the amalgam is heated. As well naturally occurring mercury in soils and sediments that are eroded by sluicing and dredging becomes remobilised and bioavailable in receiving waters. Finally, where a combination of cyanide and mercury are used, the formation of cyano-mercuric complexes enhances transport and bio-availability. The interactions of cyanide and mercury remain poorly understood at this time.
1.6 Type of Amalgamation versus Amount of Mercury Consumed The amount of mercury lost during mining depends on the amalgamation approach used. In cases where the whole ore is amalgamated, losses of mercury can be very large – as high as 20 units of mercury lost to recover 1 unit of gold. In these cases, most of the mercury is lost directly into waters. Losses to the atmosphere are roughly equal to the amount of gold produced. For example, if 20 g of mercury is consumed to produce 1 g of gold, then 19 g of mercury are discharged to water and 1 g of mercury is emitted to the atmosphere. In cases where only a gravity concentrate is amalgamated, losses are normally about 1.3 units of mercury for each unit of gold, but can be significantly lower if a mercury capturing system is used when the amalgam is burnt – retorts or fume hoods. For example, commonly 1.3 g of mercury is consumed to amalgamate 1 g of gold from a gravity concentrate produced by sluicing alluvial ore. In this case 0.3 g of mercury is discharged to water with the tailings and 1 g of mercury is emitted to the atmosphere. Alternatively atmospheric emissions can be trapped by fume hoods or retorts reducing losses to 0.3 g and localising them to the immediate receiving waters. Although this is still unacceptable by modern environmental laws, it represents a vast improvement from the status quo and is clearly a move in the right direction. Eliminating whole ore amalgamation and instigating fume hood and retort use is a central theme of the GMP. A 50% reduction in mercury use in ASM could easily be obtained simply by carrying out these two practices. In many cases

11
this represents zero cost or even additional profits for miners and so are easily accepted changes in practice.
1.7 Methyl Mercury from ASM Research in Canada and the United States has shown that MeHg production from contaminated tailings persist for at least 100 years (USGS, Susan Winch). Further, only a tiny fraction of mine waste needs to be methylated in order to create a huge environmental problem. A key to methylation is the creation of anoxic sediments. These are very commonly produced in the tropics during annual inundation of riverine flood plains such as the Amazon’s Varzea. Unfortunately, much mining in the dry season discharges mercury rich sediments into basins that later become inundated. This is true for 7 % of the Crepori Basin, the focus of Brazil’s modern gold rush in the Amazon. Specifically, 500 km2 of the Tapajos River downstream of mines are inundated annually.
1.8 Summary of Mercury in ASM In summary, the environmental impacts of mercury discharged from ASM are as follows: • 300 tonnes of mercury per annum are volatilized directly to the atmosphere • 700 tonnes are discharged into soils, rivers and lakes. • Severe occupational hazards – Mercury vapour • Tens of thousands of polluted sites with far reaching impacts • Long-term environmental health hazards to populations and ecosystems • Global food chain contamination • Global ecosystem damage • Intense local food chain contamination • Intense local ecosystem damage • Neurological damage to people and animals • Decreased capacity for innovation and prosperity – societal regression
1.9 River Siltation in ASM Another significant environmental impact caused by ASM is river siltation. Dredging and sluicing sediment and soils for gold causes the discharge of huge amounts of sediment into rivers, lakes and oceans. This discharge represents a huge increase in the erosion rate. For example, small scale mining is now the main source of sediment to Brazil’s Tapajos River which is one of the Amazon’s largest tributaries and one of the world’s largest rivers (Telmer et al., 2006). It is about twice the size of Europe’s largest river, the Danube. In the tropics sediments are very fine because they are rich in clays. This is due to the nature of soil formation in the tropics. When discharged into rivers, a significant portion of these clay rich sediments remain in suspension indefinitely. Sediment discharged from ASM is consequently transported hundreds to thousands of kilometres downstream and into the ocean.
12
1.10 Environmental Impacts of Siltation These sediment discharges have severe environmental impacts. The increases in suspended sediment reduce the penetration of light into waters and change the nutrient supply. This drastically alters the natural habitat (Costa, Telmer, and Novo, in press) biologically - productivity and diversity is reduced and shifts in species assemblages are extreme. There are also impacts directly related to mercury. The process of soil formation naturally concentrates and sequesters mercury. Soils around gold mining areas are both naturally rich in mercury and receive mercury released from amalgam burning. The erosion of soils by mining releases mercury accumulated during soil formation into water bodies where it becomes available to be methylated and bioaccumulated. Therefore mercury released into water bodies by soil erosion represents a large anthropogenic source of mercury into waters. The amount of mercury released by this process includes that added by miners but also the mercury that was naturally accumulated in the soils. In many cases, the latter can be the larger number.
1.11 Knowledge Gaps Very little high quality research has been done on mercury in ASM. Despite being one of the largest sources of mercury to the environment, research on mercury in ASM has been poorly funded and unsophisticated relative to that carried out in the northern hemisphere. Significant knowledge gaps about the quantities and fate of mercury released from ASM therefore remain. Particularly wanting are:
– Quantities of Hg released – Transport and Fate of Mercury – Methylation of Mercury – Mercury and Cyanide Interactions
In fact many of the remaining knowledge gaps highlighted by the plenary panellists at the 8th ICMGP (International Conference on Mercury as a Global Pollutant, “Mercury 2006”) apply to mercury and gold mining. Some of the relevant gaps identified are:
• Air-surface exchange • Role of Halogens • Trends in active pools • Hydrology • How to scale up • The role of dissolved organic matter DOM • Modelling challenges • Inorganic mercury vs. Methyl mercury in contamination in fish • Mercury in aquaculture
Mercury use in small scale mining is an ideal opportunity to build this knowledge because of its global scope, wide reaching impacts and the potential to learn from current practises, spread awareness and produce innovative solutions. The current lack of understanding puts

13
a limitation on the development of innovative solutions towards prevention and remediation.
1.12 Database and Monitoring of ASM The current database on ASM is poor. Data on the location, size and regional-scale of artisanal mining do not exist. Studies have been done for specific sites and communities but never used to develop a wider dataset. A good database can be effective at creating incentives and awareness for political bodies. In ASM, Knowledge mobilizes decision makers at all levels
– Miners – Local government – Local people – Regional government – National government – Private sector – General public – International bodies & awareness efforts
1.13 Development of Database and Monitoring System Here we pioneer an approach that mixes field data from assessments and training workshops with Remote Sensing and GIS. This approach was used to generate the following information and analysis for the Brazilian and Indonesian study areas:
– Area mined, extent and location of ASM operations – Number of operations and their mobility – Hg emissions resulting from ASM – Riverine mercury transport – Prospective sites for mine reclamation – Location of current activity (Change Detection)
It would be useful to populate this database annually so that it can serve as an information portal and ASM watchdog service. The database could be made available online in digital format as a digital-atlas (GIS) perhaps utilizing a Google Earth interface to serve the database. The pilot version of this is available at www.globalmercuryproject.org
1.14 Summary The most significant environmental issues presented by artisanal gold mining are (i) mercury emissions to the atmosphere and to surface waters and the consequential development of mercury hotspots that last for centuries, and (ii) land-degradation and river siltation and the associated deforestation, loss of organic soil, modification of hydrologic regimes and loss of aquatic habitat
14
These issues are complicated by characteristics of the informal gold mining sector including that ASM remains illegal in many of the areas where it operates; ASM communities are remote and have a transient nature- moving quickly when better gold areas are found; different mine types and gold purifying methods are used in different regions; and the general lack of communication within and between artisanal miners and government authorities. An approach that links field knowledge and community action with international stakeholders, as exemplified under the pilot Global Mercury Project, appears to have a chance at success where other efforts have failed. A key to this approach is building a reliable database on ASM and its trends.
1.15 Highlights • The environmental impacts of ASM are large • Innovation, organisation, and education can quickly reduce these impacts and lay
the groundwork for sustainability • Innovative *field based* engagement financed through government and industry
partners is working • Communicating and evaluating progress, monitoring trends, and providing
political incentive for action can be accomplished via an online database populated annually
15
2 Current Project Many governments and organizations have become aware of the environmental issues stemming from ASM but do not have any reliable information on its magnitude. This is because there simply is no robust database on the location, size and impacts of artisanal mining and mercury use. Here, by combining field based data collected by GMP with remotely sensed data (satellite imagery and aerial photography) we are able to begin to quantify mercury emissions and environmental impacts to the environment in the Amazon and in Indonesia. Using a geographical information system (GIS) approach, aerial photography and satellite imagery were used to determine the extent and spread of artisanal mining. The effects and numbers from known ASM sites were extrapolated across the extents of ASM visible in the imagery to provide quantitative estimates of parameters such as total land degradation and mercury use. This in turn was used to evaluate prevention and remediation options.
16
3 Building a Database on ASM and Mercury Use Monitoring regional land-cover with the use of satellite technology has become commonplace, especially in the resource sector. Images of mine sites and forest stands are used to make critical decisions regarding how sites are managed. Regional-scale datasets can be created which identify features that would not otherwise be seen. This is done by using the framework of a geographic information system (GIS). The GIS consists of multiple types of data linked by their geographic coordinates. Below, the data types used in the current project are introduced.
3.1 Optical Imagery Multi-spectral satellites such as LANDSAT sense reflected light mainly in the visible wavelengths. The main challenge of using optical imagery for Indonesia and Brazil is cloud-cover and haze – cloud free imagery may not be available over certain regions for months and even years. In this pilot study, we investigated the utility of the following optical sensors:
LANDSAT 7 ETM+ (15m pixel resolution, 80km x 80km) LANSDAT 5 (30m pixel resolution, 80km x 80km) SPOT-2 (20m pixel resolution, 120km x 120km) CBERS-2 (20m pixel resolution, 60km x 60km) Quickbird (2.5m pixel resolution for multispectral, 60cm resolution panchromatic
acquired simultaneously) Quickbird is a state-of the-art satellite platform which provides the highest commercially available resolution. The product includes four multi-spectral bands recorded at 2.5 meter spatial resolution and one 60cm panchromatic band, acquired simultaneously. Optimal image results are produced using a processing module that combines the spatial information from the panchromatic band with the multi-spectral bands producing 60cm resolution false-color imagery. The level of detail in this imagery was tested to see if individual ASM workings (such as a sluice box) could be identified and used to build independent statistics about the size of the ASM workforce. As the most detailed product, Quickbird has been used to provide ground truth for the other sensors covering coincident regions.
3.2 Radar Imagery Synthetic Aperture Radar Imagery (SAR) is an active system that has the benefit of being able to see through cloud cover and at night (more frequent acquisitions). The drawback is that SAR imagery does not provide information as rich as that of optical data, making the identification of landuse more difficult. However, the ease with which SAR can be collected allows multiple images to be collected over a relatively short time which in turn allows “repeat-pass change detection” analysis to be performed. This is a powerful tool for detecting the migration of ASM sites over the course of months to years. With the aid of the Japanese Aeronautics Exploration Agency (JAXA) who generously provided data from
17
their newly launched ALOS earth observation satellite under the K&C Initiative to Kevin Telmer (a PI of the K&C Initiative); we investigate the utility of RADAR based change detection in this study.
3.3 Shuttle Radar Topography Mission (SRTM) SRTM data is a global digital elevation model (DEM) with 90 meter ground resolution. Hydrological network analysis (stream and river transport modeling) was performed with this data to delineate drainage networks and flow maps to help understand the transport of contaminated water and sediment at ASM sites.
3.4 Aerial Photography Aerial Photography of the mining areas was carried out during field campaigns and used to understand the magnitude and dynamics of the ASM sites and to ground truth the satellite imagery. This has provided detailed insight into ASM operations on recent GMP visits (Kevin Telmer) to mining areas in Indonesia and Brazil. GPS points were collected corresponding to the photography. These geo-referenced photos are ideal for viewing the regional impacts of ASM and for ground-truthing satellite data acquired over the areas photographed. Geological samples were also collected on these visits. River water, suspended sediments, bottom sediments, soils, mine tailings and mine concentrates have been analyzed for mercury and other relevant geochemistry including cations, anions, pH and alkalinity. Costs for this work were borne by the Aqueous Geochemistry Laboratory through independent funding to Kevin Telmer.
3.5 Approach A brief history of ASM is provided for each of Brazil and Indonesia. Mine statistics collected in the field are coupled with remote sensing and aerial photography from two principle regions: the Crepori River basin in Para, Brazil (tributary of the Tapajos) and the Galangan mining region in Central Kalimantan, Indonesia. The following statistics regarding the extent and effects of ASM are presented:
1. Area mined, extent and location of ASM operations 2. Number of operations and their mobility 3. Hg emissions resulting from ASM 4. Riverine mercury transport 5. Prospective sites for mine reclamation
Mass balance is a technical term for an estimate based on the amount (mass) of material involved. Mass balances often provide unequivocal constraints on flows of materials like mercury. Although there is uncertainty involved in making mass balances, the numbers presented are realistic due to physical constraints such as water flow in a river, sluicing rate, etc…
18
The data presented and referenced in this report is being made available in digital format as a digital-atlas (GIS) on a web site at the University of Victoria (http://hgwatch.uvic.ca). A link to this site also exists on the website for the Global Mercury Project (www.globalmercuryproject.org). The digital atlas will be available online for interested parties including international organizations, mining-community interest groups, NGOs and miners. This is a non-technical report. Key parameters and mercury use statistics are presented and discussed in sections four (Brazil) and five (Indonesia). An overview of the techniques used and results from RADAR analysis follows in section six. Following this, the digital atlas (GIS), for accessing project data is presented. The final chapter focuses on recommendations for remediation and mine reclamation.
19
4 The Indonesia Case
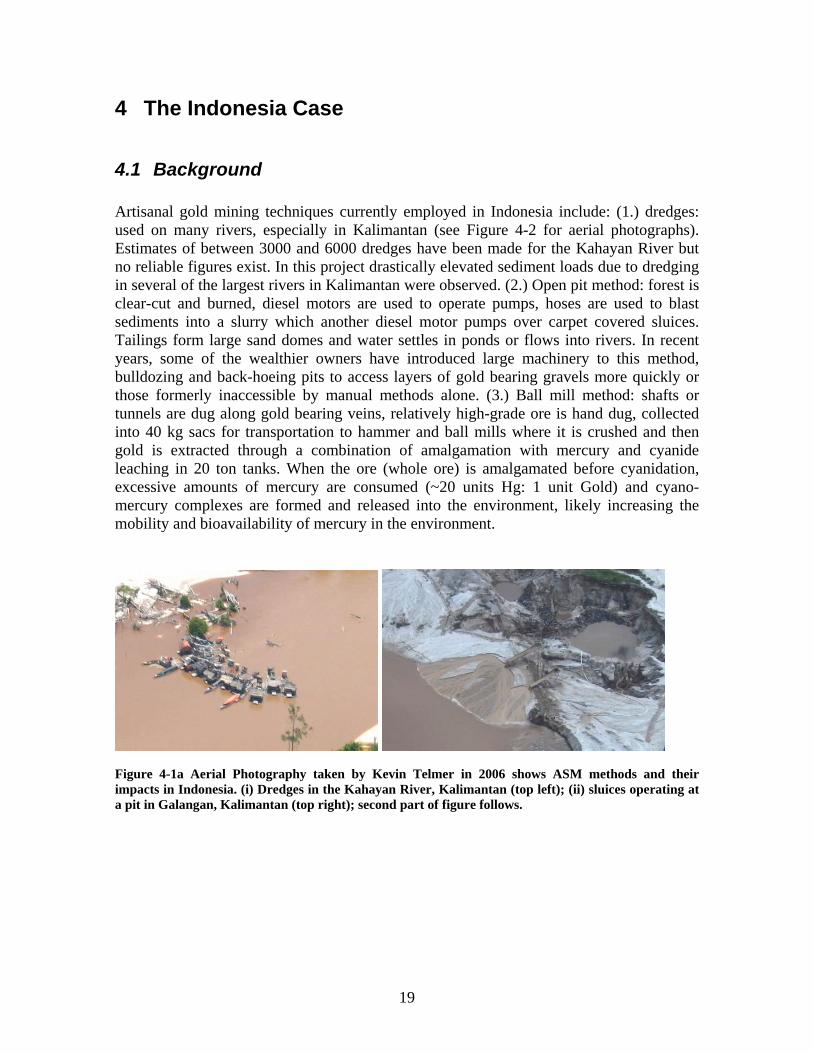
4.1 Background Artisanal gold mining techniques currently employed in Indonesia include: (1.) dredges: used on many rivers, especially in Kalimantan (see Figure 4-2 for aerial photographs). Estimates of between 3000 and 6000 dredges have been made for the Kahayan River but no reliable figures exist. In this project drastically elevated sediment loads due to dredging in several of the largest rivers in Kalimantan were observed. (2.) Open pit method: forest is clear-cut and burned, diesel motors are used to operate pumps, hoses are used to blast sediments into a slurry which another diesel motor pumps over carpet covered sluices. Tailings form large sand domes and water settles in ponds or flows into rivers. In recent years, some of the wealthier owners have introduced large machinery to this method, bulldozing and back-hoeing pits to access layers of gold bearing gravels more quickly or those formerly inaccessible by manual methods alone. (3.) Ball mill method: shafts or tunnels are dug along gold bearing veins, relatively high-grade ore is hand dug, collected into 40 kg sacs for transportation to hammer and ball mills where it is crushed and then gold is extracted through a combination of amalgamation with mercury and cyanide leaching in 20 ton tanks. When the ore (whole ore) is amalgamated before cyanidation, excessive amounts of mercury are consumed (~20 units Hg: 1 unit Gold) and cyano-mercury complexes are formed and released into the environment, likely increasing the mobility and bioavailability of mercury in the environment.
Figure 4-1a Aerial Photography taken by Kevin Telmer in 2006 shows ASM methods and their impacts in Indonesia. (i) Dredges in the Kahayan River, Kalimantan (top left); (ii) sluices operating at a pit in Galangan, Kalimantan (top right); second part of figure follows.
20
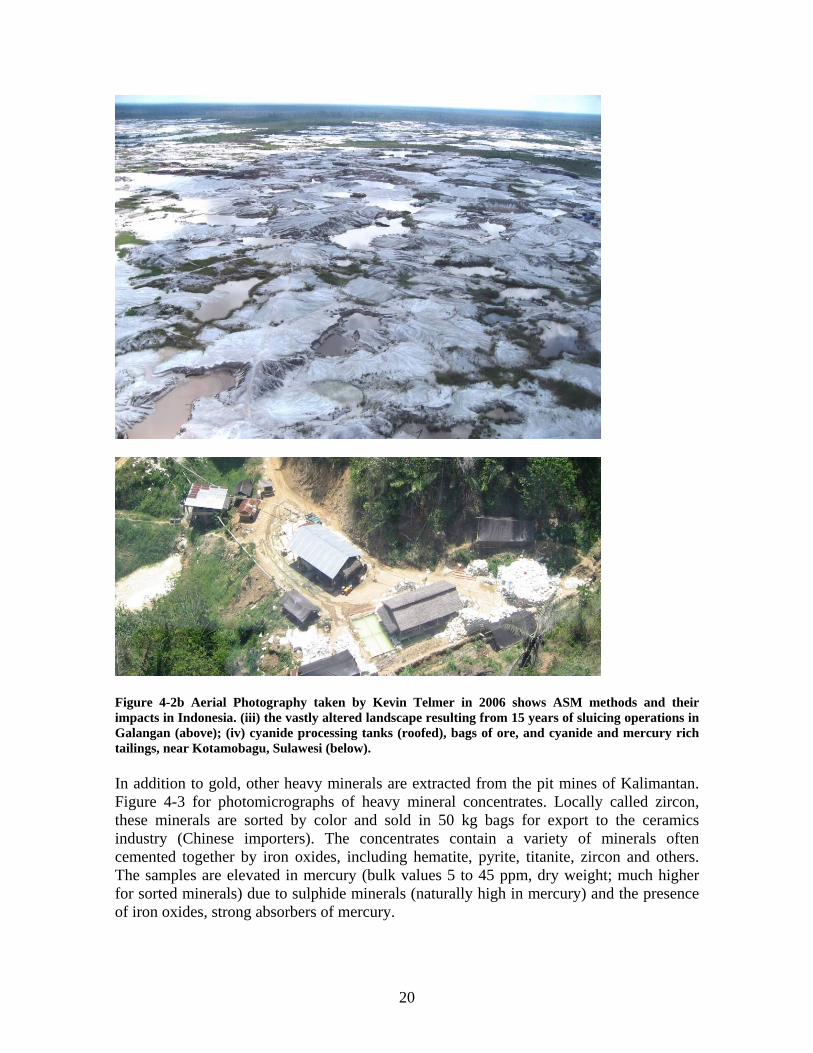
Figure 4-2b Aerial Photography taken by Kevin Telmer in 2006 shows ASM methods and their impacts in Indonesia. (iii) the vastly altered landscape resulting from 15 years of sluicing operations in Galangan (above); (iv) cyanide processing tanks (roofed), bags of ore, and cyanide and mercury rich tailings, near Kotamobagu, Sulawesi (below). In addition to gold, other heavy minerals are extracted from the pit mines of Kalimantan. Figure 4-3 for photomicrographs of heavy mineral concentrates. Locally called zircon, these minerals are sorted by color and sold in 50 kg bags for export to the ceramics industry (Chinese importers). The concentrates contain a variety of minerals often cemented together by iron oxides, including hematite, pyrite, titanite, zircon and others. The samples are elevated in mercury (bulk values 5 to 45 ppm, dry weight; much higher for sorted minerals) due to sulphide minerals (naturally high in mercury) and the presence of iron oxides, strong absorbers of mercury.
21
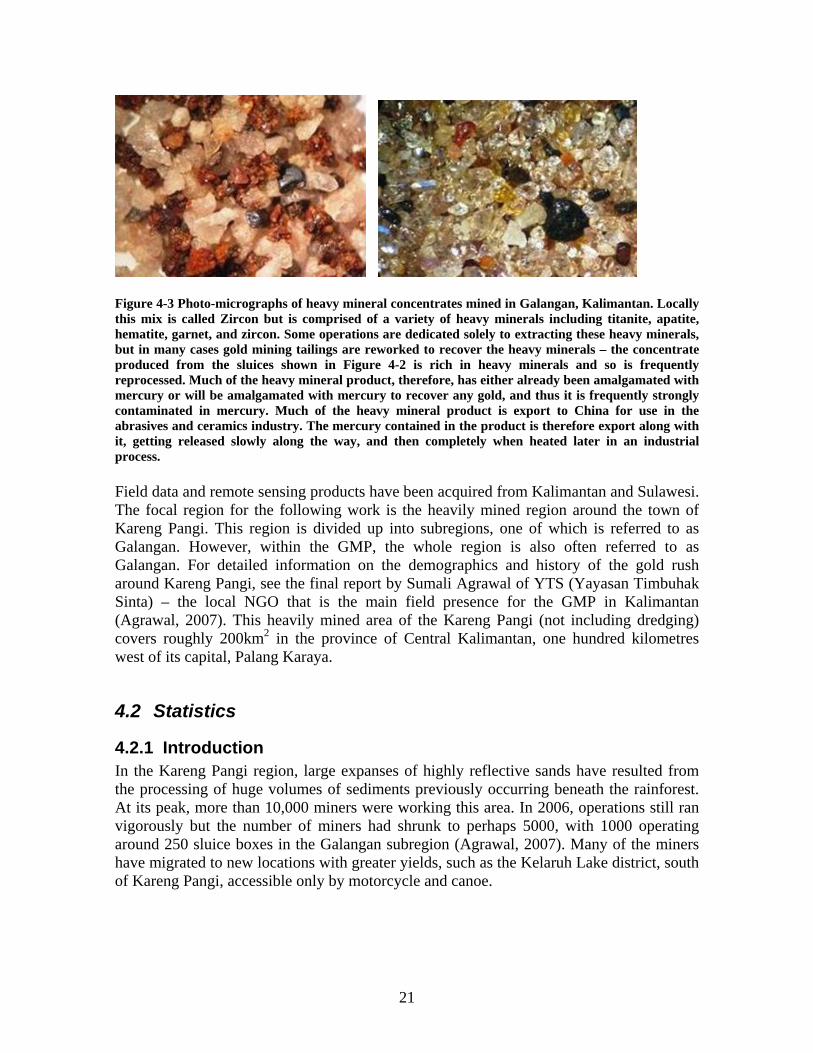
Figure 4-3 Photo-micrographs of heavy mineral concentrates mined in Galangan, Kalimantan. Locally this mix is called Zircon but is comprised of a variety of heavy minerals including titanite, apatite, hematite, garnet, and zircon. Some operations are dedicated solely to extracting these heavy minerals, but in many cases gold mining tailings are reworked to recover the heavy minerals – the concentrate produced from the sluices shown in Figure 4-2 is rich in heavy minerals and so is frequently reprocessed. Much of the heavy mineral product, therefore, has either already been amalgamated with mercury or will be amalgamated with mercury to recover any gold, and thus it is frequently strongly contaminated in mercury. Much of the heavy mineral product is export to China for use in the abrasives and ceramics industry. The mercury contained in the product is therefore export along with it, getting released slowly along the way, and then completely when heated later in an industrial process. Field data and remote sensing products have been acquired from Kalimantan and Sulawesi. The focal region for the following work is the heavily mined region around the town of Kareng Pangi. This region is divided up into subregions, one of which is referred to as Galangan. However, within the GMP, the whole region is also often referred to as Galangan. For detailed information on the demographics and history of the gold rush around Kareng Pangi, see the final report by Sumali Agrawal of YTS (Yayasan Timbuhak Sinta) – the local NGO that is the main field presence for the GMP in Kalimantan (Agrawal, 2007). This heavily mined area of the Kareng Pangi (not including dredging) covers roughly 200km2 in the province of Central Kalimantan, one hundred kilometres west of its capital, Palang Karaya.
4.2 Statistics
4.2.1 Introduction In the Kareng Pangi region, large expanses of highly reflective sands have resulted from the processing of huge volumes of sediments previously occurring beneath the rainforest. At its peak, more than 10,000 miners were working this area. In 2006, operations still ran vigorously but the number of miners had shrunk to perhaps 5000, with 1000 operating around 250 sluice boxes in the Galangan subregion (Agrawal, 2007). Many of the miners have migrated to new locations with greater yields, such as the Kelaruh Lake district, south of Kareng Pangi, accessible only by motorcycle and canoe.
22
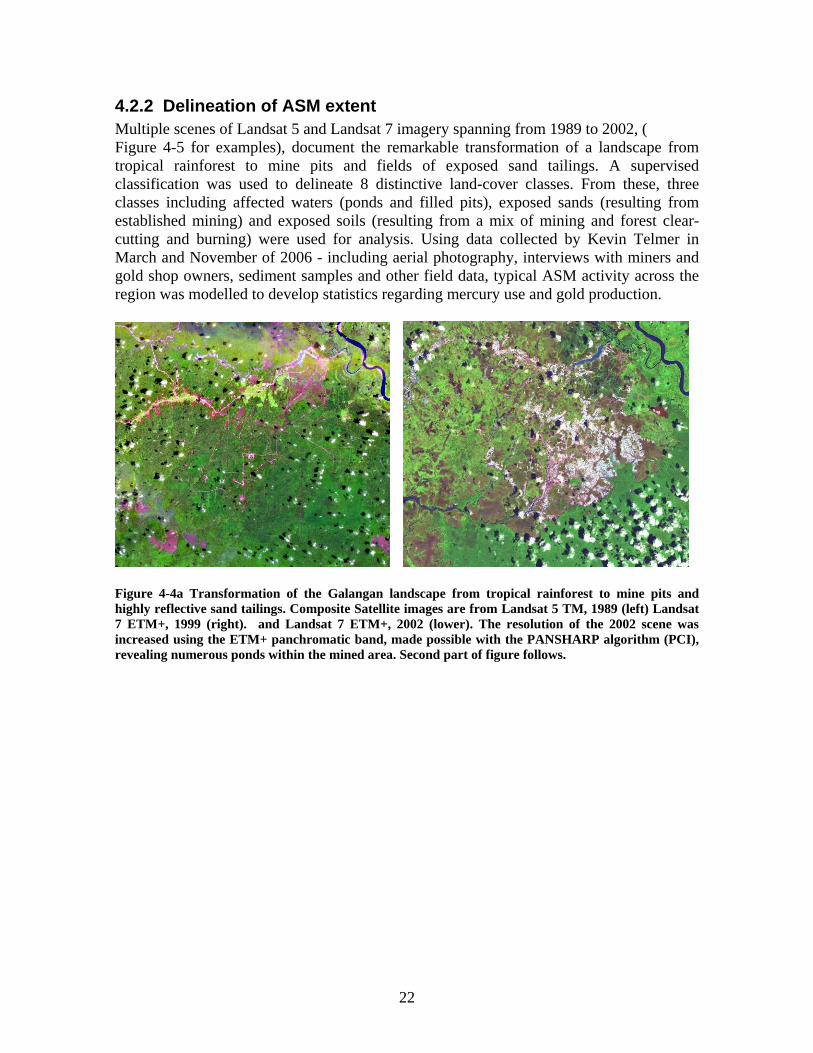
4.2.2 Delineation of ASM extent Multiple scenes of Landsat 5 and Landsat 7 imagery spanning from 1989 to 2002, ( Figure 4-5 for examples), document the remarkable transformation of a landscape from tropical rainforest to mine pits and fields of exposed sand tailings. A supervised classification was used to delineate 8 distinctive land-cover classes. From these, three classes including affected waters (ponds and filled pits), exposed sands (resulting from established mining) and exposed soils (resulting from a mix of mining and forest clear-cutting and burning) were used for analysis. Using data collected by Kevin Telmer in March and November of 2006 - including aerial photography, interviews with miners and gold shop owners, sediment samples and other field data, typical ASM activity across the region was modelled to develop statistics regarding mercury use and gold production.
Figure 4-4a Transformation of the Galangan landscape from tropical rainforest to mine pits and highly reflective sand tailings. Composite Satellite images are from Landsat 5 TM, 1989 (left) Landsat 7 ETM+, 1999 (right). and Landsat 7 ETM+, 2002 (lower). The resolution of the 2002 scene was increased using the ETM+ panchromatic band, made possible with the PANSHARP algorithm (PCI), revealing numerous ponds within the mined area. Second part of figure follows.
23
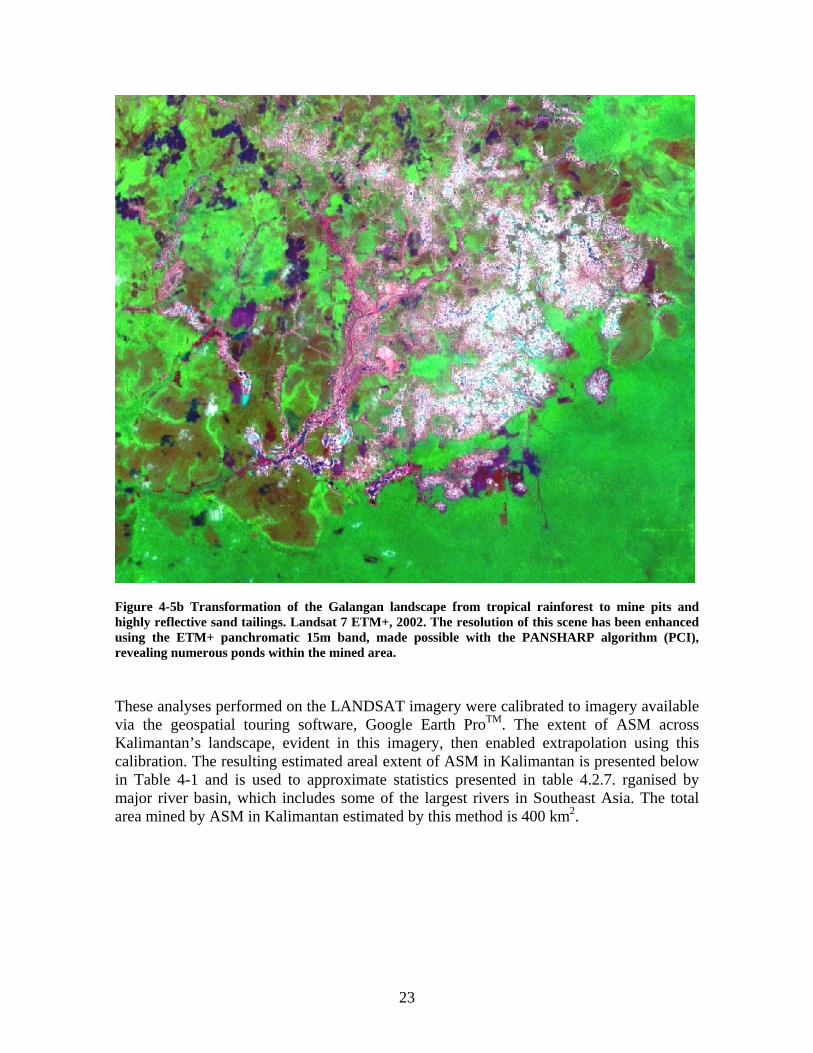
Figure 4-5b Transformation of the Galangan landscape from tropical rainforest to mine pits and highly reflective sand tailings. Landsat 7 ETM+, 2002. The resolution of this scene has been enhanced using the ETM+ panchromatic 15m band, made possible with the PANSHARP algorithm (PCI), revealing numerous ponds within the mined area. These analyses performed on the LANDSAT imagery were calibrated to imagery available via the geospatial touring software, Google Earth ProTM. The extent of ASM across Kalimantan’s landscape, evident in this imagery, then enabled extrapolation using this calibration. The resulting estimated areal extent of ASM in Kalimantan is presented below in Table 4-1 and is used to approximate statistics presented in table 4.2.7. rganised by major river basin, which includes some of the largest rivers in Southeast Asia. The total area mined by ASM in Kalimantan estimated by this method is 400 km2.
24
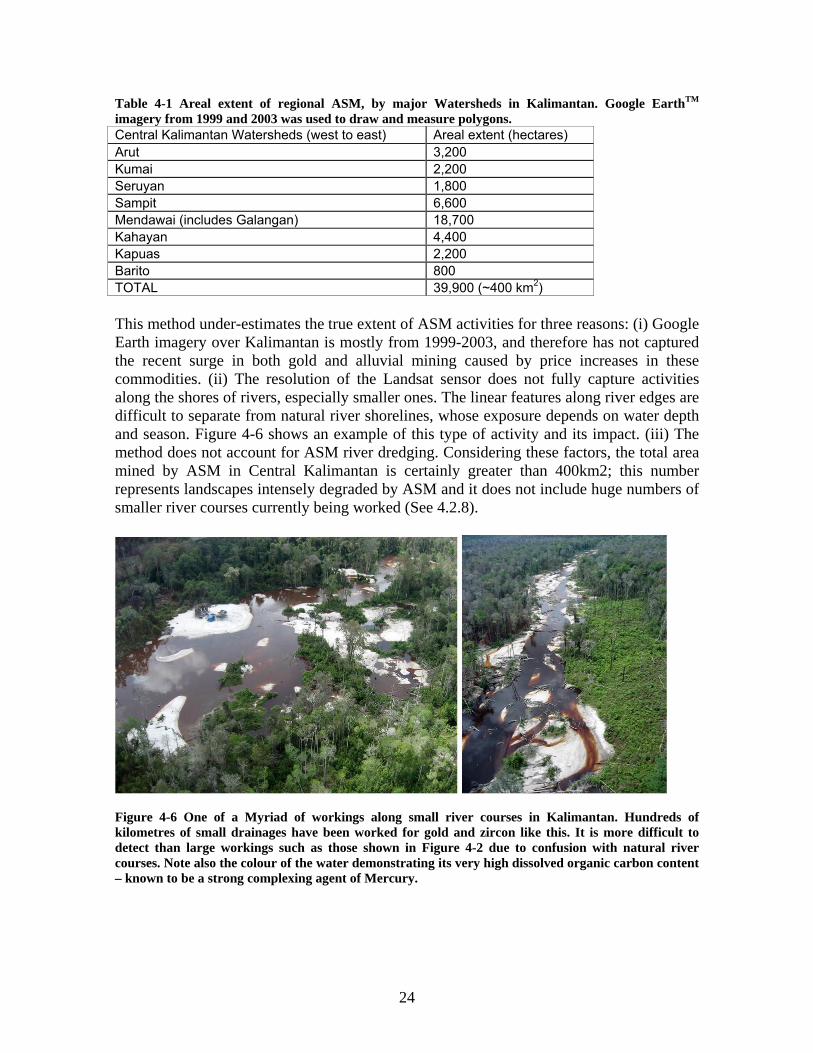
Table 4-1 Areal extent of regional ASM, by major Watersheds in Kalimantan. Google EarthTM imagery from 1999 and 2003 was used to draw and measure polygons. Central Kalimantan Watersheds (west to east) Areal extent (hectares) Arut 3,200 Kumai 2,200 Seruyan 1,800 Sampit 6,600 Mendawai (includes Galangan) 18,700 Kahayan 4,400 Kapuas 2,200 Barito 800 TOTAL 39,900 (~400 km2) This method under-estimates the true extent of ASM activities for three reasons: (i) Google Earth imagery over Kalimantan is mostly from 1999-2003, and therefore has not captured the recent surge in both gold and alluvial mining caused by price increases in these commodities. (ii) The resolution of the Landsat sensor does not fully capture activities along the shores of rivers, especially smaller ones. The linear features along river edges are difficult to separate from natural river shorelines, whose exposure depends on water depth and season. Figure 4-6 shows an example of this type of activity and its impact. (iii) The method does not account for ASM river dredging. Considering these factors, the total area mined by ASM in Central Kalimantan is certainly greater than 400km2; this number represents landscapes intensely degraded by ASM and it does not include huge numbers of smaller river courses currently being worked (See 4.2.8).
Figure 4-6 One of a Myriad of workings along small river courses in Kalimantan. Hundreds of kilometres of small drainages have been worked for gold and zircon like this. It is more difficult to detect than large workings such as those shown in Figure 4-2 due to confusion with natural river courses. Note also the colour of the water demonstrating its very high dissolved organic carbon content – known to be a strong complexing agent of Mercury.
25
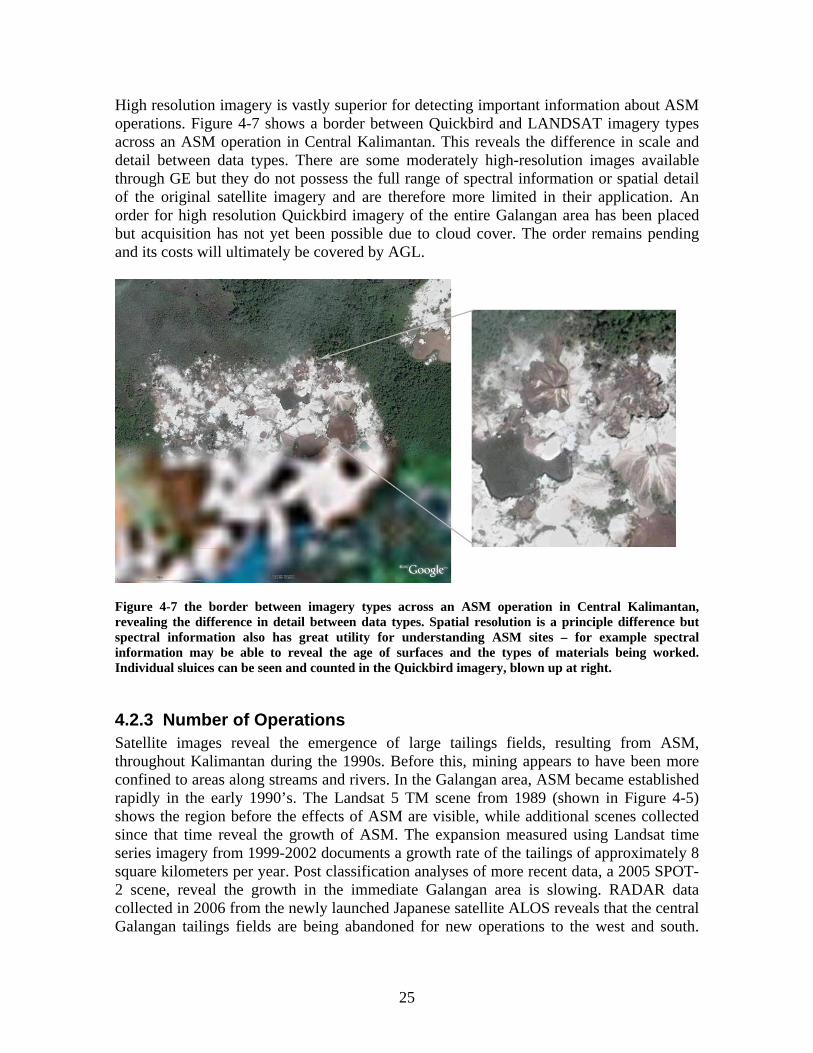
High resolution imagery is vastly superior for detecting important information about ASM operations. Figure 4-7 shows a border between Quickbird and LANDSAT imagery types across an ASM operation in Central Kalimantan. This reveals the difference in scale and detail between data types. There are some moderately high-resolution images available through GE but they do not possess the full range of spectral information or spatial detail of the original satellite imagery and are therefore more limited in their application. An order for high resolution Quickbird imagery of the entire Galangan area has been placed but acquisition has not yet been possible due to cloud cover. The order remains pending and its costs will ultimately be covered by AGL.
Figure 4-7 the border between imagery types across an ASM operation in Central Kalimantan, revealing the difference in detail between data types. Spatial resolution is a principle difference but spectral information also has great utility for understanding ASM sites – for example spectral information may be able to reveal the age of surfaces and the types of materials being worked. Individual sluices can be seen and counted in the Quickbird imagery, blown up at right.
4.2.3 Number of Operations Satellite images reveal the emergence of large tailings fields, resulting from ASM, throughout Kalimantan during the 1990s. Before this, mining appears to have been more confined to areas along streams and rivers. In the Galangan area, ASM became established rapidly in the early 1990’s. The Landsat 5 TM scene from 1989 (shown in Figure 4-5) shows the region before the effects of ASM are visible, while additional scenes collected since that time reveal the growth of ASM. The expansion measured using Landsat time series imagery from 1999-2002 documents a growth rate of the tailings of approximately 8 square kilometers per year. Post classification analyses of more recent data, a 2005 SPOT-2 scene, reveal the growth in the immediate Galangan area is slowing. RADAR data collected in 2006 from the newly launched Japanese satellite ALOS reveals that the central Galangan tailings fields are being abandoned for new operations to the west and south.

26
Aerial photography taken in November of 2006 confirms this trend. This is discussed further in section 4.3.1. As mentioned, high resolution Quickbird imagery of the Galangan region, tasked as part of the current project, has not yet been collected due to atmospheric conditions (cloud cover and seasonal burning). The intention for this 60cm pixel resolution imagery is to investigate its use for identifying and counting individual sluice operations, as in figure 4-5. This product remains forthcoming and statistics developed from this prospect will be incorporated into the dataset at a later time. Estimates of over 20,000 dredges have been made for Central Kalimantan’s many rivers, including the postulation that between 3,000 and 6,000 may work in the Kahayan River alone. Based on the flights chartered by Kevin Telmer over the region (including an 80km stretch of the Kahayan River) these estimates appear to be exaggerated. Aerial photography of dredge operations can be seen in Figure 4-2. Based on the available evidence – aerial photography, satellite imagery, elevated sediment loads, and interviews with dredge operators – we estimate that in Central Kalimantan only, between five and ten thousand dredges may be active during the dry season while between one and three thousand may be active all year long. The extent of dredging in other provinces of Kalimantan remains unknown although there is clear evidence that it is occurring and is extensive in some areas – particularly West Kalimantan.
4.2.4 Efficiency of Sluicing Operations around Kareng Pangi Around the year 2000 approximately 65km2 had been mined and was covered in worked sediments; this is a conservative estimate as it does not include the cleared or disturbed-land classes delineated from Landsat time-series imagery. By comparing the area of land impacted (based on the extent of the exposed sands class), with the amount of sediments processed (based on regional model - see Table 4-2), the efficiency with which the landscape has been exploited can be determined. Table 4-2 Efficiency of Mining - Estimate of the efficiency of landuse. The efficiency estimate is dependent on assumptions about the nature of the ore body. To demonstrate this, two estimates – max and min scenarios – based on the estimated thickness of the gold bearing sands are given. This is based on field observations and interviews with miners about the ores they have extracted thus far. Efficiency of Mining - Estimate of remaining resource within the already occupied area Total mined area (km2) 65 65 Thickness of gold bearing sands (m) 5 3 Potential mass processed (tonnes) 877,500,000 526,500,000 Potential Gold (kg) 87,750 52,650 Actual volume processed 110,376,000 110,376,000 Exploited 13% 21%
These calculations reveal how little of the area occupied by the current mining practices (now largely abandoned) have been effectively processed. Depending on the nature of the ore body, only between 13% and 21% of the resource within the disturbed area has been
27
processed. This suggests that, miners are leaving behind around 80% of the gold simply due to poor landuse planning. A further implication is that, with better planning, the impacted area could sustain mining decades without significantly growing in extent, thereby minimizing further environmental impacts.
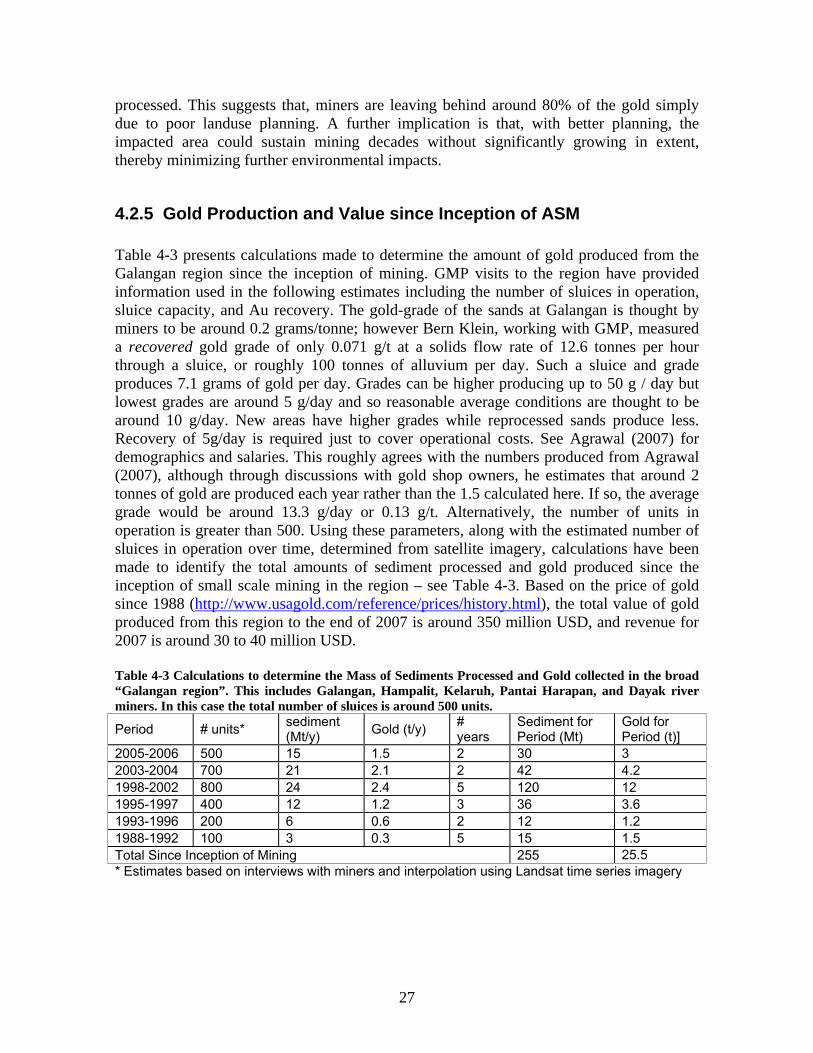
4.2.5 Gold Production and Value since Inception of ASM Table 4-3 presents calculations made to determine the amount of gold produced from the Galangan region since the inception of mining. GMP visits to the region have provided information used in the following estimates including the number of sluices in operation, sluice capacity, and Au recovery. The gold-grade of the sands at Galangan is thought by miners to be around 0.2 grams/tonne; however Bern Klein, working with GMP, measured a recovered gold grade of only 0.071 g/t at a solids flow rate of 12.6 tonnes per hour through a sluice, or roughly 100 tonnes of alluvium per day. Such a sluice and grade produces 7.1 grams of gold per day. Grades can be higher producing up to 50 g / day but lowest grades are around 5 g/day and so reasonable average conditions are thought to be around 10 g/day. New areas have higher grades while reprocessed sands produce less. Recovery of 5g/day is required just to cover operational costs. See Agrawal (2007) for demographics and salaries. This roughly agrees with the numbers produced from Agrawal (2007), although through discussions with gold shop owners, he estimates that around 2 tonnes of gold are produced each year rather than the 1.5 calculated here. If so, the average grade would be around 13.3 g/day or 0.13 g/t. Alternatively, the number of units in operation is greater than 500. Using these parameters, along with the estimated number of sluices in operation over time, determined from satellite imagery, calculations have been made to identify the total amounts of sediment processed and gold produced since the inception of small scale mining in the region – see Table 4-3. Based on the price of gold since 1988 (http://www.usagold.com/reference/prices/history.html), the total value of gold produced from this region to the end of 2007 is around 350 million USD, and revenue for 2007 is around 30 to 40 million USD. Table 4-3 Calculations to determine the Mass of Sediments Processed and Gold collected in the broad “Galangan region”. This includes Galangan, Hampalit, Kelaruh, Pantai Harapan, and Dayak river miners. In this case the total number of sluices is around 500 units.
Period # units* sediment (Mt/y) Gold (t/y) #
years Sediment for Period (Mt)
Gold for Period (t)]
2005-2006 500 15 1.5 2 30 3 2003-2004 700 21 2.1 2 42 4.2 1998-2002 800 24 2.4 5 120 12 1995-1997 400 12 1.2 3 36 3.6 1993-1996 200 6 0.6 2 12 1.2 1988-1992 100 3 0.3 5 15 1.5 Total Since Inception of Mining 255 25.5 * Estimates based on interviews with miners and interpolation using Landsat time series imagery
28
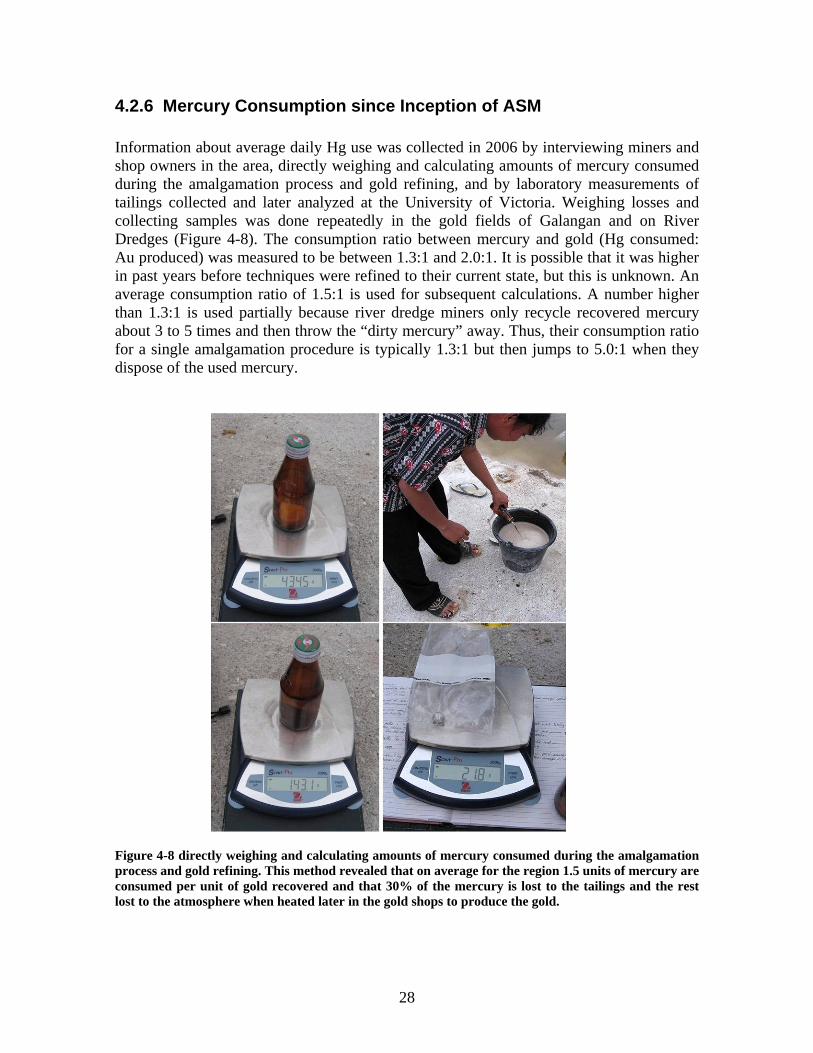
4.2.6 Mercury Consumption since Inception of ASM Information about average daily Hg use was collected in 2006 by interviewing miners and shop owners in the area, directly weighing and calculating amounts of mercury consumed during the amalgamation process and gold refining, and by laboratory measurements of tailings collected and later analyzed at the University of Victoria. Weighing losses and collecting samples was done repeatedly in the gold fields of Galangan and on River Dredges (Figure 4-8). The consumption ratio between mercury and gold (Hg consumed: Au produced) was measured to be between 1.3:1 and 2.0:1. It is possible that it was higher in past years before techniques were refined to their current state, but this is unknown. An average consumption ratio of 1.5:1 is used for subsequent calculations. A number higher than 1.3:1 is used partially because river dredge miners only recycle recovered mercury about 3 to 5 times and then throw the “dirty mercury” away. Thus, their consumption ratio for a single amalgamation procedure is typically 1.3:1 but then jumps to 5.0:1 when they dispose of the used mercury.
Figure 4-8 directly weighing and calculating amounts of mercury consumed during the amalgamation process and gold refining. This method revealed that on average for the region 1.5 units of mercury are consumed per unit of gold recovered and that 30% of the mercury is lost to the tailings and the rest lost to the atmosphere when heated later in the gold shops to produce the gold.

29
Typical amalgamation practice in the goldfields around Kareng Pangi is to use 300 grams of mercury (range: 250-400) to make an amalgam weighing 20 grams containing 10 grams of gold. Mercury recovered is 287 grams and so about 3 grams or 30% is lost to the tailings while the remainder is contained in the amalgam. The amalgam produced here was typically 50% Hg by weight. The mercury lost to the tailings is lost in the form of flowered mercury (microspherules) and is lost due to adsorption to mineral surfaces, particularly to oxides like limonite. To confirm this finding, free mercury in tailings was observed in a tailings reprocessing operation, and adsorbed mercury was measured in the laboratory at University of Victoria. Based on these observations, Table 4-4 presents an Hg-consumption per year and since the inception of ASM in the Kareng Pangi region. This is subdivided into the amount of mercury lost to tailings and consumed in the formation of amalgam. Until the year 2007 when the GMP project introduced fume hoods and retorts to the area, it can be assumed that all Mercury consumed in the formation of the amalgam was subsequently lost to the atmosphere when heated. [Since the introduction of fume hoods, Agrawal (2007) now estimates that more than 75% of the mercury formerly emitted from gold shops is now captured and recycled. – excellent progress!]. Therefore, since 1989, ASM has emitted to the atmosphere in the Kareng Pangi region 30 tonnes of Mercury – most directly into the middle of the town of Kareng Pangi – and at least 13 tonnes has been lost to tailings. The fate of the releases to the atmosphere and to tailings is poorly known. The distance that air-emissions travel is not known, it may be local or it may be regional or through deposition and re-emission, it may be global. Mercury lost to tailings is likely to have multiple fates. It can be washed into rivers and through biogeochemical processes, become methylated and enter the food chain; it can be exported along with heavy mineral concentrates (zircon) recovered from re-worked tailings and ultimately emitted to the atmosphere when heated in industrial processes (mainly ceramics or abrasives); in some settings, it can become sequestered for long times in tailings ponds that become buried. Evidence from the USGS and recent work by Susan Winch has shown that Mercury from the North American gold rushes 100 years ago continues to contaminate waterways to this day. Table 4-4 Mercury consumed in the Kareng Pangi region per year, based on field observations, interviews with miners/gold shop owners, direct measurements of loss with a precise balance, laboratory measurements of residual mercury in tailings, and on interpolation from a time series of Landsat imagery used to reconstruct historical trends.
Period # units
Hg consumed (t/yr)
Hg-in-amalgam (t/yr)
Hg-in-tailings (t/yr)
# years
Hg-consumed for Period (t)
2007 500 2.4 1.7 0.7 1 2.4 2005-2006 500 2.4 1.7 0.7 2 4.9 2003-2004 700 3.4 2.4 1.0 2 6.8 1998-2002 800 3.9 2.7 1.2 5 19.5 1995-1997 400 2.0 1.4 0.6 3 5.9 1993-1996 200 1.0 0.7 0.3 2 2.0 1988-1992 100 0.5 0.3 0.1 5 2.4 TOTAL* 43.9 30.7 13.2 43.9 * note about totals row: period (# years) must be considered
30
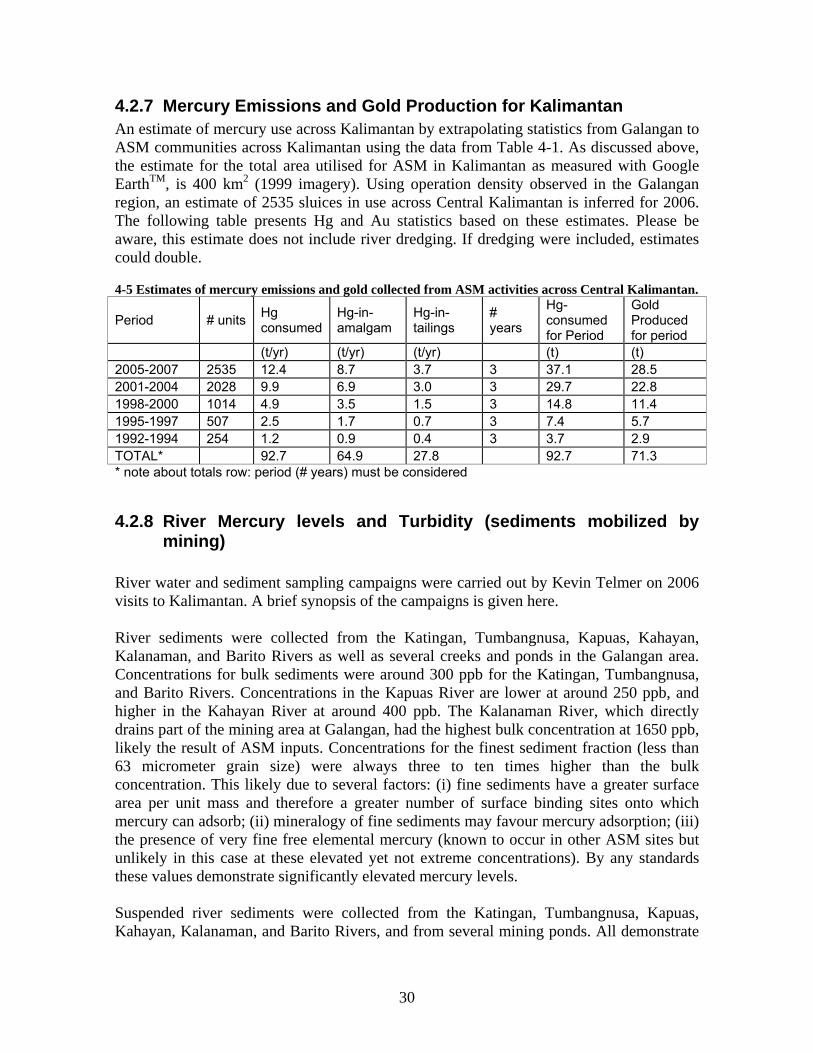
4.2.7 Mercury Emissions and Gold Production for Kalimantan An estimate of mercury use across Kalimantan by extrapolating statistics from Galangan to ASM communities across Kalimantan using the data from Table 4-1. As discussed above, the estimate for the total area utilised for ASM in Kalimantan as measured with Google EarthTM, is 400 km2 (1999 imagery). Using operation density observed in the Galangan region, an estimate of 2535 sluices in use across Central Kalimantan is inferred for 2006. The following table presents Hg and Au statistics based on these estimates. Please be aware, this estimate does not include river dredging. If dredging were included, estimates could double. 4-5 Estimates of mercury emissions and gold collected from ASM activities across Central Kalimantan.
Period # units Hg consumed
Hg-in-amalgam
Hg-in-tailings
# years
Hg-consumed for Period
Gold Produced for period
(t/yr) (t/yr) (t/yr) (t) (t) 2005-2007 2535 12.4 8.7 3.7 3 37.1 28.5 2001-2004 2028 9.9 6.9 3.0 3 29.7 22.8 1998-2000 1014 4.9 3.5 1.5 3 14.8 11.4 1995-1997 507 2.5 1.7 0.7 3 7.4 5.7 1992-1994 254 1.2 0.9 0.4 3 3.7 2.9 TOTAL* 92.7 64.9 27.8 92.7 71.3 * note about totals row: period (# years) must be considered
4.2.8 River Mercury levels and Turbidity (sediments mobilized by mining)
River water and sediment sampling campaigns were carried out by Kevin Telmer on 2006 visits to Kalimantan. A brief synopsis of the campaigns is given here. River sediments were collected from the Katingan, Tumbangnusa, Kapuas, Kahayan, Kalanaman, and Barito Rivers as well as several creeks and ponds in the Galangan area. Concentrations for bulk sediments were around 300 ppb for the Katingan, Tumbangnusa, and Barito Rivers. Concentrations in the Kapuas River are lower at around 250 ppb, and higher in the Kahayan River at around 400 ppb. The Kalanaman River, which directly drains part of the mining area at Galangan, had the highest bulk concentration at 1650 ppb, likely the result of ASM inputs. Concentrations for the finest sediment fraction (less than 63 micrometer grain size) were always three to ten times higher than the bulk concentration. This likely due to several factors: (i) fine sediments have a greater surface area per unit mass and therefore a greater number of surface binding sites onto which mercury can adsorb; (ii) mineralogy of fine sediments may favour mercury adsorption; (iii) the presence of very fine free elemental mercury (known to occur in other ASM sites but unlikely in this case at these elevated yet not extreme concentrations). By any standards these values demonstrate significantly elevated mercury levels. Suspended river sediments were collected from the Katingan, Tumbangnusa, Kapuas, Kahayan, Kalanaman, and Barito Rivers, and from several mining ponds. All demonstrate
31
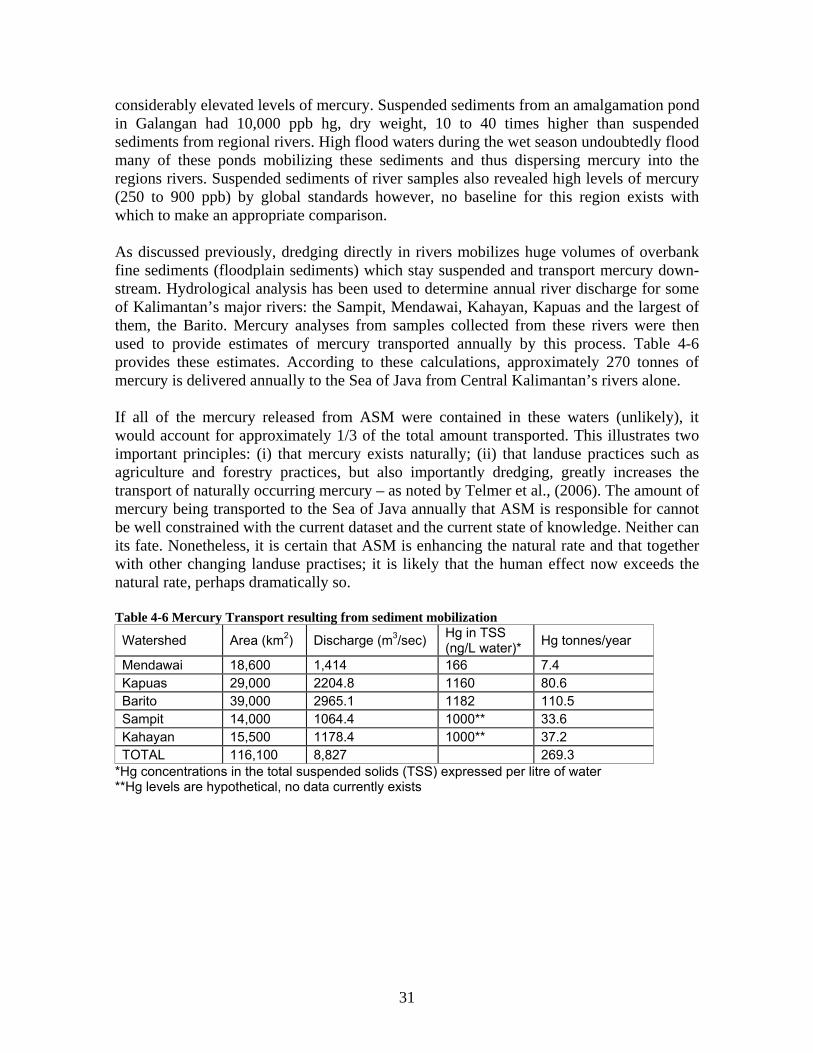
considerably elevated levels of mercury. Suspended sediments from an amalgamation pond in Galangan had 10,000 ppb hg, dry weight, 10 to 40 times higher than suspended sediments from regional rivers. High flood waters during the wet season undoubtedly flood many of these ponds mobilizing these sediments and thus dispersing mercury into the regions rivers. Suspended sediments of river samples also revealed high levels of mercury (250 to 900 ppb) by global standards however, no baseline for this region exists with which to make an appropriate comparison. As discussed previously, dredging directly in rivers mobilizes huge volumes of overbank fine sediments (floodplain sediments) which stay suspended and transport mercury down-stream. Hydrological analysis has been used to determine annual river discharge for some of Kalimantan’s major rivers: the Sampit, Mendawai, Kahayan, Kapuas and the largest of them, the Barito. Mercury analyses from samples collected from these rivers were then used to provide estimates of mercury transported annually by this process. Table 4-6 provides these estimates. According to these calculations, approximately 270 tonnes of mercury is delivered annually to the Sea of Java from Central Kalimantan’s rivers alone. If all of the mercury released from ASM were contained in these waters (unlikely), it would account for approximately 1/3 of the total amount transported. This illustrates two important principles: (i) that mercury exists naturally; (ii) that landuse practices such as agriculture and forestry practices, but also importantly dredging, greatly increases the transport of naturally occurring mercury – as noted by Telmer et al., (2006). The amount of mercury being transported to the Sea of Java annually that ASM is responsible for cannot be well constrained with the current dataset and the current state of knowledge. Neither can its fate. Nonetheless, it is certain that ASM is enhancing the natural rate and that together with other changing landuse practises; it is likely that the human effect now exceeds the natural rate, perhaps dramatically so. Table 4-6 Mercury Transport resulting from sediment mobilization
Watershed Area (km2) Discharge (m3/sec) Hg in TSS (ng/L water)* Hg tonnes/year
Mendawai 18,600 1,414 166 7.4 Kapuas 29,000 2204.8 1160 80.6 Barito 39,000 2965.1 1182 110.5 Sampit 14,000 1064.4 1000** 33.6 Kahayan 15,500 1178.4 1000** 37.2 TOTAL 116,100 8,827 269.3
*Hg concentrations in the total suspended solids (TSS) expressed per litre of water **Hg levels are hypothetical, no data currently exists

32
4.3 Monitoring ASM Using Remote Sensing
4.3.1 RADAR The use of Radar for monitoring ASM shows promising results. Radar has the benefit of being able to retrieve ground data through cloud-cover, one of the largest limitations of composite imagery. SAR scenes collected by the Japanese ALOS platform’s PALSAR sensor were collected for the Galangan region in 2006 at 12.5m spatial resolution. This was done as part of the K&C initiative (http://www.eorc.jaxa.jp/ALOS/kyoto/ kyoto_index.htm), a science program funded by JAXA (Japanese Aeronautics Exploration Agency). Data of this type can be used to generate backscatter maps (see Figure 4-9). Because PALSAR is an L-band Radar (1270 MHz, longer than typical RADAR), the pulses pass through most vegetation and are thus ideally suited for providing topographic data and for seeing the land surface. RADAR Interferometry is a method of change detection that uses multiple radar images taken of the same area at different times. There are two general approaches used: InSAR typically uses RADAR images taken right after each other to increase the information in a scene or develop DEM data. A second technique, Repeat Pass Interferometry, also uses RADAR scenes taken over the same area but on a different passes of the satellite. Using geometrically corrected repeat-pass scenes taken a month or more apart, it is possible to identify changes in topography caused by ASM.
Figure 4-9 PALSAR L-band RADAR scene of Galangan, ground resolution is 12.5 meters. The lighter areas on along the east and southern edges remain forested (high stem volume increases backscatter making these areas brighter) while the dark areas (low backscatter) result from cleared land, ground and standing waters as well as ASM.
33
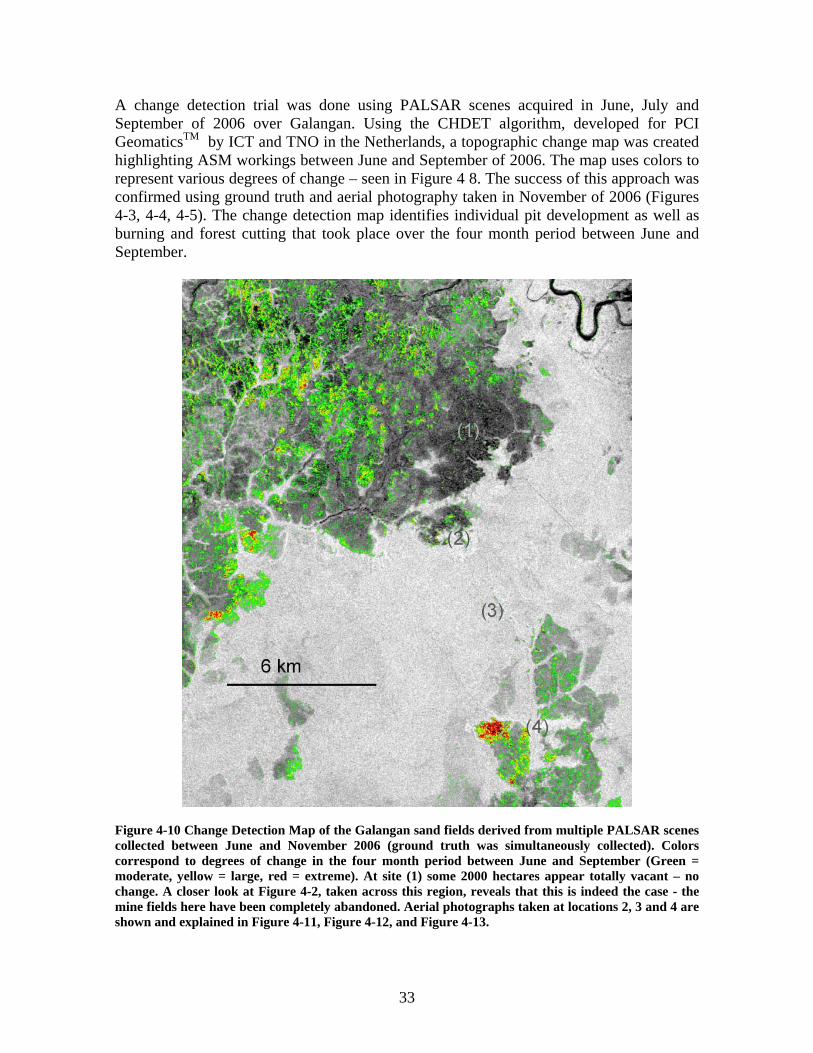
A change detection trial was done using PALSAR scenes acquired in June, July and September of 2006 over Galangan. Using the CHDET algorithm, developed for PCI GeomaticsTM by ICT and TNO in the Netherlands, a topographic change map was created highlighting ASM workings between June and September of 2006. The map uses colors to represent various degrees of change – seen in Figure 4 8. The success of this approach was confirmed using ground truth and aerial photography taken in November of 2006 (Figures 4-3, 4-4, 4-5). The change detection map identifies individual pit development as well as burning and forest cutting that took place over the four month period between June and September.
Figure 4-10 Change Detection Map of the Galangan sand fields derived from multiple PALSAR scenes collected between June and November 2006 (ground truth was simultaneously collected). Colors correspond to degrees of change in the four month period between June and September (Green = moderate, yellow = large, red = extreme). At site (1) some 2000 hectares appear totally vacant – no change. A closer look at Figure 4-2, taken across this region, reveals that this is indeed the case - the mine fields here have been completely abandoned. Aerial photographs taken at locations 2, 3 and 4 are shown and explained in Figure 4-11, Figure 4-12, and Figure 4-13.
34
Figure 4-11 At site (4) a new remote ASM community is being built in the jungle.
Figure 4-12 At site (3) the change detection method detected burning, the precursor to mining – seen along the left edge of this photograph.
Figure 4-13 Active pit operations (where heavy machinery is being used to dig pits) operate at site (2), vividly observed by the RADAR change detection algorithm.

35
Although the change maps do not differentiate causes of the change, other recent satellite data (SPOT-2, 2005) and aerial photography provides ample evidence. Swaths of high degree change are detected along forest edges along the southern borders of Galangan, where the forest is being cut. Most notably, a huge shift in ASM activity to the west of areas previously being worked is evident. Approximately 2000 hectares of exposed sands on the eastern side of the region (Galangan proper) appear to be almost totally abandoned for lands to the west (Hampalit). Information such as this can be used to quickly understand the extents and movements of ASM operations in near real time (time scales of weeks, months, or years depending on desires). During discussions with miners and goldshop owners in Galangan in 2006 there were rumours that miners were moving away from Galangan – a common occurrence in ASM. In situations where meeting miners in the field are necessary, such as the campaigns of the Global Mercury Project, the change detection capabilities of SAR can be used to quantifiably detect activities and confirm weather a given region remains in active use. The use of this approach for monitoring ASM development in regions such as Kalimantan shows promise, especially as the scale of investigation becomes wider. Figure 4-14 shows an Envisat ASAR C-band 25m resolution SAR scene taken in November 2006 purchased for this project to examine its potential usefulness for employing this approach across all of Borneo. Since C-band RADAR is affected by vegetation, secondary acquisitions (being investigated) need to be made in the same season and collected with similar viewing geometry.
Figure 4-14 November 2006 ENVISAT ASAR C-band RADAR. The southern edge of Borneo and the Sea of Java can be seen along the bottom edge of the full scene (right). Galangan is the dark area at center left of the zoomed section (left). The ground resolution of this product is 25m and acquisition cost is under 600 US dollars. A second ENVISAT scene is required to utilize the change detection algorithm.
36
5 The Brazilian Case
5.1 Background In 1983 the DNPM instated the Tapajos Garimpeira, an area over 28,000 km2 in the state of Para, making this the largest sanctioned ASM region in the world with up to 500 airstrips and more than 2,200 ASM sites (estimates from da Silva, 2002). Miner profits peaked in the 80’s and 90’s while the following techniques dominated gold mining activities in the region. (1.) The balsa: a small-scale dredge is manned by 2-3 workers; a diesel motor runs a suction system guided by a diver who vacuums sediment from the river bottom which is then pumped over a sluice lined with carpets. (2.) The draga: a large industrial scale dredge that use engines and hydraulic cranes to suck up riverbank sediments which are then pumped across swaths of tiered sluices. (3.) The barranco (Portuguese: chupadeira, par de máquina): colluvial or alluvial sediments are blasted into a slurry by high pressure hydraulic water hoses, forming pits. After this, the sediment water mix (slurry) is pumped out of the pits and over large sluices with diesel motor pumps. This type of mining necessitates land clearing and results in large deposits of sandy tailings. Pits may or may not be filled in when the pit is retired. See Figure 5-1 for aerial photography of two garimpos near Creporizao.
Figure 5-1 Aerial Photography of two garimpos (barrancos) near Creporizao; Photographs: Daniel Stapper, Tapajos River Basin, Pará, 2007. Currently the high grade alluvial gold deposits have been depleted and attention is being focused on reprocessing tailings as well as targeting colluvial and primary gold, typically associated with quartz veins. In these operations, ore is crushed in mills and then gravity concentrated and finally either amalgamated using mercury or leached using cyanide. The process of amalgamating the whole ore, using copper plates, results in much greater losses of mercury (up to 10 to 20 times higher) and so has been discouraged in recent years. In each of these methods, mercury is used to create an amalgam. Although emission factors (units of mercury emitted per units of gold collected) as high as 4:1 have been reported (Mallas and Benedicto, 1986) an extensive survey by DNPM of 800 mining sites across central Brazil (late 1990’s) resulted in an estimated average emission factor of 1.7 Hg : 1 Au. Based on an estimate for total historical gold production from the Tapajos since 1960 of 650 tons (Villas boas 2003, Da Silva 2002), total mercury emissions since the beginning
37
of the modern Amazonian gold rush would be approximately 1100 tons. Currently, ASM in the Tapajos is estimated to comprise 25-35% of total ASM in Brazil. The present study focuses on the Tapajos Garimpeira, centered on the Crepori River; it is Brazil’s largest and most concentrated ASM region. Figure 5-2 provides a watershed map of the area and situates it within Brazil. It is located in the state of Para, approximately 200km south of Itaituba, the largest city on the Tapajos and the regional gold distribution hub.
Figure 5-2 The Crepori River Basin, 200km south of Itaituba, covers 6000km2 and is Brazils most concentrated ASM region. The watershed map is created using the SRTM2 data (digital elevation model). Watershed area and river network information is used to model river discharge and mercury transport, based on field work and satellite data. The entire outlined area (beginning in grey) is the Crepori River Basin while the green, blue, red and orange borders are the Creporizinho, (upper) Crepori, Marupa, and (lower) Crepori Rivers, respectively. Statistics have been developed for each of these sub-basins.
5.2 Statistics
5.2.1 Introduction Satellite imagery spanning from 1986 through 2006 has been used to extrapolate field data and known statistics from the region. Supervised classifications of Landsat 5 TM, 7 ETM+ and CBERS-2 CCD scenes divide the landscape into nine land-cover classes. This enabled
Crepori Watershed
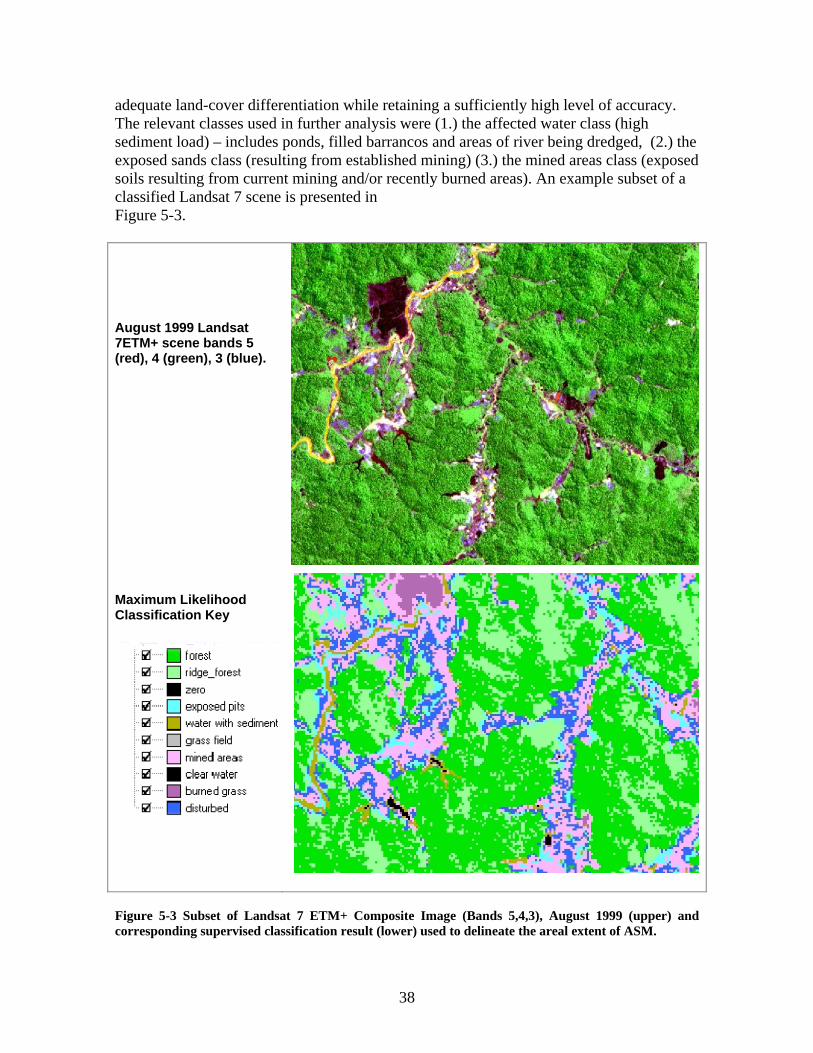
38
adequate land-cover differentiation while retaining a sufficiently high level of accuracy. The relevant classes used in further analysis were (1.) the affected water class (high sediment load) – includes ponds, filled barrancos and areas of river being dredged, (2.) the exposed sands class (resulting from established mining) (3.) the mined areas class (exposed soils resulting from current mining and/or recently burned areas). An example subset of a classified Landsat 7 scene is presented in Figure 5-3. August 1999 Landsat 7ETM+ scene bands 5 (red), 4 (green), 3 (blue).
Maximum Likelihood Classification Key
Figure 5-3 Subset of Landsat 7 ETM+ Composite Image (Bands 5,4,3), August 1999 (upper) and corresponding supervised classification result (lower) used to delineate the areal extent of ASM.
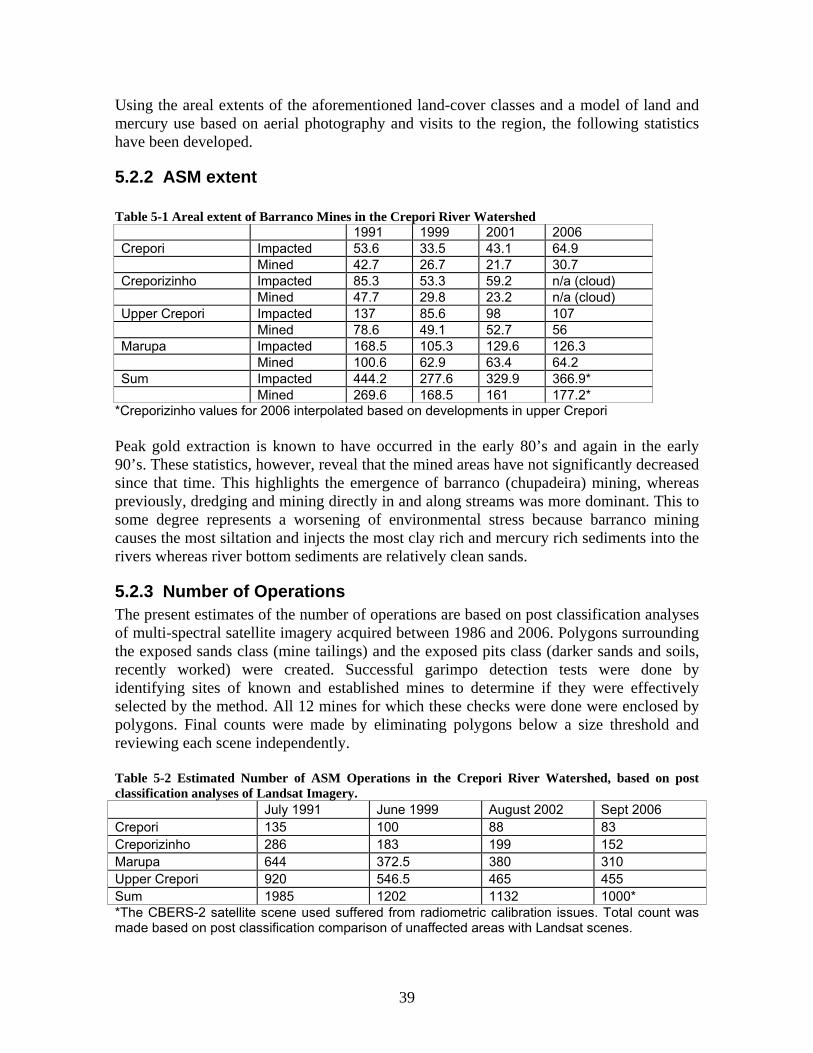
39
Using the areal extents of the aforementioned land-cover classes and a model of land and mercury use based on aerial photography and visits to the region, the following statistics have been developed.
5.2.2 ASM extent Table 5-1 Areal extent of Barranco Mines in the Crepori River Watershed 1991 1999 2001 2006 Crepori Impacted 53.6 33.5 43.1 64.9 Mined 42.7 26.7 21.7 30.7 Creporizinho Impacted 85.3 53.3 59.2 n/a (cloud) Mined 47.7 29.8 23.2 n/a (cloud) Upper Crepori Impacted 137 85.6 98 107 Mined 78.6 49.1 52.7 56 Marupa Impacted 168.5 105.3 129.6 126.3 Mined 100.6 62.9 63.4 64.2 Sum Impacted 444.2 277.6 329.9 366.9* Mined 269.6 168.5 161 177.2*
*Creporizinho values for 2006 interpolated based on developments in upper Crepori Peak gold extraction is known to have occurred in the early 80’s and again in the early 90’s. These statistics, however, reveal that the mined areas have not significantly decreased since that time. This highlights the emergence of barranco (chupadeira) mining, whereas previously, dredging and mining directly in and along streams was more dominant. This to some degree represents a worsening of environmental stress because barranco mining causes the most siltation and injects the most clay rich and mercury rich sediments into the rivers whereas river bottom sediments are relatively clean sands.
5.2.3 Number of Operations The present estimates of the number of operations are based on post classification analyses of multi-spectral satellite imagery acquired between 1986 and 2006. Polygons surrounding the exposed sands class (mine tailings) and the exposed pits class (darker sands and soils, recently worked) were created. Successful garimpo detection tests were done by identifying sites of known and established mines to determine if they were effectively selected by the method. All 12 mines for which these checks were done were enclosed by polygons. Final counts were made by eliminating polygons below a size threshold and reviewing each scene independently. Table 5-2 Estimated Number of ASM Operations in the Crepori River Watershed, based on post classification analyses of Landsat Imagery. July 1991 June 1999 August 2002 Sept 2006 Crepori 135 100 88 83 Creporizinho 286 183 199 152 Marupa 644 372.5 380 310 Upper Crepori 920 546.5 465 455 Sum 1985 1202 1132 1000* *The CBERS-2 satellite scene used suffered from radiometric calibration issues. Total count was made based on post classification comparison of unaffected areas with Landsat scenes.
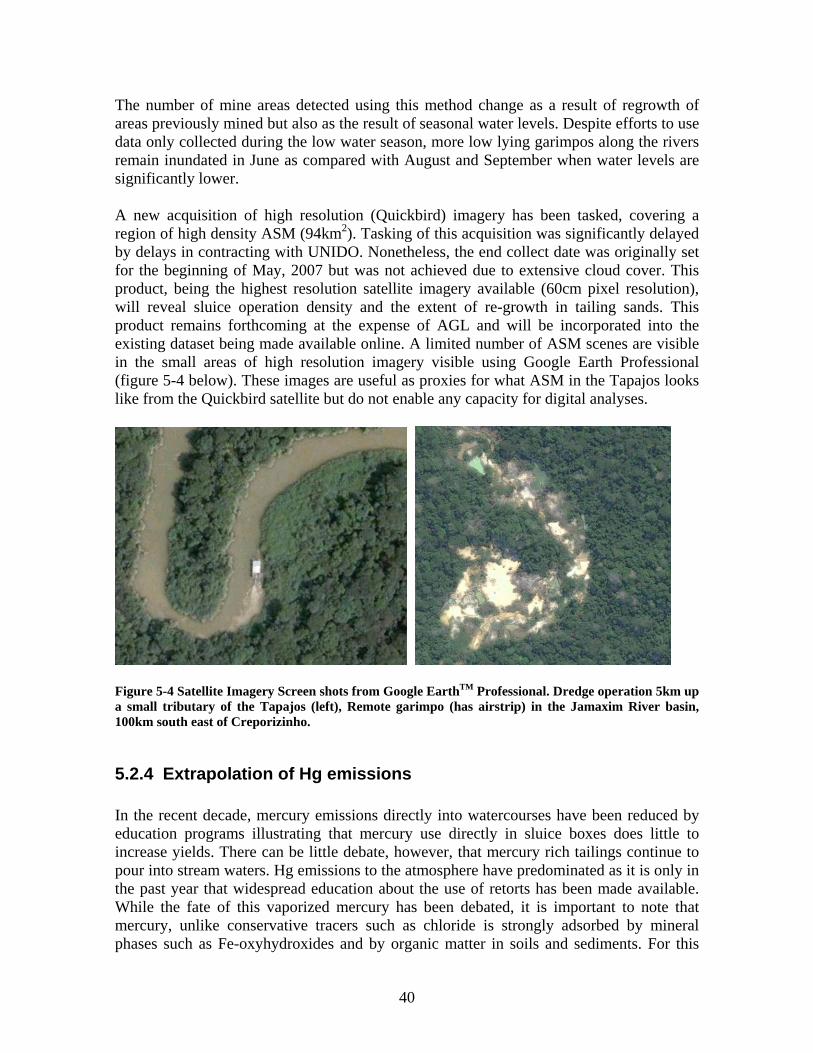
40
The number of mine areas detected using this method change as a result of regrowth of areas previously mined but also as the result of seasonal water levels. Despite efforts to use data only collected during the low water season, more low lying garimpos along the rivers remain inundated in June as compared with August and September when water levels are significantly lower. A new acquisition of high resolution (Quickbird) imagery has been tasked, covering a region of high density ASM (94km2). Tasking of this acquisition was significantly delayed by delays in contracting with UNIDO. Nonetheless, the end collect date was originally set for the beginning of May, 2007 but was not achieved due to extensive cloud cover. This product, being the highest resolution satellite imagery available (60cm pixel resolution), will reveal sluice operation density and the extent of re-growth in tailing sands. This product remains forthcoming at the expense of AGL and will be incorporated into the existing dataset being made available online. A limited number of ASM scenes are visible in the small areas of high resolution imagery visible using Google Earth Professional (figure 5-4 below). These images are useful as proxies for what ASM in the Tapajos looks like from the Quickbird satellite but do not enable any capacity for digital analyses.
Figure 5-4 Satellite Imagery Screen shots from Google EarthTM Professional. Dredge operation 5km up a small tributary of the Tapajos (left), Remote garimpo (has airstrip) in the Jamaxim River basin, 100km south east of Creporizinho.
5.2.4 Extrapolation of Hg emissions In the recent decade, mercury emissions directly into watercourses have been reduced by education programs illustrating that mercury use directly in sluice boxes does little to increase yields. There can be little debate, however, that mercury rich tailings continue to pour into stream waters. Hg emissions to the atmosphere have predominated as it is only in the past year that widespread education about the use of retorts has been made available. While the fate of this vaporized mercury has been debated, it is important to note that mercury, unlike conservative tracers such as chloride is strongly adsorbed by mineral phases such as Fe-oxyhydroxides and by organic matter in soils and sediments. For this
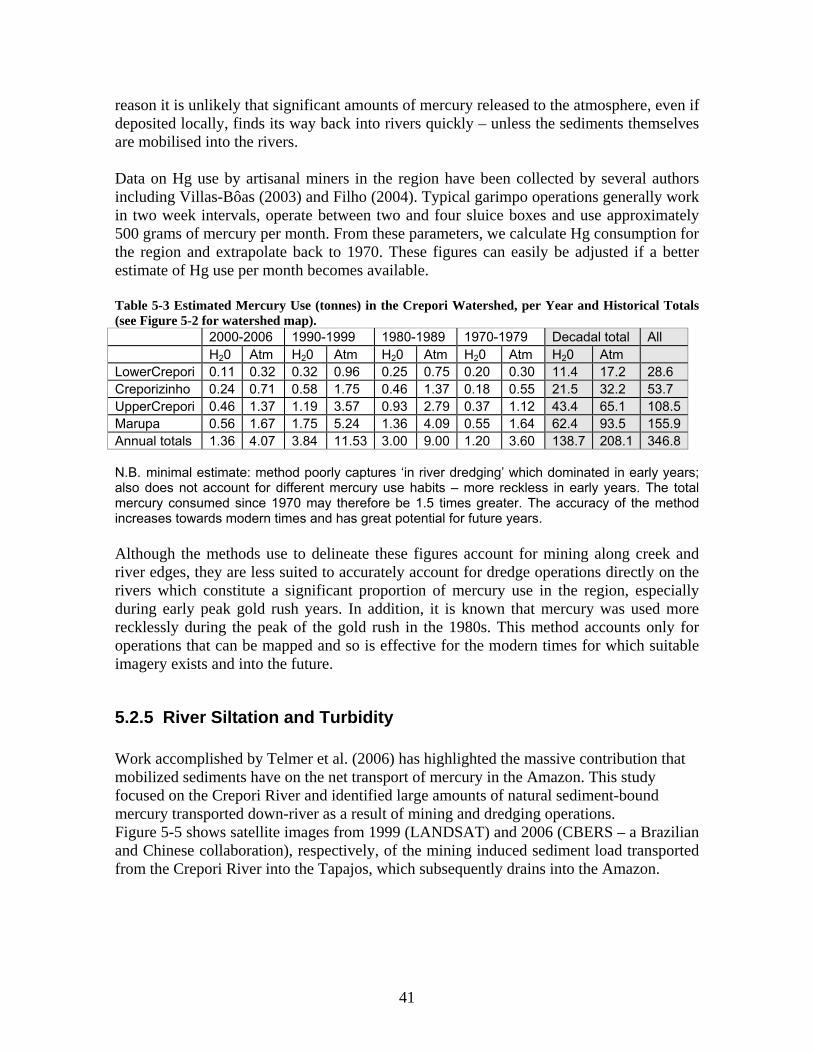
41
reason it is unlikely that significant amounts of mercury released to the atmosphere, even if deposited locally, finds its way back into rivers quickly – unless the sediments themselves are mobilised into the rivers. Data on Hg use by artisanal miners in the region have been collected by several authors including Villas-Bôas (2003) and Filho (2004). Typical garimpo operations generally work in two week intervals, operate between two and four sluice boxes and use approximately 500 grams of mercury per month. From these parameters, we calculate Hg consumption for the region and extrapolate back to 1970. These figures can easily be adjusted if a better estimate of Hg use per month becomes available. Table 5-3 Estimated Mercury Use (tonnes) in the Crepori Watershed, per Year and Historical Totals (see Figure 5-2 for watershed map). 2000-2006 1990-1999 1980-1989 1970-1979 Decadal total All H20 Atm H20 Atm H20 Atm H20 Atm H20 Atm LowerCrepori 0.11 0.32 0.32 0.96 0.25 0.75 0.20 0.30 11.4 17.2 28.6 Creporizinho 0.24 0.71 0.58 1.75 0.46 1.37 0.18 0.55 21.5 32.2 53.7 UpperCrepori 0.46 1.37 1.19 3.57 0.93 2.79 0.37 1.12 43.4 65.1 108.5Marupa 0.56 1.67 1.75 5.24 1.36 4.09 0.55 1.64 62.4 93.5 155.9Annual totals 1.36 4.07 3.84 11.53 3.00 9.00 1.20 3.60 138.7 208.1 346.8 N.B. minimal estimate: method poorly captures ‘in river dredging’ which dominated in early years; also does not account for different mercury use habits – more reckless in early years. The total mercury consumed since 1970 may therefore be 1.5 times greater. The accuracy of the method increases towards modern times and has great potential for future years. Although the methods use to delineate these figures account for mining along creek and river edges, they are less suited to accurately account for dredge operations directly on the rivers which constitute a significant proportion of mercury use in the region, especially during early peak gold rush years. In addition, it is known that mercury was used more recklessly during the peak of the gold rush in the 1980s. This method accounts only for operations that can be mapped and so is effective for the modern times for which suitable imagery exists and into the future.
5.2.5 River Siltation and Turbidity Work accomplished by Telmer et al. (2006) has highlighted the massive contribution that mobilized sediments have on the net transport of mercury in the Amazon. This study focused on the Crepori River and identified large amounts of natural sediment-bound mercury transported down-river as a result of mining and dredging operations. Figure 5-5 shows satellite images from 1999 (LANDSAT) and 2006 (CBERS – a Brazilian and Chinese collaboration), respectively, of the mining induced sediment load transported from the Crepori River into the Tapajos, which subsequently drains into the Amazon.
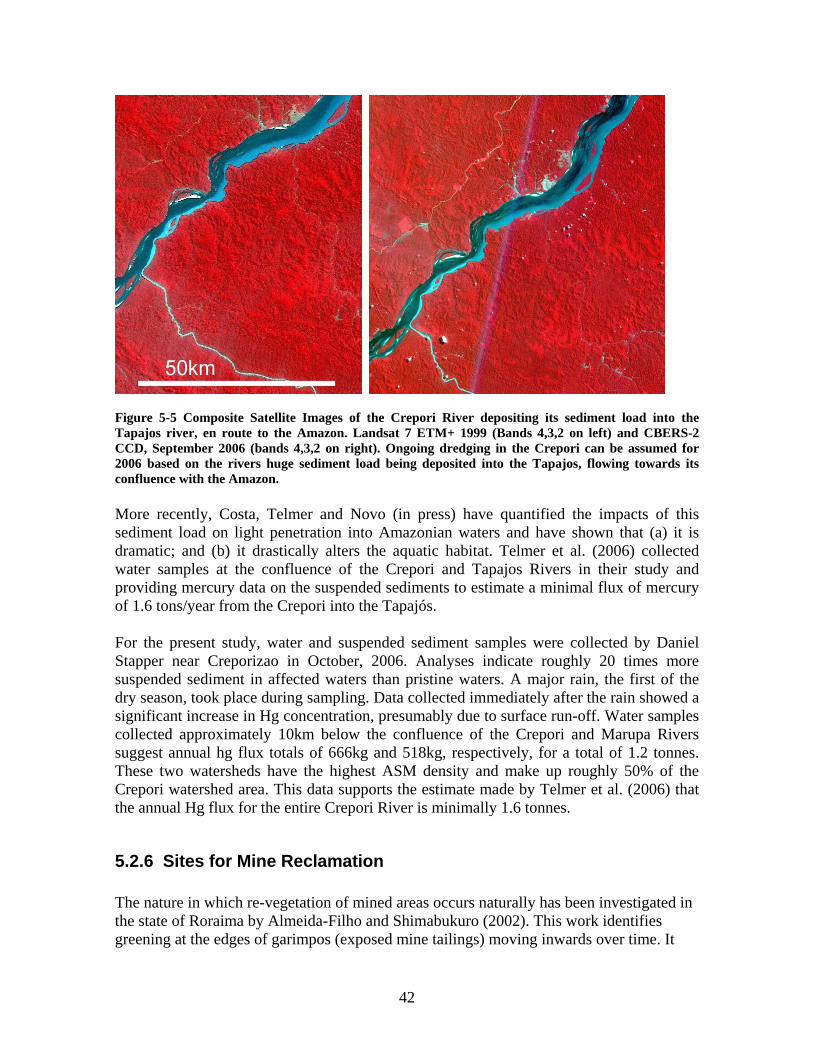
42
Figure 5-5 Composite Satellite Images of the Crepori River depositing its sediment load into the Tapajos river, en route to the Amazon. Landsat 7 ETM+ 1999 (Bands 4,3,2 on left) and CBERS-2 CCD, September 2006 (bands 4,3,2 on right). Ongoing dredging in the Crepori can be assumed for 2006 based on the rivers huge sediment load being deposited into the Tapajos, flowing towards its confluence with the Amazon. More recently, Costa, Telmer and Novo (in press) have quantified the impacts of this sediment load on light penetration into Amazonian waters and have shown that (a) it is dramatic; and (b) it drastically alters the aquatic habitat. Telmer et al. (2006) collected water samples at the confluence of the Crepori and Tapajos Rivers in their study and providing mercury data on the suspended sediments to estimate a minimal flux of mercury of 1.6 tons/year from the Crepori into the Tapajós. For the present study, water and suspended sediment samples were collected by Daniel Stapper near Creporizao in October, 2006. Analyses indicate roughly 20 times more suspended sediment in affected waters than pristine waters. A major rain, the first of the dry season, took place during sampling. Data collected immediately after the rain showed a significant increase in Hg concentration, presumably due to surface run-off. Water samples collected approximately 10km below the confluence of the Crepori and Marupa Rivers suggest annual hg flux totals of 666kg and 518kg, respectively, for a total of 1.2 tonnes. These two watersheds have the highest ASM density and make up roughly 50% of the Crepori watershed area. This data supports the estimate made by Telmer et al. (2006) that the annual Hg flux for the entire Crepori River is minimally 1.6 tonnes.
5.2.6 Sites for Mine Reclamation The nature in which re-vegetation of mined areas occurs naturally has been investigated in the state of Roraima by Almeida-Filho and Shimabukuro (2002). This work identifies greening at the edges of garimpos (exposed mine tailings) moving inwards over time. It

43
notes the prominent effect that ‘distance from the edge’ plays in determining time required for re-establishment of vegetation to mined areas. In consideration of this understanding, a principle physical criterion that can be used to identify prospective reforestation sites is simply garimpo size and ASM density. Large areas are more in need of replantation than small ones which can more quickly recover with little assistance. Local areas of high density ASM, presumably lying across several property titles, were therefore identified and are listed by lat/long coordinates in Table 5-4, below. Figure 5-6 illustrates these high density ASM locations. Table 5-4 Recommended sites for pursuing replantation efforts, based on physical attribute criteria
Latitude Longitude Location relative to nearest town
Extent (Ha) of local ASM Accessibility
-7.000 -56.900 25 km south of Creporizao 500 Airstrip, 5km boat ride on
Crepori River
-6.971 -56.486 20km southeast of Creporizinho 950 Road from Creporizinho
or Creporizao
-6.765 -56.733 15km northwest of Creporizinho 750 Road from Creporizinho
or Creporizao
Figure 5-6 Prospective reforestation sites are outlined in the map above. Large garimpo size, their high density and proximity to transportation (raods or airstrips) make these sites worthy of further consideration.
44
6 Database
6.1 Limitations of satellite imagery Thus far, we have made extensive use of mid-resolution satellite imagery. After atmospheric corrections are made, supervised classifications are made to delineate ground-cover types. The post-classification analyses which follows is strengthened by aerial photography and information from the field (ground truth). These images (Landsat, SPOT, CBERS-2) have the benefit of revealing ASM operations on a regional scale with a single scene because they cover much larger areas than high-resolution sensors (Landsat scenes are 185km x 170km, others are comparable). All of the RS products presented thus far were selected from archives belonging to remote sensing retailers. Even in the archives, cloud free selections are rare. For example, images from Brazil and Indonesia were not collected within their initial collection windows due to cloud cover and atmospheric conditions. This is mainly due to the collection window having been unrealistically short (largely caused by bureaucratic delays). Tasking high resolution Quickbird scenes for this application therefore requires significant lead-time and planning. This highlights the important issue of accessibility as it relates to these data types.
6.2 The digital database All of the data introduced in this report (and this report) can be seen in digital format at the AGL database, accessible from the internet at http://hgwatch.uvic.ca/database/ . A link to this database will be made available from the GMP website (www.globalmercuryproject. org). The database presents statistics developed in this project and is designed to highlight the global scale of the issues raised by ASM. The format is user-friendly, no special technical skills, other than basic web-use knowledge is necessary. To access the full potential of the database, Google EarthTM is recommended; this program can be downloaded for free using any internet connection. It enables users to scroll through database information visually utilising a GE’s geographical reference frame. This also allows the user the option of exploring ASM through the extensive bank of aerial photography and videos, covering the Galangan region (as well as Sulawesi), that can be viewed by connecting to the database. This approach is particularly informative.
45
7 Conclusions In the grandest sense the long term purpose of this project is to effectively educate stakeholders and the public about Mercury and ASM by providing reliable information to them. A good knowledge base is the required backbone to motivate actions and formulate solutions to the problems associated with mercury and ASM. The online database aims to serve and evolve this purpose – it will provide access to the public and will continue the important work of education and information sharing. More specifically, this project aimed to evaluate methods of building a needed database on ASM. One that would be accessible to stake holders and decision makers involved in trying to understand and solve the problems associated with mercury use in ASM. Although the report has not dealt much with the socio-economic issues of ASM (only some rudimentary estimates of the size of economies), this was purposeful and in no way reflects their importance. The socio-economic issues are equally important and complex. Rather, the need for this report came from the recognition of the paucity of high quality statistics on ASM; and the recognition that governments, international bodies, industry, and miners along with their communities, can only produce effective solutions when well informed and educated – to re-iterate once again: effective decisions require reliable information and good education. In this sense, this report is about building the needed groundwork to tackle the socio-economic issues. To that end, we hope that this report contributes some new knowledge about ASM and helps to form an appropriate framework upon which to evaluate its role and problems in society. It is however, just a beginning. Further work is clearly needed.
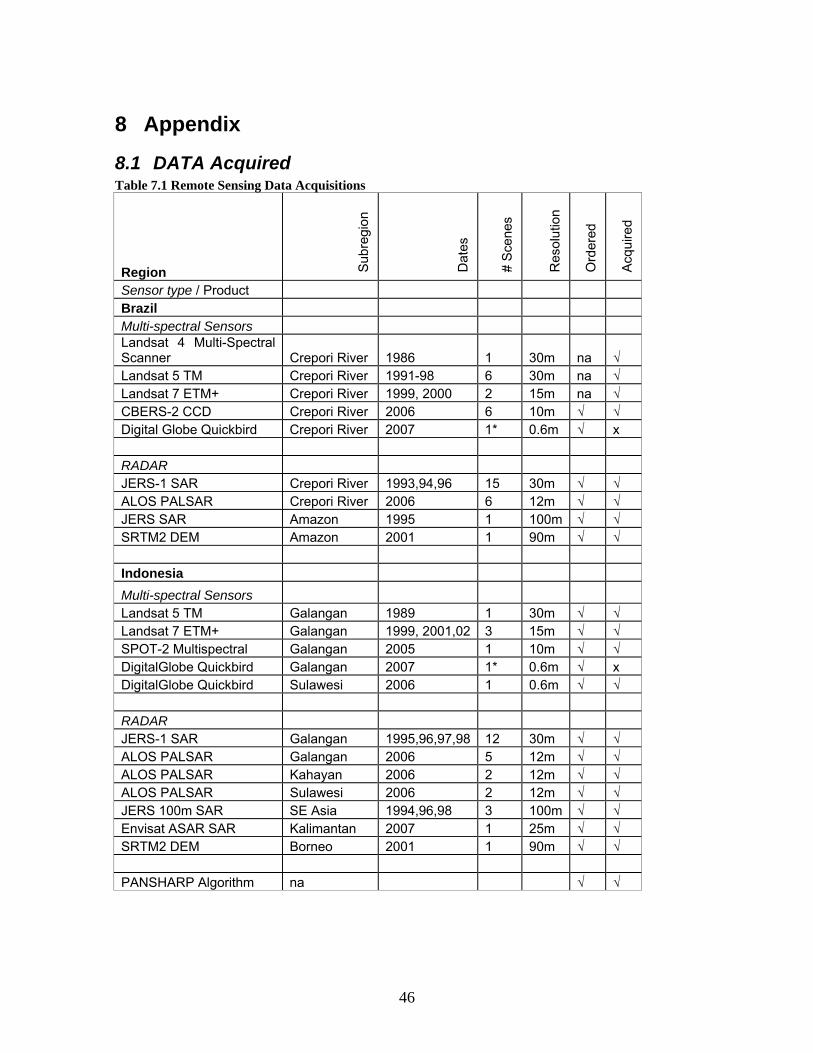
46
8 Appendix
8.1 DATA Acquired Table 7.1 Remote Sensing Data Acquisitions
Region Subr
egio
n
Dat
es
# S
cene
s
Res
olut
ion
Ord
ered
Acq
uire
d
Sensor type / Product Brazil Multi-spectral Sensors Landsat 4 Multi-Spectral Scanner Crepori River 1986 1 30m na √ Landsat 5 TM Crepori River 1991-98 6 30m na √ Landsat 7 ETM+ Crepori River 1999, 2000 2 15m na √ CBERS-2 CCD Crepori River 2006 6 10m √ √ Digital Globe Quickbird Crepori River 2007 1* 0.6m √ x RADAR JERS-1 SAR Crepori River 1993,94,96 15 30m √ √ ALOS PALSAR Crepori River 2006 6 12m √ √ JERS SAR Amazon 1995 1 100m √ √ SRTM2 DEM Amazon 2001 1 90m √ √ Indonesia Multi-spectral Sensors Landsat 5 TM Galangan 1989 1 30m √ √ Landsat 7 ETM+ Galangan 1999, 2001,02 3 15m √ √ SPOT-2 Multispectral Galangan 2005 1 10m √ √ DigitalGlobe Quickbird Galangan 2007 1* 0.6m √ x DigitalGlobe Quickbird Sulawesi 2006 1 0.6m √ √ RADAR JERS-1 SAR Galangan 1995,96,97,98 12 30m √ √ ALOS PALSAR Galangan 2006 5 12m √ √ ALOS PALSAR Kahayan 2006 2 12m √ √ ALOS PALSAR Sulawesi 2006 2 12m √ √ JERS 100m SAR SE Asia 1994,96,98 3 100m √ √ Envisat ASAR SAR Kalimantan 2007 1 25m √ √ SRTM2 DEM Borneo 2001 1 90m √ √ PANSHARP Algorithm na √ √

47
9 References Agrawal S. (2007) YTS (Yayasan Tambuhak Sinta) Final Report: Community Awareness
on Hazards of Exposure to Mercury and Supply of Equipment for Mercury-cleaner Gold Processing Technologies in Galangan, Central Kalimantan, Indonesia. UNIDO Project No. EG/GLO/01/G34; Contract No. 16001054/ML
Costa MPF, Telmer K., Novo E. (in review) Light in Amazonian waters and human effects on it. Limnology and Oceanography.
Digital processing of a Landsat-TM Time series for mapping and monitoring degraded areas caused by independent gold miners, Roraima State, Brazilian Amazon. Raimundo Almeida-Filho, Yosio E. Shimabukuro. Remote Sensing of Environment 79 (2002) 42– 50.
Environmental and Health Assessment in Two Small Scale Gold Mining Areas – Brazil Sao Chico and Creporizinho. Final Report for UNIDO. Project Leader: Saulo Rodrigues Pereira Filho, CETEM. April 2004
Fitzgerald WF, Engstrom DR, Mason RP, Nater EA. 1998. The case for atmospheric mercury contamination in remote areas. Environ Sci Technol 32:1–7.
Implementing Programs to Improve Gold Recovery and Reduce Environmental Impacts by Artisanal Gold Mining in Brazil. Rodolfo Neiva Sousa, Marcello M. Veiga. GEF/UNDP/UNIDO/Global Mercury Project. May, 2007.
Kainz M., Telmer K., Mazumder A. (2006) Bioaccumulation patterns of methyl mercury and essential fatty acids in the planktonic food web and fish. Science of the Total Environment, 368: 271 282.
Kocman D., Bloom N.S., Akagi H., Telmer K., Hylander L., Fajon V., Jereb V., Jacimovic R., Smodis B., Ikingura J.R., Horvat M. (2006) Preparation and characterization of a soil reference material from a mercury contaminated site for comparability studies. Journal of Environmental Management, 81: 146-154.
Melamed, R., Villas Boas, R.C. GonAlves, G.O. Paiva E.C. (1997) Mechanisms of physico-chemical interaction of mercury with River sediments from a gold mining region in Brazil: Relative mobility of mercury species. Journal of Geochemical Exploration 58: 119-124.
Lacerda, Pfeiffer, Marins, Rodrigues, Souza and Bastos (1991) Mercury Dispersal in Water, Sediment and Aquatic Biota of a gold mining tailing deposit drainage in Pocone, Brazil. Water, Air, and Soil Pollution 55: 283-294.
48
Telmer K. and Costa M.P.F. (2006) Utilizing SAR imagery and aquatic vegetation to map the geochemistry of soft, hard, and brackish lakes in the largest tropical wetland: the Brazilian Pantanal. Remote Sensing of the Environment. 105: 204-213.
Telmer K., Costa M.P.F., Angélica R.S., Araujo E.S., and Maurice Y. (2006) The source and fate of sediment and mercury in the Tapajós River, Pará, Brazilian Amazon: ground and space based evidence. Journal of Environmental Management, 81: 101-113.
Related Documents