Evalua&on of GEOS products with Ed4 SYN and EBAF Seiji Kato 1 , David A. Rutan 2 , Fred G. Rose 2 , Seung Hee Ham 2 , Norman G. Loeb 1 , and Michael G. Bosilovich 3 1 NASA Langley Research Center 2 Science System & ApplicaIons Inc. 3 NASA Goddard Space Flight Center CERES Science team meeIng September 2628, 2017 Goddard Space Flight Center, Greenbelt, MD

Welcome message from author
This document is posted to help you gain knowledge. Please leave a comment to let me know what you think about it! Share it to your friends and learn new things together.
Transcript

Evalua&on of GEOS products with Ed4 SYN and EBAF
Seiji Kato1, David A. Rutan2, Fred G. Rose2, Seung Hee Ham2, Norman G. Loeb1, and Michael G. Bosilovich3
1NASA Langley Research Center
2Science System & ApplicaIons Inc. 3NASA Goddard Space Flight Center
CERES Science team meeIng
September 26-‐28, 2017 Goddard Space Flight Center, Greenbelt, MD

Surface downward longwave irradiance Ed2.8 vs. Ed4.0

Outline of this talk
• Mean downward longwave irradiance bias over ocean and land • All-‐sky surface downward longwave irradiance evaluaIon with surface observaIons • Other variables (cloud fracIon and base height) affect the longwave but temperature and humidity are significant driver of surface longwave irradiances.
• Variables need to be improved • Upper tropospheric humidity • Near surface temperature and humidity over polar regions • Skin temperature over land
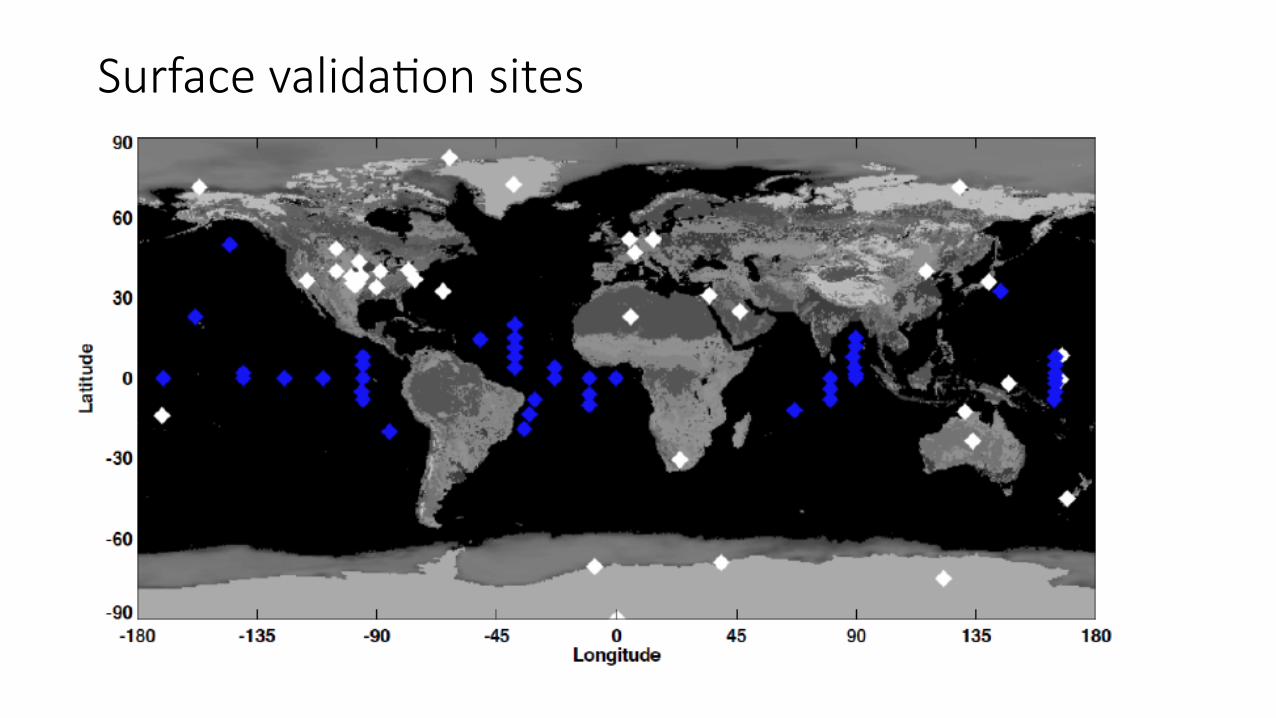
Surface valida&on sites

Monthly mean surface downward longwave irradiance comparisons (ocean)

Monthly mean surface downward longwave irradiance comparisons (Land)

Surface downward longwave irradiance bias (Ed4 SYN – Obs.)
Red: posiIve White: negaIve Blue open circle Ship data
RelaIvely large LW bias: Greenland Summit N-‐Ice2015 Subtropical ocean (MAGIC, WHOI and Kuroshio buoys)

Clear Sky Surface Downward Longwave SensiIvity Fu-‐Liou code for a wide range of temperature and water vapor condiIons.
Clear DLF is most sensiIve to lower troposphere T & Q , near surface has largest sensiIvity. Later we adopt Dilley & O’Brien parameterizaIon of Clear DLF sensiIvity which uses surface air
temperature and total precipitable water differences.
Clear-Sky OLR Sensitivity to Temperature & Water Vapor
Polar Atmosphere
-0.5 0.0 0.5 1.0 1.5 2.0dOLR/dT(1K)(solid) dOLR/dQ(12%)(dot)
(Wm-2 100hPa-1)
1000
900
800
700
600
500
400
300
200
100
Pres
sure
(hPa
) Extreme Dry (x0.1)Very Dry(x0.5)NormalMoist(x1.5)Very Moist(x2)
Clear-Sky OLR Sensitivity to Temperature & Water Vapor
Mid_Lat Atmosphere
-0.5 0.0 0.5 1.0 1.5 2.0dOLR/dT(1K)(solid) dOLR/dQ(12%)(dot)
(Wm-2 100hPa-1)
1000
900
800
700
600
500
400
300
200
100
Pres
sure
(hPa
) Extreme Dry (x0.1)Very Dry(x0.5)NormalMoist(x1.5)Very Moist(x2)
Clear-Sky DLF Sensitivity to Temperature & Water Vapor
Polar Atmosphere
0 1 2 3 4dDLF/dT(1K)(solid) dDLF/dQ(12%)(dot)
(Wm-2 100hPa-1)
1000
900
800
700
600
500
400
300
200
100
Pres
sure
(hPa
)
Extreme Dry (x0.1)Very Dry(x0.5)NormalMoist(x1.5)Very Moist(x2)
Clear-Sky DLF Sensitivity to Temperature & Water Vapor
Mid_Lat Atmosphere
0 1 2 3 4dDLF/dT(1K)(solid) dDLF/dQ(12%)(dot)
(Wm-2 100hPa-1)
1000
900
800
700
600
500
400
300
200
100
Pres
sure
(hPa
)
Extreme Dry (x0.1)Very Dry(x0.5)NormalMoist(x1.5)Very Moist(x2)
Rose 2015 spring CERES science team presentaIon

Near Surface Air Temperature (2 m) bias (GEOS-‐5.4.1 – Obs.)

Near surface (2m) Water vapor mixing ra&o rela&ve bias in % ((GEOS-‐Obs.)/Obs.)
Sites with a large longwave bias
• Greenland summit • N-‐ICE2015 (10 grid boxes) • WHOI stratus buoy • Kuroshio buoy • MAGIC • Australian Ship R/V Aurora Australis (532 grid boxes)
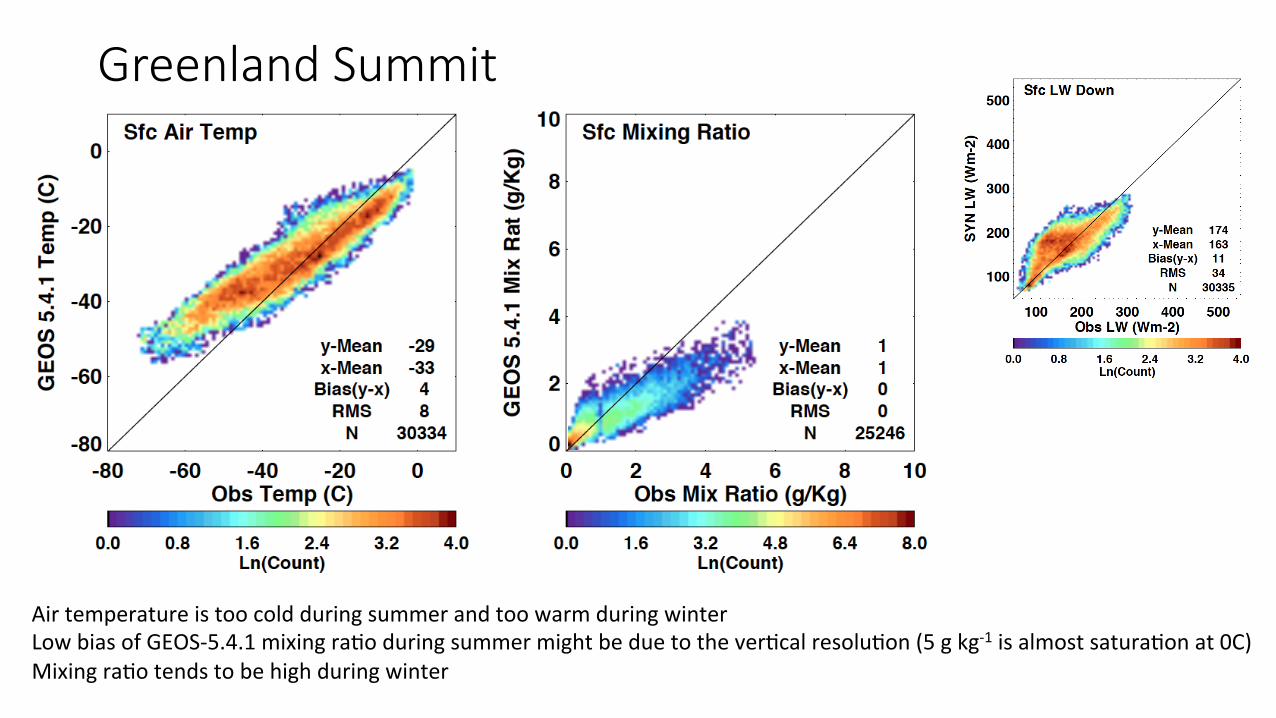
Greenland Summit
Air temperature is too cold during summer and too warm during winter Low bias of GEOS-‐5.4.1 mixing raIo during summer might be due to the verIcal resoluIon (5 g kg-‐1 is almost saturaIon at 0C) Mixing raIo tends to be high during winter

N-‐ICE2015 (Norwegian young sea ice cruise, January to June 2015)
Longwave irradiance bias is small but air temperature is biased high during winter
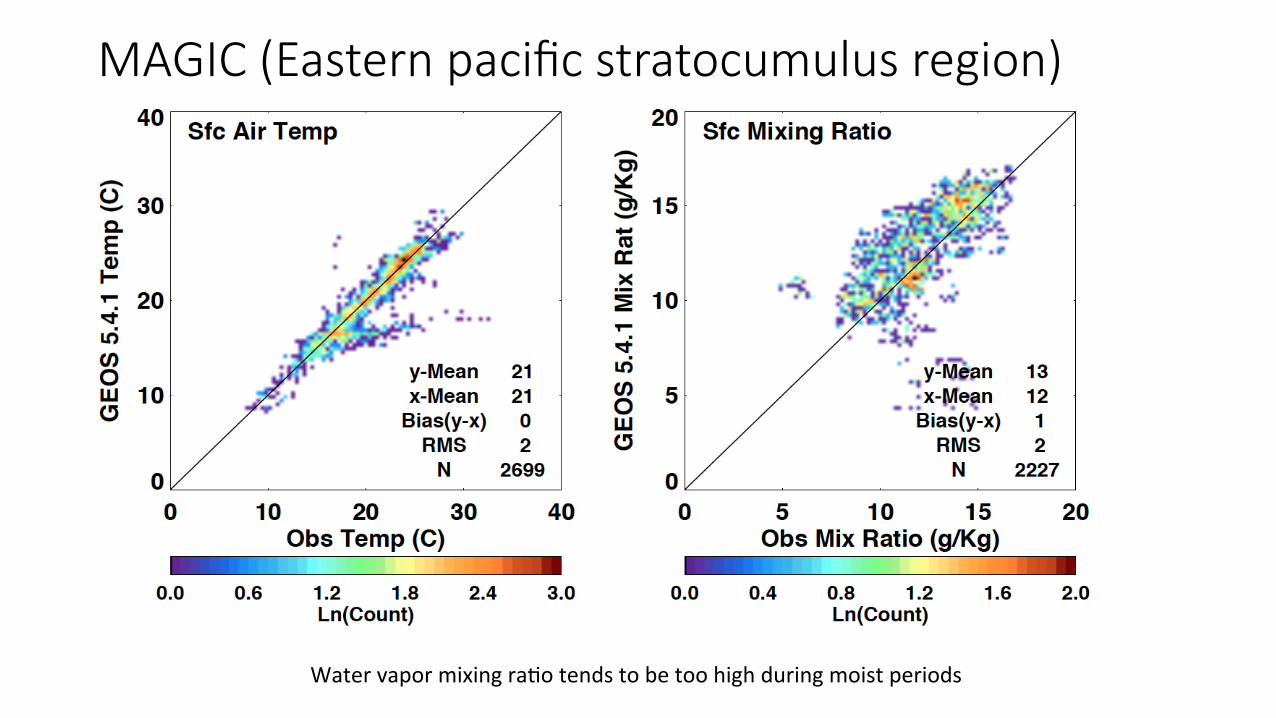
MAGIC (Eastern pacific stratocumulus region)
Water vapor mixing raIo tends to be too high during moist periods

WHOI STRATUS Buoy (south eastern pacific)
Water vapor mixing raIo is too high

NOAA STRATUS Cruises (199 grid boxes)
Humidity is too high Consistent with WHOI STRATUS Buoy

Australian Ship R/V Aurora Australis (532 grid boxes)
Temperature and mixing raIo agree well with observaIons
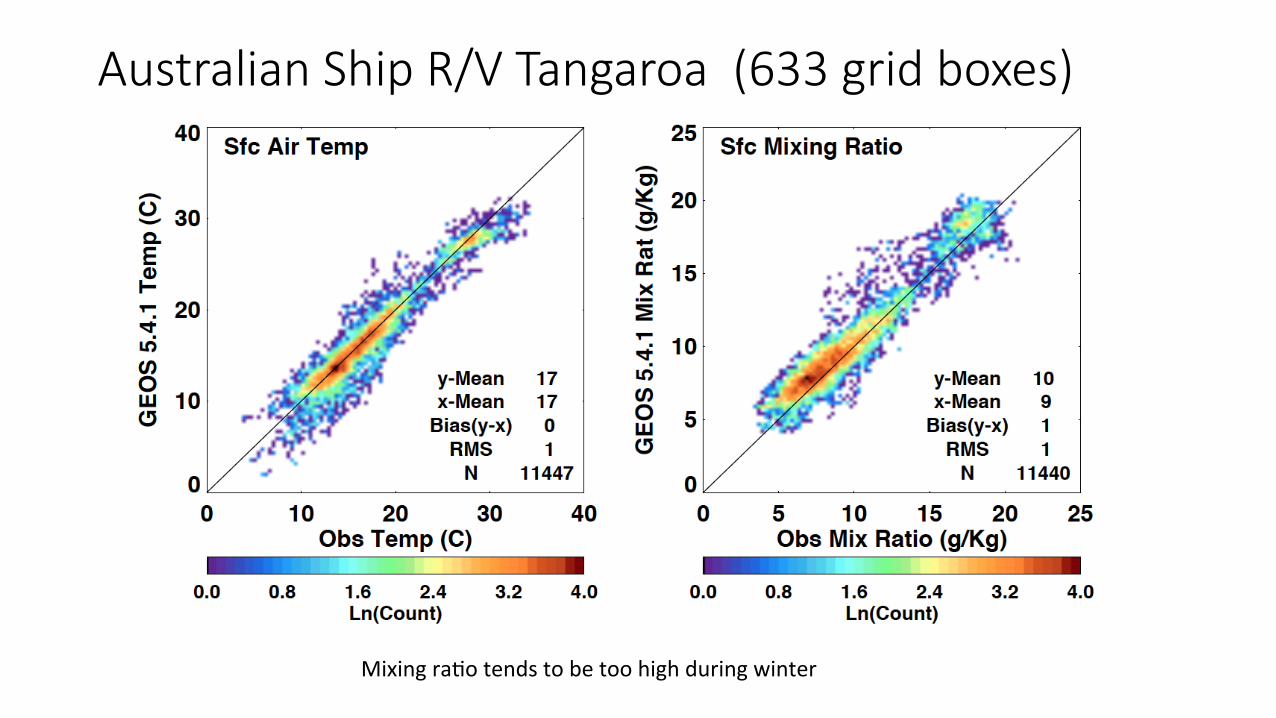
Australian Ship R/V Tangaroa (633 grid boxes)
Mixing raIo tends to be too high during winter
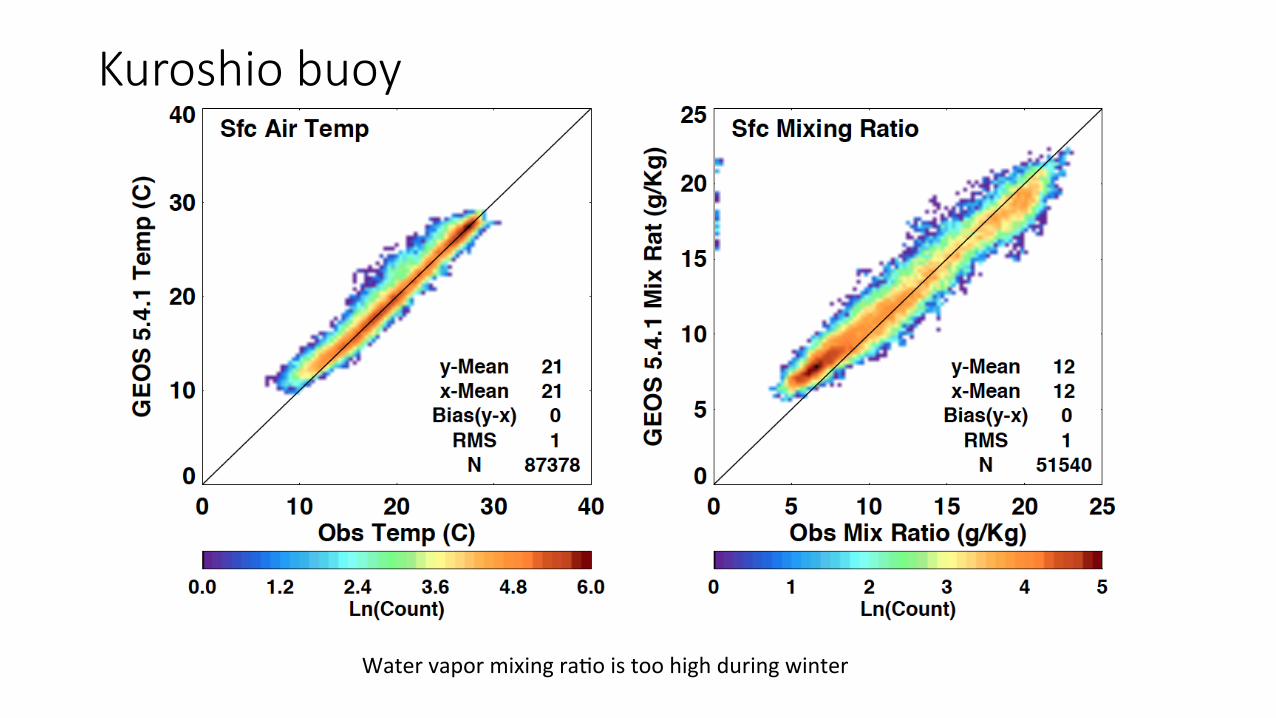
Kuroshio buoy
Water vapor mixing raIo is too high during winter

Summary of T and RH bias possibly contribu&ng LW down bias • ArcIc and Greenland summit
• Near surface temperature is too low during summer and too warm during winter. • Near surface water vapor mixing raIo is low in summer and slightly high in winter. • N-‐ICE2015 data supports temperature to be too high during winter and Near surface water vapor mixing raIo results for summer and winter.
• Subtropical Eastern pacific (MAGIC) • Near surface water vapor mixing raIo tends to be too high during moist periods (summer).
• South Eastern pacific (stratus region, WHOI STRATUS Buoy and NOAA STRATUS Cruises) • Near surface relaIve humidity tends to be too high
• North western Pacific (Kuroshio buoy) • Near surface relaIve humidity is too high during dry periods (winter)
• Summarizing the bias of mixing raIo over subtropical regions is difficult but it tends to be high (either during summer Ime or winter Ime or both).
Upper tropospheric rela&ve humidity • Comparison of MERRA2 water vapor mixing raIo and water vapor mixing raIo derived from AIRS (AIRSX3STM.006 TQ joint) • AIRSX3STM.006 TQ joint is used to correct GEOS-‐5.4.1 upper tropospheric relaIve humidity • Selected month January 2004. • MERRA2 naIve temporal and spaIal resoluIons are converted to those used as inputs to CERES products (MOA) (6 hourly T and Q profiles, 1 hourly skin T). • Select an hour box that has AIRS overpass [ascending (dayIme) and descending (nighjme) separately]. [75-‐80NS use a 2 hr window, 80-‐85NS use a 3 hr window, and 85-‐90NS include all hours].

H2O mixing ra&o, Day&me
-‐ MERRA upper atmosphere is much more moist compared to AIRS and GEOS-‐5.4.1 -‐ 30% mixing raIo bias in a 200 hPa to 300 hPa layer causes about 1 Wm-‐2 OLR bias

H2O mixing ra&o, nighcme

How to improve CERES GEOS from the CERES perspec&ve • CollaboraIng with GMAO to improve reanalysis product to be used in the future CERES data producIon. • Once a month telecon led by Mike Bosilovich and Norman Loeb
• EvaluaIng variables (temperature and humidity) from FP • A bener version of FP will become next reanalysis for CERES
• Developing an algorithm to correct monthly gridded mean temperature and humidity • CorrecIon based on observed and computed spectral radiance differences

Back-‐ups

Near Surface Rela&ve humidity (2 m) bias (GEOS-‐5.4.1 – Obs.)

Observa&on sites • NPL: 71.3 203.4 N Slope AL (NSA), Tiksi Rus (TIK), Alert Canada (ALE) • SPL: -‐85.0 0.0 Syowa (SYO), Georg v Neuymeyer (GVN), S. Pole (SPO), Dome C (DOM)
• RAM: 10.0 65.0 RAMA Array Buoys in Indian ocean -‐ 10 buoys
• TAO: 0.0 200.0 TAO Array Buoys Pacific Ocean -‐ 17 buoys
• PIR: 10.0 335.0 PIRATA Array AtlanIc Ocean -‐ 14 buoys
• SMT: 72.6 321.6 ETH Greenland Summit (SMT) (Single site)
• ABS: -‐46.7 142.0 ABOS buoy (S of Australia) (ABS) (Single Site)
• NTS: 14.5 309.0 WHOI N Tropical AtlanIc Buoy (NTS) (Single site)
• STR: -‐20.0 274.5 WHOI STRATUS Buoy, SE Pacific Ocean (STR) (Single site)
• HTS: 22.8 202.1 WHOI Hawaii Time Series Buoy, (HTS) (Single site)
• PPA: 32.4 144.6 PAPA Buoy (PPA) (Single site)
• KEO: 50.1 215.2 Kuroshio Current Buoy (KEO) (Single site)
• CUS: 42.0 260.0 ConInental USA: SURFRAD(FPK, BON, GCR, PSU, SXF) ARM-‐SGP (BEF) -‐ 6 Sites • DES: 20.0 13.0 Desert Sites: Desert Rock, (DRA) Sede Boqer IS (SBO), Tamanrraset Alg (TAM), Alice Springs, AU (ASP) -‐ 4 Sites
• JPN: 36.1 140.1 Japanese Met Sites: Tateno (TAT), Ishigakijima (ISH), Minamitorishima (MNM), Fukuoka (FUA), Sapporo (SAP) -‐ 5 Sites
• MAGC: 29.0 224.0 ARM MAGIC Cruises ( 84 grid boxes)
• EPIC: 0.5 258.0 NOAA EPIC Cruises (355 grid boxes)
• STRT: -‐14.0 279.0 NOAA STRATUS Cruises (199 grid boxes)
• VNAA: -‐28.0 90.0 Australian Ship R/V Aurora Australis (532 grid boxes)
• ZMFR: -‐45.0 110.0 Australian Ship R/V Tangaroa (633 grid boxes)
• VLHJ: -‐26.0 175.0 Australian Ship R/V Southern Surveyor (794 grid boxes)
• NICE: 78.0 20.0 N-‐ICE2015 (10 grid boxes)
• NPEO: 81.0 350.0 NPEO Driring Ice buoys (mulIple years/grid boxes) (Used 2002, 2003, 2004, 2007, 2008)
Related Documents