A FINAL PROJECT REPORT ON “EVA AS A FINANCIAL PERFORMANCE MEASUREMENT TOOL IN CASE OF SMALL MEDIUM SCALE ENTERPRISES ” In partial fulfillment of the requirement for the degree Of Master of Business Administration Specialization- Finance Submitted By: Gourav Sharma 94512236916 1

Welcome message from author
This document is posted to help you gain knowledge. Please leave a comment to let me know what you think about it! Share it to your friends and learn new things together.
Transcript
A
FINAL PROJECT REPORT
ON
“EVA AS A FINANCIAL PERFORMANCE MEASUREMENT TOOL IN CASE OF SMALL
MEDIUM SCALE ENTERPRISES”
In partial fulfillment of the requirement for the degree
Of
Master of Business Administration
Specialization- Finance
Submitted By:
Gourav Sharma
94512236916
Submitted To:
Dr. Navjot Kaur
(2009-2011)
1
ACKNOWLEDGEMENT
I am extremely thankful to Dr. NAVJOT KAUR, Faculty Guide,
GIAN JYOTI INSTITUTE OF MANAGEMENT AND TECHNOLOGY,
for her timely guidance and support throughout the Final Report work. In the
course of carrying out the Project work she help me out to understand the
various terms and working of economic value added as performance
measurement tool for small & medium scale enterprises.
Finally I am indebted to our other faculty members, my friends who
gave their full-fledged co-operation for successful completion of my project.
It was an indeed a learning experience for me.
Name of the Student: Gourav Sharma
Enrollment No.: 94512236916
2
Introduction
3

1.1 Introduction
EVA is a value based financial performance measure, an investment decision tool and a
performance measure reflecting the absolute amount of shareholder value created. It is
computed as the product of the “excess return” made on an investment or investments
and the capital invested in that investment or investments. EVA is the net operating
profit minus an appropriate charge for the opportunity cost of all capital invested in an
enterprise or project. It is an estimate of true economic profit, or the amount by which
earnings exceed or fall short of the required minimum rate of return investors could
get by investing in other securities of comparable risk (Stewart, 1990).
EVA is not new. Residual income, an accounting performance measure, is defined to be
operating profit with a capital charge subtracted. Thus, EVA is a variant of residual
income, with adjustments to how one calculates income and capital. Stern Stewart
& Co, a consulting firm based in New York, introduced the concept of EVA as a
measurement tool in 1989, and trademarked it. The EVA concept is often called
Economic Profit (EP) to avoid problems caused by the trade marking. EVA is so popular
and well known that all residual income concepts are often called EVA even though they
do not include the main elements defined by Stern Stewart & Co (Pinto, 2001). Up to
1970 residual income did not get wide publicity and it was not the prime
performance measure for companies (Makelainen, 1998). However, in the 1990’s,
the creation of shareholder value has become recognized as the ultimate economic
purpose of a corporation. Firms focus on building, operating and harvesting new
4
businesses and/or products that will provide a greater return than the firm’s cost of
capital, thus ensuring maximization of shareholder value. EVA is a strategy
formulation and a financial performance management tool that helps companies make a
return greater than the firm’s cost of capital. Firms adopt this concept to track their
financial position and to guide management decisions regarding resource allocation,
capital budgeting and acquisition analysis.
Economic Value Added simply balances a company's profitability against the capital it
employs to generate this profitability. If a company's earnings, after tax, exceed the cost
of the capital employed in the business, EVA is positive. Market studies have indicated
that a company that continually generates an increasingly positive EVA will be rewarded
by a higher stock price. A definition of EVA is net operating profit after taxes (NOPAT),
less an internal charge for the capital employed in the business (i.e., opportunity cost of
capital).
Many of the traditional corporate performance measures have been found to poorly
correlate, or even conflict, with management's primary objective of maximizing the
market value of a firm's stock. Now, there are several new measures in the financial
world that attempt to align the behaviors of an organization with its stockholders'
interests. One measure that has received a great deal of notice and acceptance is
Economic Value Added (EVA), developed by Joel M. Stern and G. Bennett Stewart III of
Stern Stewart & Co.
Implementation of one of these measures, such as EVA, can fundamentally change the
behavior of an entire organization. The new measure focuses the behavior of individuals
throughout all parts of the organization in a way that is better aligned with creating
stockholder wealth. Because performance compensation incentives are based upon the
new measure, employees and stockholders mutually benefit.
The financial function is uniquely qualified to take a leadership role in communicating an
understanding of the new measure. Main challenge is to gain a deep understanding of the
underlying principles of the measure and to communicate them in a meaningful way to all
5
parts of the organization. There can be pitfalls in translating the theory to practice, but
there is an opportunity to provide the appropriate counsel.
Economic Value Added (EVA) has become all the rage in the investing world. Stern
Stewart has gone so far as to trademark the concept, though many academics challenge it
as a knock-off of residual income. Stern Stewart has, however, been very successful
touting the measure as the best measure of business performance and management
discipline. Fortune Magazine annually publishes a list of top companies complete with
and EVA numbers and rankings, crediting the measures for the creation (or destruction)
of shareholder wealth. The Journal of Applied Corporate Finance annually publishes the
EVA for the Stern Stewart Performance 1000, citing EVA as "the critical driver of a
company's stock performance". Successful corporations are increasingly turning to EVA
to measure performance. General Electric, AT&T, Chrysler, and Compaq use EVA for
financial analysis. Coca Cola's late CEO, Roberto Goizueta, acknowledged the value of
EVA and declared "You only get richer if you invest money at a higher rate than the cost
of the money to you" (Fisher, 1995). In turn, investors and analysts are now scrutinizing
company EVA just as they have historically observed EPS and PE ratios. Academic
articles relating EVA success stories and promoting adoption of the measure abound
(Blair, 1996; Byrne, 1994; Carr, 1996; Copeland and Meenan, 1994; Gressle, 1996; Tully
1993; Stern 1990; Rice, 1996; Pallerito, 1997; Martin, 1996).
As described by Stern Stewart, EVA is net operating profit minus an appropriate charge
for the opportunity cost of all capital invested in an enterprise. In effect, it estimates the
economic profit (or loss) of a company's operations. Traditional accounting measures
such as EPS and ROA measure economic performance, but ignore the cost of the capital.
Including the cost of capital, as EVA does, reveals whether any economic value was
created. This forces management to focus on managing the company's assets as well as
creating income.
How does EVA promote shareholder interests? First, it clearly specifies to management
that the primary financial objective of the company is to create shareholder wealth.
Secondly, it emphasizes continuous improvement in the company's EVA as the basis for
6
increased shareholder wealth. Assuming the efficient market hypothesis holds, stock
price reflects the company's current performance; therefore, the level of EVA isn't
important, but changes in that level are. Management focus on these two issues can result
in dramatically increasing EVA.
Rising EVA has been purported to cause stock price to rise, therefore satisfying
shareholder interests. Does a relationship between EVA and stock return really exist?
James Meenan, CFO of AT&T's long distance business believes that it does. According
to Meenan, his company's EVA and stock price have had an almost perfect correlation
since 1984 (Fortune, 1993). Detractors are not as enthusiastic. Corporate strategy expert
Gary Hamel argues that while EVA is a good place to start, it is not an adequate way to
measure a company's wealth creation (Hamel and Lieber 1993). In 1995, Daniel Saint of
Chrysler stated, "as a single period measure of financial performance, I believe EVA's
contribution is minimal and not much different from return on equity or other traditional
accounting measures" (Kramer and Pushner, 1997). In truth, empirical evidence
supporting the relationship between EVA and stock return is sketchy at best.
1.2 What is Performance Measurement (PM)?
Investors measure overall performance of a firm as a whole to decide whether to invest in
the firm or to continue with the firm or to exit from it. In order to achieve goal
congruence, managers’ compensation is often linked with the performance of the
responsibility centers and also with firm-performance. Therefore selection of the right
measure is critical to the success of a firm. To measure performance of a firm one needed
a simple method for correctly measuring value created/ enhanced by it in a given
time frame. All the current metrics trade off between the precision in measuring the value
and its cost of measurement. In other words, each method takes into consideration the
degree of complexities in quantifying the underlying measure. The more complex is the
process, the more is the level of subjectivity and cost in measuring the performance of
the firm. There is a continuous endeavor to develop a single measure that captures
the overall performance, yet it is easy to calculate.
7

Each metric of performance claims its superiority over others. Performance of a firm is
usually measured with reference to its past record and the performance of other
firms with comparable risk profile. The various performance metrics currently in use are
based on the returns on investment generated by the business entity . Therefore to
reach a meaningful conclusion, returns generated by the firm in a particular year
should be compared with returns generated by assets with similar risk profile
(cross sectional analysis). Similarly return on investment for the current period should be
compared with returns generated in past (time series analysis). A firm creates value only
if it is able to generate return higher than its cost of capital. Cost of capital is the
weighted average cost of equity and debt (WACC).
The performance of a firm gets reflected on its valuation by the capital market. Market
valuation reflects investor’s perception about the current performance of the firm
and also their expectation on its future performance. They build their expectations
on the estimated growth of the business in terms of return on capital. This
results in incongruence between current performance and the value of the firm. Even
if the current performance is better in relative terms, poor growth prospects adversely
affects the value of the firm. Therefore any metric of performance, to be effective,
should be able to not only capture the current performance but also should be able to
incorporate the direction and magnitude of future growth. Therefore the robustness of a
measure is borne out by the degree of correlation the particular metric has with respect
to the market valuation. Perfect correlation is impossible because as shown by empirical
researchers, fundamentals of a company cannot fully explain its market capitalization;
other factors such as speculative activities, market sentiments and macro-economic
factors influence movement in share prices. However the superiority of a performance
metric over others lies in providing better information to investors.
Metrics of performance have a very important and critical role not only in evaluating the
current performance of a firm but also in achieving high performance and growth in the
future. The metrics of performance have a variety of users, which include all the
stakeholders whose well being depends on the continued well being of the firm. Principal
stakeholders are the equity holders, debt holders, management, and suppliers of material
8
and services, employees and the end-users of the products and services. Value creation and
maximization depends on the alignment of the various conflicting interests of these
stakeholders towards a common goal. This means maximization of the firm value without
jeopardizing the interests of any of the stakeholders. Any metric, which measures the
firm value without being biased towards any of the stakeholders or particular class
of participants, can be hailed as the true metric of performance. However it is difficult, if
not impossible, to develop such a metric. Most of the conventional performance measures
directly relate to the current net income of a business entity with equity, total assets, net
sales or similar surrogates of inputs or outputs. Examples of such measures are return on
equity (ROE), return on assets (ROA) and operating profit margin. ROA measures the
asset productivity and operating profit margin reflects the margin realized by the firm
at the market place. The net income figure in itself is dependent on the operational
efficiency, financial leverage and the ability of the entity to formulate right strategy
to earn adequate margin in the market place.
It is important to note that none of these measures truly reflect the complete picture
by themselves but have to be seen in conjunction with other metrics. These
measures are also plagued by the firm level inconsistencies in the accounting
figures as well as the inconsistencies in the valuation methods used by
accountants in measuring assets, liabilities and income of the firm. Accounting
valuation methods are in variance with the methods that are being used to value
individual projects and firms. The value of an asset or a firm, which is a collection
of assets, is computed by discounting future stream of cash flows. The net present
value (NPV) is the surplus that the investment is expected to generate over the cost of
capital. Measures of periodical performance of a firm, which is the collection of assets
in place, should follow the same underlying principles. Economic value added (EVA) is
a measure that captures the valuation principles.
Historically, PM systems was developed as a means of monitoring and maintaining
organizational control, which is the process of ensuring that an organization pursues
strategies that lead to the achievement of overall goals and objectives (Nanni, et al 1990).
9
PM plays a vital role in every organization as it is often viewed as a forward-looking
system of measurements that assist managers to predict the company's economic
performance and spot the need for changes in operations. In addition, PM can provide
managers, supervisors and operators with information required for making daily
judgments and decisions. PM is increasingly used by organizations, as it enables them to
ensure that they are achieving continuous improvements in their operations in order to
sustain a competitive edge, increase market share and increase profits.
1.3 Traditional measures
Accounts for the costs associated with capital and help firms spot areas in which capital
is being invested unprofitably. Although these financial data have the advantage of being
precise and objective, the limitations are far greater, making them less applicable in
today's competitive market. Organisations, that have adopted the traditional PM, have
experienced great difficulty in trying to fit the measures with increasing new business
environment and current competitive realities.
While the traditional financial metrics are value-based, they are nonetheless lagging
indicators. They offer little help for forward-looking investments, where future earnings
and capital requirements are largely unknown investments such as new product
introductions and capital or new market entry. This will lead to narrow short-term
decision-making based on bottom-line financial results.
On the other hand, most of the criticism of traditional PM stems from their failure to
measure and monitor multiple dimensions of performance, by concentrating almost
exclusively on financial measure (Brignall and Ballantine, 1996). They solely concentrate
on minimizing costs and increasing labour efficiency while neglecting other operational
performance measures such as quality, responsiveness and flexibility (Skinner, 1974)
Therefore focusing on financials to the exclusion of all other factors can produce
distortions such as low cost and high margin productions unnecessarily.
First let us look into the claim of EVA being superior than the conventional
measures such as ROI, ROE and ROA, which are based on the accounting figures. Most
10
of these measures give us the rate of return earned by the firm with respect to capital
invested in the firm. The most important limitation of these measures are derived
from limitations inherent in the measurement of accounting profit. As per current
accounting practices, while historical-cost-based accounting measures are being
used to carry most of the assets in the balance sheet, revenue and expenses (other than
depreciation) are recognized in the profit and loss account at their current value.
Therefore accounting rate of returns do not reflect the true return from an investment
and tend to be biased downwards in the initial years and upward in the latter years.
Similarly as noted by Malkelainen (Esa Malkelainen 1998), distortion occurs basically
due to the historical cost and straight line depreciation schedule used by most
businesses to value their assets. This leads to a bias in these measures due to the
composition of assets of a firm at any given point in time.
By composition he refers to the current nature of the assets, more current the assets are,
the accounting rate of return is closer to the true rate of return. This distortion will not be
significant if there is a continuous stream of investments in assets i.e. the value of the mix
of assets is nearer to the current value of the assets. But the probability, that at any point
of time, a firm should have such a composition of assets is rare, in most cases either the
assets are old or relatively new. This precludes these accounting measures from being
used to reach any meaningful conclusion regarding the true performance of the firm. The
other important limitation of accounting measures is that they ignore the cost of
equity and only consider the borrowing cost. As a result it ignores the risk inherent in the
project and fails to highlight whether the return is commensurate with the risk of
the underlying assets. This might result in selecting projects that produce attractive rate of
return but destroys firm value because their cost of capital is higher than the benchmark
return established by the management. On the other hand accounting measures encourage
managers to select projects that will improve the current rate of return and to
ignore projects even if their return is higher than their cost of capital. Selection of
projects with returns higher than the current rate of return does not automatically
increase shareholders’ wealth. Taking up only those projects, which provide returns
that are higher than the hurdle rate (cost of capital) results in increasing the
11
wealth of the shareholder. Therefore use of ROE, ROA or similar accounting
measures as the benchmark, might result in selection of those projects that though
provide rate of return higher than the current rate of return destroys firm-value. Similarly
use of these measures result in continuing with activities that destroys firm value until the
rate of return falls below the benchmark rate of return.
However, despite the criticisms made on traditional financial measure, many companies
still use them to measure performance. Many organizations, even until the end of 1970s,
operate performance under central control, through large functional department. Thus,
allowing managers to use slow-reacting and tactical management control system such as
'budgets'. These budgeting measures mainly focus on short-term value creation as it only
attempts to control and improve existing operations. However budgeting systems are
inflexible for today's dynamic and rapidly changing environment organizations still
continue to use them. This is because implementing new measures designed to manage
strategy and not control is very difficult.
Moreover, most companies motivate their worker through reward system. Rewards can
be financial such as cash payments, bonuses or share options and non-financial such as
promotion. Traditionally, employees are rewarded with bonuses at the end of the year
once a specific target has been achieved. However, this reward system causes short-
term’s as employees are seen to narrow down their focus by just targeting the 'rewarded'
goal. They may not take other factors, such as quality and service into consideration.
Hence leading businesses to run without long-term vision.
1.4 EVA (Economic Value Added)
EVA (Economic Value Added) was developed by a New York Consulting firm, Stern
Steward & Co in 1982 to promote value-maximizing behaviour in corporate managers
(O'Hanlon. J & Peasnell. K, 1998). It is a single, value-based measure that was intended
to evaluate business strategies, capital projects and to maximize long-term shareholders
wealth. Value that has been created or destroyed by the firm during the period can be
measured by comparing profits with the cost of capital used to produce them. Therefore,
12

managers can decide to withdraw value-destructive activities and invest in projects that
are critical to shareholder's wealth. This will lead to an increase in the market value of the
company. However, activities that do not increase shareholders value might be critical to
customer's satisfaction or social responsibility. For example, acquiring expensive
technology to ensure that the environment is not polluted might not be of high value from
a shareholder's perspective. Focusing solely on shareholder's wealth might jeopardize a
firm reputation and profitability in the long run.
EVA sets managerial performance target and links it to reward systems. The single goal
of maximizing shareholder value helps to overcome the traditional measure problem,
where different measures are used for different purposes with inconsistent standards and
goal. Rewards will be given to managers who are able to turn investor's money and
capital into profits efficiently. Researches have found that managers are more likely to
respond to EVA incentives when making financial, operational and investing decision
(Biddle, Gary, Managerial finance 1998), allowing them to be motivated to behave like
owners. However this behaviour might lead to some managers pursuing their own goal
and shareholder value at the expense of customer satisfaction.
Unlike simple traditional budgeting, EVA focuses on ends and not means as it does not
state how manager can increase company's value as long as the shareholders wealth are
maximized. This allowed managers to have discretion and free range creativity, avoiding
any potential dysfunctional short-term behaviour. Rewards such as bonuses from the
attainment of EVA target level are usually paid fully at the end of 3 years. This is because
workers' performance is monitored and will only be rewarded when this target is
maintained consistently. Hence, leading to long-term shareholders' wealth.
Cola-Cola is one of the many companies that adopted EVA for measuring its
performance. Its aim, which was to create shareholders wealth, was announced in its
annual report. Coca-Cola CEO Roberto Goizueta accredited EVA for turning Coca-Cola
into the number one Market Value Added Company. Coca-Cola's stock price increased
from $3 to over $60 when it first adopted EVA in the early 1980s. In 1995, Coca-Cola's
investor received $8.63 wealth for every dollar they invested.
13
Most companies refer to stock price increase as an outcome of implementing EVA.
However, empirical studies have found that traditional accounting measure have provided
a similar, or even better result in increasing stock performance (Dodd J and Johns J 'EVA
reconsidered').
EVA is a financial measure based on accounting data and is therefore historical in nature.
It has the same limitations as other traditional accounting measures and cannot
adequately replace all measures within the company especially the non-financial ones.
Due to the historical nature of EVA, manager can benefit in terms of rewards or be
punished by the past history of the organization (Otley, David Performance management
1999). Dodd J and Johns J see the balanced scorecard as one approach to overcome the
potential problem of using a single financial measure such as EVA.
1.4.1 The background of EVA
EVA is not a new discovery. An accounting performance measure called residual income
is defined to be operating profit subtracted with capital charge. EVA is thus one variation
of residual income with adjustments to how one calculates income and capital. According
to Wallace (1997) one of the earliest to mention the residual income concept was Alfred
Marshall in 1890. Marshall defined economic profit as total net gains less the interest on
invested capital at the current rate. According to Dodd & Chen (1996) the idea of residual
income appeared first in accounting theory literature early in this century by e.g. Church
in 1917 and by Scovell in 1924 and appeared in management accounting literature in the
1960s. Also Finnish academics and financial press discussed the concept as early as in
the 1970s. It was defined as a good way to complement ROI-control (Virtanen 1975).
Knowing this background many academics have been wondering about the big publicity
and praise that has surrounded EVA in the recent years. The EVA-concept is often called
Economic Profit (EP) in order to avoid problems caused by the trademarking. On the
other hand the name "EVA" is so popular and well known that often all residual income
concepts are often called EVA although they do not include even the main elements
defined by Stern Stewart & Co. For example, hardly any of those Finnish companies that
have adopted EVA calculate rate of return based on the beginning capital as Stewart has
14
defined it, because average capital is in practice a better estimate of the capital employed.
So they do not actually use EVA but other residual income measure. This insignificance
detail is ignored later on in order to avoid more serious misconceptions. It is justified to
say that the EVA concept, Finnish companies are using corresponds virtually the EVA
defined by Stern Stewart & Co.
In the 1970s or earlier residual income did not got wide publicity and it did not end up to
be the prime performance measure in great deal of companies. However EVA, practically
the same concept with a different name, has done it in the recent years. Furthermore the
spreading of EVA and other residual income measures does not look to be on a
weakening trend. On the contrary the number of companies adopting EVA is increasing
rapidly (Nuelle 1996, Wallace 1997, and Economist). It can only be a guess why residual
income did never gain a popularity of this scale. One of the possible reasons is that
Economic value added (EVA) was marketed with a concept of Market value added
(MVA) and it did offer a theoretically sound link to market valuations. In the times when
investors demand focus on Shareholder value issues this was a good bite. Perhaps also
pertinent marketing by Stern Stewart & Co. had and has its contribution.
In some previous conducted researches, EVA was verified to suffer from the same
accounting distortions as any accounting rate of return (e.g. ROI). Therefore EVA might
in some occasions give somewhat misleading signals of the true value added to
shareholders. In spite of this fact EVA has become a very popular performance measure,
perhaps because applying it has some powerful impacts on organizational behavior.
Unlike conventional profitability measures EVA helps the management and also other
employees to understand the cost of equity capital. At least in big public companies,
which do not have a strong owner, shareholders have often been conceived as a free
source of funds. Similarly, business unit managers often seem to think that they have the
right to invest all the retained earnings that their business unit has accumulated although
the group would have better investment opportunities elsewhere. EVA might change the
attitude in this sense because it emphasizes the requirement to earn sufficient return on all
capital employed.
15

Including capital costs in the income statement helps everybody in the organization to see
the true costs of capital. Rate of return does not work that way because nobody can
explicitly see the costs caused by e.g. inventories, receivables etc. The approaches
showing the consequences of invested capital under the line as profit (with ROI) or over
the line as cost (with EVA) are totally different. That is why organizations tend to
increase their capital turnover after introducing EVA, although they have formerly used
ROI that ought to take into account the capital as well. When calculating EVA, the cost
of equity (and debt) can be subtracted in the income statement earlier than after the net
operating profit. If all the revenues and costs are grouped by functions or by processes,
then it is of course practical to allocate the capital costs to these functions or processes.
The capital costs can also be allocated directly to products. Parts of the capital costs are
variable in nature (inventories, trade receivables) and thus they fluctuate according to the
sales volume. If the true capital costs were not included fully in product costs, then those
cost calculations (for price determination) are misleading. The error is the bigger, the
more capital intensive the production is.
At best EVA can be a new approach to view business. Perhaps the biggest benefit of this
approach is to get the employees and mangers to think and act like shareholders. It
emphasizes that in order to justify investments in the long run they have to produce at
least a return that covers the cost of capital. In other case the shareholders would be better
off investing elsewhere. This approach includes that the organization tries to operate
without lazy or excess capital and it is understood that the ultimate aim of the firm is to
create shareholder value by enlarging the product of positive spread (between return and
cost of capital) multiplied with the capital employed. The approach creates a new focus
on minimizing the capital tied to operations. Firms have so far done a lot in cutting costs
but cutting excess capital has been paid less attention. The power of EVA-approach is
something that most academic studies about EVA and share price correlation fail to trace.
The only way to assess the effects of this approach is to compare two sample groups,
other representing firms that use EVA and other firms that do not.
There are countless individual operational things that create shareholder value and
increase EVA. Often EVA does not directly help in finding ways to improve operational
16
efficiency except when improving capital turnover. Nor does EVA help directly in
finding strategic advantages that enable a company to earn abnormal returns and thus
create shareholder value. It is however often helpful to understand the basic ways in
which EVA and thus the wealth of shareholders can be improved.
Increasing EVA falls always into one of the following three categories:
1) Rate of return increases with the existing capital base. It means that more operating
profits are generated without tying any more capital in the business.
2) Additional capital is invested in business earning more than the cost of capital.
(Making NPV positive investments.)
3) Capital is withdrawn or liquidated from businesses that fail to earn return greater than
the cost of capital.
The first method includes all the countless ways to improve operating efficiency or
increase revenues. Of course increasing rate of return with current operations and new
investments (that is categories 1 and 2) are often linked; in order to improve the
efficiency of ongoing operations, companies often do investments which enhance also the
return on current capital base.
The fact that the wealth of shareholders increase with investments returning more that the
cost of capital (category 2) is probably known in organizations if they also use some kind
of weighted average cost of capital (WACC) and Net present value (NPV) methodology
in investment calculations. This rule is actually completely same as accepting only NPV-
positive investments.
The third category, withdrawing capital, is probably not so widely understood and
applied as the previous ones. It is however also very important to realize that shareholder
value can also be increased if capital is withdrawn from businesses earning less than the
cost of capital. Even if an operation has positive net income, it might pay to withdraw
capital from that activity. It is also kind of withdrawal when access inventories and
17
receivables and thus the capital costs caused by them are reduced without corresponding
decreases in revenues.
These categories and ways to improve EVA might appear to be quite simple. They are
certainly not new ways to improve the position of shareholders. Decreasing cost of
capital is not included in this list of methods. That is because it can not normally be done
without changing line of business and in that way changing business risk. Changing
financial leverage affects WACC only slightly via increased tax shield.
1.4.2 Indian context
In India EVA is being used with impunity. A case at point is the study published by
Economic times (11th December 2000) ,on corporate performance. While computing
EVA it used a flat rate of 15 percent as the cost of capital of all the enterprises included
in the study. The study explains that an average 15 percent interest for both the
years covered by the study is used as it is almost equal to the prime-lending rate
of the commercial bank and financial institution. It is a basic principle of economics
that ‘higher the risk higher is the expected return’. By estimating WACC at 15% this
basic principle is violated. It may be argued that cost of debt should be taken
post-tax and therefore effective cost of equity incorporated in the calculation is higher
than 15 percent. Even if this argument is accepted the computation cannot be defended
because the cost of capital is estimated without using any accepted economic model.
Moreover by using a flat rate, variation in risk profiles of firms have been ignored.
This shows both the popularity of EVA in India and difficulties in measuring the
same. The study has also ignored adjustments in capital and operating income suggested
by proponents of EVA
1.5 ECONOMIC VALUE ADDED – the concept
EVA is the most misunderstood term among the practitioners of corporate finance. The
proponents of EVA are presenting it as the wonder drug of the millennium in overcoming
all corporate ills at one stroke and ultimately help in increasing the wealth of the
18

shareholder, which is synonymous with the maximization of the firm value. The
attractiveness of the EVA lies in its use of cash flow and cost of capital that are
determinant of the value of the firm.
In the process, EVA is being bandied about with utmost impunity by all and
sundry, which includes the popular press. The academic world in its turn has come
up with various empirical studies which either supports the superiority of EVA or
questions the claim of its proponents. Currently the empirical evidence is split almost half
way.
EVA is nothing but a new version of the age-old residual income concept recognized by
economists since the 1770's. Both EVA and ‘residual income’ concepts are based on the
principle that a firm creates wealth for its owners only if it generates surplus over the cost
of the total invested capital. So what is new? Perhaps EVA could bring back the lost
focus on ‘economic surpluses from the current emphasis on accounting profit. In a lighter
vein it can be said that in an era where commercial sponsorship is the ticket to
the popularity of even the concept of god, the concept of residual income has not found a
good sponsor until Stern Stewart and Company has adopted it and relaunched it with a
brand new name of EVA.
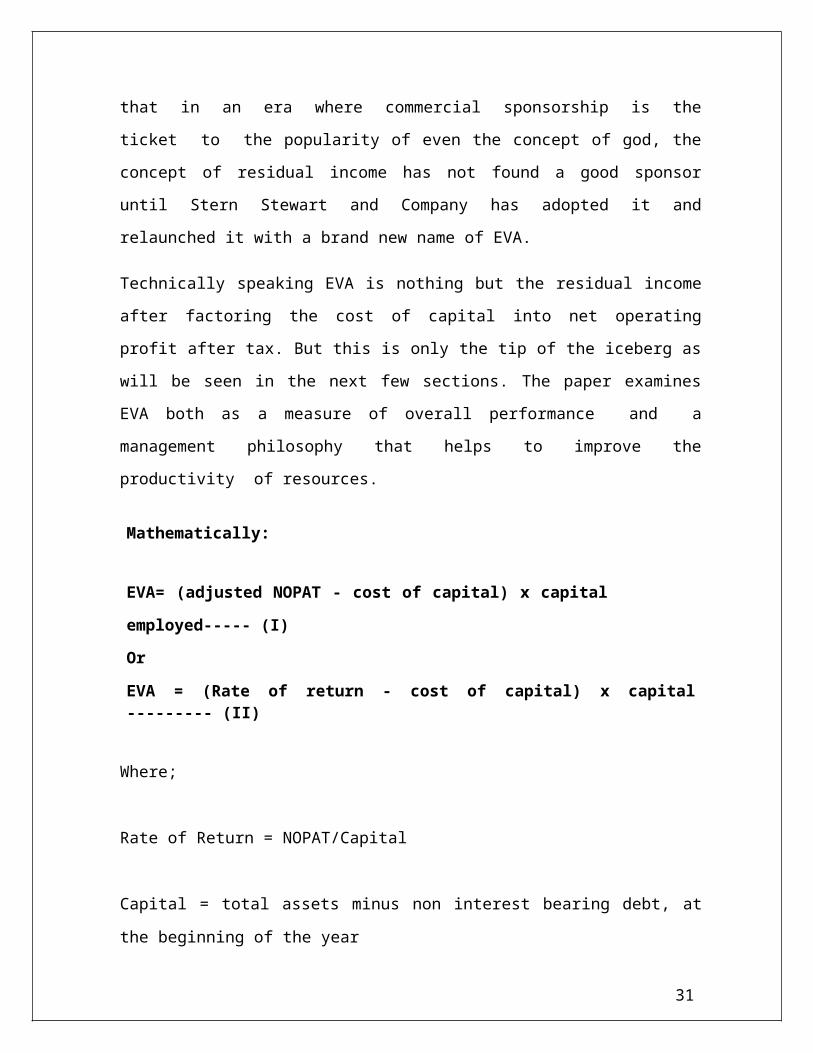
Technically speaking EVA is nothing but the residual income after factoring the cost of
capital into net operating profit after tax. But this is only the tip of the iceberg as will be
seen in the next few sections. The paper examines EVA both as a measure of overall
performance and a management philosophy that helps to improve the productivity
of resources.
Mathematically:
EVA= (adjusted NOPAT - cost of capital) x capital employed----- (I)
Or
EVA = (Rate of return - cost of capital) x capital --------- (II)
19
Where;
Rate of Return = NOPAT/Capital
Capital = total assets minus non interest bearing debt, at the beginning of the year
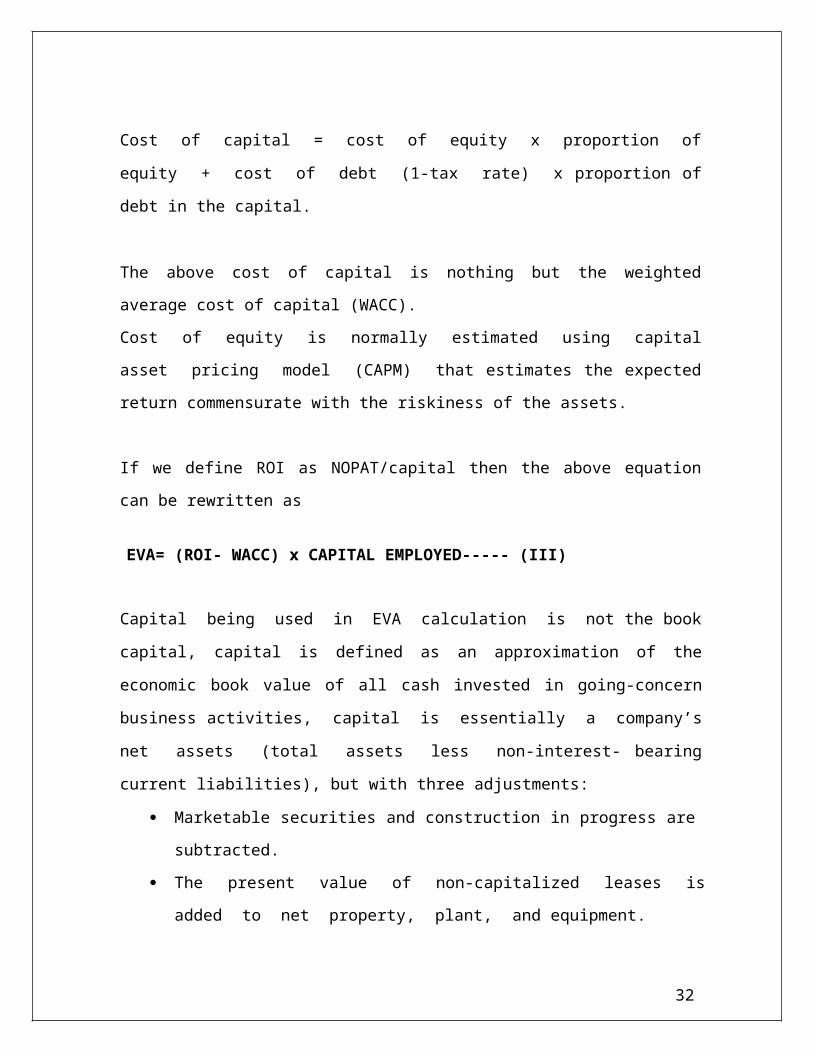
Cost of capital = cost of equity x proportion of equity + cost of debt (1-tax rate)
x proportion of debt in the capital.
The above cost of capital is nothing but the weighted average cost of capital (WACC).
Cost of equity is normally estimated using capital asset pricing model (CAPM) that
estimates the expected return commensurate with the riskiness of the assets.
If we define ROI as NOPAT/capital then the above equation can be rewritten as
EVA= (ROI- WACC) x CAPITAL EMPLOYED----- (III)
Capital being used in EVA calculation is not the book capital, capital is defined as an
approximation of the economic book value of all cash invested in going-concern business
activities, capital is essentially a company’s net assets (total assets less non-interest-
bearing current liabilities), but with three adjustments:
Marketable securities and construction in progress are subtracted.
The present value of non-capitalized leases is added to net property, plant,
and equipment.
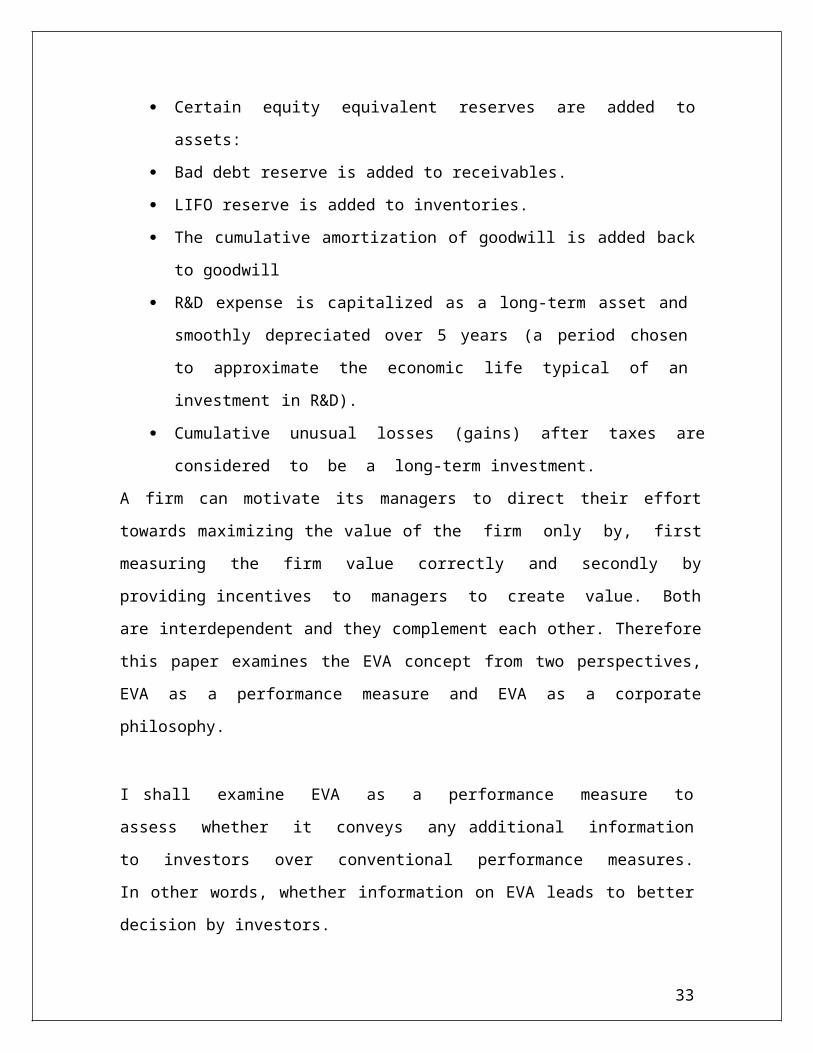
Certain equity equivalent reserves are added to assets:
Bad debt reserve is added to receivables.
LIFO reserve is added to inventories.
The cumulative amortization of goodwill is added back to goodwill
R&D expense is capitalized as a long-term asset and smoothly depreciated over
5 years (a period chosen to approximate the economic life typical of an
investment in R&D).
20
Cumulative unusual losses (gains) after taxes are considered to be a long-
term investment.
A firm can motivate its managers to direct their effort towards maximizing the value of the
firm only by, first measuring the firm value correctly and secondly by providing
incentives to managers to create value. Both are interdependent and they complement
each other. Therefore this paper examines the EVA concept from two perspectives, EVA
as a performance measure and EVA as a corporate philosophy.
I shall examine EVA as a performance measure to assess whether it conveys any
additional information to investors over conventional performance measures. In
other words, whether information on EVA leads to better decision by investors.
EVA can lend a helping hand in this connection in two ways: one that it is
inherently flexible and second, it helps generate flexibility within the organization:
1. The EVA concept allows adjustment of various accounting parameters (mentioned in
section on EVA theory) to suit the desired end purpose. There can be various purposes
for which EVA exercise might be carried out such as award of bonus to employees,
relative performance of various divisions, assessment of business as a whole etc. For the
purpose of award of bonus to employees, the focus is on the operational income and
capital employed to generate such income. Various accounting adjustments are made
accordingly. However, for the purpose of assessment of business as a whole, the strategic
investment and its returns also come into picture. While comparing various divisions, the
capital employed and expenses incurred on corporate centre take a back seat Thus, EVA
concept provides flexibility in hands of finance manager in measuring performance. In
the case study discussed later, we have discussed EVA from the point of view of award
of bonus.
2. Not only is EVA concept inherently flexible, but also it induces flexibility in the
organization. The application of concept forces the organization to release/ free the
excess capital employed. This deployment of excess capital provides the much-required
flexibility to finance manager to improve performance. Since application of concept
21
questions every decision harder, it forces the managers to keep exploring options and
encourages keeping the system flexible. This effect is more pronounced in companies
which are in distress, and where restructuring is being carried out.
1.5.1 Implementing EVA
Implementing EVA should be more than just adding one line in the monthly profit report.
EVA affects the way capital is viewed and therefore, it might create some kind of change
in management's attitude. Of course this depends on how shareholder-value-focused the
management is and how the company has been in the past. While implementing EVA
represents some kind of change in the organization, it should be implemented with care in
order to achieve understanding and commitment.
It is vital that group level managers thoroughly understand the characteristics of the
concept, how these characteristics affect control and above all where the Strategic
Business Units (SBUs) stand currently from the viewpoint of these characteristics. Before
implementing EVA to any SBU, the group management ought to assess whether the
business units are currently cash flow generators in mature businesses or companies in
rapidly growing businesses. This assessment should absolutely include careful estimation
of relative age and structure of assets in order to know whether the current accounting
rate of return is over or under estimating the true rate of return. Only then can the concept
be properly tailored to the unique situation of each individual business unit. Group level
managers should also know how to support strategic goals of SBU with EVA and how to
create value with EVA in individual SBU.
At the level of SBU, gaining understanding and commitment are also the most important
issues. First task is to get the support of all the managers, not only of the Managing
Director but also of directors of production and marketing etc. This is achieved with
intense and thorough training. For managerial level, attaining thorough commitment can
be facilitated very much by introducing good incentive plan based on EVA.
Gaining commitment of middle level managers and other employees below the top
management of business unit is also important. Training and some kind of EVA based
22
compensation plans should also be considered with these target groups. Keeping EVA
simple is also viewed as an important feature in successful implementation. In principle,
EVA is simple concept and it should be offered to business units as such.
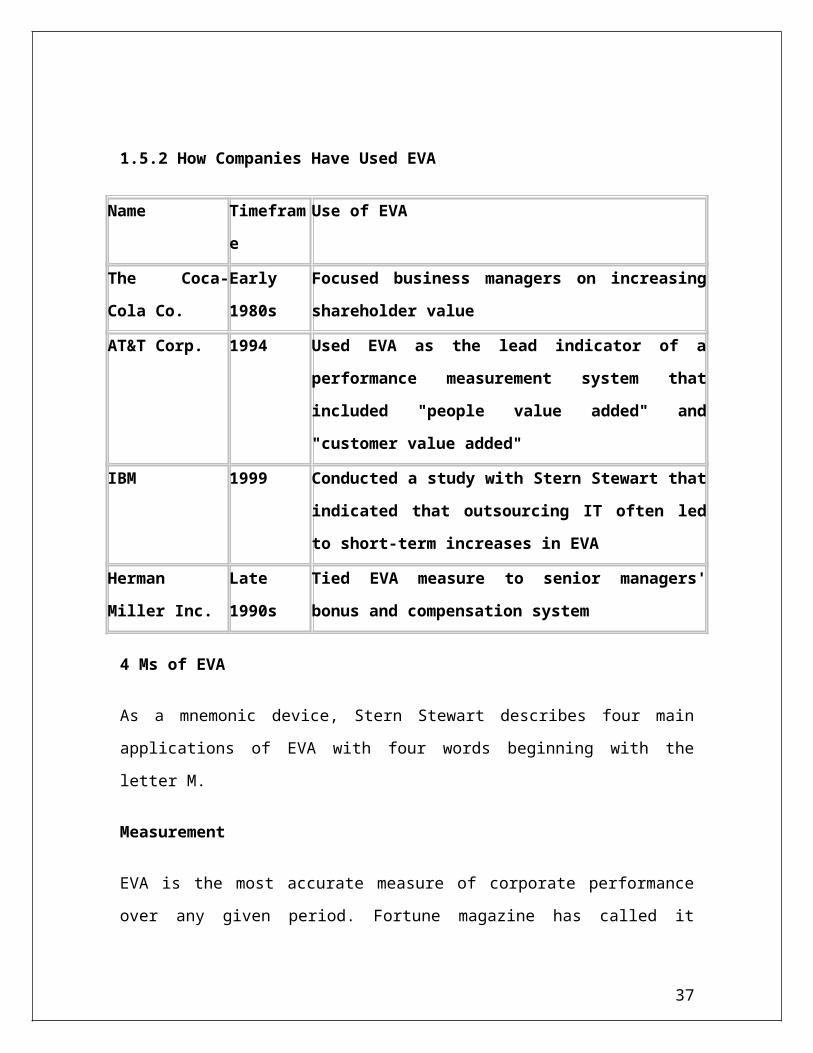
1.5.2 How Companies Have Used EVA
Name Timeframe Use of EVA
The Coca-Cola
Co.
Early 1980s Focused business managers on increasing shareholder
value
AT&T Corp. 1994 Used EVA as the lead indicator of a performance
measurement system that included "people value added"
and "customer value added"
IBM 1999 Conducted a study with Stern Stewart that indicated that
outsourcing IT often led to short-term increases in EVA
Herman Miller
Inc.
Late 1990s Tied EVA measure to senior managers' bonus and
compensation system
4 Ms of EVA
As a mnemonic device, Stern Stewart describes four main applications of EVA with four
words beginning with the letter M.
Measurement
EVA is the most accurate measure of corporate performance over any given period.
Fortune magazine has called it "today's hottest financial idea," and Peter Drucker rightly
23
observed in the Harvard Business Review that EVA is a measure of "total factor
productivity" whose growing popularity reflects the new demands of the information age.
Management System
While simply measuring EVA can give companies a better focus on how they are
performing, its true value comes in using it as the foundation for a comprehensive
financial management system that encompasses all the policies, procedures, methods and
measures that guide operations and strategy. The EVA system covers the full range of
managerial decisions, including strategic planning, allocating capital, pricing acquisitions
or divestitures, setting annual goals-even day-to-day operating decisions. In all cases, the
goal of increasing EVA is paramount.
Motivation
To instill both the sense of urgency and the long-term perspective of an owner, Stern
Stewart designs cash bonus plans that cause managers to think like and act like owners
because they are paid like owners. Indeed, basing incentive compensation on
improvements in EVA is the source of the greatest power in the EVA system. Under an
EVA bonus plan, the only way managers can make more money for themselves is by
creating even greater value for shareholders. This makes it possible to have bonus plans
with no upside limits. In fact, under EVA the greater the bonus for managers, the happier
shareholders will be.
Mindset
When implemented in its totality, the EVA financial management and incentive
compensation system transforms a corporate culture. By putting all financial and
operating functions on the same basis, the EVA system effectively provides a common
language for employees across all corporate functions. EVA facilitates communication
and cooperation among divisions and departments, it links strategic planning with the
operating divisions, and it eliminates much of the mistrust that typically exists between
operations and finance. The EVA framework is, in effect, a system of internal corporate
governance that automatically guides all managers and employees and propels them to
24
work for the best interests of the owners. The EVA system also facilitates decentralized
decision making because it holds managers responsible for-and rewards them for-
delivering value.
1.5.3 The EVA Concept of Profitability
EVA is based on the concept that a successful firm should earn at least its cost of capital.
Firms that earn higher returns than financing costs benefit shareholders and account for
increased shareholder value. In its simplest form, EVA can be expressed as the following
equation:
EVA = Net Operating Profit after Tax (NOPAT) - Cost of Capital
NOPAT is calculated as net operating income after depreciation, adjusted for items that
move the profit measure closer to an economic measure of profitability. Adjustments
include such items as: additions for interest expense after-taxes (including any implied
interest expense on operating leases); increases in net capitalized R&D expenses;
increases in the LIFO reserve; and goodwill amortization. Adjustments made to operating
earnings for these items reflect the investments made by the firm or capital employed to
achieve those profits. Stern Stewart has identified as many as 164 items for potential
adjustment, but often only a few adjustments are necessary to provide a good measure of
EVA.
Recently, the Economic Valued Added method has gained attention worldwide. This
method is intuitively appealing and measures profitability in the way shareholders define
it.
Economic Value Added calculates the actual dollar amount of a business's wealth created
or destroyed in each reporting period. It takes into account the opportunity cost (the
minimum acceptable compensation for investing in a risky asset as opposed to a less
risky market instrument like government bonds) of the company's capital investment and
measures the excess returns over this charge.
25
A positive Economic Value Added indicates that value is being created; so adding to the
intrinsic value of the company by that amount. A negative Economic Value Added, on
the other hand, indicates that value is eroded and the company is now worth less than the
initial capital employed.
Measurement of EVA
Measurement of EVA can be made using either an operating or financing approach.
Under the operating approach, NOPAT is derived by deducting cash operating expenses
and depreciation from sales. Interest expense is excluded because it is considered as a
financing charge. Adjustments, which are referred to as equity equivalent adjustments,
are designed to reflect economic reality and move income and capital to a more
economically-based value. These adjustments are considered with cash taxes deducted to
arrive at NOPAT. EVA is then measured by deducting the company's cost of capital from
the NOPAT value. The amount of capital to be used in the EVA calculations is the same
under either the operating or financing approach, but is calculated differently.
The operating approach starts with assets and builds up to invested capital, including
adjustments for economically derived equity equivalent values. The financing approach,
on the other hand, starts with debt and adds all equity and equity equivalents to arrive at
invested capital. Finally, the weighted average cost of capital, based on the relative values
of debt and equity and their respective cost rates, is used to arrive at the cost of capital
which is multiplied by the capital employed and deducted from the NOPAT value. The
resulting amount is the current period's EVA.
1.6 There are eight steps involve in applying Economic Value Added to value a
company:
Step 1: Determining a period of financial projection. To calculate returns on capital
employed, we first need to estimate the company's earnings; for instance, in the next five
years to 2016. The earnings projection is based on a set of assumptions for future volume
sales growth, finished product prices, government duties and inflation.
26
Step 2: Net operating profit after tax (NOPAT): Net operating profit after tax is
equivalent to the after tax earnings generated by the company (excluding interest
expense). The financing of asset (interest expense) is assumed to be independent of
operating results and is instead reflected in the company's cost of capital.
Step 3: Initial capital employed: The total capital employed at the beginning of each year
is the assets base from which earnings for the year are generated.
Capital employed = Net fixed assets + Working capital
Step 4: Return on capital employed (ROCE) the yearly returns on capital employed are
determined by dividing NOPAT by capital employed at the beginning of each year.
ROCE = NOPAT ÷ Capital employed
Step 5: Weighted average cost of capital (WACC) after calculating the Returns on
Investment (ROI), match them to the cost of capital. The most commonly used cost of
capital is the WACC, which is based on the company's debt equity capital structure.
WACC = Weighted cost of equity + Weighted after tax cost of debt
After tax cost of debt = [Interest payment x (1-tax rate)] ÷ Total borrowings
How big a risk premium required for investing in a company is dependent on how risky
the stock is relative to the broad market; which known as correlation beta. A high beta
implies the stock price is more volatile than the broad market. Therefore, an investor
should require a higher than market average return to compensate for the additional risks.
Conversely, a low beta implies that the stock returns will lag a market rally but will be
more resilient during a sell down.
Step 6: Excess returns over cost of capital
Excess returns (ER) = ROCE - WACC
27
Step 7: Economic Value Added and Market Value Added (MVA)
Economic Value Added = ER x Capital employed
Beyond the projected period of 2016, impute a terminal value (perpetuity); on the basis
that the company is an ongoing business concern (for the stream of future Economic
Value Added, assuming a constant yearly growth of 1%).
The stream of Economic Value Added is then discounted back to present day values
using the WACC calculated previously, the sum of which is the positive value created by
the company's business operations.
MVA = Sum of present value of Economic Value Added stream.
Step 8: Intrinsic value and shareholder value. The intrinsic value for the company is its
initial capital employed enhanced by the positive value created.
Intrinsic market value = Initial capital employed + MVA
And finally,
Shareholder value = Intrinsic market value - Net debt
Fair value per share = Shareholders' value ÷ Number of shares
The company's primary objective would be to maximize Economic Value Added; which
is not necessarily the same as maximizing profits. If the return on an investment is below
its cost of capital, then the company prefers not to make the investment at all (even if the
absolute magnitude of profit is increased).
1.6.1 EVA Calculation and Adjustments
As stated above, EVA is measured as NOPAT less a firm's cost of capital. NOPAT is
obtained by adding interest expense after tax back to net income after-taxes, because
28
interest is considered a capital charge for EVA. Interest expense will be included as part
of capital charges in the after-tax cost of debt calculation.
Other items that may require adjustment depend on company-specific activities. For
example, when operating leases rather than financing leases are employed, interest
expense is not recorded on the income statement, nor is a liability for future lease
payments recognized on the balance sheet. Thus, while interest is implicit in the yearly
lease payments, an attempt is not made to distinguish it as a financing activity under
GAAP.
Under EVA, however, the interest portion of the payment is estimated and the after-tax
amount from it is added back into NOPAT because the interest amount is considered a
capital charge rather than an operating expense. The corresponding present value of
future lease payments represents equity equivalents for purposes of capital employed by
the firm, and an adjustment for capital is also required.
R&D expense items call for careful evaluation and adjustment. While GAAP generally
requires most R&D expenditures to be expensed immediately, EVA capitalizes
successful R&D efforts and amortizes the amount over the period benefiting the
successful R&D effort.
Other adjustments recommended by Stern Stewart include the amortization of goodwill.
The annual amortization is added back for earnings measurement, while the accumulated
amount of amortization is added back to equity equivalents. Goodwill amortization is
handled in this manner because by "unamortizing" goodwill, the rate of return reflects the
true cash-on-yield. In addition, the decision to include the accumulated goodwill in
capital improves the real cost of acquiring another firm's assets regardless of the manner
in which the acquisition is accounted.
While the above adjustments are common in EVA calculations, according to Stern
Stewart, those items to be considered for adjustment should be based on the following
criteria:
29
Materiality: Adjustments should make a material difference in EVA.
Manageability: Adjustments should impact future decisions.
Definitiveness: Adjustments should be definitive and objectively determined.
Simplicity: Adjustments should not be too complex.
If an item meets all four of the criteria, it should be considered for adjustment. For
example, the impact on EVA is usually minimal for firms having small amounts of
operating leases. Under these conditions, it would be reasonable to ignore this item in the
calculation of EVA. Furthermore, adjustments for items such as deferred taxes and
various types of reserves (i.e. warranty expense, etc.) would be typical in the calculation
of EVA, although the materiality for these items should be considered. Unusual gains or
losses should also be examined and eliminated if appropriate. This last item is
particularly important as it relates to EVA-based compensation plans.
1.6.2 EVA at Work
Although economic value added is considered to be the kingpin of value-based metrics, it
won't work in an organization if a CEO doesn't force implementation throughout the
company or if incentive-based compensation isn't offered. And a pure EVA bonus plan
won't necessarily work at the middle and lower levels of a company, making it difficult to
preach the EVA gospel throughout an organization.
Stern Stewart & Co., a New York-based financial consulting firm which has trademarked
the term EVA, promotes the idea that economic value added is a financial performance
measure that comes closer than any other to capturing the true economic profit of an
enterprise. "The formula for EVA looks formidable, but it's really not," says Stern
Stewart vice president Tom Leander. "EVA is net operating profit minus an appropriate
charge for the opportunity cost of all capital invested in an enterprise. In simple terms,
EVA equals net operating profit after taxes — we use the acronym NOPAT."
Stern Stewart calculates what the economic value added for a company is and then
decides from what business centers the EVA will be calculated. Once the measurement is
made, the firm works with the finance department to show employees how EVA can be
30
used as an internal measure. The next and most obvious step is tying that measurement to
incentive compensation.
"Under classic economic theory, a problem exists in that managers' interests are not
aligned with the interests of the owners," Leander says. "But one of the aspects of EVA is
that managers must think and act like owners of the company. The underlying principle
here is that unless managers are motivated to think and feel like they're owners of the
company, they're not going to create value in a way that benefits shareholders."
EVA is about working smarter, not harder. It's about doing such things as reducing the
number of steps in a work process, reducing cycle times or scrutinizing business
expenses. Economic value added can be improved in three basic ways:
1. Growth: Invest in projects that earn more than the cost of capital. For example,
investing in personal computers, which frequently increase efficiency and justify
a minimal investment?
2. Improved productivity: Increase profits without using additional capital and/or
eliminate business expenses which can help improve income.
3. Divestiture: Eliminate non-strategic assets that do not generate operating profits
greater than the cost of capital. Examples include the reduction of inventory levels
and speeding up cycle times. Many companies which use EVA have found this to
be the most attractive method.
According to Stern Stewart, a key to weaving EVA into the corporate culture is to make
it the focal point for reporting, planning and decision-making. To do that requires two
things: The first is recognizing that, because economic value added is a measure of total
factor productivity, it can and should supersede other financial and operating measures,
resulting in a hierarchy as opposed to a balanced scorecard. The balanced scorecard
results when financial numbers are not the only consideration used to make strategic
decisions. For example, if you're manufacturing a product, a balanced scorecard weighs
factors such as financial impact, quality, customer satisfaction and productivity. If EVA
is merely added to a list of many other performance measures, confusion and unnecessary
31
complexity will remain. The second requirement is that EVA be incorporated into
decision-making processes.
The fact that such high-profile companies as The Coca-Cola Co. and Briggs & Stratton
have achieved considerable success through the implementation of EVA has prompted a
wave of companies to at least consider the strategy. "You have thought leaders in the
marketplace who are touting this much as they would reengineering," says Tom Hertog,
manager of Chicago-based Arthur Andersen Global Best Practices.
"When people come to us, they're looking for the magic bullet, but as is the case with
benchmarking and best practices, there is a whole host of approaches and no single
solution. But the appropriate and consistent application of EVA methodology will yield
results, regardless of what size company you are or what industry you're in."
Arthur Andersen promotes a four-step process for organizations that want to undertake an
economic value added program:
1. Calculation or formulation: How does one measure the return on capital minus the
cost of capital? This is where most of the focus is directed. Certain aspects of the
EVA calculation include determining the number of capital adjustments, the
number of cost of capital factors, the number of cost centers calculating EVA, and
the number of NOPAT (net operating profit after taxes) adjustments
2. Application: How does one apply EVA in his/her organization, in that particular
line of business? For example, if you're a service organization and you don't have
a tangible product, you still need a performance measurement tool such as EVA to
determine the increase or decrease of value. It's important to set a goal for
increasing EVA as expressed as a percentage for the next 12 months, the next one
to three years, and the next three to five years.
3. Implementation or integration: How does one make EVA part of their
organizational culture? This step includes determining the extent of training
needed for management and staff, the methods by which EVA will be
32
communicated throughout the company, and the time it will take for
implementation at various levels in the organization.
4. Interpretation or correlation: How will EVA impact the future of company?
Organizations obviously want to focus on positive change and sometimes use
MVA (market value added) as a measure of interpretation. MVA can be measured
by taking the current market value placed on the company as reflected in its stock
price and then subtracting the capital invested on the balance sheet.
"It comes down to ABO — awareness, buy-in, and ownership," Hertog says. "One or two
people will rise to the champion level and take ownership and drive it. The business unit
controllers will need to get that message from the CFO that they're going to do EVA. The
way you introduce it and integrate it is absolutely critical for it to gain acceptance.
Otherwise, it never happens
1.7 EVA vs. Traditional Performance Measures
The development of the concept of EVA has added flexibility in measurement of
performance. The traditional methods can continue side by side with EVA. Some of the
traditional ways of measuring corporate performance are described here.
1.7.1 Return on Investment (ROI)
Return on capital is a very good and relatively good performance measure. Different
companies calculate this return with different formulae and call it also with different
names like return on invested capital, return on capital employed, return on net assets,
return on assets etc. The main shortcoming with all these rates of return is that in all cases
maximizing rate of return does not necessarily maximize the return to shareholders.
Following example will clarify this statement:
Suppose a group has two subsidiaries X and Y. For both subsidiaries and so for the whole
group the cost of capital is 10%. The group has maximizing ROl as its target. Subsidiary
X has ROl of 15% and the other has ROl of 8%. Both subsidiaries begin to struggle for
the common target and try to maximize their respective ROIs. Company X rejects all the
33
projects that produce a return below the current 15% although there would be some
projects with return 12-13%. Y, in turn, accepts all the projects with return above 8%. For
a reason or another, it does not find very good projects, but the returns of its projects lie
somewhere near 9%.
Suppose that both subsidiaries manage to increase their ROI. The ROI of subsidiary X
increases from 15 to 16% and that of Y increases from 8 to 8.5%. The company's target
to increase ROI has been achieved, but what about the shareholder value. It is obvious
that all the projects of subsidiary Y decrease the shareholder value, because the cost of
capital is more than rate of return (and so the shareholders money would have been better
off with alternative investments). The actions of the better subsidiary are not optimal for
shareholders. Of course shareholders will benefit from the good projects with return
greater than 15% but also all the projects with returns of 10-14% should have been
accepted even though they decrease the current ROl of subsidiary X. These projects still
create and increase the shareholder value.
Hence, the capital can be misallocated on the basis of ROl. ROl ignores the definite
requirement that the rate of return should be at least as high as cost of capital. Further,
ROI does not recognize that shareholder's wealth is not maximized when the rate of
return is maximized. Shareholders want the firm to maximize the absolute return above
the cost of capital and not to increase percentages.
1.7.2 Return on Equity (ROE)
The level of ROE does not tell the owners if company is creating shareholders' wealth or
destroying it. With ROE, this shortcoming is much more severe than with ROI, because
simply increasing leverage can increase the ROE. In other words, decreasing solvency
does not always make shareholders' position better because of the increased financial
risk.
1.7.3 Earning per Share (EPS)
34
EPS is raised simply by investing more capital in business. If the additional capital is
equity (retained earnings) then the EPS will rise if the rate of return of the invested
capital is just positive. For example, let us assume that as on March 31, 2009, company A
has net worth of Rs 50 million and 5 million equity shares. At a profit after tax of Rs 100
million for FY 2009, the EPS would work out to be 20. The entire income can be
ploughed back in the business at a marginal return of 5%. Assuming that the return on
previous net worth remains the same, the profit after tax would be Rs 105 million and
EPS would be 21. Though the performance has gone down, the EPS has increased.
If the additional capital is debt then the EPS will rise if the rate of return of the
invested capital is just above the cost of debt. In reality, the invested capital is a mix of
debt and equity and the EPS will rise if the rate of return on the additional investment is
somewhere between the cost of debt and zero. Therefore EPS is completely inappropriate
measure of corporate performance and still is very common yardstick and even a
common bonus base.
Unlike conventional profitability measures, EVA helps the management and other
employees to understand the cost of equity capital. At least in big companies, which do
not have a strong owner, shareholders have often been perceived as free source of funds.
These flaws are taken care of by the concept of economic value added. The key feature of
this concept is that for the first time any measure takes cares of the opportunity cost of
capital invested in business.
1.8 The Utility of EVA: Better Decision-Making
EVA clarifies the concept of maximizing the absolute returns over and above cost of
capital in creating shareholders' wealth. Hence better investment decisions can be taken
with above aim rather than maximizing percentage of ROl. Understanding of EVA
enables monitoring of investment decisions closely not only at the level of corporate but
at line staff as well.
Fosters New Era of Corporate Control
35
EVA points / centres can be created within an organization and these centres would have
capital, revenue and expenditure issue attached to them. It helps identify value drivers
and destroyers. Responsibility of positive EVA can be delegated at these centres. It
questions the decisions harder.
Long-Term Thinking
Perhaps the biggest benefit of this approach is to get employees and managers to think
and act like shareholders. EVA encourages long-term perspective among the managers
and employees of organization. It emphasizes that in order to justify investments in the
long run they have to produce at least a return that covers the cost of capital. In other
case, the shareholders would be better off investing elsewhere. This approach includes
that the organization tries to operate without the luxury of excess capital and it is
understood that the ultimate aim of the firm is to create shareholder value by enlarging
the product of positive spread multiplied with capital employed. The approach creates a
new focus on minimizing the capital tied to operations. Firms have so far done a lot in
cutting costs but cutting excess capital has been paid less attention.
Capital Allocation Tool
EVA is a capital allocation tool inside a company as it sets minimum level of acceptable
performance with regard to the rate of return in the long run This minimum rate of return
is based on average (risk adjusted) return on equity markets. The average return is a
benchmark that should be reached. If a company cannot achieve the average return, then
the shareholders would be better off if they allocated the capital to another industry or
another company.
Bonus System
EVA has provided a platform on which a flexible bonus payment system can be
based. Employees will be paid bonus only when they earn at least equal to the cost of
capital employed. This links the bonus with the end result and forces employees to act
like shareholders. Proponents of bonus systems based on EVA have suggested that
36
bonuses for corporate managers should always be tied to the long-term capital because
short-term EVA can sometimes be manipulated upwards to the cost of long run EVA The
long run can be incorporated into EVA-based bonuses, that is, by banking the bonuses.
This would mean that when EVA is good, the managers earn a certain percentage of it,
but the bonus should not be paid out of them entirely. If the periodic EVA is negative,
then the bonus put in the bank is negative and it decreases the balance already earned.
This exposes the managers partly to the risk the shareholders are used to bear. At the
same time, it gives incentives to good performers and encourages the bad performers to
improve their performance.
For example, manager earns a bonus of an amount X of the annual salary for leading its
centre to a positive EVA to the extent of 10% of capital employed. Out of the entire
bonus, 50% can be paid out and the rest can be banked as entitlement if the next year
EVA is not negative. In case the EVA next year is negative, the banked bonus can be
reduced as disincentive for bad performance.
Flexibility in EVA
Today's business environment is marked by presence of a lot of change drivers like
globalization, an intense competition, etc and the uncertainty surrounding them has
created chaos and confusion in organizations. Consequently, flexibility has assumed key
role in every facet of organization management and finance function, known for its
rigidity, is not too far from application of this paradigm.
1.9 Small and Medium Enterprises (SMEs)
Small and Medium Enterprises (SMEs) are considered engines for economic growth, not
only in India but all over the world. Small and medium enterprises have played a vital
role in the growth of the Indian economy. Small Scale Industry has a 40% share in
industrial output, producing over 8000 value-added products. They contribute nearly 35%
in direct export and 45% in the overall export from the country. They are one of the
biggest employment-providing sectors after agriculture, providing employment to 28.28
million people. They account for 80% of global economic growth.
37
Market conditions have dramatically changed for Indian SMEs after economic reforms.
SMEs are regularly facing new challenges in terms of cost, quality, delivery, flexibility
and human resource development for their survival and growth. In the context of a
dynamic market scenario, they have to formulate their strategies for developing various
capabilities and competencies to satisfy their domestic as well as global customers.
For long-term competitiveness, SMEs have to focus on all aspects of organizational
functions such as assets, strategy development, processes and their performance. In
Punjab the SMEs have not been growing at the pace at which they should have been as
they have been facing a lot of problems.
Small Scale industrial undertaking is defined as an industrial undertaking in which the
investment in fixed assets in plant and machinery whether held on ownership terms on
lease or on hire purchase does not exceed Rs.50 million (Subject to the condition that the
unit is not owned, controlled or subsidiary of any other industrial undertaking). Small and
medium-size enterprises (SMEs) in India play an important role in generating
employment and creating economic wealth. Small-scale industries play a key role in the
industrialization of a developing country. This is because they provide immediate large-
scale employment and have a comparatively higher labor-capital ratio; they need lower
investments, offer a method of ensuring a more equitable distribution of national income
and facilities an effective mobilization of resources of capital and skill which might
other-wise remain unutilized.
Table1: Small Scale Industry of Punjab: A Brief Profile (2009 – 10)
No. of Registered SSI Units 1,97,340
Employment 8,54,000Fixed Investment (Rs mn) 34,050
Production (Rs mn) 1,50,000Predominant Industries
Metal Products, Leather and Products, Textile and Hosiery, Non-electrical Machine Tools & Parts, Food Products
Major Issues Need for Infrastructural facilities, Need for working capital, Need for marketing infrastructure
38
The small scale sector has stimulated economic activity of a far reaching magnitude
and has played a significant role in attaining the following major objectives;
1. Elimination of economic backwardness of rural and underdeveloped regions in the
country.
2. Attainment of self-reliance
3. Reduction of regional imbalance.
4. Reduction of disparities in income wealth and consumption.
5. Mobilization of resources of capital and skills and their optimum utilization.
6. Creation of greater employment opportunities and increase output, income and
standards of living
7. Meeting a substantial part of the economy’s requirements for consumer goods and
simple producer goods
8. Provide employment and a steady source of income to the law-income groups living in
rural and urban areas of the country
9. Provide substitutes for various industrial products now being now being imported into
the country.
10. Improves the quality of industrial products manufactured in the cottage industry
sector and to enhance both production and exports.
The development of these industries would be beneficial to the developing countries and
assist them in improving their economic and social well-being. This would create greater
employment opportunities and assist in entrepreneurship and skills development and
ensure better use of the scarce financial resources and appropriate technology. India is
ranked among the ten most industrialized countries in the world. The country has derived
its economic strength from the growth of small-industries throughout its length and
breadth. The pivotal role the small industry play in the economy of India can be judged
by looking at the statistical data; more than 55% of total production in country today is
from small-scale sector.
1.9.1 Scope of small-scale industry
39

The importance of small-scale enterprises is a global phenomenon encompassing both the
developing and developed countries. Globally, the emphasis is on the small-enterprises
holding the key to growth with equity and proficiency. In India, small industry refers to
manufacturing activity. Recently it has also included servicing activities such as repair
and maintenance shops and few community services. This sector covers over 7500 items
involving very simple to highly sophisticated technologies and offering opportunities for
the utilization of local resources and skills, the sector has emerged as a major supplier of
a variety of products for mass consumption as well as parts and components to the large
industry sector. Apart from handicrafts and other traditional products, small-scale
manufacture some of the high value-added and sophisticated products like electronic
typewriters, survey equipment, security and fire alarm system, television sets and other
consumer durables. Many such products are used as original equipment items by the
manufacturers in the large industry sector. The sector has the flexibility of responding to
varied needs of the economy.
1.9.2 Characteristics of small-industries
1. Capital investment is small
2. Most have fewer than 20 workers
3. Located in rural and semi-urban areas
4. Virtually all of these firms are privately owned and are organized as sole
proprietorships
5. Growing at a faster rate than large scale industry
6. Small-scale industries activity is beehive of entrepreneurship
7. Exploitation of natural resources
8. Human resource is exploited instead of developing it
9. Due to various constraints, cheating is a common feature
10. Organization and management is very poor and negligible in many cases.
11. Financial discipline is very weak and rules and regulation are not adhered.
12. Most of the funds come from entrepreneur’s saving.
1.9.3 Importance of small-scale industries
40
1. The small-scale sector has a high potential for employment, dispersal of industries,
promoting entrepreneurship and earning foreign exchange to the country. The following
are the points to demonstrate it
2. Symbols of national identity-small enterprises are almost always locally owned and
controlled, and they can strengthen rather than destroy the extended family and other
social systems and cultural traditions that are perceived as valuable.
3. Individual’s taste fashion and personalized service-small firms are quick in studying
changes in tastes and fashion of consumers and in adjusting the production process and
production accordingly. For eg: In garment industry the small units have ruled the roost,
big companies delegate responsibility down the line and cannot swiftly change the trace
when necessary. The garment business is personalized, oriented to changing fashions and
has to be tightly controlled.
4. Facilitates capital formation-the development of small industries generated additional
income and additional savings, this helps in capital formation in the economy.
5. Equitable distribution of income and wealth-By creating opportunities for small
business, small enterprises can bring about can bring about a more equitable distribution
of income and wealth which is socially necessary and desirable
6. Balanced regional growth-small-industries make possible transfer of manufacturing
activity from congested cities to rural and semi-urban areas, this helps in regional
development
7. Linkages-the large scale industries create an opportunity for growth of small-scale
industry, the growth of large motor industry will create opportunities for setting up small
service station and repair centers.
8. Export potential-Nearly 20% of the total value of export comes from small-scale
industry. The main items of export includes pharmaceuticals, sports goods, engineering
goods, finished leather, readymade cotton garments, processed foods etc.
41
1.9.4 Advantages of small-scale enterprises
1. Small-scale industry do not require as heavy and costly infrastructure as larger
enterprises.
2. They have favorable capital output ratio
3. Helps to create economic stability in society by diffusing prosperity and by checking
the expansion of monopolies
4. Most developing countries are rich in certain agricultural, forest and mineral resources;
small-scale industries can be based on processing of locally produced raw materials
5. It is possible to save and to earn a foreign exchange by producing and exporting goods
process from local resources.
6. Small-scale industries are generally labour-intensive and do not require large amount
of capital. The energy of unemployed and under-employed people may be used for
productive purposes in an economy in which capital is scarce.
7. They bring integration with rural economy on one hand and large scale enterprise on
other.
8. They facilitate mobilization of resources of capital and skills which often would
remain inadequately utilized.
1.9.5 Role of small business in national economy
Small business has played a very crucial role in transforming the Indian economy from a
backward agrarian economy to its present stature. Its benefits range from creating job
opportunities for millions of people, including many with low levels of formal education.
It has nurtured the inherent entrepreneurial spirit in far flung corners of the nation
resulting in the growth and development of all regions. It has been instrumental in raising
the standard of living of the multitudes. The small scale sector has contributed
specifically in the following areas:
42
1. Employment Generation: The SSI sector in India is the second largest
manpower employer in the country next only to the agriculture sector. India is
characterized by abundant labour supply and is plagued by unemployment and
underemployment. Under these circumstances the small-scale sector is a boon
.For every Rs.0.1million of investment, the small-scale sector provides jobs to
26 people as compared to 4 jobs created in the large-scale sector.
2. Low Initial Capital Investment: Another feature of the Indian economy and
most of the developing economies is the scarcity of capital. The modern large-
scale sector requires colossal investments whereas the small sector is just the
opposite. Not only is the employment capital ratio high for the SSI but the
output capital ratio is also high.
3. Balanced Regional Development: Dispersion of small business in all parts of
the country helps in removing regional imbalances by promoting decentralized
development of industries. It helps in industrialization of rural and backward
areas. It also helps to reduce problems of congestion, pollution housing, sanitation
etc
4. Equitable Distribution of Income: This is a natural corollary of the above.
When entrepreneurial talent is tapped in different regions and areas the
income is also distributed instead of being concentrated in the hands of a few
individuals or business families.
5. Promotes Inter-Sectoral Linkages: SSI units are supplementary and
complementary to large and medium scale units as ancillary units. Many small
units produce sub-parts, assemblies, components and accessories for the large-
scale sector especially in the electronic and automotive sectors.
6. Exports: The most significant contribution of the SSI has been in the field of
exports. There has been a significant increase in the exports from this sector
43
of both traditional and non-traditional goods including jewellery, garments,
leather, hand tools, engineering goods, soft ware etc.
7. Development of Entrepreneurship: Small business taps the latent potential
available locally. This way they facilitate the spirit of enterprise, which results
in overall growth, and development of all the regions /sectors of the nation
Companies that succeed with economic value added (EVA) initiatives tend to
possess the following characteristics:
1. Strong support from the CEO. If the CEO takes a wait-and-see attitude, EVA
stands a greater chance of failing, because employees are less likely to take it
seriously.
2. Effective EVA education. If employees understand why they should start using
EVA principles in their everyday tasks, there’s a greater chance of success in the
implementation phase.
3. Links between EVA performance and employee compensation. Connecting the
performance measure with incentives gives EVA implementation teeth and lets
everyone know how they will be evaluated.
4. Realistic income stream projections. EVA is based on the educated guess of how
much potential a capital asset has to produce a rate of return over and above its
cost. If the people making those estimates are too rosy in their projections, the
number of capital expenditures that produce a positive EVA will shrink
5. An overall attitude of economic efficiency. Successful EVA companies look not
only at the cost of capital, but also at a variety of ways to improve economic
efficiency within their organization, such as reducing inventory costs and
improving operational processes.
6. An overall attitude of economic efficiency. Successful EVA companies look not
only at the cost of capital, but also at a variety of ways to improve economic
44
efficiency within their organization, such as reducing inventory costs and
improving operational processes.
7. EVA-based budgets. Traditional budgets impede EVA’s effectiveness by,
essentially, saying, "We have X dollars, and all of that money needs to go
someplace." If a company’s calculations indicate that only 60 percent or 75
percent of that money can be spent within its EVA parameters, then that company
should allocate its resources only to capital projects that will produce an
acceptable rate of return.
1.10 Strategies for increasing EVA
Increase the return on existing projects (improve operating performance)
Invest in new projects that have a return greater than the cost of capital
Use less capital to achieve the same return
Reduce the cost of capital
Liquidate capital or curtail further investment in sub-standard operations where
inadequate returns are being earned
1.10.1 Advantages of EVA
EVA is more than just performance measurement system and it is also marketed as a
motivational, compensation-based management system that facilitates economic activity
and accountability at all levels in the firm.
Stern Stewart reports that companies that have adopted EVA have outperformed their
competitors when compared on the basis of comparable market capitalization.
Several advantages claimed for EVA are:
EVA eliminates economic distortions of GAAP to focus decisions on real
economic results
45
EVA provides for better assessment of decisions that affect balance sheet and
income statement or tradeoffs between each through the use of the capital charge
against NOPAT
EVA decouples bonus plans from budgetary targets
EVA covers all aspects of the business cycle
EVA aligns and speeds decision making, and enhances communication and
teamwork
Academic researchers have argued for the following additional benefits:
Goal congruence of managerial and shareholder goals achieved by tying
compensation of managers and other employees to EVA measures (Dierks &
Patel, 1997)
Better goal congruence than ROI (Brewer, Chandra, & Hock, 1999)
Annual performance measured tied to executive compensation
Provision of correct incentives for capital allocations (Booth, 1997)
Long-term performance that is not compromised in favor of short-term results
(Booth, 1997)
Provision of significant information value beyond traditional accounting measures
of EPS, ROA and ROE (Chen & Dodd, 1997)
1.10.2 Limitations of EVA
EVA also has its critics. The biggest limitation is that the only major publicly-available
sample evidence on the evidence of EVA adoption on firm performance is an in-house
study conducted by Stern Stewart and except that there are only a number of single-firm
or industry field studies. It would be wrong to say that EVA is not beset with any
drawbacks. Though it provides a new tool in the hands of management, it has its own
limitations. For example, EVA does not take into cognizance current market value of
assets and book value is taken into account in calculations. This is of course misleading
and presents distorted picture but estimating the current market value of assets is very
difficult and often impractical.
46
EVA has established superiority over other measures of performance but that does not
mean that EVA alone can clearly tell how the plans are going and strategic goals being
met. The companies that have invested heavily today and expect positive cash flow only
in distant future are extreme examples that have negative EVA in near future. Their
performance can be better judged by market share, sales growth etc.
For the equity analysts, there is a word of caution. The concept of EVA requires
knowledge of accounts internal to organization to a great extent and their availability to
the external world is a big constrain. This constraint becomes even more pronounced in
countries like India where even the annual reports published by companies have scanty
disclosures. Moreover, it has to be borne in mind that EVA gives one year snapshot of
company's operational performance.
Brewer, Chandra & Hock (1999) cite the following limitations to EVA:
EVA does not control for size differences across plants or divisions
EVA is based on financial accounting methods that can be manipulated by
managers
EVA may focus on immediate results which diminishes innovation
EVA provides information that is obvious but offers no solutions in much the
same way as historical financial statement do
Also, Chandra (2001) identifies the following two limitations of EVA:
Given the emphasis of EVA on improving business-unit performance, it does not
encourage collaborative relationship between business unit managers
EVA although a better measure than EPS, PAT and RONW is still not a perfect
measure
Brewer et al (1999) recommend using other performance measures along with EVA and
suggest the balanced scorecard system. Other researchers have noted that EVA does not
correlate as strongly with stock returns as its proponents claim. Chen & Dodd (1997)
found that, while EVA provides significant information value, other accounting profit
47
measures also provide significant information and should not be discarded in favor of
EVA alone. Biddle, Brown & Wallace (1997) found only marginal information content
beyond earnings and suggest a greater association of earnings with returns and firm
values than EVA, residual income, or cash flow from operations.
Finally, a key criticism of EVA is that it is simply a retreated model of residual income
and that the large number of "equity adjustments" incorporated in the Stern Stewart
system may not be necessary (Barfield, 1998; Chen & Dodd, 1997; O'Hanlon & Peasnell,
1998; Young, 1997). The similarity between EVA and residual income is supported by
Chen and Dodd (1997) who note that most of the EVA and residual income variables are
highly correlated and are almost identical in terms of association to stock return.
1.10.3 Common EVA errors:
They don't make it a way of life. You can't just calculate EVA; you have to adopt
it. Companies must make it the centerpiece of a comprehensive financial
management system. Economic value added must be linked to how companies set
overall financial goals, how they communicate those goals internally and to the
investment community, and how they evaluate opportunities to build the business
and invest capital.
They rush the implementation process. Depending on the size of a company, the
implementation process could take anywhere from three months to two years.
Companies that make the mistake of trying to implement EVA all at once often
find there are too many people to train and disruption results. Top managers must
be able to understand economic value added so they can train those down the line.
There is a lack of conviction from senior management. The CEO must be totally
committed to prevent staff from creating fiefdoms. Direction from the top is
critical because moving to EVA is something not all managers will want to do if
they already can easily meet budget. Approximately 50 percent of the power of
EVA can be lost if the incentive plan is not driven by it.
Managers complain too much. Instead of making economic value added a
philosophical crusade to create shareholder value, communicate a simple message
48
to employees: "What if we found a measure of financial performance that really
captures all the things a person can do to run the business more efficiently, to
satisfy customers, and to reward shareholders. Wouldn't it make sense to use that
to shape our financial decision-making?"
There is a lack of quality training. It is important that the fundamentals of EVA be
communicated throughout the organization because even those with the smallest jobs can
create value. This means things like linking EVA to such key operating metrics as cycle
time or inventory turns and making certain the people involved know how economic
value added fits in. After all, the faster you turn inventory, the greater the reduction of
needed capital, resulting in increased EVA.
49
Objectivesof the Study
50
1.11 Objectives of the Study
Whenever a study is conducted, it is done on the basis of certain objectives in mind. A
successful completion of a project is based on the objectives of the study that could be
stated as under:
1) To determine how to calculate EVA of a company.
2) To develop an EVA model for SME’s.
3) To determine how EVA as a tool act as a financial performance measure in SME’s.
4) To examine how EVA is different from other performance measures i.e. pitfalls of
traditional performance measures are discussed here.
1.12 Limitations of the study
Though every care has been taken to make this report authentic in every sense, yet there
were a few uncomfortable factors, which might have their influence on the final report.
Linking factors can be stated as:-
There were many problems regarding the collection of secondary data internally
i.e. Income Statement and Balance Sheet of the firm.
51
None of the owner managers and employees of the firm is keeping a proper record
of Sales, Inventory, costs associated and other facts required for the purpose of
research.
Nobody was willing to share any kind of information and it was hard to get the
real fact about the firm’s profitability.
Lack of resources available on Economic Value Added (EVA) model for SME.
52
Reviewof
Literature
Review of Literature
2.1 Bartoloma Deya Tortella and Sandro Brusco (2001) examined that Economic
Value Added (EVA) is a widely adopted technique for the measurement of value
creation. Using different event study methodologies they test the market reaction to the
introduction of EVA. Additionally, they analyze the long-run evolution before and after
EVA adoption of profitability, investment and cash flow variables. They first show that
the introduction of EVA does not generate significant abnormal returns, either positive or
negative. Next, they show that firms adopt EVA after a long period of bad performance,
and performance indicators improve only in the long run. With respect to the firm
53
investment activity variables, the adoption of EVA provides incentives for the managers
to increase firm investment activity, and this appears to be linked to higher levels of debt.
Finally, they observe that EVA adoption affects positively and significantly cash flow
measures.
2.2 Andrew Worthington and Tracey West (2003) noticed that with increasing
pressure on firms to deliver shareholder value, there has been a renewed emphasis on
devising measures of corporate financial performance and incentive compensation plans
that encourage managers to increase shareholder wealth. One professedly recent
innovation in the field of internal and external performance measurement is a trade-
marked variant of residual income known as economic value-added (EVA). This paper
attempts to provide a synoptic survey of EVA’s conceptual underpinnings and the
comparatively few empirical analyses of value-added performance measures. Special
attention is given to the GAAP-related accounting adjustments involved in EVA-type
calculations.
2.3 Roztocki, N. and Needy, K. L. (1999) this paper examines introducing Economic
Value Added as a performance measure for small companies. Advantages and
disadvantages of using Economic Value Added as a primary measure of performance as
opposed to sales, revenues, earnings, operating profit, profit after tax, and profit margin
are investigated. The Economic Value Added calculation using data from a company’s
income and balance sheet statements is illustrated. Necessary adjustments to these
financial statements, that are typical for a small company, are demonstrated to prepare the
data for the Economic Value Added determination. Finally, potential improvement
opportunities resulting from Economic Value Added implementation as a performance
measure in small manufacturing companies is discussed.
2.4 M Geyser & IE Liebenbergn (2003) examines long-term shareholder wealth is
equally important for all profit seeking organizations, regardless of their size. This paper
examines introducing Economic Value Added (EVA) as a performance measure for
agribusinesses and co-ops in South Africa. EVA is an effective measure of the
quality of managerial decisions as well as a reliable indicator of an enterprise’s
54
value growth in future. The question posed is whether South African agribusinesses and
cooperatives are capable of creating shareholder and member value after the deregulation
of the agricultural markets.
2.5 Linda M. Lovata and Michael L.Costigan (2002) found that Economic Value
Added is a new measure of performance that is purported to better align managers’
incentives to that of the shareholders. Accordingly, firms that experience higher agency
conflicts should be more inclined to use this performance evaluation system.
Additionally, the organizational strategy of the firm should influence the likelihood of
employing EVA. Prospector firms are defined as firms that apply a differentiation
strategy while defender firms focus on being cost-leaders. Firms identified as prospectors
should be less likely to use EVA. One hundred and fifteen firms were identified as being
adopters of EVA. Logistic regression was performed to contrast these firms to a control
group of 1271 non-adopters. The results indicate that firms using EVA exhibit a higher
percentage of institutional ownership and a lower percentage of insider ownership than
non-adopters. Prospector firms as defined by a higher ratio of research and development
to sales tend to use EVA less than defender firms. Accounting adjustments are a focal
point of the EVA formulation and the results presented in this study suggest that
providing appropriate incentives may be more complex than the developers of EVA
imply.
2.6 Financial Management Department ;University of Pretoria (2003) studied that
several researchers and practitioners, notably Stern Stewart Consulting Company and
Associates, have claimed that economic value added (EVA) is superior to traditional
accounting measures in driving shareholder value. Other researchers have refuted these
claims by supplying data in support of traditional accounting indicators such as earnings
per share (EPS), dividends per share (DPS), return on assets (ROA) and return on
equity (ROE). This study endeavored to analyses the results of companies listed on the
JSE Securities Exchange South Africa, using market value added (MVA) as a proxy for
shareholder value. The findings do not support the purported superiority of EVA. The
results suggest stronger relationships between MVA and cash flow from operations. The
study also found very little correlation between MVA and EPS, or between MVA and
55
DPS, concluding that the credibility of share valuations based on earnings or
dividends must be questioned
2.7 Raghunatha Reddy (2008) examined that for the past two decades many countries
started transforming their economies from traditional protected ones to those of more
liberalized, globalize and market driven. This period has also seen the economies
becoming more knowledge oriented and Human Resources started assuming more
prominence in the growth of the economies and businesses posing a greater challenge for
companies to acquire and retain talented workforce (especially at the strategic &
managerial levels). The knowledge economy also started witnessing the rapid rise of the
agency problem- conflict of interest between managers and owners. So it is very essential
to align the interests of the mangers and shareholders or at least reduce the difference
between them. In this regard Economic Value Added has been seen as better alternative
to the stock price and traditional performance measures. While successful EVA stories in
the west are quite encouraging, Corporate India is slowly catching up the EVA adoption.
Although not a panacea, EVA based compensation plans will drive managers employ a
firm's assets more productively and EVA should help reduce the difference in the
interests of the managers and shareholders, if not perfectly align them.
2.8 Girotra, Arvind; Yadav, Surendra S (2001) noted that with increased competition
and greater awareness among investors, new and innovative ways of measuring corporate
performance are being developed. New tools/techniques provide flexibility to managers
in their functions, be it in terms of operational aspects or evaluation parameters.
Economic Value Added (EVA) is one such innovation. Besides the measures like Return
on Equity (ROE), Return on Net Worth (RONW), Return on Capital Employed (ROCE)
and Earnings per Share (EPS), EVA is a new measure available to the corporate
managers
2.9 Michael F. Shivey and Jeffery J. McMillan (2002) This paper first provides an
overview of the standard asset ; market and income valuation methods that are used to
estimate the value of small businesses. It then discusses economic value added (EVA)
and demonstrates its potential use inn the valuation of small business.
56
2.10 Gary C. Biddle, Robert M. Bowen, James S. Wallace (1998) Traces the growth in
the use of economic value added (EVA, previously known as (residual income) and uses
two previous research studies to assess some claims for its merits. Compares EVA’s
ability to explain stock returns with that of earnings before extraordinary items (EBEI)
and cash flow using 1984-1993 US data; and finds EBEI is most closely related.
Examines EVA’s incentive effects on management investing, financing and operating
decisions and shows that, although EVA users decreased new investment, increased
dispositions of assets, increased share repurchases, used assets more intensively and
increased residual income, market reactions to this were weak. Suggests possible reasons
for this and concludes that EVA may align management incentives with shareholders’
interests but this does not necessarily increase shareholder value.
2.11 Samuel C.Weaver (2001) analyzed that over the past decade, consultants, the
popular business press, a number of companies and a few investment analysts have
heralded Economic Value Added (EVA). In theory, EVA is net operating profit after tax
(NOPAT) less a capital charge for the invested capital (IC) employed in the business.
This survey bridges the gap between "theory" and "practice" by detailing how EVA
proponents measure EVA. This survey is important because its fieldwork identifies
significant inconsistencies in the measurement of EVA and its major components
2.12 Storrie & Sinclair (1997) present that EVA based on historical values can be
somewhat misleading. They first demonstrate that the valuation formula of EVA is
theoretically exactly the same as the valuation formula of discounted cash flow (DCF)
(Proved also by Kappi 1996). After that Storrie & Sinclair also prove mathematically that
this equivalence is due to the fact that the book value in EVA valuation formula is
irrelevant in determining value. That is because an increase in "book value of equity"
decreases the periodic EVA-figures ("present value of future EVA") and these changes
cancel each other out.
2.13 Stewart, (1991) explained that by explicitly assigning a cost of equity capital and
removing the distortions of accounting conventions, EVA allegedly better measures the
wealth that a firm has created during a period than does traditional accounting earnings.
57
In other words, EVA allows investors to evaluate whether the return being earned on
invested capital exceeds its cost as measured by the return from alternative capital uses.
Since wealth (or value or return) created is a primary concern to investors, proponents
claim that EVA® is the only measure that ties directly to the intrinsic value of a
company’s stock As mentioned earlier, all anecdotal EVA stories allude to this as the
primary advantage of adopting EVA.
2.14 Weissenreider (1998) criticized EVA because it is based on accounting items only.
He opined that financial managers might be compelled to act on information that is
accounting in disguise and might have serious consequences. Weissenreider (1998)
compared EVA with Cash Value Added (CVA) and concluded that the latter is a better
performance measure.
2.15 Tully, (1993) In contrast, in this paper EVA has been hailed as the most recent and
exciting innovative measure of corporate performance that corrects both types of errors in
accounting earnings and that EVA should, therefore, replace earnings in both security
analysis and performance evaluation
2.16 Asish K Bhattachary and B.V. Phani (2004) this paper explains the concept of
Economic Value Added (EVA) that is gaining popularity in India. The paper examines
whether EVA is a superior performance measure both for corporate reporting and for
internal governance. It relied on empirical studies in U.S.A. and other advance
economies. It concluded that though EVA does not provide additional information to
investors, it can be adapted as a corporate philosophy for motivating and educating
employees to differentiate between value creating and value destructing activities.
This would lead to direct all efforts in creating shareholder value. The paper brings to
attention the dangerous trend of reporting EVA casually that might mislead investors.
2.17 Mahfuzul Hoque and Mahmuda Akter (2004) this paper examines performance
measurement matters in today’s complex business arena irrespective of the type, nature,
and volume diversity in business. If the result of performance measurement goes wrong
due to the faulty or inaccurate selection of tool(s), then the total process will prove wrong
58
in due time. This paper evaluates Economic Value Added (EVA) as a smart and powerful
alternative to traditional performance measures like gross margin, percentage change in
sales, net margin etc. in a small manufacturing company perspective. Small
manufacturing companies are the focus of the study, as most of the people in such
companies believe that EVA is truly designed for large companies and the equation of
EVA cannot be applied in small companies due to the non-availability of required data.
This paper results in a typical model applicable to small manufacturing companies where
all adjustments and other technicalities are discussed with a real life example. Finally, the
possible advantages and opportunities of using EVA as a performance measurement tool
is discussed that may encourage the users/readers to incorporate EVA with their current
setup to reap the potential benefits from it.
59
Research
Methodology
Research Methodology
Research by the name itself means re-search i.e. to search again. The task of research is
to generate accurate information for the use of decision making. Research is a systematic
and objective process of gathering, recording and analyzing data for the aid of making
decisions relating to a particular problem.
3.1 Need and Focus of the Research
The study consists of three main chapters. The first discusses the general theory behind
EVA. This chapter presents the background and basic theory of EVA as well as main
60
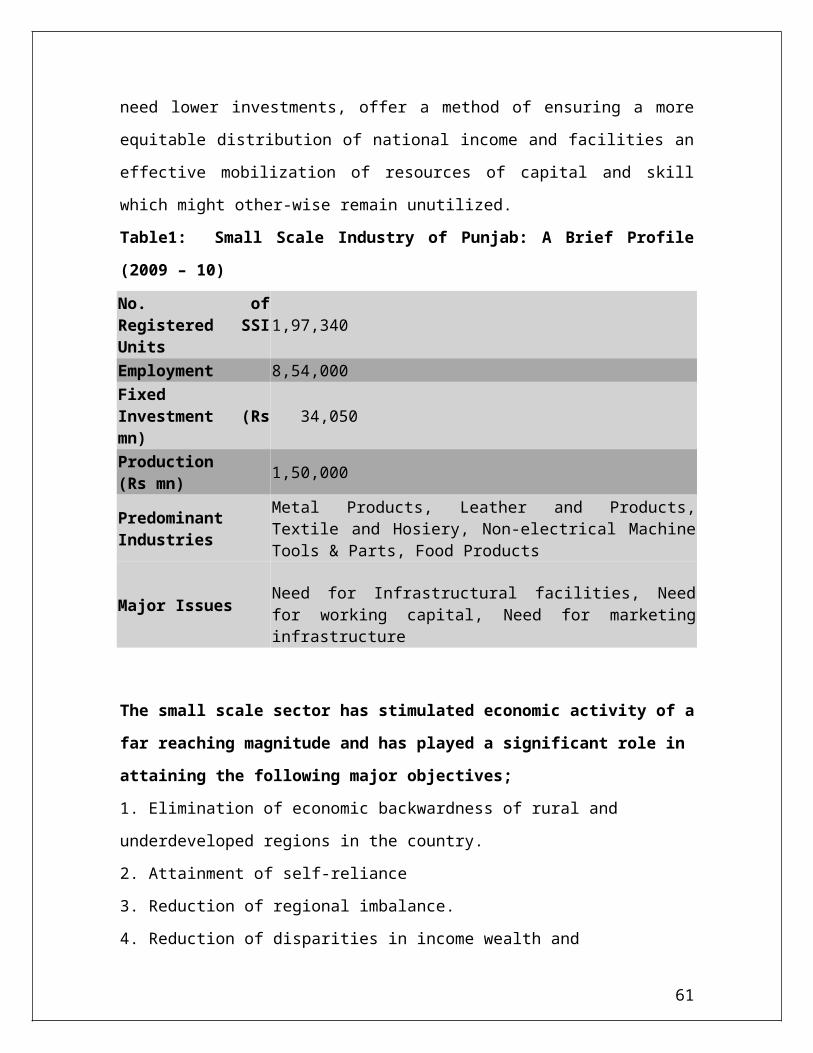
findings about EVA in financial literature. The chapter also explains in general what
EVA has to give to corporate world. This chapter also focuses on the use of EVA in
group-level controlling. It discusses how EVA could be defined in controlling and
reporting, how it can be used in any company as a financial performance tool and what
are the problems faced in implementing EVA. The second chapter consists of review of
literature mentioning findings of various research papers and various other studies
conducted on the use of EVA as a financial performance tool. Third and final main
chapter deals with EVA more practically inside and for this the case of SME has been
taken from Ludhiana city, Punjab. (Name of the firm has not been disclosed due to
ethical reasons just to hide their explicit identity). The chapter presents with numerical
example the calculation of EVA and its impacts as a financial performance tool.
3.2 Research design
The research design is a master plan specifying the method and procedures for
collecting and analyzing needed information. The research design in this project is
exploratory in nature. Secondary data was used in doing the study “Economic Value
Added (EVA) as a financial performance tool: A case of SME’s”
Sampling plan:
Sampling plan is an effective step in collection of different data from different sources
and has a great influence on the quality of results. Mainly secondary data i.e. Income
Statement and Balance Sheet of the firm was used in doing this study to develop an EVA
model for small manufacturing firms. The sampling plan includes the population, sample
size and sampling technique.
Population:
The study is aimed to include any SSI / SME from Punjab state.
Sample Size:
To conduct this study and to develop an EVA model a case of one small manufacturing
firm has been taken from Ludhiana; Punjab.
61

Sampling Technique:
The sample was drawn from the population using convenience sampling.
Data Sources:
Secondary data was used in doing the study which has been collected internally as
Income statement and Balance sheet of the firm and externally from published materials
like research papers and from the internet.
3.3 Data Analysis Technique
How to calculate EVA
The EVA is a measure of surplus value created on an investment. Here, surplus value
simply stands for the difference between return and cost of capital. In a small
manufacturing firm, the EVA model is modified, or more appropriately, simplified to
some extent. This simplification comes due to the less complexity of operation, non-
availability of required information and comparatively lower amount of financial
involvement. This proposed EVA model seeks six sequential steps to be followed
before getting a periodic EVA, i.e., to what extent the owners‘ equity or wealth
is changed (increased/decreased). These steps are outlined below followed by an
illustration with one of my sampled small manufacturing firm.
Step 1: Review the company‘s financial data
EVA is based on the financial data. Most of these data are available from the general-
purpose financial statement consisting of at least income statement and balance sheet.
Sometimes additional data from the notes to financial statements may also be required.
In most of the cases, the last two years information prove sufficient to get all the
required information to calculate EVA for any specific year. Income statement is used
to calculate net operating profit after tax (NOPAT) and balance sheet is used to identify
the capital invested in the business. Notes are used to find out the adjustments in
NOPAT and cost of capital (COC) invested.
62
Step 2: Identify the necessary adjustments require to be considered
The conventional GAAP income statement and balance sheet are required to be
adjusted to find out net operating profit and the true capital. Companies cannot replace
GAAP earnings with EVA in their public reporting, of course. The first departure from
GAAP accounting is to recognize the full COC (Cost of Capital). EVA also fixes the
problems with GAAP by converting accounting earnings to economic earnings and
accounting book value to economic book value, or capital. The result is a NOPAT figure
that gives a much truer picture of the economics of the business and a capital figure that
is far better measure of the funds contributed by shareholders and lenders. Stern Stewart
identified around 164 potential adjustments to GAAP and to internal accounting
treatments, all of which can improve the measure of operating profits and capital. Now
the question comes, to what extent it can be adjusted.
The “Basic EVA” is the unadjusted EVA quoted from the GAAP operating profits and
Balance sheet. “Disclosed EVA” is used by Stern Stewart in its published MVA/EVA
ranking and computed after a dozen standard adjustments to publicly available
accounting data. “True EVA”, is the accurate EVA after considering all relevant
adjustments to accounting data. However, our interest is at the “Tailored EVA”. Each
company must develop their tailored EVA definition, peculiar to its organizational
structure, business mix, strategy and accounting policies, i.e., one that optimally balances
the trade-off between the simplicity and precision.
Once the formula is set, it should be virtually immutable, serving as a sort of
constitutional definition of performance. According to John Shiely, The CEO of Briggs
and Stratton Corp, —Adopting EVA simply as a performance measurement metric, in
the absence of some ideas as to how you are going to create value, is not going to get you
anywhere“ (Kroll, 1997). The list of potential adjustments is too lengthy to detail here.
Some adjustments are necessary to avoid mixing operating and financial decisions,
others provide a long-term perspective, and some are needed to convert GAAP
63
accrual items to a cash-flow basis while others convert cash flow items to
additions to capital.
Step 3: Identify the company‘s capital structure
Because of the deficiency of GAAP in describing a company‘s real financial position
(Clinton and Chen, 1998), Stewart proposes up to 164 adjustments to regain the real
picture of a firm‘s financial performance (Stewart, 1991; Blair, 1997). These
adjustments are needed to eliminate financing distortions in a company‘s NOPAT and
capital (Stewart, 1991). Regarding adjustments, some accounting items such as costs for
research and product development, restructuring charges, and marketing outlays are
considered more as capital investments as opposed to expenses (Stewart, 1991).
A company‘s capital structure comprises all of the money invested in the company
either by the owner or by borrowing from outsiders formally. It is the proportions of debt
instruments and preferred and common stock on a company‘s balance sheet (Van Horne,
2002). Stewart (1990) defined capital to be total assets subtracted with non- interest
bearing liabilities in the beginning of the period. However, it can be computed by either
of the following methods:
Direct Method: By adding all interest bearing debts (both short and long term) to owner‘s equity.
Indirect Method: By subtracting all non- interest bearing liabilities from total assets.
Step 4: Determine the company‘s COC rate for the individual sources of capital in capital structure
Estimation of COC is a great challenge so far as EVA calculation for a company is
concerned. It becomes more complex when small companies are considered whose
sources of capital are unstructured and varied over the years. The cost of capital
depends primarily on the use of the funds, not the source (Ross et al, 2003). It depends
on so many factors like financial structures, business risks, current interest level,
investors expectation, macro economic variables, volatility of incomes and so on. It is
64
the minimum acceptable rate of return on new investment made by the firm from the
viewpoint of creditors and investors in the firms‘ securities (Schall and Haley, 1980).
Some financial management tools are available in this case to calculate the COC. A more
common and simple method is Weighted Average Cost of Capital (WACC)
(Copeland et al, 1996).
The overall COC is the weighted average of the costs of the various components of the
capital structure. WACC, though a good tool to compute accurate cost of capital, is less
useful for a small company. WACC includes both debt and equity part of financing. Each
element in the capital structure has an explicit, or opportunity, cost associated with it
(Block and Hirt, 2002). The cost of each component of the firm‘s capital, debt, preferred
stock, or common stock equity is the return that investors must forgo if they are to invest
in the firm‘s securities (Kolb and DeMong, 1988). Thus, the difficulty arises in both of
the cases. Cost of debt cannot be calculated because the debt instruments in this case are
not traded in the open market. It is measured by the interest rate, or yields, paid to
bondholders (Block and Hirt, 2002). Sometimes, these instruments have no developed
market. Again, cost of equity is also difficult to calculate due to the non- applicability of
the tools developed to this effect. For example, for large companies, the
Capital Asset Pricing Model (CAPM) is a common method in estimating the cost of
equity (Copeland et al, 1996). CAPM postulates that the cost of equity is equal to the
return on risk-free security plus a company‘s systematic risk, called beta, multiplied
by the market risk premium (Copeland et al, 1996). Risk premium is associated
with the specific risks of a given investment (Block and Hirt, 2002).
In our financial environment, even the betas for all large companies are not available. For
large publicly traded companies, betas are published regularly by services such as Value Line
(Reimann, 1988). For small companies, regression analysis may be used in order to
estimate their betas (Ross et al, 1999). The next obstacle is to get a proper value of
market risk premium. For large U.S. companies, the recommended market risk
premium is 5 to 6 percent (Copeland et al, 1996; Stewart, 1991). For publicly traded
65
small companies, the market risk premium is significantly higher with values around 14
percent (Ross et al, 1999). These rates are not absolute rather relative as these depend on
time, location, macro economic variables and some other factors. In our environment,
market risk is so volatile that the appropriate premium, demanded by the
owners against their investment, for even the large companies cannot be
accurately estimated. Even no company takes the responsibility to work in this area. For
a small company, it cannot be thought of in current eco-financial setup.
Dividend discount model is another popular model in this case where market price of a
share is equal to the present value of future streams of dividends (Khan and Jain, 1999).
This model presupposes that the company under consideration is matured and normal
growth one that I have assumed in my case. However, in this case also, the presence
of an active market for securities is a must, otherwise, the COC (Equity ) cannot
be determined which is the discount rate (ke) in the following simplified version
of Gordon‘s dividend capitalization model:
P = E (1-b) / ke – br
Where, P = Price of shares E = Earnings per share b = Retention ratio Ke = Capitalization rate/ COC (Equity) br = g = growth rate in i.e., rate of return on investment in an all-equity firm.
Considering all of the obstacles, we suggested a method derived from the WACC
estimation and the CAPM model which have been adapted to the needs of small
companies. We identify this rate as COC rate just to make a distinction between WACC
that is used for large companies with the modified WACC. The COC that is developed
here with the applicability option of small companies as considered here. The COC
replaces the formal WACC in the following way:
COC = COC (Debt) (Debt/(Debt + Equity)) (1-t) + COC(Equity) (Equity/(Debt +
Equity))
66
Where (t) represents the corporate tax rate and incorporated with the weight of debts only
as debt has the tax deductibility advantage.
Again, COC (Debt) can be estimated as follows:
COC (Debt) = Prime Rate + Bank Charges
Where, prime rate is the core rate (explicit rate) charged on loan and bank charges are
additional charges over the prime rate. Average bank charges in my study for small
manufacturing companies vary from one percent to two percent.
COC (Equity) can be estimated as follows:
COC (Equity) = Rf +RpWhere, Rf = Risk free rate Rp = Risk premium
Rf is the arbitrary rate of governmental treasury bill on which it is assumed that this
rate does not vary with the actions and reactions of the market factors. In contrast, Rp
reflects the risk resulting from the investment in the equity. The riskier the investment,
the higher would be the Rp . If the Rp is not higher, investors will not agree to invest
their funds in risky business. This table suggests various Rp ranges depending upon the
investment risk
RP Ranges Investment Risk
6 % and less Extremely low risk, established profitable company with extremely stable cash flows.
6 % - 12 % Low risk, established profitable company with relative low fluctuation in cash flow
12 % - 18 % Moderate risk, established profitable company with moderate fluctuation in cash flow
18 % and more High business risk
67
(Source: Narcyz Roztocki &Kim LaScola Needy; University of Pittsburgh; Department of Industrial
Engineering)
Step 5: Calculate the company‘s NOPAT
NOPAT is derived from NOP simply by deducting calculated taxes from NOP i.e.,
NOPAT = NOP (1- Tax rate). These calculated taxes do not correspond the taxes
actually paid because e.g. interest on debt decreases real taxes. The tax shield of debt is
however taken into account with the capital costs. NOPAT is a measure of a company‘s
cash generation capability from recurring business activities, while disregarding its
capital structure (Dierks and Patel, 1997).
Most of the needed adjustments, to convert the accounting profit to economic profit as
identified in step 2, are appropriate for large companies. On the other hand, small
companies have some peculiar adjustments that are not required in case of large
companies. For example, some researchers observed that an owner-manager‘s salary in
a small business represents a much larger fraction of revenues than that in a large
company (Welsh and White, 1981). It may imply that in a small business owner-
manager‘s salary is not only salary but it also includes a charge for the capital that they
invested in the company. To remove this distortion, an adjustment is needed with the
accounting profit to find out the economic profit. Thus, here NOPAT can be calculated
as follows:
NOPAT = Net Profit after tax + Total Adjustments – Tax Savings on investments
Step 6: Calculation of Economic Value Added
At last, the EVA can be calculated by subtracting capital charges from NOPAT
as follows (Stewart, 1991; Reimann, 1988):
EVA = NOPAT - Capital Charges
68
= NOPAT - C COC
Where, C and COC include all types of capital proportionately.
Positive EVA indicates value creation while negative EVA indicates value destruction for
the company‘s owners.
Analysis
69
&
Discussion
Analysis & Discussion
4.1 The EVA and its status in India
In India, most of the companies use traditional measures. Even, they do not use it to
evaluate internally. It seems to be that people are reluctant to accept new but strong tool.
In our environment, people are very much cautious to abide by the legal
requirements. Disclosure is strictly governed by the legal framework and people always
want to avoid voluntary disclosure. In terms of efficiency, our market is in weak form.
Therefore, large companies, whether public or private, do not feel that they should
incorporate tools like EVA in their present setup. However, in a large company
70
perspective, it is simple to calculate EVA, as the required information is very simple to
find or compute. It is a matter of time and intention only for the calculation and
disclosure of EVA’s so far as large companies are concerned. Nevertheless, the
necessary data for calculating EVA is not available for small companies. That is why;
I focus on small manufacturing companies here where performance evaluation is of
paramount importance.
4.2 Empirical illustration
To propose EVA calculation for small manufacturing firms, as a realistic example, I have
used data from one of the sample firm of Ludhiana city. This firm is managed by three
owner-managers and has approximately 20 employees working in a firm. The company‘s
line of business is manufacturing of cotton, woolen and acrylic fabrics for the local user
groups with a vision to extend the market over the boundary in near future. As per my
commitment, I will refer to this company as — XYZ firm throughout the paper just
to hide their explicit identity. The financial data are simplified for the readers just to turn
their attention towards the process rather than on accounting details.
Step 1: Review the company‘s financial data
To assemble necessary financial information, I just collected their income statement,
Balance sheet and notes to the accounts. These are sufficient for all required information
for my study. Table 2 shows the income statements for the years 2009 and 2010 and
Table 3 shows the balance sheet for three consecutive years in a simplified way.
Table 2: XYZ‘s Income statement for the years 2009 and 2010 (in lac Rupees)
Particulars 2009 2010
1.0 Sales Revenues (Less return, VAT etc.) 193.19 271.17
1.1 Cost of Goods Sold 163.71 236.30
1.2 Gross Profit (1.0-1.1) 29.48 34.87
1.3 General and Administration Expenses 14.24 15.64
1.4 Selling Expenses 1.86 2.12
1.5 Total Administration & Selling Exp. (1.3 + 1.4) 16.10 17.76
71
1.6 Operating Profit (Loss) (1.2 - 1.5) 13.38 17.11
1.7 Other Income __ __
1.8 Other Expenses 0.25 0.42
1.9 Financial Expenses (Interest) 1.44 2.47
2.0 Net Profit (Loss) before tax (1.6 + 1.7 -1.8 – 1.9) 11.69 14.22
2.1 Taxes (31.10%) 3.64 4.42
2.2 Net Profit (Loss) after tax (2 - 2.1) 8.05 9.80
Step 2: Identify the necessary adjustments requires to be considered
Now, after assembling all necessary financial information, the next step necessitates to
identify all required adjustments to be considered. In case of XYZ firm, I do not find any
documentation of cost related to research and development, extension of current
facilities, employee training, unusual write-offs or gains and thus adjustments are
insignificant. One adjustment is needed in net profit for interest expense and
tax shield. These adjustments are needed to find out the true NOPAT. Because, NOPAT
is a measure of a company‘s cash generation ability from recurring business activities
(Dierks and Patel, 1997).
Step 3: Identify the company‘s capital structure
Capital structure includes all forms of financing whether generated internally or by
borrowing externally. It can be estimated under each of the two methods as identified
earlier. In case of direct method (financing approach), all interest-bearing debts (both
short and long term) are added to owner‘s equity to find out the total amount of capital
invested.
On the other hand, in case of indirect method (operating approach), all non- interest
bearing debts like accounts payable, sundry creditors, accrued expenses are
subtracted from the total liabilities to calculate the total capital invested in the business.
Tables 4 represent the amount of capital invested by XYZ firm under indirect method
respectively.
72
Table 3: XYZ’s Balance Sheet for the years 2009 and 2010 (in lac Rupees)
Liabilities 2008 2009 2010 Assets 2008 2009 2010
Current Liabilities: Current Assets:2.0 Accounts payable/
Sundry Creditors6.61 11.76 16.89. 3.2 Cash in hand 0.26 0.39 0.47
2.1 Secured loan/Bank loan
2.25 5.40 15.91 3.3 Accounts Receivable 8.64 16.31 27.54
2.2 Accrued Expenses 0.35 0.67 0.75 3.4 Inventory/Stock 10.55 17.83 27.81
2.3 Other Current Liabilities 0.17 0.26 0.39 3.5 Prepaid Expenses 0.06 0.08 0.12
2.4 Total Current
Liabilities
(2.0 to 2.3)
9.38 18.09 33.94 3.6 Other Current Assets 0.28 0.37 0.54
Non-Current Liabilities: 3.7 Total Current
Assets
(3.2 to 3.6)
19.79 34.98 56.48
2.5 Long Term Loan 3.10 6.15 4.45 Fixed Assets:
2.6 Unsecured loans 6.37 8.81 10.85 3.8 Land &Building (net of dep.)
4.78 7.89 8.91
2.7 Total Non Current
liabilities
(2.5 to 2.6)
9.47 14.96 15.30 3.9 Plant and Machinery(net of dep.)
3.88 6.54 7.25
2.8 Total Liabilities
(2.4 + 2.7)
18.8
5
33.05 49.24 4.0 Furniture and Fixtures(net of dep.)
0..29 0.42 0.54
Equity/Net Worth:
4.1 Other fixed Assets 0.17 0.49 1.76
2.9 Capital (Less Drawing) 10.1
7
17.41 25.97 4.2 Total Fixed
Assets
9.12 15.34 18.46
73
(3.8 to 4.1)
3.0 Less: Intangible Assets (i.e. Goodwill, patent etc.)
0.11 0.14 0.27
3.1 Tangible Net worth/equity(2.9 – 3.0)
10.0
6
17.27 25.70
Total Liabilities and equities(2.8 + 3.1)
28.9
1
50.32 74.94 Total Assets
(3.7 + 4.2)
28.91 50.32 74.94
Table 4: An estimation of the capital employed by XYZ firm under indirect method or operating approach (in lacs Rupees) Components of Capital 2009 2010
Total Liabilities 50.32 74.94
Accounts Payable/ SundryCreditors
(11.76) (16.89)
Accrued Expenses (0.67) (0.75)
Other current liabilities (0.26) (0.39)
Capital 37.63 56.91
In calculating the capital, I assumed the book value of the liabilities truly
represent the current market value. Furthermore, since the XYZ‘s equity and other debts
are not traded in a financial market, it is assumed that the values on the balance sheet are
74
good estimators of market values. Finally, no adjustment is made to convert the
accounting capital to financial capital just to keep the illustration simple and precise.
Step 4: Determine the company‘s COC rate for the individual sources of capital in capital structure
The COC rate has two parts. The prime rate for the cost of debt is 14% for this typical
firm and on an average, they have to pay other charges of 1% of the amount
borrowed. Thus, the pre-tax COC (Debt) will be 15% for the year 2010 if I put the values
in equation
. COC (Debt) = Prime Rate + Bank Charges
= 14 % + 1 % = 15 %
For the COC calculations, I have taken weighted average yield of 91days
government treasury bill rate (ranges between 6.50% - 7.50%) of 7.50% as a
proxy for risk free rate and according to my analysis; the company lies in average
risk area that requires 12% of risk premium. Having this information and equation,
COC (Equity) can be estimated as follows:
COC (Equity) = Rf +Rp = 7.50% + 12 % = 19.5% Where, Rf = Risk free rate Rp = Risk premium
The 19.5% cost of equity rate will be same for both of the years if the company will
remain in the same risky area over the years. As I got both cost of debt and cost of equity,
now I can calculate overall COC using capital structure as shown in Table 4 and
equation, as follows:
COC = COC (Debt) (Debt/(Debt + Equity)) (1-t) + COC(Equity) (Equity/(Debt + Equity))
In 2009,
COC = 9.03 %
75
In 2010,
COC = 8.64 %
Step 5: Calculate the company‘s NOPAT
As I have already identified the necessary adjustments of net operating profit in step
2, it becomes very simple here to compute adjusted NOPAT. In 2010, I have to adjust
NOPAT by the capital charge in interest expense with the tax shield. However, in
2009 also, I have to adjust the capital charge embedded interest expense with respective
tax shield, as the company had sufficient debt in their capital structure in the
specified year. Using equation, the NOPAT for the years will be as follows:
2009 2010
NOPAT = Net Profit after Tax + Total
Adjustments – Tax savings on adjustments
NOPAT = Net Profit after Tax + Total
Adjustments – Tax savings on adjustments
NOPAT = 8.05 + 1.44 – (1.44 .3110)
= 9.04
NOPAT = 9.80 + 2.47 – (2.47 .3110)
= 11.50
Step 6: Calculation of EVA
Finally, the XYZ’s EVA can be calculated by putting the values in equation as follows:
In 2009,
EVA = NOPAT – Capital Charges = NOPAT – C COC = 9.04 – 37.63 9.03 = 9.04 – 3.40
76
= 5.64
In 2010,
EVA = NOPAT – Capital Charges = NOPAT – C COC = 11.50 – 56.91 = 11.50 – 4.92 = 6.58
Thus, in both of the years, XYZ creates positive value for its owners amounting to
Rupees 5.64 lacs and Rupees 6.58 lacs in years 2009 and 2010 respectively. It
means that the actual wealth of the owners have increased by the amount of EVA.
4.3 Implications of findings
After the calculation of EVA, I met the owner-managers of the company and
explained the result to them. They showed their best interest with the EVA measure as
compared with their current measure of earning after interest and taxes (EAIT). They
were amazed with adding borrowed fund in their capital structure that helped them to get
tax advantage by way of reducing tax liability. Thus, they may add more wealth in the
year 2009 as compared with 2010 due to the presence of more debt in 2010. Moreover,
they found that EVA approach is consistent with the objectives of the business, which is,
wealth creation for the owners that was not prima facie considered in case of
traditional measures. The XYZ’s owner-managers assured me that they would
incorporate EVA measure very soon to evaluate performance and compare the changes
with the current measure. They agreed that EVA measure would help them to
utilize their financial resources more economically. Their reactions satisfied me and
encouraged me to conduct some vigorous study in the same field if demand arises to
develop the proposed model for small manufacturing companies with the new business
situation.
4.4 EVA Implementation by a Small Company
EVA calculation is just a starting point
77
Permanent EVA improvement has to be the main management objective
EVA has to be calculated periodically (at least every three months)
Changes in EVA have to be analyzed
EVA development is the basis for a company’s financial and business policy.
Compared to conventional measures, EVA is an epochal measure since it can be
maximized: it is the better the bigger EVA is. With traditional measures that is not
the case, since ROI can be increased with ignoring below average projects and
EPS/Operating Profit/Net profit can be increased simply investing more money in
the company
Since EVA helps the organization to realize that capital is a costly resource the
most immediate effect of EVA implementation is in most cases dramatic
improvement in capital efficiency (improved capital turnover)
4.5 Pitfalls of Traditional Performance Measurement
The maxim “what gets measured gets managed” does not only refer to shareowner
value. A review of businesses’ favorite financial performance measures – and their
pitfalls – shows that managers and executives should be very careful. While
business schools have been preaching valuation concepts for decades, earnings per
share and other traditional financial measures continue to rule supreme. However,
these metrics have many risks.
Overinvestment
Profit and profit margin measures often drive over-investment and vertical
integration because they overlook capital and its cost. Increasingly, different businesses
and business models consume varying levels of capital at varying costs. Managers are
often drawn to higher margin businesses that, on the surface, may seem more attractive.
For example, profits are often improved with newer production technology – but
they must be, to compensate for the higher levels of investment. Because
traditional financial measures ignore the returns that shareholders expect, any
corporate project with just a positive – but not necessarily an adequate – return above
78

zero can improve a manager’s margins, unit cost, profit and productivity measures.
However, such a project can also destroy value.
Overproduction
Traditional measures of unit cost, utilization and income frequently promote
troublesome over- production, particularly at the end of a year or quarter.
Producing to capacity rather than to demand often appears to reduce costs, yet doing so
can also raise the cost of invested capital. The bias toward over-production, despite
demand, is exacerbated by absorption accounting practices, which convert operating costs
into inventory. This practice gives the illusion of lower costs from the distorted
perspective of a cost per part, while creating operating burdens (e.g., uneven and
inflexible production) and vast quantities of unnecessary inventory. Foregone revenue is
endemic to this vicious circle, because heavy discounting and trade promotion are
needed to unload the extra product, often at the end of each quarter.
Service Economy
Traditional financial measures, being based on traditional business models, have not kept
up with the pace of change. New business models are often based on services,
outsourcing, partnerships and other innovative ways of doing business.Therefore,
traditional financial measures are inherently biased against the new service economy.
Their blunt nature is too simplistic, creating impediments to profitable growth in a world
where more and more service-oriented businesses are being designed around razor-thin
margins, but with low capital investment. Similarly, a bias against viable, long-term
investments and economic growth can result from a simplistic, near term income focus.
Poor Decisions
Traditional financial measures exclude the shareholders’ investment in the business; an
incomplete measure that ignores capital is entirely inappropriate to handle the many
79

business decisions that trade-off between profit margin and capital utilization (velocity).
Traditional financial measures confuse accounting anomalies with the underlying
economics of business. When tied to incentive compensation, this can lead to
dysfunctional behavior among managers and top executives alike.
Conclusion80
Conclusions
Creation of value for the owners is important in business, irrespective of the volume of
investment or type of operation. Moreover, in case of EVA measurement, companies,
whether large or small, have to earn more than capital charges if they want to add value
positively. Thus, in an EVA controlled world, everybody works to maximize the gap
between NOPAT and capital charges that will ultimately ensure both financial
efficiency and operational efficiency. Financial efficiency means the construction of
capital structure in such a way and from such sources that will ensure minimal capital
charges. On the other side, operational efficiency will ensure more NOPAT.
However, it is to some extent difficult to implement EVA in small manufacturing
companies, a tailored definition of EVA is required to be set on the specific type of
operation and the needs of the business. EVA is the most widely used value-based
performance measure (Myers, 1996) probably just because it happens to be an easier
81

concept compared to the others. In implementing EVA, one of the most important
things is to get the people in organizations to commit to EVA and thereby also
to understand EVA (Klinkerman, 1997). It may have some impurities in it. Nevertheless,
in future courses of time, the EVA model can be made error free. Once the employees
get motivated to maximize EVA, wealth creation becomes a regular phenomenon
in a business.
In this paper, I have tried to develop an EVA model for small manufacturing business
setup with considering all of their hindrances and technicalities. I was confronted with the
question, —Whether EVA can be used in small manufacturing companies as a tool to
measure performance? “Through this paper, I employed my best effort to give an answer
to the question. Whatever may be the size and nature of operation, EVA is suited with
some adjustments. In most cases, the additional effort in calculating EVA is outweighed
by the value of the additional information showing improvement opportunities
i.e. benefit is always greater than the cost of incorporating EVA as a new tool replacing
the traditional tools.
82
Suggestions
Suggestions
EVA is the only operating measure to account for the many income statement and
balance sheet trade-offs involved in creating value because of its simultaneously focuses
on both profit and capital. Donaldson Brown, Chief Financial Officer of General Motors,
wrote in 1924, “The objective of management is not necessarily the highest rate of return
on capital, but … to assure profit with each increment of volume that will at least equal
the economic cost of additional capital required.”
Management in a Small Company can improve EVA in the following ways:
Try to improve returns with no or with only minimal capital investments
Invest new capital only in projects, equipment, machines able to cover capital cost
while avoiding investments with low returns
Identify where capital employment can be reduced
Identify where the returns are below the capital cost; divest those investments
when improvements in returns are not feasible
83
EVA is an appropriate management tool for small business
Economic Value Added (EVA) is easy-to-calculate
Periodical EVA calculation and analysis can be done with minimal effort because
only few basic data have to be entered in a common spreadsheet
EVA calculation is a starting point for improvement in financial and business
policy
Scarce capital resources of a small company can be more efficiently allocated
using EVA than using intuition or traditional methods
EVA implementation in a small company will result in a better business
performance, because of better understanding the objectives (especially near the
floor/operating activities)
Bibliography
1. Stewart, G. B. (1991). The Quest for Value: A Guide for Senior Managers. New
York, NY: Harper Business.
2. Stewart, G. B. (1994, Summer). EVA: Fact and Fantasy. Journal of Applied
Corporate Finance,
3. Ross, S. A., Westerfield, R. W., & Jaffe, J.(1999). Corporate Finance. Irwin
McGraw- Hill.
4. Biddle G.C. Bowen R.M. and Wallace J.S. (1997) Does EVA Beat Earnings?
Evidence on Association with Stock Returns and firm values, Journal of
Accounting and Economics, 24, 301-336.
5. Copeland T., Koller T. and Murrin J. (1990) Valuation: Measuring and Managing
the Value of Companies, John Wiley & Sons Inc., New York.
6. Wallace, J. S., 1997, —Adopting residual income-based compensation plans:
Evidence of effects on management actions“, Working paper, University of
California, Irvine, CA.
84
7. Ho N. Hui N., and Li L. (2000) Does EVA Beat Earnings? Round 2: Evidence
from Internet Companies, Working Paper Series, University of New South Wales.
8. Shrieves R.E. and Wachowicz J.M. (2000) Free Cash Flow, Economic Value
Added, Net Present Value: A Reconciliation of Variations of Discounted Cash
Flow Valuation, Working Paper Series, and University of Tennessee.
9. Valez P.I. (2001) Value Creation and its Measurement: A Critical Look at EVA,
Working Paper Series, Universidad Javeriane, Columbia.
10. Weissenrieder F. (1998) Value Based Management: Economic Value Added or
Cash Value Added, Anelda AB,
11. Arvind Girotra Functional Consultant, ICICI Infotech Services, Mumbai
12. Surendra S. Yadav Dalrnia Chair Associate Professor Department of Management
Studies, IIT Delhi
13. Stern, J. M., Stewart, G. B., & Chew, D. H. (1989). Corporate Restructuring and
Executive Compensation. Cambridge, MA: Ballinger Publishing Company.
14. De Villiers, J., 1997, —The distortions of Economic Value Added“, Journal of
Economics and Business, Vol. 49, No. 3, May/June, pp. 285-300.
15. Dierks, P. A. and Patel, A., 1997, —What is EVA, and How Can It Help Your
Company?“, Management Accounting, Vol. 79, No. 5, November, pp. 52-58.
16. Fisher, A. B., 1995, —Creating Stockholder Wealth“, Fortune, Iss. 132, No. 12,
December, pp. 105-116.
17. Kappi, J., 1996, —Corporate valuation: A note“, Unpublished working
paper, Helsinki School of Economics and Business Administration, Helsinki.
18. Khan, M. Y. and Jain, P. K., 1999, Financial Management: Text and Problems,
Tata McGraw-Hill Publishing Company Limited, New Delhi.
19. Biddle G.C.ab Bowen R.M.a and Wallace J.S.c (1999) Evidence on EVA(TM)",
Working Paper Series, (a: University of Washington Business School, b:
Hongkong University of Science and Technology, c: University of California).
20. Roztochi, N. and Needy, K. L., 1998, —An Integrated Activity-Based
Costing and Economic Value Added System as an Engineering Management
85
Tool for Manufacturers“, Proceedings from the 1998 ASEM National
Conference, pp. 77-84.
21. Roztochi, N. and Needy, K. L., 1999, —EVA for Small Manufacturing
Companies“. Proceedings from the 1999 SAM International Management
Conference, The Society for Advancement of Management.
22. Schall, L. D. and Haley, C. W., 1980, Introduction to Financial Management,
McGraw-Hill Book Company.
23. Dodd, James L; Chen, Shimin; 1996, "EVA: A new panacea?", Business and
Economic Review, Vol 42; Jul-Sep 1996, p.26-28
24. Nuelle, Frances 1996. "The two faces of EVA". Chief executive.
January/February 1996. p.39
25. Storrie, Mark; Sinclair, David 1997, "Is EVATM equivalent to DCF?", CPS
Alcair Global Review, Volume III, Number V, Spring 1997, p.5-6
26. Tully, S (1999) "America's wealth creators". Fortune Nov 22, 1999 v140 n10
p275 (10).
86
Related Documents