Continental Shelf Research 23 (2003) 1635–1671 Eutrophication and some European waters of restricted exchange Paul Tett a, *, Linda Gilpin a , Harald Svendsen b , Carina P. Erlandsson c , Ulf Larsson d , Susanne Kratzer e , Eric Fouilland f , Carol Janzen g , Jae-Young Lee a , Christian Grenz h , Alice Newton i , Jo * ao Gomes Ferreira j , Teresa Fernandes a , Serge Scory k a School of Life Sciences, Napier University, Edinburgh EH10 5DT, UK b Geophysical Institute, University of Bergen, N-5007 and Norwegian Polar Institute, N-9296 Troms^, Norway c Department of Earth Sciences, G . oteborg University, SM-405 30 G . oteborg, Sweden d Department of Systems Ecology, Stockholm University, SE-106 91 Stockholm, Sweden e Department of Physical Geography and Quaternary Geology, Stockholm University, SE-106 91 Stockholm, Sweden f SAMS, Dunstaffnage Marine Laboratory, Dunbeg, Oban Argyll PA37 4QA, UK g School of Ocean Sciences, University of Wales, Bangor, Menai Bridge, Anglesey LL59 5EY, UK h Station Marine d’Endoume, UMR 6535 CNRS - LOB, rue Batterie des Lions, F13007 Marseille, France i IMAR - University of the Algarve, Campus de Gambelas, 8000-117 Faro, Portugal j IMAR - DCEA-FCT, Universidade Nova de Lisboa, Monte de Caparica 2825, Portugal k MUMM, Gulledelle 100, B-1200 Brussels, Belgium Received 5 July 2002; accepted 30 June 2003 Abstract Regions of Restricted Exchange (RREs) are an important feature of the European coastline. They are historically preferred sites for human settlement and aquaculture and their ecosystems, and consequent human use, may be at risk from eutrophication. The OAERRE project (EVK3-CT1999-0002) concerns ‘Oceanographic Applications to Eutrophication in Regions of Restricted Exchange’. It began in July 2000, and studies six sites. Four of these sites are fjords: Kongsfjorden (west coast of Spitzbergen); Gullmaren (Skagerrak coast of Sweden); Himmerfj . arden (Baltic coast of Sweden); and the Firth of Clyde (west coast of Scotland). Two are bays sheltered by sand bars: Golfe de Fos (French Mediterranean); and Ria Formosa (Portuguese Algarve). Together they exemplify a range of hydrographic and enrichment conditions. The project aims to understand the physical, biogeochemical and biological processes, and their interactions, that determine the trophic status of these coastal marine RRE through the development of simple screening models to define, predict and assess eutrophication. This paper introduces the sites and describes the component parts of a basic screening model and its application to each site using historical data. The model forms the starting point for the OAERRE project and views an RRE as a well-mixed box, exchanging with the sea at a daily rate E determined by physical processes, and converting nutrient to phytoplankton chlorophyll at a fixed yield q: It thus uses nutrient levels to estimate maximum biomass; these preliminary results are discussed in relation to objective criteria used to assess trophic status. The influence of factors such as grazing and vertical mixing on key parameters in the screening model are further studied using simulations of a complex ‘research’ model for the Firth of Clyde. The future ARTICLE IN PRESS *Corresponding author. Tel.: +44-131-455-2350; fax: +44-131-455-2291. E-mail address: [email protected] (P. Tett). 0278-4343/$ - see front matter r 2003 Published by Elsevier Ltd. doi:10.1016/j.csr.2003.06.013

Welcome message from author
This document is posted to help you gain knowledge. Please leave a comment to let me know what you think about it! Share it to your friends and learn new things together.
Transcript

ARTICLE IN PRESS
Continental Shelf Research 23 (2003) 1635–1671
*Correspondin
E-mail addre
0278-4343/$ - see
doi:10.1016/j.csr
Eutrophication and some European waters ofrestricted exchange
Paul Tetta,*, Linda Gilpina, Harald Svendsenb, Carina P. Erlandssonc,Ulf Larssond, Susanne Kratzere, Eric Fouillandf, Carol Janzeng, Jae-Young Leea,
Christian Grenzh, Alice Newtoni, Jo*ao Gomes Ferreiraj, Teresa Fernandesa,Serge Scoryk
aSchool of Life Sciences, Napier University, Edinburgh EH10 5DT, UKbGeophysical Institute, University of Bergen, N-5007 and Norwegian Polar Institute, N-9296 Troms^, Norway
cDepartment of Earth Sciences, G .oteborg University, SM-405 30 G .oteborg, SwedendDepartment of Systems Ecology, Stockholm University, SE-106 91 Stockholm, Sweden
eDepartment of Physical Geography and Quaternary Geology, Stockholm University, SE-106 91 Stockholm, SwedenfSAMS, Dunstaffnage Marine Laboratory, Dunbeg, Oban Argyll PA37 4QA, UK
gSchool of Ocean Sciences, University of Wales, Bangor, Menai Bridge, Anglesey LL59 5EY, UKhStation Marine d’Endoume, UMR 6535 CNRS - LOB, rue Batterie des Lions, F13007 Marseille, France
i IMAR - University of the Algarve, Campus de Gambelas, 8000-117 Faro, Portugalj IMAR - DCEA-FCT, Universidade Nova de Lisboa, Monte de Caparica 2825, Portugal
kMUMM, Gulledelle 100, B-1200 Brussels, Belgium
Received 5 July 2002; accepted 30 June 2003
Abstract
Regions of Restricted Exchange (RREs) are an important feature of the European coastline. They are historically
preferred sites for human settlement and aquaculture and their ecosystems, and consequent human use, may be at risk
from eutrophication. The OAERRE project (EVK3-CT1999-0002) concerns ‘Oceanographic Applications to
Eutrophication in Regions of Restricted Exchange’. It began in July 2000, and studies six sites. Four of these sites
are fjords: Kongsfjorden (west coast of Spitzbergen); Gullmaren (Skagerrak coast of Sweden); Himmerfj.arden (Baltic
coast of Sweden); and the Firth of Clyde (west coast of Scotland). Two are bays sheltered by sand bars: Golfe de Fos
(French Mediterranean); and Ria Formosa (Portuguese Algarve). Together they exemplify a range of hydrographic and
enrichment conditions. The project aims to understand the physical, biogeochemical and biological processes, and their
interactions, that determine the trophic status of these coastal marine RRE through the development of simple
screening models to define, predict and assess eutrophication. This paper introduces the sites and describes the
component parts of a basic screening model and its application to each site using historical data. The model forms the
starting point for the OAERRE project and views an RRE as a well-mixed box, exchanging with the sea at a daily rate
E determined by physical processes, and converting nutrient to phytoplankton chlorophyll at a fixed yield q: It thus usesnutrient levels to estimate maximum biomass; these preliminary results are discussed in relation to objective criteria
used to assess trophic status. The influence of factors such as grazing and vertical mixing on key parameters in the
screening model are further studied using simulations of a complex ‘research’ model for the Firth of Clyde. The future
g author. Tel.: +44-131-455-2350; fax: +44-131-455-2291.
ss: [email protected] (P. Tett).
front matter r 2003 Published by Elsevier Ltd.
.2003.06.013

ARTICLE IN PRESS
P. Tett et al. / Continental Shelf Research 23 (2003) 1635–16711636
development of screening models in general and within OAERRE in particular is discussed. In addition, the paper looks
ahead with a broad discussion of progress in the scientific understanding of eutrophication and the legal and socio-
economic issues that need to be taken into account in managing the trophic status of RREs.
r 2003 Published by Elsevier Ltd.
1. Introduction
Section 1.1 of this long paper introduces theconcept of eutrophication and the legislation towhich it is related. Section 2 outlines theOAERRE project which seeks to improve boththe understanding and prediction of eutrophica-tion in coastal regions of restricted exchange. Adescription of each of the six study sites is followedin Section 3 by an explanation of the componentsof a simple ‘screening’ model used to give apreliminary assessment of trophic status for eachsite. A more detailed ‘research’ model is then usedin Section 4 to give insight into some of the factorscontrolling key parameters in the simple model.This leads in Section 5 to a discussion of how toimprove the screening model and develop links tothe socio-economic impact of eutrophication andits amelioration.
1.1. Eutrophication and environmental protection
in regions of restricted exchange
The contents of fjords, lagoons and rias are cutoff from the normal circulation of coastal watersby enclosure on three sides, although there may begood exchange across the fourth side. SuchRegions of Restricted Exchange (RREs) are animportant feature of the European coastline, andthe lands surrounding them are preferred sites forhuman settlement, using their waters for fisheries,aquaculture, navigation and recreation. Theseactivities can lead to increased nutrient loadingand hence the risk of eutrophication, which isintensified by restricted water exchange.
Most states and localities have their own lawsand rules for protecting the environment withinregions of restricted exchange. These have usuallybeen drawn up to conform with a variety ofEuropean directives and other trans-nationalagreements. Those of particular importance inrelation to eutrophication include: the Urban
Waste Water Treatment Directive (UWWTD:C.E.C., 1991a); the Water Framework Directive(WFD: C.E.C., 2000); the Oslo and Paris Con-vention for the protection of the Marine Environ-ment of the North-East Atlantic (OSPAR);the Helsinki Convention (HELCOM) for theBaltic, and the Barcelona Convention for theMediterranean.
The UWWTD deals with the treatment thaturban waste water must receive before its dis-charge. Removal of organic matter is standard,but in the case of an eutrophic receiving water,treatment has to include additional stripping ofplant nutrients. Basic treatment is permitted in thecase of a ‘less sensitive’ water, defined as subject tohigh dispersion and hence not likely to be de-oxygenated or eutrophied.
The WFD provides a single system thatincorporates a variety of requirements for manage-ment of water status. In addition to specificprotection of certain habitats, drinking waterabstraction areas, and bathing waters, it requiresthat almost all waters have ‘good ecological status’and ‘good chemical status’ by 2015, with nodegradation being allowed if a water’s currentstatus is better than ‘good’. ‘Good ecologicalstatus’ is defined as having a biological communitythat closely resembles that to be expected were thewater body subject to minimal anthropogenicimpact. ‘Good chemical status’ requires compli-ance with all EU water quality standards forchemical substances.
The WFD extends to at least one nautical milebeyond the coastal baseline for biological qualityelements and 12 nautical miles for the physico-chemical quality elements (including nutrients). Sofar as eutrophication is concerned, OSPAR hasresponsibility for all north-east Atlantic and NorthSea waters beyond these limits, and is moving toharmonise its classification scheme with those ofthe WFD, by equating WFD ‘good’ and ‘high’ecological status with OSPAR’s ‘non-problem

ARTICLE IN PRESS
P. Tett et al. / Continental Shelf Research 23 (2003) 1635–1671 1637
area’ (OSPAR, 2001b). ‘‘The overall goal of theOSPAR Strategy to Combat Eutrophication is toreach by 2010 a healthy environment whereeutrophication does not occur’’, that is, to ensurethat all Convention waters fall into the ‘non-problem area’ category with respect to eutrophica-tion by this time.
Eutrophic conditions were defined in theUWWTD (C.E.C., 1991a) as involving:
enrichment of water by nutrients especiallycompounds of nitrogen and phosphorus, caus-ing an accelerated growth of algae and higherforms of plant life to produce an undesirabledisturbance to the balance of organisms and thequality of the water concerned.
Vollenweider (1992) has given a similar defini-tion in which the consequences of nutrient enrich-ment are enhanced primary production, leading, inserious cases, to visible algal blooms and algalscum. In contrast, Nixon (1995) considered onlythe first two elements (enrichment and acceleratedgrowth) of the UWWTD characterisation andargued for a ‘value-free’ definition of eutrophicconditions, based on the level of annual primaryproduction.
OSPAR (2001a) has proposed a set of assess-ment criteria covering: (i) degree of nutrientenrichment; (ii) direct effects of nutrient enrich-ment, including enhancement of phytoplanktonchlorophyll and of the abundance of indicatorspecies; (iii) indirect effects including oxygendepletion, changes/kills in zoobenthos, fish kills,and organic matter input to the sediment; and (iv)possible effects, including shellfish intoxication. Inthe case of freshwaters, an OECD scheme (OECD,1982) evaluates trophic status on the objectivebasis of measurements of water transparency andlevels of phosphorus and chlorophyll.
Eutrophic conditions are sometimes natural andlong-standing, as in the case of marine upwellingregions, and most ecologists would not considerthe ecosystems of such regions to be undesirablydisturbed. An European example is the CanaryCurrent upwelling region, where persistent upwel-ling of deep, nutrient-rich water supports highplanktonic production and a rich fishery (Bartonet al., 1998). In other cases, however, the eutrophic
state is a recent result of nutrient enrichment dueto human actions, and is associated with changesin water quality or the balance of organisms. Thecoastal waters of the southern North Sea providean example of such changes. Nutrient enrichmentof the inner part of the German Bight, inparticular, has been linked to a well documentedincrease of the proportion of flagellated phyto-plankton (Gillbricht, 1988) and has beenheld responsible for sea-bed deoxygenation(Gerlach, 1990).
2. The OAERRE project
2.1. Introduction
The OAERRE project concerns ‘OceanographicApplications to Eutrophication in Regions ofRestricted Exchange’. It aims to understand thephysical, biogeochemical and biological processes,and their interactions, involved in eutrophicationin regions of restricted exchange, especiallylagoons and fjords. Better knowledge of theseprocesses is needed to diagnose, predict andmanage the impact of anthropogenic nutrients onthe ecosystem health, and sustainable use, ofRREs. OAERRE uses oceanographic methods togain this knowledge and to use it in coupledphysical–biological models for RREs. The pro-ject’s final objective is to construct simplified‘screening’ models for the definition, assessmentand prediction of eutrophication, in collaborationwith end-users, and the use of these models toanalyse the costs and benefits of ameliorationscenarios.
OAERRE is a partnership amongst 12 institu-tions in Belgium, France, Norway, Portugal,Sweden and the UK, and commenced in July2000. It is substantially funded by the FrameworkV programme of the European Commission, andis part of the ELOISE cluster of projects. Itsefforts are focused on the sites listed in Table 1,and this paper makes a preliminary assessment ofthe trophic status of these sites. This allows us todemonstrate and discuss many of the issues raisedby the use of screening models in OAERRE.

ARTIC
LEIN
PRES
S
Table 1
OAERRE sites and their main features
Site—Local name Kongsfjorden Gullmaren Himmerfj.arden Firth of Clyde Golfe de Fos Ria Formosa
—English name Kings Bay Gullmar fjord Himmer fjord Fos gulf
Where (region or West Spitzbergen West Sweden East Sweden West Scotland South France South Portugal
nearest city) (G .oteborg) (Stockholm) (Glasgow) (Marseille) (Algarve)
Latitude and 79�N12�E 58�N11�E 59�N18�E 55�N05�W 43�N05�E 37�N08�W
Longitude
Source water �Greenland Sea Skagerrak/Kattegat Baltic Sea (low Irish Sea �Western �Atlantic—Bay of
(�oceanic) salinity) Mediterranean Cadiz
WFD ecoregion Norwegian Sea North Sea Baltic Sea Atlantic Ocean Mediterranean Sea Atlantic Ocean
Basin typea Broad fjord, deep Narrow fjord Microtidal 4-basin Broad fjord with Microtidal lagoon Lagoon with large
entrance with fjord, narrow except narrow fjords and intertidal
Krossfjorden outer basin polls
Main drivers of W, E DI DI, E E, W, T, DI W, E T
exchangeb
Annual range of �15 (Feb), 5 (Jul) 0 (winter) �2 (Feb), 16 (July) 2 (Feb), 12 (Sep) 8 (Feb), 24 (Jul) 12 (winter),
mean air temp. ð�CÞ 18 (summer) 25 (summer)
Min and max mean 20 (Jun), 40 (Sep) 53 (annual mean) 20 (Feb), 50 (Nov) 120 (annual mean, 15 (Jul), 87 (Oct) (53 annual mean,
precip. (mm/month) most in autumn) most in winter)
Ice cover variable, Feb–Apr Inner part, some Part–whole, Jan–Mar None None None
years, Feb–Mar
Land usec G H, U(T) H, F, U, T U, I, F, H U, I U(T), F
Water used F F, A, R R, N, F F, N, A, R A, N A, R
aBasin type: fjord is glacially overdeepened valley with entrance sill less than maximum depth of basin but sufficiently deep to allow 2-layer circulation (cf. ‘poll’, with
shallow sill); lagoon is coastal bay protected by a bar of transported sediment. A broad fjord is wider than the local Rossby radius.bCirculation drivers, in order of importance; key: DI = density-driven intermediate exchange and deep-water flushing; E=estuarine (freshwater-driven) superficial
circulation; T=tidal exchange; W=wind-driven (even dominated) exchange.cLand use, in order of importance; key: F = farming or silviculture involving fertilisation; G = glaciated and/or tundra; H = upland pasture or woodland without
intensive cultivation; I = industrial; U = urban (T = strong seasonal-tourism component).dWater use (by humans, in order of importance); key: A = aquaculture (for fin- or shell-fish); F = fisheries (for fin- or shell-fish); N = navigation route for large
vessels; R = recreation/tourism.
P.
Tett
eta
l./
Co
ntin
enta
lS
helf
Resea
rch2
3(
20
03
)1
63
5–
16
71
1638

ARTICLE IN PRESS
-10W-5W
0 5E 10E15E
20E
40N 40N
60N 60N
80N 80N
0 200 400
km
Firth of Clyde
Ria Formosa
Golfe de Fos
Gullmaren
Kongsfjorden
..
Him
mer
fjard
en
Fig. 1. Map showing location of OAERRE sites.
P. Tett et al. / Continental Shelf Research 23 (2003) 1635–1671 1639
For our purposes, a ‘Region of RestrictedExchange’ is defined as a water that is enclosedon three sides, so having restricted exchange withthe sea; and in which the ratio of daily freshwaterinflow to mean volume is less than 0.1. The secondpart of the definition excludes estuaries that arestrongly flushed as a direct result of riverdischarge. Although the first part specifies spatialrestriction of exchange, it does not require theexchange to be small.
2.2. Study sites: description
The OAERRE study sites (Fig. 1) cover 42degrees of latitude, from Kongsfjorden at79�N12�E on the western side of the island ofSpitzbergen in the Svalbard archipelago, to theRia Formosa at 37�N8�W on the coast of theAlgarve near Faro in southern Portugal.
Three sites are directly exposed to ocean water.The source water of Kongsfjorden reaches thefjord across a 50 km wide continental shelf fromthe Greenland Sea (Svendsen et al., 2002).Sustained ice cover is the rule at this latitude, butbecause of the northwards flow of warm Atlanticwater in the West-Spitzbergen current, the off-shore waters are mostly free of ice. Inner parts ofthe fjord freeze over during late winter, and theclimate is sub-Arctic, mean air temperaturesexceeding 0�C for less than 4 months. The RiaFormosa is a shallow lagoon (Caetano et al.,2002), taking its salt water across a 20 kmcontinental shelf from the Gulf of Cadiz, a largebay of the Atlantic Ocean leading to the entranceto the Mediterranean Sea. The sea-water inflow tothe Golfe de Fos, a shallow bay at 43�N05�E nearMarseille in southern France (Grenz, 2002), comesfrom the Northern Mediterranean Current as itflows westwards across the Gulf of Lions in thewestern Mediterranean (Millot, 1991). Furthereast, the continental shelf is very narrowðo10 kmÞ but it broadens to 50 km offshore fromFos gulf. The climate of Provence and the Algarveis Mediterranean, with hot dry summers and rainfalling mainly during the winter.
The other three sites communicate with coastalseas. Himmerfj.arden, at 59�N18�E; near Stock-holm in Sweden, takes its inflow from the low-
salinity waters of the Baltic Sea (Larsson andKratzer, 2002), itself a giant fjord and prone towinter ice cover. Gullmaren, a fjord at 58�N11�E;north of G .oteborg in western Sweden (Erlandssonand Arneborg, 2002), opens into the Kattegat, thestrait communicating between the Baltic and theNorth Sea. The Firth of Clyde, a wide fjord at55�N05�W west of Glasgow in Scotland, has asea-water inflow derived mainly from the Irish Sea(Edwards et al., 1986). It is subject to a mild,damp, maritime climate, which contrasts with themore continental regime experienced in easternSweden, where the Himmer fjord regularly freezesover during winter. Gullmaren is intermediate,with partial ice cover during some winters.

ARTICLE IN PRESS
Table 2
Hydrographic and nutrient loading data for the OAERRE sites
Site: Kongs Gull Himmer Firth of Golfe de Ria
fjorden maren fj.arden Clyde Fos Formosa
Volumea 106 m3 40 000 2300 2850 100 000 336 88
Surface area km2 229 51 190 2500 42 58
Mean depth m 175 45 15 40 8 1.5
Maximum depth m 400 120 52 195 50 19
Max. entrance depth m 250 43 20 50 50 10
Freshwater inflow 106m3d�1 2.59 1.86 1.64 32.83 0.39 0.22
Freshwater rateb 10�6d�1 65 808 576 328 1160 2460
(astronomical) Tide Semidiurnal Semidiurnal Negligible Semidiurnal Negligible Semidiurnal
(mean) Tidal prism 106m3 240 13 5800 115
Tidal rateb 10�3d�1 12 11 116 2526
Total land-derived kmol d�1
nutrientc
N 0.5 157 515 3170 22 84
P 0.05 2.4 8.1 304.0 1.2 1.9
Si 108 1184 11
Nutrient/area kmol d�1
km�2
N 0.0 3.1 2.7 1.3 0.5 1.5
P 0.00 0.05 0.04 0.12 0.03 0.03
Si 2.1 0.5 0.3
Ratio to Golfe de
Fos
Volume 119 7 8 298 1 0.3
Mean depth 22 6 2 5 1 0.2
Freshwater rate 0.06 0.70 0.50 0.28 1.00 2.132
aVolumes, depths, areas, refer to mean sea-level and the entire basin (cf. Table 6).bFreshwater rate = daily freshwater inflow C volume; tidal rate = tides/day � tidal prism C volume.cDaily rate of input of nutrients from all sources, including rivers, direct, and atmosphere, except the sea.
P. Tett et al. / Continental Shelf Research 23 (2003) 1635–16711640
Freshwater inflow to the Kings fjord comesmainly from glacier melt, and is low in nutrients.The Gullmar and Himmer fjords, and the Firth ofClyde, receive river inflow enriched to moderateextent with agricultural and urban nutrients. TheFirth of Clyde and Himmer fjord also receive thedischarge of urban waste water with variousdegrees of treatment. The Fos gulf has an inputof water, moderately rich in nutrients, from theriver Rh #one. River discharges into the RiaFormosa are relatively small, but there are directinputs of urban waste water. The Ria Formosastands out from the other sites in that a large partof it is exposed to the air during each tidal cycle.
All the sites have a background of scientificstudy: Gullmaren, and the Firth of Clyde inparticular have been observed intermittently formuch of the 20th century; and the ecologicalimpact on the Himmer fjord of the discharge froma large sewage treatment plant has been studiedsince 1976 (Elmgren, 1997). Despite the consider-able work done at each site, there remain gaps,which OAERRE aims to fill. In addition, assem-bling knowledge in a form for proper comparisonis no trivial task, and needs to be informed bytheory such as that discussed later in this paper.Table 2 gives a preliminary comparison of somekey environmental features of the OAERRE sites

ARTICLE IN PRESS
P. Tett et al. / Continental Shelf Research 23 (2003) 1635–1671 1641
based on data available at the start of the project.Kongsfjorden, Gullmaren, Golfe de Fos and RiaFormosa are treated as single entities. The Firth ofClyde is made up of one large basin, called theArran deep, and smaller basins opening into itacross sills of various depths. One of these is the‘Inner Firth of Clyde’. The Himmer fjord alsocomprises several basins. In most parts of thefollowing text the several basins are aggregatedtogether, but they are treated separately whenconditions are obviously different, and in theapplication of models. In such cases a downstreambasin is assumed to receive all inputs to theupstream basin in addition to its own inputs,neglecting losses such as denitrification.
2.3. Criteria and preliminary assessment of
trophic status
Assessment of our sites must, therefore, dealwith two issues. Is a site objectively eutrophic inthat levels of certain water quality or ecologicalquality variables satisfy a defined condition? And,is a site subject to eutrophication in the sense ofthe C.E.C. definition which emphasises a pro-cess—we would argue, human-driven—culminat-ing in undesirable effects? Of course, these twoissues are not always separated. The undesirableeffects might be quantified by a variable that formspart of the objective assessment, or the precau-tionary principle might be invoked to argue thatthe existence of objectively defined eutrophicstatus should always be assumed to be undesirable.
In this paper we focus on the first issue and onwhat we call ‘objective’ measures of trophic status:bulk variables that apply unambiguously to theentire pelagic ecosystem. Matters relating toindicator species, known effects such as deoxy-genation and benthic changes, and arguable effectssuch as shellfish intoxication, require too muchqualification to be immediately useful here, butwill be touched on in the final discussion.
Table 3 gives some existing and proposedobjective categorisation schemes for trophic status.Those based on primary production use a measurethat is subject to both practical and interpreta-tional difficulties. The OECD categorisation offresh-waters cannot be applied as such to salt
waters, since nitrogen rather than phosphorus iswidely held to be the limiting nutrient in temperatecoastal seas (Ryther and Dunstan, 1971; Tayloret al., 1995; Downing et al., 1999; but cf.Soederstroem, 1996; Thingstad et al., 1998) andbecause of other differences between fresh and saltwaters (Hecky and Kilham, 1988). In general,static relationships between annual averages fornutrient loading and chlorophyll have beenestablished for freshwater (Dillon and Rigler,1974; Vollenweider, 1976; Schindler, 1977; Schind-ler et al., 1978) while nutrient–biomass relation-ships are more dynamic in the more highlydispersive marine environment. However, lakeswith rapid flushing are comparable to marinesystems in this respect (Foy, 1992). For thepresent, therefore, we use the EnvironmentalQuality Standards (EQSs) proposed by the UKCSTT (1994, 1997), which identify winter levels ofnutrient and summer levels of phytoplanktonchlorophyll as the measurement variables. Therelevant data for some of our sites are presented inTable 4. The UK EQSs may not be appropriate toall sites, and the proposal by OSPAR (2001a) touse thresholds based on 50% enhancement over‘background’ winter nutrient and growingseason chlorophyll concentrations, has some at-tractions. However, the concept of an objectivetrophic scale supports the present use of absoluteEQS.
According to the maximum summer chlorophylldata given in Table 4, Gullmaren and Golfe de Fosmay be considered eutrophic. However, thesemaximum values are occasional extremes, andtypical summer chlorophyll at these sites is belowthe CSTT EQS of 10 mg chl m�3: Taken as agroup, the OAERRE sites show little in the way ofconvincing relationships (Fig. 2) between typicalchlorophyll and nutrient loading. In the case of theHimmer fjord, however, a plot of spring maximumchlorophyll on winter maximum DIN (Fig. 3)shows a good relationship (Larsson and Kratzer,2002). The relationship emerges in part becausethe data set is large and extensive, based onobservations at 5 stations between 1977 and 1994.In addition, the slow flushing rate of the Himmerfjord may be expected to result in a bettercorrelation between sequential events whereas

ARTICLE IN PRESS
Table 3
Objective criteria for trophic status
Variable Threshold Units Reference Notes
(annual) Mean total > 35:0 mg l�1 OECD (1982) For freshwaters
phosphorus
(annual) Mean > 8:0 mg l�1
chlorophyll
Maximum chlorophyll > 25 mg l�1
(annual) Mean Secchi o3:0 m
depth
Minimum Secchi o1:5 m
depth
Winter DAINa > 12 mM CSTT (1994, 1997) For UK estuarine and coastal waters
Summer maximum chlorophyll > 10 mg l�1
Winter DIN and/or > 50% above OSPAR (2001) Background concs. are
DIPb background, with proposalc region- and salinity-specific
defaults of
DIN > 15 mMDIP > 0:8 mM
Winter N/P ratio > 25 : 1 at:at
Growing season > 50% above Background concs. are
chlorophyll background region-specific
Annual primary > 75 g C m�2 Rodhe (1969) ‘naturally eutrophic’
productiond yr�1 freshwaters
> 350 ‘Polluted’ freshwaters
Annual primary > 300 g C m�2 Nixon (1995) Sea
productiond yr�1
aDAIN= ‘dissolved available inorganic nitrogen’, effectively the same as the common usage of DIN and DTP.bDIN = ‘dissolved inorganic nitrogen’ (which ought to include dissolved nitrogen gas); DIP = dissolved inorganic phosphorus.cOnly selected, ‘bulk’, assessment parameters in OSPAR categories I and II are included.dThe papers cited imply that this is ‘net’ primary production.
P. Tett et al. / Continental Shelf Research 23 (2003) 1635–16711642
other sites are influenced by under-sampling andinherent patchiness.
3. A simple screening model for eutrophication
3.1. Introduction
The simplest models for eutrophication aim onlyto predict the value of an easily observed variablesuch as phytoplankton chlorophyll. We refer tothem as ‘screening models’, on the grounds thatthey can be used to screen sites for actual orpotential eutrophication. In addition, they provide
a conceptual framework for elaboration of thefactors controlling eutrophication.
The model presented in this section wasoriginally developed by the UK’s ‘ComprehensiveStudies Task Team’ (CSTT, 1994, 1997; Tett,2000) from a study of the yield of phytoplanktonchlorophyll from DAIN in sea-water. This study(Gowen and Ezzi, 1992; Gowen, 1994) wasdesigned to aid the prediction and managementof the effects of nutrient enrichment of sea-waterby aquaculture (GESAMP, 1996); the CSTT’sbrief arose from the need to define the ‘compre-hensive studies’ that are required to be carried outunder article 6 of the UWWTD to justify thedischarge of waste water after only primary

ARTICLE IN PRESS
Table 4
Nutrient and chlorophyll statistics for the OAERRE sites
Site Maximum winter nutrient Maximum phytoplankton
mM DAIN mM DAIP mM DSi Spring mg chl l�1 Summer mg chl l�1
Kongsfjorden 12 0.8 6 5 3
Gullmaren 10 0.9 13 25 20
Himmerfj.arden
(a) Outer 15 0.8 20 13 3
(b) Inner 28 1.0 25 21 5
Firth of Clyde
(a) Main basin 12 1.2 10 10 5
(b) Inner Firth 25 1.7 18 7 5
Golfe de Fos 25 2.0 25 22 10
Ria Formosa 38 1.5 35 2 2
DAIN = dissolved available inorganic nitrogen; the total of ammonium, nitrite and nitrate, also called DIN. DAIP = dissolved
available inorganic phosphorus; mainly phosphate, also called DIP. DSi = dissolved silica (silicate). Chlorophyll estimated by
standard survey methods involving organic extraction and spectrophotometric or fluorometric measurement including step to
distinguish pheopigment. Maximum values are typical greatest means for the superficial waters of the RRE basin during the relevant
season: ‘winter’ is the period before the Spring Bloom, ‘spring’ includes the first major bloom, and ‘summer’ includes early autumn.
Sources of data and details of subdivisions Kongsfjorden: Hop et al. (2002). Gullmaren: Lindahl (1987, 1994) and Svansson (1984).
Himmerfj.arden: Larsson and Kratzer (2002), Elmgren and Larsson (Eds.) (1997); (a) (outer) basin 1 (Sv.ardsfj.arden)—mostly station
H2; (b) proper (basins 2+3) + basin 4: mostly stations H4 and H5. Firth of Clyde: (a) Arran Deep, or main, basin: Jones et al. (1995);
(b) Inner Firth: Bock et al. (1999). Golfe de Fos: Benon et al. (1977), Folack (1986) and Arfi et al. (1990). Ria Formosa: nutrients are
upper 90%ile values from IMAR data base.
P. Tett et al. / Continental Shelf Research 23 (2003) 1635–1671 1643
treatment. The CSTT model treats RREs as well-mixed boxes (Fig. 4) of volume V m3: Allinteraction with the sea is described by a singleparameter, the daily fractional rate E at whichRRE contents are replaced by either salt or freshwater.
The CSTT model is a steady-state simplificationof a dynamic model. The latter’s key equations,which adapt the ‘Riley+’ model of Tett andWilson (2000) to RRE conditions, are:
ðchlorophyllÞdX
dt¼ ðm� LÞX � EðX � X0Þ
�F
VX0 mg chl m�3 d�1; ð1Þ
ðlimiting nutrientÞdS
dt¼ �
m � X
qþ e
L � X
q
� EðS � S0Þ þsi
Vmmol m�3 d�1;
where si ¼ F ðSf � S0Þ þ s0i: ð2Þ
The subscript 0 refers to the concentration ofnutrient S or phytoplankton chlorophyll X in the
sea outside the RRE and m is phytoplanktongrowth rate ðd�1Þ: L is phytoplankton loss rateðd�1Þ due to causes such as grazing by copepods orbenthic animals, phytoplankton sinking, or dis-ease, and e gives the fraction of the nutrientelement content of such lost material that isrecycled. A key parameter is q; the yield ofchlorophyll from assimilated nutrient (Gowenet al., 1992). The RRE is enriched by si moles ofnutrient per day from local sources, which includesfreshwater input at rate F ðm3 d�1Þ and nutrientconcentration Sf ; and other supplies s0i:
The fundamental assumption of the CSTT andthe dynamic model is that the box is uniform bothhorizontally and vertically. In fact, some spatialvariation can be tolerated so long as modelvariables and parameters are appropriately aver-aged, but in the case of a well-stratified system, E
and V apply to the upper waters only of the RRE.Eq. (2) can be solved for the equilibrium
enhanced concentration of nutrient in the RREin the absence of local consumption by phyto-plankton or phytobenthos, or losses (due e.g. to

ARTICLE IN PRESS
mean nitrogen loading, kmol N d-1 km-2
0.0 1.0 2.0 3.00.0
10.0
20.0
max
imum
sum
mer
mg
chl m
-3 KF
GF
FCRF
HF
GM
0.000 0.040 0.080 0.1200.0
10.0
20.0
mean phosphorus loading, kmol P d-1 km-2
KFRF
GF
GM
HF FC
0.0 10.0 20.0 30.0 40.00.0
10.0
20.0
30.0
max
imum
spr
ing
mg
chl m
-3
maximum winter DAIN, µM
GM
RF
FC
HF
GF
KF
yield = 1yield = 2
yield = 1/2
maximum winter DAIP, µM0.00 1.00 2.00 3.00 4.00
0.0
10.0
20.0
30.0
RF
GM
HF
FC
GF
KF
yield = 30 yield = 15 yield = 10
yield = 5
Fig. 2. Relationship between nutrient loading and phytoplankton chlorophyll statistics for the OAERRE sites.
P. Tett et al. / Continental Shelf Research 23 (2003) 1635–16711644
denitrification). It is
Seq ¼ S0 þ ðsi=ðEV ÞÞ mmol m�3: ð3Þ
This equation is similar to that of Gillibrand andTurrell (1997) who evaluated the effect of fish farmnutrients by comparing the Equilibrium Concen-tration Enhancement ðECE ¼ si=ðEV Þ with areference level. The CSTT model additionallyconsiders the worst outcome, in which all of thenutrient is converted to phytoplankton, resultingin a maximum chlorophyll concentration:
Xmax ¼ X0 þ qSeq mg chl m�3: ð4Þ
The calculation is made for DAIP as well asDAIN, and the lower of the resulting values ofXmax taken to define the maximum biomass andalso to indicate the limiting nutrient element. Thedefinitive value of Xmax can be compared with an
EQS, such as the CSTT’s threshold of10 mg chl m�3 in summer for eutrophic condi-tions. However, a complete conversion of nutrientinto chlorophyll can only occur if other factorsallow sufficient growth of phytoplankton. Highlosses, or lack of light for growth, might preventincrease. Thus, it is required that
mðIÞb L þ E 1� 1þF
V
� �X0
X
� �� �d�1
or : mðIÞXðL þ EÞ as X-Xmax with
XmaxbX0 ð5Þ
for the high biomass to be achieved. The light-controlled rate of phytoplankton growth is
mðIÞ ¼ aBðI � IcÞ d�1; ð6Þ

ARTICLE IN PRESS
loss L to zooplankton, deep water or benthos
Volume: V m3 Salinity: K kg m-3
Phytoplankton: X mg chl m-3
K0
S0
X0
inputs from land, rivers, discharge, airfreshwater: fi m dnutrient: si kmol d
Dissolved nutrient:S µM (or mmol m-3 )
))
conversion at yield q mg chl mmol
Exchange with sea
at relative rate E d
-1
-1
-1
-1
3
Fig. 4. Schematic of the CSTT’s simple model for eutrophication.
P. Tett et al. / Continental Shelf Research 23 (2003) 1635–1671 1645
where aB is effective photosynthetic efficiencyðd�1I�1Þ at low illumination. The variable I isPhotosynthetically Available Radiation (PAR)averaged over 24 h for a typical summer’s dayand also averaged from sea surface to sea-bed, orfrom surface to pycnocline if stratification exists.In principle, the PAR should be that under highbiomass conditions, because chlorophyll is itself astrong absorber of light. Finally, Ic is compensa-tion PAR, the illumination at which photosynth-esis and respiration are in balance when totalledover 24 h:
Eqs. (3)–(6) define the CSTT model and are(apart from minor changes in symbols) as given byCSTT (1994, 1997); however, the interpretation ofthe parameters, and the values assigned to them,have been improved since the original publica-tions. The next 5 subsections explore theseimprovements in the context of OAERRE sites.
Fig. 3. Relationship between nitrogen and trophogenic layer
properties in the Himmer fjord (Larsson and Kratzer, 2002)
based on data from 5 stations during 1977–1994. (After Larsson
(1997) with two more years of data added). (a) Maximal spring
chlorophyll a concentration as a function of maximum
inorganic nitrogen concentration in January/February, before
the start of the spring bloom. Data from stations with inorganic
N/P atom ratios above 22 in winter have been excluded. (b)
Annual mean chlorophyll a concentration as a function of total
nitrogen concentration. (c) Yearly mean Secchi depth as a
function of total nitrogen concentration.

ARTICLE IN PRESS
P. Tett et al. / Continental Shelf Research 23 (2003) 1635–16711646
3.2. Exchange
The exchange rate, E; is the instantaneousprobability that any small packet of water,containing salt, nutrients and phytoplankters, willbe lost from the RRE to the sea and replaced by apacket of the same volume but having a differentcontent of salt, nutrients and phytoplankters. Thereplacement may come either from the sea or fromriver discharge, rainfall, ice-melt, etc. The replace-ment probability is expressed as a daily rate afteraveraging over subdiel, especially tidal, fluctua-tions. The rate can be estimated in several ways,the best-known (Officer, 1976) involving conserva-tion of salt:
dð %CV Þdt
¼ ðEV � F ÞC0 � EV %C kg d�1; ð7Þ
where F is freshwater input ðm3 d�1Þ; %C is RREmean salinity, and C0 is external salinity. This hasa steady-state solution:
E ¼F
V
C0
C0 � %Cd�1 ð8Þ
and also allows the possibility of estimation fromtime-series of %C and F : Other empirical methodsinclude observing the dilution of an added tracer,constructing budgets for nutrients during seasonsof little phytoplankton growth, and measuringcurrents in the entrance to a RRE. Theoreticalmethods involve understanding and evaluating themain processes involved in exchange betweenRREs and the sea.
Exchange between the upper layers of Kongsf-jorden and the sea results from circulations drivenby local wind and freshwater (Svendsen et al.,2002). Both circulations have a strong lateralcomponent because the fjord’s width exceeds thelocal Rossby radius (which is small at 79�N). Thewind-driven circulation is highly variable, depend-ing on the wind strength and direction. In contrast,freshwater input from glacier melting occursthroughout the year, and so the freshwater-drivencirculation is persistent, although stronger insummer. Observations of drifters, acoustically-determined currents, and modelling, suggest aresidence time for the upper layers of 1–2 weeks.The intermediate and deep layers of Kongsfjorden
are largely isolated from surface flows by a strongpycnocline. These deeper waters exchange with thesea as a result of somewhat circular tidal flows aswell as external changes in water density relative tothe same depth inside the fjord.
The residence time of water above sill depth inGullmaren has been estimated as about 1 week,giving an exchange rate of 0:1 d�1 (Erlandsson andArneborg, 2002). Tidal flushing and freshwater-driven ‘estuarine’ circulation account for little ofthis exchange. The main parts are due to (i)fluctuations in density surfaces linked to changesin the Skagerrak-Kattegat channel, and (ii) wind,causing both local circulation and internal seiches.Erlandsson and Arneborg (2002) distinguish twomain layers in Gullmaren above sill depth: from 1to about 15 m is Kattegat water, and beneath this,from 15 to 50 m; is denser (saltier) Skagerrakwater. The depth of the interface between the twowaters responds to changes in conditions outsidethe fjord as well as to internal seiches. Every timethat the interface moves up, water is drawn intothe fjord below the interface, and pushed outabove it. When the interface moves down, super-ficial water is drawn in and deeper water is pushedout. Because the residual circulation in theSkagerrak-Kattegat channel removes expelledwater, the pumping from within Gullmaren resultsin effective exchange. Finally, the deepest water inGullmaren is also drawn from the Skagerrak, butis replaced only about once during most years.
Water exchange in the 4-basin Himmer fjord isprimarily driven by fresh-water inflow, which setsin motion an upper-layer estuarine circulation, andby density changes at the interface with the BalticSea, which drive an intermediate circulationleading to intermittent replacement of deep water(Engqvist, 1997; Larsson and Kratzer, 2002). Inthe outermost basin the intermediate circulation isroughly twice the estuarine circulation. Theyoungest water, 30 days old according to anumerical model, is found at 10 m depth, whereasthe age of surface and deep waters is, typically, 50days. In the innermost basin the surface water,with a mean age of 100 days, is youngest, the deepwater having an age of 150 days. The weakcirculation is a result of the relatively smallfreshwater input, and the presence of several sills.

ARTICLE IN PRESS
P. Tett et al. / Continental Shelf Research 23 (2003) 1635–1671 1647
The ages are the number of days since the waterleft the Baltic Sea outside the fjord.
The Firth of Clyde exhibits complex physicswith seasonal variability. Its Arran Deep basin isalmost always stratified due to a combination ofthermal and freshwater buoyancy inputs, withstrongest layering occurring during spring andsummer. Although tides are strong in the NorthChannel of the Irish Sea, much of the tidal energyis dissipated over the entrance sill (called the‘Great Plateau’ in Fig. 7) resulting in weak tides inthe Firth, and the establishment on the sill of astrong tidal mixing front separating the stratifiedArran Deep from the well-mixed North Channel.Tidal, estuarine and wind-driven circulations showlateral variations along the sill of this broad fjord,and the presence of the tidal mixing frontsuppresses the cross-sill exchanges between theArran Deep and the North Channel (Janzen et al.,2002). It is known that North Channel water canrenew Arran Deep bottom water when the NorthChannel water is sufficiently dense to sink beneaththe density front at the sill (Edwards et al., 1986;Rippeth, 1993). This renewal tends to occur in lateAutumn or Winter, when freshwater discharge andsolar heating are least, weakening vertical stratifi-cation in the Arran Deep and the tidal mixingfront. The front moves only about 3–4 kmbetween Neap and Spring tides (Kasai et al.,1999), which probably contributes little to ex-change when the front lies over the sill. However,non-tidal movements of the front, on the order of10 km; may bring it far enough into the Clyde toallow exchange between the mixed and stratifiedregimes during Spring and Summer. Wind forcingmight also contribute to cross-sill exchanges ofwaters (Midgely, 1998). Based on annual balancesof mass flux, the estimated average residence timeof water in the entire Firth of Clyde is 3–4 months(Midgely et al., 2001), at the upper end of theearlier estimate of ‘several months’ given byEdwards et al. (1986) and compatible withestimates of freshwater replacement times ofbetween 62 and 150 days by Muller et al. (1995).
The gulf of Fos is a shallow microtidal system(Grenz, 2002) flushed weakly by an estuarinecirculation driven by freshwater in the Rh #onecanal, and, intermittently but more strongly, by
wind-driven lateral circulation. Whereas the es-tuarine circulation might flush the gulf over aperiod of 20 days (Tett and Grenz, 1994), high-resolution 3-D model simulations suggest that thewind-driven circulation can replace water in theouter part of the gulf within a few days, and canisolate water of the inner part within a gyre (Ulses,2002).
The Ria Formosa is a coastal lagoon with alarge inter tidal zone, and 50–75% of the water inthe lagoon is exchanged each tide. Although it isan RRE according to our definition, waterresidence times are very short, except perhaps forwater in the inner parts of the drainage channels,and some interstitial water in intertidal sediments(Caetano et al., 2002).
This survey shows the variety of processesinvolved in water exchange between RREs andthe sea, and thus emphasises the empirical andbulk nature of the exchange rate parameter E:Table 6 includes estimates of typical values of E
for the upper layer at each of our sites, obtained bya variety of methods. The estimates will beimproved by the physical oceanographic studiescarried out during OAERRE.
3.3. Biological production and loss
The Riley+ model and its CSTT derivative tryto distil the essence of pelagic biological processesinto a few simple equations. Thus, light-controlledgrowth is described by Eq. (5) as the product of aconstant photosynthetic efficiency and the excessof mean PAR over a compensation PAR. Typi-cally, the relationship between photosynthesis ðpBÞand PAR ðIÞ is described by a curve (Jassby andPlatt, 1976; Lederman and Tett, 1981), but a linearrelationship is an acceptable approximation underlow-light conditions (Tett, 1990). Thus,
m ¼ pBm
Iffiffiffiffiffiffiffiffiffiffiffiffiffiffiffik2
I þ I2p � r becomes : m ¼ aBðI � IcÞ
where aB ¼pB
m
Ik
and Ic ¼r
aB;
r being respiration rate: ð9Þ
The photosynthetic efficiency parameter aB ismore fundamental than either the maximum

ARTICLE IN PRESS
P. Tett et al. / Continental Shelf Research 23 (2003) 1635–16711648
photosynthetic rate pBm or the ‘saturation’ irradi-
ance Ik; as the efficiency is directly related tothe quantum yield of photosynthesis and the(PAR) absorption cross-section of photosyntheticpigments.
As discussed elsewhere (Tett, 1990; Tett et al.,2002), the use of algal values (derived fromlaboratory measurements of single-species popula-tions) for the parameters in Eq. (9), leads to over-prediction of growth rate. In fact, some primaryproduction is rapidly lost due to predation of algalcells by protozoans and the mineralisation ofexcreted organic matter by pelagic bacteria. Suchmicrobial loop losses are distinguished from thoseto mesozooplankton and benthos in the micro-
plankton model (Tett, 1998) which is used as thetheoretical basis for the parameters in the CSTTmodel. In this model (Fig. 5), nitrogen andphosphorus are considered to be efficiently re-cycled within the microbial loop, whereas proto-zoan and bacterial respiration are deemed toaugment phytoplankton respiration. The micro-
sunlight
phytoplankton
chlorophyll
photosynthesis
bacteria
protozoa
respiration
Microplankton
grazing by
mesozooplankton
nutrientuptake
nutrientrecycling
Fig. 5. The microplankton box.
plankton is, thus, seen as consisting of a micro-heterotrophic component (eubacteria andprotozoa) and an autotrophic component (thephytoplankton) which are assumed to be in at leastshort-term balance with each other (see Tett andWilson, 2000). The effect of microheterotrophs inincreasing respiration, and in diverting nutrientelements from algae into protozoa or bacteria, isparameterised by means of the heterotroph frac-tion ðZÞ; the ratio of microheterotroph carbonbiomass to total microplankton biomass.
The microplankton model, and the presentversion of the CSTT model, assume that micro-plankton respiration increases with microplanktongrowth rate:
r ¼ r0 þ bm d�1 ð10Þ
but has no temperature dependence.The effective photosynthetic efficiency of Eq. (9)
must also take account of the ratio of algalchlorophyll to total microplankton (organic car-bon) biomass as well as the need to supportmicroheterotroph metabolism:
aB ¼amw1þ b
;
where microplankton chl : C
ratio is : w ¼ X qNa ðQ � qhZÞ: ð11Þ
Here, am is (maximum) autotroph photosyntheticefficiency per unit chlorophyll under nutrient-sufficient conditions, and Q is microplanktonnutrient content (mmol nutrient per mmolcarbon). The equation is solved for maxi-mum nutrient content, Qmax ¼ Qmax;að1� ZÞ þ qhZ;giving:
aB ¼am
X qNa Qmax;að1� ZÞ1þ b
d�1ðmE m�2 s�1Þ�1:
ð12Þ
The term qh referring to (constant) microhetero-troph nutrient element:carbon ratio, disappearsfrom the equation. Qmax;a is the maximum cellularcontent of the nutrient element, relative to carbon,in phytoplankton.
The value of the compensation irradiancemust take account of respiration losses by

ARTICLE IN PRESS
P. Tett et al. / Continental Shelf Research 23 (2003) 1635–1671 1649
microheterotrophs, and thus:
Ic ¼r0
aB
¼ðr0að1� ZÞ þ r0hZð1þ baÞÞ
aBmE m�2 s�1; ð13Þ
where the r0 terms refer to basal respiration (atzero growth) and the b term gives the rate ofincrease of respiration rate with growth. Sub-scripts a and h refer, respectively, to autotrophsand heterotrophs. See Tett (1998) and Tett et al.(2002).
One set of (biological) loss terms is thus builtinto the CSTT model, and depends in particularon the value chosen for the heterotroph fraction Z:The default value given in Table 5 is for typicalcoastal microplankton in summer, but can beimproved by microscopic analysis to give theabundance and size of the microplankton floraand fauna. The other set of losses is imposedexplicitly, through the external loss rate L inEq. (5). This rate is defined as the instantaneousprobability, expressed as a daily rate, that anymicroplankter will be eaten by multicellularplanktonic or benthic animals, or will sink fromthe euphotic zone. The consumers are assumed tobe unselective filter feeders, unable to distinguishbetween any component of the microplankton.Typical summer rates are of order 10�1 d�1 (e.g.Tett and Walne, 1995) but CSTT (1994, 1997)suggested that L should be taken as zero in theabsence of local data on grazers.
3.4. The yield of chlorophyll from nutrient
In a closed system, such as an algal batchculture, the uptake of limiting nutrient S from thewater leads to the formation of new algal cells andhence an increase in chlorophyll ðX Þ: Thus,
q ¼ �DX
DSmg chl ðmmol nutrientÞ�1: ð14Þ
Of course, the rate of synthesis of new chlorophylldepends on conditions, such as illumination andthe supply of substances that might be limiting forchlorophyll formation rather than for biomassincrease. Given constancy of such conditions, theyield q might be expected to be a constant. Itsvalue can be estimated from studies using algal
cultures (Caperon and Meyer, 1972; Tett et al.,1985; Zehr et al., 1988; Sakshaug et al., 1989; Sosikand Mitchell, 1991; Levasseur et al., 1993; Sosikand Mitchell, 1994). Such studies report a widerange of values of the ratio of chlorophyll tonitrogen without any clear overall pattern inrelation to cell size, growth rate or irradiance(below 300 mE m�2s�1). Ignoring a few values ofmore than 7 mg chl ðmmol NÞ�1; the median of128 values from the cited works was2:2 mg chl ðmmol NÞ�1; with quartile values of0.9 and 3:1 mg chl ðmmol NÞ�1: The pigment datawere obtained by ‘standard’ spectrophotometric orfluorometric methods, and thus overestimatechlorophyll a determined by precise chromato-graphic methods (Gowen et al., 1983; Mantouraet al., 1997). Nevertheless, they are appropriate fora model intended for comparison with observa-tions made by the same ‘standard’ methods.
Eq. (14) can also be used to estimate yield in thecase of the mixture of algae and microheterotrophsfound in natural microplankton. Gowen et al.(1992) re-examined data for a microcosm experi-ment carried out by Jones et al. (1978) andestimated yields of 2.1–3:0 mg chl ðmmol NÞ�1:More recent studies in microcosms reported byEdwards (2001) and Edwards et al. (this vol.)found consistent patterns, in which initial highyields averaging 1:8 mg chl ðmmol NÞ�1 werefollowed by lower values centering on1:1 mg chl ðmmol NÞ�1: The decrease may havebeen due to physiological changes in the algae(changing XqN
a ) or to diversion of nitrogen fromalgae to dissolved organic matter, bacteria, orprotozoa. In the second case, and ignoringpossible DON formation,
q ¼ X qNa ð1þ ðqhZ=Qað1� ZÞÞÞ�1mg chl ðmmol NÞ�1:
ð15Þ
In the sea, nitrogen might also be diverted intoanimals or detritus. In all cases, qpX qN
a :Although Hecky and Kilham (1988) pointed out
the difficulty of establishing clear relationshipsbetween nutrient loading and biomass, Gowenet al. (1992) were able to find chlorophyll-DAINrelationships in 38 out of 60 data sets examined forScottish west coastal waters, and these regressions

ARTICLE IN PRESS
Table 5
Variables and parameter values for the CSTT model
Symbol Value Units
Model variables
Seq Equilibrium nutrient concentration = S0 þ ðsi=ðEV ÞÞ mMXmax Potential maximum chlorophyll concentration ¼ X0 þ qSeq mg m�3
mðIÞ Microplankton relative growth rate as a function of PAR ¼ aBðI � IcÞ; applied
to mixed layer PAR I
d�1
Site-specific parameters
E Exchange rate between RRE and the sea d�1
L Loss rate of microplankton due to mesozooplankton and benthic grazing,sinking, etc. (default value)
0.1 d�1
si Total of nutrient input to the RRE from all sources except the sea kmol d�1
S0 Seawater (‘background’) nutrient concentration mMV Volume of RRE or of upper layer of RRE 106m3
X0 Seawater (‘background’) chlorophyll concentration mg m�3
Standard parameters
q Chlorophyll yield (from nitrogen) 1.1 mg chl ðmmol NÞ�1
Chlorophyll yield (from phosphorus) 30 mg chl ðmmol PÞ�1
aB Effective photosynthetic efficiency 0.006 d�1ðmE m�2s�1Þ�1
¼ amX qN
a Qmax;að1� ZÞ=ð1þ bÞIc Compensation irradiance 5 mE m�2s�1
¼ ðr0að1� ZÞ þ r0;hZð1þ baÞÞ=ðamwÞ
Used to calculate standard parameters
am Algal (chlorophyll-related), nutrient-replete, 0.042 mmol C ðmg chlÞ�1
photosynthetic efficiency d�1ðmE m�2s�1Þ�1
b Rate of increase of (microplankton) respiration with 1.4growth ¼ bað1þ bhZÞ þ bhZ
ba Rate of increase of (autotroph) respiration with growth 0.5bh Rate of increase of (heterotroph) respiration with growth 1.5Z ‘Heterotroph’ fraction = (microheterotroph carbon 0.4
biomass)/(total microplankton biomass)Qmax;a Maximum autotroph nitrogen content 0.20 mmol N ðmmol CÞ�1
X qNa
Autotroph chlorophyll:nitrogen ratio 3.0 mg chl ðmmol NÞ�1
r0;a Autotroph basal respiration (at zero growth) 0.05 d�1
r0;h Heterotroph basal respiration (at zero growth) 0.07 d�1
Submarine optics
I 24-hr mean PAR (m mixed layer) ¼ ð1� m0Þm1m2I01� e�Kdh
Kdh
� �mE m�2s�1
%I0 Typical summer sea-surface 24-hr mean solar radiation W m�2
m0 Sea albedo 0.06m1 Conversion from total solar energy to PAR photons 0:46� 4:15 mE J�1
m2 Fraction of surface PAR that is penetrating light 0.37h Thickness of mixed layer mKd Diffuse attenuation for PAR at chlorophyll EQS m�1
Kd;w þ m�1c a�PH XEQS
Kd;w Local diffuse attenuation without phytoplankton m�1
mc Mean cosine of downwelling photons 0.85
a�PH Absorption cross-section of coastal phytoplankton 0.016 m2 ðmg chlÞ�1
XEQS Chlorophyll concentration at threshold for eutrophic conditions 10 mg chl m�3
P. Tett et al. / Continental Shelf Research 23 (2003) 1635–16711650

ARTICLE IN PRESS
Table 6
Data for the CSTT model for the OAERRE sites
Kongs- Gull- Himmerfj.arden Firth of Clyde Golfe de Ria
fjorden maren (a), (b) (a), (b) Fos Formosa
V ð106m3Þ 4580 765 1900, 633 31800, 3130 336 88
E ðd�1Þ 0.1 0.10 0.025, 0.025 0.05, 0.14 0.05 2.1
siðNÞ ðkmol d�1Þ 0.5 157 100a, 266 1423a, 1747 21.5 84.3
siðPÞ ðkmol d�1Þ 0.05 2.36 1.77a, 3.54 136a, 168 1.24 1.86
S0ðNÞ ðmMÞ 2.5 0.02 0.1, 0.1 0.5, 1.0 0.05 0.05
S0ðPÞ ðmMÞ 0.5 0.02 0.05, 0.05 0.1, 0.2 0.05 0.05
X0 ðmg chl m�3Þ 1 4 2, 4 1, 2 0.1 0
cloud fraction 0.6 0.5 0.5 0.6 0.2 0.3
I0 ðmE m�2s�1Þb 410 490 530 500 680 650
Kd;w ðm�1Þ 0.08 0.12 0.12, 0.15 0.15, 0.30 0.05 0.50
Kd at EQS ðm�1Þ 0.27 0.31 0.31, 0.34 0.34, 0.49 0.24 0.69
h ðmÞ 20 15 15, 10 20, 20 8 1.5
I ðmE m�2s�1Þ 30.9 42.4 45.9, 62.7 29.6, 20.5 121.5 162.2
SeqðNÞ ðmMÞ 2.5 2.1 7.8, 16.9 2.5, 5.0 1.3 0.5
SeqðPÞ ðmMÞ 0.50 0.05 0.16, 0.27 0.29, 0.58 0.12 0.06
XmðNÞ ðmg chl m�3Þ 3.8 6.3 10.6, 22.6 3.7, 7.5 1.6 0.6
XmðPÞ ðmg chl m�3Þ 16.0 5.5 6.8, 12.2 9.7, 19.5 3.8 1.8
mðIÞ ðd�1Þ 0.16 0.22 0.25, 0.35 0.15, 0.09 0.70 0.94
mðIÞ=ðL þ EÞ 0.78 1.12 1.96, 2.77 0.98, 0.39 4.66 0.43
Eq N:P 5 41 48, 62 9, 9 11 8
N: ECE/Seq 0.0 1.0 1.0, 1.0 0:8; 0:8 1.0 0.9
P: ECE/Seq 0.0 0:6 0.7, 0.8 0.7, 0.7 0.6 0.2
Bold shows limiting nutrient. Himmerfj.arden: (a) (outer) basin 1 (Sv.ardsfj.arden); (b) proper (basins 2+3) + basin 4. Firth of Clyde:
(a) Arran Deep, or main, basin; (b) Inner Firth.a In these cases, the outer basin is deemed to receive all nutrients input to the inner basin, plus the given inputs to the outer basin.bAs given here, I0 has been calculated from surface irradiance by taking account of albedo and the conversion from Joules to PAR
photons.
P. Tett et al. / Continental Shelf Research 23 (2003) 1635–1671 1651
gave a median yield of 1:05 mg chl ðmmol NÞ�1
(with a wide range, from 0.25 to 4.4). The medianvalue was recommended by CSTT (1994, 1997) foruse in their model, and is supported by the recentwork by Edwards (2001). In the case of theHimmer fjord, Larsson and Kratzer (2002) reporta relationship (Fig. 3a) between maximum springchlorophyll concentration and maximum DAINbefore the spring bloom. Although the best fit wasfound with log-transformed variables, the slope ofthe log–log plot was close to 1, and re-interpretingthe data suggests a q value of about0:8 mg chl ðmmol NÞ�1:
In the case of fresh-waters, which mostly flushrather slowly compared with salt waters of similarsize, relationships between biomass and nutrient
loading are well established. For example, studiesof the Canadian experimental lakes (Schindler,1977) resulted in a relationship between meanannual chlorophyll concentration and mean an-nual total phosphorus, with a slope equivalent toabout 30 mg chl ðmmol PÞ�1:
In applying the CSTT model to OAERRE siteswe have used the CSTT value of1:1 mg chl ðmmol DAINÞ�1 for nitrogen, and avalue of 30 mg chl ðmmol DAIPÞ�1 for phos-phorus. It may be remarked that these yieldsimply a phytoplankton or microplankton atomicN:P ratio of 29:1, higher than the Redfield ratio of16:1. However, the nitrogen and phosphorus yieldsare not simultaneous, but apply each to the case oflimitation by the appropriate nutrient. Following a

ARTICLE IN PRESS
P. Tett et al. / Continental Shelf Research 23 (2003) 1635–16711652
‘threshold-limitation, internal nutrient’ model(Droop, 1983) suggests that the ratios of the Nand P yields should be somewhere between theRedfield ratio and the ratio of the ‘subsistencequota’ for each nutrient. The latter is at least 30:1(Tett et al., in press).
3.5. Sources and sinks of nutrients
The CSTT model distinguishes nutrients in thesea water outside the RRE, and described by theconcentration S0; from inputs of nutrients fromlocal point sources, land drainage, and the atmo-sphere, summarised by the flux term si: Althoughchanges in silicate availability may influence theratio of diatoms to other phytoplankton (Officerand Ryther, 1980; Justic et al., 1995), we deal hereonly with nitrogen and phosphorus and thelimitation of bulk biomass during summer. Thepotential hypernutrifying effect of local nutrientswas estimated by the Equilibrium ConcentrationEnhancement, ECE ¼ si=ðE � V Þ; and the contri-bution relative to sea-derived nutrients (Table 6)was estimated from the ratio of ECE to Seq:
In one case this ratio is low for both nitrogenand phosphorus. The input of terrestrial andatmospheric nutrients into Kongsfjorden is poorlyknown, but is probably low, with most nutrientscoming from the waters of the Greenland Sea orlocal recycling in deeper water. In all other casesthe local inputs from land and atmosphereprovided almost all nitrogen, and between 20%and 80% of phosphorus.
In the case of the three sites exchanging withshelf seas, their source water is enriched byanthropogenic nutrients, but summer concentra-tions are typically depleted due to phytoplanktongrowth. This is certainly true of the Baltic Sea(Wulff et al., 1994), providing the boundarycondition for the Himmer fjord. Gullmaren sourcewaters originate in the Baltic, by way of the BeltSea and Kattegat, and in the southern North Sea,by way of the Skagerrak. All these source watersare richer in nutrients than they were 40 years ago,but the rate of increase of N loading seems to havelevelled off, and P loadings are now decreasing(Hansen et al., 2001). The North Channel of theIrish Sea provides the source water for the Firth of
Clyde (Grantham and Tett, 1993), but there issome dispute about Irish Sea enrichment (Allenet al., 1998; Le Gall et al., 2000; Gowen et al.,2002). It may be that undisputed riverine dis-charges of anthropogenic N and P are offset byincreased denitrification and burial.
In the case of the Firth of Clyde, river input isenriched by nutrients leached from soil, agricultur-al wastes, and urban waste water (Haig, 1986). Inthe Himmer fjord, the direct discharge of urbanwaste water is of great importance; the authoritiesoperating the waste water plant have experimentedwith tertiary treatments giving a range of values ofthe N:P ratio in discharged water (Elmgren, 1997).The small rivers draining into the Himmer fjordcontribute about the same amount of nutrients asthe treatment plant; they are more enriched withphosphorus than with nitrogen. The main terres-trial source of nutrient input to the Gullmar fjordis discharge of the river .Orekil, with a littleadditional industrial and domestic waste.
The Gulf of Fos draws its sea water supply fromthe surface layer of the oligotrophic Mediterra-nean. A small part of the nutrient-enhancedRh #one river discharge reaches the bay through acanal (Arfi, 1984). Nutrient concentrations in theRia Formosa in winter are controlled by theAtlantic tidal inflow and agricultural runoff,whereas, in summer, sediment remineralisationand sewage are the main controls (Newton et al.,2003).
At least some of these RREs provide local sinksfor nutrients by way of denitrification, and burialof phosphate adsorbed to sediment particles.Larsson and Engqvist (1997) suggested that onaverage 55% of local input of available nitrogenwas lost as a result of sediment denitrification inthe Himmer fjord. Whereas this nitrogen will havepassed though euphotic zone primary producersbefore arriving at the sea-bed, and so cannot besubtracted from si in Eq. (3), it neverthelessrepresents a loss of long-term potential for trophicstimulation. Rates of denitrification in coastalmarine and estuarine sediments are highly variable(Seitzinger, 1988). Larsson and Engqvist (1997)showed a weak correlation between annual deni-trification and the total annual nitrogen loading inthe inner basin of Himmerfj.arden. Erlandsson and

ARTICLE IN PRESS
P. Tett et al. / Continental Shelf Research 23 (2003) 1635–1671 1653
Arneborg (2002) review data showing moredenitrification in Gullmar sediment beneath a70 m water column than in a sediment at 115 m:Nutrient flux studies in the Gulf of Fos (Grenz,2002) showed nitrate uptake by the sediment onmost occasions. This was due both to assimilationby microphytobenthos and to sediment denitrifica-tion. On most occasions the Fos sedimentsreleased ammonium into the water at the sametime as they consumed nitrate, as reported also forthe Himmer fjord (Blomqvist and Larsson, 1997).
The nutrient concentrations S0 given in Table 6are for the superficial layer of the sea at theentrance to the system. This may underestimatethe marine input in cases where there is inflow ofmore nutrient-rich water at an intermediate depth,which then entrains into near-surface water. Afinal problem concerns the forms of nutrients to beincluded in this inflow. The CSTT model dealswith available nutrients, and so should also takeaccount of organic compounds that mineraliseeasily. However, in Table 6 we have used only datafor inorganic forms of the nutrients.
3.6. Irradiance
Mean photosynthetically available radiation(PAR, 400–750 nm) in a vertically mixed layer ofthickness h can be approximated by
I ¼ ð1� m0Þm1m2I01� e�Kd h
Kdh
DmI0
KdhmEm�2s�1 ð16Þ
where I0 is 24-h mean solar radiation (allwavelengths) at ground level, in W m�2; the factorm0 is sea-surface albedo, m1 converts solar radiationto PAR photons and m2 deals with losses additionalto those of Beer–Lambert decay. Apart from h; thecrucial local property is the PAR diffuse attenua-tion coefficient Kd ; which is made up of componentsdue to sea water itself, coloured dissolved organicmatter (CDOM), also referred to as yellow sub-stance, phytoplankton pigments, other organicparticulates, and inorganic particulates.
In ‘optical case I’ waters (Prieur and Sathyen-dranath, 1981) optical properties are dominated byphytoplankton pigments. Such waters are often
thought of as being restricted to those of theoceans, distant from freshwater inputs of yellowsubstance and tidal resuspension of particles.However, many eutrophic waters can be treatedas case I when phytoplankters are either thelargest, or the most variable, optical component.Concentrations of CDOM and suspended parti-culates, although large, are often relatively con-stant in areas of restricted exchange. It is this thatallows Secchi depth, related approximately todiffuse attenuation by
zS ¼ fS=Kd ð17Þ
to serve as a measure of eutrophication (Sandenand H(akansson, 1996). Larsson and Kratzer(2002) demonstrate a good inverse correlationbetween total chlorophyll and Secchi depth inHimmerfj.arden, leading to the inverse relationshipbetween Secchi depth and total nitrogen shown inFig. 3(c). The factor fS in Eq. (17) is about 1.7 inclear marine waters (Raymont, 1980), falling toabout 1.4 in turbid coastal waters with highsuspended sediment load (Holmes, 1970) andincreasing to higher values (1.84) in the low-salinity waters of the Baltic Sea (Edler, 1997).
The submarine optical data (Table 6) needed toestimate typical values of I for use in the CSTTmodel were obtained in several ways. Some arebased on estimates of Kd from radiometermeasurements of underwater light, others onSecchi depth. All have been corrected to the EQSchlorophyll concentration of 10 mg m�3 using
Kd ¼ Kd;w þ m�1c a�PHXEQS: ð18Þ
The term Kd ;w specifies the diffuse attenuationcoefficient measured in the absence of phytoplank-ton but with all other light-attenuators present. Itis treated as a site-specific parameter. Takingaccount of the EQS for chlorophyll is necessarybecause the comparison of Eq. (5) involves micro-plankton growth rate under conditions of highbiomass. The parameter a�PH is the absorptioncross-section of photosynthetic pigments, with avalue of 0:016 m2 mg chl�1 in coastal waters (Tett,1990). The equation uses mc; the mean cosine (theaverage angle relative to the vertical of thesubmarine photon flux), to convert absorption toattenuation.

ARTICLE IN PRESS
observed Summer maximum chlorophyll
potential maximum chlorophyll, Xm
0.0 5.0 10.0 15.0 20.010-1
100
101
light
-con
trol
led
grow
th: µ
(I)
/ (E
+L
)lig
ht-c
ontr
olle
d gr
owth
: µ(I
) / (
E+
L)
Golfe de Fos
Ria Formosa
Firth of Clyde outer
Gullmaren
eutrophic
Kongsfjord
Himmerfjord outer Himmerfjord inner
Firth of Clyde inner
0.0 5.0 10.0 15.0 20.00.0
5.0
10.0
15.0
20.0
Gullmaren
Ria Formosa
Kongsfjord
Firth of Clyde outer
Himmerfjord outer
Golfe de Fos
Himmerfjord inner
Firth of Clyde inner
(a)
(b)
Fig. 6. Results of the CSTT model for the OAERRE sites. (a)
plotted in growth-rate and maximum chlorophyll variable
space; (b) plot of predicted versus observed summer maximum
chlorophyll. N-limited sites shown by filled squares, P-limited
sites shown by filled diamonds.
P. Tett et al. / Continental Shelf Research 23 (2003) 1635–16711654
Fjords often act as settlement tanks, and so theoptical contribution of particulates, other thanthose associated with phytoplankton, tends to below. Yellow substance, however, is often impor-tant, as it is in the Firth of Clyde (Bowers et al.,2000), which receives large discharges from riversdraining peaty, acid, land. Here, the yellowsubstance concentration is inversely correlated tosalinity. In the Baltic Sea light absorption isdominated by yellow substance (Kratzer, 2000).As the surface layer salinity of the Himmer fjord isonly about 0.5 lower than the 6–7 of the openBaltic Sea (Larsson and Kratzer, 2002), similaroptical conditions, i.e. the optical dominance ofyellow substance may be expected. In the RiaFormosa, resuspended particulates tend to dom-inate light absorption due to the strong tidal flows.Glacier melt in Kongsfjorden releases many fineparticles which can increase water turbidity in theinner parts of the fjord (Svendsen et al., 2002).Secchi depth in the outer fjord can, however,exceed 20 m: Water in the Golfe de Fos alternatesbetween high transparency when wind strength islow and high turbidity, when wind-induced wavesresuspend particles from the sea-bed (Tett andGrenz, 1994). The greatest risk of algal bloomsoccurs during periods of calm weather, and theabsorption of light by inorganic suspendedmatter has thus been ignored in the case ofFos gulf.
Finally, the sea-surface solar irradiance valuesin Table 6 were either obtained from localobservations or were calculated from latitude,time of year and mean cloud cover, using analgorithm based on that of the COHERENSmodel (Luyten et al., 1999).
3.7. Results of the CSTT model
Site-specific data for the simple model areincluded in Table 6, and standard parametervalues needed for its use are listed in Table 5. Inthe case of stratified systems, the given values arethose for a superficial layer with thickness shownby the value of h: For example, in the case ofGullmaren, this layer was equated with theKattegat water, and taken to be 15 m:
Results are shown in Fig. 6(a), in which the axesare predicted maximum chlorophyll and theestimated ratio of growth rate to losses. The‘potentially eutrophic’ region is drawn from theCSTT EQS of 10 mg chl m�3 and the ratiomðIÞ=ðE þ LÞ ¼ 1; derived from the condition ofEq. (5) and using 0:1 d�1 for L in all cases. Onlyone of the sites falls into the ‘eutrophic’ region,and that is the inner part of the Himmer fjord,which is shown as potentially phosphorus-limited.Gullmaren may also be potentially P-limited. All

ARTICLE IN PRESS
P. Tett et al. / Continental Shelf Research 23 (2003) 1635–1671 1655
the other sites are nitrogen-limited, in that Xmax
predicted from DAIN is less than that predictedfrom DAIP.
The CSTT model diagnoses the inner basins ofthe Himmer fjord as potentially eutrophic despitea comparatively low nutrient loading relative totheir volume. The ratio Si=V for Himmerfj.ardenbasins 2–4 is less, for both N and P, than thevalues for the inner Firth of Clyde and the RiaFormosa. The diagnosis of potentially high max-imum chlorophyll results in particular from theslow flushing rate of the Himmer fjord ð0:025 d�1Þcompared with that of the inner Firth of Clydeð0:14 d�1Þ and the Ria Formosa ð2:1 d�1Þ: Inreality, greatest summer chlorophyll concentra-tions in Himmerfj.arden ð5 mg chl m�3Þ do notreach the potential maximum or exceed theEQS, so losses could be greater than the con-servative value of 0:1 d�1 that has been usedin the CSTT calculations. Additionally, somenutrients discharged by the sewage treatmentplant may be trapped below the summerpycnocline.
Fig. 6(a) is the result of using the CSTT model.Fig. 6(b) evaluates the model by comparing thepredicted values of Xmax with observed summermaxima of chlorophyll. If the model is valid andits parameter values are correct, the points shouldfall on or to the left of the diagonal line, becausethe model is expected to predict the worst case thatmight occur. The chlorophyll predictions forKongsfjorden, Himmerfj.arden and the inner Firthof Clyde are indeed greater than the maximumchlorophyll observed during summer. The discre-pancy in the case of the outer Firth of Clyde isrelatively small and will be disregarded in thissection, although we will deal with the Firth atlength in the next section. This leaves threediscrepant cases to consider.
In the case of the Ria Formosa, the observedmaximum value is about twice the predictedmaximum, but both predicted and observedmaximum chlorophyll are low. The discrepancymay lie in the application of a box model to aheterogeneous system in which the contents of theinner parts of the low-water channels remainwithin the Ria for longer than implied by the bulkresidence time of less than a day.
The real values for Fos gulf and Gullmaren aremuch greater than the predicted values, and wouldthemselves place these sites in the eutrophiccategory, using the CSTT EQS of 10 mg chl m�3:In the case of Gullmaren the explanation may bethat the maximum of the observed time-series isbiased by data from 1987 to 1988, when there weresummer blooms in the Kattegat (Lindahl, 1994).The value of X0 of 4 mg chl m�3 did not takeaccount of such a case. In the case of the Gulf ofFos, the explanation may well involve circulationpatterns inside the gulf. High resolution numericalsimulations (Ulses, 2002) suggest that under somewind conditions, the inner part of the Gulf,containing less than a third (29%) of the totalvolume, may be largely isolated from the outerpart. If such conditions were combined with halinestratification in the inner part, the volume of waterreceiving nutrients from the Rh #one canal wouldhave been much less than assumed in Table 6, andthe resulting estimates of the ECE of nutrients andthe maximum chlorophyll would have been muchgreater.
4. Trophic state control investigated with a dynamic
model
The CSTT model is intentionally impoverishedin number of state variables and parameters. Thissection shows results from a more detailed model(Lee, 2002) that combines a 2-microplanktonbiological model (Lee et al., 2002) with a multiplecompartment model of the Firth of Clyde (Fig. 7).The biological model has four compartments, fordiatom-dominated microplankton, flagellate-dominated microplankton, slow-decaying detritus,and fast-sinking phytodetritus. The model cyclesnitrogen and silicon and produces and consumescarbon biomass. In addition to this greaterbiogeochemical complexity, compared with theRiley+model of Eqs. (1) and (2), each of thesecompartments has additional state variables, Q;each representing the atomic ratio of a nutrientelement to organic carbon.
The introduction of these nutrient quota vari-ables allows the growth rate of each microplank-ton to be calculated by a modification of the

ARTICLE IN PRESS
North Great Arran InnerChannel Plateau Deep Firth
Vmix(4,1)
ρ(1,1) ρ(2,1) ρ(3,1) ρ(4,1)
ρ(2,2) ρ(3,2) ρ(4,2)
ρ(3,3)
ρ(1,2)
Vadv(3,1)TE(3,1)
TE(3,2)
Ufw
Mul
l of K
inty
re
ArranTroon
RiverClyde
Inner Firth
Arran Deep
GreatPlateau
NorthChannel
100m
50m
50m100m
56°N
55°N
5°E
UOUT
UIN
UIN(D)
Fig. 7. The Firth of Clyde—map and model compartmentali-
sation.
P. Tett et al. / Continental Shelf Research 23 (2003) 1635–16711656
‘cell-quota, threshold limitation’ model of Droop(1983):
m ¼ minff ðIÞ; f ðQÞ; ½f ðSiQÞ�g d�1 ð19Þ
f ðIÞ ¼aBIw� r0
1þ b; where w ¼ X qN
a ðQ � qhZÞ;
f ðQÞ ¼ mmax 1�Qmin
Q
� �; where Q ¼
N
B;
f ðSiQÞ ¼ mmax 1�SiQmin
SiQ
� �; where SiQ ¼
SiN
B;
where B; N and SiN are the (organic) carbon,nitrogen and silicon (diatoms only) of a micro-
plankton compartment. Most of the parameters inthis equation are derived from algal and micro-heterotroph constants by equations involving the‘heterotroph fraction’ Z; the proportion thatbacterial and protozoan biomass contributes tototal microplankton carbon. The use of twomicroplanktons allows for a seasonal successionfrom a spring microplankton ðZ ¼ 0:2Þ; in whichdiatoms are the most important component, to asummer microbial loop community ðZ ¼ 0:6Þ: Theparameter X qN
a was 3 mg chl ðmmol NÞ�1 for thealgal component of both microplanktons, basedon Tett (1998). Bulk chlorophyll yield in the modelis:
q ¼ðX1 þ X2ÞðN1 þ N2Þ
¼ X qNa 1� qh
�
�Z1ð1� cÞ þ Z2c
Q1ð1� cÞ þ Q2c
� ��mg mmol�1; ð20Þ
where subscripts 1 and 2 refer respectively to thediatom-dominated and flagellate-dominated mi-croplankton. The parameter qh gives the (constant)nitrogen content of pelagic microheterotrophs,taken as 0:18 mol N ðmol CÞ�1 (Tett, 1998). Thevariable c describes the relative contributionB2=ðB1 þ B2Þ of flagellate-dominated to totalmicroplankton.
In the CSTT model, the loss term L is constant.In the present model, the analogous losses arevariable. Firstly, algorithms for shear-inducedaggregation of diatom-dominated microplanktoncreate a sinking loss which is greatest when thismicroplankton is most abundant. Secondly, lossesto mesozooplankton were calculated as grazingpressure derived (Tett and Walne, 1995) fromclimatological zooplankton data (Adams, 1986).This grazing was applied to the whole of thediatom-dominated microplankton but only to theheterotrophic part of the flagellate-dominatedmicroplankton, on the grounds that the phyto-flagellate component of the latter was too small forcapture by copepods.
The physical sub-model included horizontaltidal exchange, and an estuarine circulation(Simpson and Rippeth, 1993) in which the outflow

ARTICLE IN PRESS
468
10121416
3131.5
3232.5
3333.5
02468
10
0 50 100 150 200 250 300 350 400 4500
5
10
15
20
Days from 01 Jan 1993
(a) Temperature (°C)
(b) Salinity (psu)
(c) Total chlorophyll (mg m-3)
(d) Nitrate (mmol m-3)
Fig. 8. Firth of Clyde model results for the upper compartment
in the main basin: comparison of best simulation with
observations (a) temperature, (b) salinity, (c) chlorophyll, (d)
nitrate. Error bars in (a) and (b) give standard deviation of
observed values during each cruise. Error bars in (c) and (d)
give range.
P. Tett et al. / Continental Shelf Research 23 (2003) 1635–1671 1657
from an upper compartment of density r was:
Uout ¼ kHRðr0 � rÞ 106 m3 d�1; ð21Þ
where r0 is the density of the adjacent seawardscompartment. Uout defaulted to river input UFW
when rXr0: The inflow Uout � UFW to the ArranDeep region entered, and thus renewed, the ‘deep’compartment (3,3 in Fig. 7) only when its densityexceeded that of water already there. Verticalmixing was calculated by a 2-layer approximationof the depth-resolved model of Simpson andRippeth (1993). The approximation conservespotential energy and takes into account internaltidal mixing (Stigebrandt, 1976; Stigebrandt andAure, 1979) as well as superficial stirring by wind,and near-bed stirring by the barotropic tide.
Simulations were forced with river run-off for1993–94, climatological meteorology with realisticadditional high-frequency variability added as‘pseudo-weather’ (Elliott and Li, 1995), andclimatological outer boundary conditions. Physi-cal and biological model parameter values wereoptimised using observations made during a seriesof cruises during 1993–94 (Jones et al., 1995;Rippeth et al., 1995; Rippeth and Jones, 1997;Midgely et al., 2001). Fig. 8 compares anoptimised simulation of temperature, salinity,chlorophyll, and nitrate, with observations ofthese variables in the upper compartment of theArran Deep basin of the Firth of Clyde. Thesimulation captures most features of the seasonalcycle quite well, although the Spring Bloom andthe resulting draw-down of nitrate were perhapsunderestimated relative to observations. Theagreement between simulations and observationsis sufficient for us to deem the model to be areliable representation of reality, and thus tojustify using it to investigate the q and E
parameters of the CSTT model.Fig. 9 shows the effects of removing either the
grazing pressure due to mesozooplankton or therespiratory losses due to microheterotrophs. Itsuggests that it is the microheterotrophs thatprovide the strongest control on biomass; withoutthem the yield of chlorophyll from assimilatednitrogen is higher, and simulated biomass exceedsthe CSTT EQS for much of the summer. InFig. 9(b), the simulated ratio of chlorophyll to
microplankton nitrogen, specified by Eq. (21),was, in the case of the standard simulation, leastin summer when the flagellate fraction c wasgreatest. Implicit removal of microheterotrophs,by setting Z to zero, resulted in a higherchlorophyll yield which was, as required byEq. (21), X qN
a : The standard simulation resultedin summer values of q which were about1:5 mg chl ðmmol NÞ�1; and hence higher thanthe value of 1:1 mg chl ðmmol NÞ�1 used in theCSTT model. The higher value of q; if used in theCSTT model, would increase the estimate ofmaximum chlorophyll and so improve agreement

ARTICLE IN PRESS
100 120 140 160 180 200 220 240 260 280 3000
5
10
15
20
25
100 120 140 160 180 200 220 240 260 280 3000123456789
10
with vertical mixingwithout vertical mixing
Days from 01 Jan 1993
days
days
(a)
(b)
Fig. 10. Firth of Clyde model: water residence times ðE�1Þ forthe upper compartment of (a) the main basin, and (b) the Inner
Firth, with and without the contribution of vertical mixing.
0
10
20
30
40
50StandardNo grazingNo heterotrophs
0.5
1
1.5
2
2.5
3
3.5
0 100 200 300 400 500 600 700 8000
0.5
1
1.5
2
2.5
3
(a) chlorophyll (mg m-3)
(b) bulk microplankton q
(c) ratio of chlorophyll to total system N
Days from 01 Jan 1993
Fig. 9. Firth of Clyde model results for the upper compartment
in the main basin: numerical experiments: (a) chlorophyll, (b)
bulk microplankton chlorophyll yield, (c) ratio of chlorophyll
to total system nitrogen. Simulations: 1. standard conditions;
2. no mesozooplankton grazing; 3. (with mesozooplankton
grazing but) heterotroph fraction set to zero for both
microplanktons.
P. Tett et al. / Continental Shelf Research 23 (2003) 1635–16711658
between estimated and observed maximum chlor-ophyll in the outer basin of the Firth of Clyde,shown to be somewhat discrepant in Fig. 6.
Fig. 9(c) shows that in the standard simulationthe ecosystem converted only a small part ofavailable nitrogen into chlorophyll. During winterthe nutrient remained mainly as nitrate, becauselack of light restricted primary production; duringsummer, much of the nitrogen was contained indetritus, mesozooplankton, and deep water. Re-moval of grazers or microheterotrophs allowedalgae to make more effective use of the nutrient.
Fig. 10 shows seasonal variation in the exchangerates of the upper compartments of the Firth of
Clyde main basin (the Arran Deep) and the innerFirth. The simulation results are presented asflushing time, E�1; and were calculated by dividingthe volume of each compartment by the volumeexchanged each day with adjacent compartments.Flushing time was low (exchange rate was high)during parts of the autumn and winter when thesimulated upper mixed layer extended below thesurface compartment of the model. Even neglect-ing such vertical mixing, which may in part be anartefact of the thick-layer model, the spring andsummer residence times in the main basin were15–20 days, less than the residence times of 2–4months given by Edwards et al. (1986) andMidgely et al. (2001) for the entire basin. In theInner Firth, vertical mixing is weaker because ofstronger haline stratification, but the resultingestuarine circulation led to a summer residencetime between 5 and 8 days in the upper layer

ARTICLE IN PRESS
P. Tett et al. / Continental Shelf Research 23 (2003) 1635–1671 1659
(Fig. 10b). In both cases, the variability in exchangerates demonstrates that the use of a single value inthe CSTT model is an approximation.
5. Discussion
5.1. Introduction
Cloern (2001) distinguished several phases in theevolution of ideas of coastal eutrophication. In thefirst phase, strongly influenced by limnology, theconceptual models focused on
changing nutrient input as a signal, andresponses to that signal as increased phyto-plankton biomass and primary production,decomposition of phytoplankton-derived or-ganic matter, and enhanced depletion of oxygenfrom bottom waters.
The current phase tries to explain
differences in the responses of lakes and coastal-estuarine ecosystems to nutrient enrichment
in terms of
system-specific attributes that act as a filter tomodulate the responses to enrichment (leading tolarge differences among estuarine-coastal systemsin their sensitivity to nutrient enrichment).
It also identifies
a complex suite of direct and indirect responsesincluding linked changes in: water transpar-ency, distribution of vascular plants and bio-mass of macroalgae, sediment biogeochemistryand nutrient cycling, nutrient ratios and theirregulation of phytoplankton community com-position, frequency of toxic/harmful algalblooms, habitat quality for metazoans, repro-duction/growth/survival of pelagic and benthicinvertebrates, and subtle changes such as shiftsin the seasonality of ecosystem functions.
The next phase will concern the way in which
system-specific attributes constrain or amplifythe responses of coastal ecosystems to nutrientenrichment
and must also deal with wider aspects of eutro-phication, including interaction with other human-derived stressors and the need to develop strategiesfor ecosystem rehabilitation.
OAERRE’s objectives include the constructionof simplified screening models for the diagnosisand prognosis of eutrophication. One aim of thispaper has been to demonstrate such a model byusing it to estimate the trophic status of theOAERRE sites, and to unpack its apparentlysimple contents by showing that its parsimoniousset of parameters embodies, or requires, muchknowledge of fundamental physical and biogeo-chemical processes in RREs. At first sight, themodified CSTT model is merely part of Cloern’sphase 1, which is exemplified by studies ofnutrient–chlorophyll relationships in Canadianexperimental lakes (Schindler, 1977). We havenot dealt with the complex indirect responses ofecosystems to enrichment and increased produc-tion, but have used the CSTT model to explorehow system-specific attributes, such as exchangerate and optical conditions, determine directresponse to enrichment.
The CSTT model parameter, q; the dynamicbulk yield of chlorophyll from limiting nutrient,was treated as a universal constant. It may not beso, either as a property of organisms or ecosys-tems. The numerical simulations reported inSection 4 with the Firth of Clyde model showhow the value of q depends on the intensity ofprotozoan or copepod grazing and thus how it cansummarise ecosystem response to these factors(Fig. 9). Furthermore, the system response pre-dicted by Eq. (4) of the CSTT model also dependson the source water chlorophyll concentration.Thus, blooms occurring outside RREs may over-whelm the response of an RRE to local nutrientenrichment, as proposed in Section 3.7 to explainthe highest chlorophyll concentrations observed inGullmaren and shown as discrepant in Fig. 6(b).
In the next part of this Discussion we willconsider how our models need to be developed forbetter prediction, diagnosis and management ofeutrophication in regions of restricted exchange.Using models for such purposes requires them tobe well-constructed and well-proven engineeringtools, and this is the long-term goal of projects

ARTICLE IN PRESS
K0
S0
X0
fi, si
EO1, S1, X1
Dissolved oxygen: O2 µM Particulate organic detritus: C2 µM
loss and conversion to detritus
h1
h2
(or mmol m-3)
Vertical exchange at relative rate Ev d-1
S2
Sediment/Benthos
remineralisationdenitrification
Fig. 11. Schematic of additional processes in a stratified RRE.
P. Tett et al. / Continental Shelf Research 23 (2003) 1635–16711660
such as OAERRE. However, we also use them asconceptual tools (in Cloern’s sense) and asscientific tools for testing hypotheses about eu-trophication. These uses are illustrated by Figs. 4and 5 (conceptual model), 6(b) (scientific test ofhypotheses) and 6(a) (diagnosis of trophic state).
5.2. Developing the natural science of
eutrophication models
As discussed, there is a difference between adiagnosis of trophic status against objectivecriteria (Table 3), and a demonstration of anthro-pogenic eutrophication including identification ofnutrient sources and undesirable consequences ofenrichment. To be a useful tool for diagnosing andameliorating eutrophication, the CSTT-derivedmodel needs to be developed in two main ways.The first involves extra state variables to allowdiagnosis or prediction of the undesirable con-sequences of increased growth of algae (andphotosynthetic bacteria). The second involvesconsidering a range of nutrient sources, especiallythose in the freshwater catchment of the RRE, andtaking account of the social and economic effectsof managing change in these sources. Extendingmodels into the sphere of the social sciences isdealt with briefly in the third section of thisdiscussion.
‘‘Undesirable disturbance to the balance oforganisms and the quality of the water’’ compre-hends a range of problems, including Red Tides,water foaming, deep water and sea-bed deoxy-genation, ecosystem disturbances, kills of farmedand wild marine animals, and, perhaps, shellfish-vectored algal poisoning. Not all of these effectscan be easily described by screening models, but akey improvement to the CSTT might be toparameterise the variable we have called c; theratio of flagellate-dominated to total microplank-ton, in terms, especially, of nutrient input ratios.The underlying assumptions are that flagellates aremore likely to be associated with undesirableconsequences than is a microplankton dominatedby diatoms, and that diatoms may become silica-limited while other algae remain nitrogen orphosphorus limited (Tett et al., in press). Oneway to parameterise c would be to assume a
steady state and to suppose that the maximumdiatom biomass was limited by the yield of(diatom) chlorophyll from silica, Siq; so that
c ¼ 1�SiqSiSeq
Xmax
; where
SiSeq ¼ SiS0 þSisi
EV: ð22Þ
Conversion of the single box of the CSTT modelinto a 2-layer system (Fig. 11) would allow thepossibility of estimating enhanced deep-waterdeoxygenation by taking into account the sinkingof organic particulate matter from the upper to thelower compartment. The calculation of light-limited growth rate relative to loss rate (Eq. (5))might allow for the ability of flagellates, especiallythe larger dinoflagellates, to migrate vertically in astratified system, and of the additional losses ofdiatoms due to sinking under stratification. Theloss term might also take account of diminishedgrazing by copepods on flagellates and dinoflagel-lates on grounds that some are too small forsuccessful capture and others deter grazingthrough toxicity.
Other physical–biological models have beendescribed with purposes broadly similar to those

ARTICLE IN PRESS
P. Tett et al. / Continental Shelf Research 23 (2003) 1635–1671 1661
of the modified CSTT and Firth of Clyde models.Two will be briefly considered here. They are thestrategic simulation model for fjords of Ross andco-workers (Ross et al., 1993, 1994), which is adynamic model approaching the complexity of ourClyde model, and the FjordEnv model of Stigeb-randt (2001) which is closer to the CSTT model.
The fjord ecosystem model of Ross et al. (1993)has three water column layers and a sedimentlayer. The surface and intermediate water-columnlayers have compartments for phytoplankton,zooplankton herbivores, and carnivores, eachcontaining carbon and nitrogen. In the laterversion of the model (Ross et al., 1994), the deeplayer is combined with a sediment layer as anutrient storage compartment, the nutrients beingdissolved inorganic nitrogen and dissolved organicnitrogen. Each nutrient and plankton variable isdynamic—i.e. it is described by a differentialequation which includes variable terms. Waterexchange is simulated by a constant, tidally forced,estuarine circulation, with only a small response toincreased freshwater input.
In contrast, the FjordEnv model of Stigebrandt(2001) has more realistic parameterisations ofphysical processes, but resembles the modifiedCSTT model in using an ECE method to estimatenutrient enhancement, and assumes that all avail-able nutrients convert to phytoplankton. How-ever, it also, takes account of the sinking ofprimary production and the consequent use ofoxygen in deeper water. Its continued develop-ment, and application to some of our sites, is anobjective of OAERRE.
Table 7 compares key aspects of the CSTT,FjordEnv, strategic fjord simulation, and Clyde,models. The models of Ross et al. demonstrate theuse of simple parameterisations of higher trophiclevels. Representation of these levels may beimportant in adequately simulating top-downcontrol of responses to nutrient enrichment.However, introducing dynamic predators into amodel creates the possibility of Lotka–Volterraoscillations and hence of unpredictable systems(Hastings and Powell, 1991; Tett and Wilson,2000). Ross et al. (1994) showed that suchvariability was damped in the case of rapidly-exchanging fjords by import and export—in effect,
by increasing the strength of relaxation towardspre-determined boundary conditions. The Clydemodel uses a microplankton parameterisation ofthe interaction between algae and protozoa inorder to apply a large ‘ecological viscosity’ tohighly dynamic microbial loop interactions, andhence damp the potential for Lotka–Volterraoscillations. Whereas the strategic fjord modelrequires time-series of herbivorous and carnivor-ous zooplankters as external boundary conditions,the Clyde model needs to be forced with a time-series of local mesozooplankton grazing pressure.Such considerations point to the need to find adynamic parameterisation that allows the keyfeatures of top-down control to be captured inan ecosystem model not only without rendering itimpractical for engineering purposes because ofextreme (i.e. chaotic) sensitivity to initial condi-tions or parameter values, but also withoutrequiring substantial amounts of biological forcingdata.
The CSTT model’s exchange parameter E; andits analogue in the model of Ross et al. bundle theconsequences of a variety of physical exchangeprocesses. FjordEnv demonstrates how theoreti-cally-based, empirically calibrated, simplified para-meterisations can skilfully capture the relationshipbetween the physical determinants of these pro-cesses, and exchange. It is our contention thatmodels for diagnosing and managing eutrophica-tion, which need to be both easy to use andreliable, will succeed by applying this approach tothe relevant biogeochemical processes (as bothFjordEnv and the CSTT models have begun todemonstrate) and, ultimately, to ecological pro-cesses involving trophic networks.
The modified CSTT model takes no account ofbenthic processes. FjordEnv does so only by wayof an oxygen demand. In the Clyde and Ross et al.(1994) models, the lower boundary is simply adelayed-release nutrient storage compartment,without any parameterisation of benthic processes.As Cloern (2001) points out, what happens at thebottom of coastal waters can be of great impor-tance in determining the impact of nutrientenrichment.
This is certainly true of RREs. In deep systems(those in which most of the sea bed lies below the
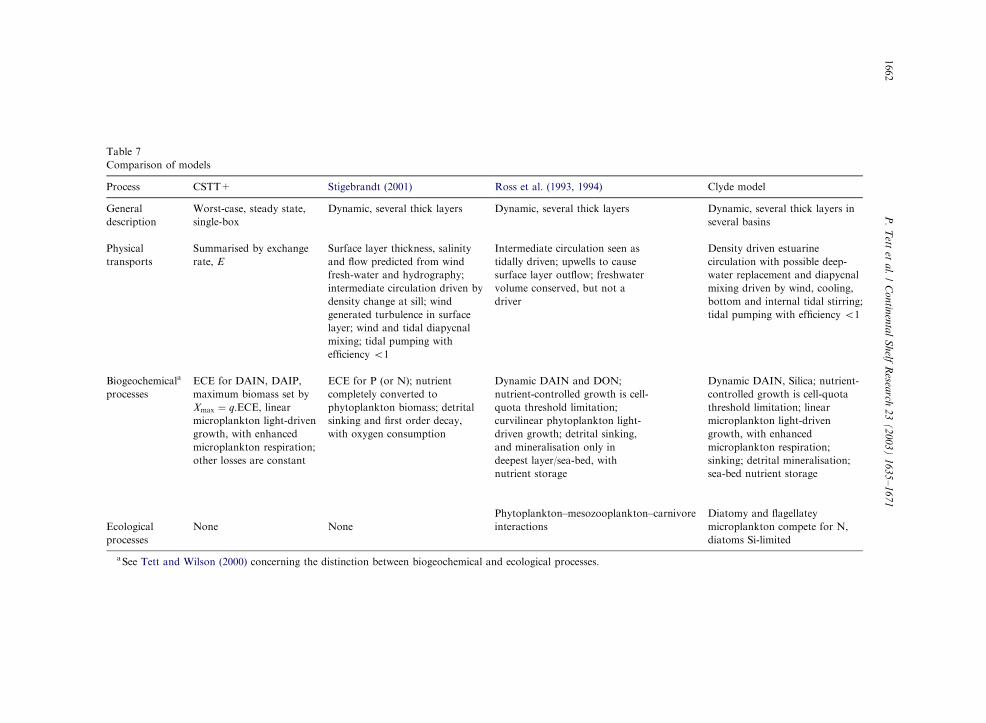
ARTIC
LEIN
PRES
S
Table 7
Comparison of models
Process CSTT+ Stigebrandt (2001) Ross et al. (1993, 1994) Clyde model
General Worst-case, steady state, Dynamic, several thick layers Dynamic, several thick layers Dynamic, several thick layers in
description single-box several basins
Physical Summarised by exchange Surface layer thickness, salinity Intermediate circulation seen as Density driven estuarine
transports rate, E and flow predicted from wind tidally driven; upwells to cause circulation with possible deep-
fresh-water and hydrography; surface layer outflow; freshwater water replacement and diapycnal
intermediate circulation driven by volume conserved, but not a mixing driven by wind, cooling,
density change at sill; wind driver bottom and internal tidal stirring;
generated turbulence in surface tidal pumping with efficiency o1
layer; wind and tidal diapycnal
mixing; tidal pumping with
efficiency o1
Biogeochemicala ECE for DAIN, DAIP, ECE for P (or N); nutrient Dynamic DAIN and DON; Dynamic DAIN, Silica; nutrient-
processes maximum biomass set by completely converted to nutrient-controlled growth is cell- controlled growth is cell-quota
Xmax ¼ q:ECE, linear phytoplankton biomass; detrital quota threshold limitation; threshold limitation; linear
microplankton light-driven sinking and first order decay, curvilinear phytoplankton light- microplankton light-driven
growth, with enhanced with oxygen consumption driven growth; detrital sinking, growth, with enhanced
microplankton respiration; and mineralisation only in microplankton respiration;
other losses are constant deepest layer/sea-bed, with sinking; detrital mineralisation;
nutrient storage sea-bed nutrient storage
Phytoplankton–mesozooplankton–carnivore Diatomy and flagellatey
Ecological None None interactions microplankton compete for N,
processes diatoms Si-limited
aSee Tett and Wilson (2000) concerning the distinction between biogeochemical and ecological processes.
P.
Tett
eta
l./
Co
ntin
enta
lS
helf
Resea
rch2
3(
20
03
)1
63
5–
16
71
1662

ARTICLE IN PRESS
P. Tett et al. / Continental Shelf Research 23 (2003) 1635–1671 1663
euphotic zone), benthic oxygen consumption andnutrient release need to be taken into considera-tion, at least in research models. In contrast,shallow sea-beds may be sites of primary produc-tion and nutrient consumption. The phytobenthosis important in the two shallowest systems studiedby OAERRE, and perhaps dominant in one ofthese, the Ria Formosa. It might be possible toincorporate phytobenthic enrichment in a versionof the CSTT model by estimating the maximumchlorophyll under unit area of the sea surface. Forexample,
X omax ¼ q
ES0h þ ðsi=AÞL
� �mg chl m�2 ð23Þ
is a worst-case, steady state, solution for themaximum chlorophyll of firmly attached phyto-benthos which do not experience loss due to waterexchange, but do lose biomass at overall rate L tograzers. Finally, the organic enrichment of thesediment due to nutrient-stimulated production,can bring about conditions favourable for deni-trification, a process that must be included inmodels that aim to budget nutrients. A number ofworkers have described models for sedimentdenitrification. The approaches of DiToro (2001)and Ruardij and van Raaphorst (1995) are parti-cularly attractive in the present context, as theycontain simplified parameterisations for 2-layeredcoastal sediments, in contrast to models (Rabouilleand Gaillard, 1991; Middleburg et al., 1996;Soetaert et al., 1996) that fully resolve the verticaldistribution of nutrients and oxidants and whichare more suitable for oceanic sediments.
5.3. Socio-economic considerations
Turner et al. (1999) describe an interdisciplinarystudy of the costs and benefits of eutrophicationreduction in the Baltic Sea, where nutrient load-ings to the Baltic were estimated and the costs andbenefits of abatement assessed.
Such a study raises three sets of issues. The firstconcerns matters of applied and theoreticalnatural science, concerning the understanding ofrelevant environmental processes. The secondconcerns economic questions of costs and benefitsand how to maximise the latter in relation to the
former. The third concerns how to bring aboutagreement amongst stakeholders (from individualsto nation states and transnational entities) in orderto achieve the benefits. A factor in this process isan agreement between the stakeholders regardingthe objectives regarding uses of the area (EQOs)and therefore, the establishment of the corre-sponding standards within limits of acceptablechange.
Most of the present paper has related toOAERRE’s main aim, of improving scientificunderstanding of the oceanographic processes thatinfluence the impact of nutrients on RREs. Herethe second and third issues in relation to apotential development of the CSTT or FjordEnvmodels are briefly considered. We call this devel-opment an ‘Environmental State Vector’ (ESV)model. The CSTT model is a solution of a dynamicmodel with two state variables, the concentrationsof limiting nutrient and chlorophyll. This isbecause it is used for comparison with only twoformal Environmental Quality Standards (EQSs),for winter DAIN and summer chlorophyll con-centration, which are deemed sufficient to indicateecological status in relation to nutrient inputs.Nevertheless, the set of regulatory and simulatedvariables may need to be expanded to adequatelydefine ‘good’ environmental and ecological status.An ESV model is a general solution, consisting inany particular case of just that set of variablesrequired to diagnose or predict whether an RRE iswithin or outside the range defined by a specific setof EQSs. Finally, each ESV model needs to becoupled to a catchment model to provide estimatesof nutrient sources and transformations.
Following Turner et al. (1999), the next stepwould appear to be that of including in the ESV-catchment model some functions for the costs ofnutrient reduction and the benefits of amelioratingeutrophication. However, whereas estimation ofcosts would seem straight-forward—the costs ofwaste water treatment are well-known—the esti-mation of benefits is more controversial. In somecases, the monetary value of ecosystem goods andservices can be identified for each of a set ofmanagement scenarios, as illustrated by Glibertand Janssen’s (1998) study of a mangrove ecosys-tem. In other cases, such as the Turner et al. study

ARTICLE IN PRESS
P. Tett et al. / Continental Shelf Research 23 (2003) 1635–16711664
of the Baltic, benefits have been estimated by‘contingent value analysis’ (Goffe, 1995)—askingpeople what they would be prepared to pay,through taxes or higher prices, for improvementsin environmental quality.
While monetary value provides a convenientsingle variable for use in optimisation studies, thisunidimensional monetarisation of ecosystem valuesuffers from the defects that Marx identified for‘exchange value’ in chapter 1 of ‘Capital’. Optimi-sation based on multivariate ‘use value’, whilstmore complex, may be more suitable for condi-tions in Europe’s ‘social market’ which aims toachieve the triple objectives of economic efficiency,social justice and environmental sustainabilitythrough a combination of law, taxes, planning,and negotiation as well as market forces. Doran(2001) considered the application of ‘agent-based’modelling to the management of the Fraser rivercatchment in Canada. Such modelling can takeaccount of all three aspects—natural scientific,economic, and socio-legalistic—of the problem ofco-operative management of RRE ecosystems.
In Doran’s view, the most difficult managementproblem is not that of finding an optimum solutionbased on natural science, but of defining a solutionbased on multidisciplinary criteria. Human societyis typically comprised by a variety of stakeholderseach pursuing their own interests with results thatinclude resource depletion, pollution and socialinequality (Doran, 2001). The challenge is todevise a sustainable solution which addressesinterests in an equitable manner. This approachis currently being adopted in EU countriesthrough the recent European Council Recommen-dation (C.E.C., 2002) concerning the implementa-tion of Integrated Coastal Zone Management inEurope.
A number of issues are involved in managing thetrophic status of RREs. Table 6 gives theproportion of equilibrium nutrient concentrationin each RRE that is estimated to come fromlandward sources. With the exception of Kongsf-jorden, at least 60% of the limiting nutrient is thusderived. In some cases the precise source can beidentified (Section 3.5). Thus, about half theenhancement of nutrient in Himmerfj.arden is dueto the treated discharge of urban waste water,
whereas in the case of Gullmaren, the Firth ofClyde and the gulf of Fos, anthropogenicallyenriched river discharge is the main source ofnutrients. That is, whereas Himmerfj.arden acts asa point source, in the other three RREs the maininput sources are riverine and agriculture run-off.The CSTT model can diagnose the contribution ofanthropogenic nutrients to trophic status. If thatstatus is eutrophic, and there are undesirableconsequences, the RRE can be deemed subject toeutrophication, as discussed in Section 2.3.
Should a RRE be so identified, the provisions ofarticle 5 of the Urban Waste Water TreatmentDirective come into play, and direct dischargesmust be nutrient-stripped, as is already the case inHimmerfj.arden. However, although the UWWTDrequires treatment of discharges of waste waterinto rivers, it has no powers to control agriculturalleaching or most forms of aquacultural input ofnutrients. The Nitrates Directive (C.E.C., 1991b)places some constraint on fertiliser use in ‘nitratevulnerable zones’ (NVZ). In addition, NVZ, andconsequent land-use restrictions, may need to bedesignated in fresh-waters if these are deemed aspotentially eutrophic or sources of nutrient topotentially eutrophic coastal areas (EuropeanCommission Court of Justice, Judgement of Court(Sixth Chamber), June 27, 2002). Finally,the Water Framework Directive requires themaintenance or restoration of ‘good’ ecologicalstatus and thus in principle can demand severereductions in diffuse inputs of nitrogen andphosphorus to rivers and estuaries, and to RREsthemselves, when the nutrient enrichment resultsin eutrophication.
In addition to the existence of natural nutrientsinks in rivers and estuaries (Billen et al., 1991),which can be augmented by the creation orrestoration of wetlands (Turner et al., 1999),RREs are in most cases able to dispose ofsubstantial nutrient inputs without adverse envir-onmental impact. Nutrient-nitrogen is dispersed,denitrified or buried; nutrient-phosphorus is dis-persed or buried. As pointed out by Elmgren(1997), the Himmer fjord acts as an extra sewagetreatment plant for the quarter of a million peoplewhose waste discharges there. The fjord may thusbe seen, in principle, as a financially valuable

ARTICLE IN PRESS
Table 8
Categories of human activity in an RRE and its catchment
Activity Time-scale of variation Notes
Agriculture and forestry Seasonal and long-term Nutrient inputs due to leaching from
soil and disposal of farmyard wastes
Industry Long-term Nutrient input depends on type of
industry
Fishery Seasonal and long-term May be necessary to distinguish
recreational from commercial fishery;
removes nutrients in fish, may change
sea bed
Aquaculture Seasonal and long-term Finfish aquaculture inputs nutrients,
shellfish aquaculture removes
phytoplankton
Permanent inhabitants Long-term Inputs nutrients depending on level of
UWW treatment
Temporary inhabitants Seasonal Inputs nutrients depending on level of
UWW treatment
Water manipulation Seasonal and long-term Requirements (for water and
hydroelectricity) driven by other
activities; damming and abstraction
changes seasonal pattern and nutrient
concs.
P. Tett et al. / Continental Shelf Research 23 (2003) 1635–1671 1665
resource. Quantification of this resource requires(a) estimating the degree of sewage treatmentrequired to meet a prescribed EQS in the adjacentcoastal waters, and (b) costing the building andmaintenance costs for the amount of treatmentprovided by the plant. Of course, there is a limit tothe use that can be made of an RRE for thispurpose, and this limit itself is set (or could be set)by EQS relating to a diagnosis of eutrophication.Nevertheless, the point is that the nutrient-absorbing capabilities of RREs have a value andthis value is currently used by some social groups(such as farmers and fish farmers) withoutpayment, whereas other groups (such as citydwellers) have to pay additional costs becausethey cannot use these capabilities.
Scientific study of RREs can explore therelevant natural processes, and a univariate ormultivariate economic model can provide rules forpotential optimisation. However, such work can-not itself reconcile conflicting interests. This caseexemplifies the sort of problem for which solutionsmight be explored with an agent-based model.
Such a model would need to deal with the RREand its catchment, which in most cases is the mainsource of nutrient enrichment. States and pro-
cesses external to this catchment (sea boundaryconditions, atmospheric inputs, macro-economictrends) would be treated as constants. Sevenaggregated categories of human activity (Table 8)within the catchment and RRE may be considered.These interact directly with each other—forexample by competing for land—and indirectlythrough the catchment ecosystems. Each categorywould be represented by a submodel (populationof software agents) obeying rules for functionalbehaviour and for communication with othersubmodels (agents).
The RRE itself provides an 8th category. Itssubmodels (population of agents) would corre-spond, in principle, to state variables with‘intentionality’—i.e. constrained by the softwareto find an optimum solution that places the valueof each within a corresponding EQS. These agentsare governed by a set of scientifically-validatedrules, are influenced by human activities (nutrientloading) and in turn influence these activities byway of environmental quality.
Considering such a model provides a usefulconceptual exercise. However, as Doran (2001)pointed out, no such model has as ‘‘yet beenimplemented on a computer, and indeed is quite

ARTICLE IN PRESS
P. Tett et al. / Continental Shelf Research 23 (2003) 1635–16711666
far from implementationy’’. A more feasible taskis that of developing an ESV model that canprovide part of the ‘natural environmental sub-model’ in Doran’s scheme. Doran argued that sucha submodel must ‘‘capture the need for long-termco-operation to attain sustainability y [and]should also permit the issue of equality orinequality of agent access to resources to beaddressed y’’. An ESV model coupled to acatchment model for nutrient sources could em-body such properties.
6. Conclusions
Understanding the process of anthropogeniceutrophication is particularly important in thecontext of applying legislation such as the WaterFramework Directive (WFD). It is useful todistinguish between eutrophic status, which theWFD approves if natural, and the human-drivenprocess that can lead to this status, which shouldbe ameliorated. The OAERRE project aims toincrease understanding of the processes controllingtrophic status in coastal regions of restrictedexchange, including those leading to the ‘undesir-able consequences’ that form part of theUWWTD’s definition of eutrophication. However,this paper, first drafted a year after the commence-ment of the project, has focused on the first twoparts of the UWWTD definition, those concerningnutrient status and amount of phytoplankton.
Comparison of measurements at the six projectsites (Kongsfjorden; Gullmaren; Himmerfj.arden;Firth of Clyde; Golfe de Fos; Ria Formosa) withthe environmental quality standards defined by theUK CSTT (1994, 1997) indicated that Gullmarenand Golfe de Fos could be considered eutrophic.However, occasional extremes can strongly controlthis assessment, and the weakness of a purelyempirical appraisal is shown by the lack of a clearrelationship between nutrient loading and trophicstated indicators in Fig. 2.
The OAERRE project aims to supplement anempirical approach by developing and applyingsimple ‘screening’ models which both diagnose andpredict eutrophication and also help clarify the keyenvironmental controls on trophic state. These
models include the FJORDENV and CSTTmodels. This paper has focused on the CSTTmodel, which assumes a region of restrictedexchange to be a well mixed box exchanging withthe sea at a daily rate E and converting nutrient tochlorophyll at a fixed rate q:
When applied to the OAERRE sites (Fig. 6(a)),the CSTT model diagnosed only the inner regionof Himmer fjord as potentially eutrophic. How-ever, summer chlorophyll concentrations observedin the fjord do not attain the levels predicted; themodel’s assumed loss rate may have been too low,indicating that there are controls on trophic statuswhich need better parameterisation in screeningmodels. Furthermore, there were discrepanciesbetween observed and predicted maximum chlor-ophyll (Fig. 6(b)) in the cases of the gulf of Fosand the Gullmar fjord. These discrepancies prob-ably demonstrate the difficulty of estimating thesize of the box which in the CSTT model receivesnutrients, or of getting good statistics for bound-ary conditions. A particular issue raised inrelation to extreme statistics concerns the level ofextreme to enter into the model: should it be thesummer maximum in a typical year, or the greatestvalue observed, for example, during one year inten?
The simplicity of the current version of theCSTT model limits its efficacy as a tool fordiagnosing and predicting trophic status; develop-ments are required. Simulations of a more complex‘research’ model for the Firth of Clyde were usedto study the influence of various factors on theyield ðqÞ of chlorophyll from nutrient, a keyfeature of the CSTT model. These studies indicatethe importance of microheterotrophic activity(Fig. 9) and demonstrate variation in exchangerate (Fig. 10). The first point emphasises thepossibly important role of planktonic protozoansin limiting algal growth, and the second pointshows the need to understand the variety ofphysical processes involved in exchange in RREs.OAERRE is studying both these matters in detail,seeking parameters such as Z which summarise therelationship between planktonic autotrophs andmicroheterotrophs, and considering how exchangerate ðEÞ in the CSTT model can be related tophysical variability.

ARTICLE IN PRESS
P. Tett et al. / Continental Shelf Research 23 (2003) 1635–1671 1667
In the final section of this paper we consideredimprovements to the natural science of screeningmodels and how, in principle, such models mighttake account of social and economic considera-tions. Suggested modifications to the CSTT modelinclude the use of silica loading in order todiscriminate between diatoms and flagellates, andthe addition of a second layer allowing sedimenta-tion and deep water oxygen depletion. Assumingthat flagellates are more likely to be associatedwith the undesirable consequences of eutrophica-tion, such developments could go beyond theprediction of chlorophyll to give insights into theundesirable consequences of nutrient enrichment.There is also a need to take account of benthic–pelagic interactions in shallow systems, especiallythat of the Ria Formosa.
The deterioration of an aquatic system hassocial and economic implications, and its restora-tion has costs. Conversely, the ability of an RREto absorb anthropogenic nutrients without detect-able harm can be seen as a resource, which can begiven a monetary value. Optimising the use of thisresource can be seen as analogous to the problemof optimising the fit of model simulations to a setof observations. We have briefly compared scalar(exchange value, monetary equivalence, contingentvaluation) and vector (use-value, multiple environ-mental quality variables and standards) methodolo-gies for optimising use of environmental resources,and conclude that the latter are most applicable inthe European ‘social market’ environment.
Acknowledgements
The authors acknowledge part-funding of theOAERRE project by contract EVK3-CT1999-00002. This is ELOISE publication no. 434/34.We are grateful to Dr. R. Gowen and ananonymous referee for helpful comments.
References
Adams, J.A., 1986. Zooplankton investigations in the Firth of
Clyde. Proceedings of the Royal Society of Edinburgh 90B,
239–254.
Allen, J.R., Slinn, D.J., Shammon, T.M., Hartnoll, R.G.,
Hawkins, S.J., 1998. Evidence for the eutrophication of the
Irish Sea over four decades. Limnology and Oceanography
43, 1970–1974.
Arfi, R., 1984. Gulf of Fos (France): main hydrobiological
features (1976–1978). Hydrobiologia 118, 187–194.
Arfi, R., Gaudy, R., Kerambrun, P., Pagano, M., 1990.
Plasticit!e !ecologique des populations planctoniques "a
1’interface terre-mer. Conditions naturelles, effets anthro-
piques (356–360). Compte rendu EUROCOAST—Littoral
1990, 764pp.
Barton, E.D., Ar!ıstegui, J., Tett, P., Cant !on, M., Garc!ıa-Braun,
J.A., Hern!andez-Leon, S., et al., 1998. The transition zone
of the Canary Current upwelling region. Progress in
Oceanography 41, 457–503.
Benon, P., Bourgade, B., Kantin, R., 1977. Impact de la
pollution sur les Ecosystemes mediterraneens cotiers:
aspects planctoniques. These 3eme cycle, Univ de la
Mediterranee. Th"ese 3 "eme cycle, Universit!e de la
M!editerran!ee.
Billen, G., Lancelot, C., Meybeck, M., 1991. N, P and Si
retention along the aquatic continuum from land to ocean.
In: Mantoura, R.F.C., Martin, J.-M., Wollast, R. (Eds.),
Ocean Margin Processes in Global Change. Wiley, New
York, pp. 19–44.
Blomqvist, S., Larsson, U., 1997. Sediment och sedimentation.
In: Elmgren, R., Larsson, U. (Eds.), Himmerfj.arden
Naturv(ardsverket F .orlag, Stockholm, Rapport 4565,
pp. 98–109.
Bock, M.T., Miller, B.S., Bowman, A.W., 1999. Assessment of
eutrophication in the Firth of Clyde: analysis of coastal
water data from 1982 to 1996. Marine Pollution Bulletin 38,
222–231.
Bowers, D.G., Harker, G.E.L., Smith, P.S.D., Tett, P., 2000.
Optical properties of a region of freshwater influence (the
Clyde Sea). Estuarine, Coastal and Shelf Science 50,
717–726.
C.E.C., 1991a. Council Directive of 21 May 1991 concerning
urban waste water treatment (91/271/EEC). Official Journal
of the European Communities L135, 40–52 (30.5.91).
C.E.C., 1991b. Council Directive 91/676/EEC of 12 December
1991 concerning the protection of waters against pollution
caused by nitrates from agricultural sources. Official
Journal of the European Communities L 375, 1–8
(31.12.91).
C.E.C., 2000. Directive 2000/60/EC of the European Parlia-
ment and of the Council of 23 October 2000 establishing a
framework for Community action in the field of water
policy. Official Journal of the European Communities L
327, 1–73 (22.12.2000).
C.E.C., 2002. Recommendation of the European Parliament
and of the Council of 30 May 2002 concerning the
implementation of Integrated Coastal Zone Management
in Europe (2002/413/EC). Official Journal of the European
Communities L 148, 24–27 (6.6.2002).
Caetano, M., Ferreira, J.G., Icely, J., Newton, A., Nunes, J.P.,
Vale, C., 2002. Ria Formosa. In: Gilpin, L., Tett, P. (Eds.),

ARTICLE IN PRESS
P. Tett et al. / Continental Shelf Research 23 (2003) 1635–16711668
OAERRE Sites Description Report. Napier University,
Edinburgh.
Caperon, J., Meyer, J., 1972. Nitrogen-limited growth of
marine phytoplankton—I. Changes in population charac-
teristics with steady-state growth rate. Deep-Sea Research
19, 601–618.
Cloern, J.E., 2001. Our evolving conceptual model of the
coastal eutrophication problem. Marine Ecology—Progress
Series 10, 223–253.
CSTT, 1994. Comprehensive studies for the purposes of Article
6 of DIR 91/271 EEC, the Urban Waste Water Treatment
Directive. Published for the Comprehensive Studies Task
Team of Group Coordinating Sea Disposal Monitoring by
the Forth River Purification Board, Edinburgh.
CSTT, 1997. Comprehensive studies for the purposes of Article
6 & 8.5 of DIR 91/271 EEC, the Urban Waste Water
Treatment Directive, second edition. Published for the
Comprehensive Studies Task Team of Group Coordinating
Sea Disposal Monitoring by the Department of the
Environment for Northern Ireland, the Environment
Agency, the Scottish Environmental Protection Agency
and the Water Services Association, Edinburgh.
Dillon, P.J., Rigler, F.H., 1974. The phosphorus–chlorophyll
relationship in lakes. Limnology and Oceanography 19,
767–773.
DiToro, D.M., 2001. Sediment flux modelling. Wiley Inter-
Science, New York.
Doran, J., 2001. Intervening to achieve co-operative ecosystem
management: towards an agent based model. Journal of
Artificial Societies and Social Simulation, 4: http://
www.soc.surrey.ac.uk/JASSS/4/2/4.html.
Downing, J.A., Osenberg, C.W., Sarnelle, O., 1999. Meta-
analysis of marine nutrient-enrichment experiments: varia-
tion in the magnitude of nutrient limitation. Ecology 80,
1157–1167.
Droop, M.R., 1983. 25 years of algal growth kinetics—a
personal view. Botanica Marina 26, 99–112.
Edler, L., 1997. In: Report of the ICES/HELCOM Workshop
on Quality Assurance of pelagic biological measurements in
the Baltic Sea. ICES CM, 1997/E:5.
Edwards, V.R., 2001. The yield of marine phytoplankton
chlorophyll from dissolved inorganic nitrogen under eu-
trophic conditions. Ph.D. Thesis, Napier University,
Edinburgh.
Edwards, A., Baxter, M.S., Ellett, D.J., Martin, J.H.A.,
Meldrum, D.T., Griffiths, C.R., 1986. Clyde Sea hydro-
graphy. Proceedings of the Royal Society of Edinburgh 90B,
67–83.
Elliott, A.J., Li, Z., 1995. A model of the annual cycle of
temperature in the north-west European shelf seas with
stochastic wind forcing. Estuarine, Coastal and Shelf
Science 40, 265–280.
Elmgren, A., 1997. Himmerfj.arden: changes in a nutrient
enriched coastal ecosystem (english summary of the report).
In: Elmgren, R., Larsson, U. (Eds.), Himmerfj.arden.
Naturv(ardsverket F .orlag, Stockholm, Rapport 4565,
pp. 13–18.
Elmgren, R., Larsson, U. (Eds.), 1997. Himmerfj.arden.
Naturv(ardsverket F .orlag, Stockholm, Rapport 4565.
Engqvist, A., 1997. Vatten- och n.arsltutbyte i hela Himmerfj-
.arden. In: Elmgren, R., Larsson, U. (Eds.), Himmerfj.arden.
Naturv(ardsverket F .orlag, Stockholm, Rapport 4565,
pp. 120–143.
Erlandsson, C.P., Arneborg, L., 2002. In: Gilpin, L., Tett, P.
(Eds.), Gullmar Fjord. OAERRE Sites Description Report.
Napier University, Edinburgh.
Folack, J., 1986. Variations mensuelles de la biomasse et de la
production du phytoplancton d’une zone c #oti"ere d’int!er#et
aquicole: Anse de Carteau—Golfe de Fos. Th"ese 3 "eme
cycle, Universit!e de la M!editerran!ee.
Foy, R.H., 1992. A phosphorous loading model for Northern
Irish Lakes. Water Research 26, 633–638.
Gerlach, S.A., 1990. Nitrogen, phosphorus, plankton and
oxygen deficiency in the German Bight and in Kiel Bay.
Kieler Meeresforschungen, Sonderheft 7, 1–341.
GESAMP, 1996. (IMO/FAO/Unesco-IOC/WMO/WHO/
IAEA/UN/UNEP Joint Group of Experts on the Scientific
Aspects of Marine Environmental protection) Monitoring
the ecological effects of coastal aquaculture wastes. Food
and Agricultural Organization of the United Nations,
Rome, Reports and Studies by GESAMP, vol. 57, 38pp.
Gillbricht, M., 1988. Phytoplankton and nutrients in the
Helgoland region. Helgolander Meeresuntersuchungen 42,
435–467.
Gillibrand, P.A., Turrell, W.R., 1997. The use of simple models
in the regulation of the impact of fish farms on water quality
in Scottish sea lochs. Aquaculture 159, 33–46.
Glibert, A.J., Janssen, R., 1998. Use of environmental functions
to communicate the values of a mangrove ecosystem under
different management regimes. Ecological Economics 25,
323–346.
Goffe, P., 1995. The benefits of improvements in coastal water
quality: a contingent approach. Journal of Environmental
Management 45, 305–317.
Gowen, R.J., 1994. Managing eutrophication associated with
aquacultural development. Journal of Applied Ichthyology
10, 242–257.
Gowen, R.J., Ezzi, I., 1992. Assessment and prediction of the
potential for hypernutrification and eutrophication asso-
ciated with cage cultures of salmonids in Scottish coastal
waters. NERC, Dunstaffnage Marine Laboratory, Oban,
Argyll, Scotland, 136pp.
Gowen, R.J., Tett, P., Wood, B.J.B., 1983. Changes in the
major dihydroporphyrin plankton pigments during the
spring bloom of phytoplankton in two Scottish sea-lochs.
Journal of the Marine Biological Association of the United
Kingdom 63, 27–36.
Gowen, R.J., Tett, P., Jones, K.J., 1992. Predicting marine
eutrophication: the yield of chlorophyll from nitrogen in
Scottish coastal phytoplankton. Marine Ecology—Progress
Series 85, 153–161.
Gowen, R.J., Hydes, D.J., Mills, D.K., Stewart, B.M., Brown,
J., Gibson, C.E., Shammon, T.M., Alien, M., Malcolm, S.J.,
2002. Assessing trends in nutrient concentrations in coastal

ARTICLE IN PRESS
P. Tett et al. / Continental Shelf Research 23 (2003) 1635–1671 1669
shelf seas: a case study in the Irish Sea. Estuarine, Coastal
and Shelf Science 54, 827–939.
Grantham, B., Tett, P., 1993. The nutrient status of the Clyde
Sea in winter. Estuarine, Coastal and Shelf Science 36,
449–462.
Grenz, C., 2002. Golfe de Fos. In: Gilpin, L., Tett, P. (Eds.),
OAERRE Sites Description Report. Napier University,
Edinburgh.
Haig, A.J.N., 1986. Use of the Clyde estuary and Firth for the
disposal of effluents. Proceedings of the Royal Society of
Edinburgh 90B, 393–405.
Hansen, O.S., Ærtegbjerg, G., Molvær, J., Magnusson, J., 2001.
Eutrophication, current status and development. In: Karl-
son, B., H(akansson, B., Sj .oberg, B. (Eds.), Skagerrak—
Environmental State and Monitoring Prospects. Swedish
Meteorological and Hydrological Institute, G .oteborg,
pp. 13–45.
Hastings, A., Powell, T., 1991. Chaos in a three-species food
chain. Ecology 72, 896–903.
Hecky, R.E., Kilham, P., 1988. Nutrient limitation of
phytoplankton in freshwater and marine environments: a
review of recent evidence on the effects of enrichment.
Limnology and Oceanography 33, 796–822.
Holmes, R.W., 1970. The Secchi disk in turbid coastal zones.
Limnology and Oceanography 15, 688–694.
Hop, H., Pearson, T., Hegseth, E.N., Kovacs, K.M., Wiencke,
C., Kwasniewski, S., et al., 2002. The marine ecosystem of
Kongsfjorden. Svalbard. Polar Research 21, 167–208.
Janzen, C.D., Simpson, J.H., Cottier, F., 2002. Frontal controls
on the cross-sill exchange of a broad fjord. AGU/ASLO
Ocean Sciences Meeting, Honolulu, HI; EOS Transactions
AGU 83 (4), OS358.
Jassby, A.D., Platt, T., 1976. Mathematical formulation of the
relationship between photosynthesis and light for phyto-
plankton. Limnology and Oceanography 21, 540–547.
Jones, K.J., Tett, P., Wallis, A.C., Wood, B.J.B., 1978.
Investigation of a nutrient-growth model using a continuous
culture of natural phytoplankton. Journal of the Marine
Biological Association of the United Kingdom 58,
923–941.
Jones, K.J., Grantham, B., Ezzi, I., Rippeth, T., Simpson, J.,
1995. Physical contols on phytoplankton and nutrient cycles
in the Clyde Sea, a fjordic system on the west coast of
Scotland. In: Skjoldal, H.R., Hopkins, C., Erikstad, K.E.,
Leinass, H.P. (Eds.), Ecology of Fjords and Coastal Waters.
Elsevier, Amsterdam, pp. 93–104.
Justic, D., Rabalais, N.N., Turner, R.E., 1995. Stoichiometric
nutrient balance and origin of coastal eutrophication.
Marine Pollution Bulletin 30, 41–46.
Kasai, A., Rippeth, T.H., Simpson, J.H., 1999. Density and
flow structure in the Clyde Sea front. Continental Shelf
Research 19, 1833–1848.
Kratzer, S., 2000. Bio-optical studies of coastal waters. Ph.D.
Thesis, University of Wales, Bangor.
Larsson, U., 1997. Tidstrender. In: Elmgren, R., Larsson, U.
(Eds.), Himmerfj.arden. Naturv(ardsverket F .orlag, Stock-
holm, Rapport 4565.
Larsson, U., Engqvist, A., 1997. Material transport till
Himmerfj.ardens inre bass.ang. In: Elmgren, R., Larsson,
U. (Eds.), Himmerfj.arden. Naturv.ardsverket F .orlag, Stock-
holm, Rapport 4565, pp. 144–158.
Larsson, U., Kratzer, S., 2002. Himmerfj.arden In: Gilpin, L.,
Tett, P. (Eds.), OAERRE Sites Description Report, Vol. 2.
Napier University, Edinburgh, pp. 33–43.
Le Gall, A.C., Hydes, D.J., Kelly-Gerreyn, B., Slinn, D.J.,
2000. Development of a 2D horizontal biogeochemical
model for the Irish Sea DYMONIS. ICES Journal of
Marine Science 57, 1050–1059.
Lederman, T.C., Tett, P., 1981. Problems in modelling
the photosynthesis–light relationship for phytoplankton.
Botanica Marina 24, 125–134.
Lee, J.-Y., 2002. A coupled physical–biological model of the
Firth of Clyde. Ph.D. Thesis, Napier University, Edinburgh.
Lee, J.-Y., Tett, P., Jones, K., Jones, S., Luyten, P., Smith, C.,
Wild-Allen, K., 2002. The PROWQM physical–biological
model with benthic–pelagic coupling applied to the northern
North Sea. Journal of Sea Research 48, 287–331.
Levasseur, M., Thompson, P.A., Harrison, P.J., 1993. Physio-
logical acclimation of marine phytoplankton to different
nitrogen sources. Journal of Phycology 29, 587–595.
Lindahl, O., 1987. Plankton community dynamics in relation to
water exchange in the Gullmar Fjord, Sweden. Ph.D.
Thesis, University of Stockholm.
Lindahl, O., 1994. Long-term studies of primary production in
the Gullmar Fjord, Sweden. In: Skjordal, H.R., Hopkins,
C., Erikstad, K.E., Leinaas, H.P. (Eds.), Ecology of Fjords
and Coastal Waters. Elsevier, Amsterdam, pp. 105–112.
Luyten, P.J., Jones, J.E., Proctor, R., Tabor, A., Tett, P., Wild-
Allen, K., 1999. COHERENS—a coupled hydrodynamical–
ecological model for regional and shelf seas: user docu-
mentation. Management Unit of the Mathematical
Models of the North Sea, MUMM Internal Document,
911pp.
Mantoura, R.F.C., Jeffrey, S.W., Llewellyn, C.A., Claustre, H.,
Morales, C.E., 1997. Comparison between spectrophoto-
metric, fluorometric and HPLC methods for chlorophyll
analysis. In: Jeffrey, S.W., Mantoura, R.F.C., Wright, S.W.
(Eds.), Phytoplankton Pigments in Oceanography. UNES-
CO, Pairs, pp. 361–380.
Middleburg, J.J., Soertaert, K., Herman, P.J., Heip, C.H.R.,
1996. Denitrification in marine sediments: a model study.
Global Biogeochemical Cycles 10, 661–673.
Midgely, R.P., 1998. Circulation, mixing and renewal in the
Clyde Sea. Ph.D. Thesis, University of Wales, Bangor.
Midgely, R.P., Simpson, J.H., Hyder, P., Rippeth, T.P., 2001.
Seasonal cycle of vertical structure and deep water renewal
in the Clyde Sea. Estuarine, Coastal and Shelf Science 53,
813–823.
Millot, C., 1991. Mesoscale and seasonal variabilities of the
circulation in the western Mediterranean. Dynamics of
Atmospheres and Oceans 15, 179–214.
Muller, F.L.L., Balls, P.W., Tranter, M., 1995. Annual
geochemical mass balances in waters of the Firth of Clyde.
Oceanologica Acta 18, 5.

ARTICLE IN PRESS
P. Tett et al. / Continental Shelf Research 23 (2003) 1635–16711670
Newton, A., Icely, J.D., Falc*ao, M., Nobre, A., Nunes, J.G.,
Ferreira, J.G., Vale, C., 2003. Evaluation of eutrophication
in the Ria Formosa coastal lagoon, Portugal. Continental
Shelf Research, this issue (doi:10.1016/j.csr.2003.06.008).
Nixon, S.W., 1995. Coastal marine eutrophication: a definition,
social causes, and future concerns. Ophelia 41, 199–219.
OECD, 1982. Eutrophication of Waters, Monitoring, Assess-
ment and Control. Organisation for Economic Cooperation
and Development, Paris.
Officer, C.B., 1976. Physical Oceanography of Estuaries. Wiley,
New York.
Officer, C.B., Ryther, J.H., 1980. The possible importance of
silicon in marine eutrophication. Marine Ecology—Progress
Series 3, 89–91.
OSPAR, 2001a. Draft Common Assessment Criteria and their
Application within the Comprehensive Procedure of the
Common Procedure. Meeting of The Eutrophication Task
Group, London, 9–11 October 2001, Annex 5. Ospar
Convention For The Protection of The Marine Environ-
ment of The North-East Atlantic.
OSPAR, 2001b. First Proposal for Integrating the OSPAR
Common Procedure and the Water Framework Directive
with respect to Eutrophication. Meeting of The Eutrophica-
tion Task Group, London, 9–11 October 2001, Annex 6.
Ospar Convention For The Protection of The Marine
Environment of The North-East Atlantic.
Prieur, L., Sathyendranath, S., 1981. An optical classification of
coastal and oceanic waters based on the specific spectral
absorption curves of phytoplankton pigments, dissolved
organic matter, and other particulate materials. Limnology
and Oceanography 26, 671–689.
Rabouille, C., Gaillard, J.-F., 1991. Towards the EDGE: Early
diagenetic global explanation. A model depicting
the early diagenesis of organic matter, O2; NO3; Mn
and PO4: Geochimica and Cosmochimica Acta 55,
2511–2525.
Raymont, J.E.G., 1980. Plankton and productivity in the
oceans, 2nd edition, vol. 1. Phytoplankton, Pergamon,
Oxford.
Rippeth, T., 1993. The control of stratification in a fjordic
system (the Clyde Sea). Ph.D. University of Wales,
Bangor.
Rippeth, T.P., Jones, K.J., 1997. The seasonal cycle of nitrate in
the Clyde Sea. Journal of Marine Systems 12, 299–310.
Rippeth, T.P., Midgely, R.P., Simpson, J.H., 1995. The
seasonal cycle of stratification in a Scottish fjord. In:
Skjoldal, H.R., Hopkins, C., Erikstad, K.E., Leinass, H.P.
(Eds.), Ecology of Fjords and Coastal Waters. Elsevier,
Amsterdam.
Rodhe, W., 1969. Crystallization of eutrophication concepts in
northern Europe. In: Rohlich, G.A. (Ed.), Eutrophication:
Causes, Consequences, Correctives. National Academy of
Sciences, Washington, DC, pp. 50–64.
Ross, A.H., Gurney, W.S.C., Heath, M.R., Hay, S.J.,
Henderson, E.W., 1993. A strategic simulation model of a
fjord ecosystem. Limnology and Oceanography 38,
128–153.
Ross, A.H., Gurney, W.S.C., Heath, M.R., 1994. A compara-
tive study of the ecosystem dynamics of 4 fjords. Limnology
and Oceanography 39, 318–343.
Ruardij, P., van Raaphorst, W., 1995. Benthic nutrient
regeneration in the ERSEM ecosystem model of the North
Sea. Netherlands Journal of Sea Research 33, 453–483.
Ryther, J.H., Dunstan, W.M., 1971. Nitrogen, phosphorus and
eutrophication in the inshore marine environment. Science
171, 1008–1013.
Sakshaug, E., Andresen, K., Kiefer, D.A., 1989. A steady state
description of growth and light absorption in the marine
planktonic diatom Skeletonema costatum. Limnology and
Oceanography 34, 198–205.
Sanden, P., H(akansson, B., 1996. Long-term trends in the
Secchi depth in the Baltic Sea. Limnology and Oceano-
graphy 41, 346–351.
Schindler, D.W., 1977. Evolution of phosphorus limitation in
lakes. Science 195, 260–262.
Schindler, D.W., Fee, E.J., Ruszczynski, T., 1978. Phosphorus
input and its consequences for phytoplankton standing crop
in the Experimental Lake Area and in similar lakes. Journal
of the Fisheries Research Board of Canada 35, 190–196.
Seitzinger, S.P., 1988. Denitrification in freshwater and coastal
marine ecosystems: Ecological and geochemical conse-
quences. Limnology and Oceanography 33, 702–724.
Simpson, J.H., Rippeth, T.P., 1993. The Clyde Sea: a model of
the seasonal cycle of stratification and mixing. Estuarine,
Coastal and Shelf Science 37, 129–144.
Soederstroem, J., 1996. The significance of observed nutrient
concentrations in the discussion about nitrogen and
phosphorus as limiting nutrients for the primary carbon
flux in coastal water ecosystems. Sarsia 81, 81–96.
Soetaert, K., Herman, P.M.J., Middelburg, J.J., 1996. A model
of early diagenetic processes from the shelf to abyssal
depths. Geochimica et Cosmochimica Acta 60, 1019–1040.
Sosik, H.M., Mitchell, B.G., 1991. Absorption fluorescence and
quantum yield for growth in nitrogen limited Dunaliella
tertiolecta. Limnology and Oceanography 36, 910–921.
Sosik, H.M., Mitchell, B.G., 1994. Effects of temperature on
growth, light absorption, and quantum yield in Dunaliella
tertiolecta (Chlorophyceae). Journal of Phycology 30,
833–840.
Stigebrandt, A., 1976. Vertical diffusion driven by internal
waves in a sill fjord. Journal of Physical Oceanography 6,
486–495.
Stigebrandt, A., 2001. FJORDENV—a water quality model for
fjords and other inshore waters. Earth Sciences Centre,
G .oteborg University, G .oteborg, C40 2001, 41pp.
Stigebrandt, A., Aure, J., 1979. Observational evidence for
vertical diffusion driven by internal waves of tidal origin in
the Oslofjord. Journal of Physical Oceanography 9,
435–441.
Svansson, A., 1984. Hydrography of the Gullmar Fjord.
Institute of Hydrographic Research, G .oteborg, Report, 23.
Svendsen, H., Beszczynska-M^ller, A., Hagen, J.O., Lefaucon-
nier, B., Tverberg, V., Gerland, S., Ørbæk, J.B., Bischof, K.,
Papucci, C., Zajaczkowksi, M., Azzolini, R., Bruland, O.,

ARTICLE IN PRESS
P. Tett et al. / Continental Shelf Research 23 (2003) 1635–1671 1671
Wiencke, C., Winther, J.-G., Dallmann, W., 2002. The
physical environment of Kongsfjorden-Krossfjorden, an
Arctic fjord system in Svalbard. Polar Research 21,
133–166.
Taylor, D., Nixon, S., Granger, S., Buckley, B., 1995. Nutrient
limitation and the eutrophication of coastal lagoons.
Marine Ecology—Progress Series 127, 235–244.
Tett, P., 1990. The photic zone. In: Herring, P.J., Campbell,
A.K., Whitfield, M., Maddock, L. (Eds.), Light and Life in
the Sea. Cambridge University Press, Cambridge, UK,
pp. 59–87.
Tett, P., 1998. Parameterising a microplankton model. Napier
University, Edinburgh, Report.
Tett, P., 2000. Marine eutrophication and the use of models. In:
Huxham, M., Summer, D. (Eds.), Science and Environ-
mental Decision Making. Addison-Wesley Longman/Pear-
son Education, London, pp. 215–238.
Tett, P., Grenz, C., 1994. Designing a simple microbiological–
physical model for a coastal embayment. Vie et Milieu 44,
39–58.
Tett, P., Walne, A., 1995. Observations and simulations of
hydrography, nutrients and plankton in the southern North
Sea. Ophelia 42, 371–416.
Tett, P., Wilson, H., 2000. From biogeochemical to ecological
models of marine microplankton. Journal of Marine
Systems 25, 431–446.
Tett, P., Heaney, S.I., Droop, M.R., 1985. The Redfield ratio
and phytoplankton growth rate. Journal of the Marine
Biological Association of the United Kingdom 65, 487–504.
Tett, P., Ar!ıstegui, J., Barton, D., Basterretxea, G., De Armas,
J.D., Esc!anez, J.E., Hern!andez Le !on, S., Lorenzo, L.M.,
Montero, N., 2002. Steady-state DCM dynamics in
Canaries waters. Deep-Sea Research II 49, 3543–3559.
Tett, P., Hydes, D., Sanders, R., Influence of nutrient
biogeochemistry on the ecology of North-West European
shelf seas. In: Schimmield, G., Black, K. (Eds.), Biogeo-
chemistry of Marine Systems. Sheffield Academic Press
Ltd., Sheffield, in press.
Thingstad, T.F., Zweifel, U.L., Rassoulzadegan, F., 1998. P
limitation of heterotrophic bacteria and phytoplankton in
the northwest Mediterranean. Limnology and Oceanogra-
phy 43, 88–94.
Turner, R.K., Georgiou, S., Gren, I.M., Wulff, F., Scott, B.,
Soderqvist, T., et al., 1999. Managing nutrient fluxes and
pollution in the Baltic: an interdisciplinary simulation study.
Ecological Economics 30, 333–352.
Ulses, C., 2002. Mod!elisation tridimensionnelle de la circula-
tion dans le golfe de Fos. Rapport DEA, Universit!e de la
M!editerran!ee, Marseille.
Vollenweider, R.A., 1976. Advances in defining critical loading
levels for phosphorus in lake eutrophication. Memorie
dell’Istituto Italiano di Idrobiologia 33, 53–83.
Vollenweider, R.A., 1992. Coastal marine eutrophication:
principles and control. The Science of the Total Environ-
ment 63 (suppl.), 1–20.
Wulff, F., Rahm, L., Rodriguez-Medina, M., 1994. Long-
term and regional variations of nutrients in the Baltic Sea:
1972–1991. Finnish Marine Research 262, 35–50.
Zehr, J.P., Falkowski, P.G., Fowler, J., Capone, D.G., 1988.
Coupling between ammonium uptake and incorporation in
a marine diatom: experiments with the short-lived radio-
isotope 13N: Limnology and Oceanography 33, 518–527.
Related Documents