Eutrophication and Algae 101: The good, the bad, and the slimy Mark Edlund St. Croix Watershed Research Station, Science Museum of Minnesota

Welcome message from author
This document is posted to help you gain knowledge. Please leave a comment to let me know what you think about it! Share it to your friends and learn new things together.
Transcript

Eutrophication and Algae 101: The good, the bad, and the
slimy
Mark Edlund
St. Croix Watershed Research Station, Science Museum of
Minnesota
St. Croix Watershed Research Station:
SCWRS: When, where, & why?• Established in 1989• Located ¼ mile from Wisconsin and 10 miles N
of Stillwater• A department in the Science Division of the
Science Museum of Minnesota• Mission:
Finding answers to important environmental questions impacting the St.Croix basin and watersheds worldwide
Let’s talk:
1. What are these algae?2. When are they good?3. When are they bad?4. How is our research helping understand andmanage lakes?
(caveats of today’s talk)
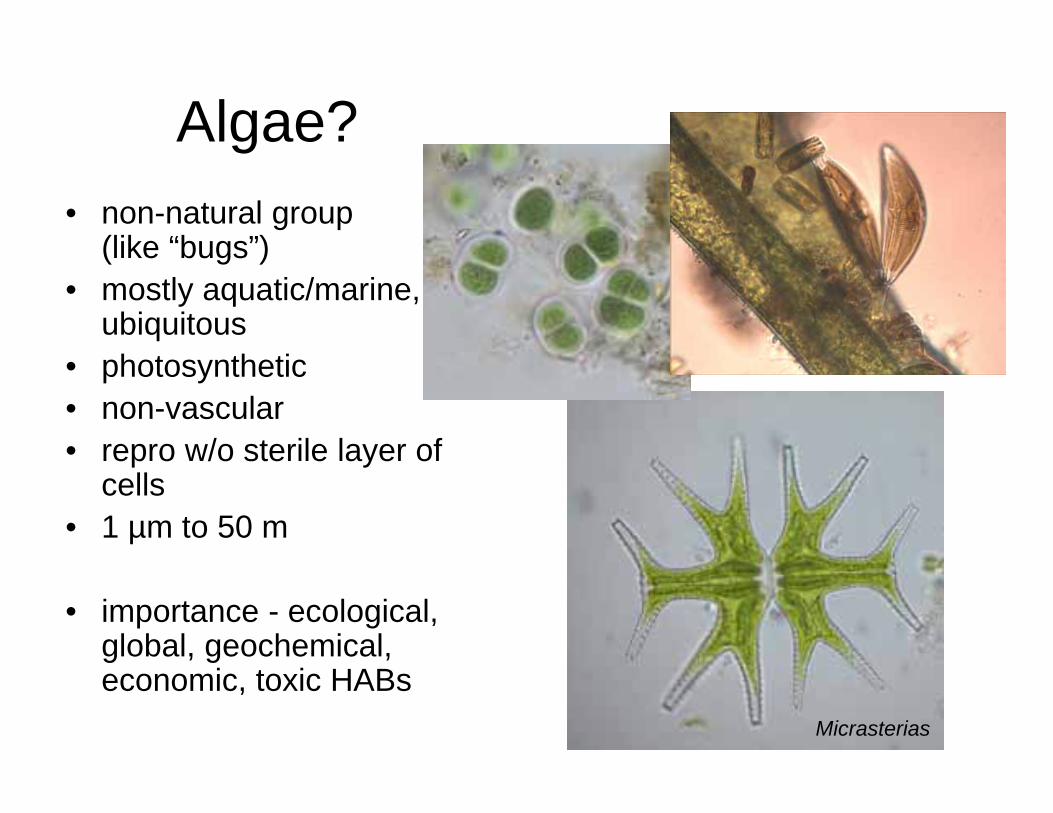
Algae?• non-natural group
(like “bugs”)• mostly aquatic/marine,
ubiquitous• photosynthetic• non-vascular• repro w/o sterile layer of
cells• 1 µm to 50 m
• importance - ecological, global, geochemical, economic, toxic HABs
Micrasterias
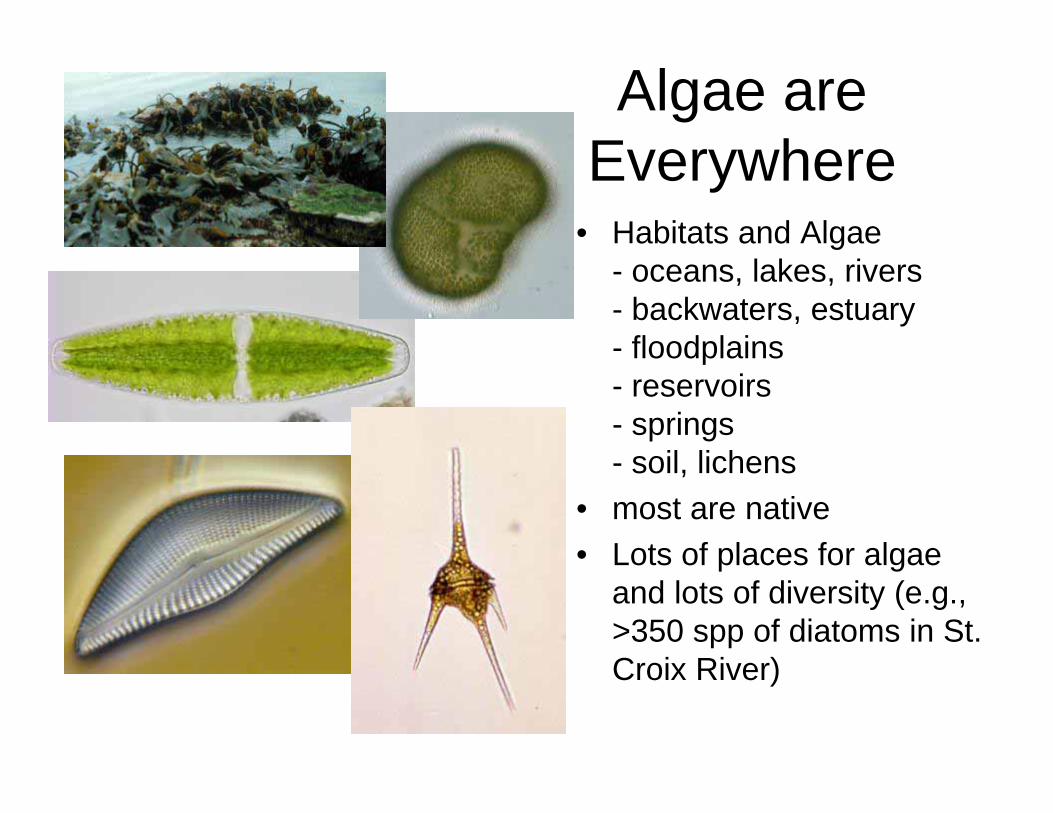
• Habitats and Algae - oceans, lakes, rivers- backwaters, estuary- floodplains- reservoirs- springs- soil, lichens
• most are native• Lots of places for algae
and lots of diversity (e.g., >350 spp of diatoms in St. Croix River)
Algae are Everywhere
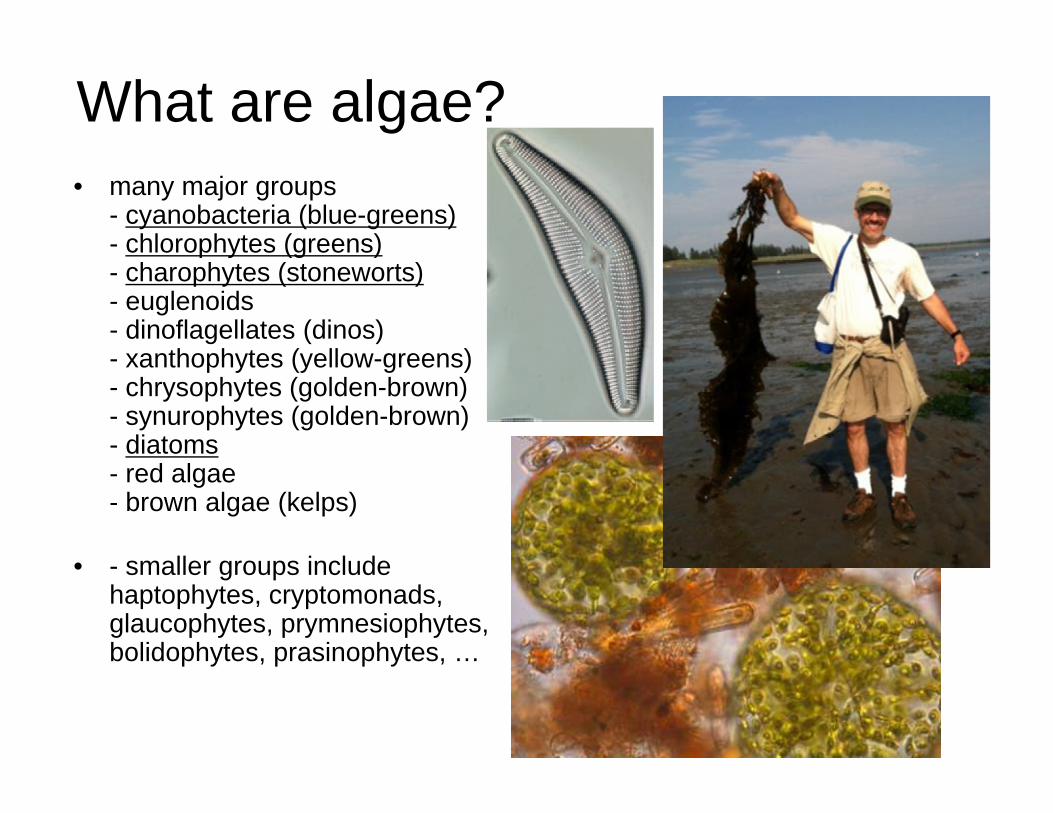
What are algae?• many major groups
- cyanobacteria (blue-greens)- chlorophytes (greens)- charophytes (stoneworts)- euglenoids- dinoflagellates (dinos)- xanthophytes (yellow-greens)- chrysophytes (golden-brown)- synurophytes (golden-brown)- diatoms- red algae- brown algae (kelps)
• - smaller groups include haptophytes, cryptomonads, glaucophytes, prymnesiophytes, bolidophytes, prasinophytes, …
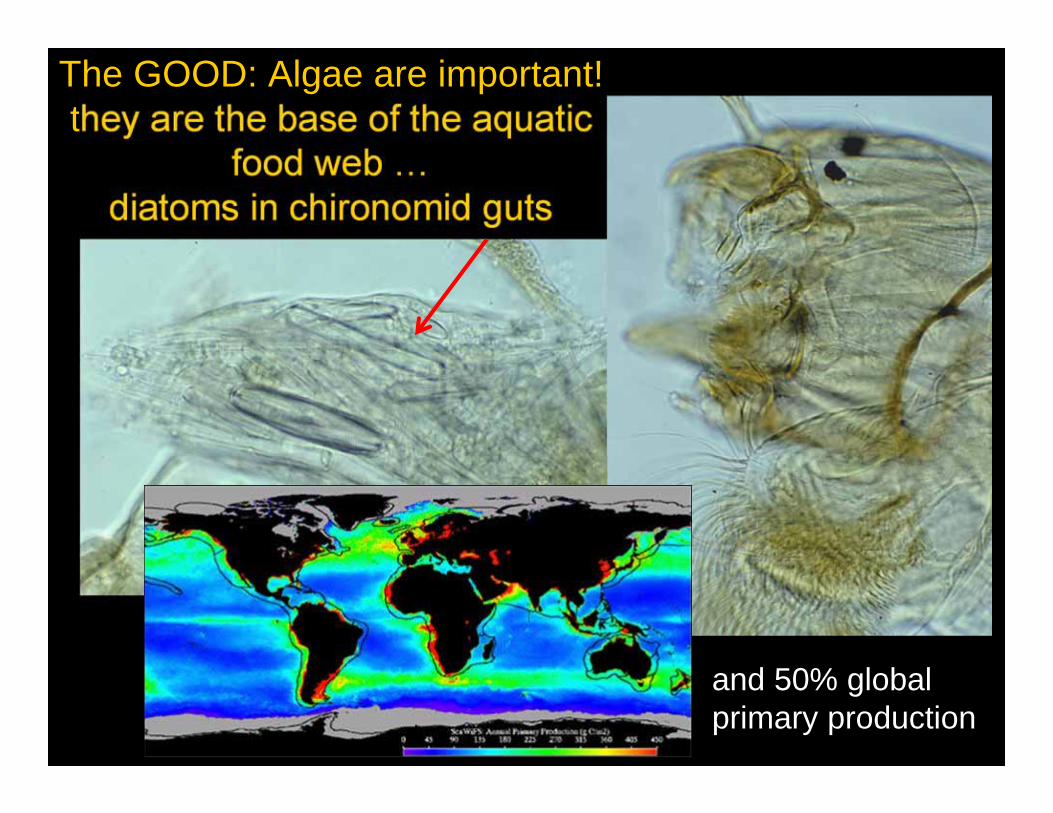
The GOOD: Algae are important!they are the base of the aquatic
food web …diatoms in chironomid guts
and 50% global primary production
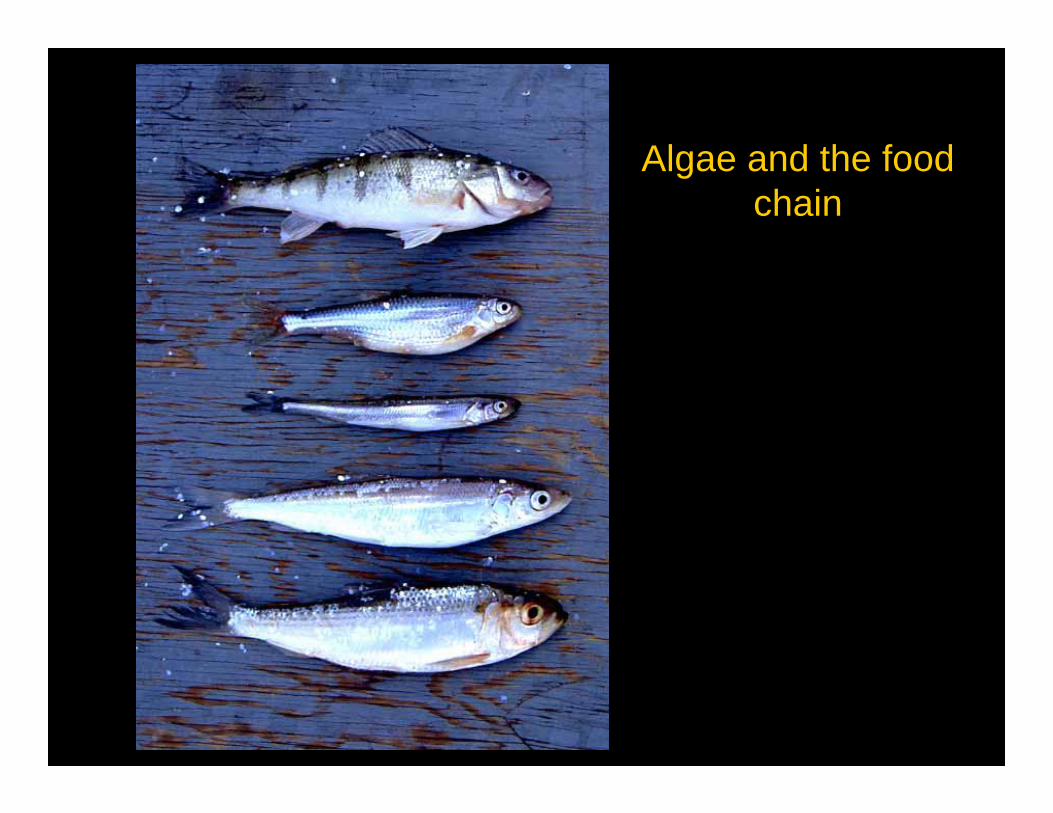
Algae and the food chain
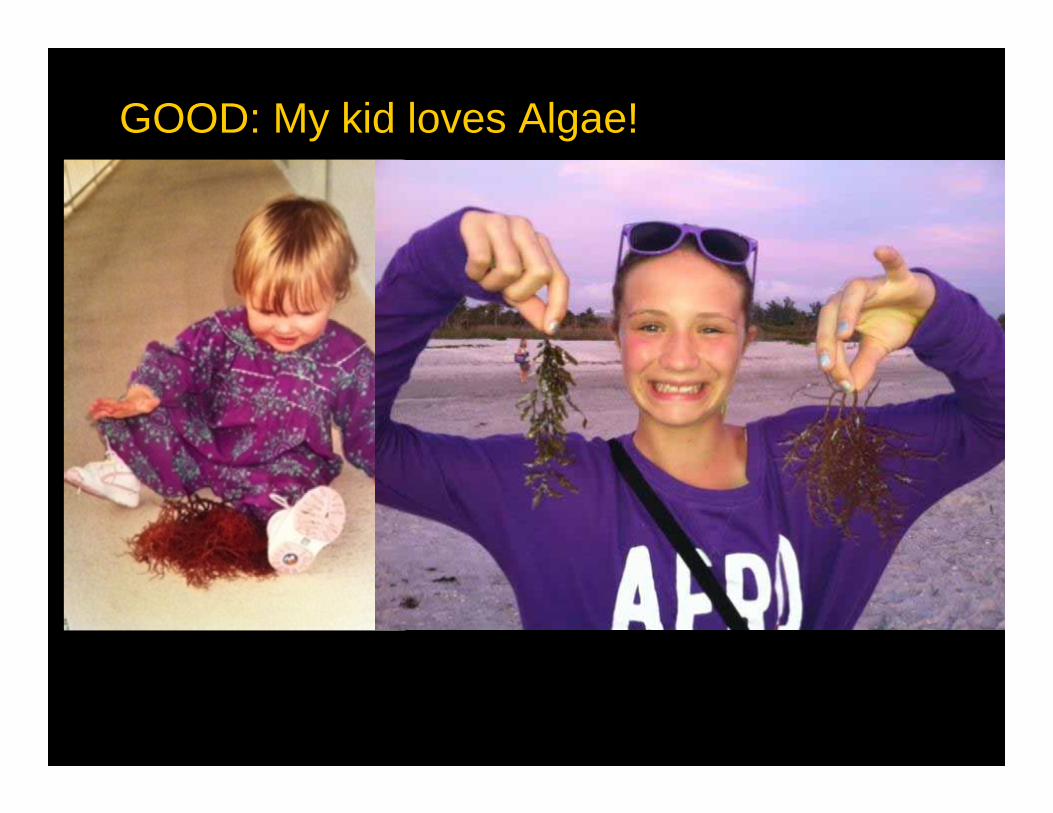
GOOD: My kid loves Algae!

More GOOD - biofuel sources, secondary metabolites, food, feed - Chaetoceros sp.
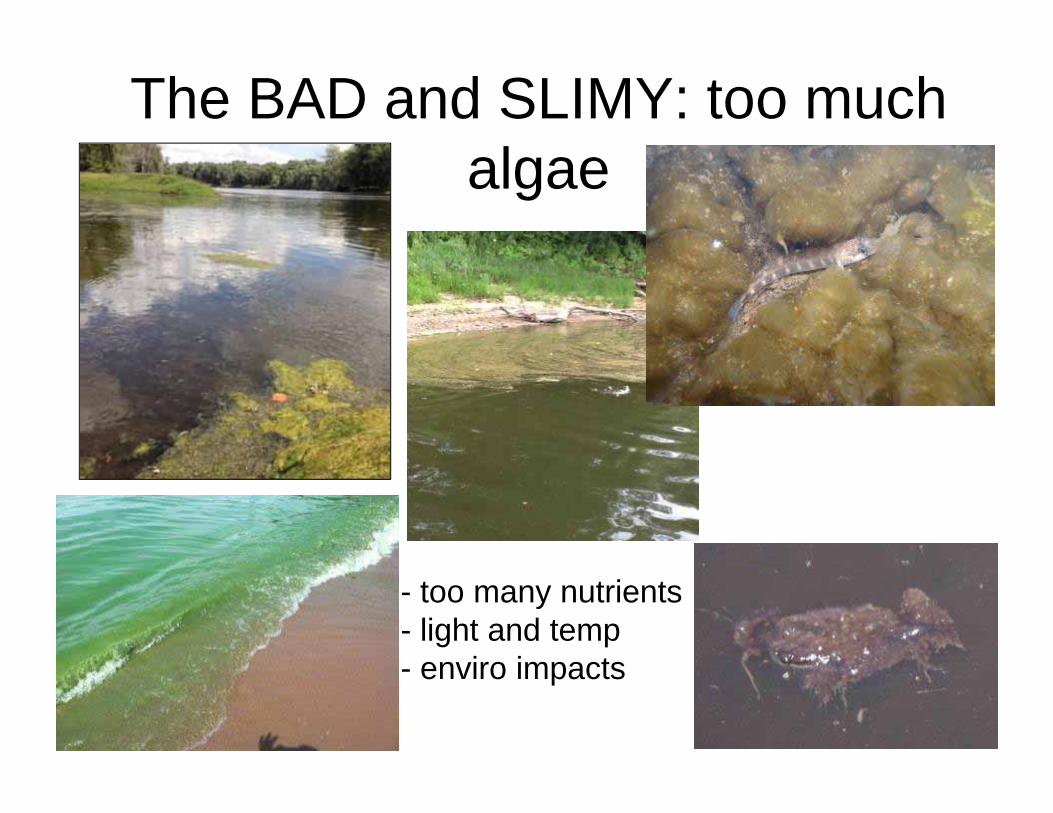
The BAD and SLIMY: too much algae
- too many nutrients- light and temp- enviro impacts

Who you calling a “nuisance”?• Nuisance Algae
- visible growths/blooms- accumulations- late summer, fall- impact recreation &
enjoyment & $$$- affect ecosystem
services- becoming more
common?- toxins!
Tabor Lake, Danbury, WI
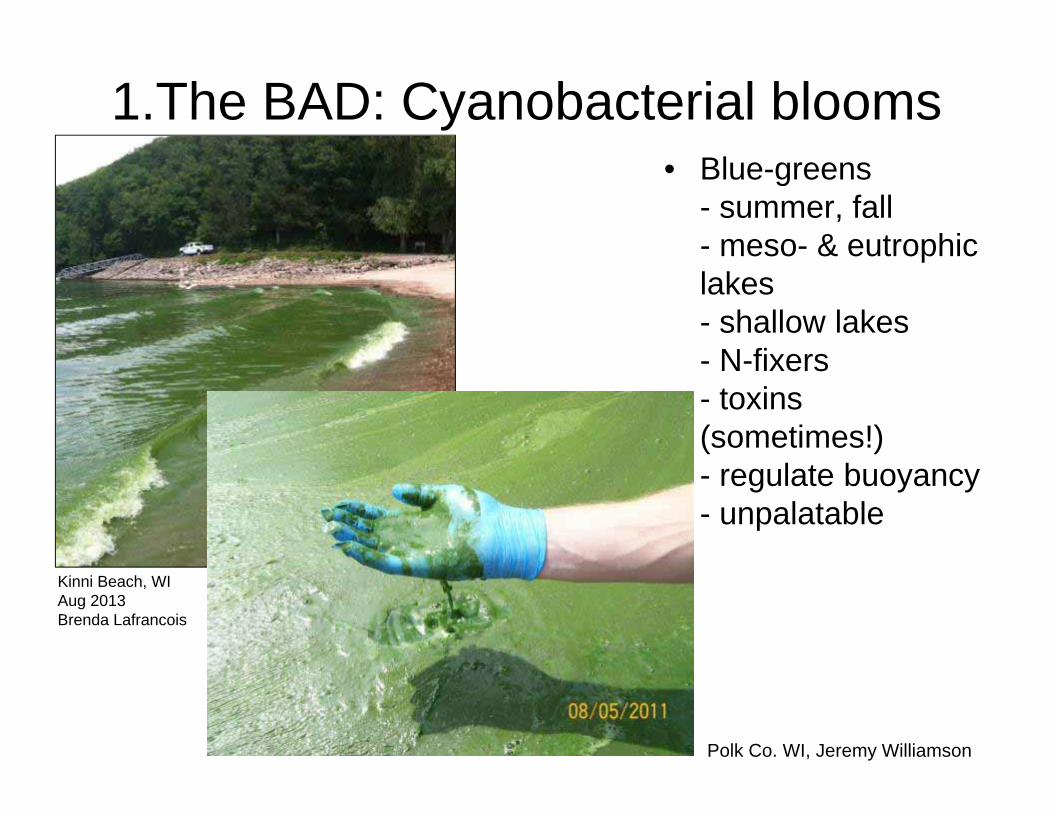
1.The BAD: Cyanobacterial blooms• Blue-greens
- summer, fall- meso- & eutrophic lakes - shallow lakes - N-fixers- toxins (sometimes!)- regulate buoyancy- unpalatable
Kinni Beach, WIAug 2013Brenda Lafrancois
Polk Co. WI, Jeremy Williamson
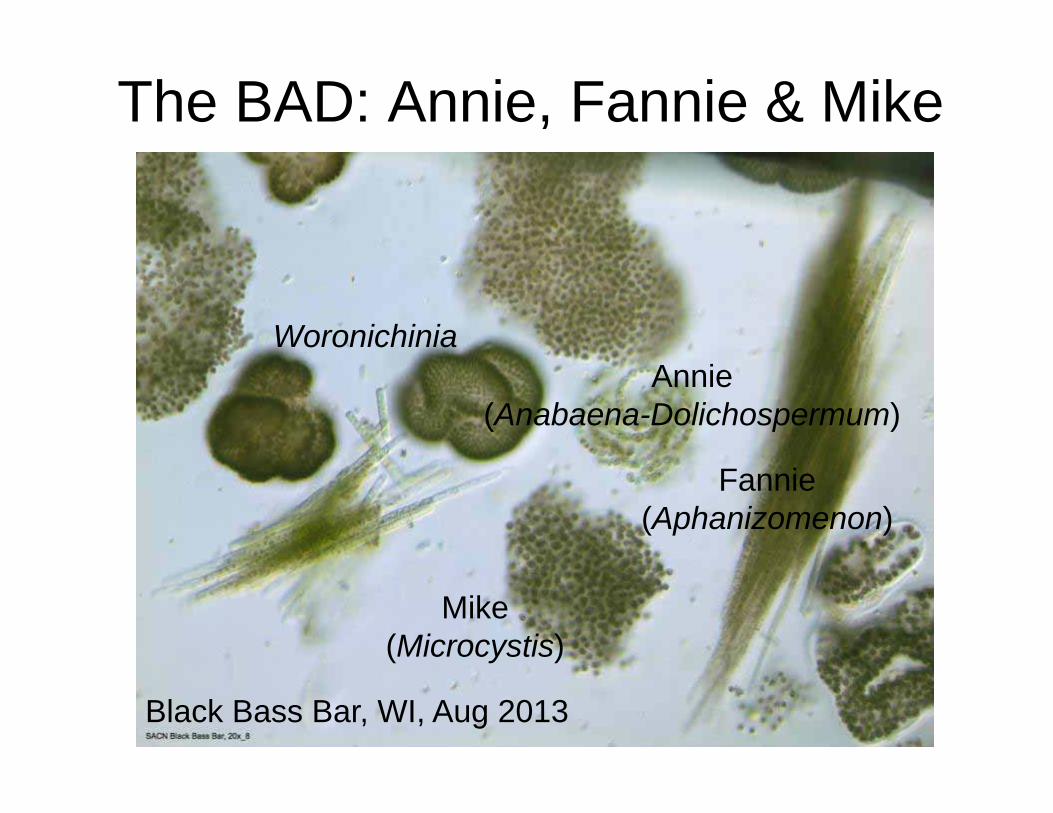
The BAD: Annie, Fannie & Mike
Black Bass Bar, WI, Aug 2013
Annie(Anabaena-Dolichospermum)
Mike(Microcystis)
Fannie(Aphanizomenon)
Woronichinia
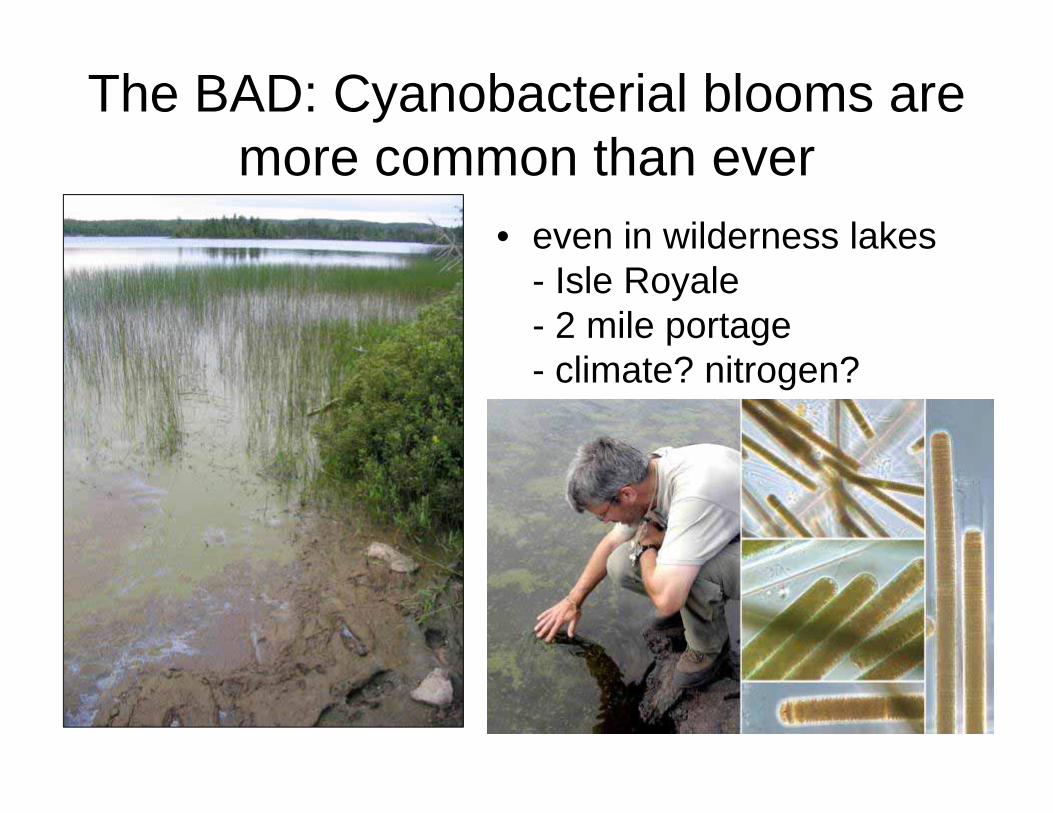
The BAD: Cyanobacterial blooms are more common than ever
• even in wilderness lakes- Isle Royale- 2 mile portage- climate? nitrogen?
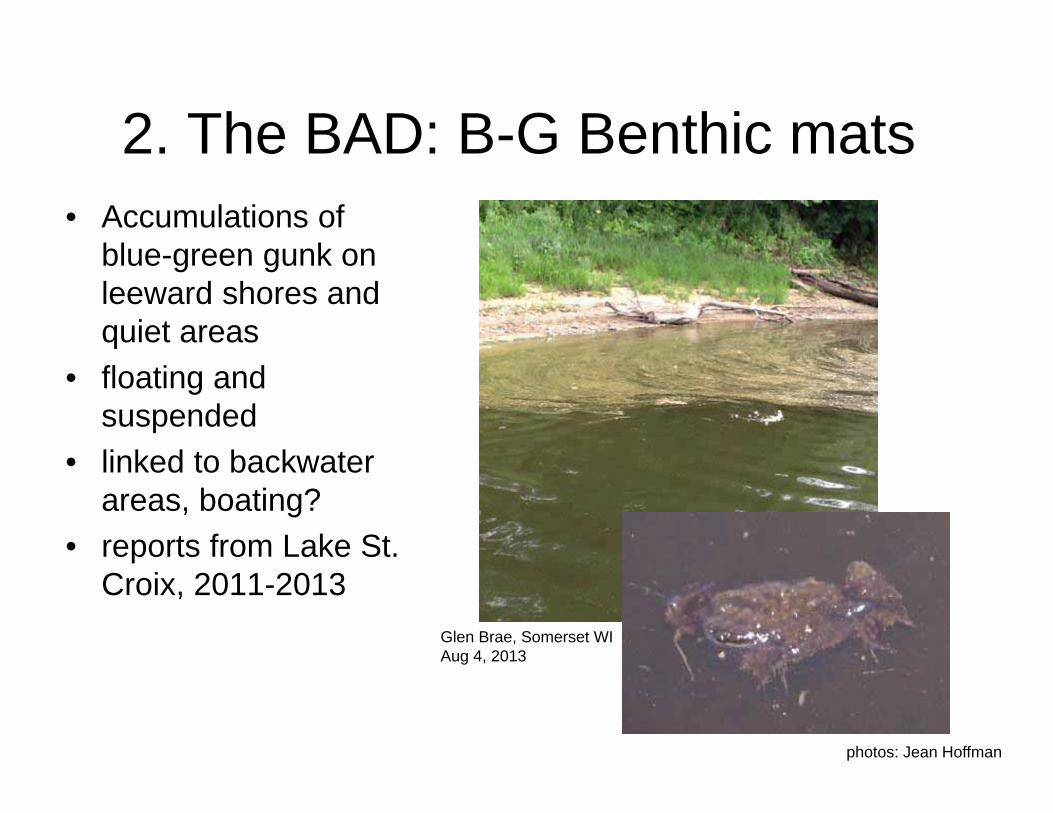
2. The BAD: B-G Benthic mats• Accumulations of
blue-green gunk on leeward shores and quiet areas
• floating and suspended
• linked to backwater areas, boating?
• reports from Lake St. Croix, 2011-2013
photos: Jean Hoffman
Glen Brae, Somerset WIAug 4, 2013
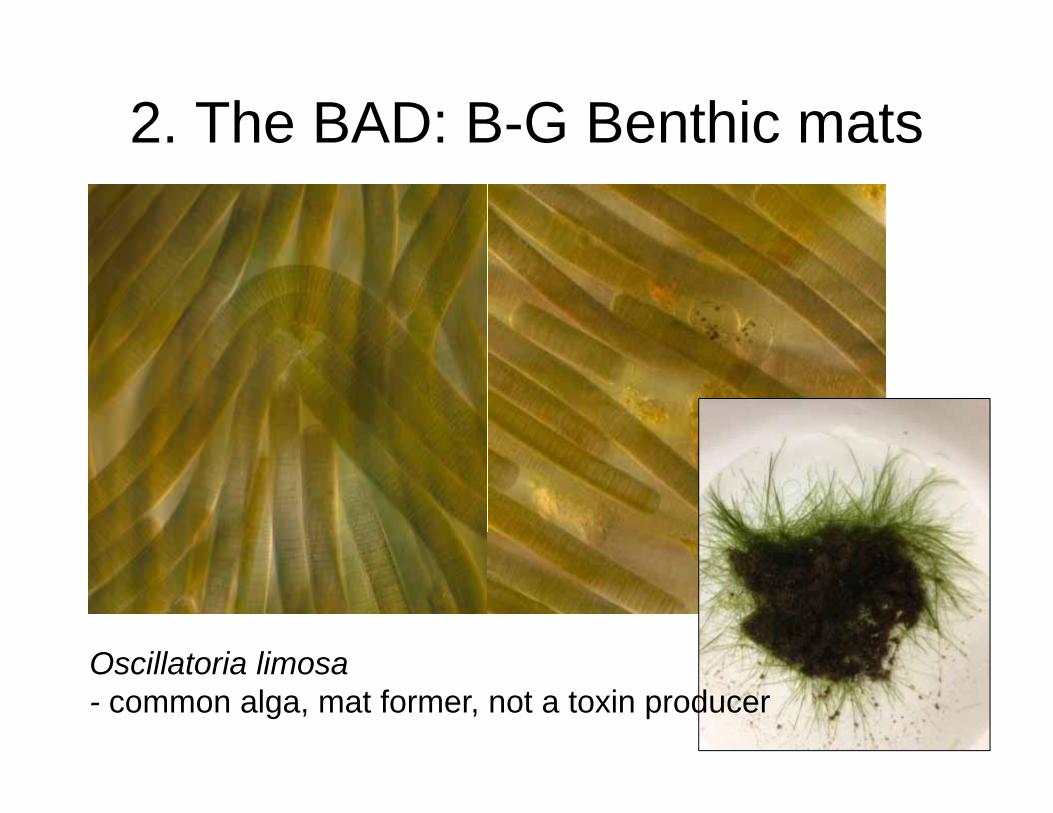
2. The BAD: B-G Benthic mats
Oscillatoria limosa- common alga, mat former, not a toxin producer
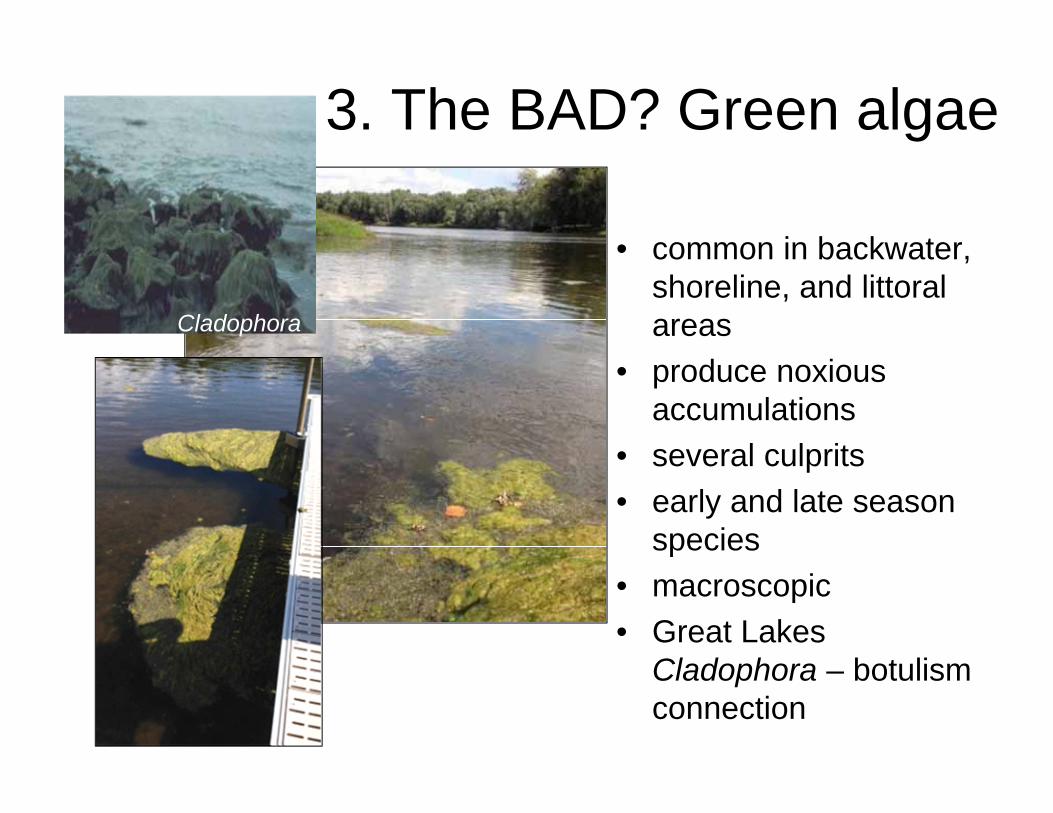
3. The BAD? Green algae
• common in backwater, shoreline, and littoral areas
• produce noxious accumulations
• several culprits• early and late season
species• macroscopic• Great Lakes
Cladophora – botulism connection
Cladophora

3. The BAD? Green algal mats
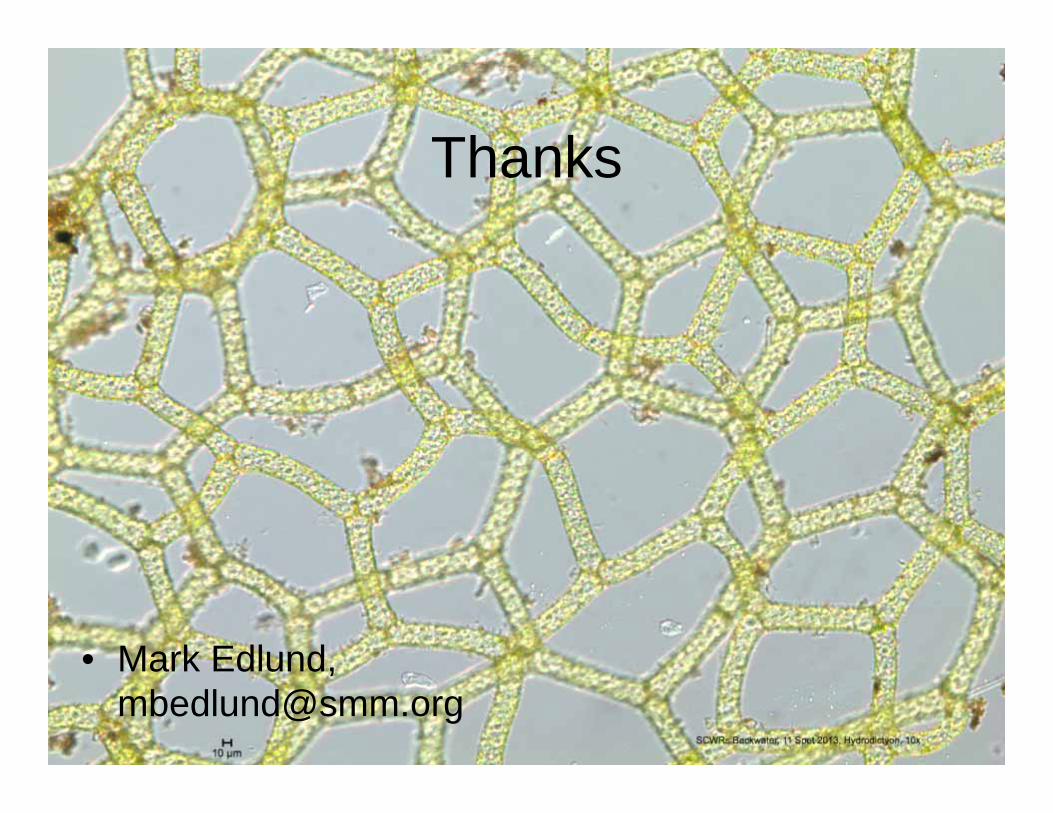
Spirogyra sp.Hydrodictyon reticulatum
(water net)
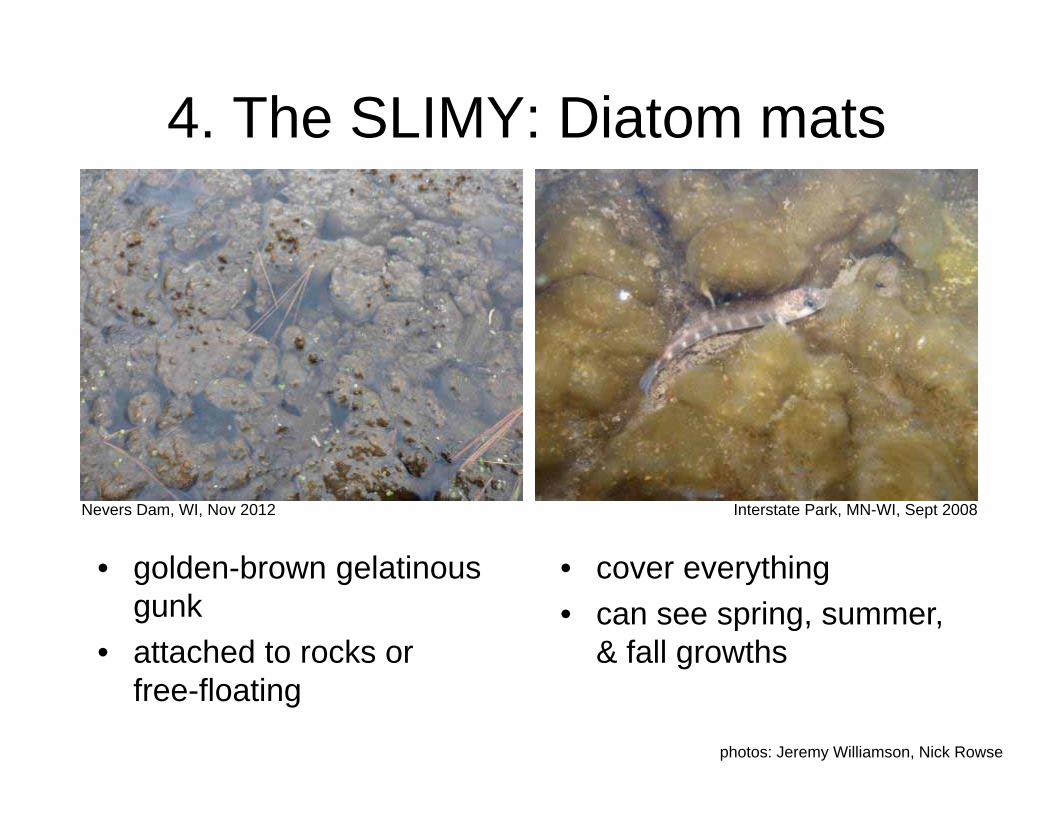
4. The SLIMY: Diatom mats
• golden-brown gelatinous gunk
• attached to rocks or free-floating
• cover everything• can see spring, summer,
& fall growths
photos: Jeremy Williamson, Nick Rowse
Nevers Dam, WI, Nov 2012 Interstate Park, MN-WI, Sept 2008

• mucilage stalks dominate biomass
• resistant polysaccharide
Sunrise Ferry Landing, August 2013
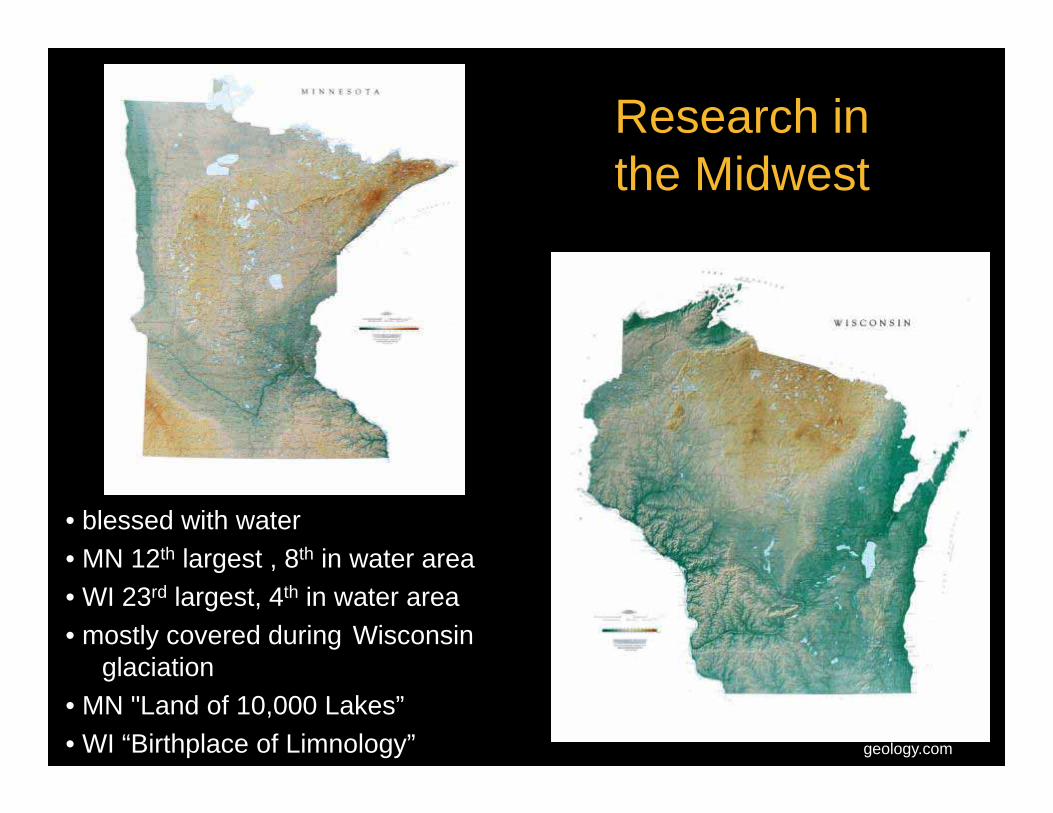
Research in the Midwest
• blessed with water• MN 12th largest , 8th in water area• WI 23rd largest, 4th in water area• mostly covered during Wisconsin
glaciation• MN "Land of 10,000 Lakes”• WI “Birthplace of Limnology” geology.com
Lake Research in the Midwest
geology.com
0-4 Superbowl recordOuch!
4-1 Superbowl record!
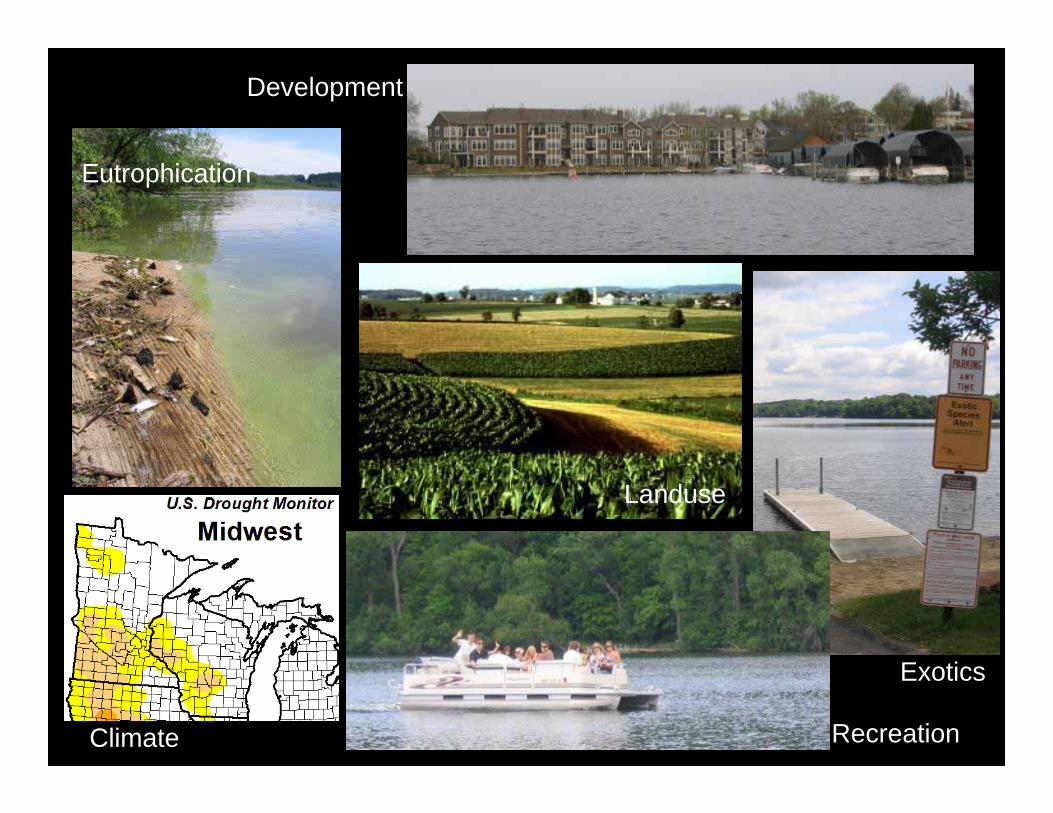
Recreation
Development
Exotics
Eutrophication
Climate
Landuse
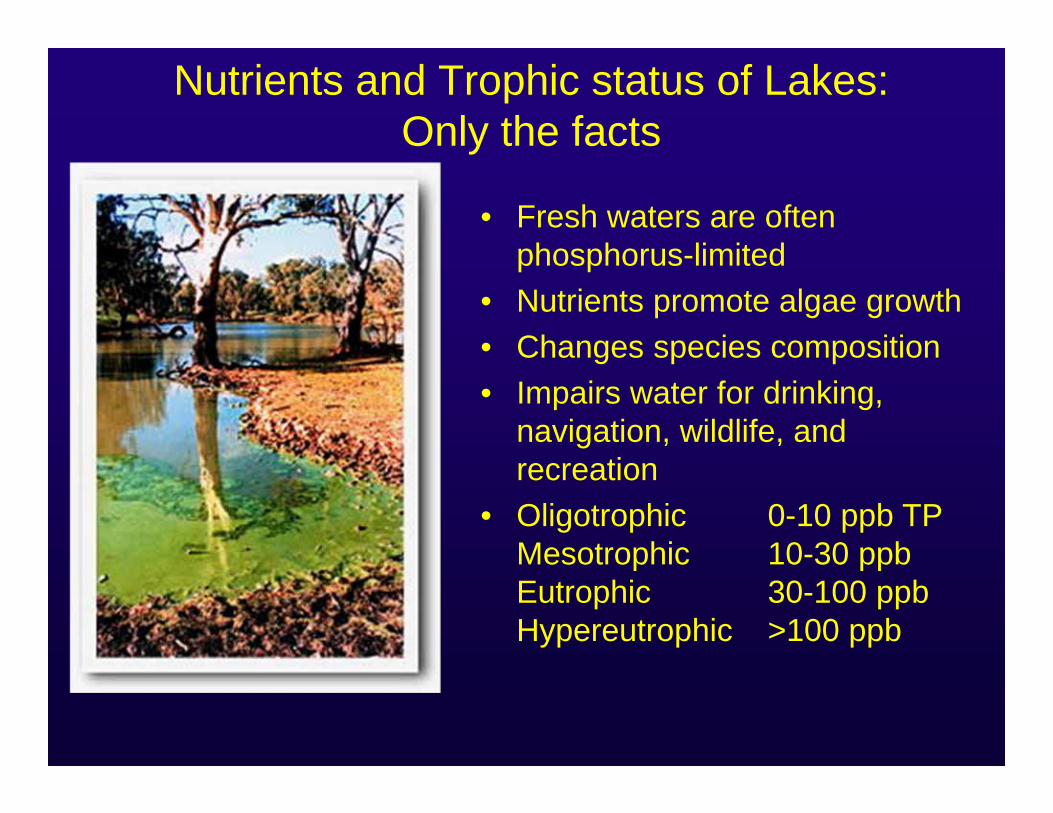
Nutrients and Trophic status of Lakes: Only the facts
• Fresh waters are often phosphorus-limited
• Nutrients promote algae growth• Changes species composition• Impairs water for drinking,
navigation, wildlife, and recreation
• Oligotrophic 0-10 ppb TPMesotrophic 10-30 ppbEutrophic 30-100 ppbHypereutrophic >100 ppb
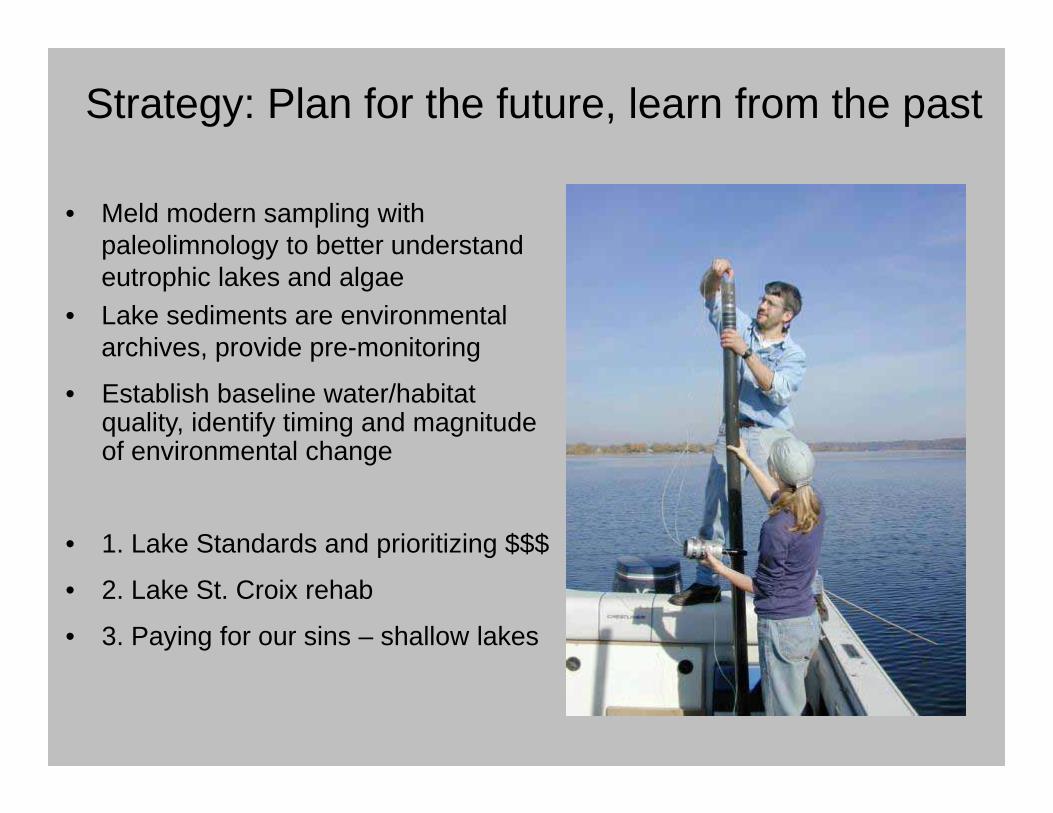
Strategy: Plan for the future, learn from the past
• Meld modern sampling with paleolimnology to better understand eutrophic lakes and algae
• Lake sediments are environmental archives, provide pre-monitoring
• Establish baseline water/habitat quality, identify timing and magnitude of environmental change
• 1. Lake Standards and prioritizing $$$
• 2. Lake St. Croix rehab
• 3. Paying for our sins – shallow lakes
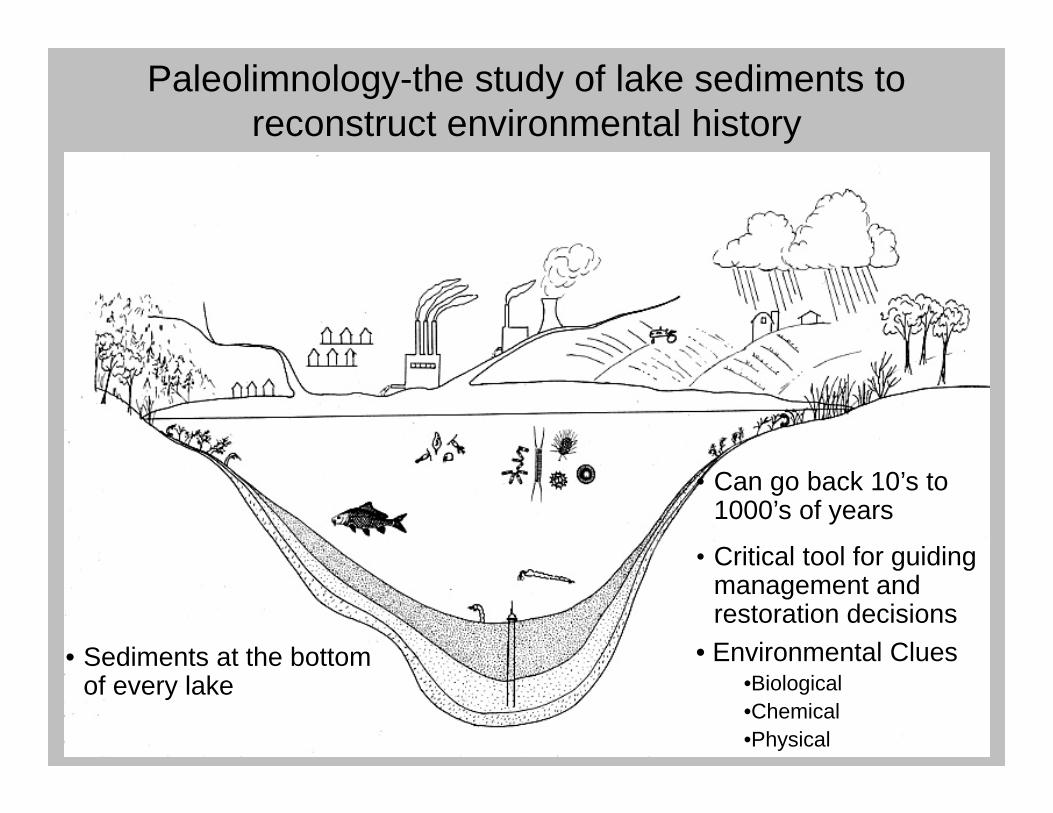
Paleolimnology-the study of lake sediments to reconstruct environmental history
• Can go back 10’s to 1000’s of years
• Critical tool for guiding management and restoration decisions
• Environmental Clues•Biological•Chemical•Physical
• Sediments at the bottom of every lake
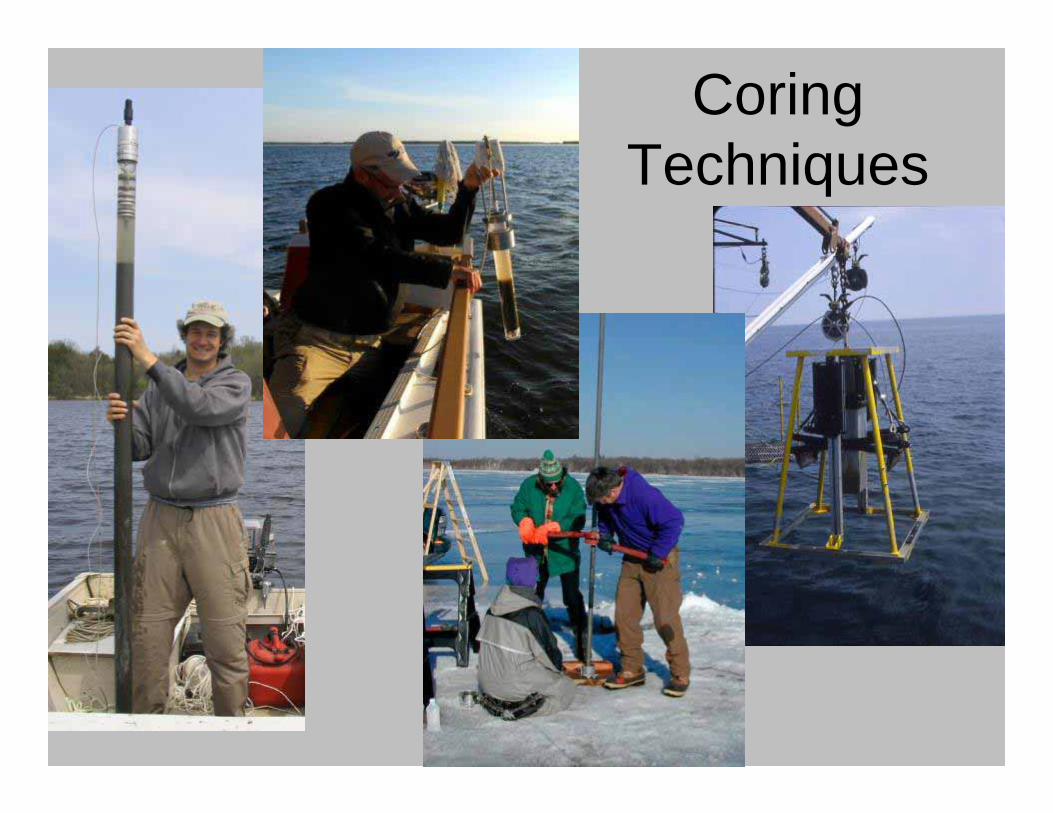
Coring Techniques
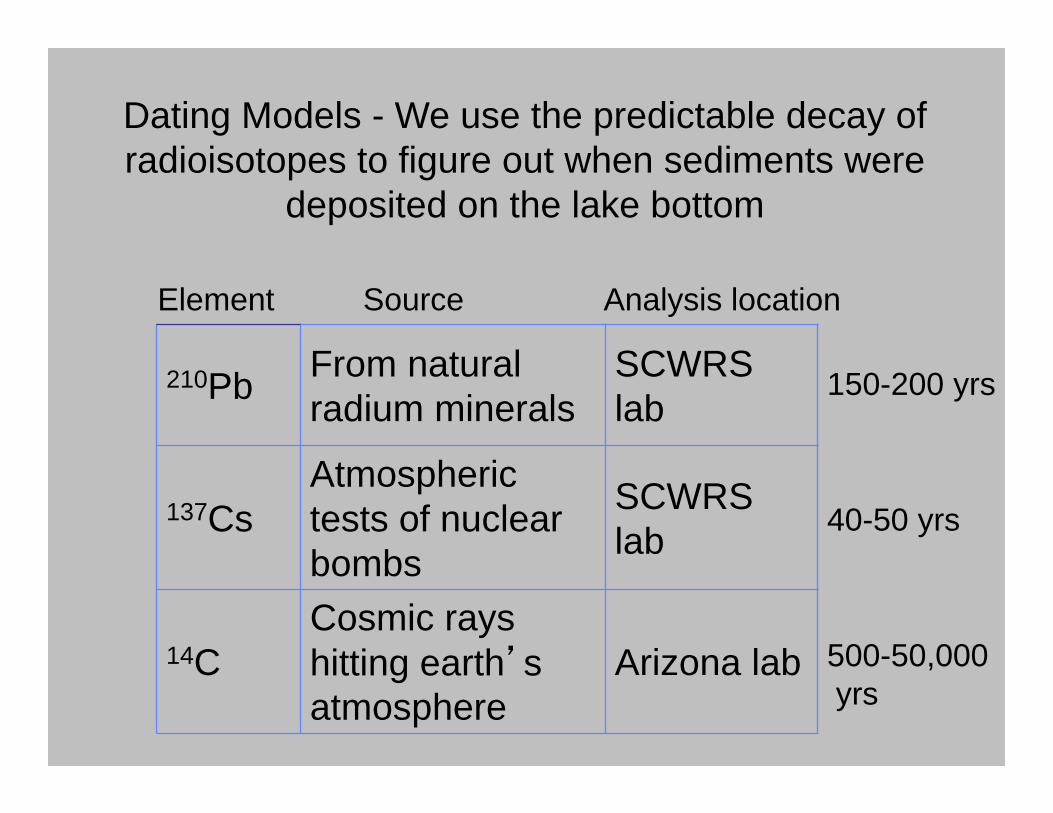
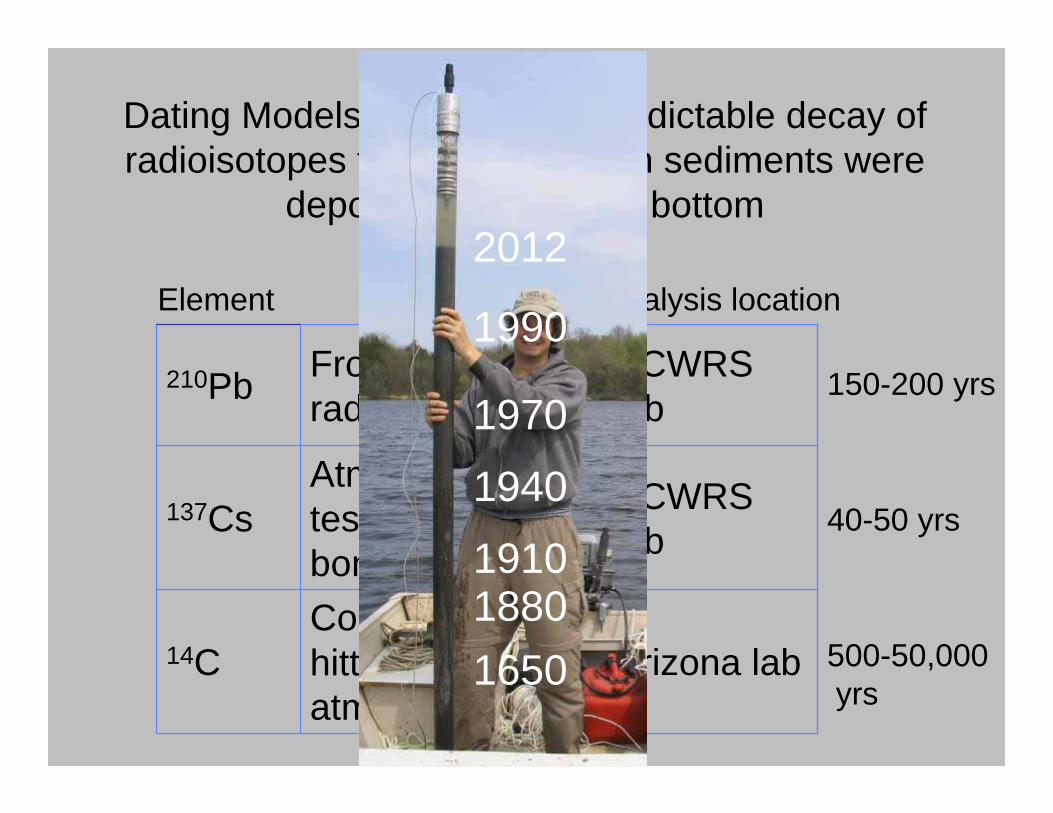
Dating Models - We use the predictable decay of radioisotopes to figure out when sediments were
deposited on the lake bottom
210Pb From natural radium minerals
SCWRS lab
137CsAtmospheric tests of nuclear bombs
SCWRS lab
14CCosmic rays hitting earth’s atmosphere
Arizona lab
Element Source Analysis location
150-200 yrs
40-50 yrs
500-50,000yrs
1990
2012
1940
1970
18801910
1650
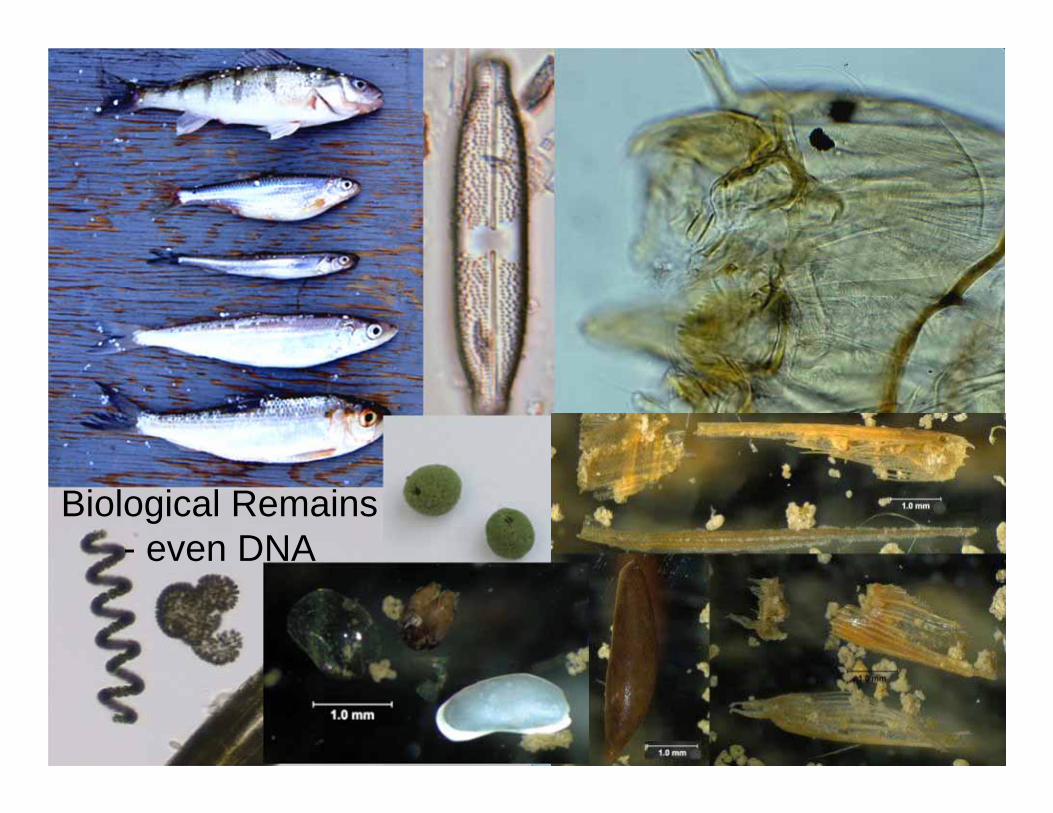
Biological Remains- even DNA

…under the scope, 1840s
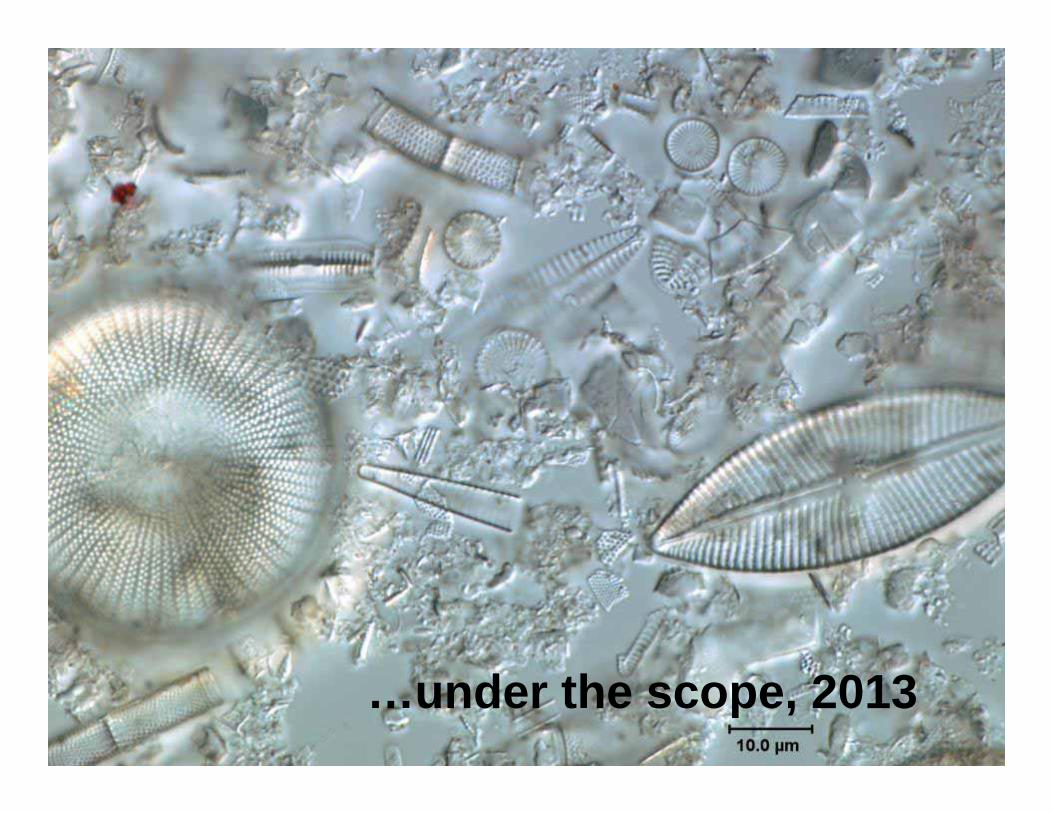
…under the scope, 2013
(from Hall et al. 1999)
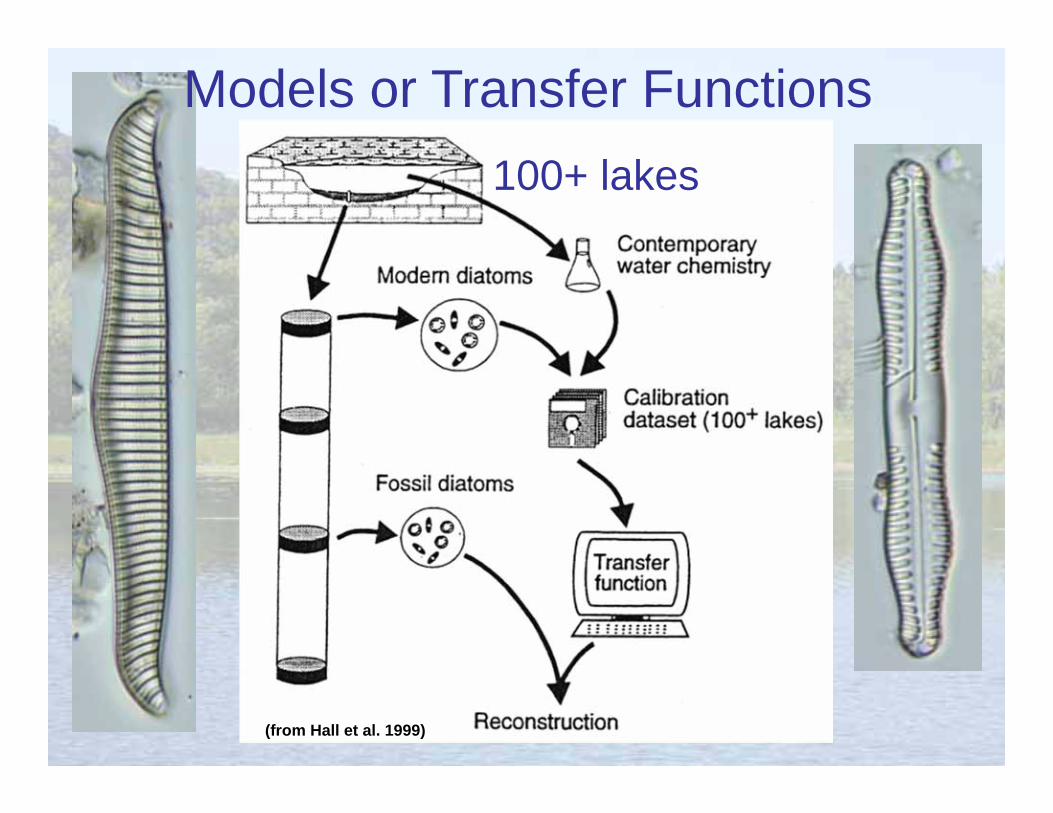
Models or Transfer Functions100+ lakes
(from Hall et al. 1999)
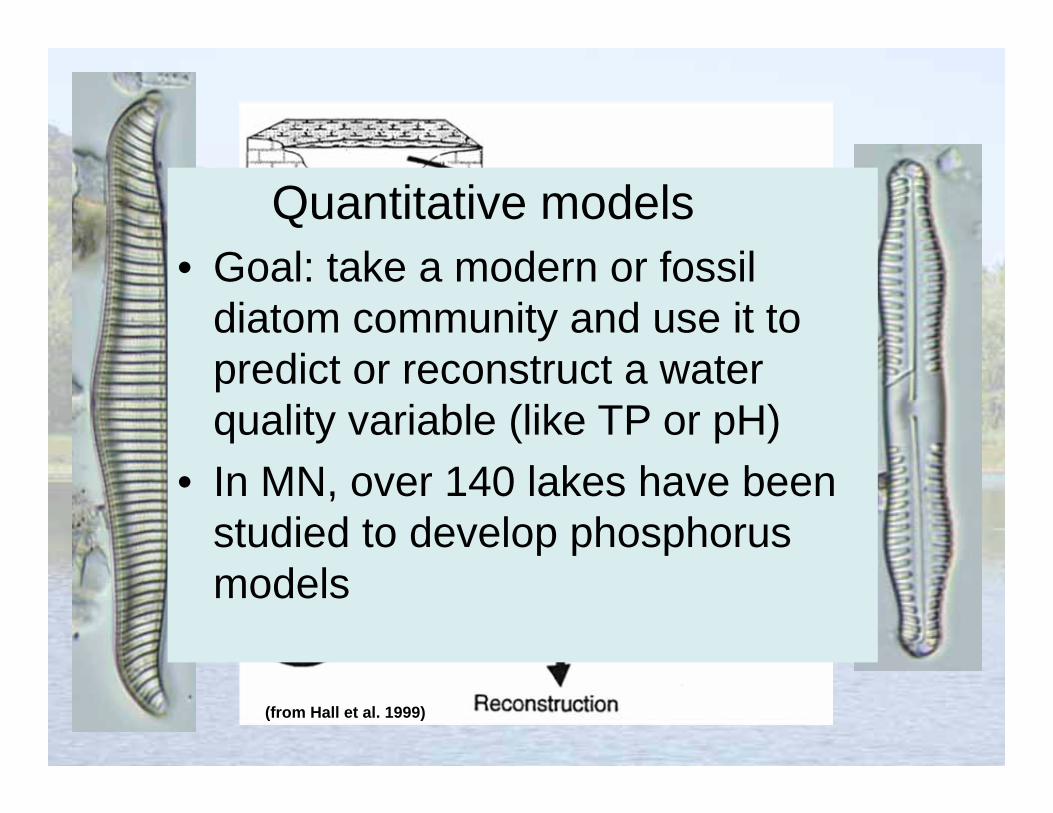
Quantitative models• Goal: take a modern or fossil
diatom community and use it to predict or reconstruct a water quality variable (like TP or pH)
• In MN, over 140 lakes have been studied to develop phosphorus models
Development of Phosphorus Standards for MN Lakes
1. US Environmental Protection Agency wants states to develop phosphorus standards for lakes, wetlands, rivers & estuaries.
2. When waters exceed standards, that lake or river is officially “impaired.”
3. Impaired waters must have a plan prepared to return them to compliance with standards.
4. Minnesota PCA has set phosphorus standards for different ecoregions of state and different lake types using paleolimnological evidence

n=5 (deep)n=6 (shallow)
n=5 (shallow)n=15 (rural)
(20 lakes)
(20 lakes)
• Core top to assess modern conditions
• Samples taken from below settlement horizon to assess natural or background nutrient levels in lakes
Top-BottomAnalysis
Diatom-inferred TP: Pre-European vs. Modern-day
0
20
40
60
80
100
120
140
NLF (n=20) CHF-Metro(n=20)
CHF-Rural(n=15)
CHF-Shallow
(n=5)
WCP - Deep(n=5)
WCP/NGP -Shallow
(n=6)
TP p
pb
Pre-E Modern
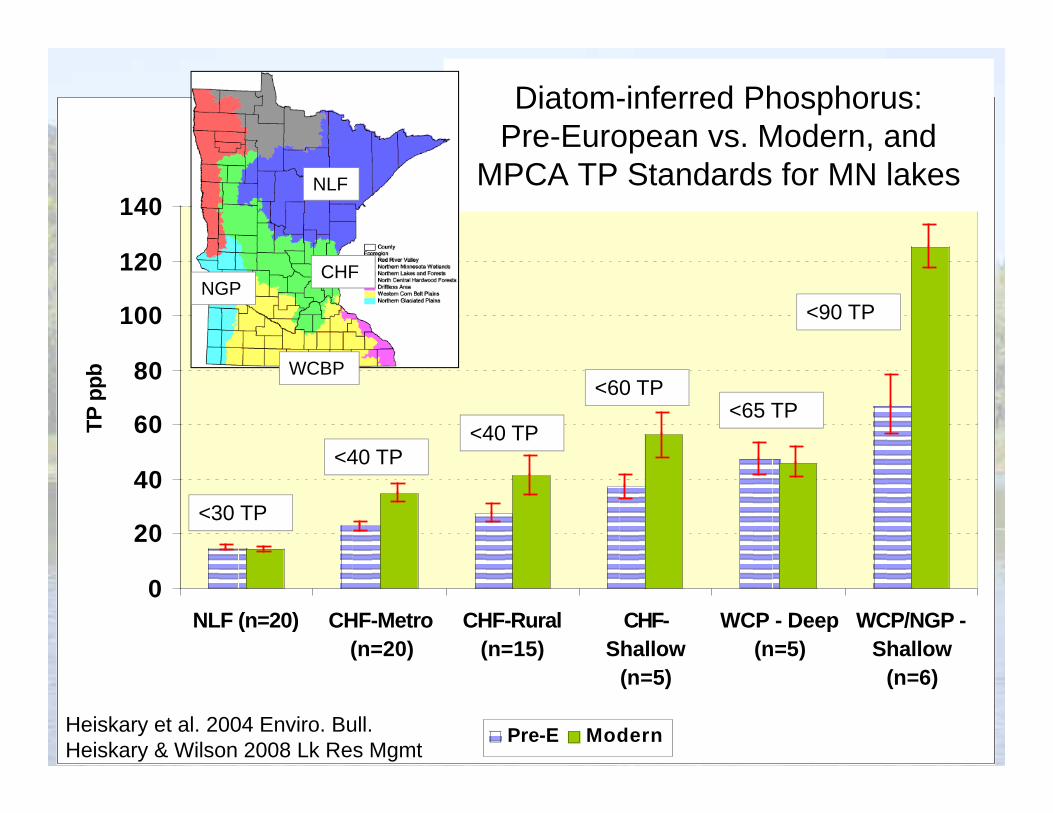
Diatom-inferred Phosphorus: Pre-European vs. Modern, and
MPCA TP Standards for MN lakesNLF
CHFNGP
WCBP
<30 TP
<40 TP<40 TP
<60 TP<65 TP
<90 TP
Heiskary et al. 2004 Enviro. Bull.Heiskary & Wilson 2008 Lk Res Mgmt
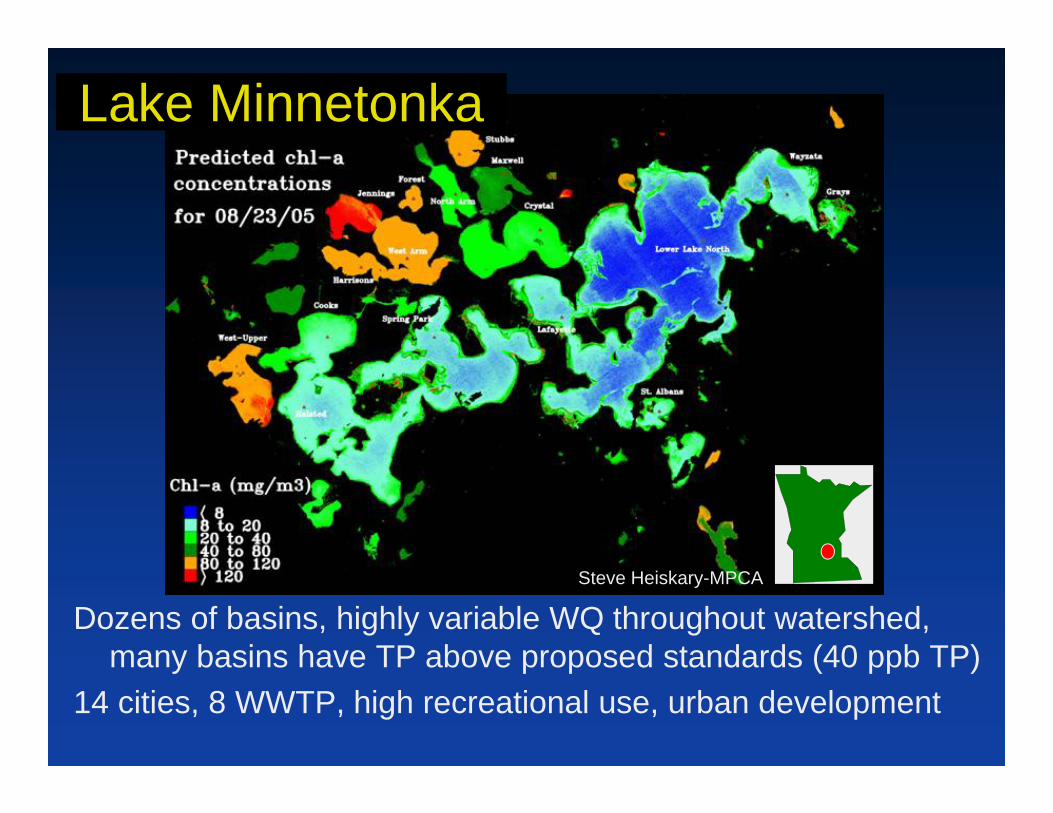
Dozens of basins, highly variable WQ throughout watershed, many basins have TP above proposed standards (40 ppb TP)
14 cities, 8 WWTP, high recreational use, urban development
Steve Heiskary-MPCA
Lake Minnetonka
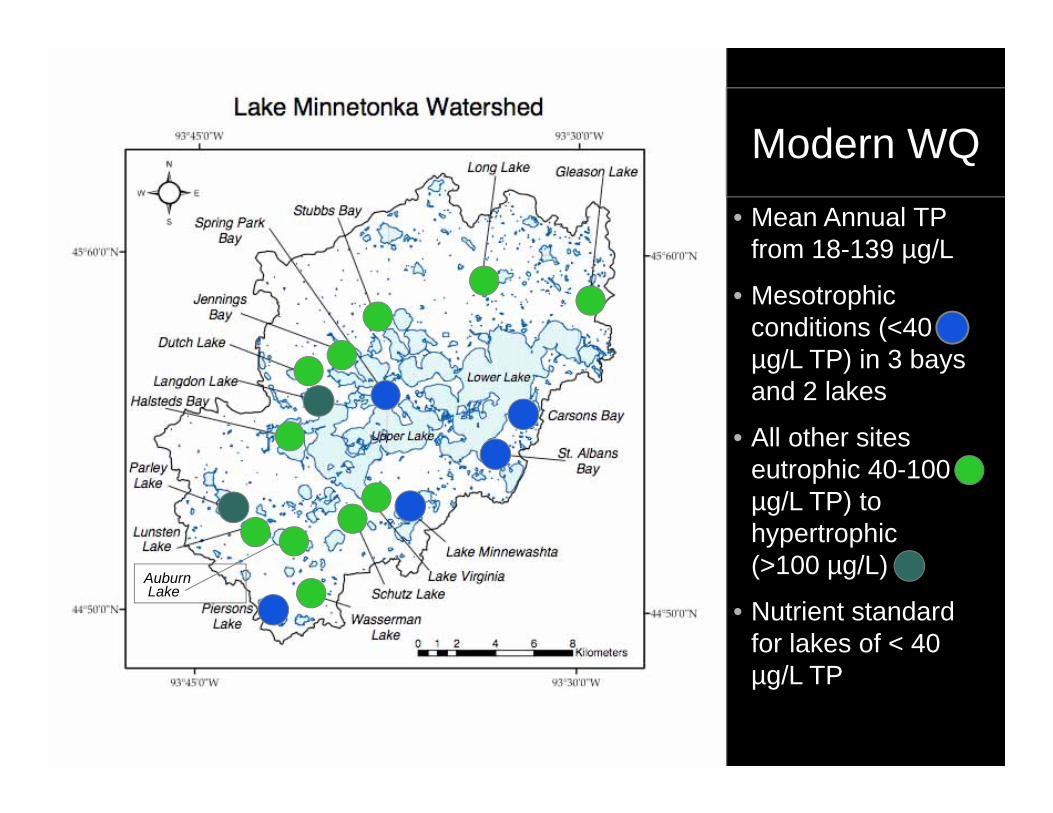
Modern WQ• Mean Annual TP
from 18-139 µg/L
• Mesotrophic conditions (<40 µg/L TP) in 3 bays and 2 lakes
• All other sites eutrophic 40-100 µg/L TP) to hypertrophic (>100 µg/L)
• Nutrient standard for lakes of < 40 µg/L TP
AuburnLake
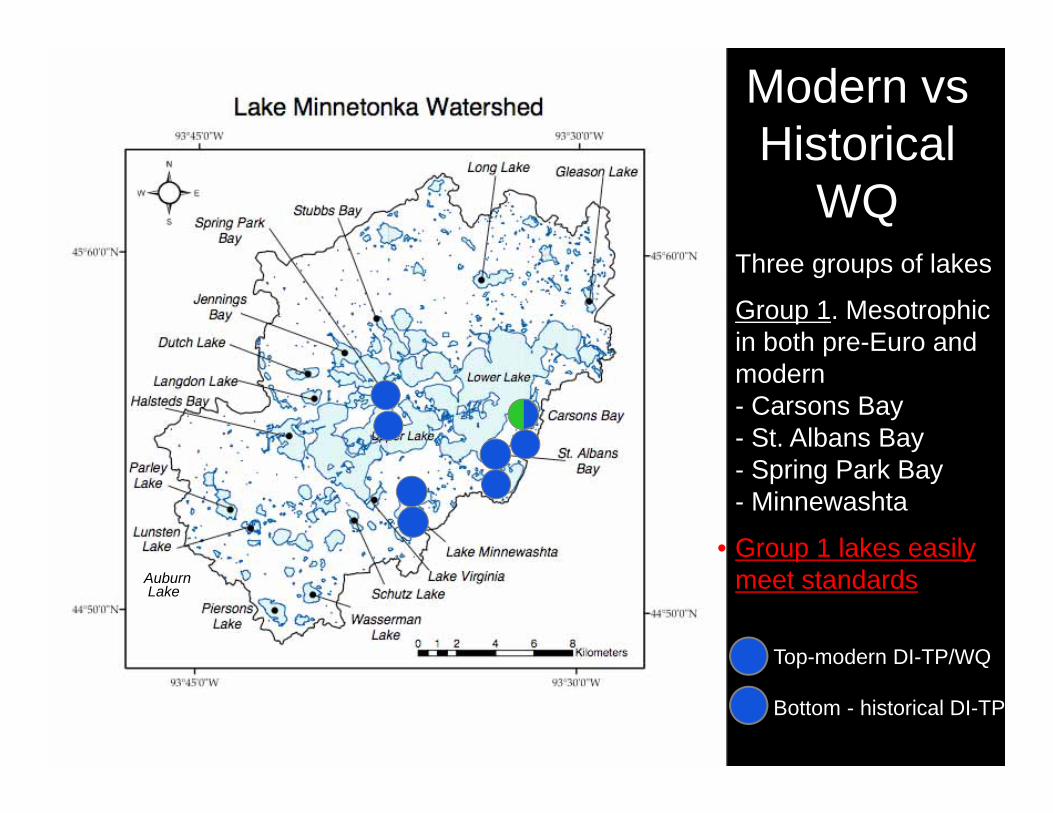
Modern vs Historical
WQ• Three groups of lakes
• Group 1. Mesotrophicin both pre-Euro and modern- Carsons Bay- St. Albans Bay- Spring Park Bay- Minnewashta
• Group 1 lakes easily meet standards
Top-modern DI-TP/WQ
Bottom - historical DI-TP
AuburnLake
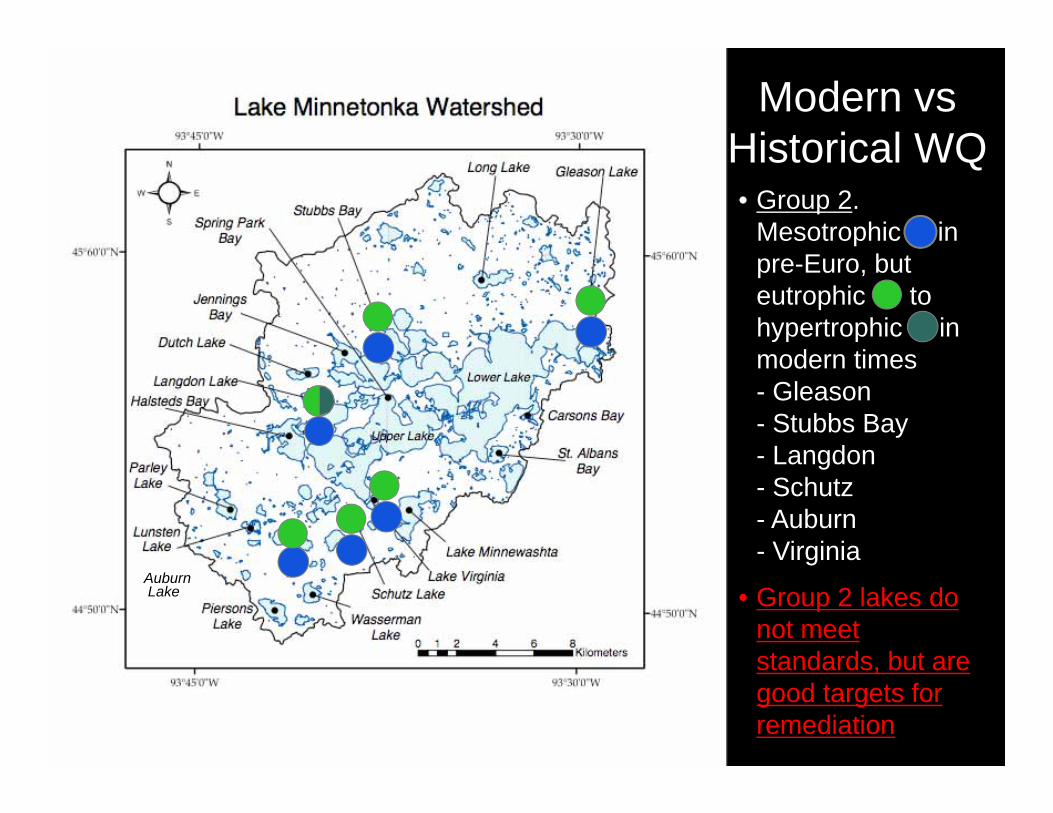
Modern vs Historical WQ• Group 2.
Mesotrophic in pre-Euro, but eutrophic to hypertrophic in modern times- Gleason- Stubbs Bay- Langdon- Schutz- Auburn- Virginia
• Group 2 lakes do not meet standards, but are good targets for remediation
AuburnLake
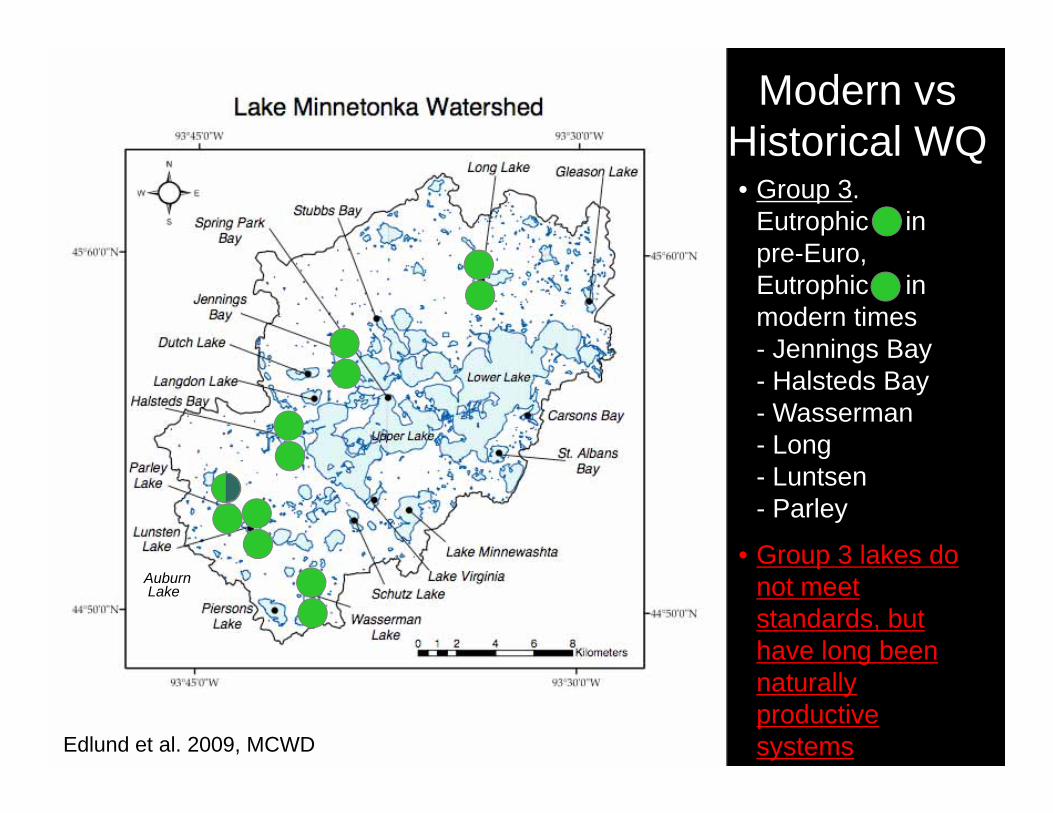
Modern vs Historical WQ• Group 3.
Eutrophic in pre-Euro, Eutrophic in modern times- Jennings Bay- Halsteds Bay- Wasserman- Long- Luntsen- Parley
• Group 3 lakes do not meet standards, but have long been naturally productive systems
AuburnLake
Edlund et al. 2009, MCWD
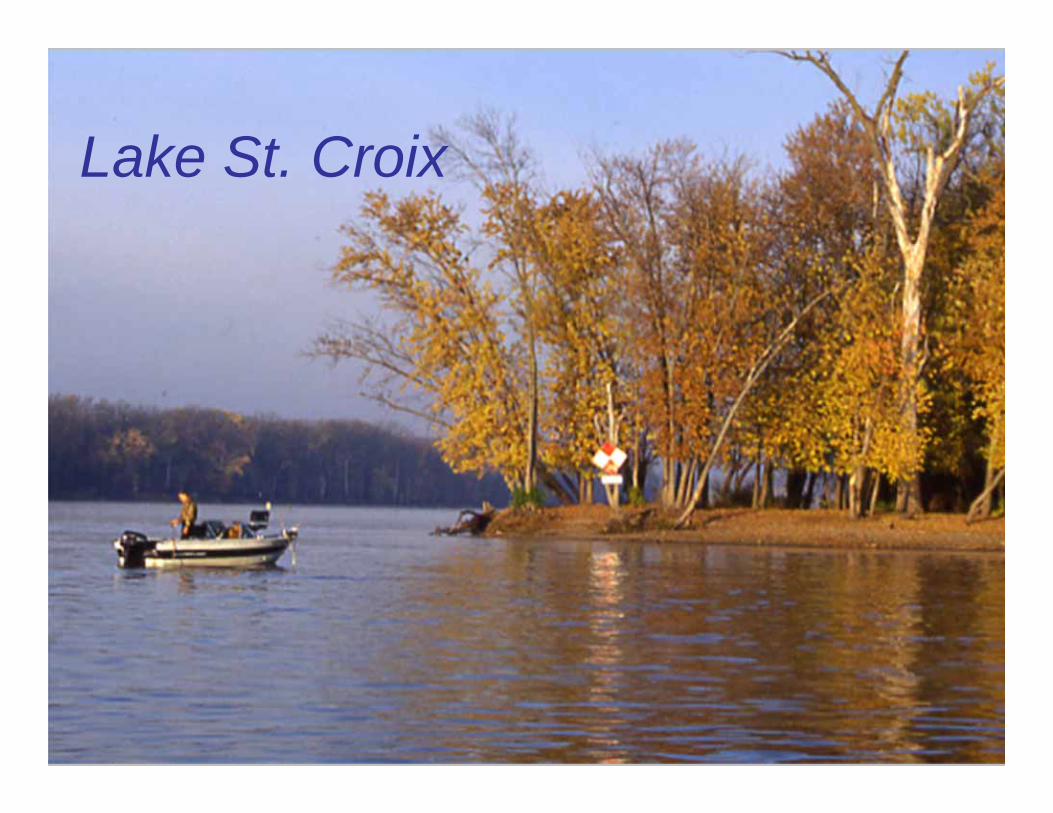
Lake St. Croix
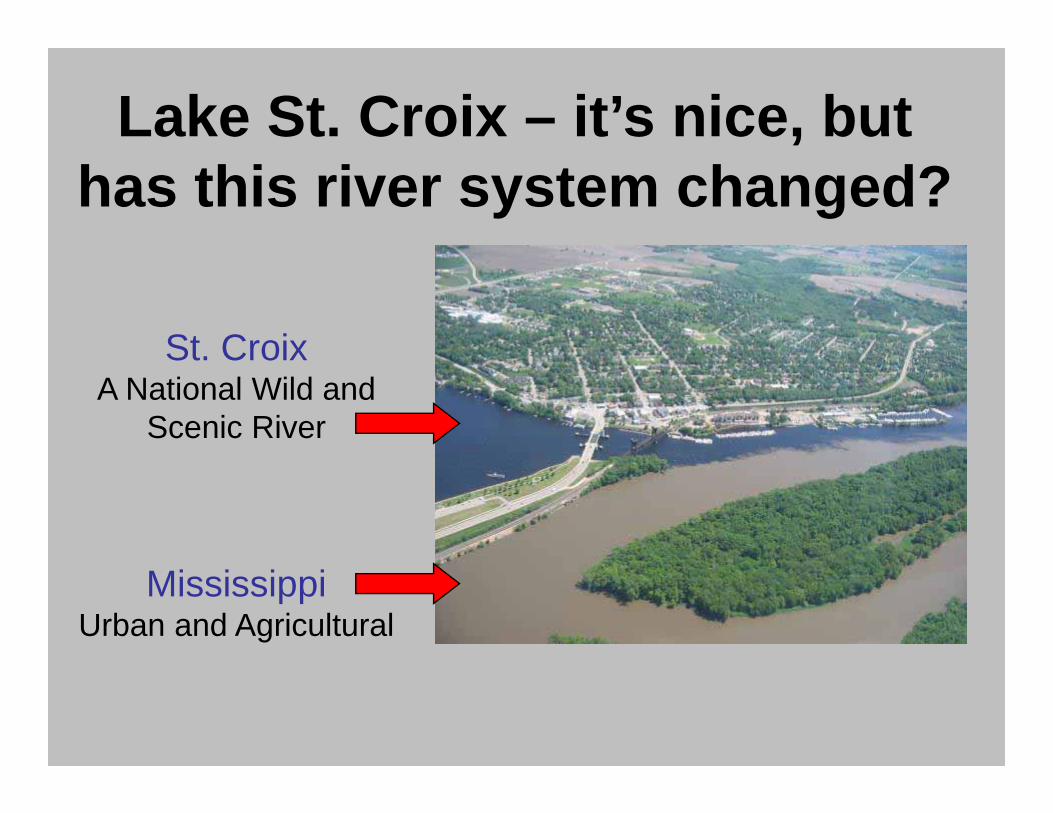
Lake St. Croix – it’s nice, but has this river system changed?
St. CroixA National Wild and
Scenic River
MississippiUrban and Agricultural
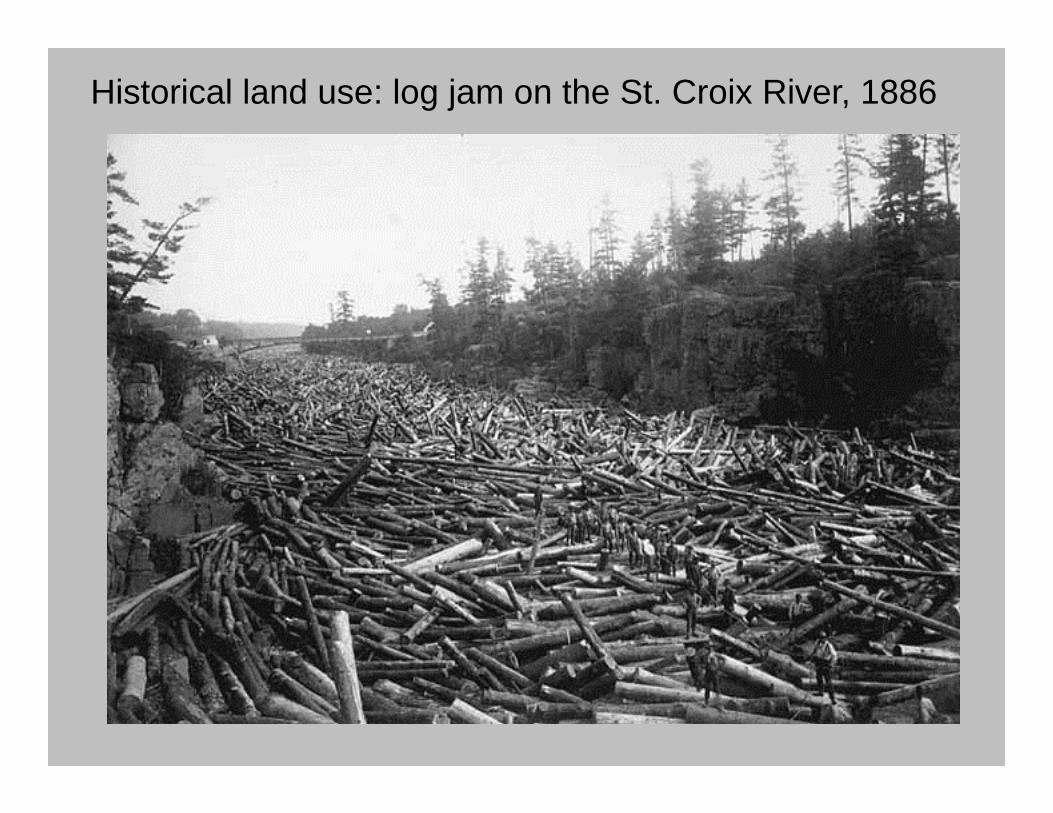
Historical land use: log jam on the St. Croix River, 1886
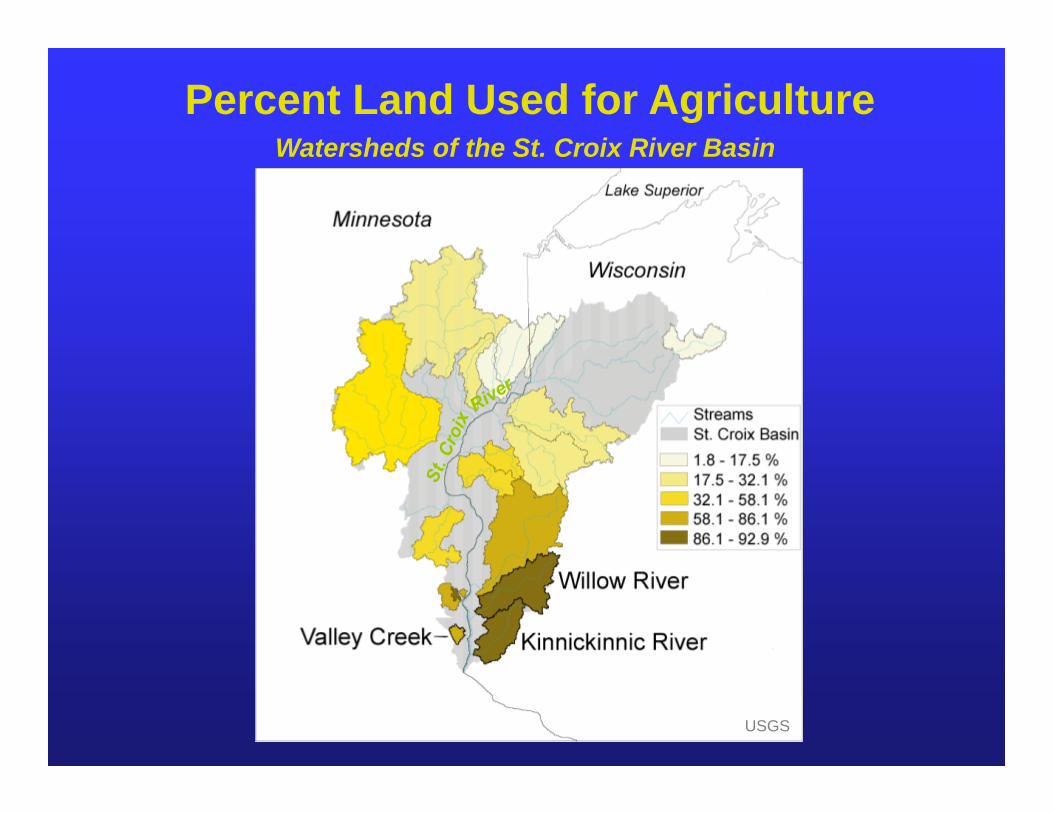
Percent Land Used for AgricultureWatersheds of the St. Croix River Basin
USGS
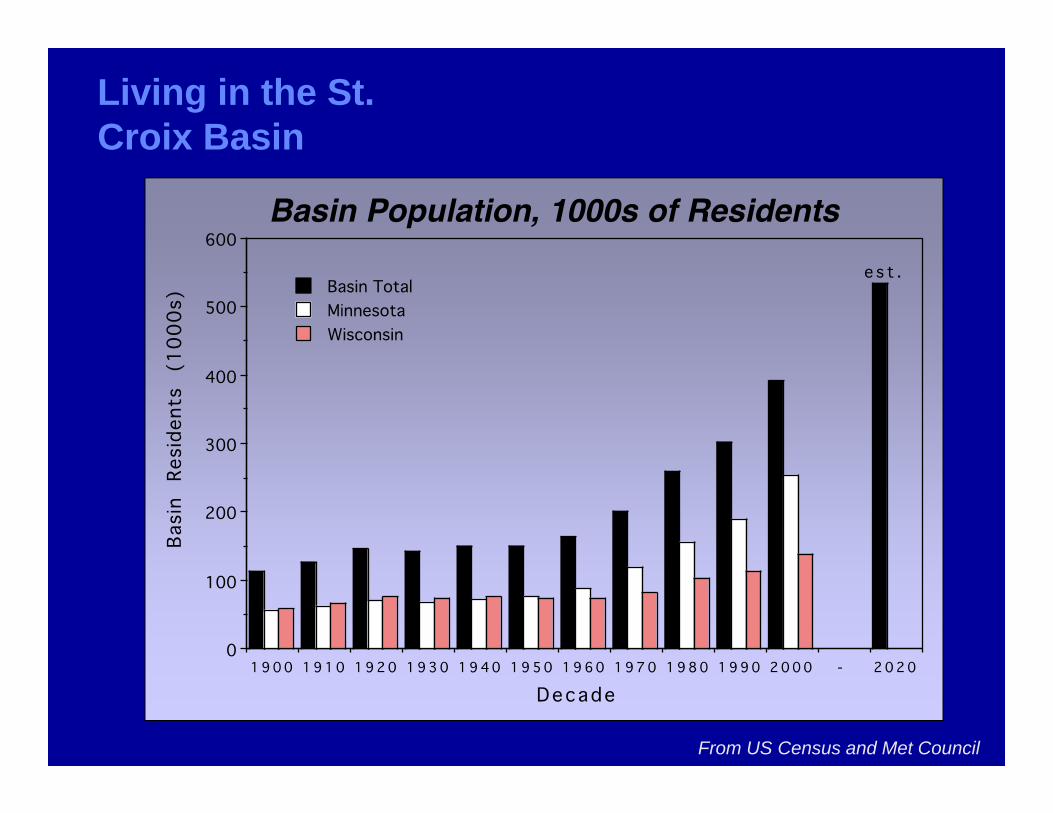
Living in the St. Croix Basin
From US Census and Met Council
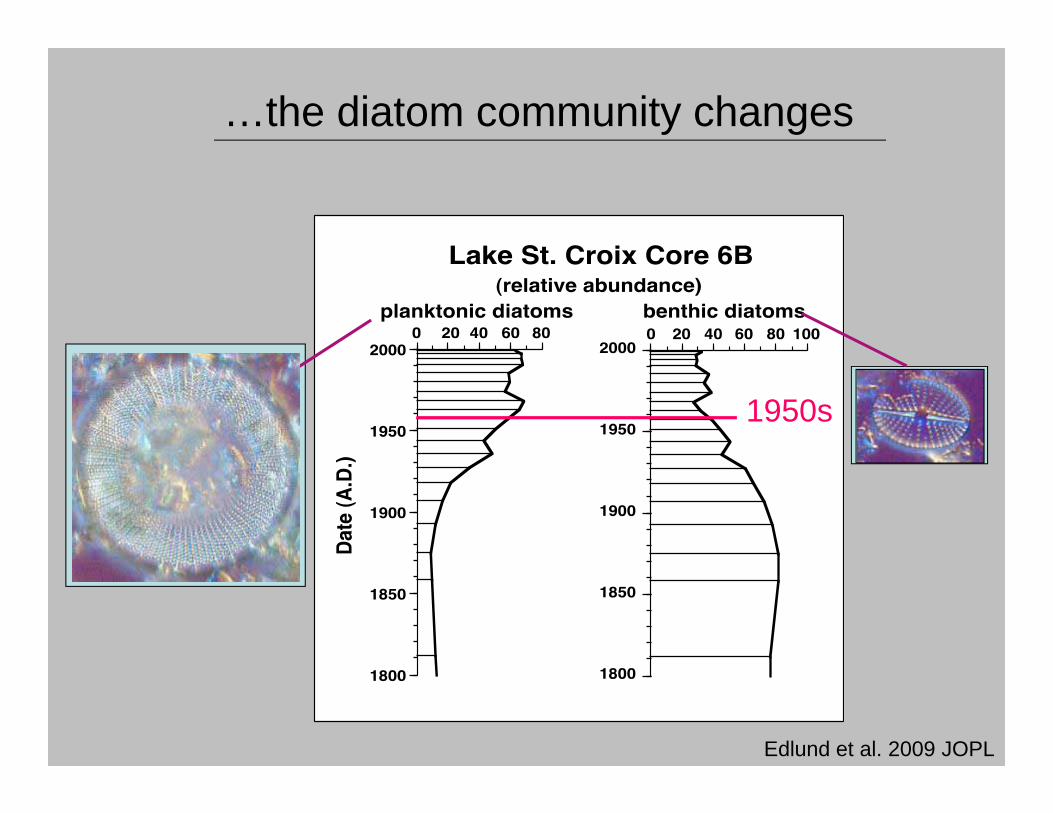
…the diatom community changes
1950s
Edlund et al. 2009 JOPL
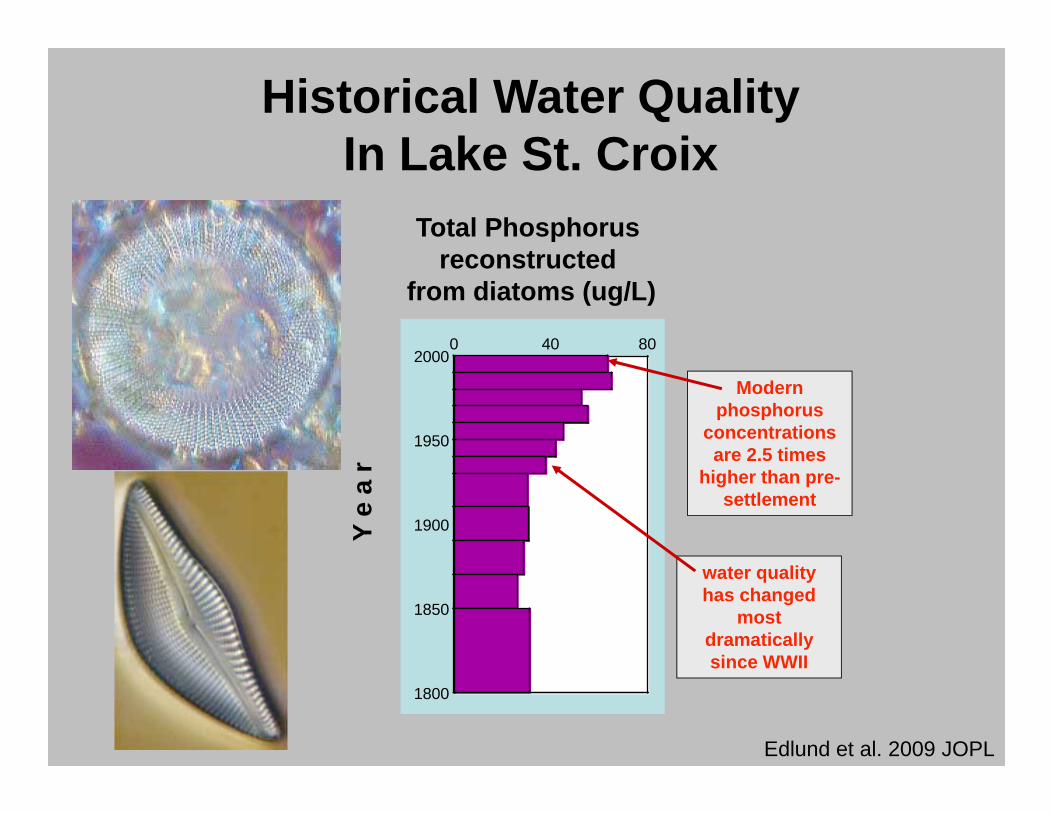
Total Phosphorus reconstructed
from diatoms (ug/L)
Y e
a r
1800
1850
1900
1950
20000 40 80
Historical Water Quality In Lake St. Croix
Modern phosphorus
concentrations are 2.5 times
higher than pre-settlement
water quality has changed
most dramatically since WWII
Edlund et al. 2009 JOPL
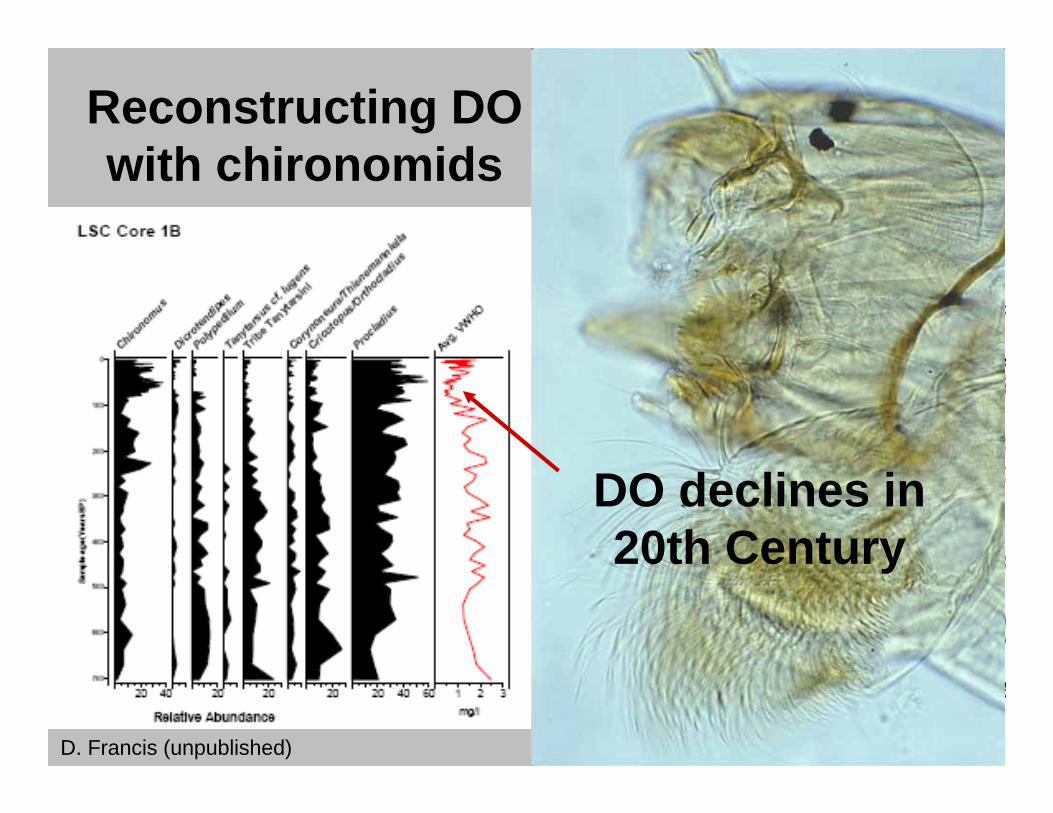
Reconstructing DO with chironomids
DO declines in 20th Century
D. Francis (unpublished)
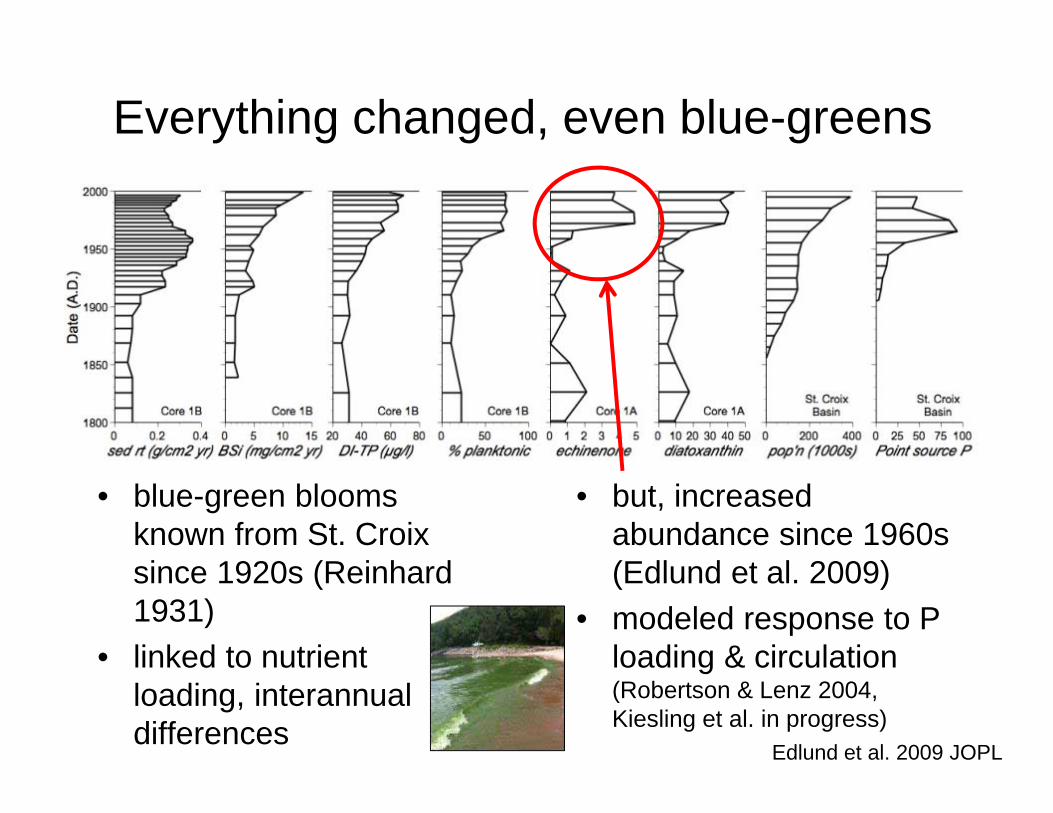
Everything changed, even blue-greens
• blue-green blooms known from St. Croix since 1920s (Reinhard1931)
• linked to nutrient loading, interannualdifferences
• but, increased abundance since 1960s (Edlund et al. 2009)
• modeled response to P loading & circulation (Robertson & Lenz 2004, Kiesling et al. in progress)
Edlund et al. 2009 JOPL
Minnesota
Wisconsin
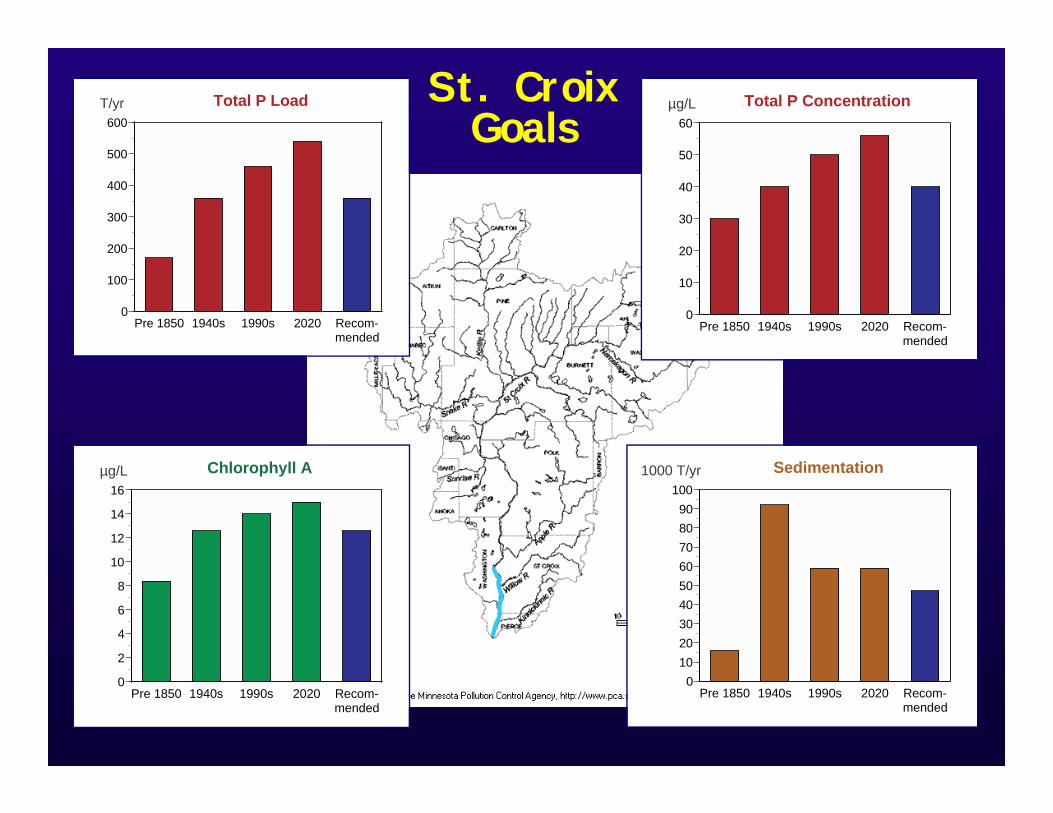
St. CroixGoals
Pre 1850 1940s 1990s 2020 Recom-mended
0
100
200
300
400
500
600T/yr Total P Load
Pre 1850 1940s 1990s 2020 Recom-mended
0
10
20
30
40
50
60µg/L Total P Concentration
Pre 1850 1940s 1990s 2020 Recom-mended
0
2
4
6
8
10
12
14
16µg/L Chlorophyll A
Pre 1850 1940s 1990s 2020 Recom-mended
0102030405060708090
1001000 T/yr Sedimentation
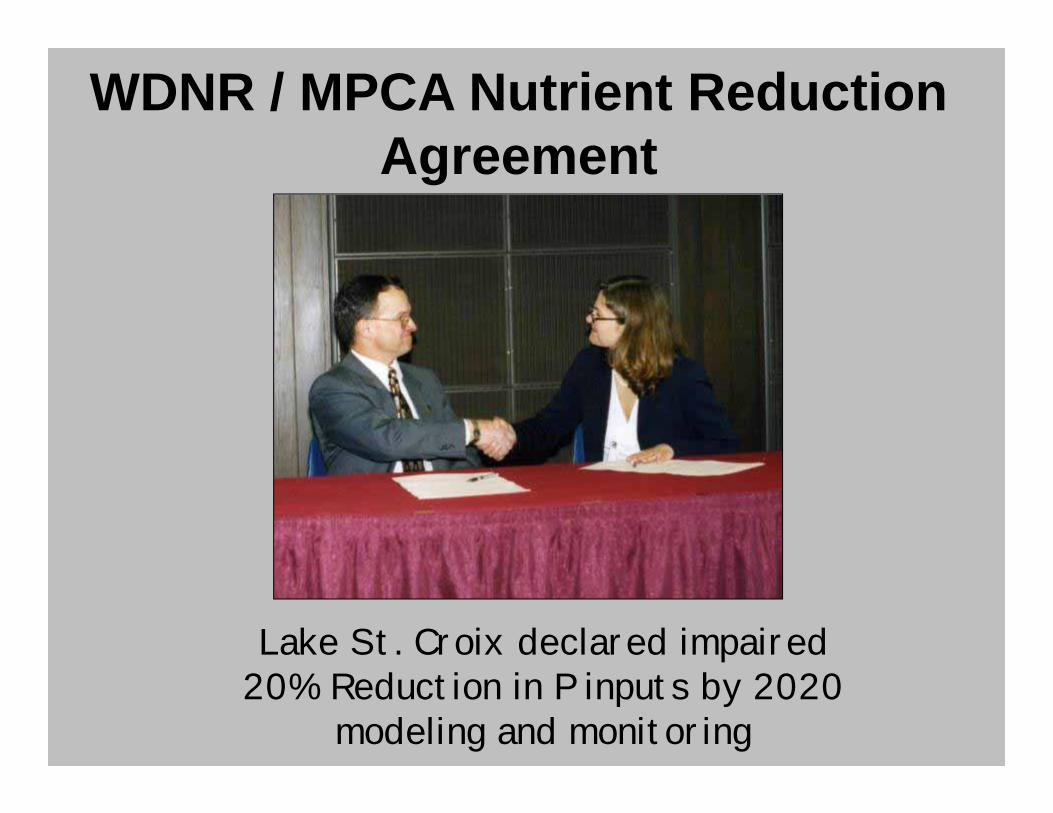
WDNR / MPCA Nutrient Reduction Agreement
Lake St. Croix declared impaired20% Reduction in P inputs by 2020
modeling and monitoring
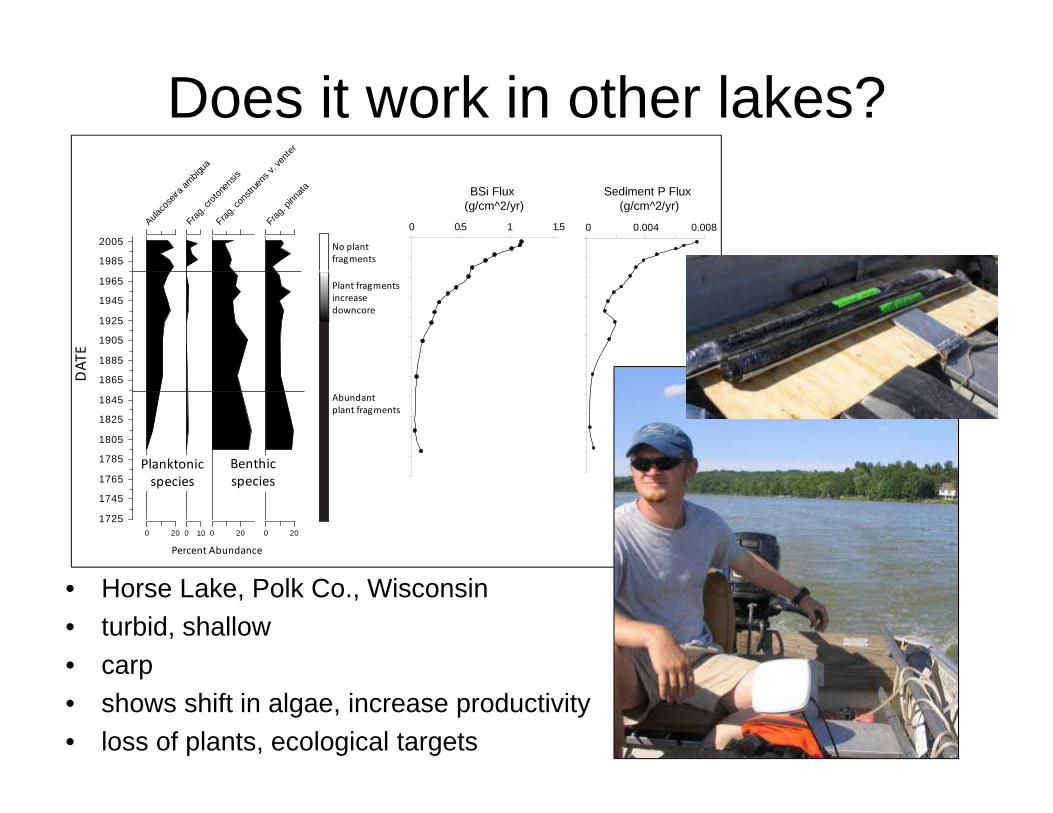
Does it work in other lakes?
• Horse Lake, Polk Co., Wisconsin• turbid, shallow • carp• shows shift in algae, increase productivity• loss of plants, ecological targets
1725
1745
1765
1785
1805
1825
1845
1865
1885
1905
1925
1945
1965
1985
2005
0 20
Aulaco
seira
ambig
ua
0
Frag. c
roton
ensis
0 20
Frag. c
onstr
uens
v.ve
nter
0 20
Frag. p
innata
No plantfragments
Plant fragmentsincreasedowncore
Abundantplant fragments
Benthicspecies
Planktonicspecies
DAT
E
10
Percent Abundance
BSi Flux(g/cm^2/yr)
0 0.5 1 1.5
Sediment P Flux(g/cm^2/yr)
0 0.0080.004
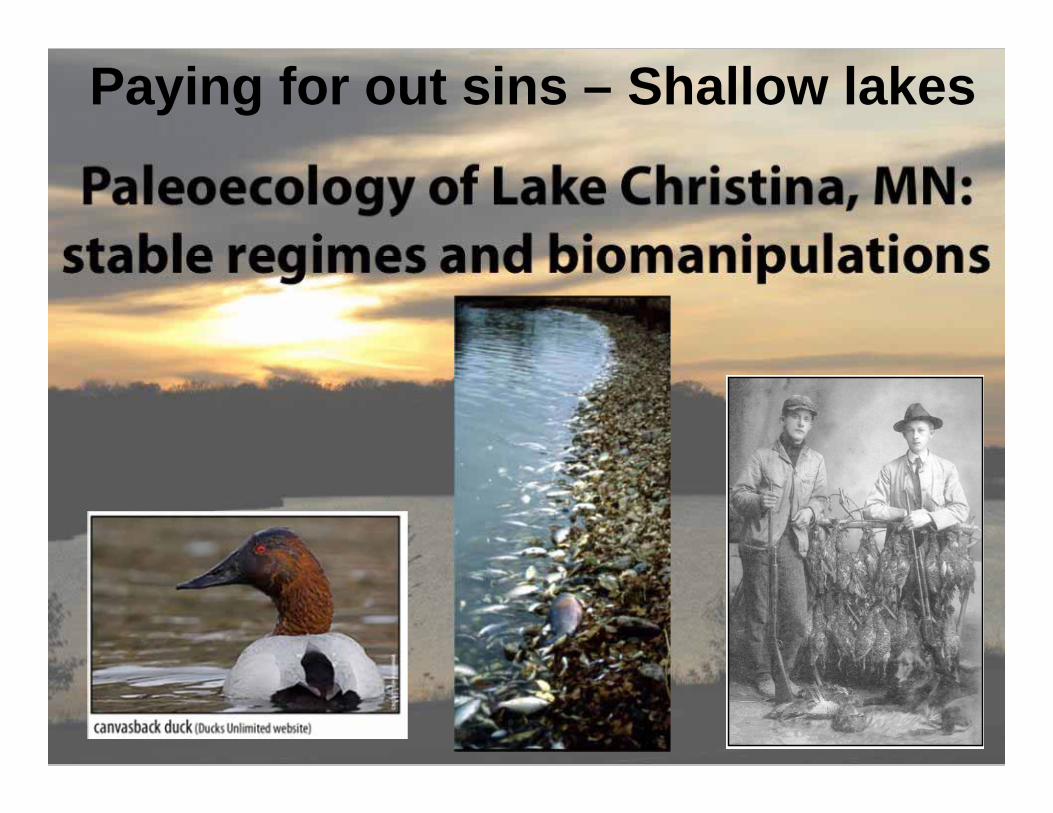
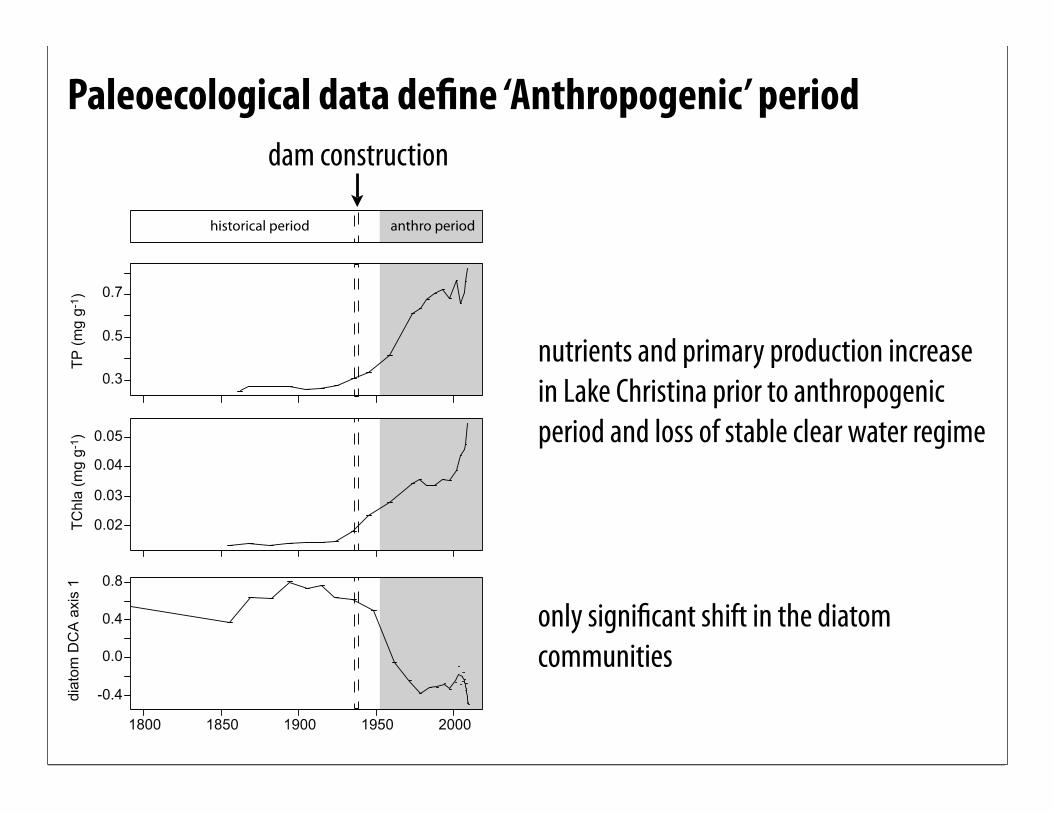
Paying for out sins – Shallow lakes
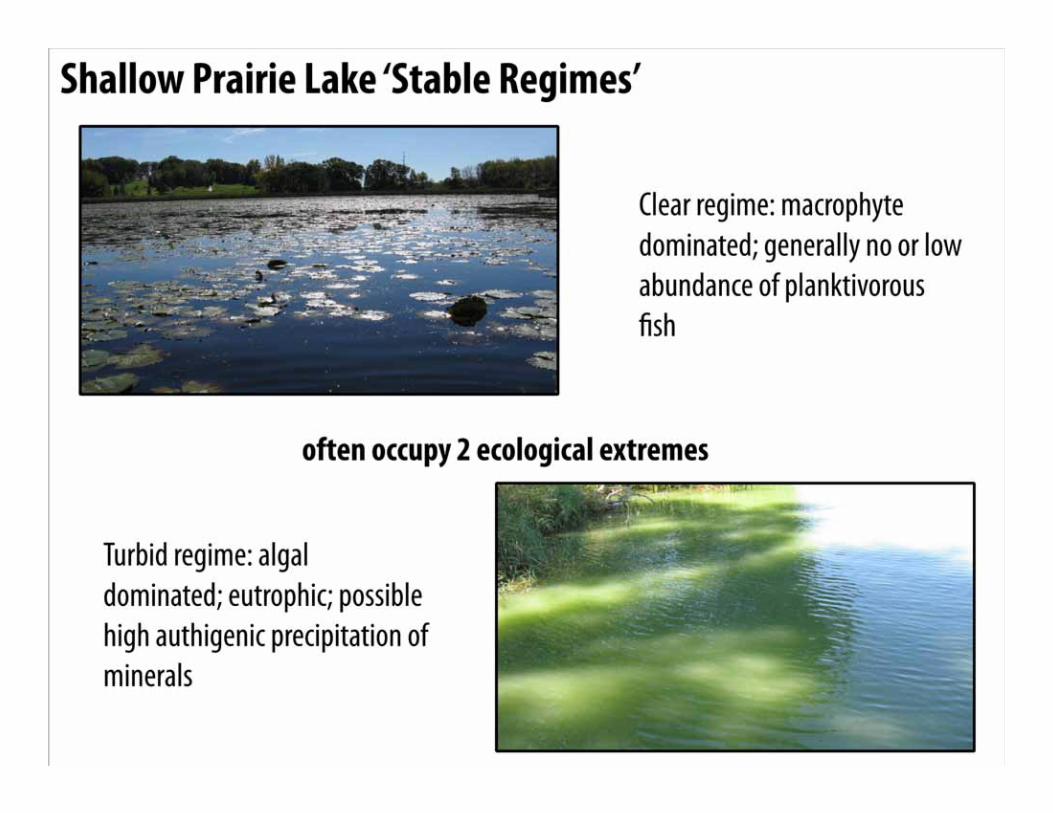
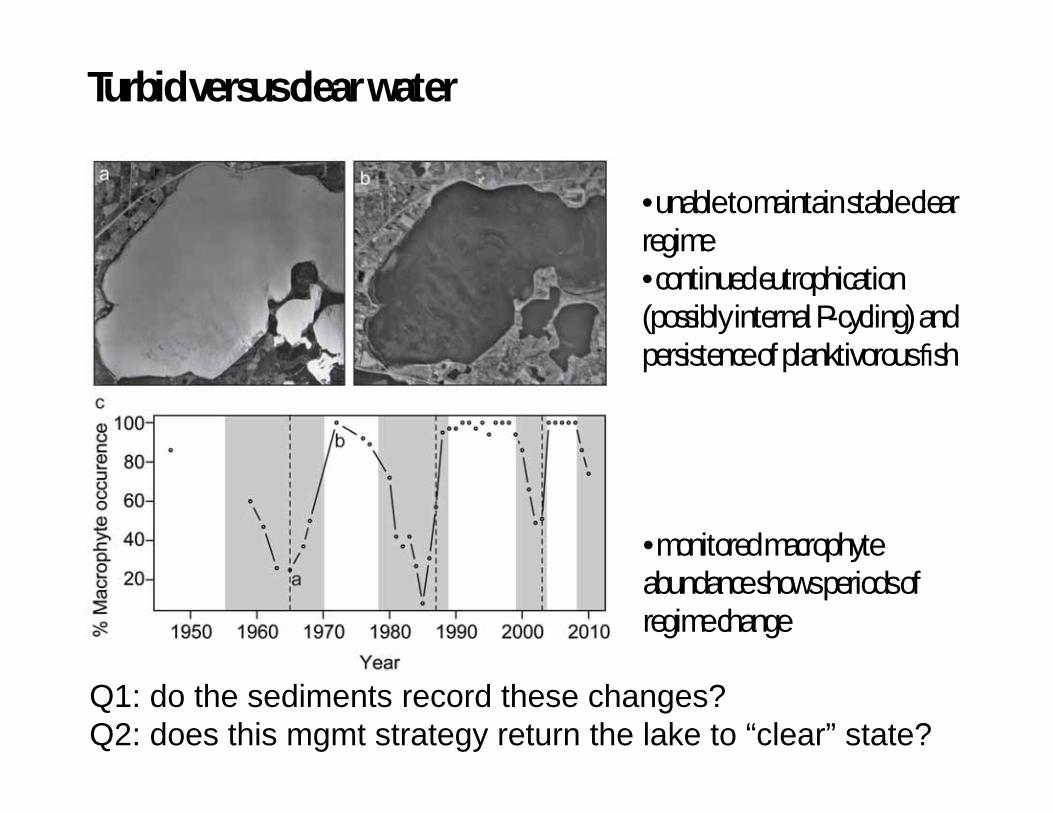
Turbid versus clear water
• monitored macrophyte abundance shows periods of regime change
• unable to maintain stable clear regime• continued eutrophication (possibly internal P-cycling) and persistence of planktivorous sh
Q1: do the sediments record these changes?Q2: does this mgmt strategy return the lake to “clear” state?
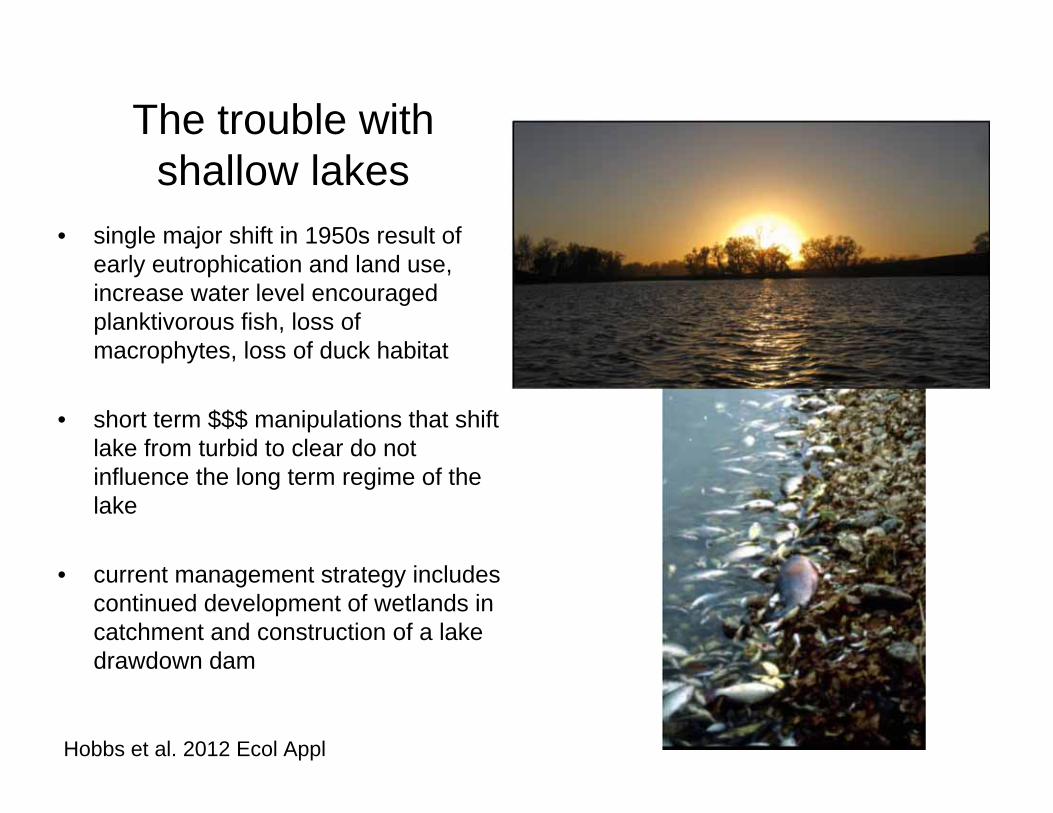
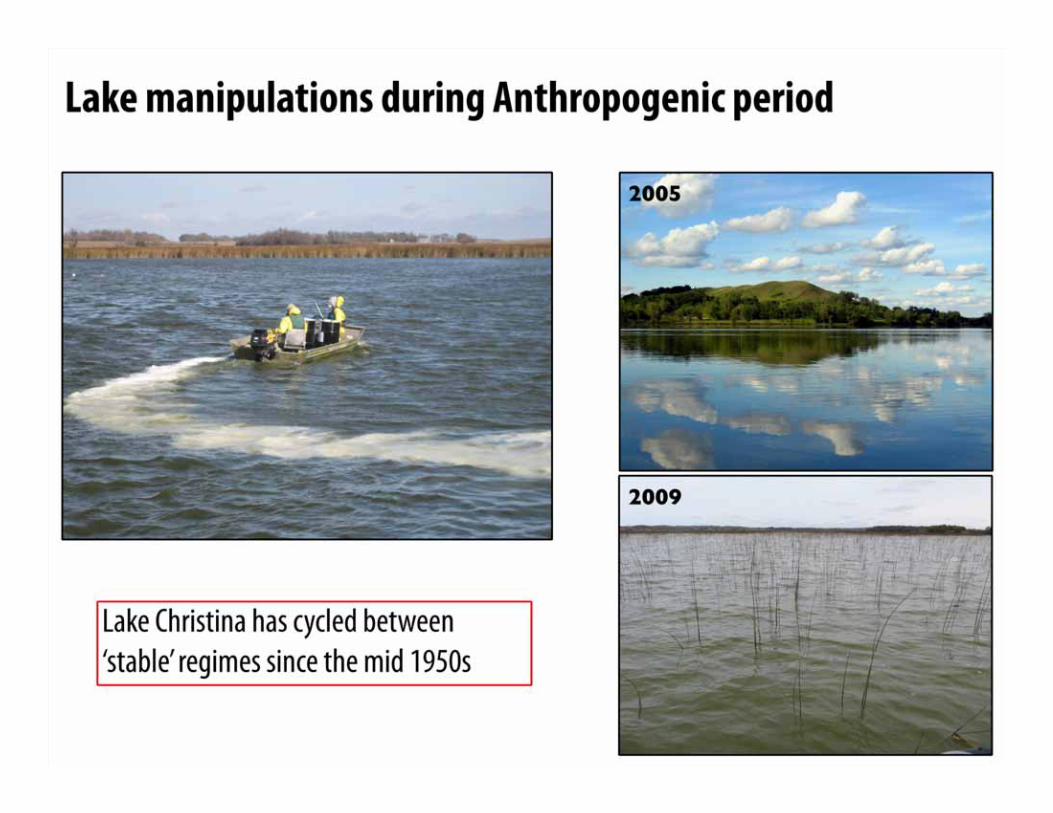
The trouble with shallow lakes
• single major shift in 1950s result of early eutrophication and land use, increase water level encouraged planktivorous fish, loss of macrophytes, loss of duck habitat
• short term $$$ manipulations that shift lake from turbid to clear do not influence the long term regime of the lake
• current management strategy includes continued development of wetlands in catchment and construction of a lake drawdown dam
Hobbs et al. 2012 Ecol Appl

Paying for our sins
Lake (not quite out) of the Woods
• it’s huge!• 65000 miles of
shoreline• 14500 islands• 65 x 60 miles• it’s not all ours• it’s warming

LoW• it’s a
destination• it’s full of fish
• but…it’s green?
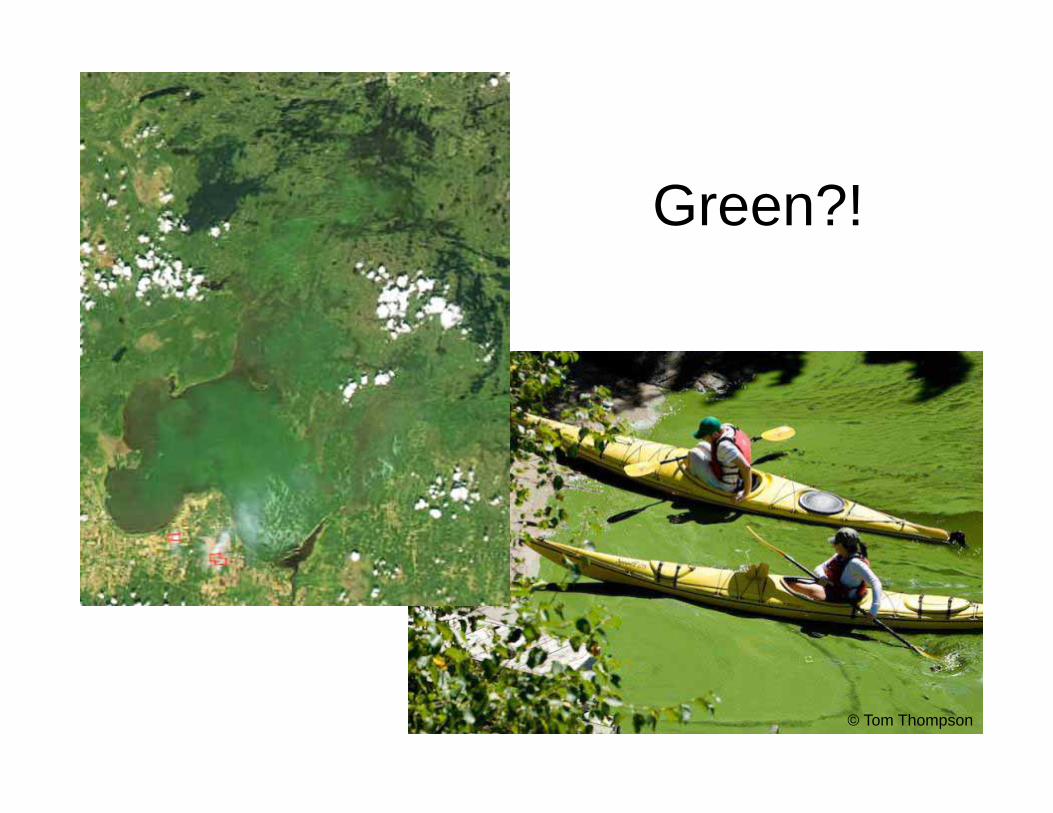
Green?!
© Tom Thompson
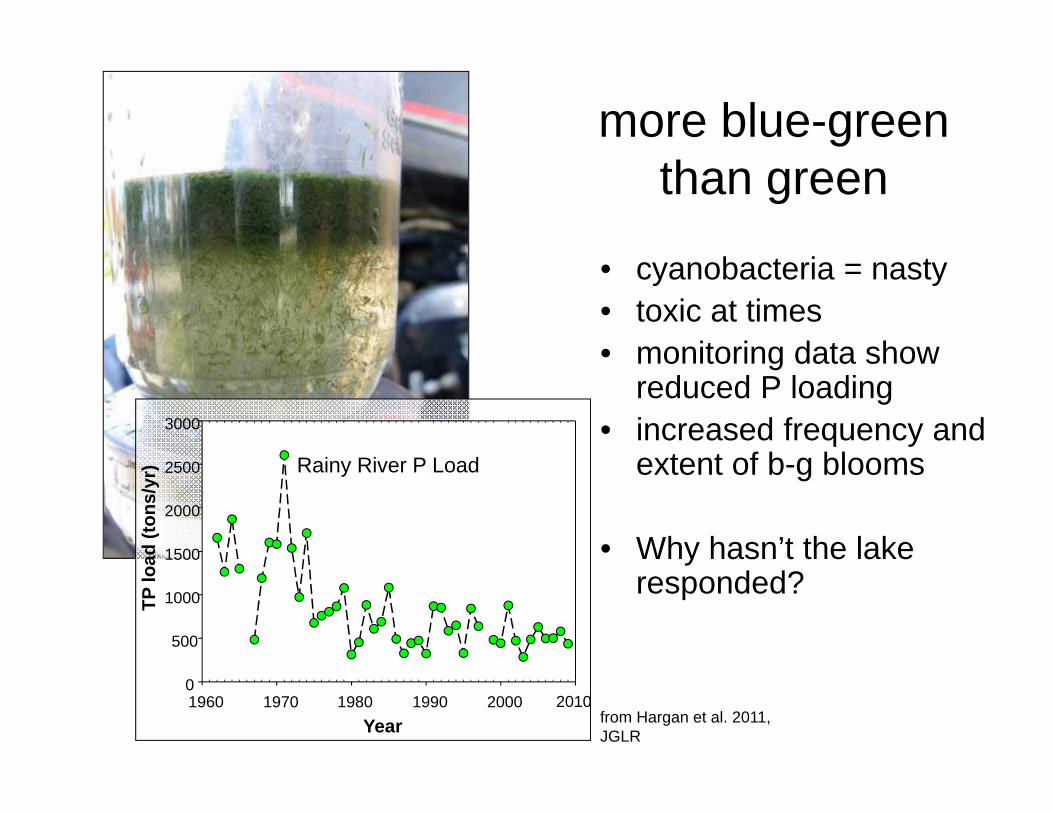
more blue-green than green
• cyanobacteria = nasty• toxic at times• monitoring data show
reduced P loading• increased frequency and
extent of b-g blooms
• Why hasn’t the lake responded?
Year1960 1970 1980 1990 2000 2010
TP lo
ad (t
ons/
yr)
0
500
1000
1500
2000
2500
3000
from Hargan et al. 2011, JGLR
Rainy River P Load
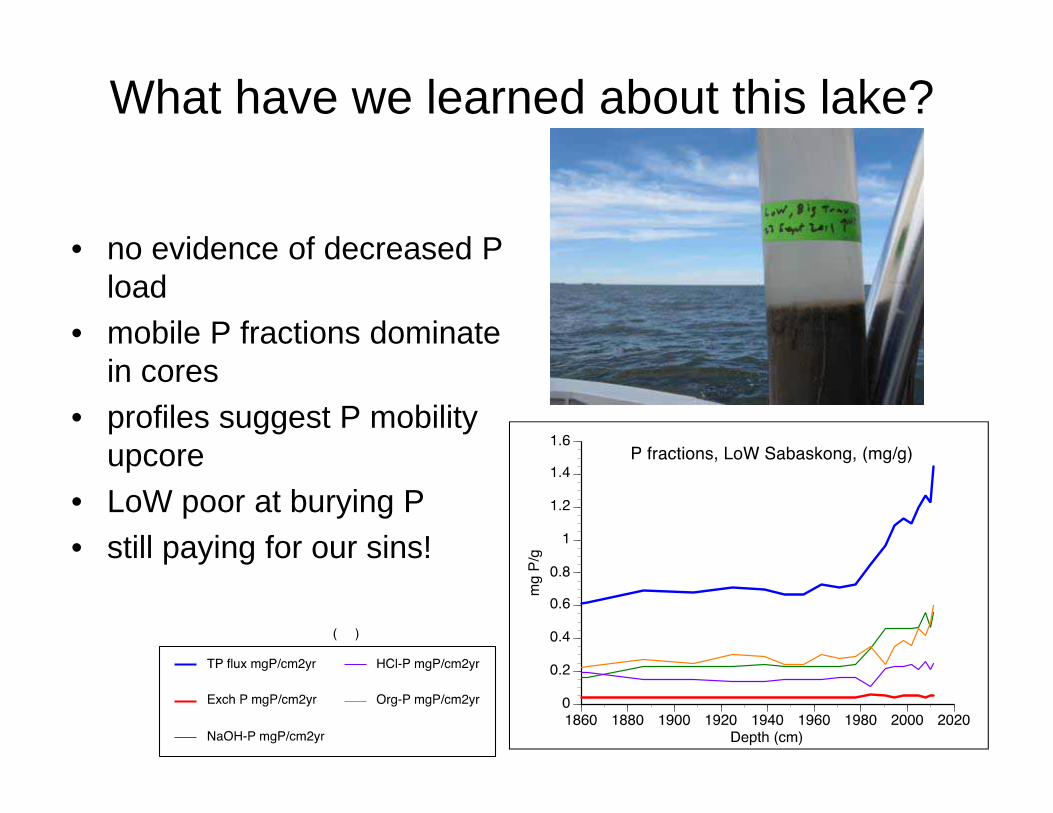
What have we learned about this lake?
• no evidence of decreased P load
• mobile P fractions dominate in cores
• profiles suggest P mobility upcore
• LoW poor at burying P• still paying for our sins!
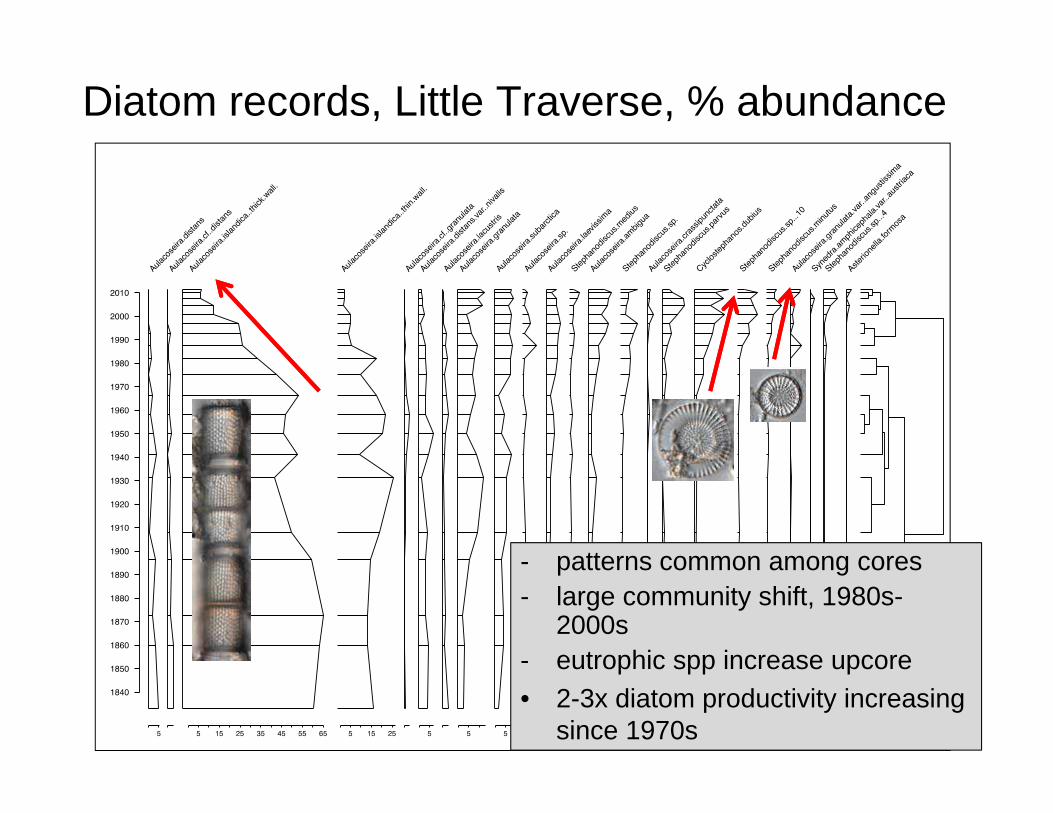
Diatom records, Little Traverse, % abundance
- patterns common among cores- large community shift, 1980s-
2000s- eutrophic spp increase upcore• 2-3x diatom productivity increasing
since 1970s

An iconic lake in a death spiral?• rare situation where we
have good monitoring data on P loads
• no evidence that decreased loads have improved lake
• legacy P – climate interaction in southern Lake of the Woods?
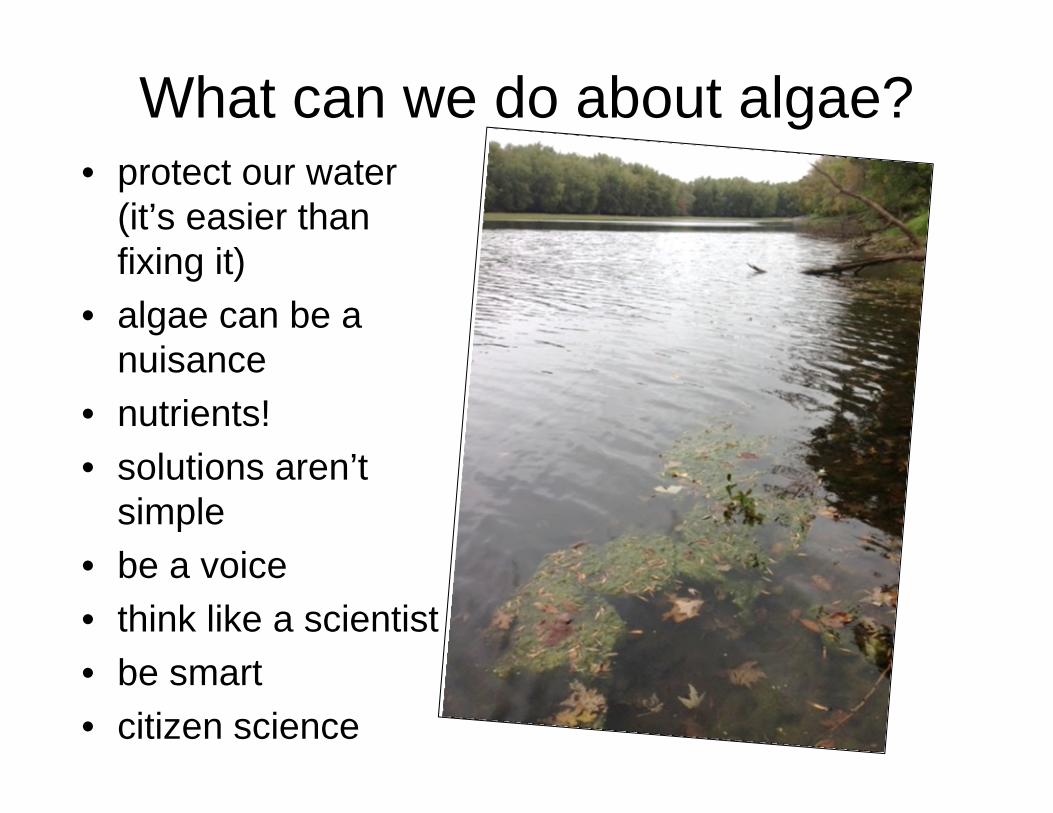
What can we do about algae?• protect our water
(it’s easier than fixing it)
• algae can be a nuisance
• nutrients! • solutions aren’t
simple• be a voice• think like a scientist• be smart• citizen science
Related Documents