This article appeared in a journal published by Elsevier. The attached copy is furnished to the author for internal non-commercial research and education use, including for instruction at the authors institution and sharing with colleagues. Other uses, including reproduction and distribution, or selling or licensing copies, or posting to personal, institutional or third party websites are prohibited. In most cases authors are permitted to post their version of the article (e.g. in Word or Tex form) to their personal website or institutional repository. Authors requiring further information regarding Elsevier’s archiving and manuscript policies are encouraged to visit: http://www.elsevier.com/copyright

Welcome message from author
This document is posted to help you gain knowledge. Please leave a comment to let me know what you think about it! Share it to your friends and learn new things together.
Transcript
This article appeared in a journal published by Elsevier. The attachedcopy is furnished to the author for internal non-commercial researchand education use, including for instruction at the authors institution
and sharing with colleagues.
Other uses, including reproduction and distribution, or selling orlicensing copies, or posting to personal, institutional or third party
websites are prohibited.
In most cases authors are permitted to post their version of thearticle (e.g. in Word or Tex form) to their personal website orinstitutional repository. Authors requiring further information
regarding Elsevier’s archiving and manuscript policies areencouraged to visit:
http://www.elsevier.com/copyright

Author's personal copy
Journal of Retailing 88 (1, 2012) 7–19
Europoly Money: How Do Tourists Convert Foreign Currencies to MakeSpending Decisions?
Priya Raghubir ∗, Vicki G. Morwitz, Shelle SantanaDepartment of Marketing, Leonard N. Stern School of Business, New York University, New York, NY 10012, United States
Abstract
This paper examines how tourists convert foreign currencies to make spending decisions. Six studies demonstrate how sequential (Study 1) andsimultaneous (Study 2) exposure to nominally different (but economically identical) prices, and the manner in which tourists perform currencyconversions (Studies 3–5) influence price perceptions and purchase intentions. Study 6 shows the effects using macroeconomic spending behaviorfrom 1993 to 2008 spanning the introduction of the Euro. The general discussion concludes with a model of how numerical inputs are combinedto make judgments as a function of the number of inputs available and their ease of use.© 2011 New York University. Published by Elsevier Inc. All rights reserved.
Keywords: Tourists; Foreign currency; Price perceptions
Introduction
This paper examines how tourists convert foreign pricesto make spending decisions as a function of sequential andsimultaneous exposure to prices provided in multiple versussingle currencies, the ease or difficulty of converting curren-cies, and the strategies used to do these conversions. Accordingto the World Tourism Organization (WTO), tourism expendi-tures are the world’s largest exported product. In 2010, nearly1 billion people traveled to a foreign country, and their totalexpenditures and transportation costs totaled over US$ 900 bil-lion (World Tourism Organization 2011). After a few years oflimited growth, the WTO recently estimated that the numberof international tourists will increase by 4–5 percent, in 2011(WTO 2011). Past research has demonstrated that one impor-tant factor that influences tourism volume and expenditures iscurrency exchange rates (WTO 2011). Because tourism expen-ditures have important implications for the economies of visitednations, domestic prices, wage rates, and consumer welfare,research that examines how consumers process foreign curren-cies and how this, in turn, influences their expenditures is ofinterest to not only economists, but also to psychologists who are
∗ Corresponding author. Tel.: +1 212 998 0503.E-mail addresses: [email protected] (P. Raghubir),
[email protected] (V.G. Morwitz), [email protected](S. Santana).
interested in how tourists process price information to makepurchase decisions.
Tourists often encounter prices for the same good presented indifferent ways. When they move between countries, tourists seeprices for the same good offered in different currencies. At othertimes, they may observe the price of a given good in multiplecurrencies, for example in duty free shops. Consumers can alsosee the same price represented in different currencies when acountry undergoes a change in currency and presents prices inboth an old and new currency prior to and after the changeover,as occurred with the introduction of the Euro in 2002.
Prior research has shown that the way a price is framedcan influence consumers’ perceptions of deal value (Darke andChung 2005), perceived savings (Krishna et al. 2002), and acqui-sition and transaction value (Chandrashekaran 2004). However,much of the prior research on framing effects in pricing used asales promotions context. In contrast, we use tourist scenarios,including the currency transition to the Euro, to examine priceframing effects when consumers observe the same price framedin multiple ways.
Study 1 examines the impact of sequential exposure to for-eign currencies on consumers’ price perceptions. The resultsshow that consumers believe they have spent less in Euro termswhen they were first exposed to prices in a currency whoseface value is larger than the Euro (DM 2 ∼=D1) than if theyare first exposed to a currency whose face value is smallerthan the Euro (£.5 ∼=D1). Study 2 examines the impact ofsimultaneous exposure to two foreign currencies (DFF vs. FFD)
0022-4359/$ – see front matter © 2011 New York University. Published by Elsevier Inc. All rights reserved.doi:10.1016/j.jretai.2011.11.001

Author's personal copy
8 P. Raghubir et al. / Journal of Retailing 88 (1, 2012) 7–19
and shows that people anchor on the nominal value of thecurrency that is more salient. Thus, they display the “money-illusion” effect, even when the original currency is also available.Study 3 extends these findings by examining the effects of see-ing either only foreign prices or these plus the prices convertedinto tourists’ home currency and tourists’ conversion strategieson their value perceptions and intentions. Studies 4 and 5 moveto a non-Euro context to examine how tourists convert in sit-uations where the currency exchange rates make conversiondifficult ($1 = Rs 42.50, Rs 47.50, Rs 45). We show that themere value of the exchange rate affects whether people natu-rally tend to round exchange rates down ($1 = Rs 42.50 → Rs40.00), or up ($1 = Rs 47.50 → Rs 50.00), and that these strate-gies moderate how providing prices only in the foreign currencyversus also providing the prices in the home currency influ-ence buying intentions. Finally, to test the external validity ofthe effects of a foreign currency on demand, in Study 6 wereport an analysis of macroeconomic tourism data for Euro-pean countries from 1993 to 2008. Our prior findings suggestwhat we call a “Europoly effect”: increased spending in Europe(where nominal Euro prices were lower than those in the orig-inal local currencies in 11 of the 12 countries that changed tothe Euro) after the Euro conversion. We find evidence for thisEuropoly effect: tourist spending in continental Euro countrieswas higher than in non-Euro countries post the changeover to theEuro.
The primary theoretical contributions of this paper are toshow that:
i) When multiple nominal values are available, then the man-ner in which people integrate them can lead to biases dueto the inappropriate use of an anchor, an inadequate adjust-ment to the anchor (replicating the face value effect; Study1), or an unnecessary adjustment to an anchor (the “europolyeffect”; Studies 2 and 3) whereby the mere presence of asecond equivalent currency amount biases responses.
ii) People round up (i.e., underestimate prices) or round downexchange rates (i.e., over estimate prices) to make their con-version tasks easier as a function of the actual exchange rate(Study 4), or task instructions (Studies 3 and 5).
iii) Providing familiar, lower nominal values makes a productappear to be higher value for the money when people rounddown by reducing the overestimation of prices, but makesit appear lower value for money when they round up byreducing the underestimation of prices (Study 3).
iv) When people use rounding strategies, then they are lesslikely to use the lower nominal value of an equivalent priceto make their judgments, but when they do not round, theyappear to inappropriately adjust the price using the lowernominal value, which in turn leads to higher purchase inten-tions (Study 4).
v) These individual level effects have economic consequences(Study 6).
vi) From a public policy and consumer welfare point of viewour results show that presenting an old and a new currencysimultaneously is not adequate to train consumers to thinkin the new currency: Biases persist.
The next section provides background information about thetransition to the Euro, since several of our studies use the Eurotransition context. We next provide a brief review of prior liter-ature on the money-illusion and Euro effects. We then describethe five experiments and the analysis of macroeconomic data.
The euro transition
In January 1999 the General Council of the European CentralBank set the conversion rate for the Euro for twelve countries thatwent on the Euro standard: Belgium, Germany, Greece, Spain,France, Ireland, Italy, Luxembourg, the Netherlands, Austria,Portugal, and Finland. These rates are “irrevocably fixed,” suchthat the Euro simply expresses the value of the previous localcurrency. On January 1, 1999, the Euro was established as theofficial currency of the twelve participating countries and couldbe used to make electronic payments, write checks, and for credittransactions. From January 1999 onwards, the twelve participat-ing countries included prices in Euros along with the prices intheir local currencies. For example, in France, while the price ofa product was primarily communicated in French Francs (FF),the Euro conversion appeared in a smaller font underneath it,ostensibly to help the French to begin to think in Euro terms. Inall of these countries, except Ireland, the nominal prices of goodswere lower in Euros than they were in the prior local currency.
The legal tender of Euro was introduced on January 1, 2002,and countries gradually ended the circulation of their existingnational currencies. There was a dual circulation period until thechangeover was complete, during which time both the new Euroand the old national currency remained in circulation. By the endof February 2002, all twelve countries had discontinued the useof their local currency. However, to help people translate pricesfrom one currency into the other, in many countries, a reversepricing communication system to what was described earlierwas adopted. The prices were displayed in Euro terms, with thelocal national currency conversion shown just below. In January2003, many retailers discontinued communicating prices in localnational currencies and only provided the prices of products inEuros, although some retailers continue the practice of display-ing prices in both currencies to this day. It was expected that,over time, consumers would become accustomed to thinking inEuro terms, and would no longer require the local currency ref-erence as an aid. This paper examines how framing a price intwo nominally different (but economically identical) currenciesaffects consumer-spending decisions beyond the fact that pricesare overall more transparent due to the easier comparison ofprices across countries with a single currency (Mussweiler andStrack 2004).
The money illusion
The “money illusion” is a bias in how people assess economictransactions because they over-weight nominal values relative toreal values (Shafir, Diamond, and Tversky 1997). Using a vari-ety of scenarios, Shafir, Diamond, and (Tversky 1997) showthat people overweight nominal values and underweight ratesof inflation and price changes and this is because people are

Author's personal copy
P. Raghubir et al. / Journal of Retailing 88 (1, 2012) 7–19 9
expected to rely on the relatively easier and salient nominalvalue while making their assessment. Raghubir and Srivastava(2002) demonstrated a similar effect using foreign currencies.They showed that when a unit of a home currency was worth amultiple of units of a foreign currency people under-spent. Thiswas because they used the face value of the product price as astarting anchor to make their decision and inadequately adjustedthis for the exchange rate. The reverse (over-spending) occurredwhen the foreign currency was a fraction of the home currency.Their studies examined easy to convert exchange rates and begthe question as to how more difficult exchange rate conversionswould be processed. This paper examines the larger question ofhow tourists make exchange rate conversions, when consumersuse rounding strategies to simplify exchange rate conversions,and how this affects their spending behavior when alternate pricecues are available.
The money illusion has implications for how people pro-cess exchange rates within the context of the Euro transitionand beyond. Research has documented that Euro prices are per-ceived to be cheaper than the former, familiar currency whenthe nominal value of the familiar currency is larger than thatof the Euro (D1 = FF 6.56, Desmet 2002), especially for cer-tain demographic groups (Lemaire and Lecacheur 2001), and atthe initial time of introduction (Mussweiler and Englich 2003).In Germany, Jonas et al. (2002) found that consumers overes-timated prices in Euros, and in Sweden, Gamble et al. (2005)found that students preferred to use a currency that had a smallernominal value when paying for a product.
Prices are also perceived to differ less from each other whenthey are expressed in Euros versus French Francs: the “accor-dion effect” (Gaston-Breton and Desmet 1999). The accordioneffect, in turn, allows national brands to charge higher price pre-miums over store brands as consumers are willing to pay morefor additional features when the face value difference in the priceappears small (Gamble et al. 2002, 2005). This leads to concernsabout the potential inflationary effect of Euro pricing: Marini,Piergallini, and Scaramozzino (2007) found that since January2002, the inflation rate in Italy was underestimated by as muchas 6 percent, possibly due to “euro-inflation.” Framing prices inEuros has also changed the way consumers make price-qualitytradeoffs: consumers purchased more expensive products whenthey were presented in Euro prices, allowing premium brands toincrease their market share (Diller and Ivens 2000).
Finally, prior research shows that people are less certain aboutprices subsequent to a currency transition (Kühberger and Keul2003). This leads to less accurate estimation of prices (Marquesand Dehaene 2004). In fact, the “Weber fraction,” (standarddeviation of estimated prices/mean of expected prices), whichreflects the accuracy of price estimates, was higher for Eurosthan for French Francs, Portuguese Escudos, and the Irish Punt(Dehaene and Marques 2002). Anttila (2004) found that theinternal reference prices and the width of price latitudes changedin Finland after the introduction of the Euro.
The research reviewed above provides evidence consistentwith the “Money Illusion” as applied to the Euro transition forcountries whose home currencies were a multiple of the euro.Questions, however, have been raised about the external validity
and internal validity of these findings, as well as about the lengthof time for which the bias lasts (Desmet 2002).
One of the goals of this paper is to answer these questions and,more importantly, to extend our understanding of how touristsmake spending decisions. Study 1 replicates the money illusioneffect in the context of the transition to the Euro, controllingfor criticisms leveled against prior research in terms of inter-nal validity. Studies 2–5 extend these findings and examine howtourists process prices both in the Euro context and in broadermore general tourist spending contexts. Study 6 examines theoverall economic implications of price frame changes usingmacroeconomic indicators. By examining overall macroeco-nomic tourist spending data for countries that adopted the Euro(vs. those that did not), we show the real world relevance of howpeople process unfamiliar currencies for consumer welfare andpublic policy.
Study 1: The effect of prior currency exposure
This study tests whether prices will appear cheaper (moreexpensive) in a foreign currency (D) if the prior currency frame ofreference was a multiple (a fraction) of the new foreign currency.This experiment was designed to control for criticisms leveledat earlier research that has documented these effects (Desmet2002). Specifically, most prior research has used residents fromcountries who were more familiar with the old currency thanthe new one, leading to a possible explanation that the effectswere driven by familiarity of old prices that served as a priorreference, and the novelty of the new prices rather than the useof nominal values in computing prices. We manipulate priorcountry exposure by using a foreign traveler task, where a personis assigned to one of three countries (with a multiple, fraction,and equivalent exchange rate to the new currency), and then hasto make a decision regarding what to buy on a website whereprices are given in Euros. Second, the information provided toall respondents is exactly the same (prices in Euro), and theonly difference is a short prior exposure to another currency(which is not their home currency). Therefore, the results cannotbe driven by perceptions of country-of-origin differences in theprovided currencies across groups: a critique of the Raghubirand Srivastava (2002) studies. Third, the ease of conversion iscontrolled by making one set of old prices equal to the newprice (Irish Punt to Euro), another set double the new price (DMto Euro), and a third set half the new price (Sterling to Euro).Finally, the dependent measure is a retrospective assessment ofthe value of a shopping basket, where the actual amount of theshopping basket is held constant across all conditions. Thus,there is no difference in what people buy and how much theypay for it across conditions, but rather on their assessment ofhow much their shopping basket costs.
Study description
ParticipantsFifty-seven undergraduates in the US participated for partial
course credit. Due to partial non-response from 6 respondents,we had a usable sample of 51.
Author's personal copy
10 P. Raghubir et al. / Journal of Retailing 88 (1, 2012) 7–19
Table 1List of products and prices provided to participants in Study 1.
Product Prior price exposure Sequential price exposure
Condition 1 Condition 2 Condition 3Ireland Germany UK Euro.com
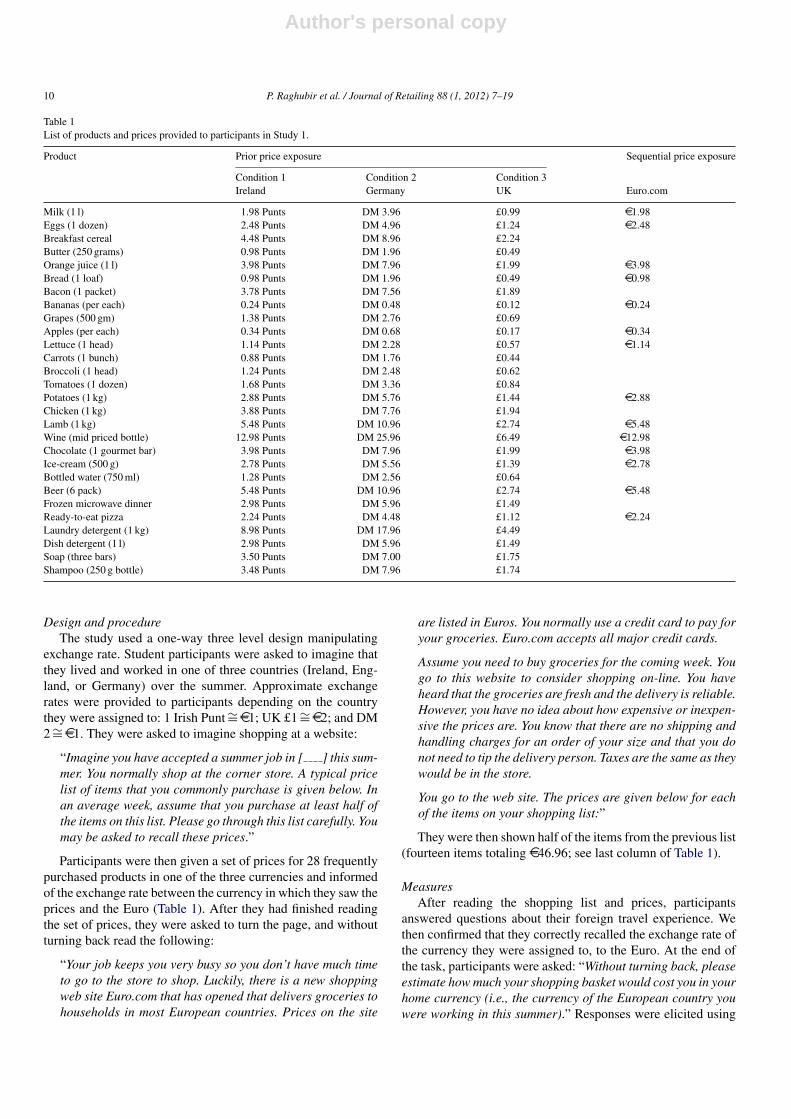
Milk (1 l) 1.98 Punts DM 3.96 £0.99 D1.98Eggs (1 dozen) 2.48 Punts DM 4.96 £1.24 D2.48Breakfast cereal 4.48 Punts DM 8.96 £2.24Butter (250 grams) 0.98 Punts DM 1.96 £0.49Orange juice (1 l) 3.98 Punts DM 7.96 £1.99 D3.98Bread (1 loaf) 0.98 Punts DM 1.96 £0.49 D0.98Bacon (1 packet) 3.78 Punts DM 7.56 £1.89Bananas (per each) 0.24 Punts DM 0.48 £0.12 D0.24Grapes (500 gm) 1.38 Punts DM 2.76 £0.69Apples (per each) 0.34 Punts DM 0.68 £0.17 D0.34Lettuce (1 head) 1.14 Punts DM 2.28 £0.57 D1.14Carrots (1 bunch) 0.88 Punts DM 1.76 £0.44Broccoli (1 head) 1.24 Punts DM 2.48 £0.62Tomatoes (1 dozen) 1.68 Punts DM 3.36 £0.84Potatoes (1 kg) 2.88 Punts DM 5.76 £1.44 D2.88Chicken (1 kg) 3.88 Punts DM 7.76 £1.94Lamb (1 kg) 5.48 Punts DM 10.96 £2.74 D5.48Wine (mid priced bottle) 12.98 Punts DM 25.96 £6.49 D12.98Chocolate (1 gourmet bar) 3.98 Punts DM 7.96 £1.99 D3.98Ice-cream (500 g) 2.78 Punts DM 5.56 £1.39 D2.78Bottled water (750 ml) 1.28 Punts DM 2.56 £0.64Beer (6 pack) 5.48 Punts DM 10.96 £2.74 D5.48Frozen microwave dinner 2.98 Punts DM 5.96 £1.49Ready-to-eat pizza 2.24 Punts DM 4.48 £1.12 D2.24Laundry detergent (1 kg) 8.98 Punts DM 17.96 £4.49Dish detergent (1 l) 2.98 Punts DM 5.96 £1.49Soap (three bars) 3.50 Punts DM 7.00 £1.75Shampoo (250 g bottle) 3.48 Punts DM 7.96 £1.74
Design and procedureThe study used a one-way three level design manipulating
exchange rate. Student participants were asked to imagine thatthey lived and worked in one of three countries (Ireland, Eng-land, or Germany) over the summer. Approximate exchangerates were provided to participants depending on the countrythey were assigned to: 1 Irish Punt ∼=D1; UK £1 ∼=D2; and DM2 ∼=D1. They were asked to imagine shopping at a website:
“Imagine you have accepted a summer job in [ ] this sum-mer. You normally shop at the corner store. A typical pricelist of items that you commonly purchase is given below. Inan average week, assume that you purchase at least half ofthe items on this list. Please go through this list carefully. Youmay be asked to recall these prices.”
Participants were then given a set of prices for 28 frequentlypurchased products in one of the three currencies and informedof the exchange rate between the currency in which they saw theprices and the Euro (Table 1). After they had finished readingthe set of prices, they were asked to turn the page, and withoutturning back read the following:
“Your job keeps you very busy so you don’t have much timeto go to the store to shop. Luckily, there is a new shoppingweb site Euro.com that has opened that delivers groceries tohouseholds in most European countries. Prices on the site
are listed in Euros. You normally use a credit card to pay foryour groceries. Euro.com accepts all major credit cards.
Assume you need to buy groceries for the coming week. Yougo to this website to consider shopping on-line. You haveheard that the groceries are fresh and the delivery is reliable.However, you have no idea about how expensive or inexpen-sive the prices are. You know that there are no shipping andhandling charges for an order of your size and that you donot need to tip the delivery person. Taxes are the same as theywould be in the store.
You go to the web site. The prices are given below for eachof the items on your shopping list:”
They were then shown half of the items from the previous list(fourteen items totaling D46.96; see last column of Table 1).
MeasuresAfter reading the shopping list and prices, participants
answered questions about their foreign travel experience. Wethen confirmed that they correctly recalled the exchange rate ofthe currency they were assigned to, to the Euro. At the end ofthe task, participants were asked: “Without turning back, pleaseestimate how much your shopping basket would cost you in yourhome currency (i.e., the currency of the European country youwere working in this summer).” Responses were elicited using
Author's personal copy
P. Raghubir et al. / Journal of Retailing 88 (1, 2012) 7–19 11
Fig. 1. Mean estimates of total cost of shopping basket by prior cur-rency in Experiment Error bars represent standard error of means (standarddeviation/
√n).
an open-ended format. This amount, converted back into Eurosserved as the dependent measure. All participants were thankedand debriefed. The procedure took approximately 15 min.
Results and discussion
A one-way ANOVA on the total cost of the shopping basket(in D) using country as the independent variable was signifi-cant (F (2, 48) = 9.96, p < .01, η2 = .29). Using three plannedorthogonal contrasts, we examined whether the means differedfrom each other, as well as whether they differed from theactual costs of the basket. As predicted, those in the UK con-dition (D2 = £1) overestimated the cost of their shopping basketat D89.78 (SD = 51.53, t17 vs. D46.96 = 3.53, p < .01) which isalmost twice the actual cost of the basket (see Fig. 1). This wasa higher estimate given than those in the Irish Punt condition(M =D52.13, SD = 37.11, contrast t48 = 2.78, p < .01), as well asthe estimate given in the DM condition (M =D33.47, SD = 19.72,contrast t48 = 4.39, p < .01). Those in the DM condition underes-timated the shopping basket by about approximately 70 percent(t17 vs. D46.96 = 2.90, p < .01) and had directionally lower esti-mates than those in the Irish Punt condition (contrast t48 = 1.39,p = .17). The estimates for the Irish punt were not significantlydifferent from the actual cost. Thus, as predicted, compared tothe actual cost of the basket, those for whom the Euro was amultiple of their local currency overestimated the magnitude ofthe value of the shopping basket, while those for whom the Eurowas a fraction of their local currency underestimated it, and thosewhere the Euro was equivalent estimated it accurately, with mostof these three estimates differing from each other.
Presumably, due to concerns regarding consumers’ misun-derstanding and miscalculating prices during the process of thecurrency changeover, such as those shown in Study 1, Europeancountries attempted to educate their populations using a num-ber of methods, including displaying prices in both currenciesduring the period of transition. The next experiment examineswhether such a strategy is effective.
Study 2: The effect of simultaneous currency frames: is thesecond currency ignored?
Study description
The results from Experiment 1 suggest that consistent withthe money illusion, prices provided in a new unfamiliar currencythat has a smaller face value than the home currency will beperceived to be cheaper than prices in the home currency. Recallthat between 1999 and 2002 the countries that were changingto the Euro displayed prices in their local currency with theEuro equivalent in smaller font (FFD); and starting in 2002, didthe reverse (DFF). Some retailers in these countries continueto display prices in both prior local and Euro currencies even in2011. The money illusion is silent as to how people process priceinformation when there are multiple face values (or nominalamounts) presented simultaneously.
This study examines how people process prices when twoprices are present, whether they average the face values, or ignorethe second currency partially or completely. If, when the Euro isthe primary currency (and French Franc the secondary currency)prices are perceived to be cheaper than the reverse, this impliesthat including information about another currency may not erad-icate the money illusion and would provide further evidence forthe robustness of the money illusion even when multiple metricsof the same value are available.
ParticipantsTwenty-eight undergraduate business students enrolled in
summer school in the United States participated in the studyfor partial course credit. Four participants did not complete allmeasures, leading to lower degrees of freedom for some analy-ses.
Design and procedureThe cover story was:
“As you are aware people make decisions about whether ornot to buy a product based on their need for the product, itsquality, and its price. Sometimes, the unexpected happens andthey need to go shopping when they least expect it. Imagineyourself in the following scenario.”
They were then provided a vignette designed to allow a vari-able consideration set size and spending amount, as well as ascenario that was believable and realistic. They were told:
“You have gone to Paris for two weeks. On landing at Charlesde Gaulle airport at 9:00 in the morning, you hear your namepaged. Walking up to the United service counter, you are toldthat your bag got delayed and will be delivered to you thenext day, in the late evening. The next day is Saturday and youplan to use it to visit museums. You ask whether United willreimburse you expenses for purchase of a few essentials. Theperson at the counter hands you a small toilet kit that containsa disposable toothbrush, toothpaste, lotion, a razor, smallsoap, deodorant and small shampoo. On pressing whetherUnited will reimburse the cost of a change of clothing, you
Author's personal copy
12 P. Raghubir et al. / Journal of Retailing 88 (1, 2012) 7–19
Table 2Shopping list in Study 2.
Item Prices
Euroa French Francsa
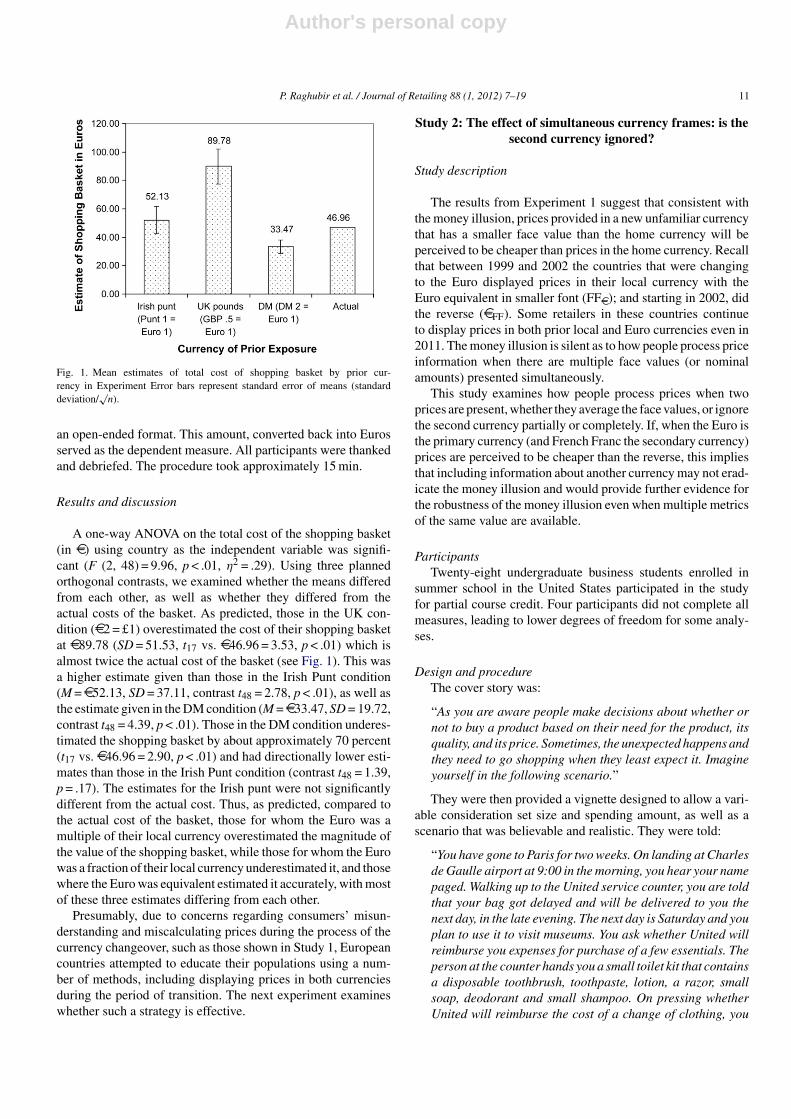
Pair of denim jeans 30.00 196.80Pair of trousers 40.00 262.40Nightshirt 22.50 147.60Underwear 15.00 98.40Shirt 20.00 131.20T-shirt 12.00 78.70Scarf/tie 10.00 65.60Belt 15.00 98.40Toothpaste 5.00 32.80Mouthwash 3.80 24.90Floss 3.00 19.70Toothbrush 6.00 39.40Footwear 85.00 557.60
Note. Across different conditions, either the prices were presented in Euros withFrancs in smaller font in brackets, or in Francs with Euros in smaller font inbrackets.
a Prices are drawn from Monoprix, a French store.
are told that they may reimburse you to a maximum of US$100(approximately Euro 105). However, you will have to requestthem to do this upon returning to the U.S. at the end of yourtrip. You go to your apartment and wash up, take a nap, andthen go out to buy yourself a few essentials. Below are pricesof some items that you see at the local chain store, Monoprix.It is not a fancy store with high fashion items, but it does stocka fair range of decent, everyday merchandise, and is close toyour apartment. Go through the list and make a decision as towhether you will purchase the product or not by checking thebox that best describes your likelihood of purchase: either“Definitely Buy,” “Probably Buy,” “Probably Not Buy,” or“Definitely Not Buy.”
The total menu of thirteen items allowed a maximum spend-ing of D252 (∼=US$ 240 at the time of data collection), whichwas substantially higher than the maximum amount that theywould be reimbursed by United (US$ 100). Prices were pro-vided in both currencies, but in one condition the Euro was inprominent bold with the French Francs in a smaller font at sub-script level; and in the other condition the reverse format wasused. Table 2 lists the items and their prices. Note that the airlinewas going to be providing them with a toilet kit including travelsize toothpaste and toothbrush, but full size versions of thesebasic toiletries were also listed on the potential shopping list.
MeasuresStudy participants indicated for each item whether they would
“Definitely Buy,” “Probably Buy,” “Probably Not Buy,” or “Def-initely Not Buy.” The number of items that were rated either“probably buy” or “definitely buy” was also counted for eachsubject. This measure can range from zero to thirteen. We predictthat spending will be higher in the DFF price frame as comparedto the FFD price frame.
Results and discussion
The analysis used was a MANOVA where currency frame(DFF or FFD) was the independent variable and the inten-tions for each of the thirteen items on the shopping listwere the dependent variables. The results show that peoplehave marginally higher average intentions when the frame isDFF (M = 2.24, SD = .13) versus FFD (M = 1.87, SD = .14; F(1,22) = 3.55, p < .07, η2 = .15). Consistent with this, the number ofitems for which people checked “probably” or “definitely” pur-chase was also higher in the DFF frame (M = 5.60, SD = 2.72)versus the FFD frame (M = 3.62, SD = 2.14, F(1, 22) = 4.49,p < .05, η2 = .15).
The results provide support for the europoly money effectand extend the money illusion and face value effects to whenmultiple nominal values (currencies) are available. The pres-ence of a secondary currency does not eliminate the face valueeffect. People continue to behave as though they are primar-ily processing the information presented in the more visuallysalient currency. The europoly effect persists when the refer-ence currency is the more visually salient currency, even whenboth currencies are available to be used simultaneously. Sincethis study had a small sample, one goal of the next study is toreplicate these findings. The main goal of Study 3 is to extendthe domain of enquiry to assess what effect currency conversionstrategies have on perceptions of price value.
Study 3: The duty free study
Specifically, Study 3 was designed to test whether differentcurrency conversion strategies will lead to different price esti-mation biases, and whether these biases can be moderated by thepresence of a home currency cue. Specifically, we predict thatwhen tourists round down an exchange rate prior to perform-ing a price conversion and then adjust, they will overestimateforeign currency prices, because they will anchor on the eas-ier exchange rate they rounded to, and the amount they adjustafterwards will be inadequate. However, when a US$ equiva-lent amount is provided in addition to the local currency price,consumer will perceive the offering to have higher value. Thereverse should occur when tourists round up exchange rates andthen adjust (and therefore underestimate prices).
Study description
ParticipantsEighty-one undergraduate students (42 business undergrad-
uates and 39 from other disciplines; Males = 39, Females = 42)enrolled in an introductory marketing class in the United Statesparticipated in the study for partial course credit. The sample wasfairly international: Seventeen of them reported having lived inEurope, 41 had a non-US country of origin, 66 of them reportedhaving made a duty free purchase, 60 percent of them respondedwith a 5, 6, or 7 to the question of how often they had travelledoverseas (1 = Not at all frequently, 7 = Very frequently), with 48percent reporting a 5, 6, or 7 to the question of how familiar theywere with Europe (1 = Not at all/7 = Very familiar). On a scale
Author's personal copy
P. Raghubir et al. / Journal of Retailing 88 (1, 2012) 7–19 13
of 1–7, where 1 = Not at all and 7 = Very, they reported beingfairly motivated to complete the study task (M = 4.72), finding itrealistic (5.36), some familiarity with Europe (M = 3.98), confi-dence in their math skills (M = 5.73), which they believed werestrong (M = 5.55).
Design and procedureThe cover story was:
“Imagine that you are at an overseas airport on your wayhome after completing a European vacation. You still haveunspent foreign currency with you (denoted as K), and youstill need to buy a few gifts before returning home. After youcheck in for your flight, you stop in at a Duty Free store to lookaround and to decide whether or not to spend the remainingmoney, and if so, how. The exchange rate for the money youare carrying is: $1 = K2.5.”
Participants were randomly assigned to one of four condi-tions using a 2 (US$ equivalent present or absent) × 2 (Travelertip: “round down to 2 and adjust as necessary,” or “round upto 3 and adjust as necessary”) design. The traveler tip stated“An easy way to estimate what a price posted in K’s would bein US dollars is to divide the displayed K price by 2 (3) andadjust as necessary.” They then saw four candy items: Cad-bury Chunks (K15.00, $6.00), Lindt Praline Noir Dorigin 120G(K20.00, $8.00), Jelly Belly Gift Box 595G (K30.00, $12.00),Ferrero Rocher 375G Promo Pack, (K 35.00, $14.00), alongwith pictures and were asked to rate the duty free store on aseven point scale (1 = Poor value for money, 7 = Good value formoney). Note that US$ equivalents were only provided in theUS$ equivalent present conditions. Participants then completedmanipulation checks and questions relating to their math skills,international experience, and demographics, and were debriefedand dismissed.
ResultsThe manipulation of traveler tip worked as intended. In the
traveler tip “round down to 2 and adjust” condition, 54 percent(20/37) respondents reported dividing by 2 (with or withoutadjustment), with 13 calculating the exact prices and 4 usinganother strategy. In contrast, in the “round up to 3 and adjust”traveler tip condition, 32 percent (14/44) reported dividing by3 (4 divided by 2, 21 calculated the exact value, and 5 usedanother strategy; overall χ2
3 = 26.25, p < .001). Note that the“round up to 3” instruction appears to have lower compliancethan the “round down to 2” instruction; an issue that may explainsome of the results presented below.
A 2 × 2 ANOVA on the perceptions of value for money,including participants’ level of confidence in their math skillsand how comfortable they felt with them as covariates, revealeda significant dollar equivalent × conversion strategy interaction(F(1, 73) = 4.54, p < .05, η2 = .06), with no significant maineffects. The pattern of the interaction is a cross over aspredicted and is analyzed using pair-wise differences usingTukey’s two-tailed t-tests based on the root mean square. Whenparticipants were given the “round down to 2 and adjust” tip andUS$ equivalents were not provided, then the duty free store was
rated as lower value for money (M = 3.28, SD = 1.36), than whenUS$ equivalents were provided (M = 4.05, SD = 1.35, t36 = 2.31,p < .05). On the other hand, when respondents were given the“round up to 3 and adjust” tip and US$ equivalents were notprovided, then the duty free store was rated as directionallyhigher value for money (M = 3.79, SD = 1.75), than when US$equivalents were provided (M = 3.30, SD = 1.29), though thedifference was not significant.
To examine whether when participates rounded, then tendedto anchor too much on the rounded conversion rate and adjustinsufficiently for the actual difference in the exchange rate, weasked participants to convert two amounts in K back to theirUS$ equivalents without using a calculator: K20 ($8) and K60($24). For both of these amounts there was a main effect oftraveler tip condition (F(1, 77) = 4.03 and 3.45, ps < .05 and .07respectively, η2s = .05 and .04 respectively). Both prices weredirectionally underestimated in the “round up to 3” condition(Ms = $7.66 and $23.20, SDs = .92 and 3.34, t43 vs. actual = 2.43and 1.57, ps < .05 and .13), and significantly overestimated in the“round down to 2” condition (Ms = $9.82 and $29.16, SDs = 6.98and 20.56, t35 vs. actual = 2.56 and 4.41, ps < .05). Note, again,that the “round down to 2” manipulation appeared to be strongerthan the “round up to 3” manipulation (see Discussion).
Discussion
For both the value and intentions measures, the presence ofthe US$ equivalent affected consumer judgments more stronglyin the “round down to 2” condition than in the “round up to3” condition, possibly because people in the “round up to 3”condition were less likely to comply with the instructions anddivide by 3. It is unclear whether this was due to a difference inthe intrinsic ease of dividing by 2 or 3, or preference to rounddown versus up, or other factors. Therefore, the next two studiesfurther examine rounding strategies and also examine whetherbiases in price perceptions have downstream consequences onpurchase intentions.
Studies 4 and 5: vacation in India
Studies 4 and 5 use a similar paradigm and a similar set ofmeasures. These studies were designed to test the robustness ofthe effects observed in the earlier studies for different, and moredifficult to compute exchange rates. We describe their overallprocedure first and then describe the specific manipulations andresults for each.
Study participants
Study 4 (n = 134) used undergraduates from the same pool(without replacement) as Study 3. Study 5 (n = 148) was con-ducted using an online sample of US residents (mTurk) to testwhether the effects generalized to a diverse adult population.

Author's personal copy
14 P. Raghubir et al. / Journal of Retailing 88 (1, 2012) 7–19
Procedure
The task was based on a tourist situation. Participants weretold:
“Imagine that you have travelled to India with a close friendor relative. At the airport you exchange the US dollars thatyou are carrying with you into Indian Rupees. $1 = Rs (42.50,45, 47.50). You are staying at a nice hotel which is not veryluxurious, but is clean, safe, and in a great location. You startoff your trip in New Delhi, from where you plan to go to Agrato see the Taj Mahal, and then you plan to end your tripin Jaipur before flying back to New York. On your secondnight you and your friend have to make a choice of whereyou are going to eat. You have heard of this great restaurantfrom colleagues of yours who knows New Delhi well. Therestaurant is offering a prix fix menu for two which includesmany of the dishes that you want to try. The offering is: Soup,Salads, 3 Meat and 2 Fish dishes, 5 vegetarian options, 3desserts: Dinner for two people: Rs 2000. If you do not go tothe restaurant, you could eat at the hotel itself, where the foodis reasonable, the prices are moderate, and you can order ala carte.”
All respondents then rated their intentions to eat out at therestaurant (7 = Definitely at the restaurant). They were thenasked their intentions to supplement their meal with drinks ifthey had chosen to go to the restaurant (1 = Not at all/7 = Verylikely). The menu of drinks items included three common alco-holic beverages in India: Scotch whiskey (Rs 500), Rum (Rs400), and Large Beer (Rs 200). Subsequently, they were askedto rate the restaurant in terms of how expensive it was (1 = Notat all/7 = Very).
To examine whether the exchange rate had been correctlyencoded and used, in Study 4, we asked participants to estimatethe US$ equivalent of a Rupee amount, and elicited their con-fidence and comfort in their estimation as in Study 3. In bothstudies we asked participants what strategy they had used toarrive at their estimate. Included among these were: “Roundeddown to Rs 40 = $1” and “Rounded up to Rs 50 = $1,” (withor without adjustment), calculated, guessed, knew from experi-ence, and other.
As in Study 3, we then asked a series of questions to measureparticipants’ gender, familiarity with India, experience travellinginternationally, level of motivation, and perceived realism of thescenario, all on seven point scales (7 = High). We also askedthem how easy the conversion task was, how similar it was totasks that they had conducted before, how confident they werein their math skills, and how comfortable they felt in doing thecalculation. These four items loaded onto a single factor andwere combined into an “ease of conversion” index (α = .77).
Study 4 participantsOne hundred and twenty-seven of the 134 partici-
pants completed all measures (Males = 66, Females = 65, Nonresponse = 3). They reported confidence in their math skills(M = 5.20, SD = 1.48), which they believed to be strong(M = 4.92, SD = 1.66), rated the task as realistic (M = 5.29,
SD = 1.53), and reported a reasonable level of motivation to com-plete the study task (M = 4.67, SD = 1.53). Overall they had lowfamiliarity with India (M = 2.52, SD = 1.82). They reported nothaving traveled much to India specifically (M = 1.49, SD = 1.50),but that they traveled overseas reasonably frequently (M = 4.36,SD = 1.88). Due to partial non-response for certain items,degrees of freedom vary across measures.
Study 4 designThe design was a 2 (exchange rate: Rs 42.50 or Rs
47.50 = $1) × 2 (US$ equivalent of prices present/absent)between subjects design.
Study 4 resultsOne goal of this study was to test whether the exchange rate
can affect whether people round up or down. We expected thatwhen the exchange rate was Rs 42.50, then participants wouldnaturally tend to round down to 40, but that they would naturallytend to round up to 50 when the exchange rate was Rs 47.50.This is, indeed, what they did: No one in the Rs 47.50 conditionrounded down to Rs 40 with over 87 percent (55/63) rounding upto Rs 50 (χ2
2 > 25, p < .05). In the Rs 42.50 condition, over half(39/69 or 57 percent) rounded down to Rs 40, with less than aquarter rounding up to Rs 50 (23.2 percent or 16/69, χ2
2 > 16.78,p < .05).
Consistent with these rounding strategies, people’s estimatefor the US$ equivalent of Rs 300 was significantly underesti-mated in the Rs 47.50 condition (M = $6.16, t61 = 2.84, p < .01vs. actual $6.32), but only directionally overestimated in theRs 42.50 condition (M = $7.17, t67 = 1.23, p > .20 vs. actual$7.06). The estimates were only affected by exchange rate (F(1,126) = 70.65, p < .01, η2 = .36) and not by the presence of theUS$ equivalent (no significant main or interaction effect). Rat-ings of the conversion ease index revealed that Rs 300 wasperceived to be easier to convert in the Rs 47.50 condition thanin the Rs 42.50 condition (Ms = 5.78 vs. 5.48 respectively, F(1,123) = 3.23, p < .05, η2 = .03), suggesting that rounding to cer-tain numbers (down to 2 as in Study 3, or up to 50 as in Study4) rather than merely rounding up or down, may be an eas-ier arithmetic task, and may influence what strategies peoplechoose. Given that some participants in the Rs 42.50 conditionrounded up rather than down, and that the most common strat-egy overall was to round up, in the analysis to follow we includeactual strategy used (round up vs. not) as a between subjectsvariable.
The four intention items (likelihood of going to the restau-rant and ordering the three drinks), all loaded onto a singlefactor and were averaged to form a purchase intentions indexthat showed a high level of reliability (α = .64). This intentionsindex was then subjected to a 2 (round up: yes/no) × $ provided(yes, no) × exchange rate (Rs 42.50, Rs 47.50) ANOVA includ-ing perceptions of price and whether or not the respondents hadtraveled to India as covariates. This analysis revealed a maineffect of price perceptions (F(1, 117) = 7.57, p < .05, η2 = .06), aswell as the expected conversion strategy used by dollar providedinteraction (F(1, 117) = 4.75, p < .05, η2 = .04). When respon-dents round up, their intentions are directionally lower when the
Author's personal copy
P. Raghubir et al. / Journal of Retailing 88 (1, 2012) 7–19 15
US$ equivalent is provided (M = 2.94, SD = .32) than when it isnot (M = 3.44, SD = .22). Note that when respondents round up,then they are underestimating prices. Therefore, providing themwith a US$ equivalent should lead to a reduction in Rupee under-estimation as argued and demonstrated in Study 3, and lead todepressing purchase intentions. On the other hand, when respon-dents do not round up the reverse pattern is seen: intentions aredirectionally higher when the US$ rate is provided (M = 3.88,SD = .40) versus when it is not (M 3.38, SD = .33). This latterpattern reflects the Europoly effect of Studies 2 and 3 where themere presence of a lower nominal value equivalent price leads toan increase in intentions, presumably because respondents inap-propriately combine the two identical inputs to make a judgment.
Study 4 discussionTo summarize, we find that when respondents use a cognitive
shortcut like rounding to simplify the exchange rate conversionprocess, then when they round up, providing a lower nominalvalue (US$ equivalent for a price presented in Rupees), leads tolower intentions because they are using the original face valueto make their judgments rather than the nominal value of theUS$ equivalent. However, when they do not round up, thenthe mere presence of the US$ price equivalent can serve as analternate cue that is inappropriately combined with the Rupeeprice, leading to higher intentions. In this study, roundingstrategy was a measured variable as we wished to examinewhether people naturally round down or round up dependingon the actual value of the exchange rate. To more carefullyexamine the specific question of whether rounding strategiesaffect purchase intentions, we report the results of a short followup study where we manipulated the rounding strategy thatpeople used (as in Study 3). In this study we extend the enquirybeyond the lab to a more diverse online sample of US adults.
Study 5 participantsOne hundred and forty-eight respondents, with character-
istics very similar on many dimensions to the student poolused in Study 4, participated in this study for a small mone-tary reimbursement (Males = 69, Females = 79). They reportedconfidence in their math skills (M = 5.10, SD = 1.55), whichthey believed to be strong (M = 4.94, SD = 1.70), rated the taskas realistic (M = 5.95, SD = 1.53), and were motivated to com-plete the study task (M = 5.82, SD = 1.19). While they had lowfamiliarity with India (M = 2.16, SD = 1.61) and had not traveled there much (M = 1.36, SD = 1.26), they had traveled over-seas slightly more (M = 2.21, SD = 1.75; 57 percent reported a 1and were categorized as “No experience” and compared to theremaining 43 percent who indicated some international travelexperience).
Study 5 designBecause the goal of this short follow up study was simply to
verify that rounding strategies influence purchase intentions, weused a simple 2 (traveler tip: round down to Rs 40 or round upto Rs 50) between subjects design. The exchange rate providedwas Rs 45 = $1 and we provided the US$ equivalent in bothconditions. We used the same procedure (travel to India) as in
Study 4. Traveler tips were manipulated as in Study 3, exceptpeople were advised either to round down to 40 or to round upto 50 (and adjust as necessary).
Study 5 resultsConversion strategies by condition show that the manipula-
tion was successful. In the “traveler tip 40” condition, 50/76 (66percent), rounded down to 40 (6 rounded up, 15 calculated therate, and 5 used an other strategy), whereas in the “traveler tip50” condition 53/72 respondents reported rounding up to 50 (74percent, with 9 calculating the exact amount, 2 rounding down,and 8 using other strategies).
The three intention items for supplementary drinks loaded onto a single factor that was distinct from the likelihood of goingto the restaurant, and were averaged to form a drinks intentionsindex that showed a high level of reliability (α = .73). Whiletraveler tip did not exert an effect on the intentions of goingto the restaurant, it affected the drinks intentions index (F(1,144) = 6.84, p < .01, η2 = .05), such that intentions were higherwhen people were given the tip to round up to 50 (M = 3.06,SD = 1.62), versus when they were given the tip to round downto 40 (M = 2.41, SD = 1.37).
Thus, manipulating (vs. measuring) the currency conversionstrategy shows that the results of rounding are robust, and thatwhen people round, they do not adjust sufficiently for the actualexchange rate. Incorporating whether or not a person was aninternational traveler did not change the effects. Incorporat-ing other variables such as familiarity with India, frequencyof travel to India, as well as overseas travel frequency alsodid not affect the results. Thus it appears that these biases donot necessarily go away with experience. The next and finalstudy examines whether we observe a pattern of data consis-tent with the Europoly effect when we examine macroeconomicindicators, specifically tourism revenues.
Study 6: an analysis of macroeconomic tourist expenditures
If the money illusion translates to the domain of the Euro, thiswould predict that prices provided in Euros will be perceived tobe cheaper than prices provided in the former local currenciesin eleven of the twelve Euro countries for which the face valueof prices are smaller in Euros (except for Ireland). These lowerprice perceptions in turn would lead to higher spending levels.To test whether we observe this pattern, we examined sixteenyears of data from 1993 to 2008 on tourist spending for ten ofthe twelve countries that adopted the Euro (Belgium, Germany,Greece, Spain, France, Italy, the Netherlands, Austria, Portugaland Finland, excluding Ireland for which the exchange rate wasin the opposite direction and Luxembourg for which data werenot available) and compared this with the tourist spending insix countries that did not adopt the Euro (Denmark, Iceland,Norway, Sweden, Switzerland and the United Kingdom). Weexpect that continental European countries that adopted the Euro(i.e., all Euro countries except for Ireland) would have a highertourist spending as compared to countries that did not adopt theEuro, post the introduction of the Euro in 2002.
Author's personal copy
16 P. Raghubir et al. / Journal of Retailing 88 (1, 2012) 7–19
Data
Data of various economic indicators for the ten countrieswe examined that adopted the Euro and the six that did notwere collected from the United Nations Statistics Division-Common Database (http://unstats.un.org/unsd/cdb/) website.Various estimates and measurement methods for the dataexist depending on the source. Tourist data from 1993 to2008 were collected from the Global Market InformationDatabase (http://www.euromonitor.com/gmid/). The key vari-able was tourist receipts. These numbers are provided by theWorld Tourism Organization and are at current prices. Tourismreceipts are defined as expenditure of international inboundvisitors including their payments to national carriers for interna-tional transport. They include any other prepayments made forgoods/services received in the destination country and, shouldalso include receipts from same-day visitors, except in caseswhen these are so important as to justify a separate classi-fication. Data on other variables that could affect the extentof tourist spending independent of exchange rates were alsocollected. These included the number of international touristarrivals (tourist visitors who stay at least one night in a collec-tive or private accommodation in the country visited. Same dayvisitors are not included), Gross domestic product (GDP; derivedfrom the value added by industries at current US$ prices), annualunemployment rate from 1993 to 2006 (calculated from the reg-istered unemployment base on the employment office records),annual consumer price indices from 1993 to 2006 (InternationalMonetary Fund, 2000 = 100), and annual population from 1993to 2005 (official mid-year estimates). Since gross domestic prod-uct and annual population were highly correlated (r = .96), wedid not include annual population in the model to avoid problemswith multi-collinearity.
Results
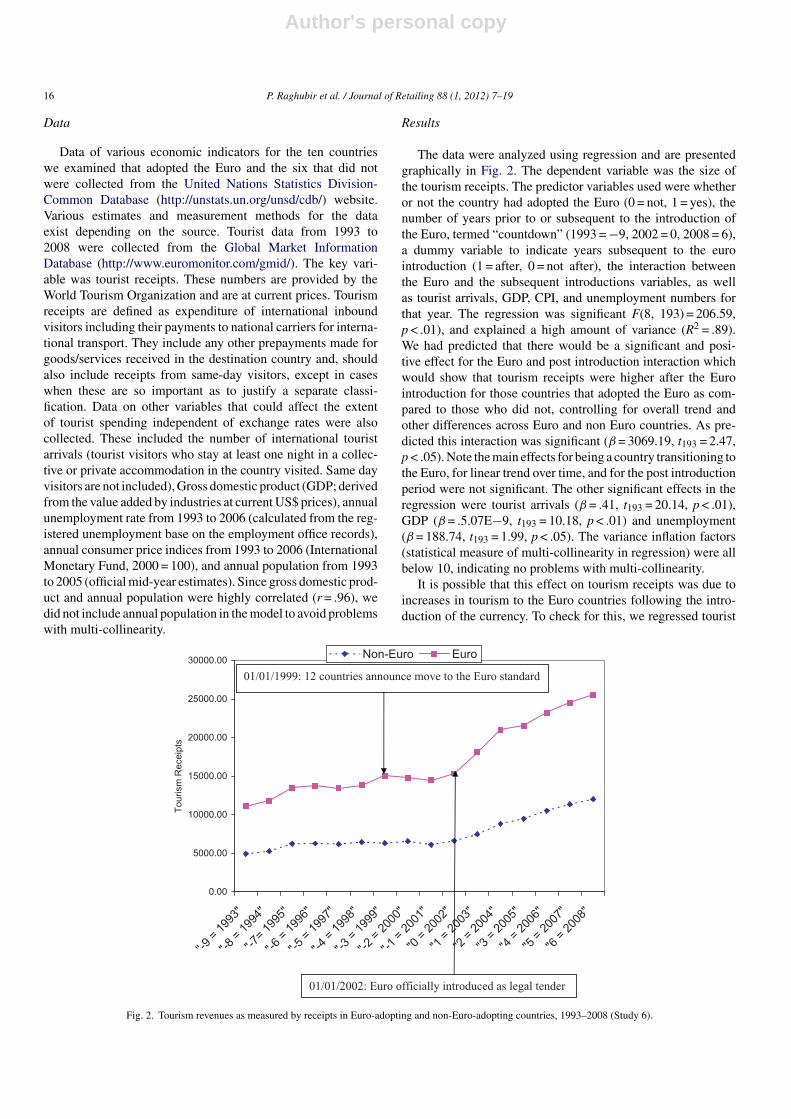
The data were analyzed using regression and are presentedgraphically in Fig. 2. The dependent variable was the size ofthe tourism receipts. The predictor variables used were whetheror not the country had adopted the Euro (0 = not, 1 = yes), thenumber of years prior to or subsequent to the introduction ofthe Euro, termed “countdown” (1993 = −9, 2002 = 0, 2008 = 6),a dummy variable to indicate years subsequent to the eurointroduction (1 = after, 0 = not after), the interaction betweenthe Euro and the subsequent introductions variables, as wellas tourist arrivals, GDP, CPI, and unemployment numbers forthat year. The regression was significant F(8, 193) = 206.59,p < .01), and explained a high amount of variance (R2 = .89).We had predicted that there would be a significant and posi-tive effect for the Euro and post introduction interaction whichwould show that tourism receipts were higher after the Eurointroduction for those countries that adopted the Euro as com-pared to those who did not, controlling for overall trend andother differences across Euro and non Euro countries. As pre-dicted this interaction was significant (β = 3069.19, t193 = 2.47,p < .05). Note the main effects for being a country transitioning tothe Euro, for linear trend over time, and for the post introductionperiod were not significant. The other significant effects in theregression were tourist arrivals (β = .41, t193 = 20.14, p < .01),GDP (β = .5.07E−9, t193 = 10.18, p < .01) and unemployment(β = 188.74, t193 = 1.99, p < .05). The variance inflation factors(statistical measure of multi-collinearity in regression) were allbelow 10, indicating no problems with multi-collinearity.
It is possible that this effect on tourism receipts was due toincreases in tourism to the Euro countries following the intro-duction of the currency. To check for this, we regressed tourist
0.00
5000.00
10000.00
15000.00
20000.00
25000.00
30000.00
"-9 =
1993
"
"-8 =
1994
"
"-7= 19
95"
"-6 =
1996
"
"-5= 19
97"
"-4 =
1998
"
"-3= 19
99"
"-2 =
2000
"
"-1= 20
01"
"0 = 2
002"
"1 = 2
003"
"2 = 2
004"
"3 = 2
005"
"4 = 2
006"
"5 = 2
007"
"6= 20
08"
Tour
ism
Rec
eipt
s
Non-Euro Euro
01/01/1999: 12 countries announce move to the Euro standard
01/01/2002: Euro officially introduced as legal tender
Fig. 2. Tourism revenues as measured by receipts in Euro-adopting and non-Euro-adopting countries, 1993–2008 (Study 6).

Author's personal copy
P. Raghubir et al. / Journal of Retailing 88 (1, 2012) 7–19 17
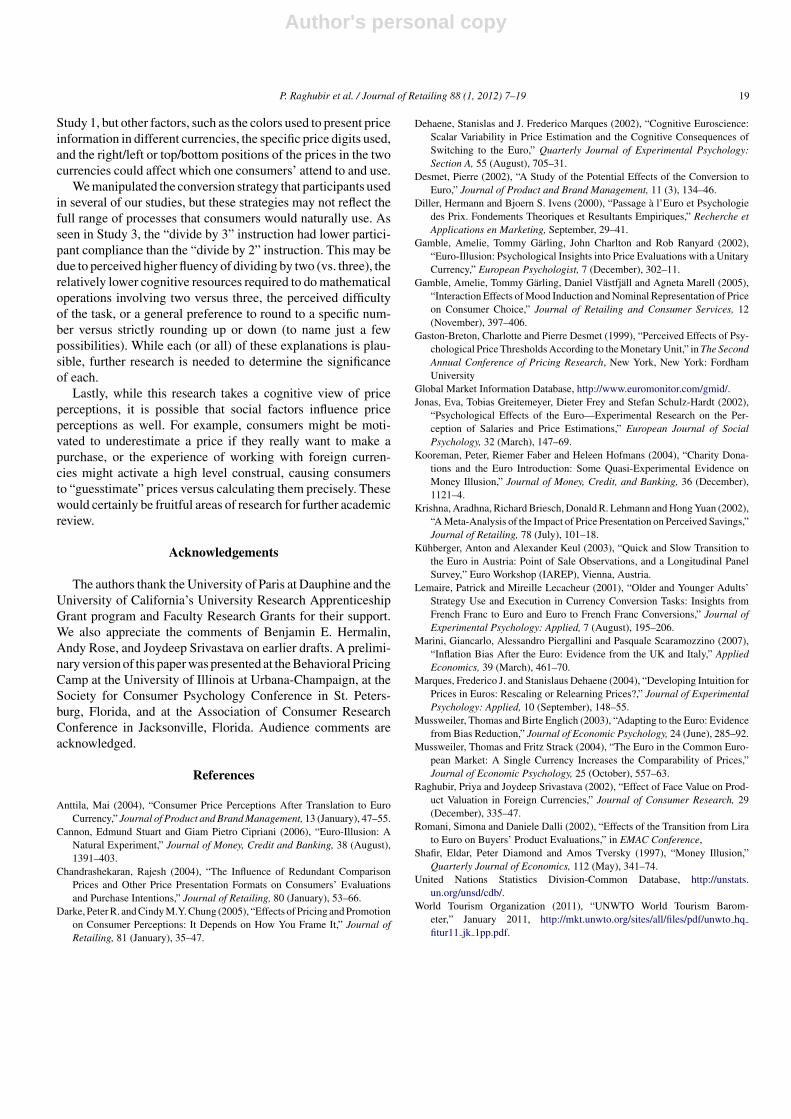
Process Model of How Numerical Inputs are combined to make Biased or Unbiased JudgmentsHow many numeric inputs are available?
One
Anchor on Input
Is the information in the anchor perceivedto be sufficient to make a decision?
Yes
No
Adjust Anchor inadequately:Biased Judgment; Face Value effect, Money Illusion
Are alternate numeric inputsavailable to be used?
Yes
No
>1
Are inputs differentially easy to use?
Yes,
one
inpu
tIs
mor
e fa
mili
ar
(Stu
dies
3-5
)
No
Combine inputs
Yes,
one
inpu
tIs
eas
ier t
o co
nver
tIn
to m
ost f
amili
arIn
put (
Stud
ies
4-5)
Yes,
one
inpu
tIs
mor
e sa
lient
(S
tudy
2)
Should alternate numeric inputs have been used?
No
Yes
Use Anchor:Unbiased Judgment
Use inappropriate anchor:Biased judgment; Study 1
Is the anchor sufficient?
Is the anchor appropriate?
Yes
No
NoYes
Were they used adequately?
Yes No
Adjust Anchor adequately:Unbiased Judgment
Adjust Anchor unnecessarily:Biased judgment; “EuropolyEffect”; Studies 2-5
Yes
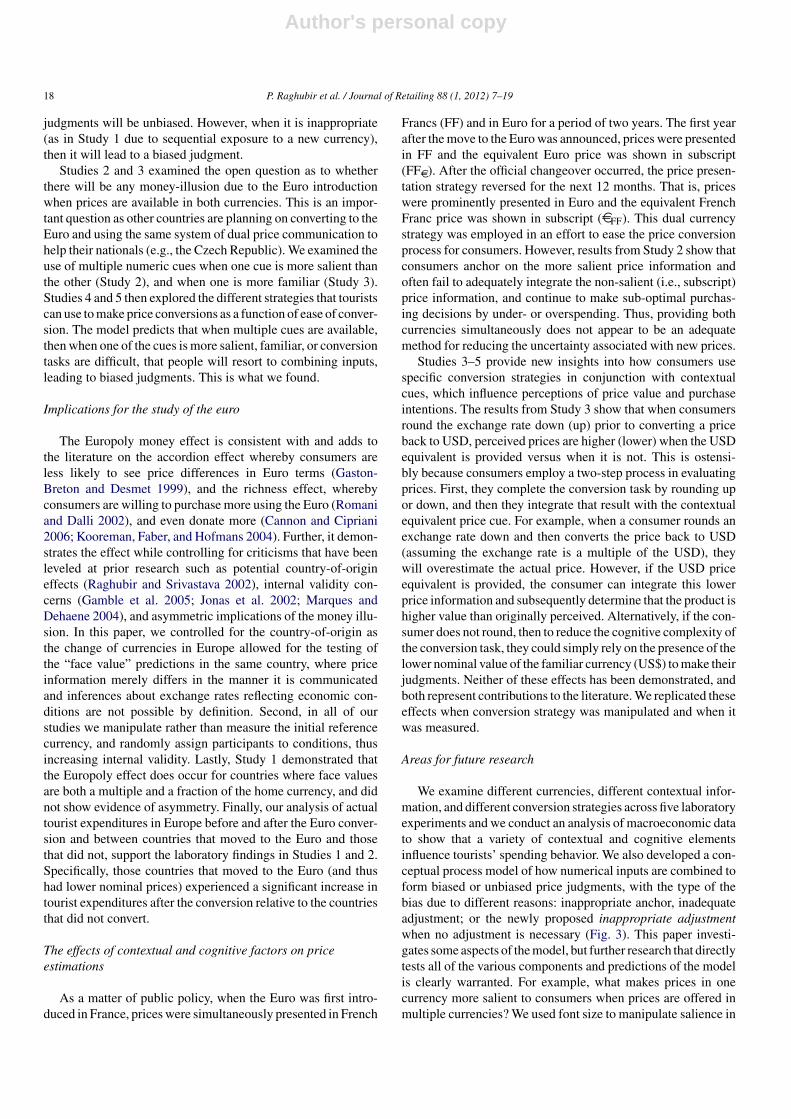
Fig. 3. Conceptual model of how prices are combined under different scenarios.
arrivals on whether or not the country had adopted the Euro(0 = not, 1 = yes), the number of years prior to or subsequentto the introduction of the Euro, a dummy variable to indi-cate years subsequent to the Euro introduction (1 = after, 0 = notafter), the interaction between the Euro and the subsequent intro-ductions variables, and GDP, CPI, and unemployment numbersfor that year. The regression was significant F(7, 194) = 28.48,p < .01), and the factors in the model explained about half ofthe variation in tourist arrivals (R2 = .51). There were no signif-icant main effects for being a country transitioning to the Euro,for linear trend over time, or for the post introduction period.Importantly, there was also no significant interaction for beinga country transitioning to the Euro and the post introductionperiod dummy. The only significant effects in the regressionwere GDP (β = 1.18E−8, t194 = 7.71, p < .01) and unemploy-ment (β = 1716.14, t194 = 5.52, p < .01). Since the key interactionterm was not significant, we can rule out that the observed effecton tourist spending was only due to tourist arrivals post the Eurointroduction.
General discussion
The primary objective of this paper was to examine howtourists convert foreign currencies to make spending decisions.We also test the “Europoly money” effect that predicts anincrease in spending in continental Europe after the initial Euro
conversion due to lower nominal prices in Euros as compared toprevious currencies. Results from five laboratory experimentsdemonstrate that a variety of contextual and cognitive factorsinfluence the perceived magnitude of foreign prices—and hencetourist spending decisions. These factors include the availabilityand relative nominal value of equivalent home prices (Studies 1and 2), the proximity and salience between foreign prices andequivalent home prices (Studies 1 and 2), when conversion tasksare difficult (Studies 4 and 5), and the specific strategy usedto convert a foreign price to the home currency (Studies 3–5).Finally, we demonstrate the external validity of the Europolyeffect through an analysis of macroeconomic tourist expen-ditures before and after the initial euro conversion in Europe(between 1993 and 2008). Taken together, our findings replicateand extend prior research on the introduction of the Euro, andalso add a deeper understanding of how tourists process foreigncurrencies to make spending decisions, and identified biases theyare prone to in tourist shopping situations.
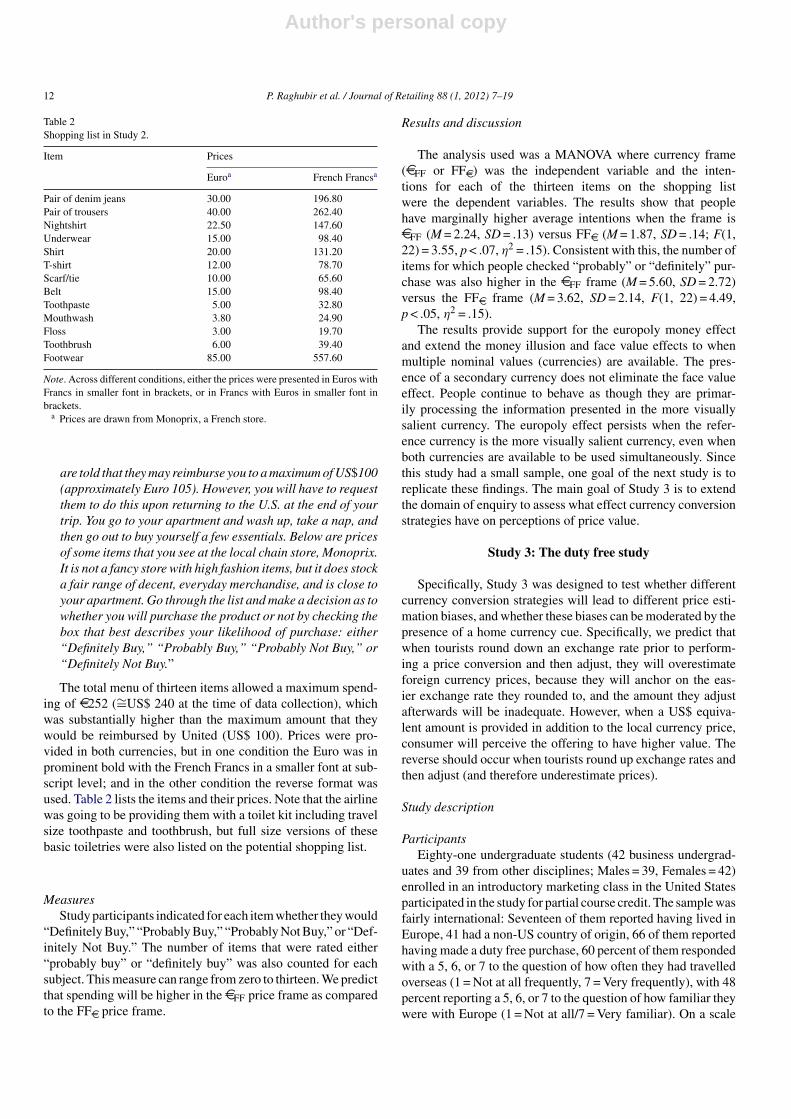
Fig. 3 presents a conceptual framework that can tie togetherthe results of the different studies and more broadly explainhow people process multiple numeric inputs. We propose inthis framework that the type of price estimation strategy is afunction of the number of alternate price inputs that are availableto consumers. When there is only one (e.g., Study 1), then peoplewill likely anchor on that price and use it to estimate price. Whenthe anchor is appropriate and sufficient to make a judgment, price
Author's personal copy
18 P. Raghubir et al. / Journal of Retailing 88 (1, 2012) 7–19
judgments will be unbiased. However, when it is inappropriate(as in Study 1 due to sequential exposure to a new currency),then it will lead to a biased judgment.
Studies 2 and 3 examined the open question as to whetherthere will be any money-illusion due to the Euro introductionwhen prices are available in both currencies. This is an impor-tant question as other countries are planning on converting to theEuro and using the same system of dual price communication tohelp their nationals (e.g., the Czech Republic). We examined theuse of multiple numeric cues when one cue is more salient thanthe other (Study 2), and when one is more familiar (Study 3).Studies 4 and 5 then explored the different strategies that touristscan use to make price conversions as a function of ease of conver-sion. The model predicts that when multiple cues are available,then when one of the cues is more salient, familiar, or conversiontasks are difficult, that people will resort to combining inputs,leading to biased judgments. This is what we found.
Implications for the study of the euro
The Europoly money effect is consistent with and adds tothe literature on the accordion effect whereby consumers areless likely to see price differences in Euro terms (Gaston-Breton and Desmet 1999), and the richness effect, wherebyconsumers are willing to purchase more using the Euro (Romaniand Dalli 2002), and even donate more (Cannon and Cipriani2006; Kooreman, Faber, and Hofmans 2004). Further, it demon-strates the effect while controlling for criticisms that have beenleveled at prior research such as potential country-of-origineffects (Raghubir and Srivastava 2002), internal validity con-cerns (Gamble et al. 2005; Jonas et al. 2002; Marques andDehaene 2004), and asymmetric implications of the money illu-sion. In this paper, we controlled for the country-of-origin asthe change of currencies in Europe allowed for the testing ofthe “face value” predictions in the same country, where priceinformation merely differs in the manner it is communicatedand inferences about exchange rates reflecting economic con-ditions are not possible by definition. Second, in all of ourstudies we manipulate rather than measure the initial referencecurrency, and randomly assign participants to conditions, thusincreasing internal validity. Lastly, Study 1 demonstrated thatthe Europoly effect does occur for countries where face valuesare both a multiple and a fraction of the home currency, and didnot show evidence of asymmetry. Finally, our analysis of actualtourist expenditures in Europe before and after the Euro conver-sion and between countries that moved to the Euro and thosethat did not, support the laboratory findings in Studies 1 and 2.Specifically, those countries that moved to the Euro (and thushad lower nominal prices) experienced a significant increase intourist expenditures after the conversion relative to the countriesthat did not convert.
The effects of contextual and cognitive factors on priceestimations
As a matter of public policy, when the Euro was first intro-duced in France, prices were simultaneously presented in French
Francs (FF) and in Euro for a period of two years. The first yearafter the move to the Euro was announced, prices were presentedin FF and the equivalent Euro price was shown in subscript(FFD). After the official changeover occurred, the price presen-tation strategy reversed for the next 12 months. That is, priceswere prominently presented in Euro and the equivalent FrenchFranc price was shown in subscript (DFF). This dual currencystrategy was employed in an effort to ease the price conversionprocess for consumers. However, results from Study 2 show thatconsumers anchor on the more salient price information andoften fail to adequately integrate the non-salient (i.e., subscript)price information, and continue to make sub-optimal purchas-ing decisions by under- or overspending. Thus, providing bothcurrencies simultaneously does not appear to be an adequatemethod for reducing the uncertainty associated with new prices.
Studies 3–5 provide new insights into how consumers usespecific conversion strategies in conjunction with contextualcues, which influence perceptions of price value and purchaseintentions. The results from Study 3 show that when consumersround the exchange rate down (up) prior to converting a priceback to USD, perceived prices are higher (lower) when the USDequivalent is provided versus when it is not. This is ostensi-bly because consumers employ a two-step process in evaluatingprices. First, they complete the conversion task by rounding upor down, and then they integrate that result with the contextualequivalent price cue. For example, when a consumer rounds anexchange rate down and then converts the price back to USD(assuming the exchange rate is a multiple of the USD), theywill overestimate the actual price. However, if the USD priceequivalent is provided, the consumer can integrate this lowerprice information and subsequently determine that the product ishigher value than originally perceived. Alternatively, if the con-sumer does not round, then to reduce the cognitive complexity ofthe conversion task, they could simply rely on the presence of thelower nominal value of the familiar currency (US$) to make theirjudgments. Neither of these effects has been demonstrated, andboth represent contributions to the literature. We replicated theseeffects when conversion strategy was manipulated and when itwas measured.
Areas for future research
We examine different currencies, different contextual infor-mation, and different conversion strategies across five laboratoryexperiments and we conduct an analysis of macroeconomic datato show that a variety of contextual and cognitive elementsinfluence tourists’ spending behavior. We also developed a con-ceptual process model of how numerical inputs are combined toform biased or unbiased price judgments, with the type of thebias due to different reasons: inappropriate anchor, inadequateadjustment; or the newly proposed inappropriate adjustmentwhen no adjustment is necessary (Fig. 3). This paper investi-gates some aspects of the model, but further research that directlytests all of the various components and predictions of the modelis clearly warranted. For example, what makes prices in onecurrency more salient to consumers when prices are offered inmultiple currencies? We used font size to manipulate salience in
Author's personal copy
P. Raghubir et al. / Journal of Retailing 88 (1, 2012) 7–19 19
Study 1, but other factors, such as the colors used to present priceinformation in different currencies, the specific price digits used,and the right/left or top/bottom positions of the prices in the twocurrencies could affect which one consumers’ attend to and use.
We manipulated the conversion strategy that participants usedin several of our studies, but these strategies may not reflect thefull range of processes that consumers would naturally use. Asseen in Study 3, the “divide by 3” instruction had lower partici-pant compliance than the “divide by 2” instruction. This may bedue to perceived higher fluency of dividing by two (vs. three), therelatively lower cognitive resources required to do mathematicaloperations involving two versus three, the perceived difficultyof the task, or a general preference to round to a specific num-ber versus strictly rounding up or down (to name just a fewpossibilities). While each (or all) of these explanations is plau-sible, further research is needed to determine the significanceof each.
Lastly, while this research takes a cognitive view of priceperceptions, it is possible that social factors influence priceperceptions as well. For example, consumers might be moti-vated to underestimate a price if they really want to make apurchase, or the experience of working with foreign curren-cies might activate a high level construal, causing consumersto “guesstimate” prices versus calculating them precisely. Thesewould certainly be fruitful areas of research for further academicreview.
Acknowledgements
The authors thank the University of Paris at Dauphine and theUniversity of California’s University Research ApprenticeshipGrant program and Faculty Research Grants for their support.We also appreciate the comments of Benjamin E. Hermalin,Andy Rose, and Joydeep Srivastava on earlier drafts. A prelimi-nary version of this paper was presented at the Behavioral PricingCamp at the University of Illinois at Urbana-Champaign, at theSociety for Consumer Psychology Conference in St. Peters-burg, Florida, and at the Association of Consumer ResearchConference in Jacksonville, Florida. Audience comments areacknowledged.
References
Anttila, Mai (2004), “Consumer Price Perceptions After Translation to EuroCurrency,” Journal of Product and Brand Management, 13 (January), 47–55.
Cannon, Edmund Stuart and Giam Pietro Cipriani (2006), “Euro-Illusion: ANatural Experiment,” Journal of Money, Credit and Banking, 38 (August),1391–403.
Chandrashekaran, Rajesh (2004), “The Influence of Redundant ComparisonPrices and Other Price Presentation Formats on Consumers’ Evaluationsand Purchase Intentions,” Journal of Retailing, 80 (January), 53–66.
Darke, Peter R. and Cindy M.Y. Chung (2005), “Effects of Pricing and Promotionon Consumer Perceptions: It Depends on How You Frame It,” Journal ofRetailing, 81 (January), 35–47.
Dehaene, Stanislas and J. Frederico Marques (2002), “Cognitive Euroscience:Scalar Variability in Price Estimation and the Cognitive Consequences ofSwitching to the Euro,” Quarterly Journal of Experimental Psychology:Section A, 55 (August), 705–31.
Desmet, Pierre (2002), “A Study of the Potential Effects of the Conversion toEuro,” Journal of Product and Brand Management, 11 (3), 134–46.
Diller, Hermann and Bjoern S. Ivens (2000), “Passage à l’Euro et Psychologiedes Prix. Fondements Theoriques et Resultants Empiriques,” Recherche etApplications en Marketing, September, 29–41.
Gamble, Amelie, Tommy Gärling, John Charlton and Rob Ranyard (2002),“Euro-Illusion: Psychological Insights into Price Evaluations with a UnitaryCurrency,” European Psychologist, 7 (December), 302–11.
Gamble, Amelie, Tommy Gärling, Daniel Västfjäll and Agneta Marell (2005),“Interaction Effects of Mood Induction and Nominal Representation of Priceon Consumer Choice,” Journal of Retailing and Consumer Services, 12(November), 397–406.
Gaston-Breton, Charlotte and Pierre Desmet (1999), “Perceived Effects of Psy-chological Price Thresholds According to the Monetary Unit,” in The SecondAnnual Conference of Pricing Research, New York, New York: FordhamUniversity
Global Market Information Database, http://www.euromonitor.com/gmid/.Jonas, Eva, Tobias Greitemeyer, Dieter Frey and Stefan Schulz-Hardt (2002),
“Psychological Effects of the Euro—Experimental Research on the Per-ception of Salaries and Price Estimations,” European Journal of SocialPsychology, 32 (March), 147–69.
Kooreman, Peter, Riemer Faber and Heleen Hofmans (2004), “Charity Dona-tions and the Euro Introduction: Some Quasi-Experimental Evidence onMoney Illusion,” Journal of Money, Credit, and Banking, 36 (December),1121–4.
Krishna, Aradhna, Richard Briesch, Donald R. Lehmann and Hong Yuan (2002),“A Meta-Analysis of the Impact of Price Presentation on Perceived Savings,”Journal of Retailing, 78 (July), 101–18.
Kühberger, Anton and Alexander Keul (2003), “Quick and Slow Transition tothe Euro in Austria: Point of Sale Observations, and a Longitudinal PanelSurvey,” Euro Workshop (IAREP), Vienna, Austria.
Lemaire, Patrick and Mireille Lecacheur (2001), “Older and Younger Adults’Strategy Use and Execution in Currency Conversion Tasks: Insights fromFrench Franc to Euro and Euro to French Franc Conversions,” Journal ofExperimental Psychology: Applied, 7 (August), 195–206.
Marini, Giancarlo, Alessandro Piergallini and Pasquale Scaramozzino (2007),“Inflation Bias After the Euro: Evidence from the UK and Italy,” AppliedEconomics, 39 (March), 461–70.
Marques, Frederico J. and Stanislaus Dehaene (2004), “Developing Intuition forPrices in Euros: Rescaling or Relearning Prices?,” Journal of ExperimentalPsychology: Applied, 10 (September), 148–55.
Mussweiler, Thomas and Birte Englich (2003), “Adapting to the Euro: Evidencefrom Bias Reduction,” Journal of Economic Psychology, 24 (June), 285–92.
Mussweiler, Thomas and Fritz Strack (2004), “The Euro in the Common Euro-pean Market: A Single Currency Increases the Comparability of Prices,”Journal of Economic Psychology, 25 (October), 557–63.
Raghubir, Priya and Joydeep Srivastava (2002), “Effect of Face Value on Prod-uct Valuation in Foreign Currencies,” Journal of Consumer Research, 29(December), 335–47.
Romani, Simona and Daniele Dalli (2002), “Effects of the Transition from Lirato Euro on Buyers’ Product Evaluations,” in EMAC Conference,
Shafir, Eldar, Peter Diamond and Amos Tversky (1997), “Money Illusion,”Quarterly Journal of Economics, 112 (May), 341–74.
United Nations Statistics Division-Common Database, http://unstats.un.org/unsd/cdb/.
World Tourism Organization (2011), “UNWTO World Tourism Barom-eter,” January 2011, http://mkt.unwto.org/sites/all/files/pdf/unwto hqfitur11 jk 1pp.pdf.
Related Documents