SPECIAL ISSUE Europe’s longest-operating on-shore CO 2 storage site at Ketzin, Germany: a progress report after three years of injection S. Martens • T. Kempka • A. Liebscher • S. Lu ¨th • F. Mo ¨ller • A. Myrttinen • B. Norden • C. Schmidt-Hattenberger • M. Zimmer • M. Ku ¨hn • The Ketzin Group Received: 30 November 2011 / Accepted: 2 April 2012 Ó The Author(s) 2012. This article is published with open access at Springerlink.com Abstract The Ketzin pilot site, led by the GFZ German Research Centre for Geosciences, is Europe’s longest- operating on-shore CO 2 storage site with the aim of increasing the understanding of geological storage of CO 2 in saline aquifers. Located near Berlin, the Ketzin pilot site is an in situ laboratory for CO 2 storage in an anticlinal structure in the Northeast German Basin. Starting research within the framework of the EU project CO 2 SINK in 2004, Ketzin is Germany’s first CO 2 storage site and fully in use since the injection began in June 2008. After 39 months of operation, about 53,000 tonnes of CO 2 have been stored in 630–650 m deep sandstone units of the Upper Triassic Stuttgart Formation. An extensive monitoring program integrates geological, geophysical and geochemical inves- tigations at Ketzin for a comprehensive characterization of the reservoir and the CO 2 migration at various scales. Integrating a unique field and laboratory data set, both static geological modeling and dynamic simulations are regularly updated. The Ketzin project successfully dem- onstrates CO 2 storage in a saline aquifer on a research scale. The results of monitoring and modeling can be summarized as follows: (1) Since the start of the CO 2 injection in June 2008, the operation has been running reliably and safely. (2) Downhole pressure data prove correlation between the injection rate and the reservoir pressure and indicates the presence of an overall dynamic equilibrium within the reservoir. (3) The extensive geo- chemical and geophysical monitoring program is capable of detecting CO 2 on different scales and gives no indication for any leakage. (4) Numerical simulations (history matching) are in good agreement with the monitoring results. Keywords Ketzin Carbon dioxide storage Saline aquifer CO 2 injection Monitoring Modeling Introduction The research activities at the pilot site Ketzin have received funding from 15 German and European projects so far. The major ones are CO 2 Storage by Injection into a Natural Saline Aquifer at Ketzin (CO 2 SINK) (2004–2010) and CO 2 Reservoir Management (CO 2 MAN) (2010–2013). The Ketzin activities began in 2004 with research and development on CO 2 storage in a saline aquifer within the project CO 2 SINK, funded by the European Commission. CO 2 SINK with its consortium of 18 partners from research institutes, universities and industry from nine European countries continued to March 2010. Together with further nationally funded projects, CO 2 SINK covered the prepa- ratory work prior to the CO 2 injection, baseline surveys and characterization (Fo ¨rster et al. 2006), drilling and instru- mentation of three wells (Prevedel et al. 2009), set-up of the injection facility and a multidisciplinary monitoring concept (Giese et al. 2009). The CO 2 injection finally began within the framework of the CO 2 SINK project on June 30, 2008. S. Martens (&) T. Kempka A. Liebscher S. Lu ¨th F. Mo ¨ller B. Norden C. Schmidt-Hattenberger M. Zimmer M. Ku ¨hn GFZ German Research Centre for Geosciences, Telegrafenberg, 14473 Potsdam, Germany e-mail: [email protected] A. Myrttinen GeoZentrum Nordbayern, Friedrich-Alexander-University Erlangen-Nu ¨rnberg, Schlossgarten 5, 91054 Erlangen, Germany 123 Environ Earth Sci DOI 10.1007/s12665-012-1672-5

Welcome message from author
This document is posted to help you gain knowledge. Please leave a comment to let me know what you think about it! Share it to your friends and learn new things together.
Transcript

SPECIAL ISSUE
Europe’s longest-operating on-shore CO2 storage site at Ketzin,Germany: a progress report after three years of injection
S. Martens • T. Kempka • A. Liebscher • S. Luth •
F. Moller • A. Myrttinen • B. Norden • C. Schmidt-Hattenberger •
M. Zimmer • M. Kuhn • The Ketzin Group
Received: 30 November 2011 / Accepted: 2 April 2012
� The Author(s) 2012. This article is published with open access at Springerlink.com
Abstract The Ketzin pilot site, led by the GFZ German
Research Centre for Geosciences, is Europe’s longest-
operating on-shore CO2 storage site with the aim of
increasing the understanding of geological storage of CO2
in saline aquifers. Located near Berlin, the Ketzin pilot site
is an in situ laboratory for CO2 storage in an anticlinal
structure in the Northeast German Basin. Starting research
within the framework of the EU project CO2SINK in 2004,
Ketzin is Germany’s first CO2 storage site and fully in use
since the injection began in June 2008. After 39 months of
operation, about 53,000 tonnes of CO2 have been stored in
630–650 m deep sandstone units of the Upper Triassic
Stuttgart Formation. An extensive monitoring program
integrates geological, geophysical and geochemical inves-
tigations at Ketzin for a comprehensive characterization of
the reservoir and the CO2 migration at various scales.
Integrating a unique field and laboratory data set, both
static geological modeling and dynamic simulations are
regularly updated. The Ketzin project successfully dem-
onstrates CO2 storage in a saline aquifer on a research
scale. The results of monitoring and modeling can be
summarized as follows: (1) Since the start of the CO2
injection in June 2008, the operation has been running
reliably and safely. (2) Downhole pressure data prove
correlation between the injection rate and the reservoir
pressure and indicates the presence of an overall dynamic
equilibrium within the reservoir. (3) The extensive geo-
chemical and geophysical monitoring program is capable
of detecting CO2 on different scales and gives no indication
for any leakage. (4) Numerical simulations (history
matching) are in good agreement with the monitoring
results.
Keywords Ketzin � Carbon dioxide storage �Saline aquifer � CO2 injection � Monitoring �Modeling
Introduction
The research activities at the pilot site Ketzin have received
funding from 15 German and European projects so far. The
major ones are CO2 Storage by Injection into a Natural
Saline Aquifer at Ketzin (CO2SINK) (2004–2010) and
CO2 Reservoir Management (CO2MAN) (2010–2013).
The Ketzin activities began in 2004 with research and
development on CO2 storage in a saline aquifer within the
project CO2SINK, funded by the European Commission.
CO2SINK with its consortium of 18 partners from research
institutes, universities and industry from nine European
countries continued to March 2010. Together with further
nationally funded projects, CO2SINK covered the prepa-
ratory work prior to the CO2 injection, baseline surveys and
characterization (Forster et al. 2006), drilling and instru-
mentation of three wells (Prevedel et al. 2009), set-up of
the injection facility and a multidisciplinary monitoring
concept (Giese et al. 2009). The CO2 injection finally
began within the framework of the CO2SINK project on
June 30, 2008.
S. Martens (&) � T. Kempka � A. Liebscher � S. Luth �F. Moller � B. Norden � C. Schmidt-Hattenberger �M. Zimmer � M. Kuhn
GFZ German Research Centre for Geosciences,
Telegrafenberg, 14473 Potsdam, Germany
e-mail: [email protected]
A. Myrttinen
GeoZentrum Nordbayern, Friedrich-Alexander-University
Erlangen-Nurnberg, Schlossgarten 5, 91054 Erlangen, Germany
123
Environ Earth Sci
DOI 10.1007/s12665-012-1672-5
Following CO2SINK, recent research and development
activities such as further CO2 injection and well con-
struction, complementary monitoring, laboratory studies,
modeling and public outreach are funded by the national
project CO2MAN. CO2MAN is coordinated by the GFZ
German Research Centre for Geosciences and comprises a
consortium of 13 partners. Research activities are com-
plemented by the European project CO2CARE (CO2 Site
Closure Assessment Research) with 23 global partners
(2011–2013). Within CO2CARE, Ketzin is one site in a
portfolio of nine storage sites worldwide (e.g. Sleipner/
Norway, Otway/Australia), most of them in operation for
years now, with some of them close to or within the
abandonment phase.
Preparatory work prior to the CO2 injection at the Ketzin
pilot site was described by Schilling et al. (2009). Forster
et al. (2006) summarize the first results of the baseline
measurements, including geology, seismic, reservoir
modeling, laboratory experiments on rock samples, and
geochemical monitoring. Key results and experiences from
the first and second year of operation were described by
Wurdemann et al. (2010) and Martens et al. (2011),
respectively. The present paper summarizes the progress
after three years of injection.
Site setting and injection operation
Geographical and geological setting
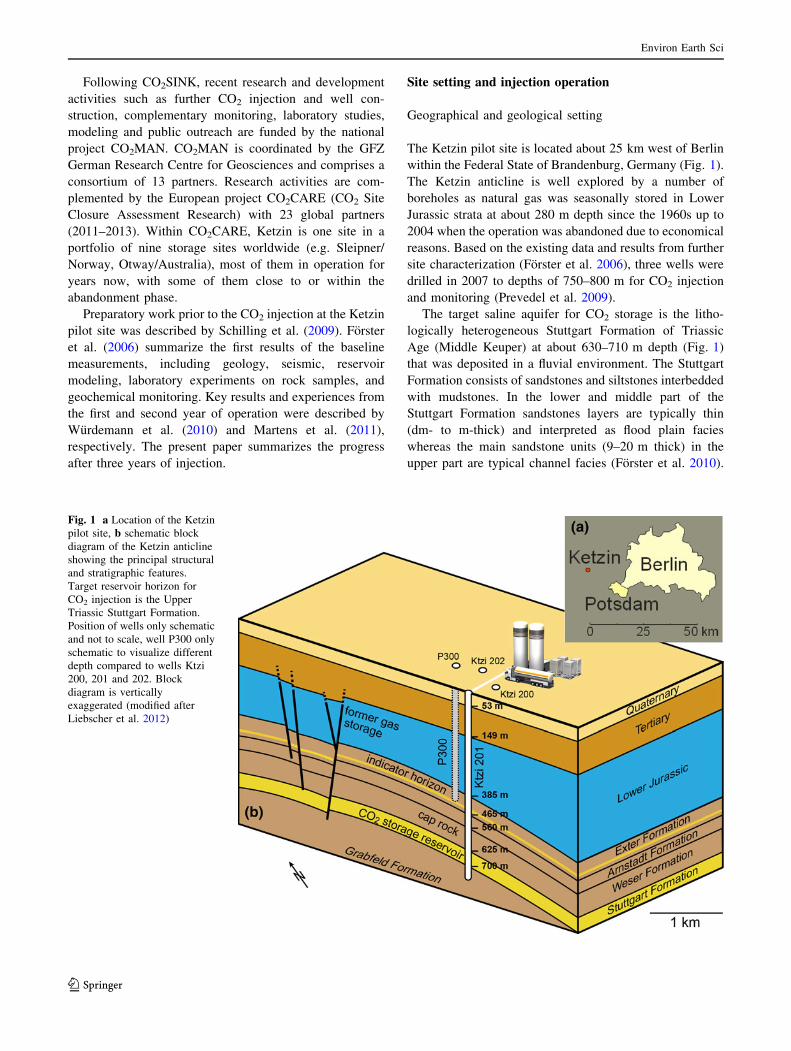
The Ketzin pilot site is located about 25 km west of Berlin
within the Federal State of Brandenburg, Germany (Fig. 1).
The Ketzin anticline is well explored by a number of
boreholes as natural gas was seasonally stored in Lower
Jurassic strata at about 280 m depth since the 1960s up to
2004 when the operation was abandoned due to economical
reasons. Based on the existing data and results from further
site characterization (Forster et al. 2006), three wells were
drilled in 2007 to depths of 750–800 m for CO2 injection
and monitoring (Prevedel et al. 2009).
The target saline aquifer for CO2 storage is the litho-
logically heterogeneous Stuttgart Formation of Triassic
Age (Middle Keuper) at about 630–710 m depth (Fig. 1)
that was deposited in a fluvial environment. The Stuttgart
Formation consists of sandstones and siltstones interbedded
with mudstones. In the lower and middle part of the
Stuttgart Formation sandstones layers are typically thin
(dm- to m-thick) and interpreted as flood plain facies
whereas the main sandstone units (9–20 m thick) in the
upper part are typical channel facies (Forster et al. 2010).
Fig. 1 a Location of the Ketzin
pilot site, b schematic block
diagram of the Ketzin anticline
showing the principal structural
and stratigraphic features.
Target reservoir horizon for
CO2 injection is the Upper
Triassic Stuttgart Formation.
Position of wells only schematic
and not to scale, well P300 only
schematic to visualize different
depth compared to wells Ktzi
200, 201 and 202. Block
diagram is vertically
exaggerated (modified after
Liebscher et al. 2012)
Environ Earth Sci
123
These channel facies sandstones in about 630–650 m depth
are the primary target reservoir for CO2 storage at the
Ketzin pilot site. The overlying first caprock is represented
by mudstones and anhydrites of the Weser and Arnstadt
Formations with a cumulative thickness of about 165 m.
The overburden of this system comprises sedimentary
rocks of the Exter Formation (Keuper) and Jurassic strata
overlain by Tertiary and Quaternary deposits (Fig. 1).
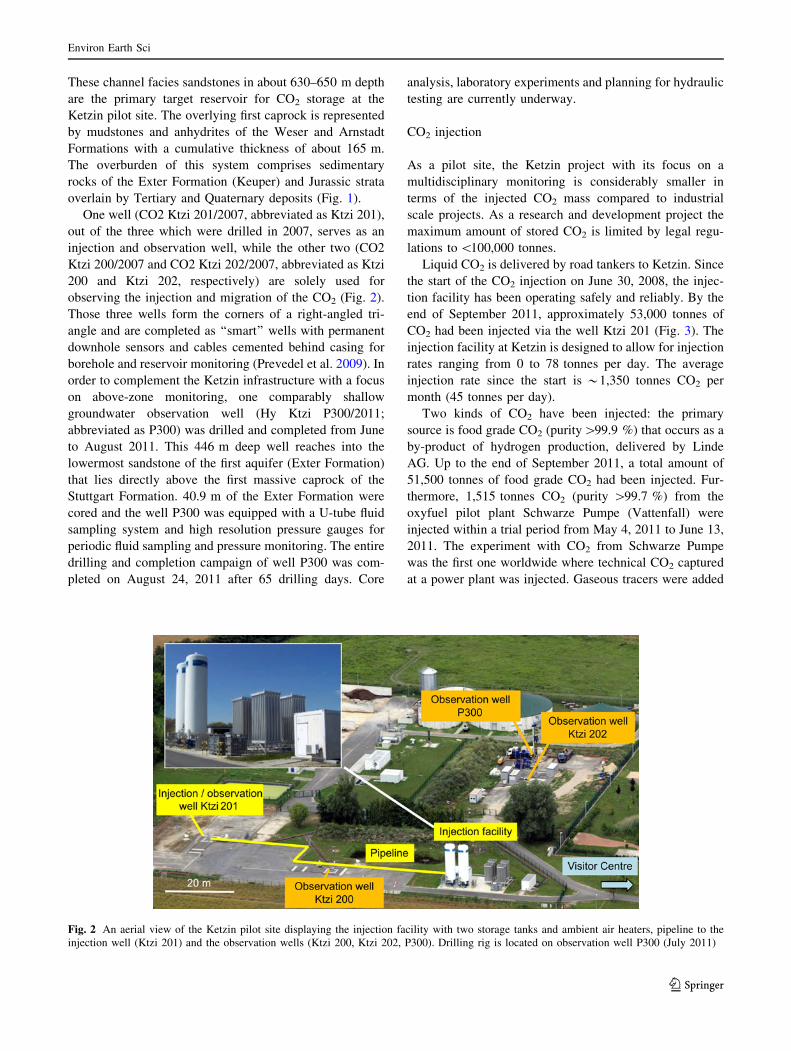
One well (CO2 Ktzi 201/2007, abbreviated as Ktzi 201),
out of the three which were drilled in 2007, serves as an
injection and observation well, while the other two (CO2
Ktzi 200/2007 and CO2 Ktzi 202/2007, abbreviated as Ktzi
200 and Ktzi 202, respectively) are solely used for
observing the injection and migration of the CO2 (Fig. 2).
Those three wells form the corners of a right-angled tri-
angle and are completed as ‘‘smart’’ wells with permanent
downhole sensors and cables cemented behind casing for
borehole and reservoir monitoring (Prevedel et al. 2009). In
order to complement the Ketzin infrastructure with a focus
on above-zone monitoring, one comparably shallow
groundwater observation well (Hy Ktzi P300/2011;
abbreviated as P300) was drilled and completed from June
to August 2011. This 446 m deep well reaches into the
lowermost sandstone of the first aquifer (Exter Formation)
that lies directly above the first massive caprock of the
Stuttgart Formation. 40.9 m of the Exter Formation were
cored and the well P300 was equipped with a U-tube fluid
sampling system and high resolution pressure gauges for
periodic fluid sampling and pressure monitoring. The entire
drilling and completion campaign of well P300 was com-
pleted on August 24, 2011 after 65 drilling days. Core
analysis, laboratory experiments and planning for hydraulic
testing are currently underway.
CO2 injection
As a pilot site, the Ketzin project with its focus on a
multidisciplinary monitoring is considerably smaller in
terms of the injected CO2 mass compared to industrial
scale projects. As a research and development project the
maximum amount of stored CO2 is limited by legal regu-
lations to \100,000 tonnes.
Liquid CO2 is delivered by road tankers to Ketzin. Since
the start of the CO2 injection on June 30, 2008, the injec-
tion facility has been operating safely and reliably. By the
end of September 2011, approximately 53,000 tonnes of
CO2 had been injected via the well Ktzi 201 (Fig. 3). The
injection facility at Ketzin is designed to allow for injection
rates ranging from 0 to 78 tonnes per day. The average
injection rate since the start is *1,350 tonnes CO2 per
month (45 tonnes per day).
Two kinds of CO2 have been injected: the primary
source is food grade CO2 (purity[99.9 %) that occurs as a
by-product of hydrogen production, delivered by Linde
AG. Up to the end of September 2011, a total amount of
51,500 tonnes of food grade CO2 had been injected. Fur-
thermore, 1,515 tonnes CO2 (purity [99.7 %) from the
oxyfuel pilot plant Schwarze Pumpe (Vattenfall) were
injected within a trial period from May 4, 2011 to June 13,
2011. The experiment with CO2 from Schwarze Pumpe
was the first one worldwide where technical CO2 captured
at a power plant was injected. Gaseous tracers were added
Fig. 2 An aerial view of the Ketzin pilot site displaying the injection facility with two storage tanks and ambient air heaters, pipeline to the
injection well (Ktzi 201) and the observation wells (Ktzi 200, Ktzi 202, P300). Drilling rig is located on observation well P300 (July 2011)
Environ Earth Sci
123
directly before and after the CO2 batch from Schwarze
Pumpe in order to better track CO2 migration (see
‘‘Borehole monitoring’’).
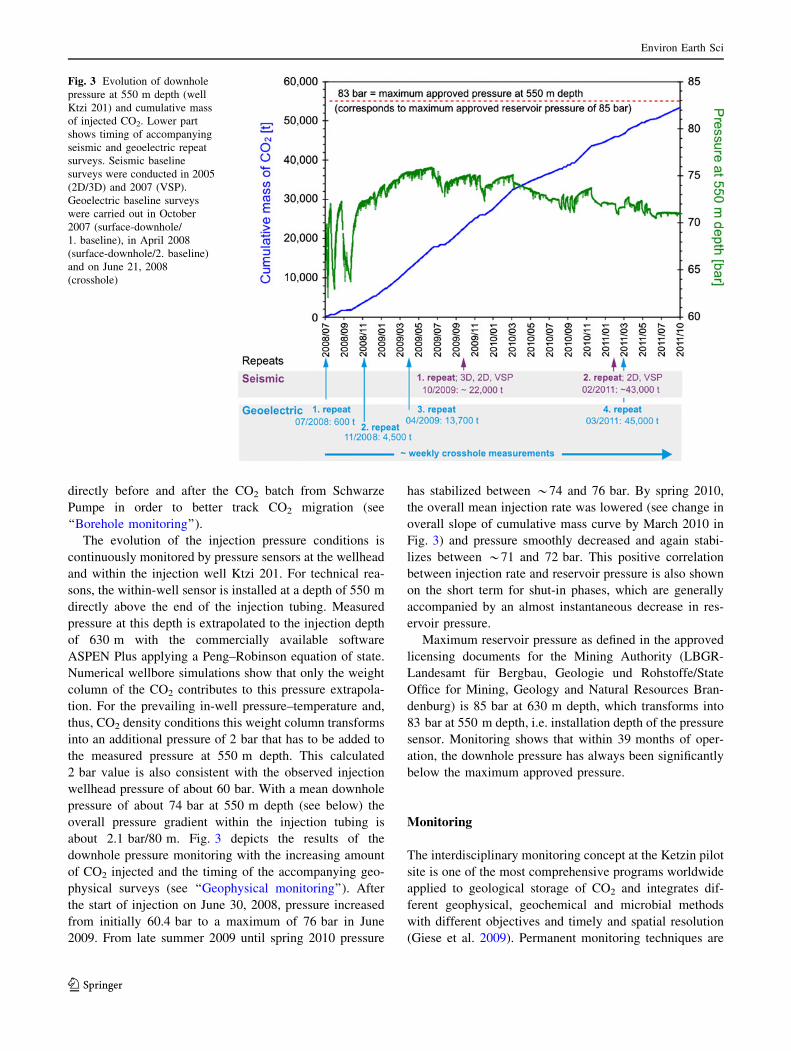
The evolution of the injection pressure conditions is
continuously monitored by pressure sensors at the wellhead
and within the injection well Ktzi 201. For technical rea-
sons, the within-well sensor is installed at a depth of 550 m
directly above the end of the injection tubing. Measured
pressure at this depth is extrapolated to the injection depth
of 630 m with the commercially available software
ASPEN Plus applying a Peng–Robinson equation of state.
Numerical wellbore simulations show that only the weight
column of the CO2 contributes to this pressure extrapola-
tion. For the prevailing in-well pressure–temperature and,
thus, CO2 density conditions this weight column transforms
into an additional pressure of 2 bar that has to be added to
the measured pressure at 550 m depth. This calculated
2 bar value is also consistent with the observed injection
wellhead pressure of about 60 bar. With a mean downhole
pressure of about 74 bar at 550 m depth (see below) the
overall pressure gradient within the injection tubing is
about 2.1 bar/80 m. Fig. 3 depicts the results of the
downhole pressure monitoring with the increasing amount
of CO2 injected and the timing of the accompanying geo-
physical surveys (see ‘‘Geophysical monitoring’’). After
the start of injection on June 30, 2008, pressure increased
from initially 60.4 bar to a maximum of 76 bar in June
2009. From late summer 2009 until spring 2010 pressure
has stabilized between *74 and 76 bar. By spring 2010,
the overall mean injection rate was lowered (see change in
overall slope of cumulative mass curve by March 2010 in
Fig. 3) and pressure smoothly decreased and again stabi-
lizes between *71 and 72 bar. This positive correlation
between injection rate and reservoir pressure is also shown
on the short term for shut-in phases, which are generally
accompanied by an almost instantaneous decrease in res-
ervoir pressure.
Maximum reservoir pressure as defined in the approved
licensing documents for the Mining Authority (LBGR-
Landesamt fur Bergbau, Geologie und Rohstoffe/State
Office for Mining, Geology and Natural Resources Bran-
denburg) is 85 bar at 630 m depth, which transforms into
83 bar at 550 m depth, i.e. installation depth of the pressure
sensor. Monitoring shows that within 39 months of oper-
ation, the downhole pressure has always been significantly
below the maximum approved pressure.
Monitoring
The interdisciplinary monitoring concept at the Ketzin pilot
site is one of the most comprehensive programs worldwide
applied to geological storage of CO2 and integrates dif-
ferent geophysical, geochemical and microbial methods
with different objectives and timely and spatial resolution
(Giese et al. 2009). Permanent monitoring techniques are
Fig. 3 Evolution of downhole
pressure at 550 m depth (well
Ktzi 201) and cumulative mass
of injected CO2. Lower part
shows timing of accompanying
seismic and geoelectric repeat
surveys. Seismic baseline
surveys were conducted in 2005
(2D/3D) and 2007 (VSP).
Geoelectric baseline surveys
were carried out in October
2007 (surface-downhole/
1. baseline), in April 2008
(surface-downhole/2. baseline)
and on June 21, 2008
(crosshole)
Environ Earth Sci
123

applied and repeat surveys are conducted for a compre-
hensive characterization of the reservoir processes and
joint interpretations.
In this contribution, we focus on the seismic and geo-
electric methods, wire-line pressure–temperature monitor-
ing in the wells and the gas geochemical monitoring. For
further details on microbiological and additional wellbore
monitoring the reader is kindly referred to Freifeld et al.
(2009), Morozova et al. (2010, 2011), Henninges et al.
(2011) and Liebscher et al. (2012).
Geophysical monitoring
Seismic monitoring
Surface and surface-downhole seismic measurements are
applied to test and optimize the resolution of different
methods and to visualize the CO2 plume. The seismic
monitoring is spearheaded by time-lapse 3D surveys, car-
ried out in 2005 (baseline) and 2009 (first repeat) as
denoted in Fig. 3. The CO2 signature could be detected by
an increased reflectivity at the top of the target reservoir, by
a change in the attenuation behavior and by a reduced
propagation velocity within the reservoir (Luth et al. 2011).
After about 15 months of injection (*22,000 tonnes), the
CO2 plume was concentrated around the injection well Ktzi
201 with a lateral extent of approximately 300–400 m and
a thickness of about 5–20 m.
Quantifying the CO2 imaged by the 3D seismic data is
still challenging due to the relatively small CO2 amount,
the heterogeneous reservoir and the limited information on
CO2 saturation. Based on the integration of borehole
measurements (Pulsed Neutron Gamma Logging), petro-
physical lab experiments and core analyses, a quantitative
analysis of the CO2 contained in the area of the seismic
time-lapse amplitude anomaly was performed. The mass
distribution of the imaged CO2 can be compared to the
history-matched reservoir simulations (see ‘‘Dynamic
modeling’’) indicating a general consistency of the simu-
lation with the monitoring results and qualitatively show-
ing the existence of a detection threshold for the seismic
monitoring which is not imaging the more distant parts of
the CO2 plume away from the injection point. A more
detailed analysis of the detection threshold is currently
underway.
An analysis of the variations of seismic amplitudes from
the reservoir with the source-receiver offset (AVO-ampli-
tude versus offset) enables a direct quantitative petro-
physical interpretation of seismic time-lapse data. The
AVO analysis results in a quantification of the zero-offset
reflection coefficient of a given reflector, and, using
petrophysical models, this can be converted, in time-lapse
mode, to the saturation of CO2 at the respective location
(Ivanova et al. 2011; Yang et al. 2011; see Fig. 4). The
AVO analysis revealed qualitatively a lower CO2 satura-
tion at the distant monitoring well Ktzi 202 than at the
injection well Ktzi 201, with some uncertainties concerning
the actual saturation but being consistent with borehole
logging results and reservoir simulations.
Alternatives to the high logistical and financial efforts of
frequent 3D time-lapse surveys are of particular interest for
the long-term monitoring of a storage reservoir. At Ketzin,
Fig. 4 Results from seismic
monitoring at the Ketzin pilot
site. a Normalized time-lapse
amplitude variations for the
baseline (2005) and first repeat
survey (2009) indicating the
lateral extent of the CO2 plume
after injecting approximately
22,000 tonnes. For reference,
the positions of the injection
well Ktzi 201 and the
monitoring wells Ktzi 200 and
202 are indicated. b Change in
water saturation for the Stuttgart
formation, derived from AVO-
analysis of the 4D seismic data.
A negative change in water
saturation correlates with CO2
replacing brine in the Stuttgart
formation. The results are still
preliminary, showing strong
scatter and artifacts at locations
where no CO2 has been detected
by amplitude variations
Environ Earth Sci
123

the 3D surveys are therefore complemented by pseudo 3D
surveys with an acquisition geometry restricted to profiles
oriented in a star-like manner around the injection site. The
second repeat survey of this type of pseudo 3D surveys was
acquired in February 2011. Although the 3D subsurface
coverage was extremely heterogeneous, it was possible to
detect a CO2 related signature at the depth level of the
Stuttgart Formation in the second repeat survey data. This
showed a larger lateral extent than the first repeat survey,
acquired in September 2009. However, the imaged plume
extent image by the pseudo 3D survey was considerably
smaller than the one imaged by the first full 3D repeat,
acquired in autumn 2009, indicating that at the given site
conditions of Ketzin, alternative pseudo 3D surveys are
only able to detect the CO2 where a sufficiently high
subsurface coverage is achieved.
Geoelectric monitoring
Since completion of the three Ketzin wells Ktzi 200, Ktzi
201 and Ktzi 202 geoelectrical surveys on different tem-
poral and spatial scales have been conducted in order to
monitor the CO2 migration in the target reservoir. The
specific geoelectrical concept combines surface and
downhole measurements by deployment of the permanent
vertical electrical resistivity array (VERA) installed in the
three wells Ktzi 200, Ktzi 201 and Ktzi 202 (Kiessling
et al. 2010). The VERA system comprises 15 steel
electrodes with a spacing of about 10 m that have been
installed in each of three wells at depths between *590 m
and 750 m. For surface to downhole measurements 16
surface dipoles with dipole length of 150 m are placed on
two concentric circles around the injection well with radii
of 800 m and 1500 m, respectively, and combined with
potential dipoles in all three wells from the VERA system
(Kiessling et al. 2010).
Comprehensive field datasets were acquired and evalu-
ated according to the electrical resistivity tomography
(ERT) method. The large-scale surface-downhole surveys
were carried out in 10/2007 and 04/2008 (baseline mea-
surements) as well as in 07/2008, 11/2008, 04/2009 and
03/2011 (repeat measurements) as denoted in Fig. 3. The
crosshole measurements, which cover the near-wellbore
area have been carried out on an almost weekly basis until
to date. The ERT is shown to be sensitive to resistivity
changes caused by the migration of the CO2 within the
originally brine-filled reservoir (Schmidt-Hattenberger
et al. 2011).
In Fig. 5 we observe a relatively stable CO2 signature over
time in the near wellbore area, which indicates that the actual
CO2 plume expansion occurs outside the imaging plane of
the VERA system. For further evaluation of additional sat-
uration related effects combined investigations with fluid-
flow modeling are foreseen for the near future.
Due to infrastructure near the pilot site a considerable
level of anthropogenic noise is infiltrated into the gathered
Fig. 5 Results from geoelectric
monitoring at the Ketzin pilot
site. A time-lapse sequence
from field data (December 2008
to June 2011) of the
permanently installed vertical
electrical resistivity array
(electrodes are depicted as blackdots) shows a significant
resistivity increase at the
reservoir level (630–650 m)
since the beginning of the CO2
injection in June 2008. Data are
shown for the observation plane
between wells Ktzi 201 and
Ktzi 200
Environ Earth Sci
123

raw data. Therefore, thoroughly data quality assessment
and efficient pre-processing routines are prerequisites to
establish consolidated datasets of apparent resistivities
for the inversion procedure. For the large-scale surface-
downhole surveys, a selective stacking approach was
applied to the acquired voltage time series. For the cross-
hole data, a workflow was developed, which considers the
short signal cycles as well as the large number of measured
electrode configurations. The procedure is based on
merging electrode combinations of the same type, aver-
aging their signals, and finding an appropriate interpolation
for the temporal evolution of the resulting apparent
resistivities.
In addition, a more detailed evaluation of the pre-
inversion data provided important findings as e.g. the
influence of well completion onto the permanent electrode
array performance, and the increasing degradation process
of individual electrodes during the array’s life cycle under
the present subsurface conditions. A quantitative estima-
tion of CO2 saturation based on the inverted 2D and 3D
resistivity distributions and corresponding petrophysical
results is currently underway. This final analysis is an
important key feature to develop the ERT surveys towards
a meaningful tool within a reservoir-monitoring program.
In general, the results from the Ketzin geoelectrical
monitoring concept contribute to the detection of the CO2
plume extension. The pre-processed and inverted field
datasets could clearly indicate a CO2-related resistivity
signature in the reservoir zone.
Borehole monitoring
During March 2011, the wells Ktzi 200, 201 and 202
were again inspected by a comprehensive wellbore log-
ging campaign. Pressure–temperature measurements in
the two observation wells Ktzi 200 and 202 confirmed the
findings of previous logging campaigns (see Henninges
et al. 2011).
Both observation wells are characterized by a complex
interplay between different CO2 fluid states (Fig. 6). Down
to about 620 m (Ktzi 200) and 600 m (Ktzi 202), two-
phase fluid conditions prevail in both observation wells
with coexisting vapour and liquid CO2. Down to about
413 m (Ktzi 200) and 403 m (Ktzi 202) vapour CO2
dominates with liquid CO2 droplets condensing within the
well. Below this depth, liquid CO2 dominates that boils off
bubbles of CO2 vapour. Below the two-phase fluid condi-
tions, single phase CO2 partly at supercritical pressure and
temperature conditions prevails down to the brine table at
643 (Ktzi 200) and 650 m (Ktzi 202). Camera inspections
of the observation wells Ktzi 200 and 202 proved the
results from the pressure–temperature measurements and
gave no hints to any corrosion of the innermost casings.
Gas geochemical monitoring
Long-term surface monitoring
A comprehensive surface monitoring network has been
established at the Ketzin pilot site since 2005 in order to
identify and monitor upward migration of CO2 with
potential leakage to the surface. This network consists of
20 sampling locations for soil CO2 gas flux, soil moisture,
and temperature measurements distributed across a study
area of approximately 2 km 9 2 km (Zimmer et al. 2011).
To gain long-term data on natural background CO2 flux, its
temporal and spatial variations and impacts of potential
CO2 leakage measurements are conducted once a month
and already started in 2005.
Since the start of injection in 2008, no change in soil
CO2 gas flux could be detected in comparison to the pre-
injection baseline (2005–2007). Mean CO2 flux as aver-
aged over all sampling locations ranged from 2.4 to
3.5 lmol/m2 per second for the pre-injection period and
from 2.2 to 2.5 lmol/m2 per second after the start of
injection (Zimmer et al. 2011). The spatial variability of
soil CO2 gas flux is 1.0 to 4.5 lmol/m2 per second among
all 20 sampling locations reflecting different organic
Fig. 6 Density-depth conditions within observation well Ktzi 200 as
measured during logging campaign from March 2011. Effective
density has been calculated based on measured pressure gradients at
each depth and liquid–vapor phase relation has been calculated based
on measured temperature and the equation of state from Span and
Wagner (1996)
Environ Earth Sci
123
carbon and nitrate contents, both serving as nutrients for
bacterial life in the soil. The data show that soil tempera-
ture is the key factor controlling the biogenic CO2 pro-
duction and subsequently the CO2 flux rate. The observed
spatial variability of soil CO2 gas flux transforms into a
natural background soil CO2 gas flux of 1,400–6,300 t/km2
per year at Ketzin and places an upper limit on biogenic
CO2 emissions apart from leakage. Thus, these values also
provide a rough estimate of the lower leakage detection
limit of the soil CO2 gas flux measurements at Ketzin
(Liebscher et al. 2012).
In March 2011, the surface monitoring network was
expanded by the installation of eight permanent stations
with automated soil gas samplers in direct vicinity of the
injection and monitoring wells. At these eight locations,
CO2 gas flux, soil moisture and temperature are measured
on an hourly basis. Evaluation and comparison with the
available long-term data are currently underway.
Borehole monitoring
Gas–chemical and isotope investigations in Ketzin are
direct methods to gain chemical and physicochemical
information on processes in the storage reservoir. In par-
ticular, the comparison between CO2 samples collected at
the injection wellhead Ktzi 201 prior to injection and CO2
samples collected at observation well Ktzi 200, i.e. after
traveling 50 m through the storage reservoir, provide
benchmark data such as gas migration velocity and changes
in composition.
In connection with the trial with CO2 from Schwarze
Pumpe, gas tracer tests with krypton (Kr) and sulphur
hexafluoride (SF6) were performed to further track the CO2
from the different sources (Linde and Schwarze Pumpe).
On May 3 and 4, 2011, before the injection of CO2 from
Schwarze Pumpe started, 6.5 m3 (STP) gaseous SF6 and Kr
were added through a valve into the injection well Ktzi
201. This was followed by 54 m3 (STP) nitrogen (N2) to
pressurize the borehole and to force the tracers into the
formation. Subsequently, the injection was restarted with
CO2 from Schwarze Pumpe on May 4, 2011. On June 15,
2011, after the injection of CO2 from Schwarze Pumpe was
finished, 7.98 m3 (STP) SF6 were pumped into the injec-
tion well to mark the change back to food-grade CO2 from
Linde. Samples were collected periodically at the well head
of the Ktzi 201 and continuously in the observation well
Ktzi 200 at 640 m depth using an especially installed 1/400
stainless steel riser tube. Incidentally, these two different
CO2 sources also exposed different stable carbon isotope
composition, thus providing ideal conditions for mass
balance and mixing calculations.
Significant changes in the gas composition and amount
between CO2 from Linde and Schwarze Pumpe have
neither been detected at the injection well head Ktzi 201
nor in the observation well Ktzi 200. The gas generally
consists of pure CO2 with traces of N2, He and CH4 during
the whole test period. The arrival of the CO2 from
Schwarze Pumpe in well Ktzi 200 was verified by the
detection of the gas tracer mixture (Kr and SF6) after
15 days on May 18, 2011 and its end by the arrival of the
second SF6 tracer after 34 days on July 19, 2011. The
longer retention time of the second tracer in the storage
formation is likely due to a reduction in the CO2 injection
rate.
The d13C of dissolved inorganic carbon (DIC) has pro-
ven to effectively trace the migration of the injected CO2 at
the Ketzin pilot site (Myrttinen et al. 2010). The d13C CO2
isotopic composition of gas samples, collected at the
wellhead of Ktzi 201 and from the observation well Ktzi
200 with the riser tube, has been analyzed since April 2011.
A change in the 13C/12C composition of the CO2 during the
temporary use of CO2 from Schwarze Pumpe was detected
(Fig. 7). The mean d13C CO2 increased from -28.3 %(Linde) to -26 % (Schwarze Pumpe). The point of time of
the isotopic change corresponds well with the arrival of the
tracers at the observation well Ktzi 200, which also signals
the arrival of the CO2 from Schwarze Pumpe.
These results show that gas chemical measurements
combined with tracer gas tests and isotope investigations
are suitable methods for identifying CO2 from different
sources and for tracing the distribution velocity, fate and
behavior of injected CO2 in the storage reservoir. They lay
foundations for further work and comparison between
conservative gas tracers (Kr and SF6) and the naturally
already present label in the injected CO2.
Modeling and simulations
Static and dynamic modeling tasks were undertaken in
order to implement a history-matched reservoir model of
the Stuttgart formation at the Ketzin pilot site for predic-
tion of reservoir behavior.
Static modeling
As discussed in Kempka et al. (2010) a history match of
reservoir pressure and CO2 arrival times in both observa-
tion wells Ktzi 201 and Ktzi 202 was not feasible applying
the initial static model developed by Frykman et al. (2009)
in dynamic simulations. This model was based on 3D
seismic investigations (Juhlin et al. 2007) interpreted and
depth-converted in 2008. Data updates being available
from consecutive monitoring at the Ketzin pilot site
allowed for a revision of the static model of the Stuttgart
formation. This revision aimed at geological modeling of
Environ Earth Sci
123

the fluvial facies bodies within the floodplain facies and
distribution of the petrophysical properties. Fault zones
identified by seismic surveys are not implemented in the
present model, but will be in future releases.
The Stuttgart formation was divided into three zones for
facies modeling. The upper zone (A) represents the
uppermost 25 m of the formation, where the highest CO2
mass is present. This zone was discretized with a vertical
resolution of 0.25 m. The middle zone (B) with a thickness
of 25 m has a vertical discretization of 0.5 m, while the
lower zone (C) is vertically discretized by 1.0 m. The
horizontal grid spacing (10 m 9 10 m) is uniform for all
zones. Facies modeling considered the expected regional
trend of the channel distribution. In addition, the results of
Kazemeini et al. (2009) were included for zone A and used
as a trend (probability) map for the presence of channel
facies. Furthermore, the results of the repeat 3D seismic
survey from 2009 were applied to define areas of high sand
content in a deterministic way. As further input, the sand–
clay content was re-evaluated based on borehole records of
wells of the broader Ketzin area. The floodplain facies is
more dominant in the revised model in zone A compared to
the previous model. Thus, the overall share of the channel
systems is decreased in the revised model version.
Petrophysical modeling of the two facies types (sand
channel and floodplain) was undertaken by an integrated
interpretation of borehole logging and laboratory data
(Norden et al. 2010) extended by literature data for the
Stuttgart formation (Wolfgramm et al. 2008). These data
sets allowed for a re-evaluation of the porosity distribution
curves (variograms) of the respective facies. Porosity was
modeled using the sequential Gaussian simulation provided
by the Petrel software package (Schlumberger 2010), tak-
ing into account the 3D seismic attribute map developed by
Kazemeini et al. (2009) after scaling it to represent a trend
map for porosity distribution.
Dynamic modeling
Numerical simulations were carried out using the revised
static model of the Stuttgart formation while taking into
account the discretization, initial and boundary conditions
as well as injection rates as described by Kempka et al.
(2010). The aim of these simulations was the verification of
the revised static model with regard to the reservoir pres-
sure determined in the injection well Ktzi 201 and the first
CO2 arrival in the observation wells Ktzi 200 and Ktzi 202
as described in Wurdemann et al. (2010). Using the Eclipse
100 reservoir simulator (Schlumberger 2009), a successful
match of monitored data was achieved where the deviation
of arrival times is below 10 % with calculated times of
23 days for the well Ktzi 200 (21 days observed) and
258 days for the well Ktzi 202 (271 days observed). Fur-
thermore, a good agreement of calculated and monitored
reservoir pressure was achieved by the simulations as
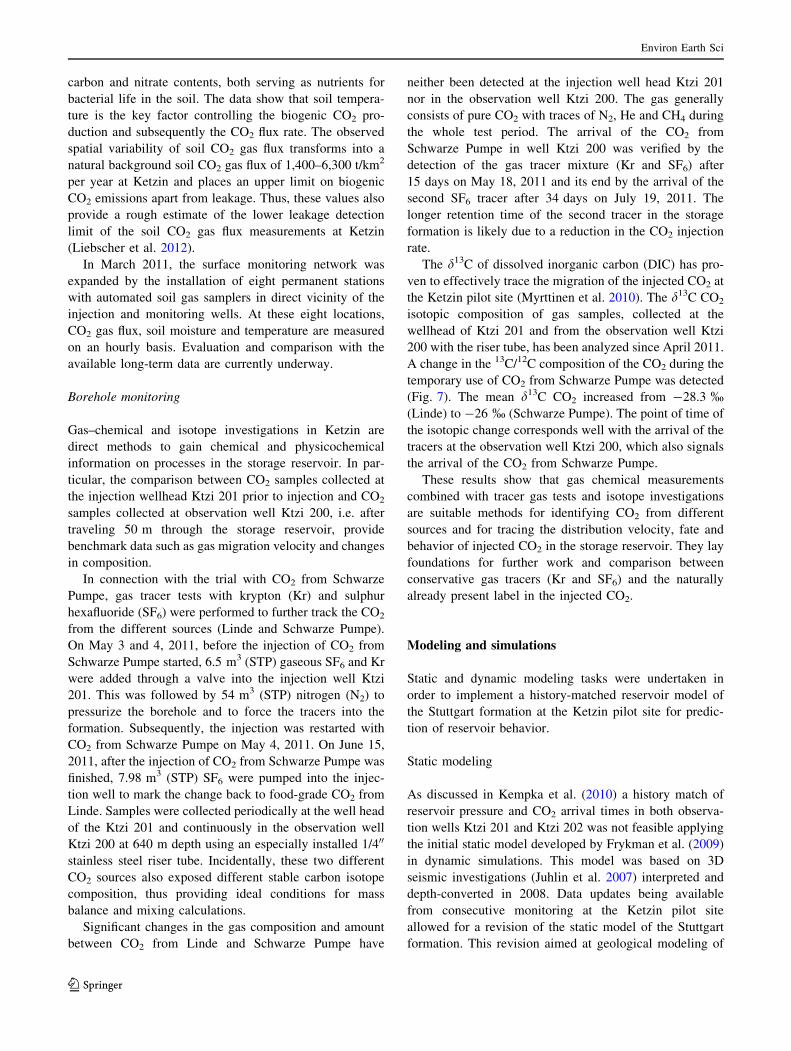
illustrated in Fig. 8.
A comparison of CO2 plume thickness using the CO2
plume distribution calculated and scaled based on the time-
lapse amplitude analysis of the 3D seismic repeat results
(*22 kt CO2 injected) is plotted in Fig. 9. The areas with
Fig. 7 CO2 injection and
detection of the gas tracers Kr
and SF6 together with the d13C
CO2 isotope data from Ketzin.
Pre- and post-injection of SF6
and Kr bracket CO2 from
Schwarze Pumpe
Environ Earth Sci
123
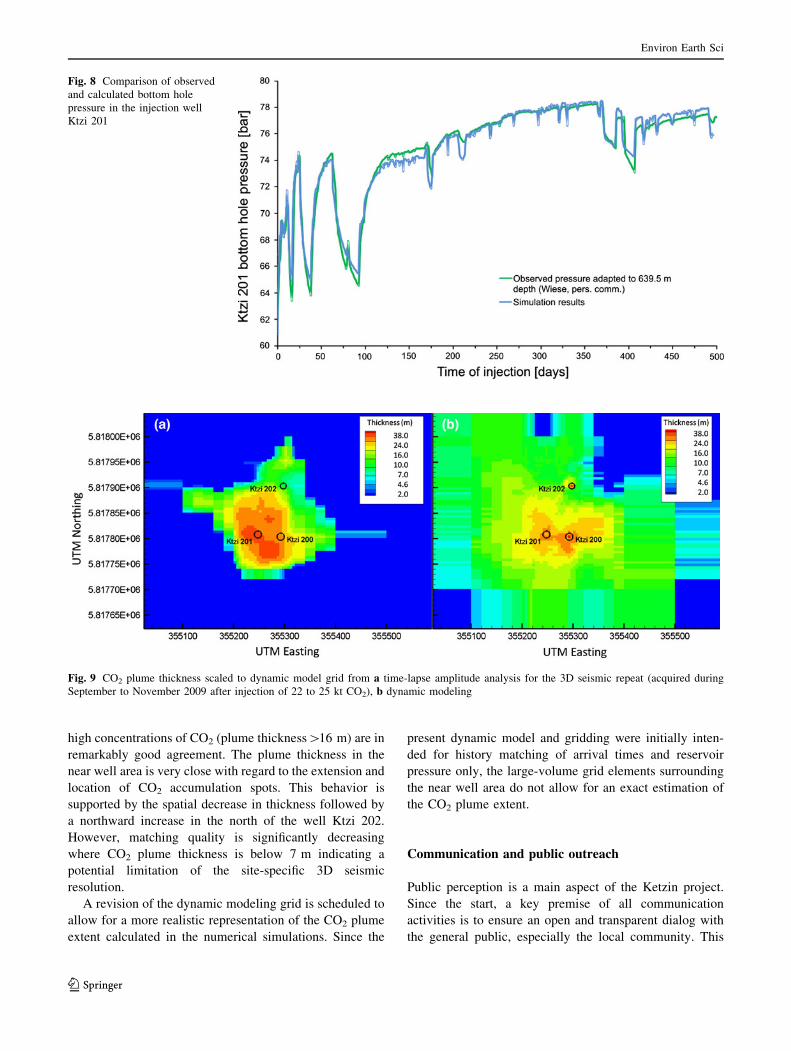
high concentrations of CO2 (plume thickness[16 m) are in
remarkably good agreement. The plume thickness in the
near well area is very close with regard to the extension and
location of CO2 accumulation spots. This behavior is
supported by the spatial decrease in thickness followed by
a northward increase in the north of the well Ktzi 202.
However, matching quality is significantly decreasing
where CO2 plume thickness is below 7 m indicating a
potential limitation of the site-specific 3D seismic
resolution.
A revision of the dynamic modeling grid is scheduled to
allow for a more realistic representation of the CO2 plume
extent calculated in the numerical simulations. Since the
present dynamic model and gridding were initially inten-
ded for history matching of arrival times and reservoir
pressure only, the large-volume grid elements surrounding
the near well area do not allow for an exact estimation of
the CO2 plume extent.
Communication and public outreach
Public perception is a main aspect of the Ketzin project.
Since the start, a key premise of all communication
activities is to ensure an open and transparent dialog with
the general public, especially the local community. This
Fig. 8 Comparison of observed
and calculated bottom hole
pressure in the injection well
Ktzi 201
Fig. 9 CO2 plume thickness scaled to dynamic model grid from a time-lapse amplitude analysis for the 3D seismic repeat (acquired during
September to November 2009 after injection of 22 to 25 kt CO2), b dynamic modeling
Environ Earth Sci
123
concept is reflected by a large and positive national and
international resonance in the media and continuous visitor
groups to the pilot site (800 visitors in 2011).
Information about the activities and experiences gained
at the Ketzin pilot site are made available through multiple
communication types. The visitor center on site is the most
important contact point and a corner stone for close col-
laboration with stakeholders and dissemination of knowl-
edge. In spring 2011, the center was expanded and
renovated in order to host larger visitor groups and per-
manent exhibits (e.g. posters, core samples, physical
models) that can be used to visually illustrate the concept
of CO2 storage. In addition, interested groups, especially
the local community, were invited by GFZ to attend an
open day on site in May 2011. The event was well received
and carried out in close cooperation with people from the
nearby city of Ketzin/Havel, for example, with the
involvement of the Mayor, the local fire brigade and other
service providers. The project status and progress are also
covered in videos and brochures, with attention drawn to
the project website (www.co2ketzin.de) where more gen-
eral and scientific information is available.
Conclusion and future work
The Ketzin project represents the longest-operating on-shore
CO2 storage site in Europe and successfully demonstrates
CO2 storage in a saline aquifer. After three years of
injection, the results can be summarized as follows:
1. Since the start of the CO2 injection in June 2008, the
operation has been running reliably and safely.
2. Downhole pressure data prove correlation between the
injection rate and the reservoir pressure and indicates
the presence of an overall dynamic equilibrium within
the reservoir.
3. The extensive geochemical and geophysical monitor-
ing program is capable of detecting CO2 on different
scales and gives no indication for any leakage.
4. Numerical simulations (history matching) are in good
agreement with the monitoring results.
The fundamental regulatory principles surrounding future
site closure, transfer of responsibility to the competent
authority and post-closure obligations are set out in the EU
Directive on CO2 Geological Storage (EU 2009). Although
the Ketzin pilot site is still in the operational phase it is
interesting to note that the three items (2) to (4) mentioned
above also refer to the following three minimum criteria as
defined in Article 18 for transfer of responsibility:
• Site is evolving towards a situation of long-term
stability.
• No detectable leakage.
• Observed behavior of the injected CO2 conforms to the
modeled behavior.
These conditions define satisfactory for long-term site
performance at a high-level. However, the EU Directive
does not give any technical criteria based on real site
performance data, which can demonstrate that a storage
site meets the three requirements. In order to close this gap,
the Ketzin pilot site is part of the portfolio of nine inter-
national sites within the European project CO2CARE
(2011–2013). Main objectives of CO2CARE are the
development of site abandonment procedures and tech-
nologies, which guarantee the fulfillment of these criteria
as well as so called dry runs or virtual implementations of
the abandonment process at real storage sites.
The Ketzin pilot site is a research and development
project and limited by legal regulations to a maximum
amount of stored CO2 of \100,000 tonnes. Injection is
scheduled to last until 2013. Following the success of the
Ketzin project to date, drilling of another *800 m deep
observation well (Ktzi 203) on the existing injection site is
planned for 2012. Cores retrieved from the Stuttgart For-
mation will provide the unique opportunity for research to
be conducted with samples that have been exposed in situ
to the CO2 for a period of about 4 years. In addition, the
seismic monitoring will be complemented by the next 3D
survey repeat measurement in 2012/13.
Acknowledgments The authors would like to thank the interdisci-
plinary team working on the Ketzin project and all partners for their
continued support and significant contributions. The research descri-
bed in this paper is funded by the European Commission (Sixth and
Seventh Framework Program), two German ministries—the Federal
Ministry of Economics and Technology and the Federal Ministry of
Education and Research—and industry. Funding from the Federal
Ministry of Education and Research within the GEOTECHNOLO-
GIEN Program (GEOTECH-1831) and industry partners enables the
on-going research project CO2MAN (www.co2ketzin.de). We also
thank Mary Lavin–Zimmer and two anonymous reviewers for their
constructive comments on this manuscript.
Open Access This article is distributed under the terms of the
Creative Commons Attribution License which permits any use, dis-
tribution, and reproduction in any medium, provided the original
author(s) and the source are credited.
References
EU (2009): Directive 2009/31/EC of the European Parliament and of
the council of 23 April 2009 on the geological storage of carbon
dioxide and amending Council Directive 85/337/EEC, European
Parliament and Council Directives 2000/60/EC, 2001/80/EC,
2004/35/EC, 2006/12/EC, 2008/1/EC and Regulation (EC) No
1013/2006
Forster A, Norden B, Zinck-Jørgensen K, Frykman P, Kulenkampff J,
Spangenberg E, Erzinger J, Zimmer M, Kopp J, Borm G, Juhlin
Environ Earth Sci
123

C, Cosma C, Hurter S (2006) Baseline characterization of the
CO2SINK geological storage site at Ketzin, Germany. Environ
Geosci 13(3):145–161. doi:10.1306/eg.02080605016
Forster A, Schoner R, Forster HJ, Norden B, Blaschke AW, Luckert J,
Beutler G, Gaupp R, Rhede D (2010) Reservoir characterization
of a CO2 storage aquifer: The Upper Triassic Stuttgart Formation
in the Northeast German Basin. Mar Petrol Geol 27(10):2156–
2172. doi:10.1016/j.marpetgeo.2010.07.010
Freifeld BM, Daley TM, Hovorka SD, Henninges J, Underschultz J,
Sharma S (2009) Recent advances in well-based monitoring of
CO2 sequestration. Energy Procedia 1(1):2277–2284. doi:
10.1016/j.egypro.2009.01.296
Frykman P, Nielsen CM, Norden B, Forster A (2009) Modeling and
predictions in the Ketzin CO2 storage experimental site. In: 13th
Annual Conference of the International Association of Mathe-
matical Geosciences IAMG09 (Stanford, CA, USA), CD-ROM
Giese R, Henninges J, Luth S, Morozova D, Schmidt-Hattenberger C,
Wurdemann H, Zimmer M, Cosma C, Juhlin C, CO2SINK Group
(2009) Monitoring at the CO2SINK site: a concept integrating
geophysics. Geochemistry and Microbiology. Energy Procedia
1(1):2251–2259. doi:10.1016/j.egypro.2009.01.293
Henninges J, Liebscher A, Bannach A, Brandt W, Hurter S, Kohler S,
Moller F, CO2SINK Group (2011) P-T-q and two-phase fluid
conditions with inverted density profile in observation wells at
the CO2 storage site at Ketzin (Germany). Energy Procedia
4:6085–6090. doi:10.1016/j.egypro.2011.02.614
Ivanova A, Yang C, Kummerow J, Luth S, Juhlin (2011) Discrim-
ination between pressure and fluid saturation changes from time-
lapse seismic data at a CO2 storage site. EAGE 2011, Vienna,
P062, extended abstract
Juhlin C, Giese R, Zinck-Jørgensen K, Cosma C, Kazemeini H,
Juhojuntti N, Luth S, Norden B, Forster A (2007) 3D baseline
seismics at Ketzin, Germany: the CO2SINK project. Geophysics
72(5):B121–B132. doi:10.1190/1.2754667
Kazemeini H, Juhlin C, Zinck-Jorgensen K, Norden B (2009)
Application of the continuous wavelet transform on seismic
data for mapping of channel deposits and gas detection at the
CO2SINK site, Ketzin, Germany. Geophys Prospect 57(1):111–
123. doi:10.1111/j.1365-2478.2008.00723.x
Kempka T, Kuhn M, Class H, Frykman P, Kopp A, Nielsen CM,
Probst P (2010) Modeling of CO2 arrival time at Ketzin-Part I.
Int J Greenh Gas Control 4(6):1007–1015. doi:10.1016/j.ijggc.
2010.07.005
Kiessling D, Schmidt-Hattenberger C, Schuett H, Schilling F,
Krueger K, Schoebel B, Danckwardt E, Kummerow J, the
CO2SINK Group (2010) Geoelectrical methods for monitoring
geological CO2 storage: First results from crosshole and surface-
downhole measurements from the CO2SINK test site at Ketzin
(Germany). Int J of Greenh Gas Control 4:816–826. doi:
10.1016/j.ijggc.2010.05.001
Liebscher A, Martens S, Moller F, Kuhn M (2012) On-shore CO2
storage in Germany – experiences gained from the Ketzin pilot
site, Brandenburg, the sole German national CO2 storage project.
In: Gluyas J, Mathias S (eds) Geoscience of carbon dioxide
(CO2) storage. Woodhead Publishing, Cambridge
Luth S, Bergmann P, Giese R, Gotz J, Ivanova A, Juhlin C, Cosma C
(2011) Time-lapse seismic surface and down-dole measurements
for monitoring CO2 storage in the CO2SINK project (Ketzin,
Germany). Energy Procedia 4:3435–3442. doi:10.1016/j.egypro.
2011.02.268
Martens S, Liebscher A, Moller F, Wurdemann H, Schilling F, Kuhn
M, Ketzin Group (2011) Progress Report on the First European
on-shore CO2 Storage Site at Ketzin (Germany)-Second Year of
Injection. Energy Procedia 4:3246–3253. doi:10.1016/j.egypro.
2011.02.243
Morozova D, Wandrey M, Alawi M, Zimmer M, Vieth A, Zettlitzer
M, Wurdemann H (2010) Monitoring of the microbial commu-
nity composition of the saline aquifers during CO2 storage by
fluorescence in situ hybridisation. Int J Greenh Gas Control
4(6):981–989. doi:10.1016/j.ijggc.2009.11.014
Morozova D, Zettlitzer M, Let D, Wurdemann H (2011) Monitoring
of the microbial community composition in deep subsurface
saline aquifers during CO2 storage in Ketzin, Germany. Energy
Procedia 4:4362–4370. doi:10.1016/j.egypro.2011.02.388
Myrttinen A, Becker V, van Geldern R, Wurdemann H, Morozova D,
Zimmer M, Taubald H, Blum P, Barth JAC (2010) Carbon and
oxygen isotope indications for CO2 behaviour after injection:
First results from the Ketzin site (Germany). Int J of Greenh Gas
Control 4:1000–1006. doi:10.1016/j.ijggc.2010.02.005
Norden B, Forster A, Vu-Hoang D, Marcelis F, Springer N, Le Ni I
(2010) Lithological and petrophysical core-log interpretation in
CO2SINK, the European CO2 onshore research storage and
verification project. SPE Reserv Eval Eng 13(2):179–192. doi:
10.2118/115247-PA
Prevedel B, Wohlgemuth L, Legarth B, Henninges J, Schutt H,
Schmidt-Hattenberger C, Norden B, Forster A, Hurter S (2009)
The CO2SINK boreholes for geological CO2-storage testing.
Energy Procedia 1(1):2087–2094. doi:10.1016/j.egypro.2009.
01.272
Schilling F, Borm G, Wurdemann H, Moller F, Kuhn M, CO2SINK
Group (2009) Status report on the First European on-shore CO2
storage site at Ketzin (Germany). Energy Procedia 1(1):2029–
2035. doi:10.1016/j.egypro.2009.01.264
Schlumberger (2009) Eclipse Reservoir Engineering Software,
Version 2009
Schlumberger (2010): Petrel Seismic-to-Evaluation Software, Version
2010
Schmidt-Hattenberger C, Bergmann P, Kiessling D, Krueger K, Rucker
C, Schuett H, Ketzin Group (2011) Application of a vertical
electrical resistivity array (VERA) for monitoring CO2 migration
at the Ketzin test site: first performance evaluation. Energy
Procedia 4:3363–3370. doi:10.1016/j.egypro.2011.02.258
Span R, Wagner W (1996) A new equation of state for carbon dioxide
covering the fluid region from the triple-point temperature to
1100 K at pressures up to 800 MPa. J Phys Chem Ref Data
25:1509–1596. doi:10.1063/1.555991
Wolfgramm M, Rauppach K, Seibt P (2008) Reservoirgeologische
Charakterisierung mesozoischer Sandsteine im Norddeutschen
Becken auf Basis petrophysikalischer und petrographischer
Daten (in German). Z Geol Wiss 4(5):249–266
Wurdemann H, Moller F, Kuhn M, Heidug W, Christensen NP, Borm
G, Schilling FR, the CO2SINK Group (2010) CO2SINK - From
site characterisation and risk assessment to monitoring and
verification: One year of operational experience with the field
laboratory for CO2 storage at Ketzin, Germany. Int J Greenh Gas
Control 4 (6): 938-951. doi:10.1016/j.ijggc.2010.08.010
Yang C, Juhlin C, Fan W, Ivanova A (2011) Estimation of changes in
the reservoir reflection coefficient due to CO2 injection at the
CO2SINK project site, Ketzin, Germany. In: EAGE 2011,
Vienna, SP21, extended abstract
Zimmer M, Pilz P, Erzinger J (2011) Long-term surface carbon
dioxide flux monitoring at the Ketzin carbon dioxide storage test
site. Environ Geosci 18:119–130. doi:10.1306/eg.11181010017
Environ Earth Sci
123
Related Documents