FOR RELEASE NOV. 29, 2017 FOR MEDIA OR OTHER INQUIRIES: Alan Cooperman, Director of Religion Research Conrad Hackett, Associate Director of Research Anna Schiller, Communications Manager 202.419.4372 www.pewresearch.org RECOMMENDED CITATION Pew Research Center, Nov. 29, 2017, “Europe’s Growing Muslim Population”

Welcome message from author
This document is posted to help you gain knowledge. Please leave a comment to let me know what you think about it! Share it to your friends and learn new things together.
Transcript

FOR RELEASE NOV. 29, 2017
FOR MEDIA OR OTHER INQUIRIES:
Alan Cooperman, Director of Religion Research
Conrad Hackett, Associate Director of Research
Anna Schiller, Communications Manager
202.419.4372
www.pewresearch.org
RECOMMENDED CITATION
Pew Research Center, Nov. 29, 2017, “Europe’s
Growing Muslim Population”

1
PEW RESEARCH CENTER
www.pewresearch.org
About Pew Research Center
Pew Research Center is a nonpartisan fact tank that informs the public about the issues, attitudes
and trends shaping America and the world. It does not take policy positions. The Center conducts
public opinion polling, demographic research, content analysis and other data-driven social
science research. It studies U.S. politics and policy; journalism and media; internet, science and
technology; religion and public life; Hispanic trends; global attitudes and trends; and U.S. social
and demographic trends. All of the Center’s reports are available at www.pewresearch.org. Pew
Research Center is a subsidiary of The Pew Charitable Trusts, its primary funder.
This report was produced by Pew Research Center as part of the Pew-Templeton Global Religious
Futures project, which analyzes religious change and its impact on societies around the world.
Funding for the Global Religious Futures project comes from The Pew Charitable Trusts and the
John Templeton Foundation.
© Pew Research Center 2017

2
PEW RESEARCH CENTER
www.pewresearch.org
Acknowledgments
This report was produced by Pew Research Center as part of the Pew-Templeton Global Religious
Futures project, which analyzes religious change and its impact on societies around the world.
Funding for the Global Religious Futures project comes from The Pew Charitable Trusts and the
John Templeton Foundation.
This report is a collaborative effort based on the input and analysis of the following individuals:
Primary Researchers
Conrad Hackett, Associate Director of Research and Senior Demographer
Phillip Connor, Senior Researcher
Marcin Stonawski, Project Leader, Religion-Education-Demography Project, International
Institute for Applied Systems Analysis (IIASA); Department of Demography, Cracow University
of Economics
Michaela Potančoková, Research Scholar, International Institute for Applied Systems Analysis
(IIASA)
Research Team
Alan Cooperman, Director of Religion Research
Anne Fengyan Shi, Senior Researcher
Stephanie Kramer, Research Associate
Joey Marshall, Research Associate
Ariana Monique Salazar, Research Analyst
Juan Carlos Esparza Ochoa, Data Manager
Editorial and Graphic Design
Michael Lipka, Senior Editor
Aleksandra Sandstrom, Copy Editor
Bill Webster, Information Graphics Designer
Communications and Web Publishing
Stacy Rosenberg, Associate Director, Digital
Travis Mitchell, Digital Producer
Anna Schiller, Communications Manager
Jessica Pumphrey, Communications Associate

3
PEW RESEARCH CENTER
www.pewresearch.org
Others at Pew Research Center who gave valuable feedback on this report include Vice President
of Global Strategy James Bell, Director of Hispanic Research Mark Hugo Lopez, Senior
Demographer Jeffrey Passel, Senior Writer and Editor D’Vera Cohn and Senior Research
Methodologist Steve Schwarzer. Former Pew Research Center staff members also contributed to
this report: Research Associate David McClendon and Senior Writer and Editor Geneive Abdo.
We received helpful advice and feedback on German data from Matthias Koenig, professor of
sociology at the University of Göttingen. We are grateful to the Institut Montaigne for sharing their
2016 survey of French Muslims and answering questions about this survey. Our frequent
collaborator Vegard Skirbekk, Professor at Columbia University and Senior Researcher at the
Norwegian Institute of Public Health, provided helpful feedback on a draft of this report.
We are indebted to Guy Abel, professor at Shanghai University’s Asian Demographic Research
Institute, who constructed the country-level migration flow data, which after adjustment by Pew
Research Center researchers were used to estimate non-asylum seeker (“regular”) migration flows
to Europe.

4
PEW RESEARCH CENTER
www.pewresearch.org
In recent years, Europe has
experienced a record influx of
asylum seekers fleeing conflicts
in Syria and other
predominantly Muslim
countries. This wave of Muslim
migrants has prompted debate
about immigration and security
policies in numerous countries
and has raised questions about
the current and future number
of Muslims in Europe.
To see how the size of Europe’s
Muslim population may change
in the coming decades, Pew
Research Center has modeled
three scenarios that vary
depending on future levels of
migration. These are not efforts
to predict what will happen in
the future, but rather a set of
projections about what could
happen under different
circumstances.
The baseline for all three
scenarios is the Muslim
population in Europe (defined
here as the 28 countries
presently in the European
Union, plus Norway and

5
PEW RESEARCH CENTER
www.pewresearch.org
Switzerland) as of mid-2016, estimated at 25.8 million (4.9% of the overall population) – up from
19.5 million (3.8%) in 2010.
Even if all migration into Europe were to
immediately and permanently stop – a “zero
migration” scenario – the Muslim population of
Europe still would be expected to rise from the
current level of 4.9% to 7.4% by the year 2050.
This is because Muslims are younger (by 13
years, on average) and have higher fertility (one
child more per woman, on average) than other
Europeans, mirroring a global pattern.
A second, “medium” migration scenario
assumes that all refugee flows will stop as of
mid-2016 but that recent levels of “regular”
migration to Europe will continue (i.e.,
migration of those who come for reasons other
than seeking asylum; see note on terms on page
6). Under these conditions, Muslims could reach
11.2% of Europe’s population in 2050.
Finally, a “high” migration scenario projects the
record flow of refugees into Europe between
2014 and 2016 to continue indefinitely into the
future with the same religious composition (i.e.,
mostly made up of Muslims) in addition to the
typical annual flow of regular migrants. In this
scenario, Muslims could make up 14% of
Europe’s population by 2050 – nearly triple the
current share, but still considerably smaller than
the populations of both Christians and people
with no religion in Europe.
The refugee flows of the last few years, however, are extremely high compared with the historical
average in recent decades, and already have begun to decline as the European Union and many of
its member states have made policy changes aimed at limiting refugee flows (see sidebar on page
26).

6
PEW RESEARCH CENTER
www.pewresearch.org
How key terms are used in this report: Regular
migrants, asylum seekers and refugees
Migrants: This broad category includes all people moving across
international borders to live in another country.
Regular migrants/other migrants: People who legally move to
Europe for any reason other than seeking asylum – e.g., for
economic, educational or family reasons.
Asylum seekers: Migrants who apply for refugee status upon entry
to Europe. Asylum seekers whose requests for asylum are rejected
can appeal the decision but cannot legally stay in Europe if the
appeal is denied.
Refugees: Successful asylum seekers and those who are expected
to receive legal status once their paperwork is processed. Estimates
are based on recent rates of approval by European destination
country for each origin country (among first-time applicants) and
adjusted for withdrawals of asylum requests, which occur, for
example, when asylum seekers move to another European country
or outside of Europe.
In limbo: Asylum seekers whose application for asylum has been or
is expected to be denied. Though this population may remain
temporarily or illegally in Europe, these migrants are excluded from
the population estimates and projections in this report.
Predicting future migration
levels is impossible, because
migration rates are connected
not only to political and
economic conditions outside of
Europe, but also to the
changing economic situation
and government policies
within Europe. Although none
of these scenarios will play out
exactly as projected, each
provides a set of rough
parameters from which to
imagine other possible
outcomes. For example, if
regular migration continues at
recent levels, and some asylum
seekers also continue to arrive
and receive refugee status –
but not as many as during the
historically exceptional surge
of refugees from 2014 to 2016
– then the share of Muslims in
Europe’s population as of 2050
would be expected to be
somewhere between 11.2% and
14%.
While Europe’s Muslim
population is expected to grow in
all three scenarios – and more
than double in the medium and
high migration scenarios –
Europe’s non-Muslims, on the
other hand, are projected to decline in total number in each scenario. Migration, however, does
mitigate this decline somewhat; nearly half of all recent migrants to Europe (47%) were not
Muslim, with Christians making up the next-largest group.

7
PEW RESEARCH CENTER
www.pewresearch.org
Taken as a whole, Europe’s population (including both Muslims and non-Muslims) would be
expected to decline considerably (from about 521 million to an estimated 482 million) without any
future migration. In the medium migration scenario, it would remain roughly stable, while in the
high migration scenario it would be projected to grow modestly.
The impact of these scenarios is uneven across different European countries (see maps on next
three pages); due in large part to government policies, some countries are much more affected by
migration than others.

8
PEW RESEARCH CENTER
www.pewresearch.org
Countries that have received
relatively large numbers of Muslim
refugees in recent years are
projected to experience the biggest
changes in the high migration
scenario – the only one that
projects these heavy refugee flows
to continue into the future. For
instance, Germany’s population
(6% Muslim in 2016) would be
projected to be about 20% Muslim
by 2050 in the high scenario – a
reflection of the fact that Germany
has accepted many Muslim refugees
in recent years – compared with
11% in the medium scenario and 9%
in the zero migration scenario.
Sweden, which also has accepted a
relatively high number of refugees,
would experience even greater
effects if the migration levels from
2014 to mid-2016 were to continue
indefinitely: Sweden’s population
(8% Muslim in 2016) could grow to
31% Muslim in the high scenario by
2050, compared with 21% in the
medium scenario and 11% with no
further Muslim migration.
By contrast, the countries projected
to experience the biggest changes in
the medium scenario (such as the
UK) tend to have been destinations
for the highest numbers of regular
Muslim migrants. This scenario
only models regular migration.
9
PEW RESEARCH CENTER
www.pewresearch.org
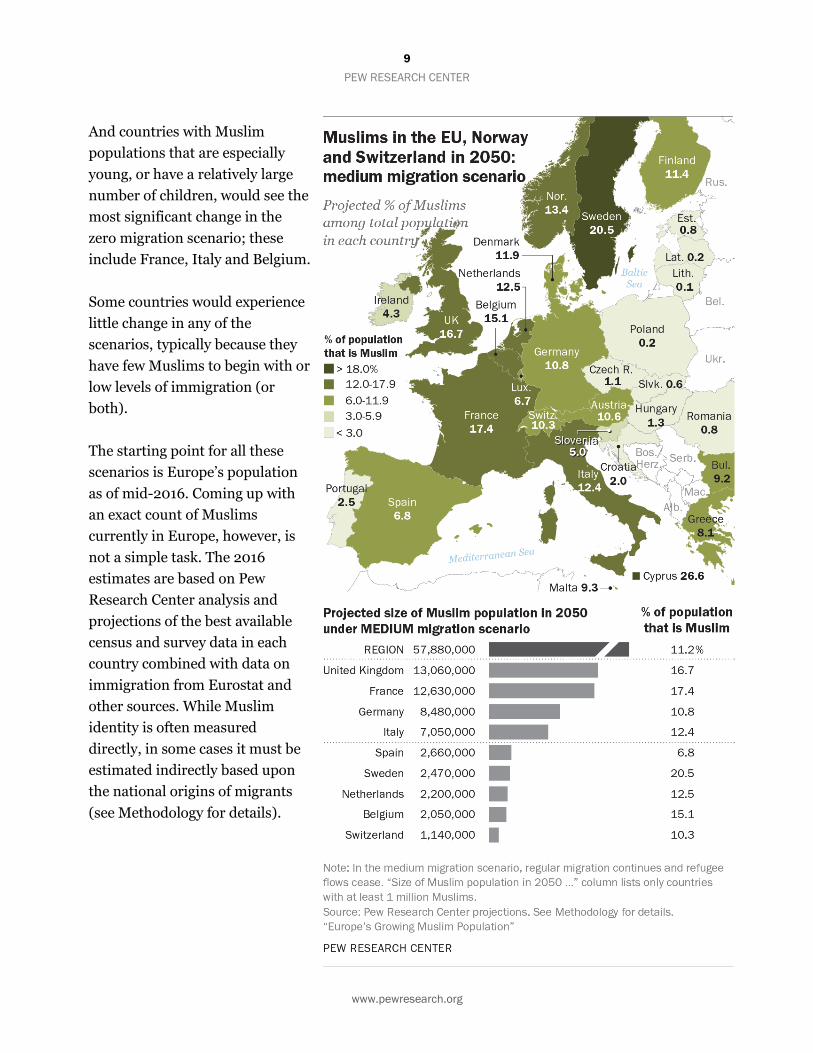
And countries with Muslim
populations that are especially
young, or have a relatively large
number of children, would see the
most significant change in the
zero migration scenario; these
include France, Italy and Belgium.
Some countries would experience
little change in any of the
scenarios, typically because they
have few Muslims to begin with or
low levels of immigration (or
both).
The starting point for all these
scenarios is Europe’s population
as of mid-2016. Coming up with
an exact count of Muslims
currently in Europe, however, is
not a simple task. The 2016
estimates are based on Pew
Research Center analysis and
projections of the best available
census and survey data in each
country combined with data on
immigration from Eurostat and
other sources. While Muslim
identity is often measured
directly, in some cases it must be
estimated indirectly based upon
the national origins of migrants
(see Methodology for details).

10
PEW RESEARCH CENTER
www.pewresearch.org
One source of uncertainty is the
status of asylum seekers who are
not granted refugee status. An
estimated 3.7 million Muslims
migrated to Europe between mid-
2010 and mid-2016, including
approximately 2.5 million regular
migrants entering legally as
workers, students, etc., as well as
1.3 million Muslims who have or
are expected to be granted refugee
status (including an estimated
980,000 Muslim refugees who
arrived between 2014 and mid-
2016).
Based on recent rates of approval of
asylum applications, Pew Research
Center estimates that nearly a
million (970,000) additional
Muslim asylum seekers who came
to Europe in recent years will not
have their applications for asylum
accepted, based on past rates of
approval on a country-by-country
basis. These estimates also take
into account expected rates of
withdrawals of requests for refugee
status (see Methodology for
details).
Where these asylum seekers “in
limbo” ultimately will go is unclear:
Some may leave Europe voluntarily
or be deported, while others will
remain at least temporarily while
they appeal their asylum rejection.
11
PEW RESEARCH CENTER
www.pewresearch.org
Some also could try to stay in Europe illegally.
For the future population projections presented in this report, it is assumed that only Muslim
migrants who already have – or are expected to gain – legal status in Europe will remain for the
long term, providing a baseline of 25.8 million Muslims as of 2016 (4.9% of Europe’s population).
However, if all of the approximately 1 million Muslims who are currently in legal limbo in Europe
were to remain in Europe – which seems unlikely – the 2016 baseline could rise as high as 26.8
million, with ripple effects across all three scenarios.
These are a few of the key findings from a new Pew Research Center demographic analysis – part
of a broader effort to project the population growth of religious groups around the world. This
report, which focuses on Muslims in Europe due to the rapid changes brought on by the recent
influx of refugees, provides the first estimates of the growing size of the Muslim population in
Europe following the wave of refugees between 2014 and mid-2016. It uses the best available data
combined with estimation and projection methods developed in prior Pew Research Center
demographic studies. The projections take into account the current size of both the Muslim and
non-Muslim populations in Europe, as well as international migration, age and sex composition,
fertility and mortality rates, and patterns in conversion. (See Methodology for details.)
Europe's Muslim population is diverse. It encompasses Muslims born in Europe and in a wide
variety of non-European countries. It includes Sunnis, Shiites and Sufis. Levels of religious
commitment and belief vary among Europe's Muslim populations. Some of the Muslims
enumerated in this report would not describe Muslim identity as salient in their daily lives. For
others, Muslim identity profoundly shapes their daily lives. However, quantifying religious
devotion and categories of Muslim identity is outside the scope of this report.

12
PEW RESEARCH CENTER
www.pewresearch.org
Between mid-2010 and mid-
2016, the number of Muslims in
Europe grew considerably
through natural increase alone –
that is, estimated births
outnumbered deaths among
Muslims by more than 2.9
million over that period. But
most of the Muslim population
growth in Europe during the
period (about 60%) was due to
migration: The Muslim
population grew by an estimated
3.5 million from net migration
(i.e., the number of Muslims who
arrived minus the number who
left, including both regular
migrants and refugees). Over the
same period, there was a
relatively small loss in the
Muslim population due to
religious switching – an
estimated 160,000 more people
switched their religious identity
from Muslim to another religion
(or to no religion) than switched
into Islam from some other religion or no religion – although this had a modest impact compared
with births, deaths and migration.1
By comparison, the non-Muslim population in Europe declined slightly between 2010 and 2016. A
natural decrease of about 1.7 million people in the non-Muslim European population modestly
1 Data on religious switching patterns come from general population surveys. In European countries, these surveys are generally sufficient for
measuring rates of switching into Islam among those who were not raised as Muslims. However, due to the relatively small size of Muslim
populations in European countries, these surveys typically have too few Muslims to reliably estimate patterns of switching out of Islam.
Furthermore, the small number of respondents in these surveys who were raised Muslim may not be representative of all people raised
Muslim in the country — respondents may be disproportionately assimilated and perhaps more likely than others in the country who were
raised Muslim to report some type of religious switching. However, in France, a large, carefully designed survey provided sufficient statistical
power and methodological precautions to measure switching patterns among those raised Muslim. In the absence of data on country-specific
switching and retention patterns among those raised Muslim, the switching patterns of respondents raised Muslim in France have been used
to model retention in and switching out of Islam in other Western European countries.

13
PEW RESEARCH CENTER
www.pewresearch.org
outnumbered the net increase of non-Muslim migrants and a modest net change due to religious
switching.
The rest of the report looks at these findings in greater detail. The first section examines the
number of migrants to Europe between mid-2010 and mid-2016, including patterns by religion
and refugee status. The next section details the top origin and destination countries for recent
migrants to Europe, including in each case the estimated percentage of Muslims. One sidebar
looks at European public opinion toward the surge in refugees from countries like Iraq and Syria;
another summarizes trends in government policies toward refugees and migration in individual
countries and the EU as a whole. The following section examines more deeply the three projection
scenarios on a country-by-country basis. Finally, the last two sections reveal data on two other key
demographic factors that affect population growth: fertility and age structure.
This report was produced by Pew Research Center as part of the Pew-Templeton Global Religious
Futures project, which analyzes religious change and its impact on societies around the world.
Funding for the Global Religious Futures project comes from The Pew Charitable Trusts and the
John Templeton Foundation.

14
PEW RESEARCH CENTER
www.pewresearch.org
3.7m
1.3
2.5
3.3
0.3
2.9
All migrants to
Europe
Refugees Regular migrants
Muslims Non-Muslims
Overall, regardless of religion or immigration
status, there were an estimated 7 million
migrants to Europe between mid-2010 and
mid-2016 (not including 1.7 million asylum
seekers who are not expected to have their
applications for asylum approved).
Historically, a relatively small share of
migrants to Europe are refugees from violence
or persecution in their home countries.2 This
continued to be the case from mid-2010 to
mid-2016 – roughly three-quarters of
migrants to Europe in this period (5.4 million)
were regular migrants (i.e., not refugees).
2 Europe also experienced a large surge in refugees over the 1991 to 1995 period due to the collapse of Yugoslavia and the Bosnian War.
About one-quarter of recent immigrants
to Europe are refugees
Estimated counts of Muslims and non-Muslims
immigrating to Europe between mid-2010 and mid-2016
Note: Counts do not include those asylum seekers who are not expected to
be granted legal refugee status to remain in Europe. Europe defined here
as the 28 member nations of the European Union in 2016 plus Norway
and Switzerland.
Source: Pew Research Center estimates. See Methodology for details.
“Europe’s Growing Muslim Population”
PEW RESEARCH CENTER

15
PEW RESEARCH CENTER
www.pewresearch.org
But the number of refugees has surged since 2014. During the three-and-a-half-year period from
mid-2010 to the end of 2013, about 400,000 refugees (an average of 110,000 per year) arrived in
Europe. Between the beginning of 2014 and mid-2016 – a stretch of only two and a half years –
roughly three times as many refugees (1.2 million, or about 490,000 annually) came to Europe, as
conflicts in Syria, Iraq and Afghanistan continued or intensified. (These figures do not include an
additional 970,000 Muslim asylum seekers and 680,000 non-Muslim asylum seekers who arrived
between mid-2010 and mid-2016 but are not
projected to receive legal status in Europe.)
Europe has experienced surge of
refugees since 2014
Annual averages of estimated refugees in each period
Note: Counts do not include those asylum seekers who are not expected to
be granted legal refugee status to remain in Europe. Europe defined here
as the 28 member nations of the European Union in 2016 plus Norway
and Switzerland.
Source: Pew Research Center estimates. See Methodology for details.
“Europe’s Growing Muslim Population”
PEW RESEARCH CENTER
80,000
390,000
30,000
90,000
mid-2010 to 2013 2014 to mid-2016
Muslims Non-Muslims

16
PEW RESEARCH CENTER
www.pewresearch.org
Of these roughly 1.6 million people who received refugee
status in Europe between mid-2010 and mid-2016 (or are
expected to have their applications approved in the future),
more than three-quarters (78%, or 1.3 million) were
estimated to be Muslims.3 By comparison, a smaller
percentage of regular migrants to Europe in this period
(46%) were Muslims, although this still greatly exceeds the
share of Europe’s overall population that is Muslim and
thus contributes to Europe’s growing Muslim population. In
fact, about two-thirds of all Muslims who arrived in Europe
between mid-2010 and mid-2016 were regular migrants
and not refugees.
Altogether, a slim majority of all migrants to Europe – both
refugees and regular migrants – between mid-2010 and
mid-2016 (an estimated 53%) were Muslim. In total
number, roughly 3.7 million Muslims and 3.3 million non-
Muslims arrived in Europe during this period.
Non-Muslim migrants to Europe overall between mid-2010
and mid-2016 were mostly made up of Christians (an
estimated 1.9 million), people with no religious affiliation
(410,000), Buddhists (390,000) and Hindus (350,000).
Christians made up 30% of regular migrants overall (1.6
million regular Christian migrants; 55% of all non-Muslim
regular migrants) and 16% of all refugees (250,000 Christian refugees; 71% of all non-Muslim
refugees).
3 This relatively high share of Muslims among refugees is a result of both a surge of migrants from predominantly Muslim countries as well as
the fact that applications for asylum have been approved at higher rates for asylum seekers from Syria and Iraq compared with other origin
countries.
Majority of recent
refugees are Muslim
Estimated shares of Muslims and
non-Muslims immigrating to
Europe, 2010-2016
Note: Estimates do not include those asylum
seekers who are not expected to be granted
legal refugee status to remain in Europe.
Europe defined here as the 28 member nations
of the European Union in 2016 plus Norway
and Switzerland.
Source: Pew Research Center estimates. See
Methodology for details.
“Europe’s Growing Muslim Population”
PEW RESEARCH CENTER
53%
78%
46%
47% 22% 54%
All migrants
to Europe
Refugees Regular
migrants
Muslims Non-Muslims

17
PEW RESEARCH CENTER
www.pewresearch.org
Considering the total influx of refugees and
regular migrants together, more migrants to
Europe between mid-2010 and mid-2016 came
from Syria than any other country. Of the
710,000 Syrian migrants to Europe during this
period, more than nine-in-ten (94%, or
670,000) came seeking refuge from the Syrian
civil war, violence perpetrated by the Islamic
State or some other strife.
An estimated nine-in-ten Syrian migrants
(91%) were Muslims. In this case and many
others, migrants’ religious composition is
assumed to match the religious composition of
their origin country. In some other cases, data
are available for migrants from a particular
country to a destination country; for example,
there is a higher share of Christians among
Egyptian migrants to Austria than there is
among those living in Egypt. When available,
this type of data is used to estimate the
religious composition of new migrants. (For
more details, see Methodology on page 38.)
After Syria, the largest sources of recent
refugees to Europe are Afghanistan (180,000)
and Iraq (150,000). Again, in both cases,
nearly all of the migrants from these countries
were refugees from conflict, and overwhelming
majorities from both places were Muslims.
Several other countries, however, were the
origin of more overall migrants to Europe.
India, for example, was the second-biggest
Syria and India top list of countries of
origin of migrants to Europe, mid-2010
to mid-2016
Top 10 origins of migrants overall
Estimated count % Muslim
Syria 710,000 91%
India 480,000 15
Morocco 370,000 100
Pakistan 280,000 96
Bangladesh 250,000 95
United States 240,000 1
China 240,000 2
Iran 220,000 97
Nigeria 190,000 23
Sri Lanka 190,000 10
Top 10 origins of refugees
Syria 670,000 91%
Afghanistan 180,000 100
Iraq 150,000 92
Eritrea 120,000 37
Somalia 60,000 100
Iran 50,000 96
Pakistan 30,000 96
Nigeria 20,000 44
Russia 20,000 8
Sudan 20,000 91
Top 10 origins of regular migrants
India 470,000 15%
Morocco 360,000 100
Pakistan 250,000 96
United States 240,000 1
Bangladesh 240,000 96
China 230,000 2
Sri Lanka 180,000 10
Libya 180,000 97
Iran 170,000 98
Nigeria 170,000 20
Note: Estimates do not include those asylum seekers not expected to be
granted legal status to remain in Europe.
Source: Pew Research Center estimates. See Methodology for details.
“Europe’s Growing Muslim Population”
PEW RESEARCH CENTER

18
PEW RESEARCH CENTER
www.pewresearch.org
source of migrants to Europe (480,000) between mid-2010 and mid-2016; very few of these
migrants came as refugees, and only an estimated 15% were Muslims.
The top countries of origin of migrants in legal limbo are not necessarily the top countries of origin
among legally accepted refugees. For example, relatively few Syrians are in legal limbo, while
Albania, where fewer asylum seekers come from, is the origin of a large number of rejected
applicants. Afghanistan, meanwhile, is both a major source of legally accepted refugees and also a
major country of origin of those in legal limbo.
Since the primary criterion for asylum decisions is the safety of the origin country, particularly
dangerous countries, such as Syria, have much higher acceptance rates than others. For more
information on the countries of origin of those in legal limbo see Pew Research Center’s 2017
report, “Still in Limbo: About a Million Asylum Seekers Await Word on Whether They Can Call
Europe Home.”

19
PEW RESEARCH CENTER
www.pewresearch.org
Syria also was by far the single biggest source of Muslim migrants to Europe overall in recent
years. But Morocco, Pakistan, Bangladesh and Iran also sent considerable numbers of Muslim
migrants to Europe between mid-2010 and mid-2016 – more than 1 million combined – and the
vast majority of Muslims from these countries came to Europe as regular migrants and not as
refugees.
Morocco, Pakistan, Bangladesh top list of countries of origin for regular Muslim
migrants to Europe
Estimated counts of Muslims migrating from each country of origin, 2010-2016
Top 10 origins of Muslim migrants Top 10 origins of Muslim refugees Top 10 origins of regular Muslim
migrants
Syria 650,000 Syria 610,000 Morocco 360,000
Morocco 370,000 Afghanistan 180,000 Pakistan 240,000
Pakistan 270,000 Iraq 140,000 Bangladesh 230,000
Bangladesh 230,000 Somalia 60,000 Libya 170,000
Iran 220,000 Iran 50,000 Iran 170,000
Afghanistan 180,000 Eritrea 50,000 Jordan 150,000
Libya 180,000 Pakistan 30,000 Algeria 140,000
Jordan 150,000 Sudan 10,000 Senegal 70,000
Iraq 140,000 Mali 10,000 Somalia 70,000
Algeria 140,000 Nigeria 10,000 India 70,000
Note: Estimates do not include those asylum seekers who are not expected to be granted legal refugee status to remain in Europe.
Source: Pew Research Center estimates. See Methodology for details.
“Europe’s Growing Muslim Population”
PEW RESEARCH CENTER

20
PEW RESEARCH CENTER
www.pewresearch.org
Germany was the destination for an estimated
670,000 refugees between mid-2010 and mid-
2016 – more than three times as many as the
country with the next-largest number, Sweden
(200,000). A similar number of regular
migrants from outside Europe also arrived in
Germany in recent years (680,000). But
religiously, refugees and other migrants to
Germany look very different; an estimated 86%
of refugees accepted by Germany were
Muslims, compared with just 40% of regular
migrants to Germany.
Germany has the largest population and
economy in Europe, is centrally located on the
continent and has policies favorable toward
asylum seekers (for more on EU policies
toward refugees, see sidebar on page 26). The
UK, however, actually was the destination for a
larger number of migrants from outside
Europe overall between mid-2010 and mid-
2016 (1.6 million). The UK voted in a 2016
referendum to leave the EU, which may impact
immigration patterns in the future, but it is
still counted as part of Europe in this report.
Relatively few recent immigrants to the UK
(60,000) were refugees, but more than 1.5
million regular migrants arrived there in
recent years. Overall, an estimated 43% of all
migrants to the UK between mid-2010 and
mid-2016 were Muslims.
UK received largest number of total
immigrants to Europe, 2010-2016
Top 10 destinations of migrants overall
Estimated count % Muslim
United Kingdom 1,600,000 43%
Germany 1,350,000 63
France 790,000 67
Italy 720,000 56
Sweden 450,000 67
Netherlands 310,000 57
Switzerland 280,000 33
Austria 240,000 46
Belgium 230,000 57
Spain 210,000 39
Top 10 destinations of refugees
Germany 670,000 86%
Sweden 200,000 77
Italy 130,000 72
Austria 110,000 72
France 80,000 60
Switzerland 70,000 75
Netherlands 70,000 54
United Kingdom 60,000 72
Belgium 50,000 81
Norway 40,000 73
Top 10 destinations of regular migrants
United Kingdom 1,540,000 42%
France 710,000 68
Germany 680,000 40
Italy 590,000 53
Sweden 250,000 58
Netherlands 240,000 51
Switzerland 210,000 26
Spain 200,000 37
Belgium 170,000 50
Norway 150,000 40
Note: Estimates do not include those asylum seekers who are not
expected to be granted legal status to remain in Europe.
Source: Pew Research Center estimates. See Methodology for details.
“Europe’s Growing Muslim Population”
PEW RESEARCH CENTER

21
PEW RESEARCH CENTER
www.pewresearch.org
Combining Muslim refugees and Muslim regular migrants, Germany was the destination for more
Muslim migrants overall than the UK (850,000 vs. 690,000).
France also received more than half a million Muslim migrants – predominantly regular migrants
– between mid-2010 and mid-2016, while 400,000 Muslims arrived in Italy. The two countries
accepted a combined total of 210,000 refugees (130,000 by Italy and 80,000 by France), most of
whom were Muslims.
Sweden received even more refugees than the UK, Italy and France, all of which have much larger
populations. A large majority of these 200,000 refugees (an estimated 77%) were Muslims;
Sweden also received 250,000 regular migrants, most of whom were Muslims (58%). Overall,
300,000 Muslim migrants – 160,000 of whom were refugees – arrived in Sweden in recent years.
Only Germany, the UK, France and Italy received more Muslim migrants to Europe overall since
mid-2010. But because Sweden is home to fewer than 10 million people, these arrivals have a
bigger impact on Sweden’s overall religious composition than does Muslim migration to larger
countries in Western Europe.
These estimates do not include migration from one EU country to another. Some countries,
particularly Germany, received a large number of regular migrants from within the EU. In fact,
with about 800,000 newcomers from other EU countries, Germany received more intra-EU
migrants than regular migrants from outside the EU. Intra-EU migrants tend to have a similar
religious composition to Europeans overall.

22
PEW RESEARCH CENTER
www.pewresearch.org
The number of Muslim asylum seekers in legal limbo – i.e., those who already have had or are
expected to have their applications for asylum rejected – varies substantially from country to
country, largely because of differences in policies on asylum, variation in the number of
applications received and differing origins of those migrants. Germany, for example, has a high
number of Muslim migrants in legal limbo despite a relatively low rejection rate – mainly because
it has received such a large number of applications for asylum. Germany received about 900,000
applications for asylum from Muslims between mid-2010 and mid-2016, and is projected to
ultimately accept 580,000 and reject roughly 320,000 – or slightly more than one-third
(excluding applications that were withdrawn).
This rejection rate is similar to Sweden’s; Sweden ultimately is expected to reject an estimated
90,000 out of roughly 240,000 Muslim applications (again, excluding withdrawals). France,
meanwhile, is projected to reject three-quarters of applications from Muslims, leaving an “in
limbo” population of 140,000 (out of 190,000 Muslim applications). Italy is expected to reject
about half of Muslim applicants (90,000 out of 190,000 applications), and the UK is projected to
reject 60,000 out of 100,000.
Germany is top European destination for Muslim refugees by a wide margin; UK is
top destination for other Muslim migrants
Estimated counts of Muslims migrating to each destination country, 2010-2016
Top 10 destinations of Muslim migrants Top 10 destinations of
Muslim refugees Top 10 destinations of regular
Muslim migrants
Germany 850,000 Germany 580,000 United Kingdom 650,000
United Kingdom 690,000 Sweden 160,000 France 480,000
France 530,000 Italy 100,000 Italy 310,000
Italy 400,000 Austria 80,000 Germany 270,000
Sweden 300,000 Netherlands 50,000 Sweden 140,000
Netherlands 170,000 France 50,000 Netherlands 120,000
Belgium 130,000 Belgium 40,000 Belgium 90,000
Austria 110,000 United Kingdom 40,000 Spain 70,000
Switzerland 90,000 Switzerland 40,000 Norway 60,000
Norway 90,000 Norway 30,000 Switzerland 60,000
Note: Estimates do not include those asylum seekers who are not expected to be granted legal status to remain in Europe.
Source: Pew Research Center estimates. See Methodology for details.
“Europe’s Growing Muslim Population”
PEW RESEARCH CENTER

23
PEW RESEARCH CENTER
www.pewresearch.org
Data for the 2010 to 2013 period are based on application decision rates. But due to the
combination of still-unresolved applications and lack of comprehensive data on recent decisions
when this analysis took place, rejection patterns for the 2014 to mid-2016 period are estimated
based on 2010 to 2013 rates of rejection for each origin and destination country pair (for details,
see Methodology). There is no religious preference inherent to the asylum regulations in Europe.
However, if religious persecution is a reason for seeking asylum, that context (as opposed to
religious affiliation in and of itself) can be considered in the decision process. Religion is estimated
in this report based on available information about countries of origin and migration flow patterns
by religion – application decisions are not reported by religious group.

24
PEW RESEARCH CENTER
www.pewresearch.org
Sidebar: Iraqi and Syrian refugees perceived as less of a threat in countries where more of
them have sought asylum
Does public opinion toward refugees invariably turn negative as their numbers rise? Apparently not. In some
European countries that have attracted large numbers of refugees from Iraq and Syria, public levels of concern
about these refugees are relatively low. Meanwhile, in some countries where there are fewer refugees from Iraq
and Syria, a much higher share of the public says they pose a “major threat,” according to a 2017 Pew Research
Center survey.
For instance, Germany has been the
primary destination country for
asylum seekers from the Middle
East, receiving 457,000
applications from Iraqis and Syrians
between mid-2010 and mid-2016.
Yet the share of people in Germany
who say “large numbers of refugees
from countries such as Iraq and
Syria” pose a “major threat” is
among the lowest of all European
countries surveyed (28%).
Similarly, in Sweden, just 22% of
the public says these refugees
constitute a “major threat.” Iraqi
and Syrian asylum seekers make up
an even greater share of Sweden’s
population than Germany’s; there
are 139 asylum seekers from these
countries for every 10,000 Swedes.
By contrast, majorities of the public
in Greece (67%), Italy (65%) and
Poland (60%) say large numbers of
refugees from countries such as
Iraq and Syria represent a “major threat,” even though there are relatively few such asylum seekers in these
countries.4 Indeed, there are fewer than 10,000 people from Iraq and Syria seeking asylum in Italy and Poland
combined, representing one or fewer per 10,000 residents in each country.
This pattern is not universal. Hungary received 85,000 applications for asylum from Iraqi and Syrian refugees
between mid-2010 and mid-2016 – among the highest figures in Europe – and most Hungarians (66%) see this
surge of refugees as a major threat. Hungary’s government decided to close its border with Croatia in October
4 Many asylum seekers from North Africa cross the Mediterranean to land in Italy. Italian respondents may have been considering this flow of
potential refugees when answering this survey question.
In countries with more asylum seekers from Iraq and
Syria, perceptions of threat are generally lower
% who say large numbers of refugees from countries such as Iraq and Syria
represent ____, alongside counts of asylum applications from Iraqis and
Syrians between mid-2010 and mid-2016
Major threat
Minor threat
Not a threat
Number of asylum seekers from Iraq and Syria
Asylum seekers per
10,000 residents
Greece 67% 19% 14% 22,000 20
Hungary 66 26 6 85,000 87
Italy 65 23 7 7,000 1
Poland 60 28 10 1,000 0
Spain 42 23 33 10,000 2
France 39 41 20 18,000 3
United Kingdom 36 36 24 17,000 3
Netherlands 31 44 25 41,000 24
Germany 28 49 22 457,000 56
Sweden 22 48 30 138,000 139
Note: In contrast with the rest of this report, total asylum seekers (rather than estimates of
successful refugees) are presented above since respondents may think about reports of asylum
seeker numbers when answering this question.
Source: Pew Research Center’s spring 2017 Global Attitudes Survey.
“Europe’s Growing Muslim Population”
PEW RESEARCH CENTER

25
PEW RESEARCH CENTER
www.pewresearch.org
2015, erecting a fence to keep migrants out. Tens of thousands of applications for asylum in Hungary have been
withdrawn since 2015. (For more on government policies toward migration, see sidebar on page 26.)
Concerns about refugees from Iraq and Syria, most of whom are Muslims, are tied to negative views about
Muslims in general. In all 10 EU countries that were part of a Pew Research Center survey in 2016, people who
have an unfavorable view of Muslims are especially likely to see a threat associated with Iraqi and Syrian
refugees. In the United Kingdom, for example, 80% of those who have an unfavorable opinion of Muslims say
large numbers of refugees from countries such as Iraq and Syria represent a major threat. Among British adults
who view Muslims favorably, just 40% see the refugees as a major threat.

26
PEW RESEARCH CENTER
www.pewresearch.org
Sidebar: EU restrictions on migration tightening after surge
Changing government policies in European countries can have a major impact on migration flows. In recent years,
several European countries – and the European Union itself, acting on behalf of its member states – have
adopted policies that have generally moved to tighten Europe’s borders and to limit flows of migrants.
In 2016, the EU signed a deal with Turkey, a frequent stop for migrants coming from Syria. Under the terms of the
deal, Greece, which shares a border with Turkey, can return to Turkey all new “irregular” or illegal migrants. In
exchange, EU member states pledged to resettle more Syrian refugees living in Turkey and to increase financial
aid for those remaining there. By 2017, the agreement had reduced by 97% the number of migrants coming from
Turkey into Greece, according to the EU migration commissioner.
Another common path for large numbers of migrants to Europe is from sub-Saharan Africa to Italy, where they
primarily arrive by sea from the Libyan coast. To try to stem the tide, Italy has worked with the Libyan coast guard
to develop techniques to stop boats carrying the migrants, among other policies and tactics.
In addition, even Germany – the destination of more recent asylum seekers than any other European country --
has deported some migrants, including to Afghanistan, and moved toward tougher border controls. German
Chancellor Angela Merkel, following a September 2017 election that saw the far-right Alternative for Germany
(AfD) party gain a presence in parliament for the first time, agreed to a limit of 200,000 asylum seekers per year.
Sweden and Austria also have accepted high numbers of refugees, especially relative to their small populations.
But in November 2015, leaders announced a tightening of Sweden’s refugee policy, requiring identity checks to
be imposed on all forms of transportation, and limiting family reunification with refugees. And in an October 2017
election, Austrian voters favored parties that had campaigned on taking a harder line on immigration.
Immigration – and not just by refugees – has been a major campaign issue in several countries, and it was one of
the key factors in the Brexit debate over whether the UK, the destination of more regular migrants than any other
European country in recent years, should remain in the European Union. In the aftermath of the 2016
referendum in which British voters opted to leave the EU, UK government officials have vowed to remove the
country from the freedom-of-movement policy, which allows EU citizens to move to and work in EU member states
without having to apply for visas, in March 2019.

27
PEW RESEARCH CENTER
www.pewresearch.org
Pew Research Center’s three scenarios projecting the future size of the Muslim population in
Europe reflect uncertainty about future migration flows due to political and social conditions
outside of Europe, as well as shifting immigration policies in the region.
These projections start from an estimated baseline of 26 million Muslims in Europe as of 2016,
which excludes asylum seekers who are not expected to gain legal status. Even with no future
migration, Europe’s Muslim population is projected to increase by 10 million by 2050 based on
fertility and age patterns (see page 34). If past levels of regular migration continue in the future –
but with no more asylum seekers — the Muslim population in Europe would increase to nearly 58
million by midcentury (the medium scenario). And if the heavy refugee flows seen in recent years
were to continue in the future on top of regular migration (the high migration scenario), there
would be more than 75 million Muslims in Europe as of 2050.
In all three scenarios, the non-Muslim population in Europe is projected to shrink in total number
between now and 2050.
Effects of migration on European population
Projected population counts by 2050
2010 2016 2050
zero migration 2050
medium migration 2050
high migration
Muslims 19,520,000 25,770,000 35,770,000 57,880,000 75,550,000
Non-Muslims 495,280,000 495,060,000 445,920,000 459,070,000 463,040,000
Total 514,810,000 520,830,000 481,690,000 516,950,000 538,600,000
Note: Europe is defined here as the 28 nations of the EU plus Norway and Switzerland. In zero migration scenario, no migration of any kind takes place to
or from Europe. In medium migration scenario, regular migration continues and refugee flows cease. In high migration scenario, 2014 to mid-2016
refugee inflow patterns continue in addition to regular migration. Estimates do not include those asylum seekers who are not expected to gain legal status
to remain in Europe.
Source: Pew Research Center estimates and projections. See Methodology for details.
“Europe’s Growing Muslim Population”
PEW RESEARCH CENTER

28
PEW RESEARCH CENTER
www.pewresearch.org
As of 2016, France and Germany have the highest numbers of Muslims in Europe. But in the
medium migration scenario, the United Kingdom would surpass them, with a projected 13 million
Muslims in 2050 (compared with a projected 12.6 million in France and 8.5 million in Germany).
This is because the UK was the top destination country for regular Muslim migrants (as opposed to
refugees) between mid-2010 and mid-2016, and the medium scenario assumes that only regular
immigration will continue.
Alternatively, in the high migration scenario, Germany would have by far the highest number of
Muslims in 2050 – 17.5 million. This projection reflects Germany’s acceptance of a large number
of Muslim refugees in recent years. The high scenario assumes that these refugee flows will
continue in the coming decades, not only at the same volume but also with the same religious
composition (i.e., that many refugees will continue to come from predominantly Muslim
countries). Compared with the UK and France, Germany has received fewer regular Muslim
migrants in recent years.
Other, smaller European countries also are expected to experience significant growth in their
Muslim populations if regular migration or an influx of refugees continues (or both). For instance,
in Sweden, the number of Muslims would climb threefold from fewer than a million (810,000) in
2016 to nearly 2.5 million in 2050 in the medium scenario, and fivefold to almost 4.5 million in
the high scenario.
But some countries – even some large ones, like Poland – had very few Muslims in 2016 and are
projected to continue to have very few Muslims in 2050 in all three scenarios. Poland’s Muslim
population was roughly 10,000 in 2016 and would only rise to 50,000 in the medium scenario and
60,000 in the high scenario.

29
PEW RESEARCH CENTER
www.pewresearch.org
Projected Muslim counts over time under different migration scenarios
2010 2016
2050 zero migration
scenario
2050 medium migration
scenario
2050 high migration
scenario
Europe overall 19,520,000 25,770,000 35,770,000 57,880,000 75,550,000
United Kingdom 2,970,000 4,130,000 6,560,000 13,060,000 13,480,000
France 4,720,000
5,720,000
8,600,000
12,630,000
13,210,000
Germany 3,300,000 4,950,000 5,990,000 8,480,000 17,490,000
Italy 2,150,000 2,870,000 4,350,000 7,050,000 8,250,000
Spain 980,000 1,180,000 1,880,000 2,660,000 2,810,000
Sweden 430,000 810,000 1,130,000 2,470,000 4,450,000
Netherlands 990,000 1,210,000 1,510,000 2,200,000 2,790,000
Belgium 650,000 870,000 1,250,000 2,050,000 2,580,000
Switzerland 390,000 510,000 660,000 1,140,000 1,520,000
Norway 180,000 300,000 390,000 980,000 1,320,000
Austria 450,000 600,000 750,000 960,000 2,120,000
Denmark 220,000 310,000 430,000 770,000 1,100,000
Finland 60,000 150,000 220,000 720,000 990,000
Greece 590,000 620,000 590,000 700,000 860,000
Bulgaria 820,000 790,000 700,000 500,000 650,000
Cyprus 280,000 300,000 300,000 390,000 430,000
Portugal 30,000 40,000 50,000 210,000 220,000
Ireland 50,000 70,000 80,000 190,000 200,000
Hungary < 10,000 40,000 30,000 110,000 390,000
Romania 70,000 80,000 70,000 110,000 120,000
Slovenia 70,000 80,000 80,000 100,000 100,000
Czech Republic < 10,000 20,000 20,000 100,000 110,000
Croatia 70,000 70,000 60,000 70,000 70,000
Luxembourg 10,000 20,000 20,000 60,000 90,000
Poland < 10,000 10,000 10,000 50,000 60,000
Malta < 10,000 10,000 10,000 40,000 80,000
Slovakia < 10,000 < 10,000 < 10,000 30,000 40,000
Latvia < 10,000 < 10,000 < 10,000 < 10,000 < 10,000
Lithuania < 10,000 < 10,000 < 10,000 < 10,000 < 10,000
Estonia < 10,000 < 10,000 < 10,000 < 10,000 10,000
Notes: In zero migration scenario, no migration of any kind takes place to or from Europe. In medium migration scenario, regular migration continues and
refugee flows cease. In high migration scenario, 2014 to mid-2016 refugee inflow patterns continue in addition to regular migration. Estimates do not
include those asylum seekers who are not expected to gain legal status to remain in Europe.
Source: Pew Research Center estimates and projections. See Methodology for details.
“Europe’s Growing Muslim Population”
PEW RESEARCH CENTER

30
PEW RESEARCH CENTER
www.pewresearch.org
These growing numbers of
Muslims in Europe, combined
with the projected shrinkage
of the non-Muslim population,
are expected to result in a
rising share of Muslims in
Europe’s overall population in
all scenarios.
Even if every EU country plus
Norway and Switzerland
immediately closed its borders
to any further migration, the
Muslim share of the
population in these 30
countries would be expected
to rise from 4.9% in 2016 to
7.4% in 2050 simply due to
prevailing demographic
trends. In the medium
migration scenario, with
projected future regular
migration but no refugees, the
Muslim share of Europe would
rise to 11.2% by midcentury.
And if high refugee flows were
to continue in future decades,
Europe would be 14% Muslim
in 2050 – a considerable
increase, although still a
relative minority in a
Christian-majority region.
Cyprus currently has the
highest share of Muslims in
the EU (25.4%), due largely to
the historical presence of
predominantly Muslim
The size of the European Muslim population in 2050
depends largely on the future of migration
Estimated and projected Muslim population shares
Country 2010 2016 2050 zero migration
2050 medium migration
2050 high migration
Cyprus 25.3% 25.4% 25.5% 26.6% 28.3%
Sweden 4.6 8.1 11.1 20.5 30.6
France 7.5 8.8 12.7 17.4 18.0
United Kingdom 4.7 6.3 9.7 16.7 17.2
Belgium 6.0 7.6 11.1 15.1 18.2
Norway 3.7 5.7 7.2 13.4 17.0
Netherlands 6.0 7.1 9.1 12.5 15.2
Italy 3.6 4.8 8.3 12.4 14.1
Denmark 4.0 5.4 7.6 11.9 16.0
Finland 1.2 2.7 4.2 11.4 15.0
Europe overall 3.8 4.9 7.4 11.2 14.0
Germany 4.1 6.1 8.7 10.8 19.7
Austria 5.4 6.9 9.3 10.6 19.9
Switzerland 4.9 6.1 8.2 10.3 12.9
Malta 0.2 2.6 3.2 9.3 16.2
Bulgaria 11.1 11.1 12.5 9.2 11.6
Greece 5.3 5.7 6.3 8.1 9.7
Spain 2.1 2.6 4.6 6.8 7.2
Luxembourg 2.3 3.2 3.4 6.7 9.9
Slovenia 3.6 3.8 4.3 5.0 5.2
Ireland 1.1 1.4 1.6 4.3 4.4
Portugal 0.3 0.4 0.5 2.5 2.5
Croatia 1.5 1.6 1.8 2.0 2.1
Hungary 0.1 0.4 0.4 1.3 4.5
Czech Republic 0.1 0.2 0.2 1.1 1.2
Estonia 0.2 0.2 0.2 0.8 1.0
Romania 0.3 0.4 0.4 0.8 0.9
Slovakia 0.0 0.1 0.1 0.6 0.7
Latvia 0.1 0.2 0.2 0.2 0.4
Poland 0.0 0.0 0.0 0.2 0.2
Lithuania 0.1 0.1 0.1 0.1 0.2
Notes: In zero migration scenario, no migration of any kind takes place to or from Europe. In medium
migration scenario, regular migration continues and refugee flows cease. In high migration scenario,
2014 to mid-2016 refugee inflow patterns continue in addition to regular migration. Estimates do not
include those asylum seekers who are not expected to gain legal status to remain in Europe.
Source: Pew Research Center estimates and projections. See Methodology for details.
“Europe’s Growing Muslim Population”
PEW RESEARCH CENTER

31
PEW RESEARCH CENTER
www.pewresearch.org
Turkish Cypriots in the northern part of the island. Migration is not projected to dramatically
change the Muslim share of the population in Cyprus in future scenarios.
In both the zero and medium migration scenarios, Cyprus would maintain the largest Muslim
share in Europe in 2050. But in the high migration scenario, Sweden – which was among the
countries to accept a large number of refugees during the recent surge – is projected to surpass
even Cyprus. In this scenario, roughly three-in-ten Swedes (30.6%) would be Muslim at
midcentury.
Even in the medium scenario, without any future refugee flows, Sweden would be expected to have
the second-largest Muslim share (20.5%) as of 2050. If migration were to stop altogether, a much
smaller percentage of Swedes (11.1%) would be Muslim in 2050.
Migration also drives the projected increase in the Muslim shares of France, the UK and several
other countries. Both France and the UK are expected to be roughly 17% Muslim by 2050 in the
medium scenario, several percentage points higher than they would be if all future migration were
to stop. Because both countries have accepted many more Muslim regular migrants than Muslim
refugees, France and the UK do not vary as greatly between the medium scenario and the high
scenario.
Germany, on the other hand, sees a dramatic difference in its projected Muslim share depending
on future refugee flows. The share of Muslims in Germany (6.1% in 2016) would increase to 10.8%
in 2050 under the medium scenario, in which regular migration continues at its recent pace and
refugee flows stop entirely. But it would rise far more dramatically, to 19.7%, in the high scenario,
if the recent volume of refugee flows continues as well. There is a similar pattern in Austria (6.9%
Muslim in 2016, 10.6% in 2050 in the medium scenario and 19.9% in 2050 in the high scenario).
32
PEW RESEARCH CENTER
www.pewresearch.org
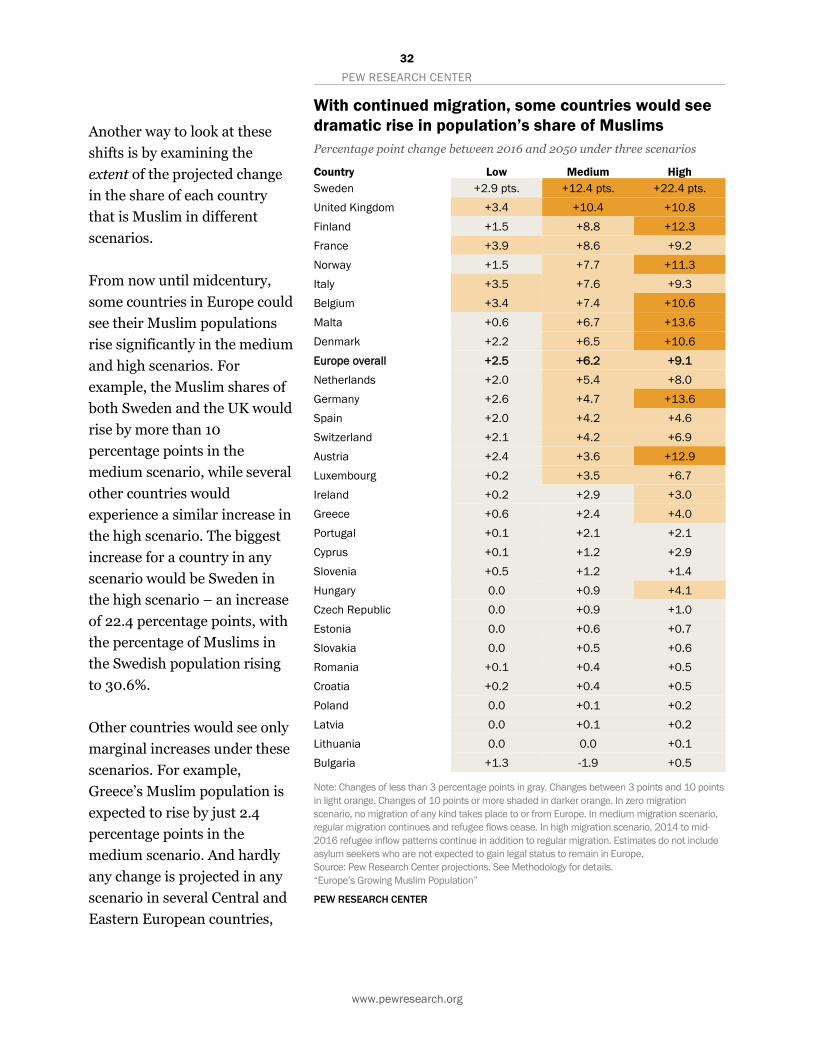
Another way to look at these
shifts is by examining the
extent of the projected change
in the share of each country
that is Muslim in different
scenarios.
From now until midcentury,
some countries in Europe could
see their Muslim populations
rise significantly in the medium
and high scenarios. For
example, the Muslim shares of
both Sweden and the UK would
rise by more than 10
percentage points in the
medium scenario, while several
other countries would
experience a similar increase in
the high scenario. The biggest
increase for a country in any
scenario would be Sweden in
the high scenario – an increase
of 22.4 percentage points, with
the percentage of Muslims in
the Swedish population rising
to 30.6%.
Other countries would see only
marginal increases under these
scenarios. For example,
Greece’s Muslim population is
expected to rise by just 2.4
percentage points in the
medium scenario. And hardly
any change is projected in any
scenario in several Central and
Eastern European countries,
With continued migration, some countries would see
dramatic rise in population’s share of Muslims
Percentage point change between 2016 and 2050 under three scenarios
Country Low Medium High
Sweden +2.9 pts. +12.4 pts. +22.4 pts.
United Kingdom +3.4 +10.4 +10.8
Finland +1.5 +8.8 +12.3
France +3.9 +8.6 +9.2
Norway +1.5 +7.7 +11.3
Italy +3.5 +7.6 +9.3
Belgium +3.4 +7.4 +10.6
Malta +0.6 +6.7 +13.6
Denmark +2.2 +6.5 +10.6
Europe overall +2.5 +6.2 +9.1
Netherlands +2.0 +5.4 +8.0
Germany +2.6 +4.7 +13.6
Spain +2.0 +4.2 +4.6
Switzerland +2.1 +4.2 +6.9
Austria +2.4 +3.6 +12.9
Luxembourg +0.2 +3.5 +6.7
Ireland +0.2 +2.9 +3.0
Greece +0.6 +2.4 +4.0
Portugal +0.1 +2.1 +2.1
Cyprus +0.1 +1.2 +2.9
Slovenia +0.5 +1.2 +1.4
Hungary 0.0 +0.9 +4.1
Czech Republic 0.0 +0.9 +1.0
Estonia 0.0 +0.6 +0.7
Slovakia 0.0 +0.5 +0.6
Romania +0.1 +0.4 +0.5
Croatia +0.2 +0.4 +0.5
Poland 0.0 +0.1 +0.2
Latvia 0.0 +0.1 +0.2
Lithuania 0.0 0.0 +0.1
Bulgaria +1.3 -1.9 +0.5
Note: Changes of less than 3 percentage points in gray. Changes between 3 points and 10 points
in light orange. Changes of 10 points or more shaded in darker orange. In zero migration
scenario, no migration of any kind takes place to or from Europe. In medium migration scenario,
regular migration continues and refugee flows cease. In high migration scenario, 2014 to mid-
2016 refugee inflow patterns continue in addition to regular migration. Estimates do not include
asylum seekers who are not expected to gain legal status to remain in Europe.
Source: Pew Research Center projections. See Methodology for details.
“Europe’s Growing Muslim Population”
PEW RESEARCH CENTER
33
PEW RESEARCH CENTER
www.pewresearch.org
including Poland, Latvia and Lithuania.
In Europe overall, even if all Muslim migration into Europe were to immediately and permanently
stop – a zero migration scenario – the overall Muslim population of Europe would be expected to
rise by 2.5 percentage points, from the current level of 4.9% to 7.4% by 2050. This is because
Muslims in Europe are considerably younger and have a higher fertility rate than other Europeans.
Without any future migrants, these prevailing demographic trends would lead to projected rises of
at least 3 percentage points in the Muslim shares of France, Belgium, Italy and the UK.

34
PEW RESEARCH CENTER
www.pewresearch.org
Migration aside, fertility rates are among the
other dynamics driving Europe’s growing
Muslim population. Europe’s Muslims have
more children than members of other religious
groups (or people with no religion) in the
region. (New Muslim migrants to Europe are
assumed to have fertility rates that match those
of Muslims in their destination countries; for
more details, see Methodology.)
Not all children born to Muslim women will
ultimately identify as Muslims, but children are
generally more likely to adopt their parents’
religious identity than any other.5
Taken as a whole, non-Muslim European
women are projected to have a total fertility rate
of 1.6 children, on average, during the 2015-
2020 period, compared with 2.6 children per
Muslim woman in the region. This difference of
one child per woman is particularly significant
given that fertility among European Muslims
exceeds replacement level (i.e., the rate of
births needed to sustain the size of a
population) while non-Muslims are not having
enough children to keep their population
steady.
The difference between Muslim women and others varies considerably from one European country
to another. In some countries, the disparity is large. The current estimated fertility rate for Muslim
5 In France, roughly 10% of those raised Muslim switch to identify with some other religion or with no religion as adults. Projections for
Western European countries assume that rising cohorts of Muslims will experience a 10% defection rate, drawing on the data from France,
the only Western European country with an adequate sample for measuring switching patterns of those raised Muslim. Patterns of switching
to Islam are captured in country-specific surveys and are incorporated into projections.
In Europe, Muslims projected to have
more children than non-Muslims
Total fertility rates, 2015-2020
Muslims Non-
Muslims Difference
Europe average 2.6 1.6 +1.0
Finland 3.1 1.7 +1.4
United Kingdom 2.9 1.8 +1.0
France 2.9 1.9 +1.0
Sweden 2.8 1.8 +0.9
Belgium 2.6 1.7 +0.9
Denmark 2.5 1.7 +0.8
Netherlands 2.3 1.7 +0.5
Austria 2.2 1.5 +0.7
Norway 2.1 1.8 +0.3
Switzerland 2.1 1.5 +0.6
Germany 1.9 1.4 +0.5
Ireland 1.8 2.0 -0.2
Slovenia 1.7 1.6 +0.1
Bulgaria 1.6 1.6 +0.1
Romania 1.6 1.5 +0.1
Greece 1.5 1.3 +0.2
Note: The total fertility rate (TFR) is an estimate of the number of children
an average woman is expected to have in her lifetime based upon age-
specific fertility patterns observed in a given period. Europe is defined here
as the 28 nations of the EU plus Norway and Switzerland. Countries
lacking sufficient data are not shown. Differences between Muslims and
non-Muslims are computed based on unrounded numbers.
Source: Pew Research Center calculations. See Methodology for details..
“Europe’s Growing Muslim Population”
PEW RESEARCH CENTER

35
PEW RESEARCH CENTER
www.pewresearch.org
women in Finland, for example, is 3.1 children
per woman, compared with 1.7 for non-Muslim
Finns.6
Among Western European countries with the
largest Muslim populations, Germany’s Muslim
women have relatively low fertility, at just 1.9
children per woman (compared with 1.4 for
non-Muslim Germans). Muslims in the UK and
France, meanwhile, average 2.9 children – a full
child more per woman than non-Muslims. This
is one reason the German Muslim population –
both in total number and as a share of the
overall population – is not projected to keep
pace with the British and French Muslim
populations, except in the high scenario (which
includes large future refugee flows).
In some countries, including Bulgaria and Greece, there is little difference in fertility rates between
Muslims and non-Muslims.
Over time, Muslim fertility rates are projected to decline, narrowing the gap with the non-Muslim
population from a full child per woman today to 0.7 children between 2045 and 2050. This is
because the fertility rates of second- and third-generation immigrants generally become similar to
the overall rates in their adopted countries.
The low fertility rate in Europe among non-Muslims is largely responsible for the projected decline
in the region’s total population without future migration.
6 The fertility difference may be even larger between Muslims and non-Muslims in Spain and Italy, but due to concerns about the reliability of
data in these countries, these values are not displayed. In European countries with small Muslim populations, data are not sufficient to
reliably estimate fertility differences.
Estimated total fertility rates (children
born per woman) over time in Europe,
for medium migration scenario
Muslim Non-
Muslim Difference
2015-2020 2.6 1.6 1.0
2020-2025 2.6 1.6 1.0
2025-2030 2.5 1.6 0.9
2030-2035 2.5 1.6 0.9
2035-2040 2.5 1.7 0.8
2040-2045 2.4 1.7 0.8
2045-2050 2.4 1.7 0.7
Note: Europe is defined here as the 28 nations of the EU plus Norway and
Switzerland. In medium migration scenario, regular migration continues
and refugee flows cease. Differences computed based on unrounded
numbers.
Source: Pew Research Center calculations. See Methodology for details.
“Europe’s Growing Muslim Population”
PEW RESEARCH CENTER

36
PEW RESEARCH CENTER
www.pewresearch.org
The age distribution of a religious group also is
an important determinant of demographic
growth.
European Muslims are concentrated in young age
groups – the share of Muslims younger than 15
(27%) is nearly double the share of non-Muslims
who are children (15%). And while one-in-ten
non-Muslim Europeans are ages 75 and older,
this is true of only 1% of Muslims in Europe.

37
PEW RESEARCH CENTER
www.pewresearch.org
As of 2016, there is a 13-year difference
between the median age of Muslims in Europe
(30.4 years of age) and non-Muslim Europeans
(43.8). Because a larger share of Muslims
relative to the general population are in their
child-bearing years, their population would
grow faster, even if Muslims and non-Muslims
had the same fertility rates.
As of 2016, France and Germany have the
greatest age differences in Europe between
Muslims and non-Muslims. The median age of
Muslims in France is just 27, compared with 43
for non-Muslims. Germany has an equally large
gap (31 for Muslims, 47 for non-Muslims).
Muslims are younger than non-Muslims
Median age, 2016
Muslims Non-Muslims Age
difference
Europe average 30 44 -13
France 27 43 -16
Germany 31 47 -16
Belgium 29 43 -14
Italy 33 47 -14
United Kingdom 28 41 -13
Denmark 30 43 -13
Finland 30 43 -13
Switzerland 30 44 -13
Austria 30 45 -15
Malta 30 42 -13
Norway 29 40 -11
Hungary 29 42 -12
Sweden 31 42 -12
Netherlands 33 44 -11
Spain 33 44 -11
Portugal 34 44 -10
Czech Republic 32 42 -10
Ireland 30 37 -7
Slovakia 32 39 -7
Poland 33 40 -7
Bulgaria 39 44 -5
Estonia 37 42 -5
Romania 38 42 -4
Slovenia 39 44 -4
Greece 40 44 -5
Luxembourg 35 40 -5
Croatia 40 43 -3
Latvia 41 43 -3
Cyprus 36 37 0
Lithuania 43 43 0
Note: Europe is defined here as the 28 nations of the EU plus Norway and
Switzerland. Differences computed based on unrounded numbers
Source: Pew Research Center calculations. See Methodology for details.
“Europe’s Growing Muslim Population”
PEW RESEARCH CENTER
38
PEW RESEARCH CENTER
www.pewresearch.org
Appendix A: Methodology
The estimates and projections in this report build upon and update data from the April 2015 Pew
Research Center report, “The Future of World Religions: Population Growth Projections, 2010-
2050.” Soon after the release of that report, a large influx of migrants entered Europe seeking
refugee status. This report includes estimates of how Europe’s Muslim population changed from
mid-2010 to mid-2016, with particular attention to change caused by migration. It also includes
projections of how the size of Europe’s Muslim population may change in the future under
different migration scenarios.
This study takes advantage of more than 2,500 data sources gathered for previous projections,
including censuses, demographic surveys, general population surveys and other studies.
Additionally, this study draws on new data, including asylum-seeker data through mid-2016 from
Eurostat (Europe’s statistical agency), as well as new survey and other government data.
The earliest population figures in this report are for the year 2010. Several Pew Research Center
reports estimated the size of religious populations, including Muslims, in Europe in the year 2010
(“The Future of the Global Muslim Population,” released in 2011; “The Global Religious
Landscape,” released in 2012; and the aforementioned “The Future of World Religions” report,
released in 2015). Each report builds on our prior reports, adjusting estimates based on new data.
While previous religious demography reports classified 50 countries, including Russia, as part of
Europe, this report focuses on a narrower set of 30 countries: the 28 member nations of the
European Union (as of mid-2016), as well as Norway and Switzerland.7 The reasons for the
narrower geographic focus of this report are both substantive and pragmatic. These 30 countries
have received the bulk of Europe’s asylum seekers in recent years and they are the countries for
which data on asylum-seeking patterns are available from Eurostat.
The gold standard for measuring religious identity in this report is a census or survey question that
asks, “What is your religion, if any?” The aim in this report is to measure identity sociologically
7 For the 50-country Europe region in “The Future of World Religions,” the Muslim population in 2010 was estimated to be 43.5 million (when
Cyprus – which is part of the European Union but is not included in Europe in that report – is added in, the total rises to 43.7 million). Of the
remaining 20 countries excluded from this report, the most consequential difference is the absence of Russia, which had an estimated 14.3
million Muslims in 2010.
When Muslim estimates used in “The Future of World Religions” report are aggregated for the 30 countries in this report, the 2010 total is
21.2 million (and 22.2 million for the remaining 20 countries, including Russia). In this report, the 2010 estimate for the size of the Muslim
population in the EU, Norway and Switzerland is 19.5 million. The country estimate that is most different between reports is Germany. “The
Future of World Religions” had a higher estimate of Germany’s Muslim population in 2010 (4.8 million) because it relied on estimates of
Germany’s overall population size that analysis of the 2011 census found to be exaggerated (see discussion of Germany in the next section).
Based on analysis of new government data, this report estimates Germany’s Muslim population in 2010 to have been 3.3 million.

39
PEW RESEARCH CENTER
www.pewresearch.org
rather than theologically. Individuals who self-identify as Muslim are classified as such, regardless
of their level of adherence to what might be considered orthodox belief and practice.
Among the 30 countries covered in this report, about half of these nations directly measure
religious identity in a traditional census or census substitute (such as a large-sample household
survey). Census data are ideal for measuring the size and characteristics of minority populations.
However, in the remaining countries it was necessary to rely on sources that lack the statistical
power of a census. In some countries, general population surveys and demographic surveys
provide sufficient detail on the size and demographic characteristics of Muslim populations.
However, typical general population surveys of 1,000 to 3,000 respondents may under-sample
Muslims, particularly in countries with substantial first-generation immigrant populations, who
may not be fluent in the country’s dominant languages and who may be difficult to capture in
standard sampling frames. Estimates of the size of Muslim populations are based on an
assessment of all available data, including census and survey data, population registers,
immigration data and other reports and sources. Primary sources used for each country are listed
in Appendix B.
40
PEW RESEARCH CENTER
www.pewresearch.org
Special considerations in France and Germany
The sensitivity of measuring religious identity varies across European countries. While many
countries do collect data on Muslims and other religious groups in a census, in other countries,
such as France, governments restrict the collection of religion data on the census and other
government surveys. A 1978 French law imposes limitations on the collection of data pertaining to
race, ethnicity and religious opinions unless the subject gives express consent. While religion has
not been measured on a nationwide government census in France since 1872, it is nonetheless still
possible to measure religious identity and practice in France.
Two French surveys are particularly important for this report. Our baseline estimate of the size of
France’s 2010 Muslim population is based primarily on data from the 2008 “Trajectories and
Origins” survey of more than 20,000 respondents in metropolitan France (which includes
oversamples of first- and second-generation immigrants) sponsored by the French Institute for
Demographic Studies (INED) and the National Institute of Statistics and Economic Studies
(INSEE). Our projection to 2016 was validated against a 2016 survey of 15,459 respondents
sponsored by the Institut Montaigne and carried out by the French Institute of Public Opinion
(Ifop).8
Since Germany’s 1990 reunification, no German census was conducted at all until 2011, when the
country was required to carry out a census as a member of the EU. Prior to 2011, population
estimates had been based on reports of births, deaths and moves (in, out or within Germany),
which people are required to make to their local governments. Individuals who left Germany
without an expectation of returning were not motivated to deregister as residents, and were over-
counted, artificially exaggerating the “healthy-migrant effect” – the puzzlingly high number of
migrants living to be 110. While aggregations of municipal registries were adjusted to account for
some failure to deregister, such adjustments were not sufficient, and the 2011 census revealed that
Germany had overestimated its population by 1.5 million people. Most of these missing people
were migrants who had left Germany without deregistering. The 2011 census was an improvement,
but it did not gather accurate estimates of religious group sizes. Due to a problematic
questionnaire design, religious affiliation was measured with a two-step question, which was
partly optional, and the results were vague and systematically undercounted non-Christians. Our
8 The report based on the Institut Montaigne survey does not estimate the total size of the Muslim population, including children, but data
from the survey confirm that Muslim shares are much higher among the youngest respondents than among older French respondents. If the
incidence of Muslim identity among those younger than 15 years old in France is similar to incidence among respondents ages 15 to 17 in
the survey, then when that incidence rate and the incidence rate for other cohorts in the survey are multiplied by the size of each cohort in
2016, the estimate for the total population is an overall incidence rate slightly below 8%. This report’s projection based on the Trajectories
and Origins baseline is that the Muslim incidence rate reached 8.8% in 2016. Working with the same baseline survey data, French
demographer Michèle Tribalat finds estimates of France’s Muslim population based on the 2016 Ifop/Montaigne data to be conservative.

41
PEW RESEARCH CENTER
www.pewresearch.org
estimates of Germany’s Muslim population in this report build upon new estimates from the
German Federal Office for Migration and Refugees.9
The 2016 estimates and 2050 projections in this report are based on projections from 2010
baseline data. The projections rely on input data about the characteristics of Muslims and non-
Muslims, including age and sex composition, fertility rates, religious switching patterns, and
migration patterns. The next section describes our projection methods. Subsequent sections
provide detail on the input data used in the projections.
The projection approach: Explaining multistate cohort-component projections
The technical calculations for the projections in this report were made by Marcin Stonawski, the
Religion-Education-Demography project leader at the International Institute for Applied Systems
Analysis (IIASA), in consultation with Michaela Potančoková (a research scholar at IIASA) and
Pew Research Center researchers, using an advanced variation of the standard demographic
method of making population projections. The standard approach is called the cohort-component
method, and it takes the age and sex structure of a population into account when projecting the
population forward in time. This has the advantage of recognizing that an initial baseline
population can be relatively “young,” with a high proportion of people in younger age groups or
relatively “old,” with a high proportion of older people.
Cohorts are groups of people that had an experience in a particular time. A birth cohort, the type
of cohort referenced in this context, comprises people born in a certain period. Birth cohorts can
also be described as males or females who have reached a certain age in a particular year. For
example, the cohorts of females ages 15 to 19 in the year 2000 and males ages 15 to 19 in the year
2000 shared the experience of being born between 1981 and 1985.
Components are the three ways in which populations grow or shrink: new entrants via births, exits
via deaths and net changes from migration. Each cohort of the population is projected into the
future by adding likely gains – births and people moving into the country (immigrants) – and
subtracting likely losses – deaths and people moving out (emigrants) – year-by-year. The very
youngest cohorts, those ages 0 to 4, are created by applying age-specific fertility rates to each
female cohort in the childbearing years (ages 15 to 49).
9 “The Future of World Religions” report had a higher estimates of Germany’s Muslim population in 2010 (4.8 million) because it relied on
estimates of Germany’s overall population size that analysis of 2011 census found to be exaggerated (see discussion of Germany in the next
section). Based on analysis of new government data, this report estimates Germany’s Muslim population in 2010 to have been 3.3 million.

42
PEW RESEARCH CENTER
www.pewresearch.org
The cohort-component method has been in existence for more than a century. First suggested by
English economist Edwin Cannan in 1895, then further improved by demographers in the 1930s
and ’40s, it has been widely adopted since World War II. It is used by the United Nations
Population Division, the U.S. Census Bureau, other national statistical offices, and numerous
academic and research institutions.
The advanced variant of this approach, multistate cohort-component projection, became viable
starting in the 1970s thanks to the availability of mainframe computers and work by the American
geographer Andrei Rogers, among others. The multistate approach permits simultaneous
projection of multiple religious groups, taking into account variation by religion in age, sex,
childbearing patterns and propensity and direction of migration. This approach also enables
modeling of religious switching as a transition between religious “states.”
Projection inputs for each country – including differential data by religion on fertility, age
structure, migration and, where available, switching rates – were used for multistate cohort-
component projections going out to the year 2050. Country-level 2010 population data, as well as
fertility and mortality trajectories, are based on the 2015 revision of the United Nations’ World
Population Prospects.
All projection models assume that Muslims and non-Muslims within each country will see their
fertility levels slowly converge toward identical fertility rates by 2110 – a century from the baseline
year of the projections. The assumption that fertility differences gradually will diminish within
countries is based on evidence that when people live in the same economic and social milieu, their
fertility patterns tend to become increasingly similar over time. Studies have shown, for example,
that the offspring of immigrants to the United States and Europe tend to adopt the fertility
patterns of the general population in the countries where they live within a few generations. The
adoption of a relatively conservative 100-year timeframe for within-country convergence reflects
the fact that geographic clustering, differing education levels and other factors may perpetuate
distinctive childbearing patterns among some religious groups.10 At each step of the main
projection scenario, fertility for the total population of a country follows the UN medium variant
assumptions from the 2015 revision.
All projection models extend current religious switching rates in the 22 countries with available
data. Those rates are used to calculate the flow of people in certain age and sex groups who move
between Muslim and non-Muslim categories at each five-year interval of the projections. In
10 In European countries with longstanding Muslim populations that have long co-resided with non-Muslims, Muslims still tend to have
modestly more children than non-Muslims, even after controlling for socioeconomic differences. See Stonawski, Marcin and Michaela
Potančoková and Vegard Skirbekk. 2016. “Fertility Patterns of Native and Migrant Muslims in Europe.” Population, Space and Place.

43
PEW RESEARCH CENTER
www.pewresearch.org
countries for which switching data are available, researchers generated recent rates of switching.
The main projection model assumes that emerging cohorts will switch from their childhood status
at the same rate observed in recent survey data.
Based on projection assumptions from the United Nations Population Division, this study projects
that life expectancy at birth will gradually increase in all countries. There is no high, medium or
low assumption because each country, regardless of its current economic condition, is assumed to
be moving toward better living standards and, therefore, longer life expectancy at birth. Following
the 2015 revision of UN projection assumptions, gender-specific differences in mortality are
introduced based on the UN assumptions of life expectancy by sex.
Disclaimers about projections
Some cautionary words are in order. Population projections are estimates built on current
population data and assumptions about demographic trends. The future of the Muslim population
in Europe will be influenced by economic and political circumstances in Europe that affect the
feasibility and desirability of immigration, as well as circumstances outside Europe, including
political upheavals and armed conflicts that could produce migration surges. The future of Muslim
and non-Muslim populations also may be influenced by scientific discoveries, environmental
challenges and other changes that could shift demographic trends in unforeseen ways.
Estimating migration is difficult. Projecting it is even harder. The mass movement of people can be
the result of several different push and pull factors, including economics, politics and conflict.
Predictions are hard to make and when unexpected migration-related events occur, as they have in
and around Europe during the past few years, sudden change can immediately alter the number,
origins and destinations of future migrants.
These migration uncertainties have been part of academic discussions for years. Most recently
they were studied by Oxford University’s Global Migration Futures project. This study brought
together migration experts to map migration factors that could have the greatest impact on future
migration flows into and out of European countries. They also categorized these factors by their
level of uncertainty. Several of the factors involved changes in Europe’s economy, the political
integration (or potential disintegration) of the European Union and conflict in surrounding
regions.
The projections in this report are not meant to forecast the future, but instead present estimates
for the religious composition of Europe under three migration scenarios to convey a range of “what
if” outcomes.

44
PEW RESEARCH CENTER
www.pewresearch.org
The medium and high projection scenarios in this report assume that in the future, the countries
sending migrants to Europe will remain the same as they have been in recent years. Of course, this
will not be exactly correct. What will be consequential for the size of the Muslim population in
Europe will be whether countries sending migrants in the future continue to be countries with
large Muslim populations. For example, if Turkey replaces Syria as a top country of origin in the
future, this would continue to boost Muslim numbers, whereas an influx of migrants from Canada
or China probably would not have the same effect on Muslim numbers. And while Africa’s large
Muslim populations tend to be geographically closer to Europe than its large Christian
populations, a change in the religious mix of Africans entering Europe could also have a large
impact.
The demographic projections in this report use data on age and sex composition, fertility,
mortality, religious switching and migration. This section describes how these data were gathered
and standardized for use in the projections.
Estimating age and sex structures
Religious affiliation varies by age. In this section, the phrase “age structure” is used as shorthand
to refer to the religious composition of age-sex groups. In order to calculate the median ages of
religious groups and carry out population projections, researchers assembled age structures for
Muslims and non-Muslims in every country. Data on age structures were collected in 20 age
categories (measured in five-year increments with a top value of 95 and above) for males and
females (e.g., males ages 15 to 19), resulting in a total of 40 categories.
Researchers constructed initial age structures by analyzing survey datasets, census datasets and
tables published by census agencies. While censuses usually enumerate religion for the entire
population, including children, general population surveys do not usually include interviews with
children. Since age structures require religious affiliation data for children, children were assigned
religious affiliations when necessary based on the best methods available, including estimating the
religious affiliation of children based on the fertility patterns and religious affiliation of women of
childbearing age, as well as information about the religious affiliation of the youngest respondents
measured in a survey.
Estimating fertility
In many countries, there are substantial differences in the number of children born to Muslim and
non-Muslim women. Furthermore, groups often vary in the share of women in their population

45
PEW RESEARCH CENTER
www.pewresearch.org
who are of childbearing age, and women in some groups may, on average, begin having children at
younger or older ages than do women in other groups. These differences in childbearing patterns,
age structure and fertility timing combine to produce differences in the rates at which babies are
born to Muslims and non-Muslims.
Fertility data were gathered from censuses and surveys, and fertility rates were estimated via
direct and indirect measures. Some censuses and surveys directly measure recent births or the
number of children a woman has ever borne by the time of the survey. In other cases, fertility data
were gathered indirectly, for example, by using data on the age of a mother’s children to estimate
her past birth patterns. These various sources of fertility data were used to estimate age-specific
and total fertility rates for Muslims and non-Muslims in each country.
Fertility rates were estimated for the 2010 to 2015 period and projected forward to subsequent
time periods with differences between Muslims and non-Muslims slowly converging. In the
absence of data on the fertility rates of new Muslim migrants, they are assumed to have the
prevailing fertility rates of other Muslims in their destination countries.
The estimates of differential fertility for Muslims and non-Muslims in the 3o countries of this
report are the same as those estimated for the 2015 “Future of World Religions” report.
Life expectancy
Each country’s projected mortality patterns are based on UN mortality tables for the country.
Little research has been conducted on cross-national differences in mortality and life expectancy
across religious groups. In the absence of better data, the same mortality patterns within each
country are assumed for Muslims and non-Muslims. Muslims in many European nations have less
education than non-Muslims, which could be associated with lower life expectancy, but a large
share of many European Muslim populations are first-generation migrants, and being a first-
generation migrant is sometimes associated with health advantages and longer life expectancy
relative to native-born residents of destination countries (for example, Hispanic migrants to the
United States have advantages compared with those born in the U.S.).
Estimating religious switching
Studies of religious switching indicate that this phenomenon is often concentrated in young adult
years, roughly between the ages of 15 and 29. Change in religious affiliation may occur as young
adults move away from their parents and forge their own identity or partner with someone of a
different affiliation status. While some religious switching may take place at other ages, switching
is modeled as a life course phenomenon in which some young adults change their religious

46
PEW RESEARCH CENTER
www.pewresearch.org
affiliation status. There may be some time periods during which people of all ages are prone to
religious switching, such as when political circumstances in a country encourage or discourage
religious identity or lack of religious identity. Our models do not attempt to include such period
effects.
Sources of switching data
The typical procedure for measuring religious switching is to compare the religion in which a
person grew up with their current religion (when the person is an adult). The best sources of data
on religious switching are nationally representative surveys that ask adults about their current
religion and the religion in which they were raised. These surveys typically have sample sizes
between 1,000 and 3,000 respondents. Unfortunately, while censuses and large-scale
demographic surveys often measure current religious affiliation, they generally do not measure
religious origins, so they cannot be used to directly measure religious switching. (Censuses in
Northern Ireland and Scotland are exceptions.)
In 22 countries (Austria, Belgium, Croatia, Czech Republic, Denmark, Finland, France, Germany,
Hungary, Ireland, Italy, Latvia, Netherlands, Norway, Poland, Portugal, Slovakia, Slovenia, Spain,
Sweden, Switzerland and the United Kingdom), adequate survey data are available on both the
religious upbringing of survey respondents and on current adult religious identity.11 Data on
patterns of switching from non-Muslim religions to Islam come from the International Social
Survey Program. In France, data on patterns of switching out of Islam among those raised Muslim
come from the Trajectories and Origins survey, which found that approximately 10% of those
raised Muslim later switched to no religious affiliation or to some other religion. Because other
European countries lack sufficient data to measure patterns of switching out of Islam, the French
pattern is borrowed for other Western European countries. Thus, in Western Europe, projections
model that roughly 10% of rising cohorts of children raised in Islam will switch out of the faith as
adults.
Since men and women often follow different switching patterns, researchers calculated rates of
switching separately for men and women based on the experiences of adults ages 18 to 54 at the
time of the survey. Researchers assume that the experience of young respondents is the best
source of information about likely switching patterns for emerging generations, so the experiences
of older respondents (those ages 55 and above) are excluded from the analysis. The analysis was
initially restricted to the switching experience of 30- to 54-year-olds; while this restriction allowed
the focus to be on respondents who have recently completed their young adult years, it left less-
11 Switching data were not available for Bulgaria, Cyprus, Estonia, Greece, Lithuania, Luxembourg, Malta and Romania.

47
PEW RESEARCH CENTER
www.pewresearch.org
than-optimal sample sizes. Including the full range of adults ages 18 to 54 in the sample increased
sample sizes and did not appear to compromise the reliability of the switching rates.
The estimates of religious switching for Muslims and non-Muslims in the 3o countries of this
report are the same as those estimated for the 2015 “Future of World Religions” report.
Estimating and projecting the size and religious composition of regular migrants
To model the impact of migration on future religious change, the population projections in this
report required an estimate of the religious composition of recent migrant flows between
countries. That is, how many migrants moving from country X to country Y are Muslim? How
many have some other religious identity? Data on the size and religious breakdown of migrant
flows were pieced together in two steps. The first step was to estimate how many people move to
and from every country in the world. Second, the religious composition of migrants moving
between countries was estimated.
Generally speaking, there is much better information on migrant “stocks” (how many foreign-born
people reside in each country, and where they were born) than there is on migrant “flows” (how
many people move between countries each year). The limited flow data that are available may not
capture all modes of travel or all kinds of international migrants, and it can be difficult to
distinguish short-term travel from long-term migration. Since data on migration flows are
incomplete, data on migrant stocks for 2010 and 2015, estimated by the United Nations, were used
to estimate migration flows for both males and females.12 Demographer Guy Abel developed an
innovative technique to estimate migration flows between countries using this stock data.13 Using
empirical data and observed regularities in the age patterns of migration flows, researchers were
able to disaggregate each estimated total flow into subtotals by five-year age groups. The bilateral
flows estimated based on the UN migrant stock data include asylum-seeking and regular, non-
asylum-seeking migration. Although the UN data include refugee stock estimates from the Office
of the UN High Commissioner for Refugees, the latest UN migrant stock data (released in
December 2015) was prepared too early to capture the large volume of asylum seeker flows that
arrived late in the 2010 to 2015 interval. Since Eurostat provides updated measures of asylum
seeker flows, Eurostat is the source of asylum seeker data in this report and UN data were
manually adjusted to reduce flow estimates (such as the flow from Syria to Sweden) likely to have
been largely composed of asylum seekers. Thus, adjusted data from Guy J. Abel, based on UN
12 This approach is described in Abel, Guy J. Forthcoming. “Estimates of Global Bilateral Migration Flows by Gender between 1960 and 2015.”
International Migration Review. 13 See Abel, Guy J. 2013. “Estimating global migration flow tables using place of birth data.” Demographic Research. Also see Abel, Guy J. and
Nikola Sander. 2014. “Quantifying Global International Migration Flows.” Science.

48
PEW RESEARCH CENTER
www.pewresearch.org
stock estimates, became the source for estimating regular migration; refugee flows, adjusted based
on rejection rates, were estimated separately based on Eurostat asylum seeker data.
Another step was to identify the religious breakdown of migrants. The religious composition of
migrants is not always the same as the religious composition of the general population in their
country of origin. In many cases, members of some religious groups are more likely than others to
leave a country, and they are also more likely to choose certain destination countries. Religious
minorities, in particular, may be disproportionately likely to migrate to a country in which their
religion is in the majority. The religious breakdown for the movement of migrants is drawn from
Pew Research Center’s Global Religion and Migration Database – which has estimates of the
religious breakdown of migrant populations based on global census and survey information.
Using all of this information, researchers calculated migration rates to and from countries by age,
sex and religion. Using migration rates instead of population counts allows for a more dynamic
model of future migration. As countries increase or decrease in size and their religious
composition changes, the migration rates will produce corresponding changes in the size and
religious composition of migrant flows.
Estimating asylum seekers
Estimates of asylum seekers and refugees are based on Pew Research Center’s analysis of Eurostat
data on applications for asylum. Eurostat is Europe’s statistical agency, a central repository for
high-quality population and other data. Eurostat collects data from 28 EU countries and four
European Free Trade Association countries (Iceland, Liechtenstein, Norway and Switzerland) on
the number of applications for asylum submitted, withdrawn, accepted and rejected, and it makes
these counts available to the public. These publicly available counts of asylum seekers by
application status are not linked together, however, so it is not possible for analysts to track
individuals or cohorts of applicants through the process.
The estimates of the number of asylum seekers in this report are based on first-time applications
for asylum, adjusted for withdrawals (read more about withdrawn applications below). First-time
applicants are those who have never previously applied for protection within a country, as opposed
to applicants who are appealing a previous decision.
Applications are made at the individual level, rather than at the household level. Thus, every
person, regardless of age or family relationship, is required to submit an application for asylum.
Applications are not the same as arrivals. It can take several months for newly arrived asylum

49
PEW RESEARCH CENTER
www.pewresearch.org
seekers to make formal applications for asylum and become included in asylum applicant
statistics.
Adjusting for withdrawals
Importantly, applicants are not always applying for protection in Europe for the first time, and
might file applications in more than one country. Countries in the EU, as well as Norway and
Switzerland, have agreed to the Dublin Regulation, which states that asylum seekers are to apply
for refugee status in the first European country they enter. The Dublin Regulation is intended to
prevent multiple applications and reduce the number of asylum seekers moving from country to
country, but it was partially suspended in 2015. Consequently, many asylum-seekers traveled
through Greece, making their way north and west to Germany and other destinations using a route
through several Balkan countries and through EU countries, such as Hungary and Austria. Some
asylum seekers applied for refugee status in transit countries, sometimes unwillingly, before
making it to their desired destination. Many asylum seekers who applied in Hungary and Bulgaria,
for example, later had their applications withdrawn.
To estimate the number of asylum seekers, rates of withdrawn applications by nationality and
country of application pair were calculated from Eurostat’s withdrawn application data and
subtracted from the total number of first-time (within country) applications for asylum.
Applications are withdrawn either intentionally by applicants or automatically whenever an
applicant fails to complete the next step of the application process. These withdrawn applications
are not included in this report’s counts of asylum seekers because it is likely that asylum seekers
who withdrew their applications either left Europe or applied in another country. Removing
withdrawn applications avoids double counting of asylum seekers.
Estimating refugee counts
Refugee counts are estimated based on Eurostat’s quarterly decision data on approved first-time
asylum applications. 14 Rates based on acceptances between origin country X and destination
country Y were applied to every nationality and country of application pair. Applicants who have
been accepted, or whose applications are pending and are likely to be accepted based on
applicants’ nationality and country of application are counted as refugees for Pew Research
Center’s estimates. Acceptance rates were based on all positive decisions. No distinctions are made
based on the kind or length of stay or humanitarian protection status granted to the applicant.
14 Appeal rates are more difficult to generate over a series of years. Application acceptance rates used in this study do not take into account
asylum seekers who may later be granted permission to stay in Europe after an appeal. Consequently, acceptance rates used in this study are
conservative.

50
PEW RESEARCH CENTER
www.pewresearch.org
Estimating the religious composition of asylum seekers
Though religious identity is frequently relevant and provided in asylum applications, applicant
religious affiliation is not collected for its own sake and the publicly available data from Eurostat
do not include information on applicant religion. This report’s estimates of religious affiliation of
asylum seekers and refugees are therefore based on religious demographic data from other
sources.
In some cases, the religious composition of migrants are estimated based on the religious
composition of their country of origin, and the models in this report assume that migrants are a
random selection of people from a country with regard to religion. When available, data on the
religious composition of prior migration flows by nationality and country of application pairs is
utilized from Pew Research Center’s Global Religion and Migration Database. In the latter case,
models assume that recent migrants’ religious composition is more similar to past migrants’ from
that country of origin than the country of origin’s overall religious makeup.
Return migration for refugees
This report does not explicitly model the return migration of refugees after they have settled in
Europe based on the assumption (and historical precedent) that even if conditions improve in the
country they left, most will continue to remain.15 This assumption is based on the experience of
waves of Turks and North Africans who came to Europe during times of labor shortage in the
1950s and 1960s and continued to remain in Europe even when European economies had fewer
jobs for them during the 1970s. As noted by migration scholar Philip Martin, “There is nothing
more permanent than temporary workers.” Even though the motivation among refugees for
coming to Europe may differ than guest workers in earlier decades, refugee families are not
expected to uproot themselves in large numbers to return to their home countries. However, if
countries enforce the temporary legal status of some refugee decisions, then forcible repatriation,
like voluntary returns, could curtail the estimates in this report. While the decision not to model
return migration for refugees could have the effect of inflating future Muslim population
projections to some degree, this bias may be counterbalanced by the conservative treatment of
asylum seekers who are not expected to initially gain legal status to remain in Europe (discussed
below).
15 General migration out of European countries, based on emigration estimates derived from Guy Abel’s analysis of United Nations migration
stock data, is part of all projection scenarios except the no migration scenario. These emigration estimates assume that patterns from the
2010-2015 period will continue.

51
PEW RESEARCH CENTER
www.pewresearch.org
Estimating legal limbo populations
Finally, recent rejection rates recorded by Eurostat were used to estimate the number of people in
Europe who have applied for asylum but have not been and are unlikely to be granted legal refugee
status. This is the population of asylum seekers in legal limbo, for whom the future is uncertain.
Many applicants who are initially rejected will appeal their decisions, and some may eventually be
approved to live and work in Europe as protected refugees. Others will leave, voluntarily or
through forced deportation. Still others will obtain another legal status, for example through
student or worker visa programs. The population of Muslims estimated to be in legal limbo in
2016 is not counted in the estimates or projections in this report. Some will no doubt stay in
Europe, legally or illegally. Not counting this population makes our projections conservative. This
conservative bias may help balance the assumption that refugees granted stay in Europe will not
return (see preceding section).
Generally speaking, most of the 2016 Muslim estimates in this report are the result of projections
from 2010 that account for Muslim and non-Muslim differences in age structure, fertility, religious
switching and regular migration.16 Additionally, the 2016 figures include estimates of Muslim
refugees who came to Europe between mid-2010 and mid-2016. In some cases, 2015 or 2016
government data for Muslim populations were used rather than projections from 2010. For
example, a report from the German Federal Office for Migration and Refugees on the year-end
2015 size of the Muslim population in Germany was the basis for our midyear 2016 estimate in
Germany (our estimate also incorporates growth in the population from the ongoing flow of
refugees in the first half of 2016).
Projection scenarios for 2016 to 2050
To highlight how different migration patterns may change the landscape of Europe’s Muslim
population, the only factor that varies in our 2016 to 2050 projection scenarios is migration. The
zero migration scenario assumes there will be no migration to or from any of the 30 countries after
midyear 2016. Recent history since mid-2016 suggests this scenario will not be a realistic model of
migration outcomes. However, the benefit of this scenario is to highlight how factors other than
migration would be expected to change Muslim population numbers in Europe. The medium
scenario models change that would be expected if only regular migration (i.e., no asylum seeker
flows) continued, following the estimated patterns of country origin and destination flow from the
2010 to 2015 period that were used to make 2010 to 2016 projections. The high migration scenario
16 Projections of religious projections from Pew Research Center typically use five-year projection increments. In order to report on Muslim
population estimates after the large influx of asylum seekers in 2015 and 2016, midyear 2016 estimates are based on refugee estimates,
projections from 2010 to 2015 as well as roughly one-fifth of the change projected for the 2015 to 2020 period.

52
PEW RESEARCH CENTER
www.pewresearch.org
adds an ongoing flow of refugee levels seen between the beginning of 2014 and mid-2016 (i.e., the
continuation of what some have described as a “refugee crisis”) in addition to regular migrants.
For example, in the high scenario, Germany is projected to receive 200,000 Muslim and 30,000
non-Muslim refugees annually because these are the annual average of the estimated numbers of
refugees Germany received from January 2014 through June 2016.
Sex balancing in high migration scenario
Recent flows of asylum seekers have been dominated by young men (roughly 70% to 75% of
asylum seekers have been male). Under certain conditions, refugees who obtain humanitarian
protection status are entitled to family reunification. If current refugees are able to bring family
members to Europe, this could increase the female share of future refugee flows as spouses,
children and other relatives join existing refugees.
Information on the family composition (including marital status) of existing refugees is not
available, so family reunification has to be modeled hypothetically rather than on the particular
family characteristics of refugees. The approach used in these projections assumes many refugees
will seek to bring family members and/or spouses who share their cultural background (i.e., from
their home country) rather than building new family structures in the host society.
Gender balance ratio targets were created for each of the 30 countries based on 2011 population
census data about the stock of the foreign-born population aggregated by Eurostat by nationality
and country of application pairs. This assumes that over time, family reunification for refugees
could permit the gender balance of refugees in a country to approach the gender balance of first-
generation immigrants in the country. Typically, the 2011 stocks of first-generation immigrants in
Europe were roughly gender balanced, with women generally making up 44% to 55% of this
population, depending on the nationality and country of application.
For refugees projected to arrive until mid-2025, the flow of refugees in the 15-to-49 age categories
is assumed to have a gender composition that will complement the stock of refugees who arrived
since 2010 so that by 2025, the overall stock of refugees (since 2010) of reproductive age in each
country will be roughly gender-balanced. After 2025, the high migration scenario assumes that
further flows of refugees will be gender-balanced.
53
PEW RESEARCH CENTER
www.pewresearch.org
Appendix B: Data sources by country
Researchers considered many sources when preparing estimates of the size of Muslim and non-
Muslim populations in each country and looking at the demographic characteristics that influence
the size of each group. These characteristics include age and sex composition, fertility rates,
patterns of migration and religious switching (how many people choose to begin or stop
identifying as Muslim).
The list of general sources below provides bibliographic information for sources widely used across
countries. At the end of this appendix is a detailed list, organized by country, of the primary
sources used to determine each characteristic of religious groups in that country. (The many
supplementary sources consulted for each country are not included.)
As described in the Methodology, data on the size of asylum flows come from Eurostat, and the
size of regular migrant flows is estimated from Pew Research Center analysis of migration flow
data prepared by Guy Abel (based on the 2015 revision of the UN’s International Migrant stock
data). The religion of asylum seekers and regular migrants is estimated based on a combination of
Pew Research Center’s 2012 Global Religion and Migration Database and information about the
religious composition of migrant origin countries.
The sources for data on levels of switching to Islam are 2008 International Social Survey
Programme surveys. In Western European countries, patterns of switching away from Islam to
some other (or no) religion are based on the French pattern measured in the 2008 “Trajectories
and Origins” survey of more than 20,000 respondents in metropolitan France (which includes
oversamples of first- and second-generation immigrants) sponsored by the French Institute for
Demographic Studies (INED) and the National Institute of Statistics and Economic Studies
(INSEE). Most surveys in European countries include too few respondents raised as Muslims to
reliably measure patterns of switching away from Islam.
Fertility estimates used in this report were originally prepared for the 2015 report “The Future of
World Religions: Population Growth Projections, 2010-2050.” Data on the baseline size of overall
country populations, by age and sex, come from the 2015 revision of the UN’s World Population
Prospects.
More information about each type of data is provided in the Methodology.

54
PEW RESEARCH CENTER
www.pewresearch.org
Abel, Guy J. Forthcoming. “Estimates of Global Bilateral Migration Flows by Gender between 1960
and 2015.” International Migration Review.
European Social Survey. Led by Centre for Comparative Social Surveys, City University.
http://www.europeansocialsurvey.org/.
European Values Study. Administered by the European Values Study Foundation at Tilburg
University. http://www.europeanvaluesstudy.eu/.
Eurostat. 2017. Asylum statistics. http://ec.europa.eu/eurostat/statistics-
explained/index.php/Asylum_statistics.
Generations & Gender Programme: Survey Instruments. United Nations.
http://www.unece.org/pau/ggp/welcome.html.
Global Migration Database. Pew Research Center.
http://www.pewforum.org/2012/03/08/religious-migration-exec/.
International Migrant Stock: The 2015 Revision. United Nations Population Division.
http://www.un.org/en/development/desa/population/migration/data/estimates2/estimates15.sh
tml
International Social Survey Program. ISSP Research Group, GESIS Data Archive, Cologne.
http://www.gesis.org/en/issp/issp-home/.
World Population Prospects: The 2015 Revision. United Nations Population Division.
https://esa.un.org/unpd/wpp/publications/.

55
www.pewresearch.org
Religious composition Age and sex Fertility Religion of migrants Switching to Islam
Austria Estimates based on 2001 Census.
Estimates based on 2001 Census.
Data on fertility differences between religious groups based on 2001 Census.
Religion of some incoming migrants is based on Pew Research Center's 2012 Global Religion and Migration Database.
Rates based on 2008 International Social Survey Programme survey.
Belgium Estimates based on 2001 Census.
Estimates based on 2001 Census.
Data on fertility differences between religious groups based on 2001 Generations and Gender Survey.
Religion of incoming migrants is based on the religious composition of the origin country.
Rates based on 2008 International Social Survey Programme survey.
Bulgaria Estimates based on 2011 Census.
Estimates based on 2011 Census.
Data on fertility differences between religious groups based on 2001 Census.
Religion of incoming migrants is based on the religious composition of the origin country.
Data unavailable; no religious switching modeled.
Croatia Estimates based on 2011 Census.
Estimates based on 2011 Census.
Data on fertility differences between religious groups unavailable; same fertility rate used for Muslims and non-Muslims.
Religion of some incoming migrants is based on Pew Research Center's 2012 Global Religion and Migration Database.
Rates based on 2008 International Social Survey Programme survey.
Cyprus Estimates based on weighted average of 2008 European Values Study in Cyprus and 2008 European Values Study in Northern Cyprus.
Estimates based on 2008 European Values Study.
Data on fertility differences between religious groups unavailable; same fertility rate used for Muslims and non-Muslims.
Religion of incoming migrants is based on the religious composition of the origin country, adjusted for selected origin countries.
Data unavailable; no religious switching modeled.
Czech Republic
Estimates based on 2011 Census.
Estimates based on 2011 Census.
Data on fertility differences between religious groups based on 2001 Census.
Religion of incoming migrants is based on the religious composition of the origin country.
Rates based on 2008 International Social Survey Programme survey.
Denmark Estimates based on 2010 Central Population Register (CPR) data prepared by Statistics Denmark.
Estimates based on 2010 Central Population Register (CPR) data prepared by Statistics Denmark.
Data on fertility differences between religious groups based on 2010 Population Register.
Religion of incoming migrants is based on the religious composition of the origin country.
Rates based on 2008 International Social Survey Programme survey.
Estonia Estimates based on 2011 Census.
Estimates based on 2011 Census.
Data on fertility differences between religious groups unavailable; same fertility rate used for Muslims and non-Muslims.
Religion of some incoming migrants is based on Pew Research Center's 2012 Global Religion and Migration Database.
Data unavailable; no religious switching modeled.

56
www.pewresearch.org
Religious composition Age and sex Fertility Religion of migrants Switching to Islam
Finland Estimates based on 2010 Population Information System data prepared by Statistics Finland.
Estimates based on 2010 Population Information System data prepared by Statistics Finland.
Data on fertility differences between religious groups based on 2010 Population Information System.
Religion of incoming migrants is based on the religious composition of the origin country.
Rates based on 2008 International Social Survey Programme survey.
France Estimates based on 2008-2009 Trajectories and Origins Survey conducted by Institut National de la Statistique et des Études Économiques and the Institut National d’études Démographiques.
Estimates based on 2016 survey conducted by the French Institute of Public Opinion for the Institut Montaigne.
Data on fertility differences between religious groups based on 2005 Generations and Gender Survey.
Religion of incoming migrants is based on the religious composition of the origin country.
Rates based on 2008 International Social Survey Programme survey.
Germany Estimates based on 2015 report from the German Federal Office for Migration and Refugees.
Estimates based on 2005 Generations and Gender survey.
Data on fertility differences between religious groups based on 2005 and 2006 Generations and Gender Survey.
Religion of some incoming migrants is based on Pew Research Center's 2012 Global Religion and Migration Database.
Rates based on 2008 International Social Survey Programme survey.
Greece Estimates based on 2001 Census.
Estimates based on 2001 Census.
Data on fertility differences between religious groups based on 2001 Census.
Religion of some incoming migrants is based on Pew Research Center's 2012 Global Religion and Migration Database.
Data unavailable; no religious switching modeled.
Hungary Estimates based on 2011 Census.
Estimates based on 2011 Census.
Data on fertility differences between religious groups based on 2004-2005 Generations and Gender Survey.
Religion of incoming migrants is based on the religious composition of the origin country.
Rates based on 2008 International Social Survey Programme survey.
Ireland Estimates based on 2011 Census.
Estimates based on 2011 Census.
Data on fertility differences between religious groups based on 2006 Census.
Religion of incoming migrants is based on the religious composition of the origin country.
Rates based on 2008 International Social Survey Programme survey.
Italy Estimates based on World Religion Database.
Estimates based on migrant data.
Data on fertility differences between religious groups based on Italian National Institute of Statistics report, "La popolazione straniera residente in Italia as 1 gennaio 2007. Statistiche in Breve."
Religion of incoming migrants is based on the religious composition of the origin country.
Rates based on 2008 International Social Survey Programme survey.

57
www.pewresearch.org
Religious composition Age and sex Fertility Religion of migrants Switching to Islam
Latvia Estimates based on 2000 Census.
Estimates based on Latvia Central Statistical Bureau.
Data on fertility differences between religious groups unavailable; same fertility rate used for Muslims and non-Muslims.
Religion of incoming migrants is based on the religious composition of the origin country.
Rates based on 2008 International Social Survey Programme survey.
Lithuania Estimates based on 2011 Census.
Estimates based on 2011 Census
Data on fertility differences between religious groups unavailable; same fertility rate used for Muslims and non-Muslims.
Religion of incoming migrants is based on the religious composition of the origin country.
Data unavailable; no religious switching modeled.
Luxembourg Estimates based on 2008 European Values Study, adjusted for missing data.
Estimates based on 2008 European Values Study.
Data on fertility differences between religious groups unavailable; same fertility rate used for Muslims and non-Muslims.
Migration in and out of this country was not included in projections.
Data unavailable; no religious switching modeled.
Malta Estimates based on 2008 European Values Study.
Estimates based on 2008 European Values Study.
Data on fertility differences between religious groups unavailable; same fertility rate used for Muslims and non-Muslims.
Migration in and out of this country was not included in projections.
Data unavailable; no religious switching modeled.
Netherlands Estimates based on 2003 Generations and Gender Survey and migrant register.
Estimates based on 2003 Generations and Gender Survey and migrant register.
Data on fertility differences between religious groups based on 2003 Generations and Gender Survey.
Religion of incoming migrants is based on the religious composition of the origin country.
Rates based on 2008 International Social Survey Programme survey.
Norway Estimates based on 2007 register of migrants.
Estimates based on 2007 register of migrants.
Data on fertility differences between religious groups based on 2007-2008 Generations and Gender Survey.
Religion of incoming migrants is based on the religious composition of the origin country.
Rates based on 2008 International Social Survey Programme survey.
Poland Estimates based on 2011 Census.
Estimates based on 2011 Census.
Data on fertility differences between religious groups unavailable; same fertility rate used for Muslims and non-Muslims.
Religion of incoming migrants is based on the religious composition of the origin country.
Rates based on 2008 International Social Survey Programme survey.

58
www.pewresearch.org
Religious composition Age and sex Fertility Religion of migrants Switching to Islam
Portugal Estimates based on 2011 Census.
Estimates based on 2011 Census.
Data on fertility differences between religious groups unavailable; same fertility rate used for Muslims and non-Muslims.
Religion of some incoming migrants is based on Pew Research Center's 2012 Global Religion and Migration Database.
Rates based on 2008 International Social Survey Programme survey.
Romania Estimates based on 2011 Census.
Estimates based on 2011 Census.
Data on fertility differences between religious groups based on 2002 Census.
Religion of some incoming migrants is based on Pew Research Center's 2012 Global Religion and Migration Database.
Data unavailable; no religious switching modeled.
Slovakia Estimates based on 2011 Census.
Estimates based on 2011 Census.
Data on fertility differences between religious groups based on 2001 Census.
Religion of incoming migrants is based on the religious composition of the origin country.
Rates based on 2008 International Social Survey Programme survey.
Slovenia Estimates based on 2002 Census.
Estimates based on 2002 Census.
Data on fertility differences between religious groups based on 2002 Census.
Religion of incoming migrants is based on the religious composition of the origin country.
Rates based on 2008 International Social Survey Programme survey.
Spain Estimates based on 2011 Census and 2010 Municipal Register (Padrón).
Estimates based on 2011 Census and 2010 Municipal Register (Padrón).
Data on fertility differences between religious groups based on 2007 Fertility Survey and 2005-2008 Municipality Register.
Religion of incoming migrants is based on the religious composition of the origin country.
Rates based on 2008 International Social Survey Programme survey.
Sweden Estimates based on 2008 Migrant's Register.
Estimates based on 2008 Migrant's Register.
Data on fertility differences between religious groups based on 2008 Migrant's Register.
Religion of some incoming migrants is based on Pew Research Center's 2012 Global Religion and Migration Database.
Rates based on 2008 International Social Survey Programme survey.
Switzerland Estimates based on 2011 structural survey (sample of approximately 200,000 people).
Estimates based on 2011 structural survey.
Data on fertility differences between religious groups based on 2000 Census.
Religion of some incoming migrants is based on Pew Research Center's 2012 Global Religion and Migration Database.
Rates based on 2008 International Social Survey Programme survey.
United Kingdom
Estimates based on 2011 Census.
Estimates based on 2011 Census.
Data on fertility differences between religious groups based on 2001 Census.
Religion of some incoming migrants is based on Pew Research Center's 2012 Global Religion and Migration Database.
Rates based on 2008 International Social Survey Programme survey.
Related Documents