Biogeosciences, 11, 2519–2530, 2014 www.biogeosciences.net/11/2519/2014/ doi:10.5194/bg-11-2519-2014 © Author(s) 2014. CC Attribution 3.0 License. Biogeosciences Open Access European sea bass, Dicentrarchus labrax, in a changing ocean E. C. Pope 1 , R. P. Ellis 2 , M. Scolamacchia 1 , J. W. S. Scolding 1 , A. Keay 1 , P. Chingombe 3 , R. J. Shields 1 , R. Wilcox 1 , D. C. Speirs 4 , R. W. Wilson 2 , C. Lewis 2 , and K. J. Flynn 1 1 Centre for Sustainable Aquatic Research, Swansea University, Swansea, UK 2 College of Life and Environmental Science, University of Exeter, Exeter, UK 3 Department of Earth, Ocean and Ecological Sciences, School of Environmental Sciences, University of Liverpool, UK 4 Department of Mathematics and Statistics, University of Strathclyde, Glasgow, UK Correspondence to: K. J. Flynn ([email protected]) Received: 7 October 2013 – Published in Biogeosciences Discuss.: 31 October 2013 Revised: 25 March 2014 – Accepted: 26 March 2014 – Published: 12 May 2014 Abstract. Ocean acidification, caused by rising concentra- tions of carbon dioxide (CO 2 ), is widely considered to be a major global threat to marine ecosystems. To investigate the potential effects of ocean acidification on the early life stages of a commercially important fish species, European sea bass (Dicentrarchus labrax), 12 000 larvae were incubated from hatch through metamorphosis under a matrix of two temper- atures (17 and 19 ◦ C) and two seawater pCO 2 levels (am- bient and 1,000 μatm) and sampled regularly for 42 days. Calculated daily mortality was significantly affected by both temperature and pCO 2 , with both increased temperature and elevated pCO 2 associated with lower daily mortality and a significant interaction between these two factors. There was no significant pCO 2 effect noted on larval morphology dur- ing this period but larvae raised at 19 ◦ C possessed signifi- cantly larger eyes and lower carbon:nitrogen ratios at the end of the study compared to those raised under 17 ◦ C. Similarly, when the incubation was continued to post-metamorphic (ju- venile) animals (day 67–69), fish raised under a combina- tion of 19 ◦ C and 1000 μatm pCO 2 were significantly heav- ier. However, juvenile D. labrax raised under this combina- tion of 19 ◦ C and 1000 μatm pCO 2 also exhibited lower aero- bic scopes than those incubated at 19 ◦ C and ambient pCO 2 . Most studies investigating the effects of near-future oceanic conditions on the early life stages of marine fish have used incubations of relatively short durations and suggested that these animals are resilient to ocean acidification. Whilst the increased survival and growth observed in this study supports this view, we conclude that more work is required to investi- gate whether the differences in juvenile physiology observed in this study manifest as negative impacts in adult fish. 1 Introduction Ocean acidification is widely considered as a major threat to marine ecosystems globally (Wood et al., 2008; Doney et al., 2009; Dupont and Pörtner, 2013; Kroeker et al., 2013). Caused by rising concentrations of carbon dioxide (CO 2 ) in the atmosphere, which recently (9 May 2013) exceeded 400 ppm for the first time since records started in 1958 (Showstack, 2013; Mauna Loa Observatory, Hawaii), this phenomenon has led to a 30 % increase in the acidity of surface oceans over the past 200 years (Feely et al., 2009; Dupont and Pörtner, 2013). Assuming anthropogenic CO 2 emissions continue unabated, atmospheric concentrations of CO 2 are projected to reach ca. 940 ppm by 2100 (Vuuren et al., 2011; RCP 8.5 emission scenario), resulting in a con- current shift in seawater carbonate chemistry and a further decrease in surface ocean pH (Meehl et al., 2007). Ocean acidification therefore poses a significant challenge to marine organisms globally, and poignantly, this process is occurring against a background of warming. Sea surface temperatures have increased by 0.74 ◦ C over the past 100 years and global surface temperatures are projected to increase by a further 1–4 ◦ C by the year 2100 (Meehl et al., 2007). Whilst the body of literature that has investigated the im- pact of decreased seawater pH on marine organisms con- tinues to grow exponentially (Gattuso and Hansson, 2011), there is still a dearth of information for other taxa, espe- cially for fish (see recent meta-analysis of ocean acidification studies by Kroeker et al., 2013). Whilst it is undeniably im- portant to study the effects of ocean acidification on groups such as calcifying invertebrates, which are hypothesised to Published by Copernicus Publications on behalf of the European Geosciences Union.

Welcome message from author
This document is posted to help you gain knowledge. Please leave a comment to let me know what you think about it! Share it to your friends and learn new things together.
Transcript
Biogeosciences, 11, 2519–2530, 2014www.biogeosciences.net/11/2519/2014/doi:10.5194/bg-11-2519-2014© Author(s) 2014. CC Attribution 3.0 License.
Biogeosciences
Open A
ccess
European sea bass,Dicentrarchus labrax, in a changing ocean
E. C. Pope1, R. P. Ellis2, M. Scolamacchia1, J. W. S. Scolding1, A. Keay1, P. Chingombe3, R. J. Shields1, R. Wilcox1,D. C. Speirs4, R. W. Wilson2, C. Lewis2, and K. J. Flynn1
1Centre for Sustainable Aquatic Research, Swansea University, Swansea, UK2College of Life and Environmental Science, University of Exeter, Exeter, UK3Department of Earth, Ocean and Ecological Sciences, School of Environmental Sciences, University of Liverpool, UK4Department of Mathematics and Statistics, University of Strathclyde, Glasgow, UK
Correspondence to:K. J. Flynn ([email protected])
Received: 7 October 2013 – Published in Biogeosciences Discuss.: 31 October 2013Revised: 25 March 2014 – Accepted: 26 March 2014 – Published: 12 May 2014
Abstract. Ocean acidification, caused by rising concentra-tions of carbon dioxide (CO2), is widely considered to be amajor global threat to marine ecosystems. To investigate thepotential effects of ocean acidification on the early life stagesof a commercially important fish species, European sea bass(Dicentrarchus labrax), 12 000 larvae were incubated fromhatch through metamorphosis under a matrix of two temper-atures (17 and 19◦C) and two seawaterpCO2 levels (am-bient and 1,000 µatm) and sampled regularly for 42 days.Calculated daily mortality was significantly affected by bothtemperature andpCO2, with both increased temperature andelevatedpCO2 associated with lower daily mortality and asignificant interaction between these two factors. There wasno significantpCO2 effect noted on larval morphology dur-ing this period but larvae raised at 19◦C possessed signifi-cantly larger eyes and lower carbon:nitrogen ratios at the endof the study compared to those raised under 17◦C. Similarly,when the incubation was continued to post-metamorphic (ju-venile) animals (day 67–69), fish raised under a combina-tion of 19◦C and 1000 µatmpCO2 were significantly heav-ier. However, juvenileD. labrax raised under this combina-tion of 19◦C and 1000 µatmpCO2 also exhibited lower aero-bic scopes than those incubated at 19◦C and ambientpCO2.Most studies investigating the effects of near-future oceanicconditions on the early life stages of marine fish have usedincubations of relatively short durations and suggested thatthese animals are resilient to ocean acidification. Whilst theincreased survival and growth observed in this study supportsthis view, we conclude that more work is required to investi-gate whether the differences in juvenile physiology observedin this study manifest as negative impacts in adult fish.
1 Introduction
Ocean acidification is widely considered as a major threatto marine ecosystems globally (Wood et al., 2008; Doney etal., 2009; Dupont and Pörtner, 2013; Kroeker et al., 2013).Caused by rising concentrations of carbon dioxide (CO2)
in the atmosphere, which recently (9 May 2013) exceeded400 ppm for the first time since records started in 1958(Showstack, 2013; Mauna Loa Observatory, Hawaii), thisphenomenon has led to a 30 % increase in the acidity ofsurface oceans over the past 200 years (Feely et al., 2009;Dupont and Pörtner, 2013). Assuming anthropogenic CO2emissions continue unabated, atmospheric concentrations ofCO2 are projected to reach ca. 940 ppm by 2100 (Vuuren etal., 2011; RCP 8.5 emission scenario), resulting in a con-current shift in seawater carbonate chemistry and a furtherdecrease in surface ocean pH (Meehl et al., 2007). Oceanacidification therefore poses a significant challenge to marineorganisms globally, and poignantly, this process is occurringagainst a background of warming. Sea surface temperatureshave increased by 0.74◦C over the past 100 years and globalsurface temperatures are projected to increase by a further1–4◦C by the year 2100 (Meehl et al., 2007).
Whilst the body of literature that has investigated the im-pact of decreased seawater pH on marine organisms con-tinues to grow exponentially (Gattuso and Hansson, 2011),there is still a dearth of information for other taxa, espe-cially for fish (see recent meta-analysis of ocean acidificationstudies by Kroeker et al., 2013). Whilst it is undeniably im-portant to study the effects of ocean acidification on groupssuch as calcifying invertebrates, which are hypothesised to
Published by Copernicus Publications on behalf of the European Geosciences Union.
2520 E. C. Pope et al.: European sea bass in a changing ocean
be particularly vulnerable, there is also a pressing need tounderstand how this environmental change will impact onfish (Bignami et al., 2013), which are important sources ofdietary protein globally (FAO, 2012) and a vital economicresource for countries and communities worldwide.
Although relatively few studies have examined the influ-ence of near-future ocean acidification on marine fish, thisfield has yielded interesting, often seemingly contradictory,results with decreased seawater pH being shown to influ-ence survival (Baumann et al., 2011), growth (Munday et al.,2009a; Frommel et al., 2011, 2013; Bignami et al., 2012), tis-sue health (Frommel et al., 2011), swimming ability (Mun-day et al., 2009b) and behaviour (Simpson et al., 2011; Nils-son et al., 2012; Domenici et al., 2012; Chivers et al., 2013).These variable effects often occur within the very same stud-ies, highlighting a pressing need for further investigationsinto the responses of marine fish to ocean acidification acrossa wide range of species and life history stages.
Adult and juvenile fish possess competent physiologicalprocesses that enable these organisms to acclimate to chang-ing environmental conditions (Ishimatsu et al., 2008) and toseemingly cope with very highpCO2 or correspondingly lowwater pH (Holeton et al., 1983; Claiborne et al., 2002). How-ever, it is hypothesised that early life stages are more vulnera-ble to environmental challenges because they possess highersurface area to volume ratios and have not yet fully devel-oped the homeostatic mechanisms present in adult fish (Hurstet al., 2013). This hypothesis has been supported by experi-mental work. For example, incubating newly fertilised eggs(< 24 h old) of the estuarine fishMenidia beryllina(rearedunder a salinity of 30) under a range of CO2 concentra-tions (∼ 390 to∼ 1100 ppm) until ca. 1 week post-hatch re-vealed a consistent decline in both larval survival and stan-dard length with increasing CO2 concentration (Baumann etal., 2011). Thus, understanding the impact of ocean acidifica-tion on these early stages is crucial to accurately project thelikely sensitivity of commercially important fish species tochanging environmental conditions (Pankhurst and Munday,2011).
The European sea bass,Dicentrarchus labrax, is an impor-tant species for fisheries, and aquaculture in particular. In thedecade between 2002 and 2011, globalD. labraxlandings to-talled 103 476 t, equivalent to ca. 10 % of global aquacultureproduction over the same period (FAO Fisheries and Aqua-culture Department, 2011). Therefore the potential effects ofnear-future oceanic conditions onD. labraxcould have clearecological and economical ramifications. In this study we in-vestigated the effects of near-future warming (+2◦C) and in-creasedpCO2 (1000 µatm, selected to match RCP 8.5 emis-sion scenario; Vuuren et al., 2011) on the early life stages ofthis species measuring larval survival, development rate andmorphology, as well as juvenile development and metabolicrate. For comparison, measurements ofpCO2 recorded as apartial pressure in seawater in µatm typically differ from at-mospheric measurements in ppm by< 3 % at 500 ppm and
<5 % at 800 ppm (see Branch et al., 2013). This study raisedlarge numbers (12 000 initially) of a commercially importantfinfish species from hatching through their entire larval stageunder the multiple stressors/drivers (see Boyd and Hutchins,2012) of near-future temperature andpCO2.
2 Materials and methods
Throughout the following, experimental time is abbreviatedto the formatdx , with x indicating number of day post-hatch.
2.1 Systems
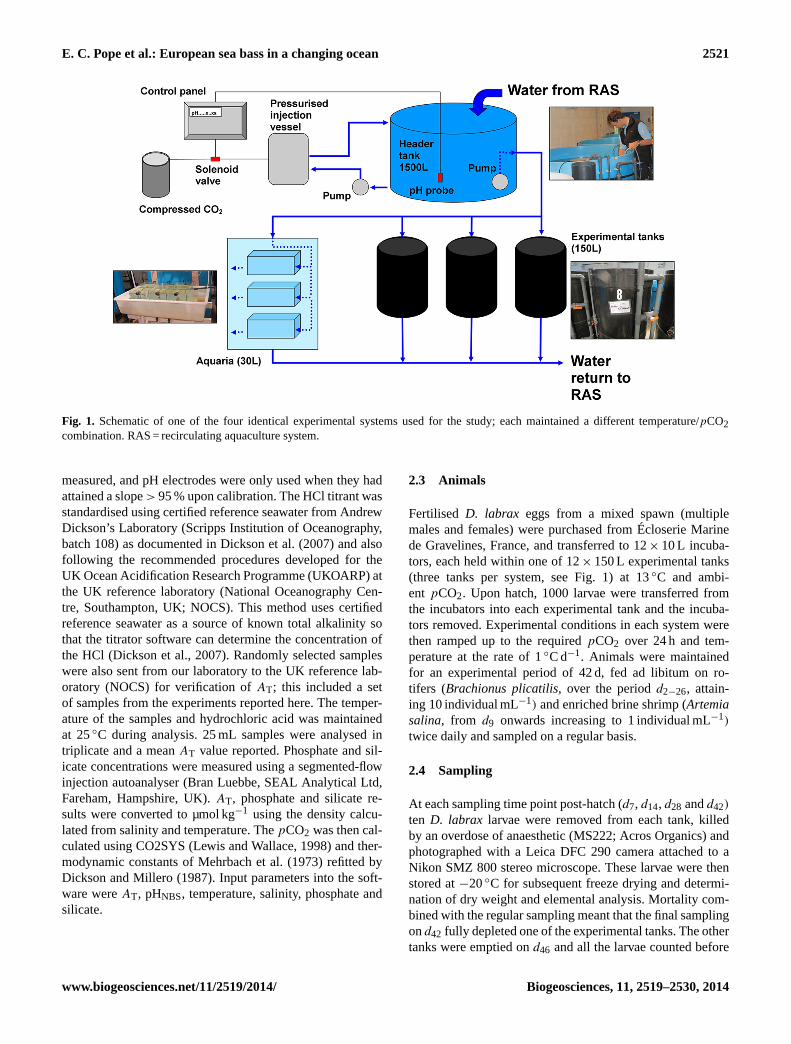
Incubations were carried out in four independent systemswith experimental conditions following a matrix of two tem-peratures (17◦C and 19◦C) and 2pCO2 levels (ambient and1000 µatm) adjusted via injection of compressed CO2 gas(Fig. 1). SeawaterpCO2 was maintained via a computerisedfeedback system which monitored seawater pHNBS and reg-ulated the addition of CO2 (Fig. 1). The adjustment ofpCO2was undertaken in the header tanks flowing into the stockedexperimental tanks. Inevitably, and reflecting the situation innature,pCO2 conditions become elevated around animalsthat are locally contributing to the dissolved CO2 in theirenvironment through respiration. Thus ambient conditionswere observed to be ca. 200 µatmpCO2 higher than would beexpected from purely atmospheric conditions, which was at-tributed to respiration. It was not possible to adjust thepCO2in the experimental tanks because the necessary rates of bub-bling and agitation would be detrimental to the welfare of theanimals.
Experimental tanks were maintained at a salinityof 28.17± 0.22 (mean± 1 standard deviation, SD)measured according to the practical salinity scale,and held within a 12 h light : 12 h dark photoperiod(median light = 6.5 µmol photon m−2 s−1, range = 4.2–12.4 µmol photon m−2 s−1). Temperature and pHNBS weremeasured in each experimental tank daily using a WTW typepH/Cond 340i probe, calibrated daily using a NIST/DIN-traceable calibration (WTW technical buffers at 7.0 and10.0). Total alkalinity (AT), was measured in each headertank less frequently (typically twice a week).
2.2 Water chemistry
AT was measured using open-cell potentiometric titration(Total Alkalinity AS-ALK2 Gran Titration System, ApolloSciTech Inc.) with an incorporated high-precision pH me-ter (Orion 3-star, Thermo Scientific) and ROSS combina-tion pH glass electrode (Orion 8102BNUWP, Thermo Sci-entific). The pH electrode was first calibrated by measuringpH (in mV) of National Bureau of Standards (NBS) buffers(pH 4, 7 and 10). The titrator software (AS-ALK2-Star3,Apollo SciTech Inc.) was then used to calculate the elec-trode performance from the pH of the buffers and potential
Biogeosciences, 11, 2519–2530, 2014 www.biogeosciences.net/11/2519/2014/
E. C. Pope et al.: European sea bass in a changing ocean 2521
Fig. 1. Schematic of one of the four identical experimental systems used for the study; each maintained a different temperature/pCO2combination. RAS = recirculating aquaculture system.
measured, and pH electrodes were only used when they hadattained a slope> 95 % upon calibration. The HCl titrant wasstandardised using certified reference seawater from AndrewDickson’s Laboratory (Scripps Institution of Oceanography,batch 108) as documented in Dickson et al. (2007) and alsofollowing the recommended procedures developed for theUK Ocean Acidification Research Programme (UKOARP) atthe UK reference laboratory (National Oceanography Cen-tre, Southampton, UK; NOCS). This method uses certifiedreference seawater as a source of known total alkalinity sothat the titrator software can determine the concentration ofthe HCl (Dickson et al., 2007). Randomly selected sampleswere also sent from our laboratory to the UK reference lab-oratory (NOCS) for verification ofAT; this included a setof samples from the experiments reported here. The temper-ature of the samples and hydrochloric acid was maintainedat 25◦C during analysis. 25 mL samples were analysed intriplicate and a meanAT value reported. Phosphate and sil-icate concentrations were measured using a segmented-flowinjection autoanalyser (Bran Luebbe, SEAL Analytical Ltd,Fareham, Hampshire, UK).AT, phosphate and silicate re-sults were converted to µmol kg−1 using the density calcu-lated from salinity and temperature. ThepCO2 was then cal-culated using CO2SYS (Lewis and Wallace, 1998) and ther-modynamic constants of Mehrbach et al. (1973) refitted byDickson and Millero (1987). Input parameters into the soft-ware wereAT, pHNBS, temperature, salinity, phosphate andsilicate.
2.3 Animals
Fertilised D. labrax eggs from a mixed spawn (multiplemales and females) were purchased from Écloserie Marinede Gravelines, France, and transferred to 12× 10 L incuba-tors, each held within one of 12× 150 L experimental tanks(three tanks per system, see Fig. 1) at 13◦C and ambi-ent pCO2. Upon hatch, 1000 larvae were transferred fromthe incubators into each experimental tank and the incuba-tors removed. Experimental conditions in each system werethen ramped up to the requiredpCO2 over 24 h and tem-perature at the rate of 1◦C d−1. Animals were maintainedfor an experimental period of 42 d, fed ad libitum on ro-tifers (Brachionus plicatilis, over the periodd2−26, attain-ing 10 individual mL−1) and enriched brine shrimp (Artemiasalina, from d9 onwards increasing to 1 individual mL−1)
twice daily and sampled on a regular basis.
2.4 Sampling
At each sampling time point post-hatch (d7, d14, d28 andd42)
ten D. labrax larvae were removed from each tank, killedby an overdose of anaesthetic (MS222; Acros Organics) andphotographed with a Leica DFC 290 camera attached to aNikon SMZ 800 stereo microscope. These larvae were thenstored at−20◦C for subsequent freeze drying and determi-nation of dry weight and elemental analysis. Mortality com-bined with the regular sampling meant that the final samplingond42 fully depleted one of the experimental tanks. The othertanks were emptied ond46 and all the larvae counted before
www.biogeosciences.net/11/2519/2014/ Biogeosciences, 11, 2519–2530, 2014
2522 E. C. Pope et al.: European sea bass in a changing ocean
being returned. For comparative purposes, the number of lar-vae in each tank ond42 was calculated from thed46 valuesand any mortality recorded betweend42 andd46. Larvae weremaintained under experimental conditions for a further 35days (tod80).
The daily mortality rate,Z (d−1), was calculated using
Nt = N0e−Zt
−
n∑i=1
rie−Z(t−ti ). (1)
Here,N0 is the number of animals stocked into the tank,Ntis the number of larvae in the tank at timet and a number (ri)of larvae were sampled at each sampling time (ti).
Larval development was evaluated from the micrographs,with larval morphometric analysis and gut contents quanti-fied using Leica Application Suite software, v3.8. Yolk sacvolume was estimated from the length (L) and height (W ) ofthe sac using the formula for a spheroid,V = LH2 (Blaxterand Hempel, 1963) and the volume of oil droplets calculatedfrom the formula for a sphere (πr3 wherer = droplet radius).
Specific growth rate (µ, d−1) was calculated from Eq. (2),whereWi = dry weight atti andWj was the dry weight attj :
µ =Ln (Wi) − Ln (Wj )
ti − tj(2)
2.5 Weaning trial
The period when cultured fish are weaned onto dry foodis typified by higher mortality. To investigate possible ef-fects of experimental ocean acidification conditions in com-bination with this additional stressor, six glass aquaria wereconnected to the two systems set to 19◦C (ambient and1000 µatmpCO2, three aquaria each). Fifty larvae (d49 post-hatch) were then transferred from each 19◦C tank into acorresponding glass aquarium. Only the 19◦C systems wereused for this work. The larvae were then gradually weanedonto dry food over 7 d and maintained for a total of 26 d (lar-vae wered75 post-hatch at the end of the weaning trial) withmortality recorded daily.
2.6 Respirometry
On d67–69, post-metamorphic, juvenileD. labraxwere takenfrom two tanks per treatment to determine their individ-ual routine metabolic rate (RMR) and maximal metabolicrate (MMR). Custom built, closed re-circulating respirom-eters (75 mL) were used to measure water oxygen concen-tration. Water was pumped through each respirometer viaa small, closed, external circuit using a peristaltic pump(75± 0.5 mL min−1; model 2058, Watson Marlow Pumps,Falmouth, UK) and tubing with low oxygen permeabil-ity (Masterflex tygon tubing). This ensured sufficient wa-ter movement throughout the chamber and even distribu-tion of oxygen within the respirometer. Preliminary exper-iments were conducted using hypoxic seawater (ca. 20 %
oxygen saturation) over a 4 h period to confirm that no oxy-gen diffused into the respirometer during an experimentalrun. (Note: experimental oxygen consumption measurementswere run for a maximum period of 20 min.) Respirometerswere housed in re-circulating water baths set to either 17◦C(±0.1◦C) or 19◦C (±0.1◦C) during oxygen consumptionmeasurements.
Water oxygen concentration was measured using a four-channel Firesting O2 fibre-optic oxygen meter (Pyro-Science, Germany), fitted with retractable needle-type fibre-optic oxygen probes (Model OXYR50, Pyro-Science, Ger-many) and an integrated temperature sensor (Model TDIP15,Pyro-science, Germany). Juvenile fish were fasted overnightbefore being placed in the respirometers and allowed to ac-climate (4 h) prior to measuring RMR (defined as allow-ing low levels of spontaneous activity; Burton et al., 2011).Fish from each experimental tank (weight range: 52–521 mgwet weight; WW) were individually placed into separaterespirometers. By this time (d67–69), some of the experimen-tal tanks were empty so only two experimental tanks wereused from each treatment. Eight fish were taken from eachexperimental tank, except for Tank 8 (17◦C, ambientpCO2),which supplied only four animals. Each respirometer wasconnected to the fish’s tank of origin during the following 4 hacclimation to ensure conditions were maintained under thecorrect temperature andpCO2 levels, and also that oxygendid not drop below 95 % oxygen saturation. The respirome-ters were covered in foil when they contained an animal toreduce light levels and disturbance. After acclimation, therespirometers were disconnected from these tanks so thatmeasurements could be taken, with water circulation main-tained using the peristaltic pump. The initial oxygen readingwas recorded no longer than 2 min after the respirometer wasdisconnected from the acclimation set-up. Measurements ofroutine oxygen consumption were made over the course of20 min, with water oxygen content measured within each in-dividual respirometer every 2 min. Following the completionof oxygen consumption measurements, the animals were re-moved from the respirometer, euthanised as described earlier,rinsed briefly in fresh water to remove external salts, blotteddry and weighed (WW).
To measure MMR in juvenile sea bass, individuals wereexhaustively exercised using a burst swimming protocol sim-ilar to that described by Killen et al. (2007), using small,open, circular swim chambers similar to those designed byNilsson et al. (2007). Briefly, eight fish (weight range: 58–649 mg WW) were collected from two experimental tanksper treatment and placed individually into swim chambers;only four fish were available from Tank 8. Swim chamberswere filled with water from the experimental tank from whichthe fish originated to ensure the correct temperature,pCO2and oxygen levels. Swim chambers were placed on a mag-netic stirrer, with water speed regulated by a stirring magnetin the bottom of each chamber. No attempt was made to cal-ibrate the speed of the water current during the experiment
Biogeosciences, 11, 2519–2530, 2014 www.biogeosciences.net/11/2519/2014/
E. C. Pope et al.: European sea bass in a changing ocean 2523
because the small size and circular shape of swim chambersmeant that flow rate would have varied between the inner andouter edges of the chamber (Nilsson et al., 2007). However,as a burst swimming protocol was used rather than measuringcritical swimming speed (Ucrit), absolute speed is of little im-portance as fish were swam to exhaustion. Water motion wasset in place once the fish were placed in the swim chambersand the fish began to swim against the current. The speedwas set to a point at which the fish began to perform bursttype swimming and this speed was maintained until the fishreached exhaustion (when they were unable to maintain theirposition in the water column, either resting on the bottomor the side of the swim chamber; this was usually achievedwithin 7–10 min). Fish were removed from swim chambersimmediately after reaching exhaustion, briefly exposed to air(30 s; Roche et al., 2013), and then placed in respirometerswith oxygen consumption recorded each minute over the first10 min of recovery. This method of measuring MMR usesthe excess post-exercise oxygen consumption (EPOC) prin-ciple (Gaesser and Brooks, 1984). Oxygen concentration wasshown to decrease at a constant linear rate during this recov-ery period, and therefore maximal oxygen consumption wascalculated using the data across the entire 10 min recoveryperiod.
Rates of oxygen consumption (mg O2 h−1) were calcu-lated during each trial using a linear regression of the data.Data were then normalised against WW to account formetabolic scaling. Whilst much uncertainty surrounds the ef-fects of body size on metabolic rate in teleosts, and specifi-cally the precise value of the metabolic scaling coefficient,we used a metabolic scaling exponent of 0.8, as proposed forjuvenile fish (Clarke and Johnston, 1999) using
LnY = Lna + b × LnM (3)
where LnY is the natural log of the metabolic rate (RMRor MMR), LnM is natural log of body mass (WW, g),bis the scaling exponent and Lna is the natural log of mea-sured MO2 (mg O2 h−1). This value was then normalised toa 300 mg fish. The factorial aerobic scope (FAS) was calcu-lated as mean MMR/RMR.
2.7 Carbon-nitrogen analysis
Freeze-dried samples were used for elemental analysis to in-vestigate the carbon and nitrogen content of animals dur-ing the trial. Samples were homogenised using a pestleand mortar and then placed overnight in a dessicator. Sam-ples (weight range: 0.255–0.330 mg) were then weighed intotin capsules (Elemental Microanalysis, Okehampton, UK),sealed, and analysed using an ANCA GSL elemental anal-yser interfaced with a PDZ Europa 20/20 isotope ratio massspectrometer. Sample run time was typically 12 min; eightstandards (isoleucine: 1.5–50 µg N, 5–250 µg C) were run atthe beginning of the run and four standards were run every12 samples to enable correction for any drift.
2.8 Statistical analysis
Data were analysed using GraphPad Prism 6 for Windows(GraphPad Software, San Diego, USA). Data were analysedusing one- or two-way ANOVA, matched by tank where ap-propriate.
3 Results
Full data have been logged with BODC (Pope et al., 2014).In the text that follows, tables and figures located in the Sup-plement PDF file are labelled with the prefix “S”.
3.1 Main incubation (d0–42)
Table 1 shows experimental conditions and mean measure-ments of pH, temperature andAT, and calculatedpCO2 val-ues over the duration of the experiment. Hatching occurredunder ambient conditions, with 81± 15.3 % (mean± 1 SD)of larvae hatching successfully. Mean yolk sac volume athatch was 0.360± 0.075 mm3 and yolk sacs were fully ab-sorbed in all larvae by the next sampling time (d7 post-hatch).Oil droplets, which are used after yolk reserves, were visi-ble atd7 but there was no significantpCO2 or temperatureeffect on their residual volumes (two-way ANOVA, Supple-ment Table S1 and Fig. S1).
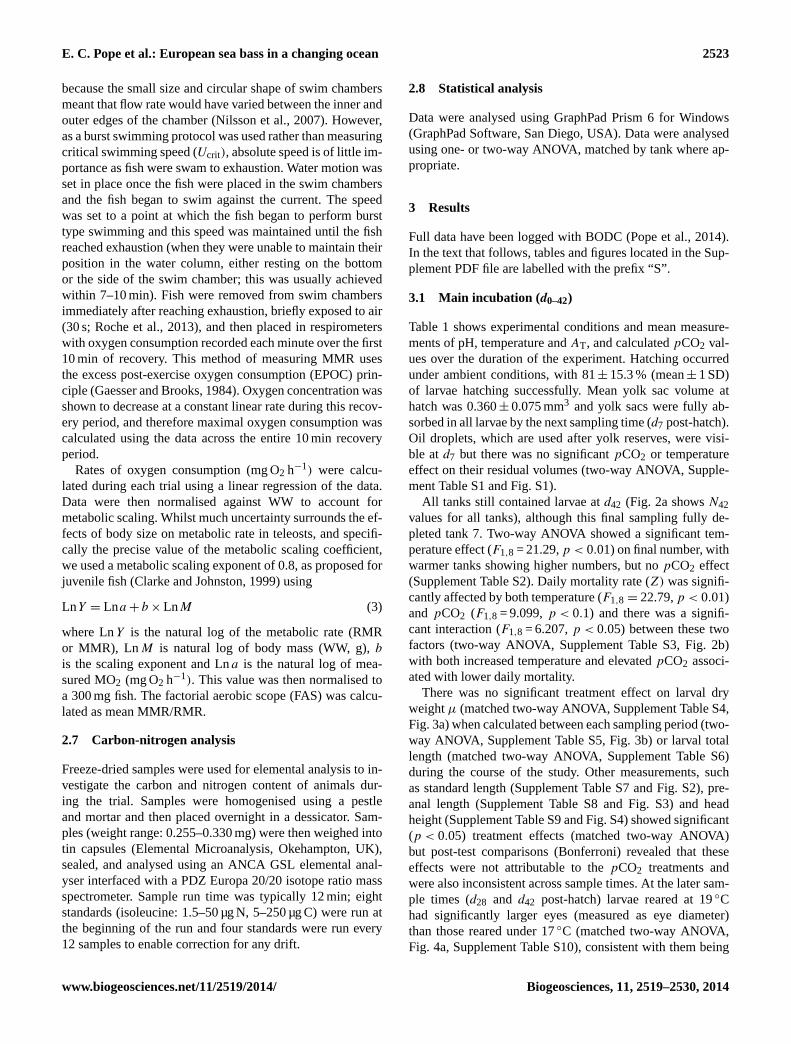
All tanks still contained larvae atd42 (Fig. 2a showsN42values for all tanks), although this final sampling fully de-pleted tank 7. Two-way ANOVA showed a significant tem-perature effect (F1,8 = 21.29,p < 0.01) on final number, withwarmer tanks showing higher numbers, but nopCO2 effect(Supplement Table S2). Daily mortality rate (Z) was signifi-cantly affected by both temperature (F1,8 = 22.79,p < 0.01)and pCO2 (F1,8 = 9.099,p < 0.1) and there was a signifi-cant interaction (F1,8 = 6.207,p < 0.05) between these twofactors (two-way ANOVA, Supplement Table S3, Fig. 2b)with both increased temperature and elevatedpCO2 associ-ated with lower daily mortality.
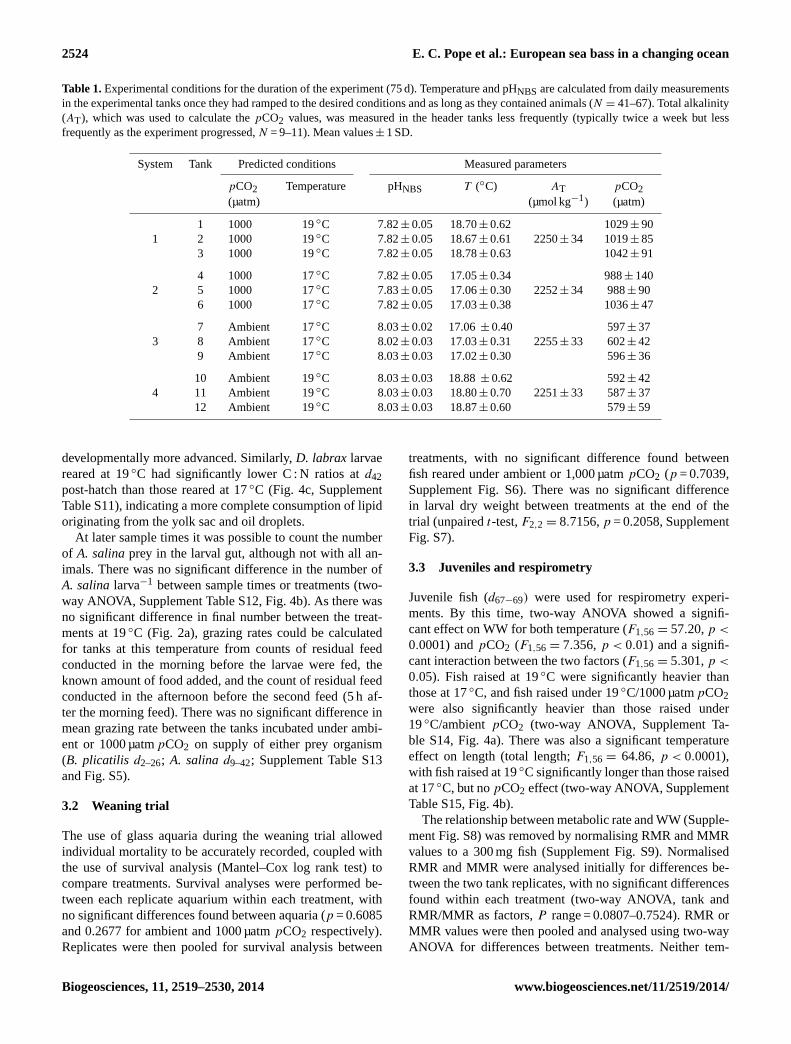
There was no significant treatment effect on larval dryweightµ (matched two-way ANOVA, Supplement Table S4,Fig. 3a) when calculated between each sampling period (two-way ANOVA, Supplement Table S5, Fig. 3b) or larval totallength (matched two-way ANOVA, Supplement Table S6)during the course of the study. Other measurements, suchas standard length (Supplement Table S7 and Fig. S2), pre-anal length (Supplement Table S8 and Fig. S3) and headheight (Supplement Table S9 and Fig. S4) showed significant(p < 0.05) treatment effects (matched two-way ANOVA)but post-test comparisons (Bonferroni) revealed that theseeffects were not attributable to thepCO2 treatments andwere also inconsistent across sample times. At the later sam-ple times (d28 and d42 post-hatch) larvae reared at 19◦Chad significantly larger eyes (measured as eye diameter)than those reared under 17◦C (matched two-way ANOVA,Fig. 4a, Supplement Table S10), consistent with them being
www.biogeosciences.net/11/2519/2014/ Biogeosciences, 11, 2519–2530, 2014
2524 E. C. Pope et al.: European sea bass in a changing ocean
Table 1.Experimental conditions for the duration of the experiment (75 d). Temperature and pHNBS are calculated from daily measurementsin the experimental tanks once they had ramped to the desired conditions and as long as they contained animals (N = 41–67). Total alkalinity(AT), which was used to calculate thepCO2 values, was measured in the header tanks less frequently (typically twice a week but lessfrequently as the experiment progressed,N = 9–11). Mean values± 1 SD.
System Tank Predicted conditions Measured parameters
pCO2 Temperature pHNBS T (◦C) AT pCO2(µatm) (µmol kg−1) (µatm)
1 1000 19◦C 7.82± 0.05 18.70± 0.62 1029± 901 2 1000 19◦C 7.82± 0.05 18.67± 0.61 2250± 34 1019± 85
3 1000 19◦C 7.82± 0.05 18.78± 0.63 1042± 91
4 1000 17◦C 7.82± 0.05 17.05± 0.34 988± 1402 5 1000 17◦C 7.83± 0.05 17.06± 0.30 2252± 34 988± 90
6 1000 17◦C 7.82± 0.05 17.03± 0.38 1036± 47
7 Ambient 17◦C 8.03± 0.02 17.06± 0.40 597± 373 8 Ambient 17◦C 8.02± 0.03 17.03± 0.31 2255± 33 602± 42
9 Ambient 17◦C 8.03± 0.03 17.02± 0.30 596± 36
10 Ambient 19◦C 8.03± 0.03 18.88± 0.62 592± 424 11 Ambient 19◦C 8.03± 0.03 18.80± 0.70 2251± 33 587± 37
12 Ambient 19◦C 8.03± 0.03 18.87± 0.60 579± 59
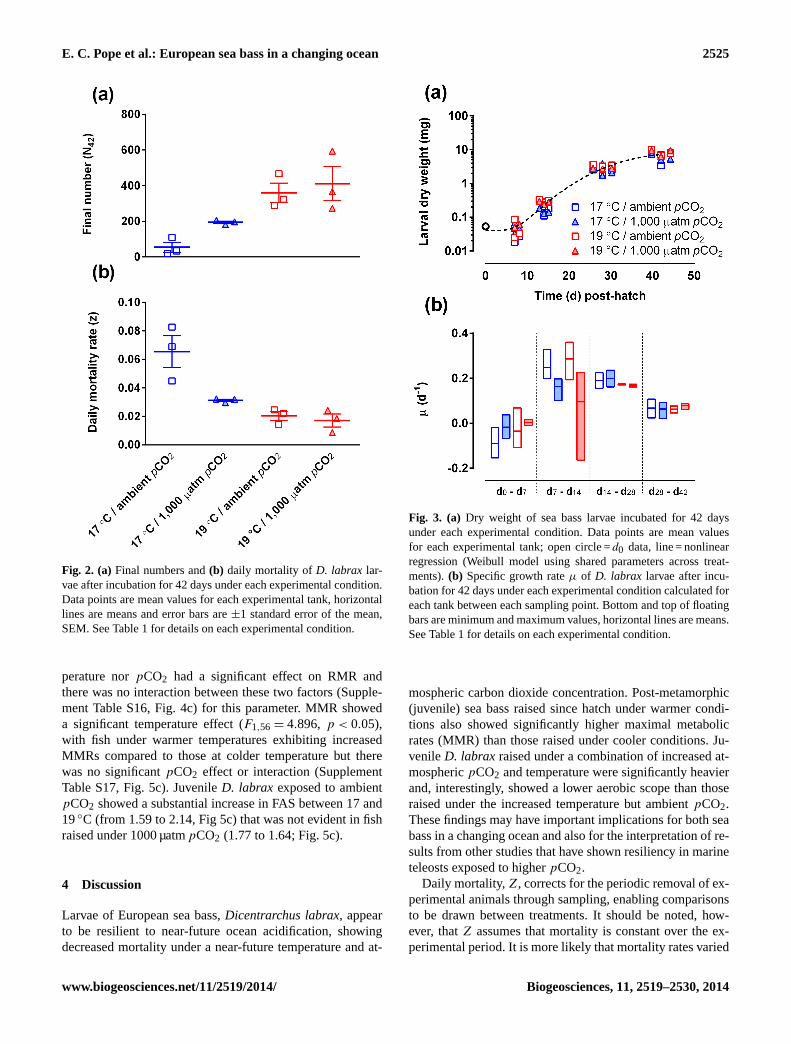
developmentally more advanced. Similarly,D. labrax larvaereared at 19◦C had significantly lower C : N ratios atd42post-hatch than those reared at 17◦C (Fig. 4c, SupplementTable S11), indicating a more complete consumption of lipidoriginating from the yolk sac and oil droplets.
At later sample times it was possible to count the numberof A. salinaprey in the larval gut, although not with all an-imals. There was no significant difference in the number ofA. salinalarva−1 between sample times or treatments (two-way ANOVA, Supplement Table S12, Fig. 4b). As there wasno significant difference in final number between the treat-ments at 19◦C (Fig. 2a), grazing rates could be calculatedfor tanks at this temperature from counts of residual feedconducted in the morning before the larvae were fed, theknown amount of food added, and the count of residual feedconducted in the afternoon before the second feed (5 h af-ter the morning feed). There was no significant difference inmean grazing rate between the tanks incubated under ambi-ent or 1000 µatmpCO2 on supply of either prey organism(B. plicatilis d2–26; A. salinad9–42; Supplement Table S13and Fig. S5).
3.2 Weaning trial
The use of glass aquaria during the weaning trial allowedindividual mortality to be accurately recorded, coupled withthe use of survival analysis (Mantel–Cox log rank test) tocompare treatments. Survival analyses were performed be-tween each replicate aquarium within each treatment, withno significant differences found between aquaria (p = 0.6085and 0.2677 for ambient and 1000 µatmpCO2 respectively).Replicates were then pooled for survival analysis between
treatments, with no significant difference found betweenfish reared under ambient or 1,000 µatmpCO2 (p = 0.7039,Supplement Fig. S6). There was no significant differencein larval dry weight between treatments at the end of thetrial (unpairedt-test,F2,2 = 8.7156,p = 0.2058, SupplementFig. S7).
3.3 Juveniles and respirometry
Juvenile fish (d67−69) were used for respirometry experi-ments. By this time, two-way ANOVA showed a signifi-cant effect on WW for both temperature (F1,56 = 57.20,p <
0.0001) andpCO2 (F1,56 = 7.356,p < 0.01) and a signifi-cant interaction between the two factors (F1,56 = 5.301,p <
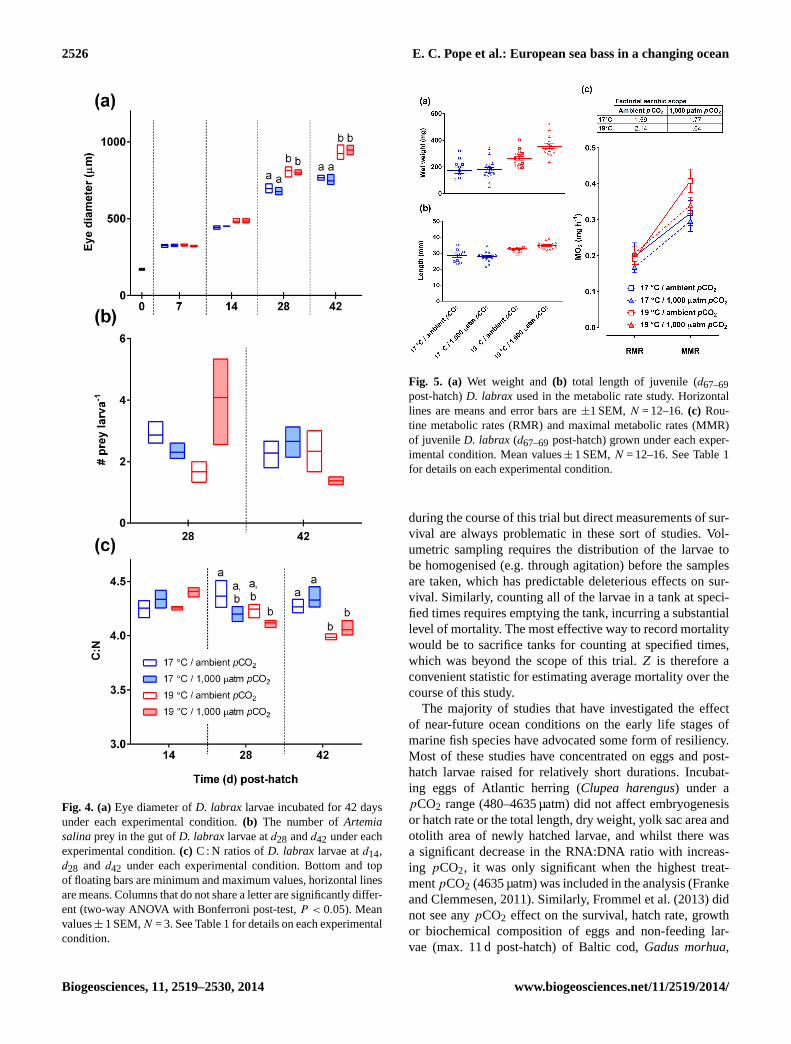
0.05). Fish raised at 19◦C were significantly heavier thanthose at 17◦C, and fish raised under 19◦C/1000 µatmpCO2were also significantly heavier than those raised under19◦C/ambientpCO2 (two-way ANOVA, Supplement Ta-ble S14, Fig. 4a). There was also a significant temperatureeffect on length (total length;F1,56 = 64.86,p < 0.0001),with fish raised at 19◦C significantly longer than those raisedat 17◦C, but nopCO2 effect (two-way ANOVA, SupplementTable S15, Fig. 4b).
The relationship between metabolic rate and WW (Supple-ment Fig. S8) was removed by normalising RMR and MMRvalues to a 300 mg fish (Supplement Fig. S9). NormalisedRMR and MMR were analysed initially for differences be-tween the two tank replicates, with no significant differencesfound within each treatment (two-way ANOVA, tank andRMR/MMR as factors,P range = 0.0807–0.7524). RMR orMMR values were then pooled and analysed using two-wayANOVA for differences between treatments. Neither tem-
Biogeosciences, 11, 2519–2530, 2014 www.biogeosciences.net/11/2519/2014/
E. C. Pope et al.: European sea bass in a changing ocean 2525
Fig. 2. (a) Final numbers and(b) daily mortality of D. labrax lar-vae after incubation for 42 days under each experimental condition.Data points are mean values for each experimental tank, horizontallines are means and error bars are±1 standard error of the mean,SEM. See Table 1 for details on each experimental condition.
perature norpCO2 had a significant effect on RMR andthere was no interaction between these two factors (Supple-ment Table S16, Fig. 4c) for this parameter. MMR showeda significant temperature effect (F1,56 = 4.896, p < 0.05),with fish under warmer temperatures exhibiting increasedMMRs compared to those at colder temperature but therewas no significantpCO2 effect or interaction (SupplementTable S17, Fig. 5c). JuvenileD. labrax exposed to ambientpCO2 showed a substantial increase in FAS between 17 and19◦C (from 1.59 to 2.14, Fig 5c) that was not evident in fishraised under 1000 µatmpCO2 (1.77 to 1.64; Fig. 5c).
4 Discussion
Larvae of European sea bass,Dicentrarchus labrax, appearto be resilient to near-future ocean acidification, showingdecreased mortality under a near-future temperature and at-
Fig. 3. (a) Dry weight of sea bass larvae incubated for 42 daysunder each experimental condition. Data points are mean valuesfor each experimental tank; open circle =d0 data, line = nonlinearregression (Weibull model using shared parameters across treat-ments).(b) Specific growth rateµ of D. labrax larvae after incu-bation for 42 days under each experimental condition calculated foreach tank between each sampling point. Bottom and top of floatingbars are minimum and maximum values, horizontal lines are means.See Table 1 for details on each experimental condition.
mospheric carbon dioxide concentration. Post-metamorphic(juvenile) sea bass raised since hatch under warmer condi-tions also showed significantly higher maximal metabolicrates (MMR) than those raised under cooler conditions. Ju-venileD. labrax raised under a combination of increased at-mosphericpCO2 and temperature were significantly heavierand, interestingly, showed a lower aerobic scope than thoseraised under the increased temperature but ambientpCO2.These findings may have important implications for both seabass in a changing ocean and also for the interpretation of re-sults from other studies that have shown resiliency in marineteleosts exposed to higherpCO2.
Daily mortality,Z, corrects for the periodic removal of ex-perimental animals through sampling, enabling comparisonsto be drawn between treatments. It should be noted, how-ever, thatZ assumes that mortality is constant over the ex-perimental period. It is more likely that mortality rates varied
www.biogeosciences.net/11/2519/2014/ Biogeosciences, 11, 2519–2530, 2014
2526 E. C. Pope et al.: European sea bass in a changing ocean
Fig. 4. (a)Eye diameter ofD. labrax larvae incubated for 42 daysunder each experimental condition.(b) The number ofArtemiasalinaprey in the gut ofD. labrax larvae atd28 andd42 under eachexperimental condition.(c) C : N ratios ofD. labrax larvae atd14,d28 and d42 under each experimental condition. Bottom and topof floating bars are minimum and maximum values, horizontal linesare means. Columns that do not share a letter are significantly differ-ent (two-way ANOVA with Bonferroni post-test,P < 0.05). Meanvalues± 1 SEM,N = 3. See Table 1 for details on each experimentalcondition.
Fig. 5. (a) Wet weight and(b) total length of juvenile (d67–69post-hatch)D. labrax used in the metabolic rate study. Horizontallines are means and error bars are±1 SEM, N = 12–16.(c) Rou-tine metabolic rates (RMR) and maximal metabolic rates (MMR)of juvenileD. labrax (d67–69post-hatch) grown under each exper-imental condition. Mean values± 1 SEM,N = 12–16. See Table 1for details on each experimental condition.
during the course of this trial but direct measurements of sur-vival are always problematic in these sort of studies. Vol-umetric sampling requires the distribution of the larvae tobe homogenised (e.g. through agitation) before the samplesare taken, which has predictable deleterious effects on sur-vival. Similarly, counting all of the larvae in a tank at speci-fied times requires emptying the tank, incurring a substantiallevel of mortality. The most effective way to record mortalitywould be to sacrifice tanks for counting at specified times,which was beyond the scope of this trial.Z is therefore aconvenient statistic for estimating average mortality over thecourse of this study.
The majority of studies that have investigated the effectof near-future ocean conditions on the early life stages ofmarine fish species have advocated some form of resiliency.Most of these studies have concentrated on eggs and post-hatch larvae raised for relatively short durations. Incubat-ing eggs of Atlantic herring (Clupea harengus) under apCO2 range (480–4635 µatm) did not affect embryogenesisor hatch rate or the total length, dry weight, yolk sac area andotolith area of newly hatched larvae, and whilst there wasa significant decrease in the RNA:DNA ratio with increas-ing pCO2, it was only significant when the highest treat-mentpCO2 (4635 µatm) was included in the analysis (Frankeand Clemmesen, 2011). Similarly, Frommel et al. (2013) didnot see anypCO2 effect on the survival, hatch rate, growthor biochemical composition of eggs and non-feeding lar-vae (max. 11 d post-hatch) of Baltic cod,Gadus morhua,
Biogeosciences, 11, 2519–2530, 2014 www.biogeosciences.net/11/2519/2014/
E. C. Pope et al.: European sea bass in a changing ocean 2527
at a range ofpCO2 (380–4000 µatm). Raising larval cobia(R. canadum) for 22 d under 800 and 2100 µatmpCO2 hadno effect on somatic growth, development, swimming abil-ity or swimming activity, although larvae raised under el-evatedpCO2 did possess significantly larger otoliths thancontrol animals (Bignami et al., 2012). Finally, Hurst etal. (2013) raised walleye pollock (Theragra chalcogramma)embryos and larvae under a range ofpCO2 (287–1933 µatm)to ca. 30 d post-hatch and saw only “minor responses”.
Incubations for longer time periods may be required formore subtle effects of near-future conditions to emerge. Un-fortunately, fish larvae are prone to considerable levels ofmortality under even the most stringent culture conditions solonger studies are challenging and require more sophisticatedfacilities. Signals of differential survival or growth can easilybe hidden in this background noise of larval mortality. Ourstudy used 12,000 larvae, distributed across 12 experimen-tal tanks in a state-of-the-art aquaculture system, with cal-culated daily mortalities (0.02–0.07 d−1) substantially lowerthan those in similar study using larval cobia (Rachycentroncanadum) and 800 µatmpCO2 (0.13–0.18 d−1; Bignami etal., 2012), yet our final sampling, coupled with mortality,fully depleted one of the tanks. In fact, larval mortality is verylikely the reason for the short durations of many of the otherstudies that have investigated the effects of ocean acidifica-tion on larval fish. Suitable culturing facilities, such as meso-cosms, allow more substantial incubation times. Frommel etal. (2011), who incubated newly fertilisedG. morhua(Nor-wegian coastal cod) eggs in mesocosms with flow-throughof fresh seawater and natural zooplankton prey for 7 weeks,saw an apparent (but not significant) increase in survival un-der a substantially higherpCO2 of 1,800 µatm compared tocontrol animals at 380 µatmpCO2 (324± 513 larvae after7 weeks vs. 153± 134, mean± 1 SD), although they alsorecorded some organ damage, especially under extreme hy-percapnic conditions of 4200 µatmpCO2.
Whilst a substantial body of work has investigatedmetabolic rate in fish, those studies have used either larger(fingerlings through to adults) or very small (eggs or younglarvae) life stages, so appropriate values for comparison tothe metabolic rates of the recently metamorphosed fish usedin this study are rare in published work. The values forRMR, MMR and FAS in our study compare well with theonly study we are aware of that measured the metabolicrate of marine fish over their entire life histories (Killen etal., 2007). Killen et al. (2007) measured the standard andmaximal metabolism in three marine fish species (oceanpout, Macrozoarces americanus; lumpsucker,Cyclopteruslumpus; and short-spined sea scorpion,Myoxocephalus scor-pius) and showed that metabolic rate and aerobic scope werehighly dependent upon the size of the animals. Hence com-parisons of our values with other life stages of even the samespecies are not appropriate. Killen et al. (2007) producedbiphasic (pre- and post-metamorphosis) regressions of stan-dard metabolic rate (SMR), MMR and FAS for the entire
size range of each species (incorporating a change in massof over six orders of magnitude for some species) enablingdirect comparisons with the values calculated for recentlymetamorphosed juveniles in our study. The metabolic ratesin our study agree with those recorded by Killen et al. (2007),although they are slightly higher than for the three species inKillen et al. (2007) becauseD. labraxis an active species, un-like the relatively sedentary benthic and semi-pelagic speciesused by these workers. This also means that RMR will beconsiderably higher than SMR inD. labrax, unlike in Killenet al. (2007), because the sea bass continued to swim whilstthe RMR was measured. The aerobic scopes calculated inthis study are therefore probably underestimates.
When the incubation was continued past metamorphosis,juvenile sea bass held at 19◦C and 1000 µatmpCO2 weresignificantly heavier than any other treatment group, includ-ing fish incubated at 19◦C but ambientpCO2. Rapid growthis especially advantageous to young fish as it decreases thelength of time an individual is vulnerable to a particularpredator, decreasing size-specific mortality (Glazier, 2005),and has also been seen in a tropical reef species raised un-der elevated atmospheric CO2 concentration. Orange clown-fish (Amphiprion percula) grown at 1030 ppm CO2 until theywere settlement-stage juveniles were significantly longer andheavier than control fish (390 ppm CO2), although it shouldbe noted that these tropical reef fish show different develop-mental times and life history to the temperate species used inour study and were 11 d post-hatch when measured (Mundayet al., 2009a).
It is interesting that the increased growth inD. labraxwasnot supported by an increased RMR. Similarly, there was noobserved effect ofpCO2 or temperature on feeding in (pre-metamorphic)D. labrax larvae, although it should be notedthat often it was not to possible to count the prey in thestomachs of individual larvae, reducing our ability to iden-tify differences. In addition, the larvae were fed ad libitumso a snapshot of their stomach contents may not be the mostappropriate method for determining feeding rate. We wereunable to determine gut transit time, and heavier larvae mayhave processed food more rapidly and so consumed more.On the other hand, the lack of difference in grazing rates be-tween the twopCO2 in the 19◦C tanks supports support thefinding thatpCO2 does not increase feeding rate. Increasedgrowth may not therefore come at a cost, unless the aerobicscope of the fish is considered.
Larvae at 19◦C were an average of 72 degree days olderthan those at 17◦C (788± 4 vs. 716± 1, mean± 1 SD; Note:a degree day is a value used in aquaculture to predict the stageof development of early life stages – it is calculated by mul-tiplying the mean temperature in◦C by the incubation timein d) by d42 and whilst they did not show any difference inweight or length at this time, their lower C : N ratio suggestsa greater degree of oil consumption and concomitant proteindeposition, which would be expected to be mainly in the formof muscle (Rosenlund et al., 1983). Coupled with the fact that
www.biogeosciences.net/11/2519/2014/ Biogeosciences, 11, 2519–2530, 2014
2528 E. C. Pope et al.: European sea bass in a changing ocean
these animals also possessed larger eyes, it would appear thatlarvae raised at 19◦C were showing signs of being develop-mentally more advanced byd42 and that this was evident inlength and weight byd67–69. The increased FAS of the juve-niles raised at 19◦C and ambientpCO2 (2.14) compared tothose raised at 17◦C and the samepCO2 (1.59) is thereforeconsistent with the paradigm of Killen et al. (2007) that aero-bic scope gradually increases through ontogeny. It is notablethat fish raised under higherpCO2 conditions did not fol-low this pattern; the calculated FAS was actually lower forfish raised at 19◦C (1.64) than those raised at 17◦C (1.77)under 1000 µatmpCO2. Aerobic scope describes an organ-ism’s capacity to perform any energetic activity above basalmetabolism and a decreased aerobic scope could have severeimplications for young fish, limiting the availability of en-ergy for physiological activity or behaviours, such as escaperesponses. Munday et al. (2009b) saw a similar effect in ex-periments using adult coral reef fish; aerobic scope was de-creased with both increasing temperature and CO2 (to pro-duce a pH of 7.8, equivalent of ca. 1000 ppm; Munday et al.,2009b). Unlike Munday et al. (2009b), who acutely exposedwild animals (albeit with an acclimation period of 1 week),we measured decreased aerobic scope in fish raised underchronically elevatedpCO2.
The animals for this study came from aquaculture, whichmay, in part explain the results. Animals in aquaculture willroutinely experience relatively highpCO2 as a result of largenumbers of animals respiring within a relatively small, en-closed environment. Indeed, the ambientpCO2 in our sys-tem was observed to be ca. 200 µatm higher than would beexpected from atmospheric CO2 concentration alone. It isalso worth noting that marine aquaculture facilities in the fu-ture will use water from a higherpCO2 ocean with an al-ready decreased buffering capacity that will only contributeto the resultant systemic decline in pH. In addition, fish arealso often raised artificially under warmer temperatures thanin the wild to promote growth. It could therefore be arguedthat animals reared through multiple generations in this en-vironment may be more tolerant of warmer, higherpCO2conditions. Then again, fish in an industrial setting exist inan inherently unnatural environment with an abundance offood and absence of predators and interspecific competitors.Any energetic cost incurred by fish under near-future oceanicconditions, for example, will not be a strong selection pres-sure in an energy-replete environment. Similarly, a reducedjuvenile aerobic scope, such as observed in this study, willbe of little importance to a cultured animal whereas it wouldbe disadvantageous to a wild fish, especially if it persisted toadulthood. The experimental design used in this study, withad libitum feeding, may therefore have limited ability to dis-cover energetic costs for fish living in a near-future ocean.On the other hand, whilst a restricted diet regimen may re-veal subtle effects on larval growth and development, larvi-culture is challenging and such a diet may also result in high
levels of mortality which, as discussed earlier, could concealeffects.
Further studies are required that raise other teleosts undernear-future ocean conditions, for longer durations, to ascer-tain whether “resiliency” is maintained throughout ontogenyunder natural conditions. The results of this study are cau-tiously optimistic forD. labrax, although it is important todiscover whether the differences in juvenile physiology ob-served in this study manifest in adult fish.
Supplementary material related to this article isavailable online athttp://www.biogeosciences.net/11/2519/2014/bg-11-2519-2014-supplement.pdf.
Acknowledgements.This work was funded through UKOARPgrant NE/H01750X/1, co-funded by the Natural EnvironmentResearch Council (NERC), the Department for Environment,Food and Rural Affairs (Defra), and the Department of Energyand Climate Change (DECC). We are grateful to Neil Loader,Josh Mayers and Naomi Ginnever for their assistance with theelemental analysis, to all the technical staff at the Centre forSustainable Aquatic Research, and to two anonymous reviewers fortheir helpful comments.
Edited by: J.-P. Gattuso
References
Baumann, H., Talmage, S. C., and Gobler, C. J.: Reduced early lifegrowth and survival in a fish in direct response to increased car-bon dioxide, Nat. Clim. Change, 2, 38–41, 2011.
Bignami, S., Sponaugle, S., and Cowen, R. K.: Response to oceanacidification in larvae of a large tropical marine fish,Rachycen-tron canadum, Glob. Change Biol., 19, 996–1006, 2012.
Bignami, S., Enochs, I. C., Manzello, D. P., Sponaugle, S., andCowen, R. K.: Ocean acidification alters the otoliths of a pantrop-ical fish species with implications for sensory function, P. Natl.Acad. Sci. USA, 110, 7366–7370, 2013.
Blaxter, J. H. S. and Hempel, G.: The influence of egg size on her-ring larvae (Clupea harengusL.), ICES J. Mar. Sci., 28, 211–240,1963.
Boyd, P. and Hutchins, D.: Understanding the responses of oceanbiota to a complex matrix of cumulative anthropogenic change,Mar. Ecol. Prog. Ser., 470, 125–135, 2012.
Branch, T. A., Dejoseph, B. M., Ray, L. J., and Wagner, C. A.:Impacts of ocean acidification on marine seafood, Trends Ecol.Evol., 28, 178–86, 2013.
Burton, T., Killen, S. S., Armstrong, J. D., and Metcalfe, N. B.:What causes intraspecific variation in resting metabolic rate andwhat are its ecological consequences?, P. Roy. Soc. B-Biol. Sci.,278, 3465–3473, 2011.
Chivers, D. P., McCormick, M. I., Nilsson, G. E., Munday, P.,Watson, S.-A., Meekan, M. G., Mitchell, M. D., Corkill, K.C., and Ferrari, M. C. O.: Impaired learning of predators andlower prey survival under elevated CO2: a consequence of neu-rotransmitter interference, Glob. Change Biol., 20, 515–522,doi:10.1111/gcb.12291, 2013.
Biogeosciences, 11, 2519–2530, 2014 www.biogeosciences.net/11/2519/2014/
E. C. Pope et al.: European sea bass in a changing ocean 2529
Claiborne, J. B., Edwards, S. L., and Morrison-Shetlar, A. I.: Acid-base regulation in fishes: cellular and molecular mechanisms, J.Exp. Zool., 293, 302–319, 2002.
Clarke, A. and Johnston, N.: Scaling of metabolic rate with bodymass and temperature in teleost fish, J. Anim. Ecol., 68, 893–905, 1999.
Connell, S. D. and Russell, B. D.: The direct effects of increasingCO2 and temperature on non-calcifying organisms: increasingthe potential for phase shifts in kelp forests?, P. Roy. Soc. B-Biol.Sci., 277, 1409–1415, 2010.
Dickson, A. G. and Millero, F. J.: A comparison of the equilibriumconstants for the dissociation of carbonic acid in seawater media,Deep-Sea Res., 34, 1733–1743, 1987.
Dickson, A. G., Sabine, C. L., and Christian, J. R.: Guide tobest practices for ocean CO2 measurements, Sidney, BritishColumbia, North Pacific Marine Science Organization, PICESSpecial Publication 3, 2007.
Domenici, P., Allan, B., McCormick, M. I., and Munday, P. L.: Ele-vated carbon dioxide affects behavioural lateralization in a coralreef fish, Biol. Lett., 8, 78–81, 2012.
Doney, S. C., Fabry, V. J., Feely, R. A., and Kleypas, J. A.: Oceanacidification: The other CO2 problem, Annu. Rev. Mar. Sci., 1,169–192, 2009.
Dupont, S. and Pörtner, H.: Marine science: Get ready for oceanacidification, Nature, 498, p. 429, 2013.
FAO Fisheries and Aquaculture Department: Statistics and Infor-mation Service FishStatJ: Universal software for fishery statis-tical time series,www.fao.org/fishery/statistics/software/fishstat/en, Copyright 2011.
FAO: The State of the World Fisheries and Aquaculture, Food andAgriculture Organisation of the United Nations, Rome, 2012.
Feely, R. A., Doney, S. C., and Cooley, S. R.: Ocean acidifica-tion: present conditions and future changes in a high-CO2 world,Oceanography, 22, 36–47, 2009.
Franke, A. and Clemmesen, C.: Effect of ocean acidification onearly life stages of Atlantic herring (Clupea harengusL.), Bio-geosciences, 8, 3697–3707, doi:10.5194/bg-8-3697-2011, 2011.
Frommel, A. Y., Maneja, R., Lowe, D., Malzahn, A. M., Geffen, A.J., Folkvord, A., Piatkowski, U., Reusch, T. B. H., and Clemme-sen, C.: Severe tissue damage in Atlantic cod larvae under in-creasing ocean acidification, Nat. Clim. Change, 2, 42–46, 2011.
Frommel, A. Y., Schubert, A., Piatkowski, U., and Clemmesen, C.:Egg and early larval stages of Baltic cod,Gadus morhua, are ro-bust to high levels of ocean acidification, Mar. Biol., 160, 1825–1834, 2013.
Gaesser, G. A. and Brooks, G. A.: Metabolic bases of excess post-exercise oxygen consumption: a review, Med. Sci. Sport. Exer.,16, 29-43, 1984.
Gattuso, J.-P. and Hansson, L.: Ocean Acidification, Oxford Uni-versity Press, Oxford, 2011.
Glazier, D. S.: Beyond the “3/4-power law”: variation in the intra-and interspecific scaling of metabolic rate in animals, Biol. Rev.Camb. Philo. S., 80, 611–62, 2005.
Holeton, G. F., Booth, J. H., and Jansz, G. F.: Acid-base balance andNa+ regulation in rainbow trout during exposure to, and recoveryfrom, low environmental pH, J. Exp. Zool., 228, 21–32, 1983.
Hurst, T., Fernandez, E., and Mathis, J.: Effects of ocean acidifica-tion on hatch size and larval growth of walleye pollock (Theragrachalcogramma), ICES J. Mar. Sci., 70, 812–822, 2013.
Ishimatsu, A., Hayashi, M., and Kikkawa, T.: Fishes in high-CO2,acidified oceans, Mar. Ecol.-Prog. Ser., 373, 295–302, 2008.
Killen, S. S., Costa, I., Brown, J. A., and Gamperl, A. K.: Little leftin the tank: metabolic scaling in marine teleosts and its implica-tions for aerobic scope, P. Roy. Soc. B-Biol. Sci., 274, 431–438,2007.
Kroeker K. J., Kordas R. L., Crim R., Hendriks I. E., Ramajo L.,Singh G. S., Duarte C. M. and Gattuso J.-P.: Impacts of oceanacidification on marine organisms: quantifying sensitivities andinteraction with warming, Glob. Change Biol., 19, 1884–1896,2013.
Lewis, R. and Wallace, D. W. R.: Program developed for CO2 sys-tem calculations, ORNL/CDIAC-105, Carbon Dioxide Informa-tion Analysis Center, Oak Ridge National Laboratory, U.S. De-partment of Energy, Oak Ridge, Tennessee, 1998.
Meehl, G. A., Stocker, T. F., Collins, W. D., Friedlingstein, P., Gaye,T., Gregory, J. M., Kitoh, A., Knutti, R., Murphy, J. M., Noda, A.,Raper, S. C. B., Watterson, I. G., Weaver, A. J., and Zhao, Z. C.:Global climate projections, in: Climate Change 2007: The Physi-cal Science Basis. Contribution of Working Group I to the FourthAssessment Report of the Intergovernmental Panel on ClimateChange, edited by: Solomon, S., Qin, D., Manning, M., Chen,Z., Marquis, M., Averyt, K. B., Tignor, M., and Miller, H. L.,Cambridge University Press, Cambridge, 2007.
Mehrbach, C., Culberson, C. H., Hawley, J. H., and Pytkow-icz, R. M.: Measurement of the apparent dissociation constantsof carbonic acid in seawater at atmospheric pressure, Limnol.Oceanogr., 18, 897–907, 1973.
Munday, P. L., Donelson, J. M., Dixson, D. L., and Endo, G. G. K.:Effects of ocean acidification on the early life history of a tropicalmarine fish, P. Roy. Soc. B-Biol. Sci., 276, 3275–3283, 2009a.
Munday, P. L., Crawley, N., and Nilsson, G.: Interacting effects ofelevated temperature and ocean acidification on the aerobic per-formance of coral reef fishes, Mar. Ecol.-Prog. Ser., 388, 235–242, 2009b.
Nilsson, G. E., Ostlund-Nilsson, S., Penfold, R., and Grutter, A.S.: From record performance to hypoxia tolerance: respiratorytransition in damselfish larvae settling on a coral reef, P. Roy.Soc. B-Biol. Sci., 274, 79–85, 2007.
Nilsson, G. E. Dixson, D. L., Domenici, P., McCormick, M. I.,Sørensen, C., Watson, S.-A., and Munday, P. L.: Near-future car-bon dioxide levels alter fish behaviour by interfering with neuro-transmitter function, Nat. Clim. Change, 2, 201–204, 2012.
Pankhurst, N. W. and Munday, P. L.: Effects of climate change onfish reproduction and early life history stages, Mar. FreshwaterRes., 62, 1015–1026, 2011.
Pope, E. C., Ellis, R. P., Scolamacchia, M., Scolding, J. W. S., Keay,A., Chingombe, P., Shields, R. J., Wilcox, R. M., Speirs, D. C.,Wilson, R. W., Lewis, C. N., and Flynn, K. J.: Growth mea-surements, feeding rates, metabolic responses from respirometry,carbon-nitrogen ratios and mortality of European sea bass (Di-centrarchus labrax) larvae under conditions of elevatedpCO2and temperature, British Oceanographic Data Centre, Nat. Envi-ron. Res. Council, UK, doi:10/snt, 2014.
Roche, D. G., Binning, S. A., Bosiger, Y., Johansen, J. L., and Rum-mer, J. L.: Finding the best estimates of metabolic rates in a coralreef fish, J. Exp. Biol., 216, 2103–2110, 2013.
Rosenlund, G., Lund, B., Lied, E., and von der Decken, A.: Proper-ties of white trunk muscle from saithePollachius virens, rainbow
www.biogeosciences.net/11/2519/2014/ Biogeosciences, 11, 2519–2530, 2014

2530 E. C. Pope et al.: European sea bass in a changing ocean
troutSalmo gairdneriand herringClupea harengus: protein syn-thesisin vitro, electrophoretic study of proteins, Comp. Biochem.Phys. B, 74, 389–397, 1983.
Showstack, R.: Carbon dioxide tops 400 ppm at Mauna Loa,Hawaii, Eos Trans. AGU, 94, p. 192, 2013.
Simpson, S. D., Munday, P. L., Wittenrich, M. L., Manassa, R., Dix-son, D. L., Gagliano, M., and Yan, H. Y.: Ocean acidificationerodes crucial auditory behaviour in a marine fish, Biol. Lett., 7,917–920, 2011.
Vuuren, D. P., Edmonds, J., Kainuma, M., Riahi, K., Thomson,A., Hibbard, K., Hurtt, G. C., Kram T., Krey, V., Lamarque, J.-F., Masui, T., Meinshausen, M., Nakicenovic, N., Smith, S. J.,and Rose, S. K.: The representative concentration pathways: anoverview, Clim. Change, 109, 5–31, 2011.
Wood, H. L., Spicer, J. I., and Widdicombe, S.: Ocean acidificationmay increase calcification rates, but at a cost, P. Roy. Soc. B-Biol.Sci., 275, 1767–1773, 2008.
Biogeosciences, 11, 2519–2530, 2014 www.biogeosciences.net/11/2519/2014/
Related Documents