European ports: an engine for growth

Welcome message from author
This document is posted to help you gain knowledge. Please leave a comment to let me know what you think about it! Share it to your friends and learn new things together.
Transcript
European ports:
an engine
for growth
Rotterdam
Hamburg
Antwerp
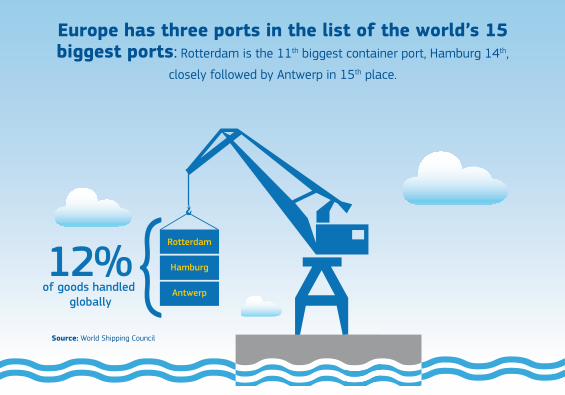
12% of goods handled
globally
Europe has three ports in the list of the world’s 15 biggest ports: Rotterdam is the 11th biggest container port, Hamburg 14th,
closely followed by Antwerp in 15th place.
Source: World Shipping Council

348
84889
629
340
Ports in Europe are directly connected to 848 ports in the Far East and 629 in Central and South America.
74% of EU trade goes by ship.
Source: ESPO, European Port Performance Dashboard, 2012
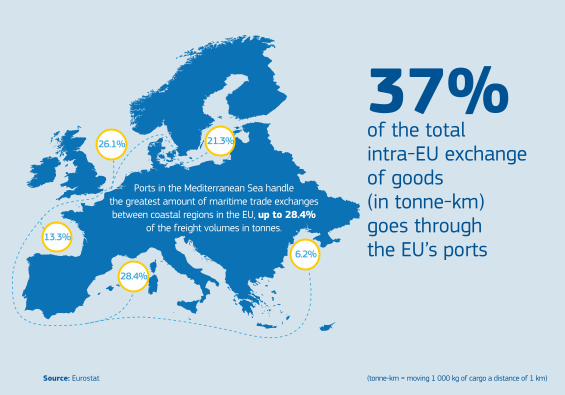
6.2%
28.4%
13.3%
26.1% 21.3%
Source: Eurostat (tonne-km = moving 1 000 kg of cargo a distance of 1 km)
Ports in the Mediterranean Sea handle the greatest amount of maritime trade exchanges between coastal regions in the EU, up to 28.4%
of the freight volumes in tonnes.
37%
of the total intra-EU exchange of goods (in tonne-km) goes through the EU’s ports
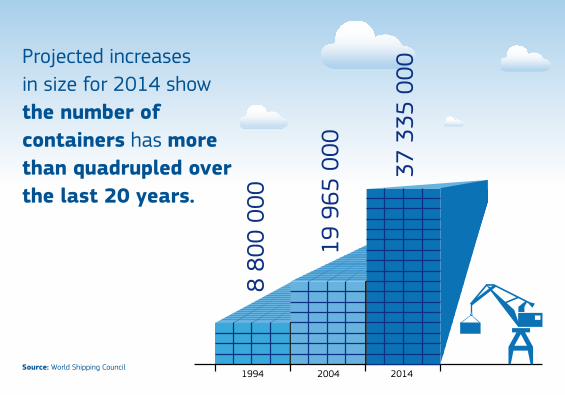
1994 2004 2014
8 80
0 00
0
19 9
65 0
00
37 3
35 0
00
Projected increases in size for 2014 show the number of containers has more than quadrupled over the last 20 years.
Source: World Shipping Council
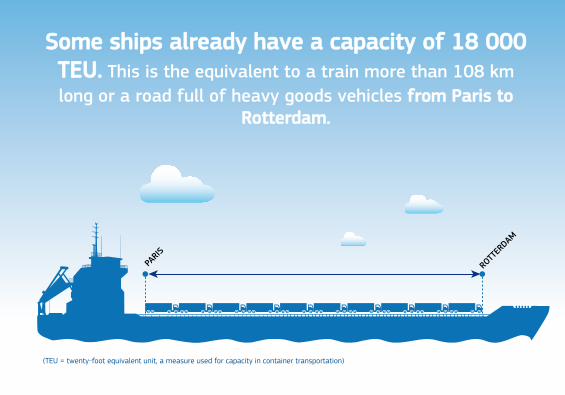
PARIS
ROTTERDAM
Some ships already have a capacity of 18 000 TEU. This is the equivalent to a train more than 108 km long or a road full of heavy goods vehicles from Paris to
Rotterdam.
(TEU = twenty-foot equivalent unit, a measure used for capacity in container transportation)
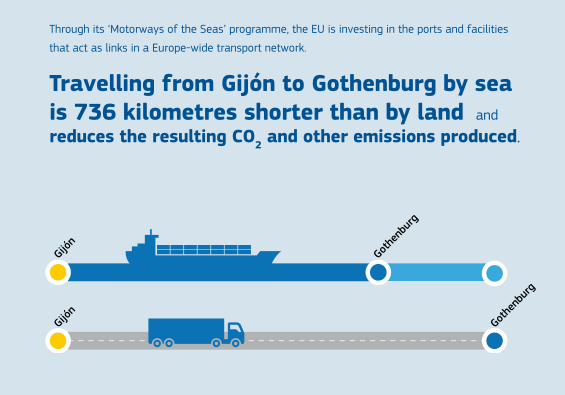
Through its ‘Motorways of the Seas’ programme, the EU is investing in the ports and facilities
that act as links in a Europe-wide transport network.
Travelling from Gijón to Gothenburg by sea is 736 kilometres shorter than by land and
reduces the resulting CO2 and other emissions produced.
Gijón
Gijón
Gothe
nbur
g
Gothe
nbur
g-736 km
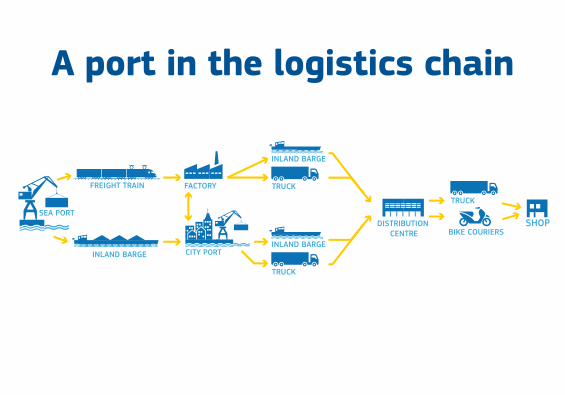
A port in the logistics chain

23
18.2%
21
13.6%
2
1.7%
25
27.0%
22
38.3%
Source: Eurostat
The total quantity of freight handled in EU ports in 2010 was 3 641 million tonnes. North Sea core ports dominated, with a relativelylow share of freight being handled in ports along the Black Sea or in the outermost regions.
Source: OECD
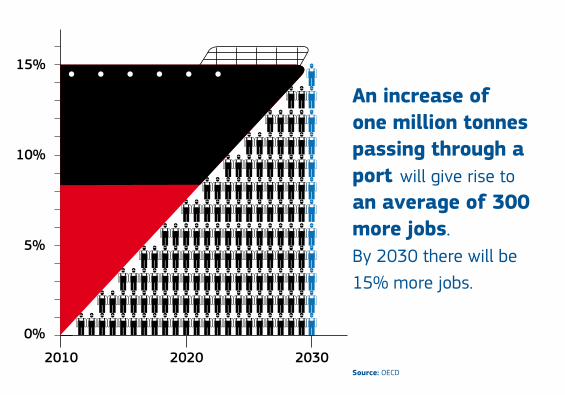
2010
0%
5%
10%
15%
2020 2030
An increase of one million tonnes passing through a port will give rise to an average of 300 more jobs. By 2030 there will be 15% more jobs.
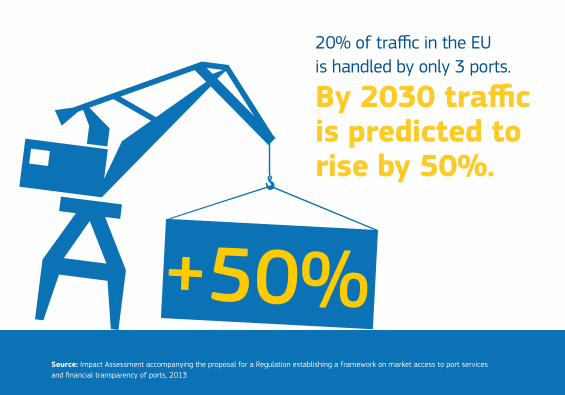
+50%Source: Impact Assessment accompanying the proposal for a Regulation establishing a framework on market access to port services and financial transparency of ports, 2013
20% of traffic in the EU is handled by only 3 ports.
By 2030 traffic is predicted to rise by 50%.
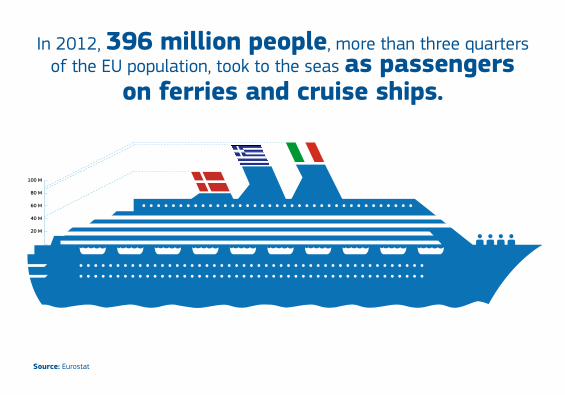
In 2012, 396 million people, more than three quarters of the EU population, took to the seas as passengers
on ferries and cruise ships.
Source: Eurostat
20 M
40 M
60 M
80 M
100 M
Related Documents